- 155 - SULPHUR DEFICIENCY IN RAPESEED -- DIAGNOSTIC PLANT ANALYSIS D.G. Maynard and J.W.B. Stewart Department of Soil Science University of Saskatchewan Saskatoon, Sask. Introduction For any given nutrient in a particular crop, two analytical approaches are available for assessing the adequacy of plant nutrition. These are soil analysis and plant analysis. For most elements one approach or the other is clearly to be preferred but this does not apply to sulphur (Metson, 1979). Considerable effort and research has gone into the development of diagnostic methods for estimating the sulphur status of soils and for predicting sulphur fertilizer requirements using both soil and plant analysis (Fox et al., 1964; Ensminger and Freney, 1966; Beaton et al., 1968; Tisdale, 1971; Hamm et al., 1973; Bettany et al., 1974; Metson, 19 79). A wide variety of extractants have been used for measuring available soil sulphur. The use of these soil extractants have been reviewed elsewhere (Reisenauer, 1975; Metson, 1979). While it is known that soluble (sulphate) sulphur is main source o·f plant available sulphur, the nature and the amount of the organic soil sulphur that mineralizes over a growing season is not completely known. Despite this, good correlation with many of these soil extracts and plant growth has been observed. The basic weakness of the methods used to extract available sulphur is that they are only correlated with sulphur uptake on sulphur deficient soils (Biederbeck, 1978). Rehm and Caldwell (1968) found in Minnesota that in sulphur deficient soils, the plant uptake of sulphur was di-rectly related to the measured sulphur extracted. However in soils with medium to high sulphur supplying capacity, sulphur uptake was not found to be related to the soil sulphur extracted. This could be the result of changes in the size and composition of the various soil sulphur pools over short periods of time. Recent work by Bettany et al. (1979, 1980) has provided an indication of the relative importance of the various organic matter sulphur fractions from a standpoint of both short term and long term fertility status of soils, They indicate that the conventional fulvic acid fraction and clay-associated humic acid fraction are of importance in Canadian prairie soils as medium term storehouses of organically bound sulphur. Further work directed at the short term effects of these labile and potentially labile sulphur pools should lead to a greater understanding of plant available soil sulphur. Plant analysis for not without its problems. which include; diagnostic analyzed, stage of growth diagnosing sulphur requirements is likewise It is complicated by several considerations criteria to be applied, plant part to be sampled, and the method of analysis (Blair

Welcome message from author
This document is posted to help you gain knowledge. Please leave a comment to let me know what you think about it! Share it to your friends and learn new things together.
Transcript

- 155 -
SULPHUR DEFICIENCY IN RAPESEED -- DIAGNOSTIC PLANT ANALYSIS
D.G. Maynard and J.W.B. Stewart Department of Soil Science University of Saskatchewan
Saskatoon, Sask.
Introduction
For any given nutrient in a particular crop, two analytical approaches are available for assessing the adequacy of plant nutrition. These are soil analysis and plant analysis. For most elements one approach or the other is clearly to be preferred but this does not apply to sulphur (Metson, 1979). Considerable effort and research has gone into the development of diagnostic methods for estimating the sulphur status of soils and for predicting sulphur fertilizer requirements using both soil and plant analysis (Fox et al., 1964; Ensminger and Freney, 1966; Beaton et al., 1968; Tisdale, 1971; Hamm et al., 1973; Bettany et al., 1974; Metson, 19 79).
A wide variety of extractants have been used for measuring available soil sulphur. The use of these soil extractants have been reviewed elsewhere (Reisenauer, 1975; Metson, 1979). While it is known that soluble (sulphate) sulphur is tb~e main source o·f plant available sulphur, the nature and the amount of the organic soil sulphur that mineralizes over a growing season is not completely known. Despite this, good correlation with many of these soil extracts and plant growth has been observed.
The basic weakness of the methods used to extract available sulphur is that they are only correlated with sulphur uptake on sulphur deficient soils (Biederbeck, 1978). Rehm and Caldwell (1968) found in Minnesota that in sulphur deficient soils, the plant uptake of sulphur was di-rectly related to the measured sulphur extracted. However in soils with medium to high sulphur supplying capacity, sulphur uptake was not found to be related to the soil sulphur extracted. This could be the result of changes in the size and composition of the various soil sulphur pools over short periods of time. Recent work by Bettany et al. (1979, 1980) has provided an indication of the relative importance of the various organic matter sulphur fractions from a standpoint of both short term and long term fertility status of soils, They indicate that the conventional fulvic acid fraction and clay-associated humic acid fraction are of importance in Canadian prairie soils as medium term storehouses of organically bound sulphur. Further work directed at the short term effects of these labile and potentially labile sulphur pools should lead to a greater understanding of plant available soil sulphur.
Plant analysis for not without its problems. which include; diagnostic analyzed, stage of growth
diagnosing sulphur requirements is likewise It is complicated by several considerations
criteria to be applied, plant part to be sampled, and the method of analysis (Blair
Ryan
Sticky Note
None set by Ryan
Ryan
Sticky Note
MigrationNone set by Ryan
Ryan
Sticky Note
Unmarked set by Ryan
- 156 -
et al., 1978; Metson, 1979). These are all problems that can be overcome. Plant analysis has however the major disadvantage of giving information too late in some cases to be of value during the current crop year though this information can be used for fertilizer recommendations in future years.
Despite these drawbacks if soil and plant analysis are used together they can be of great value in determining the sulphur status of the soil in relation to plant availability.
The objectives of this work are: (i) to review the use of plant analysis in the diagnosis of sulphur deficiencies in various crops, and (ii) to examine the usefulness of plant analysis in the diagnosis of sulphur deficiencies in rapeseed grown in Northern Saskatchewan during 1979.
Plant Analysis
Critical Percentages
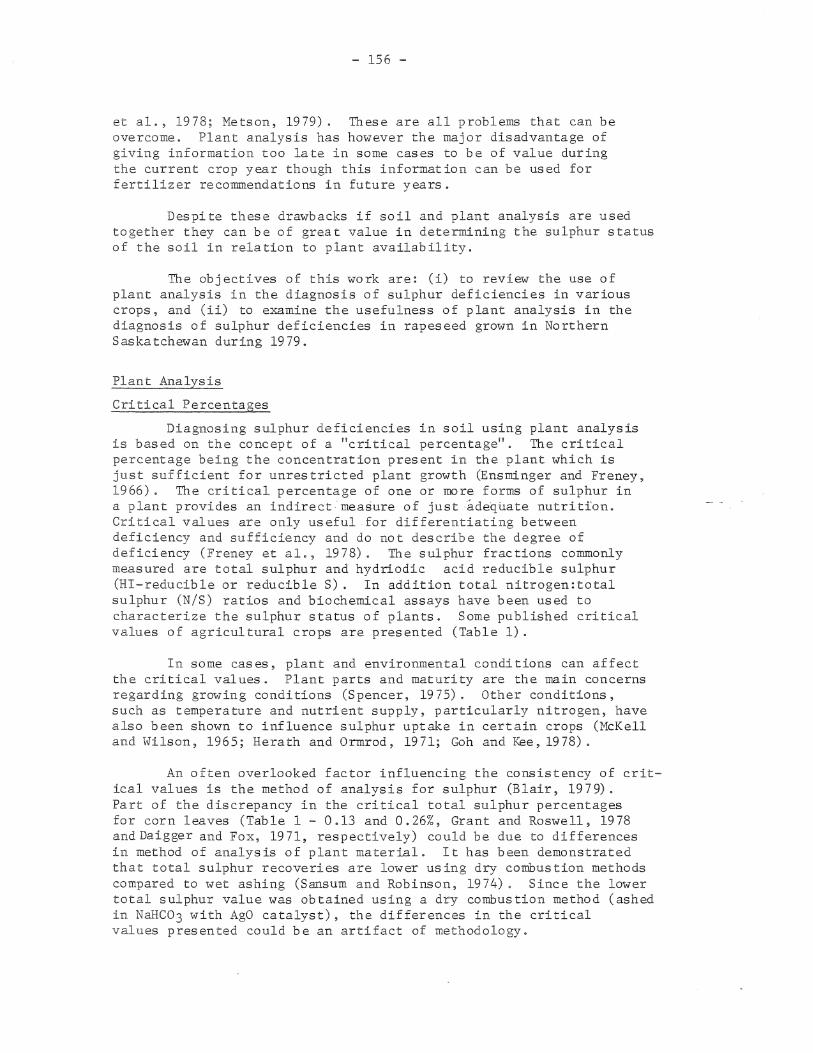
Diagnosing sulphur deficiencies in soil using plant analysis is based on the concept of a "critical percentage". The critical percentage being the concentration present in the plant which is just sufficient for unrestricted plant growth (Ensminger and Freney, 1966). The critical percentage of one or more forms of sulphur in a plant provides an indirect ·measure of just ·adequate nutrition. Critical values are only useful for differentiating between deficiency and sufficiency and do not describe the degree of deficiency (Freney et al., 1978). The sulphur fractions commonly measured are total sulphur and hydriodic acid reducible sulphur (HI-reducible or reducible S) . In addition total nitrogen:total sulphur (N/S) ratios and biochemical assays have been used to characterize the sulphur status of plants. Some published critical values of agricultural crops are presented (Table 1).
In some cases, plant and environmental conditions can affect the critical values. Plant parts and maturity are the main concerns regarding growing conditions (Spencer, 1975). Other conditions, such as temperature and nutrient supply, particularly nitrogen, have also been shown to influence sulphur uptake in certain crops (McKell and Wilson, 1965; Herath and Ormrod, 1971; Goh and Kee, 1978).
An often overlooked factor influencing the consistency of critical values is the method of analysis for sulphur (Blair, 1979). Part of the discrepancy in the critical total sulphur percentages for corn leaves (Table 1 - 0.13 and 0.26%, Grant and Roswell, 1978 and Daigger and Fox, 1971, respectively) could be due to differences in method of analysis of plant material. It has been demonstrated that total sulphur recoveries are lower using dry combustion methods compared to wet ashing (Sansum and Robinson, 1974) . Since the lower total sulphur value was obtained using a dry combustion method (ashed in NaHC03 with AgO catalyst), the differences in the critical values presented could be an artifact of methodology.
Ryan
Sticky Note
None set by Ryan
Ryan
Sticky Note
MigrationNone set by Ryan
Ryan
Sticky Note
Unmarked set by Ryan
- 157 -
Table 1. Sulphur - critical values or ratios.
Growth stage Total s HI-reducible N/S ratio or time from (%) sl (ppm) (total) Reference
Top Blade 3 Tops
Cob leaf Upper stalk
Ear leaf
Tops
Tops Tops
Tops Tops Tops
seeding
Early bloom Early bloom Early bloom
10 weeks 10 weeks
Silking stage
26 days 55 days 97 days Mature 30 days
Mature Flowering 4 weeks
Alfalfa
0.22
0.14
Corn
0.13 0.05-0.04
0.24
Wheat
0.23-0.25 0.11-0.12 0.06-0.08
0.09
150 5oo2
60-70 60-70
230-250 110-120
60-80
Rapeseed
0.10 0.25
11:1
17-18:1
20-25:1
12:1
15-18:1 15-20:1 17-21:1
16:1 17:1
12:1
1Hydriodic acid (HI) - reducible S mainly free S04-S and ester bonded S
2 2% acetic acid soluble S04-S
3 Water soluble so4-s
Total Sulphur
28 46 47
18 18
10
16 16 16 29 40
1 19 19
Total sulphur is the obvious choice as a measure of the sulphur status as it is directly related to the sulphur supply. The critical concentration required must be determined for individual species, plant parts and growing conditions.
The leaf or blade of most crops exceeds the sulphur concentrations in the roots or stems. Total sulphur concentrations of roots are comparatively smaller than those found in the above ground portion of plants. In perennial ryegrass, total sulphur concentrations of the roots was found to be less than 40% of the sulphur level in tops, regardless of treatment (Goh and Kee, 1978). This suggests that sulphur levels in roots are less affected by changes in the
---'S!"
Ryan
Sticky Note
None set by Ryan
Ryan
Sticky Note
MigrationNone set by Ryan
Ryan
Sticky Note
Unmarked set by Ryan
- 158 -
sulphur nutrition of the plant than the leaf. However the greatest and most consistent differences between normal and deficient plants are not always found in the leaf. Total sulphur concentrations in the leaves of maize were not as reliable an indicator of sulphur status as the upper stalk (Grant and Roswell, 1978). Variations in the total sulphur percentages, according to age and position in the plant were greater than differences due to the sulphur levels.
The portion of the plant which shows the greatest and most consistent differences in total sulphur between sufficient and nonsufficient plants should be used. When the critical value for different plant parts are variable, parts should not be mixed for analysis. A specific plant part may provide a better and early indicator of a sulphur deficiency than a bulk plant sample "diluted" by a less sensitive portion of the plant.
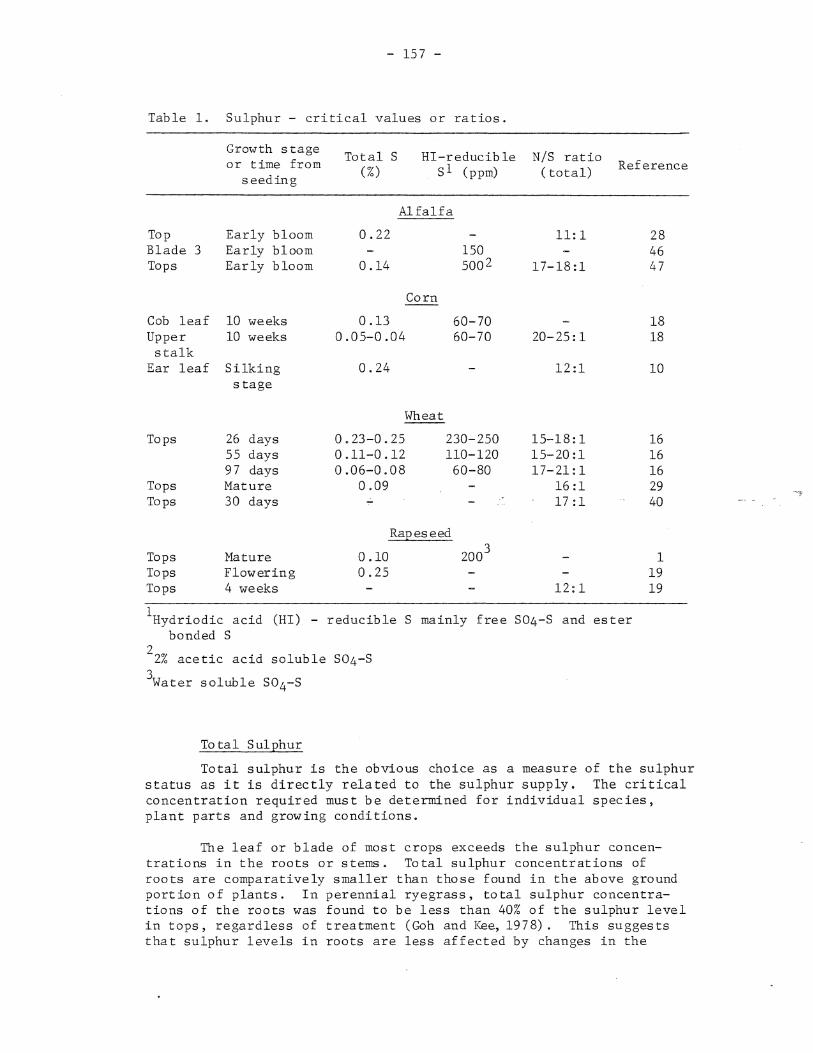
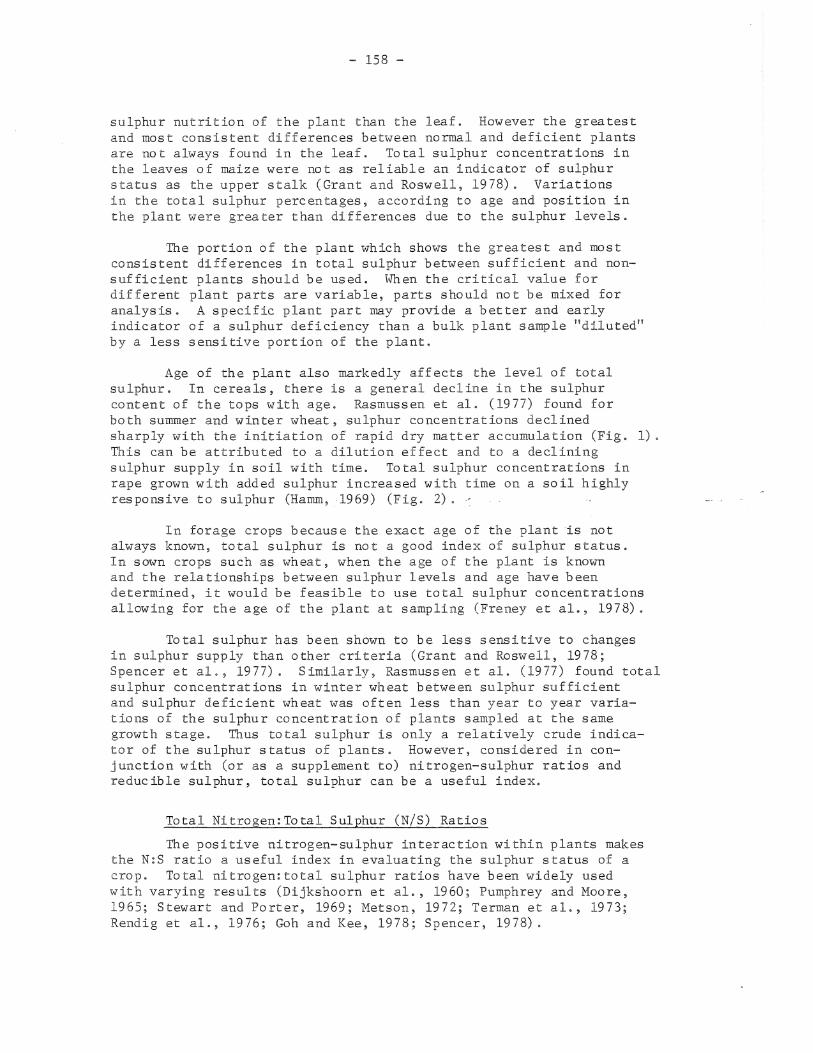
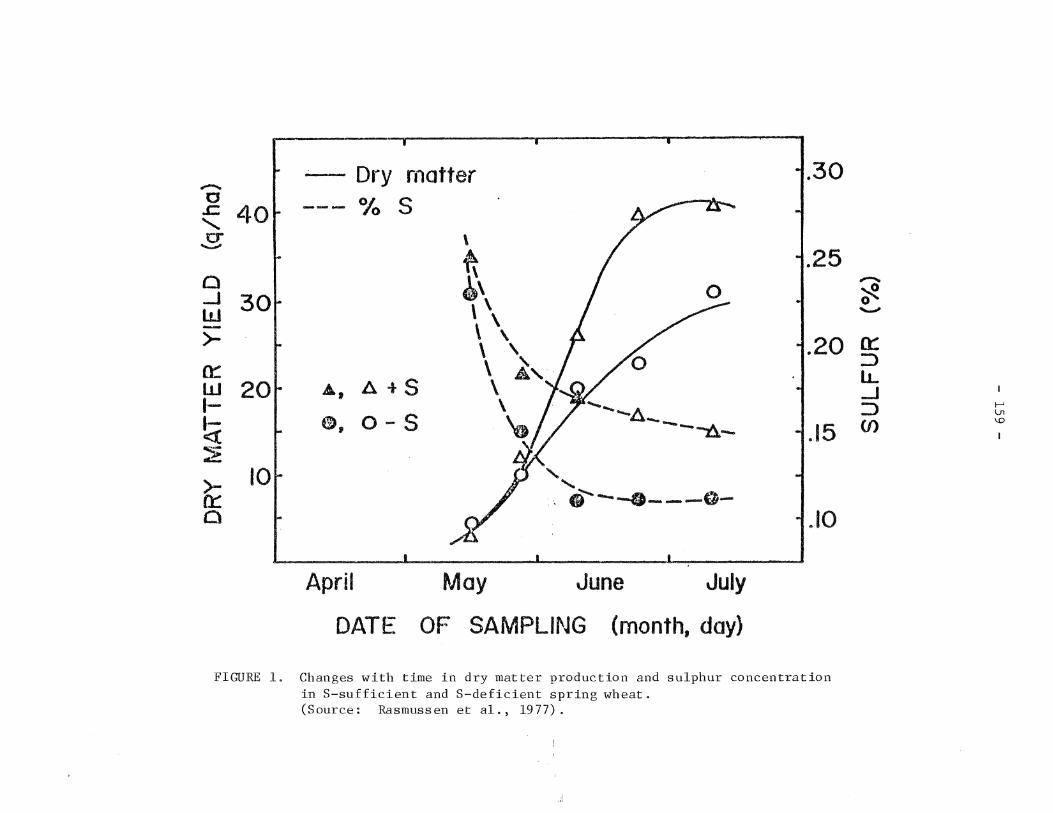
Age of the plant also markedly affects the level of total sulphur. In cereals, there is a general decline in the sulphur content of the tops with age. Rasmussen et al. (1977) found for both summer and winter wheat, sulphur concentrations declined sharply with the initiation of rapid dry matter accumulation (Fig. 1). This can be attributed to a dilution effect and to a declining sulphur supply in soil with time. Total sulphur concentrations in rape grown with added sulphur increased with time on a soil highly responsive to sulphur (Hamm, 1969) (Fig. 2) .
In forage crops because the exact age of the plant is not always known, total sulphur is not a good index of sulphur status. In sown crops such as wheat, when the age of the plant is known and the relationships between sulphur levels and age have been determined, it would be feasible to use total sulphur concentrations allowing for the age of the plant at sampling (Freney et al., 1978).
Total sulphur h~s been shown to be less sensitive to changes in sulphur supply than other criteria (Grant and Roswell, 1978; Spencer et al., 1977). Similarly, Rasmussen et al. (1977) found total sulphur concentrations in winter wheat between sulphur sufficient and sulphur deficient wheat was often less than year to year variations of the sulphur concentration of plants sampled at the same growth stage. Thus total sulphur is only a relatively crude indicator of the sulphur status of plants. However, considered in conjunction with (or as a supplement to) nitrogen-sulphur ratios and reducible sulphur, total sulphur can be a useful index.
Total Nitrogen:Total Sulphur (N/S) Ratios
The positive nitrogen-sulphur interaction within plants makes the N:S ratio a useful index in evaluating the sulphur status of a crop. Total nitrogen:total sulphur ratios have been widely used with varying results (Dijkshoorn et al., 1960; Pumphrey and Moore, 1965; Stewart and Porter, 1969; Metson, 1972; Terman et al., 1973; Rendig et al., 1976; Goh and Kee, 1978; Spencer, 1978).
Ryan
Sticky Note
None set by Ryan
Ryan
Sticky Note
MigrationNone set by Ryan
Ryan
Sticky Note
Unmarked set by Ryan
.;.,__ Dry rnatter .30 .......... CJ --- o/o s .c 40 ........ CT \ - ft .25 0 ~\ _J
\ \ w - \ ', >- .20 \ ' ~ \ ' .,. w A, A.+S \ 1- \ -. .... ._A._ 1- e, o-s 'o <( --~- .15 ~
' >- ..... 0:: ~ '~ ........ ------0-0 .10
April May June July
DATE OF SAMPLING (month, day)
FIGURE 1. Changes with time in dry matter production and sulphur concentration inS-sufficient and S-deficient spring wheat. (Source: Rasmussen et al., 1977).
.......... ~ 0 ......,
0: ::> lJ... _J ::> f-'
ln
(J) \0
Ryan
Sticky Note
None set by Ryan
Ryan
Sticky Note
MigrationNone set by Ryan
Ryan
Sticky Note
Unmarked set by Ryan
- 160 -
.66
.54
.42 0----cc: ·--::> --lJ... _J ::> .30
·-------(J) • ~ h
. 18 ........... ..........
. 06 ...__ _ ____. ___ ......_ __ ...._ __ __, 20 40 60 80 100
TIME (days)
FIGURE 2. Changes with time in the sulphur concentration of Ssufficient and S-deficient systems. (Source: Hamm, 1969).
Ryan
Sticky Note
None set by Ryan
Ryan
Sticky Note
MigrationNone set by Ryan
Ryan
Sticky Note
Unmarked set by Ryan
- 161 -
One method proposed by Dijkshoorn et al. (1960) is based on the concept of a constant protein nitrogen:protein sulphur (N/S)p ratio. The method assumes that (N/S)p remains constant since the components of a given protein is controlled by the genetics of the plant: species. Environmental factors and nutrient supply should not c:hange the (N/S)p ratio significantly. When sulphur is adequate sulphate or non-protein sulphur accumulates in the plant tissue and the (N/S)t will be smaller than the (N/S)p ratio. Conversely, when sulphur is deficient non-protein nitrogen accumulates and (N/S)t ratio will increase relative to the (N/S)p. Dijkshoorn and van Wijk (1967), from a review of published data indicated that the nitrogen to sulphur ratio in proteins is relatively constant at about 17.5 in legumes and 13.6 in graminous plants. Further data has shown that the (N/S)p was close to 15 parts of N to one part of S for several plant species (Stewart, 1966; Stewart and Porter, 1969). This concept cannot be applied to some plant species such as the Brassica because they contain large amounts of organic sulphur in compounds other than proteins (Stewart and Porter, 1969).
The (N/S)t ratio have been shown to vary less with age and plant part than other diagnostic criteria. Pumphrey and MOore (1965) found that alfalfa at early bloom with a (N/S)t greater than 11:1 was sulphur deficient and the critical (N/S)t remained relatively constant at different growth stages. In subterranean clover pastures critical (N/S)t ratios between 16 and 19_:1 provided.satisfactory discrimination between deficient and non-deficient plants (Spencer, 1978). In earlier greenhouse trials with subterranean clove,r (N/S) t ratios changed less with age, plant part and nitrogen supply than total sulphur or reducible sulphur (Spencer et al., 1977). Other evidence suggested that varying (N/S)t ratio due to plant age could be reduced by sampling a particular plant part.
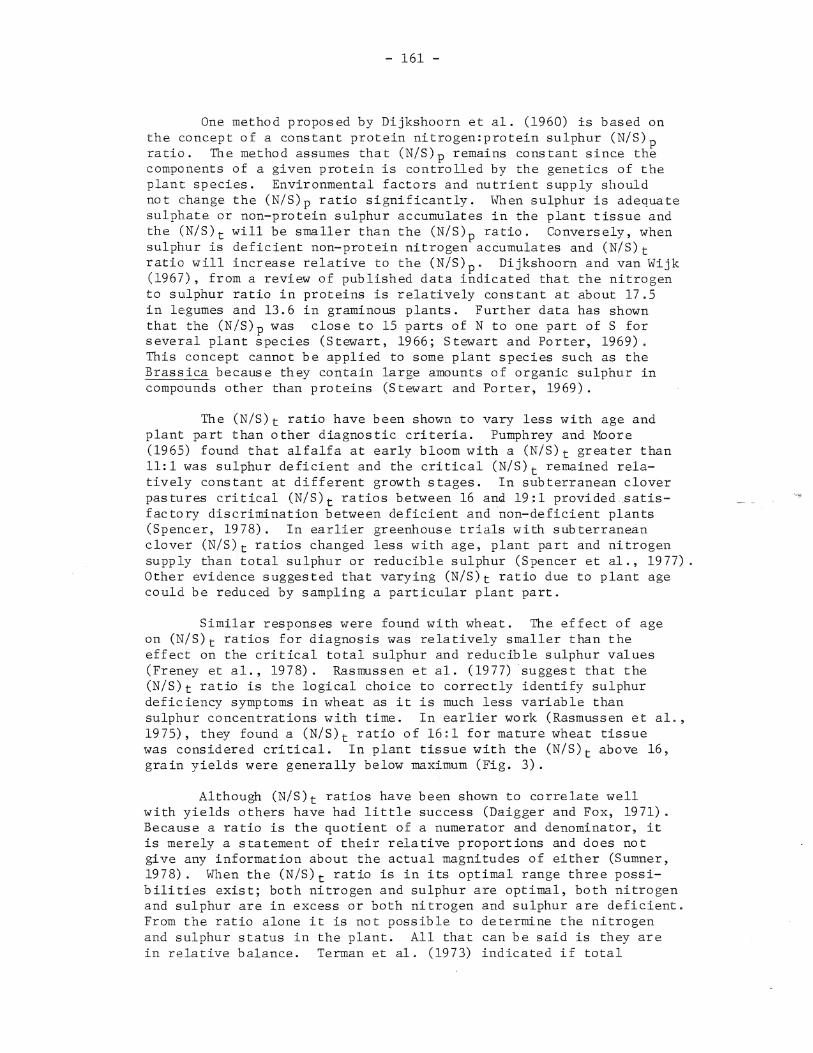
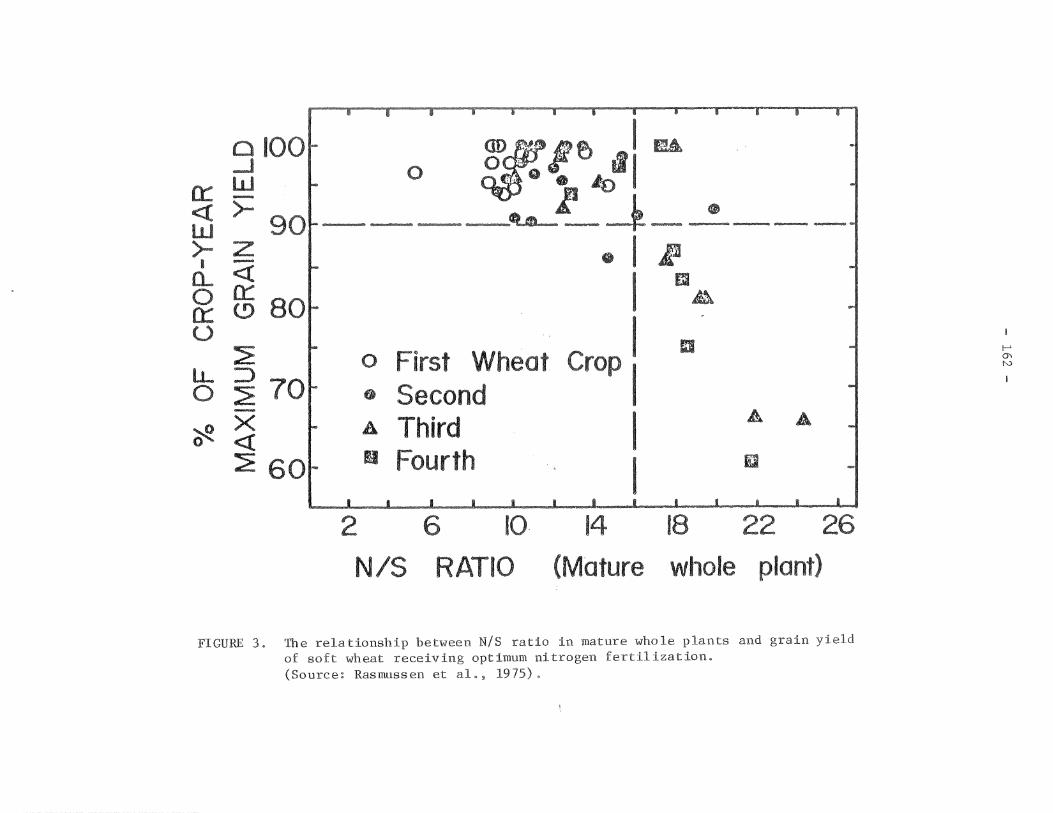
Similar responses were found with wheat. The effect of age on (N/S)t ratios for diagnosis was relatively smaller than the effect on the critical total sulphur and reducible sulphur values (Freney et al., 1978). Rasmussen et al. (1977) suggest that the (N/S)t ratio is the logical choice to correctly identify sulphur deficiency symptoms in wheat as it is much less variable than sulphur concentrations with time. In earlier work (Rasmussen et al., 1975), they found a (N/S)t ratio of 16:1 for mature wheat tissue was considered critical. In plant tissue with the (N/S)t above 16, grain yields were generally below maximum (Fig. 3).
Although (N/S) t ratios have been shown to correlate well with yields others have had little success (Daigger and Fox, 1971). Because a ratio is the quotient of a numerator and denominator, it is merely a statement of their relative proportions and does not give any information about the actual magnitudes of either (Sumner, 1978). When the (N/S) t ratio is in its optimal range three possibilities exist; both nitrogen and sulphur are optimal, both nitrogen and sulphur are in excess or both nitrogen and sulphur are deficient. From the ratio alone it is not possible to determine the nitrogen and sulphur status in the plant. All that can be said is they are in relative balance. Terman et al. (1973) indicated if total
Ryan
Sticky Note
None set by Ryan
Ryan
Sticky Note
MigrationNone set by Ryan
Ryan
Sticky Note
Unmarked set by Ryan
oiOO lf.le I mA __J 0 'I 0:: w . ~ - b~~-<( >- • w >- z • I ; I -a_ <(
I m 0 0::: A 0:: (.!)
0
Crop I ~ 0 First Wheat D
LL ~ 70 0 o Second - A ~
X A Third I <(
:E 60 u Fourth I D
2 6 10- 14 18 22 26
N/S RATIO (Mature whole plant)
FIGURE 3. The relationship between N/S ratio in mature whole plants and grain yield of soft wheat receiving optimum nitrogen fertilization. (Source: Rasmussen et al., 1975).
I-' 0\ N
Ryan
Sticky Note
None set by Ryan
Ryan
Sticky Note
MigrationNone set by Ryan
Ryan
Sticky Note
Unmarked set by Ryan
- 163 -
concentrations are known the (N/S)t can be used to assess the nitrogen and sulphur status of the crop. If the concentrations equal or exceed established critical levels and the resulting (N/S)t for young corn (6-8 weeks) approximates 16, the nutrients are in proper balance.
Nitrogen:sulphur ratios as a diagnostic criteria for sulphur are limited when used as the single index of the sulphur status. But when the (N/S) t ratio is used in a multiple criteria approach as suggested by Blair and Crofts (1970) the deficiencies inherent in single nutrient ratios can be overcome.
Hydriodic Acid Reducible (HI-reducible) Sulphur
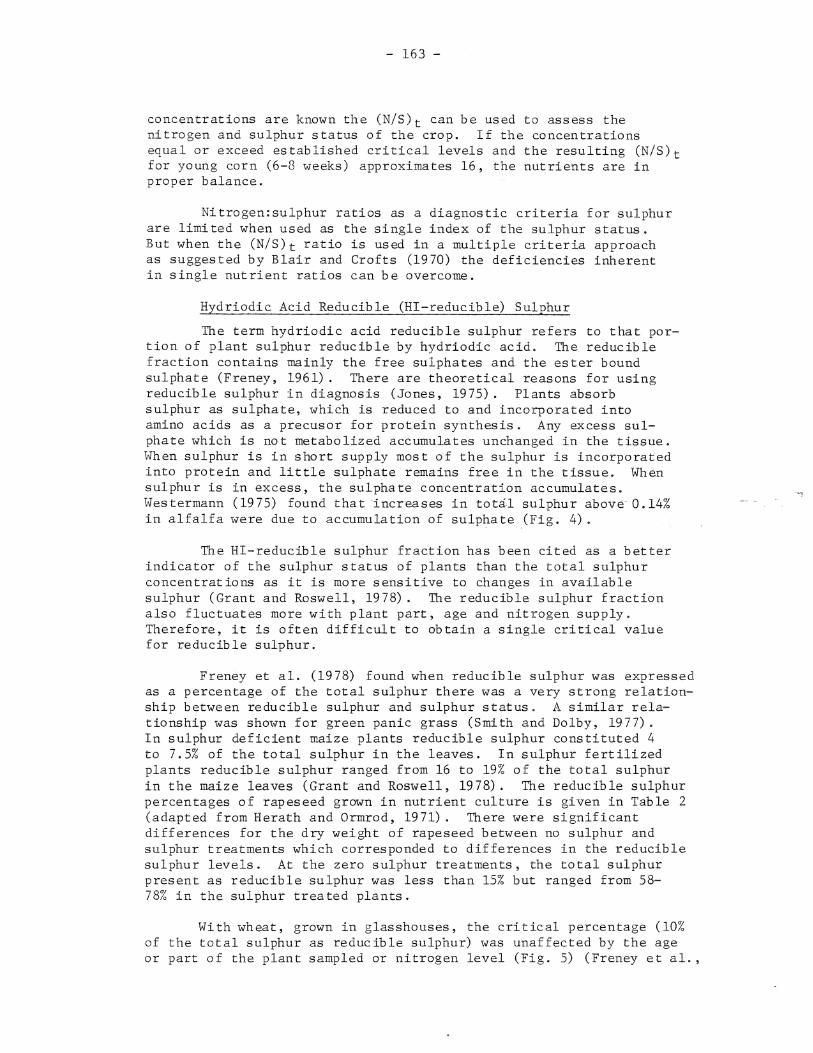
The term hydriodic acid reducible sulphur refers to that portion of plant sulphur reducible by hydriodic acid. The reducible fraction contains mainly the free sulphates and the ester bound sulphate (Freney, 1961). There are theoretical reasons for using reducible sulphur in diagnosis (Jones, 1975). Plants absorb sulphur as sulphate, which is reduced to and incorporated into amino acids as a precusor for protein synthesis. Any excess sulphate which is not metabolized accumulates unchanged in the tissue. When sulphur is in short supply most of the sulphur is incorporated into protein and little sulphate remains free in the tissue. When sulphur is in excess, the sulphate concentration accumulates. Westermann (1975) found that increases in total sulphur above- 0.14% in alfalfa were due to accumulation of sulphate (Fig. 4).
The HI-reducible sulphur fraction has been cited as a better indicator of the sulphur status of plants than the total sulphur concentrations as it is more sensitive to changes in available sulphur (Grant and Roswell, 1978). The reducible sulphur fraction also fluctuates more with plant part, age and nitrogen supply. Therefore, it is often difficult to obtain a single critical value for reducible sulphur.
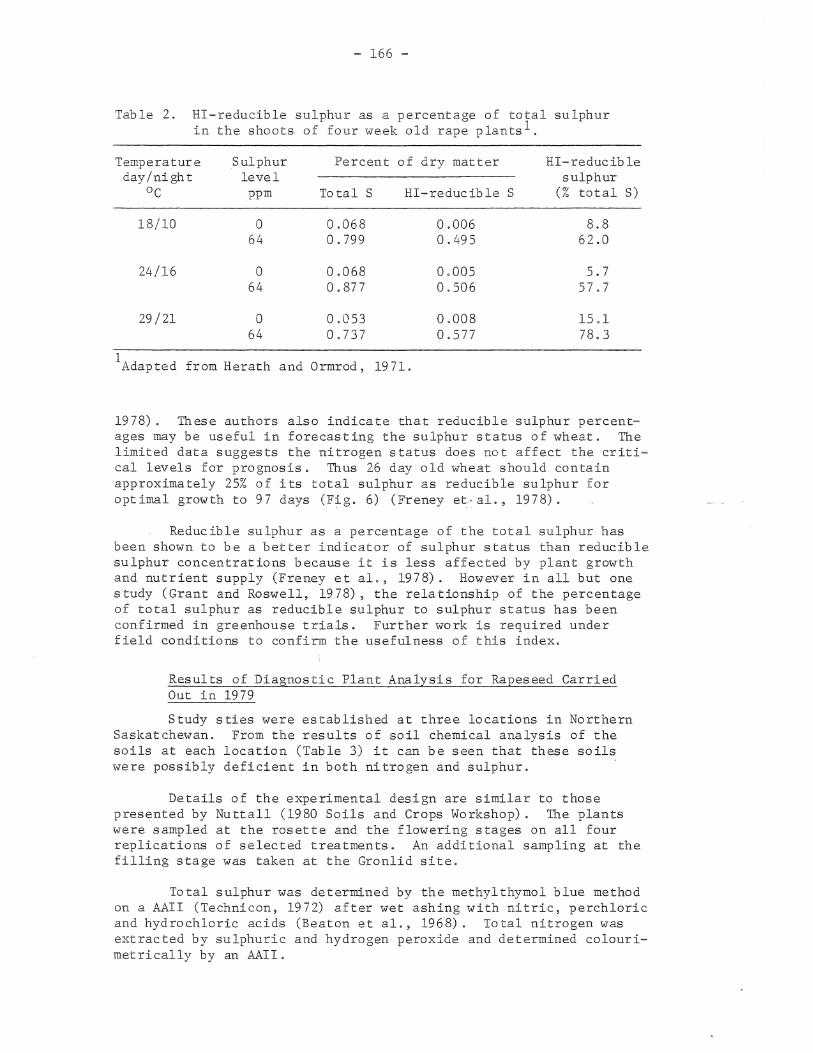
Freney et al. (1978) found when reducible sulphur was expressed as a percentage of the total sulphur there was a very strong relationship between reducible sulphur and sulphur status. A similar relationship was shown for green panic grass (Smith and Dolby, 1977). In sulphur deficient maize plants reducible sulphur constituted 4 to 7.5% of the total sulphur in the leaves. In sulphur fertilized plants reducible sulphur ranged from 16 to 19% of the total sulphur in the maize leaves (Grant and Roswell, 1978). The reducible sulphur percentages of rapeseed grown in nutrient culture is given in Table 2 (adapted from Herath and Ormrod, 1971). There were significant differences for the dry weight of rapeseed between no sulphur and sulphur treatments which corresponded to differences in the reducible sulphur levels. At the zero sulphur treatments, the total sulphur present as reducible sulphur was less than 15% but ranged from 58-78% in the sulphur treated plants.
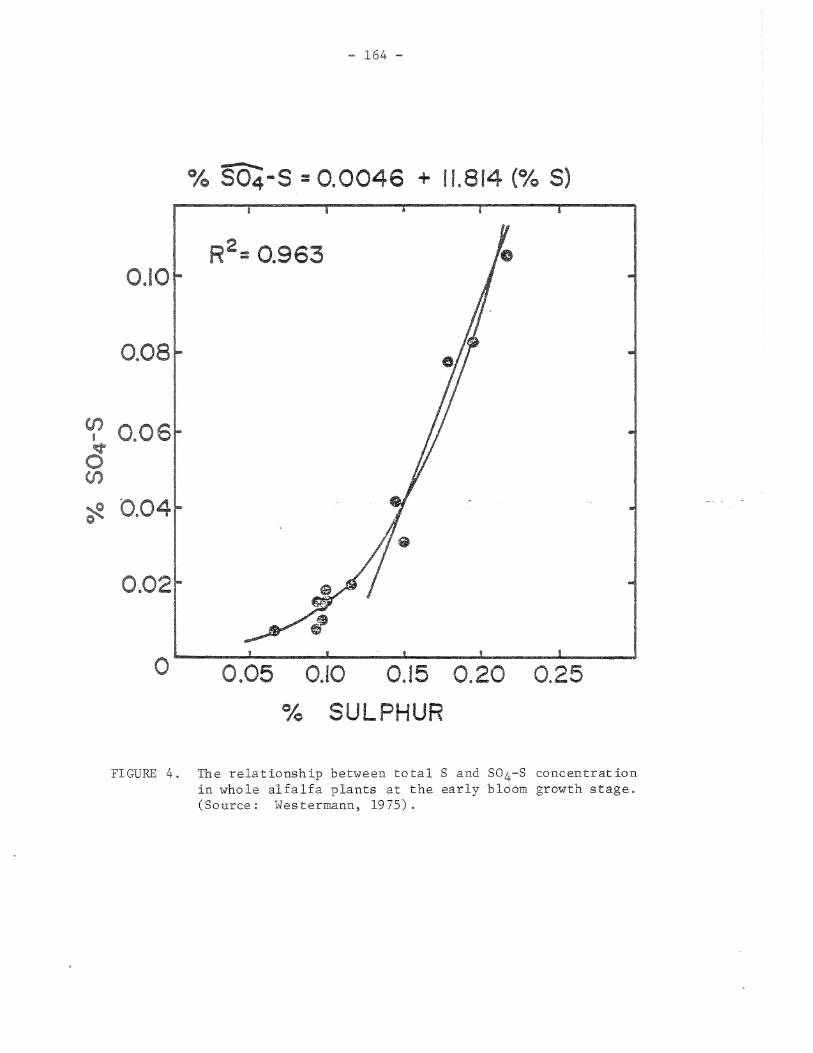
With wheat, grown in glasshouses, the critical percentage (10% of the total sulphur as reducible sulphur) was unaffected by the age or part of the plant sampled or nitrogen level (Fig. 5) (Freney et al.,
Ryan
Sticky Note
None set by Ryan
Ryan
Sticky Note
MigrationNone set by Ryan
Ryan
Sticky Note
Unmarked set by Ryan
- 164 -
0/o 504-s = 0.0046 + 11.814 (Ofo S)
0.10
0.08
c.r 0.06 d en ~ 0.04
0.02
0 0.05 0.10 0.15 0.20 0.25 0/o SULPHUR
FIGURE 4. The relationship between total S and S04-S concentration in whole alfalfa plants at the early bloom growth stage. (Source: Westermann, 1975).
Ryan
Sticky Note
None set by Ryan
Ryan
Sticky Note
MigrationNone set by Ryan
Ryan
Sticky Note
Unmarked set by Ryan
100 ,....., ~ - 80 X 0 X R = 0.93* _j w 60 ->-w > X -tt XX _) 20 X w X a:: X
0 5 10 15 20 25 30 35 40 45 50
SULFATE (% total S)
FIGURE 5. The relationship between sulphate expressed as a percentage of total S and the sulphur status of wheat at various sampling times. (Source: Freney et al., 1978).
.;i
t-' 0"1 V1
Ryan
Sticky Note
None set by Ryan
Ryan
Sticky Note
MigrationNone set by Ryan
Ryan
Sticky Note
Unmarked set by Ryan
- 166 -
Table 2. HI-reducible sulphur as a percentage of total sulphur in the shoots of four week old rape plantsl
Temperature Sulphur Percent of dry matter HI-reducible day/night level sulphur
oc ppm Total S HI-reducible s (% total S)
18/10 0 0.068 0.006 8.8 64 0. 799 0.495 62.0
24/16 0 0.068 0.005 5.7 64 0.877 0.506 57.7
29/21 0 0.053 0.008 15.1 64 0.737 0.577 78.3
1 Adapted from Herath and Ormrod, 1971.
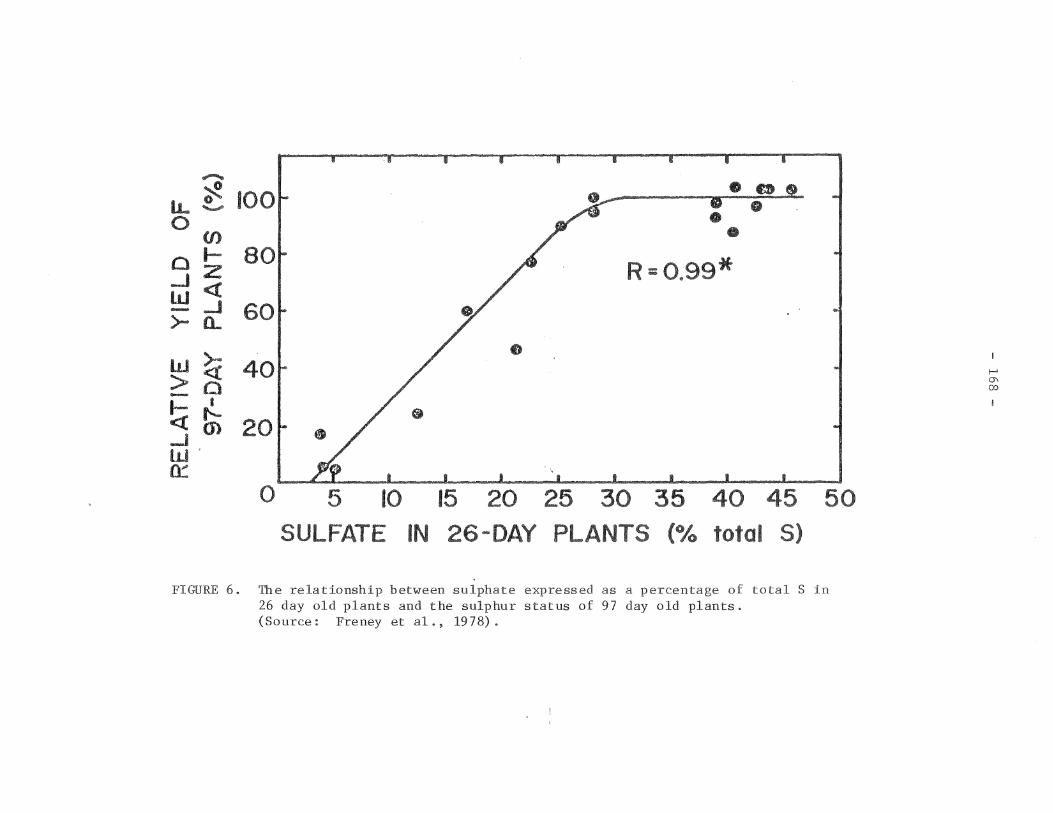
1978). These authors also indicate that reducible sulphur percentages may be useful in forecasting the sulphur status of wheat. The limited data suggests the nitrogen status does not affect the critical levels for prognosis. Thus 26 day old wheat should contain approximately 25% of its total sulphur as reducible sulphur for optimal growth to 97 days (Fig. 6) (Freney et-aL_, 1978).
Reducible sulphur as a percentage of the total sulphur has been shown to be a better indicator of sulphur status than reducible sulphur concentrations because it is less affected by plant growth and nutrient supply (Freney et al., 1978). However in all but one study (Grant and Roswell, 1978), the relationship of the percentage of total sulphur as reducible sulphur to sulphur status has been confirmed in greenhouse trials. Further work is required under field conditions to confirm the usefulness of this index.
Results of Diagnostic Plant Analysis for Rapeseed Carried Out in 1979
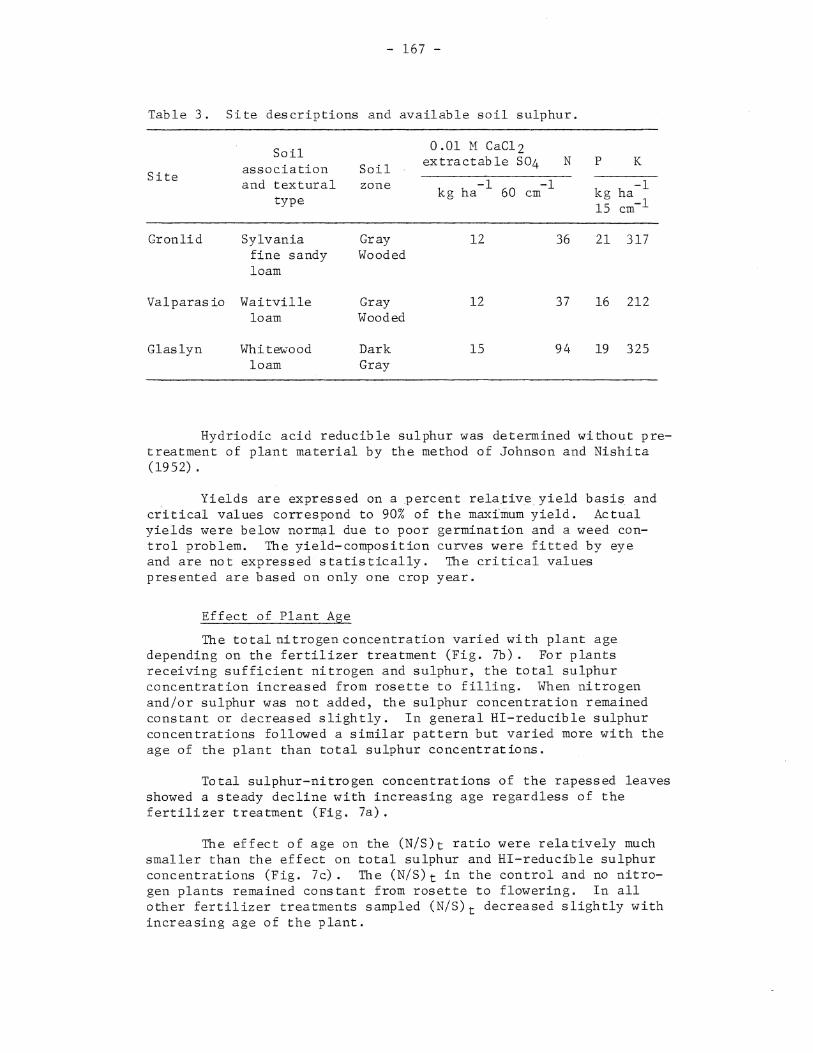
Study sties were established at three locations in Northern Saskatchewan. From the results of soil chemical analysis of the soils at each location (Table 3) it can be seen that these soils were possibly deficient in both nitrogen and sulphur.
Details of the experimental design are similar to those presented by Nuttall (1980 Soils and Crops Workshop). The plants were sampled at the rosette and the flowering stages on all four replications of selected treatments. An additional sampling at the filling stage was taken at the Gronlid site.
Total sulphur was determined by the methylthymol blue method on a AAII (Technicon, 1972) after wet ashing with nitric, perchloric and hydrochloric acids (Beaton et al., 1968). Total nitrogen was extracted by sulphuric and hydrogen peroxide and determined colourimetrically by an AAII.
Ryan
Sticky Note
None set by Ryan
Ryan
Sticky Note
MigrationNone set by Ryan
Ryan
Sticky Note
Unmarked set by Ryan
- 167 -
Table 3. Site descriptions and available soil sulphur.
Soil 0.01 M CaCl2
association Soil extractable S04 N p K Site and textural -1 -1 -1 zone
60 type kg ha em kg ha 15 cm-1
Gronlid Sylvania Gray 12 36 21 317 fine sandy Wooded loam
Valparasio Waitville Gray 12 37 16 212 loam Wooded
Glaslyn Whitew-ood Dark 15 94 19 325 loam Gray
Hydriodic acid reducible sulphur was determined without pretreatment of plant material by the method of Johnson and Nishita (1952).
, Yields are expressed on a percent relative_ yield basis_ and critical values correspond to 90% of the maximum yield. Actual yields were below· normal due to poor germination and a weed control problem. The yield-composition curves were fitted by eye and are not expressed statistically. The critical values presented are based on only one crop year.
Effect of Plant Age
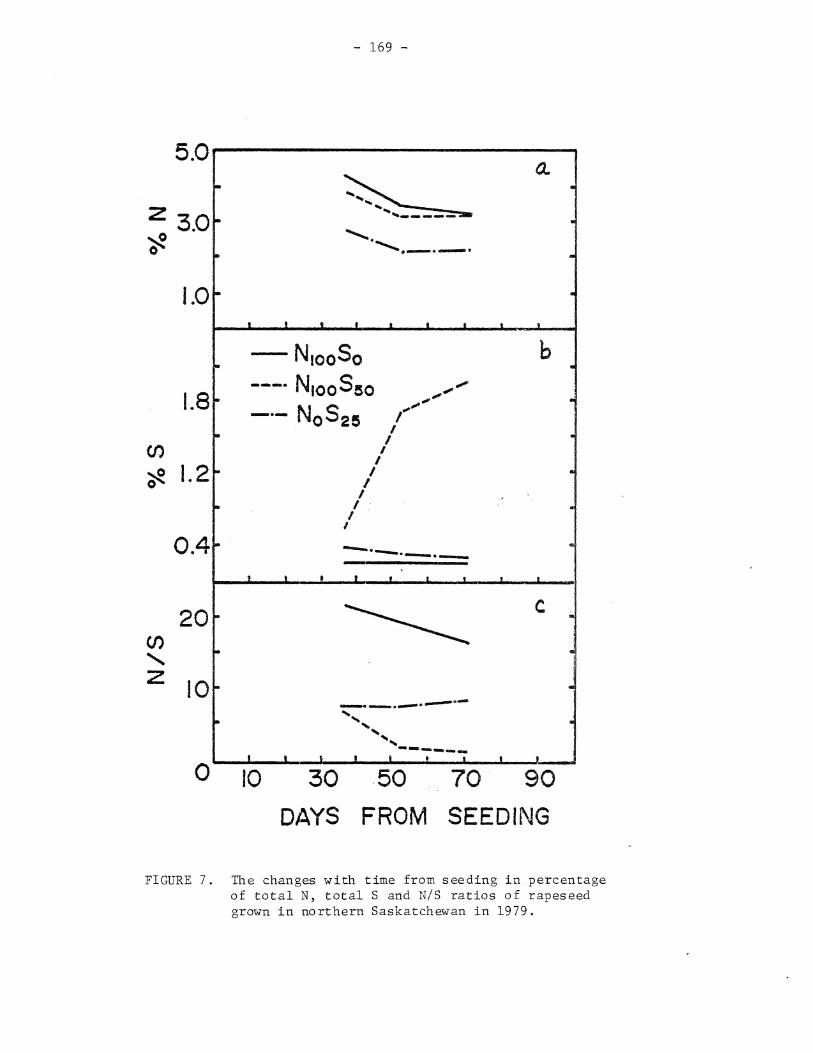
The total nitrogen concentration varied with plant age depending on the fertilizer treatment (Fig. 7b). For plants receiving sufficient nitrogen and sulphur, the total sulphur concentration increased from rosette to filling. When nitrogen and/or sulphur was not added, the sulphur concentration remained constant or decreased slightly. In general HI-reducible sulphur concentrations followed a similar pattern but varied more with the age of the plant than total sulphur concentrations.
Total sulphur-nitrogen concentrations of the rapessed leaves showed a steady decline with increasing age regardless of the fertilizer treatment (Fig. 7a).
The effect of age on the (N/S)t ratio were relatively much smaller than the effect on total sulphur and HI-reducible sulphur concentrations (Fig. 7c). The (N/S)t in the control and no nitrogen plants remained constant from rosette to flowering. In all other fertilizer treatments sampled (N/S)t decreased slightly with increasing age of the plant.
Ryan
Sticky Note
None set by Ryan
Ryan
Sticky Note
MigrationNone set by Ryan
Ryan
Sticky Note
Unmarked set by Ryan
~
~ lL 0 .......... 0 • en • 0 1-
R = 0.99* _. z w <(
- __. 60 >- a..
~ • w 40 > Cl -~
I f-...
20 m -.1 w· ~
0 5 10 15 20 25 30 35 40 45 50 SULFATE IN 26-DAY PLANTS (% total S)
FIGURE 6. The relationship between sulphate expressed as a percentage of total S in 26 day old plants and the sulphur status of 97 day old plants. (Source: Freney et al., 1978).
I-' 0\ 00
Ryan
Sticky Note
None set by Ryan
Ryan
Sticky Note
MigrationNone set by Ryan
Ryan
Sticky Note
Unmarked set by Ryan
5.0
z 3.0 ~ 0
1.0
1.8
(/)
~ 1.2
CJ)
' z
0.4
20
10
0
•
. •
•
•
. •
..
. •
. r-
1-
•
- 169 -
~ a.
... ,.. ___ ...........
"·-·-·
I I I I . _L _._ I -•
-N1ooSo b ---· NtooSso .,.-" ,,
NoS2e .,, -·- I
I I
I I
I I
I . I -
I I
-·----·-·-' t I I • t • I
~ c
___ ........ .---·--........
.... .... , ' ------1 I ' I • • t I I
10 30
DAYS
.50
FROM 70 90
SEEDING
•
.
.
.
.
..
. •
•
.
,;,
•
.
.
FIGURE 7. The changes with time from seeding in percentage of total N, total S and N/S ratios of rapeseed grown in northern Saskatchewan in 1979.
Ryan
Sticky Note
None set by Ryan
Ryan
Sticky Note
MigrationNone set by Ryan
Ryan
Sticky Note
Unmarked set by Ryan
- 170 -
Critical Values
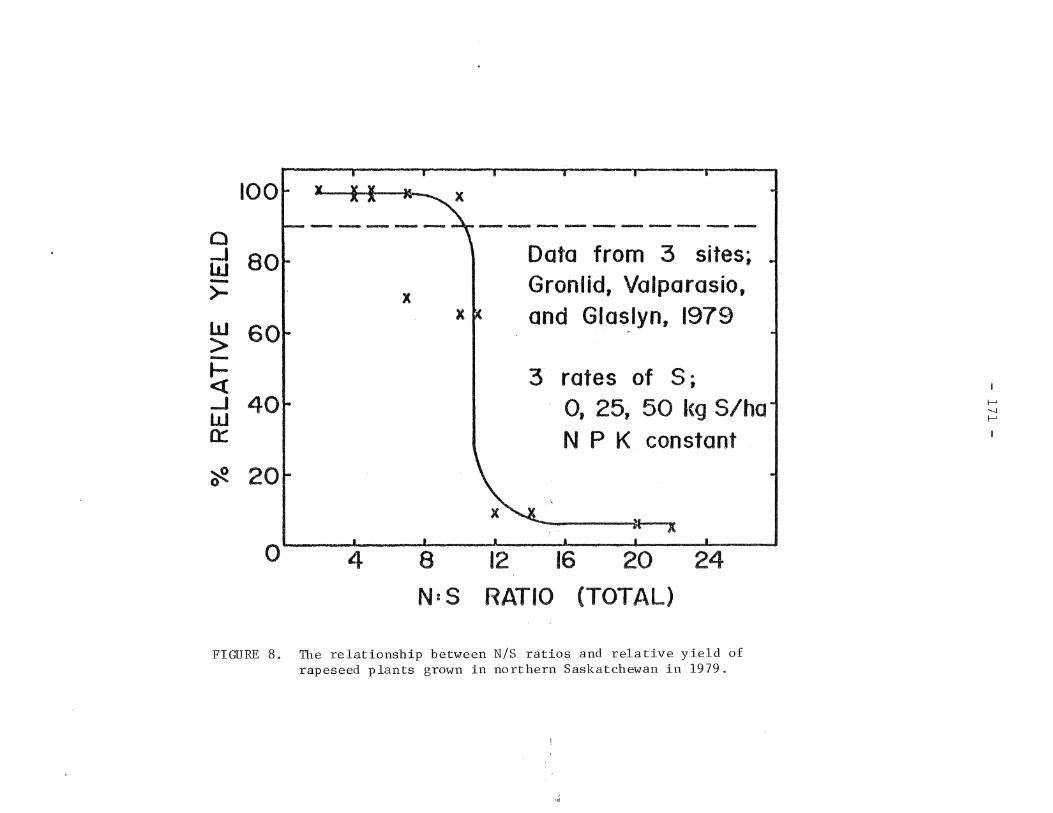
The relationship between total nitrogen:total sulphur ratios and sulphur status is the same for all three sites at both the rosette and flowering growth stage (Fig. 8). The data plotted are for treatments at a constant NPK level (100, 20 and 50 kg/ha, respectively). Rapeseed leaves with an (N/S)t less than 11:1 were adequately supplied with sulphur.
Total sulphur concentrations showed a greater change with age and nitrogen level than with sulphur supply. If total sulphur (and total nitrogen) are included with (N/S) t ratios in classifying the sulphur status of rapeseed, a more meaningful guide to diagnosing sulphur deficiencies can be determined. A preliminary classification system for rapeseed which include total nitrogen, total sulphur and (N/S)t was determined (Table 4) using the multiple criteria approach of Blair et al. (1978).
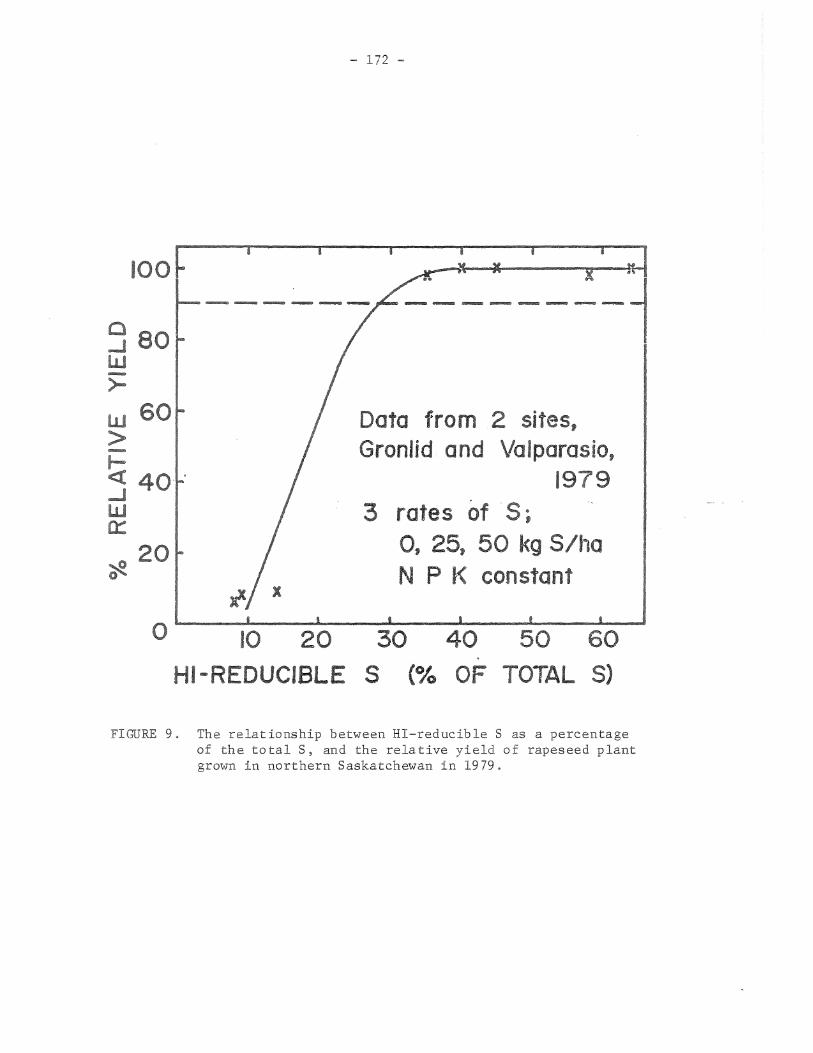
When HI-reducible sulphur was expressed as a percentage of the total sulphur a fairly strong relationship was found (Fig. 9). The relationship was more sensitive to the sulphur status of the rapeseed but showed a greater variability to plant age than did (N/S)t. Because of the limited data available for the % total sulphur as HI-reducible sulphur, the critical value can not be set with the same reliability as for (N/S)t. Percentages of total sulphur as HI-reducible sulphur b-elow a critical range of 28-30% in rapeseed leaves at rosette indicated a sulp):mr deficiency.
The (N/S)t and HI-reducible sulphur (percent total sulphur) were found to be the best indices for diagnosing the sulphur status of rapeseed. The main weakness of the (N/S)t ratio, as indicated by Sumner (1978), is that it is mainly a statement of the relative portion of nitrogen and sulphur and does not give any information about the actual magnitudes of either. This can be partially overcome by using a multiple criteria approach as in Table 4.
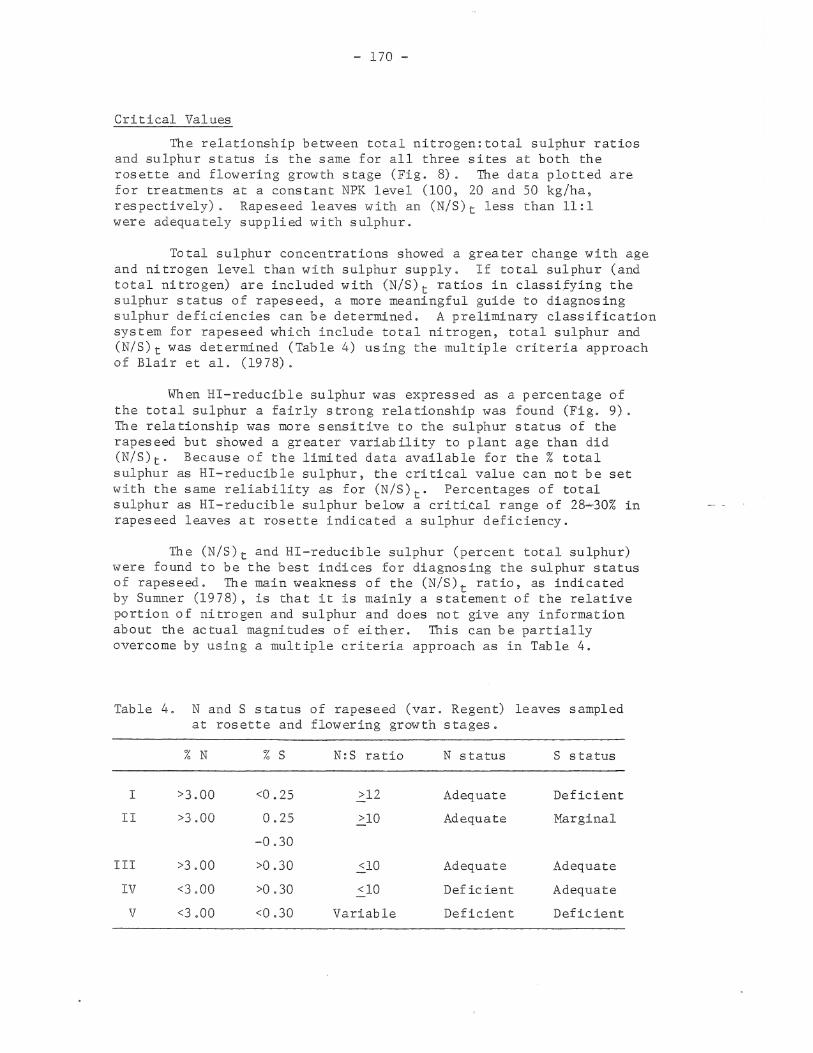
Table 4. N and S status of rapeseed (var. Regent) leaves sampled at rosette and flowering growth stages.
% N % s N:S ratio N status S status
I >3.00 <0 .25 >12 Adequate Deficient
II >3.00 0.25 >10 Adequate Marginal
-0.30
III >3 .00 >0 .30 <10 Adequate Adequate
IV <3.00 >0 .30 <10 Deficient Adequate
v <3.00 <0.30 Variable Deficient Deficient
Ryan
Sticky Note
None set by Ryan
Ryan
Sticky Note
MigrationNone set by Ryan
Ryan
Sticky Note
Unmarked set by Ryan
100 _________ ._ __ 0 _J Data from 3 sites; w - Gronlid, Valparasio, >- X
LLJ and Glaslyn, 1979 > -I- 3 rates of S; <{ _J 0, 25, 50 kg S/ha w 0:: N P K constant
~
0 4 8 12 16 20 24
N=S RATIO (TOTAL)
FIGURE 8. The relationship between N/S ratios and relative yield of rapeseed plants grown in northern Saskatchewan in 1979.
1-' '-1 1-'
Ryan
Sticky Note
None set by Ryan
Ryan
Sticky Note
MigrationNone set by Ryan
Ryan
Sticky Note
Unmarked set by Ryan
100
~ 80 w ->-w 60 > -~ ....J w 0:::
20 *
- 172 -
--------l Data from 2 sites, Gronlid and Valparasio,
1979 3 rates of -s;
0, 25, 50 kg S/ha N P K constant
0 10 20 30 40 50 60 (% OF TOTAL S) HI-REDUCIBLE S
FIGURE 9. The relationship between HI-reducible S as a percentage of the totalS, and the relative yield of rapeseed plant grown in northern Saskatchewan in 1979.
Ryan
Sticky Note
None set by Ryan
Ryan
Sticky Note
MigrationNone set by Ryan
Ryan
Sticky Note
Unmarked set by Ryan
- 173 -
Although (N/S)t showed less variability to age and nitrogen level than HI-reducible. sulphur (percent total sulphur), it was less sensitive to the sulphur status of rapeseed. Thus if the HIreducible sulphur (% of total sulphur) is determined at the rosette growth stage only, it is likely a more sensitive index of the sulphur status than (N/S)t·
It must be emphasized that the critical values and relationships presented are based on only one year's field data. Thus before these relationships can be used as techniques in determining the sulphur status of rapeseed, reconfirmation in a second year's field study is required.
References
Anderson, D.W. (1966). Available sulphur in some Manitoba soils as estimated by plant growth and chemical analysis. M.Sc. Thesis, University of Manitoba, Winnipeg.
Beaton, J.D., C.R. Burns and J. Platou. (1968). of sulphur in soils and plant material. Institute, Washington, 14.
Determination Tech. Bull. Sulphur
Bettany, J.R., J.W.B. Stewart and E.H. Halstead. (1974). Sulphur fractions and carbon, nitrogen and sulfur. relationships in grassland, forest and associated transitional soils. Soil Sci. Soc. Amer. Proc. 37: 915-918.
Bettany, J.R., J.W.B. Stewart and S. Saggar. (1979). The nature and forms of sulfur in organic matter fractions of soils selected along an environmental gradient. Soil Sci. Soc. Am. J. 43: 981-985.
Bettany, J.R., S. Saggar and J.W.B. Stewart. (1980), Comparison of the amounts and forms of sulfur in soil organic matter fractions after 65 years of cultivation. Soil Sci. Soc. Am. J.
Biederbeck, V.O. (1978). Soil organic sulfur and fertility. In Soil Organic Matter. M. Schnitzer and S.U. Khan (Eds.) Elsevier Scientific Pub. Co., New York. pp. 273-310.
Blair, G.J. (1979). Sulfur in the tropics. Int. Fert. Development Center, Muscle Shoals, Ala. 69 p.
Blair, G.J. and F.C. Crofts. (1979). The effect of sulphur fertilization on the yield and chemical composition of forage oats on the central tablelands of New South Wales. Aust. J. Exp. Agric. Anim. Husb. 10: 768-773.
Blair, G.J., C.P. Mamaril and E. Momuat. (1978). Sulfur nutrition of wetland rice. IRRS Res. Pap. Ser. No. 21. 29 p.
Ryan
Sticky Note
None set by Ryan
Ryan
Sticky Note
MigrationNone set by Ryan
Ryan
Sticky Note
Unmarked set by Ryan
- 174 -
Daigger, L.A. and R.L. Fox. (1971). Nitrogen and sulfur nutrition of sweet corn in relation to fertilization and water composition. Agron. J. 63: 729-730.
Dijkshoorn, W., J.E.M. Lampe and P.F.J. van Burg. (1960). A method of diagnosing the sulfur status of herbage. Plant and Soil 13: 227-241.
Dijkshoorn, W. and A.L. van Wijk. (1967). The sulphur requirements of plants as evidence by the sulphur-nitrogen ratio in the organic matter. A review of published data. Plant and Soil 26: 129-157.
Ensminger, L.E. and J.R. Freney. (1966). Diagnostic techniques for determining sulfur deficiencies in crops and soils. Soil Sci. 101: 283-290.
Fox, R.L., R.A. Olson and H.F. Rhoades. (1964). Evaluating the sulfur status of soils by plant and soil tests. Soil Sci. Soc. Am. Proc. 28: 243-246.
Freney, J.R. (1961). Some observations on the nature of organic sulphur compounds in soil. Aust. J. Agric. Res. 12: 424-436.
Freney, J.R., K. Spencer and M.B. Jones. (1978). The diagnosis of sulphur deficiency inwheat. Aust. J .. -Agric. Res. 29:·729-738.
Goh, K.M. and K.K. Kee. (1978). Effects of nitrogen and sulphur fertilization on the digestibility and chemical composition of perennial ryegrass (Lolium perenne L.). Plant and Soil so: 161-177.
Grant, P.M. and A.W.G. Roswell. (1978). The distribution of sulphate and total sulphur in maize plants (Zea mays L.) in relation to the diagnosis of deficiency. Rhod. J. Agric. Res. 16: 43-59.
Harnm, J.W. (1969). Nitrogen and sulphur mineralization of several Manitoba soils and N:S ratios in rape and barley. M.Sc. Thesis, University of Manitoba, Winnipeg.
Harnm, J.W., J.R. Bettany and E.H. Halstead. (1973). A soil test for sulphur and interpretative criteria for Saskatchewan. Cornm. Soil Sci. Plant Anal. 4: 219-231.
Herath, H.M.W. and D.P. Ormrod. (1971). Temperature effects on the response to sulphur of barley, peas and rape. Plant and Soil 35: 635-646.
Johnson, C.M. and H. Nishita. (1952). Microestimation of sulphur -in plant materials, soils and irrigation waters. Anal. Chern. 24: 736-742.
Jones, M.B. (1975). Plant assays for the recognition of sulphur deficiency. In Sulphur in Australasian Agriculture. K.D. McLachla~(Ed.) Sydney Univ. Press. pp. 175-181.
Ryan
Sticky Note
None set by Ryan
Ryan
Sticky Note
MigrationNone set by Ryan
Ryan
Sticky Note
Unmarked set by Ryan
- 175 -
35 McKell, C.M. and A.M. Wilson. (1963). Effects of temperature on S uptake and translocation by rose and subterranean clovers. Agron. J. 55: 134-137.
Metson, A.J. (1972). Iron pyrites as fertilizers. II. Forms of sulphur fertilizer in relation to growth of and total sulphur, sulphate sulphur and nitrogen/sulphur ratio in a grass-clover pasture. N.Z. Jour. Agric. Res. 15: 565-584.
Metson, A.J. (1979). Sulphur in New Zealand soils. I. A review of sulphur in soils with particular reference to adsorbed sulphate-sulphur. N.Z. Jour. Agric. Res. 22: 95-114.
Nuttall, W.F. (1980). The effect of nitrogen, sulphur and boron on the growth and yield of rapeseed. Proc. of 1980 Soils and Crops Workshop, Saskatoon.
Pumphrey, F.V. and D.P. Moore. (1965). Diagnosing sulfur deficiency of alfalfa (Medicago sativa L.) from plant analysis. Agron. J. 57: 364-366.
Rasmussen, P.E., R.E. Ramig, R.R. Allmaras and C.M. Smith. (1975). Nitrogen-sulfur relations in soft winter wheat. II. Initial and residual effects of sulfur application on nutrient concentrations, uptake and N/S ratio. .Agron. J. 6 7: 224-228.
Rasmussen, P.E., R.E. Ramig, L.G •. Ekin and C.R. Rohde. (1977). Tissue analysis guidelines for diagnosing sulphur deficiency in white wheat. Plant and Soil 46: 153-163.
Rehm, G.W. and A.C. Caldwell. (1968). Sulfur supplying capacity of soils and the relationship to soil type. Soil Sci. 105: 355-361.
Reisenauer, H.M. (1975). Soil assays for the recognition of sulphur deficiencies. In Sulphur in Australasian Agriculture. K.D. McLachlan (ed.) Sydney Univ. Press. pp. 182-187.
Rendig, V.V., C. Oputa and E.A. McComb. (1976). Effects of sulfur deficiency on non-protein nitrogen, soluble sugars and N/S ratios in young corn (Zea mays L.) plants. Plant and Soil 44: 423-427.
Sansum, L.L. and J.B.D. Robinson. (1974). Wet digestion, manual and automated analysis of total sulphur in plant material. Comm. Soil Sci. Plant Anal. 5: 365-383.
Smith, F.W. and G.R. Dolby. (1977). Derivation of diagnostic indices for assessing the sulphur status of Panicum maximum var. trichoglume. Comm. Soil Sci. Plant Anal. 8: 221-240.
Spencer, K. (1975). Sulphur requirements of plants. Australasian Agriculture. K.D. McLachlan (ed.). Press.
In Sulphur in Sydney Univ.
Ryan
Sticky Note
None set by Ryan
Ryan
Sticky Note
MigrationNone set by Ryan
Ryan
Sticky Note
Unmarked set by Ryan
- 176 -
Spencer, K. (1978). Sulphur nutrition of clover: effects of plant age on the composition-yield relationship. Comm. Soil Sci. Plant Anal. 9: 883-895.
Spencer, K., M.B. Jones and J.R. Freney. (1977). for sulphur status of subterranean clover. Res. 28: 401-412.
Diagnostic indices Aust. J. Agric.
Stewart, B.A. (1966). Nitrogen-sulphur relationships in plant tissues, plant residues and soil organic matter. Trans. Comm. II & IV, I.S.S.S. (Aberdeen). pp. 131-138.
Stewart, B.A. and C.J. Whitfield. (1965). Effects of crop residue, soil temperature and sulfur on the growth of winter wheat. Soil Sci. Soc. Am. Proc. 29: 752-755.
Stewart, B.A. and L.K. Porter. (1969). Nitrogen-sulfur relationships in wheat (Triticum aestivum L.),corn (Zea mays L.) and beans (Phaseolus vulgaris). Agron. J. 61: 267-271.
Sumner, M.E. (1978). Interpretation of nutrient ratios in plant tissue. Comm. Soil Sci. Plant Anal. 9: 335-345.
Technicon. (1972). Sulfate in water and wastewater. Industrial Method No. 118-71W. Technicon Industrial Systems, Tarrytown, New York.
Terman, G.L., S.E. Allen and P.M. Giordana. (1973). Dry matter yield -- N and S concentration relationships and ratios in young corn plants. Agron. J. 65: 633-636.
Tisdale, S.L. (1971). Soil and plant tests for the evaluation of the sulphur status of soils. Proc. Int. Symp. Fert. Evaluation, New Delhi, India. pp. 119-133.
Ulrich, A., M.A. Tabatabai, K. Ohki and C.M. Johnson. (1967). Sulphur content of alfalfa in relations to growth in filtered and unfiltered air. Plant and Soil 29: 235-252.
Westermann, D.T. (1975). Indexes of sulfur deficiency in alfalfa. II. Plant analysis. Agron. J. 67: 265-268.
Ryan
Sticky Note
None set by Ryan
Ryan
Sticky Note
MigrationNone set by Ryan
Ryan
Sticky Note
Unmarked set by Ryan
Related Documents