1 st NATIONAL CONFERENCE & EXHIBITION ON CNG & RELATED INDUSTRIES 2008 Olympic Hotel, Tehran, Islamic Republic of Iran, 2 nd – 4 th August 2008 ANGVA & NGV IN ASIA PACIFIC LEE GIOK SENG EXECUTIVE DIRECTOR ASIA PACIFIC NATURAL GAS VEHICLES ASSOCIATION (ANGVA)

.. 1 st NATIONAL CONFERENCE & EXHIBITION ON CNG & RELATED INDUSTRIES 2008 Olympic Hotel, Tehran, Islamic Republic of Iran, 2 nd – 4 th August 2008 ANGVA.
Dec 26, 2015
Welcome message from author
This document is posted to help you gain knowledge. Please leave a comment to let me know what you think about it! Share it to your friends and learn new things together.
Transcript

..
1st NATIONAL CONFERENCE & EXHIBITION ON CNG & RELATED INDUSTRIES 2008
Olympic Hotel, Tehran, Islamic Republic of Iran, 2nd – 4th August 2008
ANGVA &
NGV IN ASIA PACIFIC
LEE GIOK SENGEXECUTIVE DIRECTOR
ASIA PACIFIC NATURAL GAS VEHICLES ASSOCIATION(ANGVA)
22
CONTENT
ANGVA
NGV IN ASIA PACIFIC

33
THE ASSOCIATION

44
ASIA PACIFIC NATURAL GAS VEHICLES ASSOCIATION (ANGVA)
..
.
Secretariat Office:Level 2, Block A, Lot 3288 & 3289Off Jalan Ayer Itam, Kawasan Institusi Bangi43000 Kajang SelangorMALAYSIATel: 603 8926 1798Fax: 603 8926 1834Email: [email protected]: www.angva.org
ANGVA is the NGV industry association serving NGV
stakeholders in the Asia Pacific region.
ANGVA defines the Asia Pacific region as countries
in the United Nations Asian Regional Group and the
Australasia.

55
ANGVA COVERAGE AREAS – ASIA PACIFIC REGION
(UNITED NATIONS ASIAN REGIONAL GROUP AND AUSTRALASIA)
██ Asia Pacific Region – 58 Countries

66
COUNTRIES IN ANGVA’S ASIA PACIFIC REGION
Country Country Country Country1 Afghanistan 16 Iraq 31 Nauru 46 Syria2 Australia 17 Japan 32 Nepal 47 Taiwan3 Bahrain 18 Jordan 33 New Zealand 48 Tajikistan4 Bangladesh 19 Kazakhstan 34 Oman 49 Thailand5 Bhutan 20 Kiribati 35 Pakistan 50 Timor-Leste
6Brunei Darussalam
21 Kuwait 36 Palau 51 Tonga
7 Cambodia 22 Kyrgyzstan 37Papua New Guinea
52 Turkmenistan
8 China 23 Laos 38 Philippines 53 Tuvalu
9 Cooks Island 24 Lebanon 39 Qatar 54United Arab Emirates
10 Cyprus 25 Malaysia 40Republic of Korea
55 Uzbekistan
11 DPR of Korea 26 Maldives 41 Samoa 56 Vanuatu
12 Fiji 27Marshall Islands
42 Saudi Arabia 57 Vietnam
13 India 28 Micronesia 43 Singapore 58 Yemen14 Indonesia 29 Mongolia 44 Solomon Islands15 IR of Iran 30 Myanmar 45 Sri Lanka

77
VISION AND MISSIONS OF ANGVA
VISION
To make natural gas the transportation fuel of
choice.
MISSION
Assisting members in their NGV business.
Reducing emissions and greenhouse gases.
Optimising the use of indigenous fuel.
Establishing a platform for harmonising
standards.
Encourage development of NGV technology and
refuelling infrastructure.

88
OBJECTIVES OF ANGVA
OBJECTIVES
1. Provide forum for discussions.
2. Promote development of sustainable and profitable
market.
3. Encourage development of NGV technology and
refuelling infrastructure.
4. Advance knowledge and learning, and stimulate
research.
5. Collect, analyse and disseminate information.
6. Promote standards for safety and uniformity of
practices.
7. Organise conferences, exhibitions, seminars,
workshops, fora, and trainings.

99
www.angva.org
Homepage
WEBSITE

1010
ORGANISATION CHART OF ANGVA
COUNCIL
EXECUTIVE COMMITTEE(GOVERNING BOARD)
SECRETARIAT
COMMITTEES ANGVA SCHOOLS
Marketing & Media CommitteeHead: Guan Saw
Membership CommitteeHead: Sean Blythe
Structural & Financial CommitteeHead: Brenda Smith
Technical CommitteeHead: Fazal Ali Khan
Governing Board Members (2007 – 2009)
PresidentDr. Chitrapongse Kwangsukstith (PTT, Thailand)
Immediate Past PresidentDatuk (Dr) Abdul Rahim Hj. Hashim (PETRONAS, Malaysia)
Senior Vice PresidentGuan Saw (Cummins Westport, China)
TreasurerBrenda Smith (Gas Advisers, Hong Kong)
Vice Presidents1. Fazal Ali Khan (LMF, UAE)2. Sean Blythe (AFT, Australia)3. Hyo-Sun Pang (KOGAS, Korea)
Secretariat StaffLee Giok Seng (Secretary/Executive
Director)
Norhafiza Roosli (Executive)

1111Secretariat
Staff
EXECUTIVE COMMITTEE / BOARD MEMBERS
Executive Committee / Board Members

1212
59 ANGVA MEMBERS WORLDWIDE (as of July 20th 2008)
No
CountryNo. of
Members
Class
A B C D
1 Australia 5 1 3 1
2 Bangladesh 7 4 3
3 Canada 2 2
4 China 2 1 1
5 Hong Kong 1 1
6 Indonesia 2 2
7 IR of Iran 4 1 3
8 Italy* 1 1
9 Japan 1 1
10 Malaysia 12 1 3 7 1
No CountryNo. of
Members
Class
A B C D
11 Myanmar 1 1
12 New Zealand 2 2
13 Pakistan 2 1 1
14 Singapore 1 1
15 South Korea 9 1 3 5
16 Thailand 2 1 1
17 UAE 2 1 1
18United Kingdom*
1 1
19 USA* 2 1 1
TOTAL 59 6 5 32 14

1313
4 ANGVA MEMBERS IN ISLAMIC REPUBLIC OF IRAN (as of July 20th 2008)
No
Class
Company Main Focal Person Designation
1 A Gas Khodro Iran Co Alireza RahnamaInternational Affairs
2 C Noavaran Engineering Co. G. H. Liaghat -
3 C Golchin Barg CompanyIraj Mahandesi Khosroshahi
Managing Director
4 CFanavavan Saanat Gostave Paniz
Mohammad Ali Ramezani
Managing Director

1414
Theme: “Natural Gas for Vehicles – Rising to the Challenge”
Host: Donghae City.
Website: www.angva2009.com
UPCOMING ANGVA EVENT
ANGVA 2009, DONGHAE, KOREA, 27 – 29TH Oct 2009

1515
ANGVA GREEN HIGHWAYS PROJECT II Objectives:
Create awareness and promote NGV, ANGVA, and NGV Infrastructure along the routes.
Promote harmonisation of Standards and Code of Practices along the routes.
To reach Donghae City in time for ANGVA 2009, 27th – 29th Oct 2009.
To be self-funding.
Sponsorships and participations are welcome.
Propose Green Highways Project II routes:
Western Route
Iran / UAE - Pakistan – India – Bangladesh - Myanmar – China – Korea.
Southern Route
Singapore / Malaysia – Thailand – Vietnam – China - Korea
UPCOMING ANGVA EVENT

1616
UPCOMING ANGVA ENDORSED EVENT
CNG-NGV Philippines Forum 2008
Date: 27 – 28th August 2008
Place: Manila, Philippines
Organiser: All Events Group
Website: www.alleventsgroup.com/cng

1717
NGV IN ASIA PACIFIC

1818
20 COUNTRIES HAVE NGV PROGRAMMES

1919
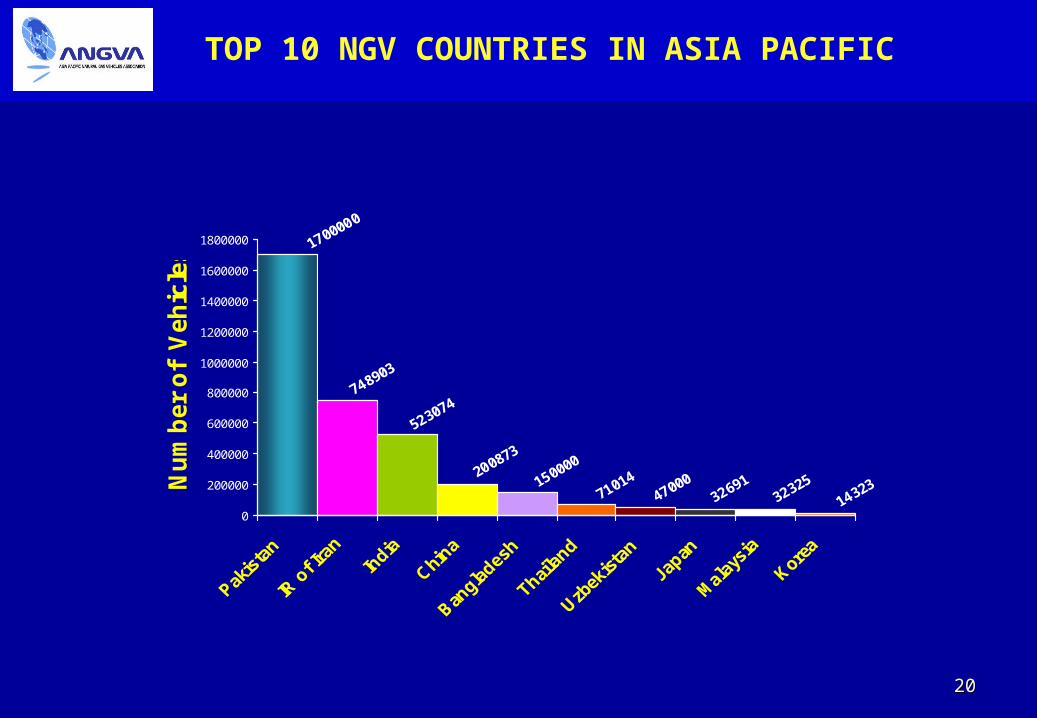
Country No. of Vehicles No. of Stations Remarks
1 Pakistan 1,700,000 1,974 Apr ‘08
2 IR of Iran 748,903 413 May ‘08
3 India 523,074 402 Apr ‘08
4 China 200,873 486 Jan ‘08
5 Bangladesh 150,000 200 Dec ‘07
6 Thailand 71,014 185 Apr ‘08
7 Uzbekistan 47,000 43 Dec ‘07
8 Japan 32,691 324 Sept ‘07
9 Malaysia 32,325 75 Apr ‘08
10 Republic of Korea 14,323 121 Oct ‘07
11 Myanmar 10,900 20 Dec ‘06
12 Tajikistan 10,600 53 Dec ‘07
13 Kyrgyzstan 6,000 6 Dec ‘07
14 Indonesia 3,079 8 Apr ‘08
15 Australia 2,453 146 Mar ‘07
16 Singapore 370 3 Apr ‘08
17 United Arab Emirates 305 2 Mar ‘07
18 New Zealand 283 14 Mar ‘07
19 Philippines 36 1 Feb ‘06
20 Taiwan* 4 1 Apr ‘05
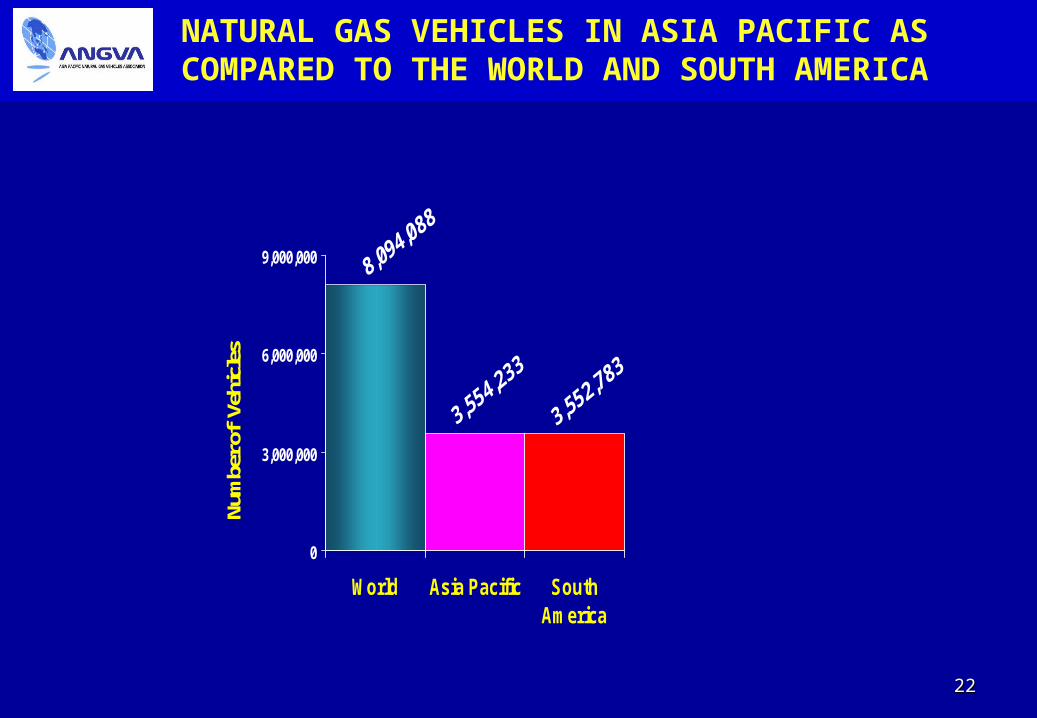
Total 3,554,233 4,477
3.55 MILLIONS NATURAL GAS VEHICLES AND 4500 STATIONS
(Source: Asian NGV Communications & GVR magazines & Others)
2020
0
200000
400000
600000
800000
1000000
1200000
1400000
1600000
1800000
Nu
mb
er
of
Veh
icle
s
TOP 10 NGV COUNTRIES IN ASIA PACIFIC

2121
0
200000
400000
600000
800000
1000000
1200000
1400000
1600000
1800000
Nu
mb
er
of
Ve
hic
les
TOP 10 NGV COUNTRIES IN THE WORLD
2222
0
3,000,000
6,000,000
9,000,000
World Asia Pacific SouthAmerica
Num
ber o
f Ve
hicl
es
NATURAL GAS VEHICLES IN ASIA PACIFIC AS COMPARED TO THE WORLD AND SOUTH AMERICA

2323
12,673
3,7704,480
0
5,000
10,000
15,000
20,000
World Asia Pacific South America
Nu
mb
er
of
Re
fue
llin
g S
tati
on
s
NGV REFUELLING STATIONS IN ASIA PACIFIC AS COMPARED TO THE WORLD AND SOUTH AMERICA

2424
THE GROWTH

2525
0
200000
400000
600000
800000
1000000
1200000
1400000
1600000
1800000
2003 2004 2005 2006 2007 2008
No
. of
Veh
icle
s
Pakistan
IR of Iran
India
China
Bangladesh
Uzbekistan
Thailand
Japan
Malaysia
Republic of Korea
Myanmar
Tajikistan
Kyrgyztan
Australia
Indonesia
Singapore
United Arab Emirates
New Zealand
Philippines
Taiwan
NATURAL GAS VEHICLES GROWTH IN ASIA PACIFIC (2003 TO 2008)

2626
NGV REFUELLING STATIONS GROWTH IN ASIA PACIFIC (2003 TO 2008)
0
500
1000
1500
2000
2003
2004
2005
2006
2007
2008
No
. of
Sta
tio
ns
Pakistan
IR of Iran
India
China
Bangladesh
Uzbekistan
Thailand
Japan
Malaysia
Republic of Korea
Tajikistan
Kyrgyztan
Myanmar
Australia
Indonesia
Singapore
United Arab Emirates
New Zealand
Philippines
Taiwan

2727
0
1000000
2000000
3000000
4000000
5000000
6000000
7000000
8000000
9000000
2004 2005 2006 2007 2008
No
. of V
ehic
les
Asia Pacific
South America
World
NATURAL GAS VEHICLES GROWTH COMPARED TO THE WORLD AND SOUTH AMERICA (2004 TO 2008)

2828
0
2000
4000
6000
8000
10000
12000
14000
2004 2005 2006 2007 2008
No
. of
Sta
tio
ns
Asia Pacific
South America
World
NGV STATIONS GROWTH COMPARED TO THE WORLD AND SOUTH AMERICA (2004 TO 2008)

2929
THE FUTURE?

3030
NGV WILL CONTINUE TO GROW IN ASIA PACIFIC
Present of strong key drivers in most
countries in Asia Pacific:
1. Energy
2. Economics
3. Environment
Strong support and commitment from
government.

3131
NGV WILL CONTINUE TO GROW IN THE FOLLOWING 25 COUNTRIES IN ASIA PACIFIC
Countries Currently With NGV
1 Pakistan 8 Japan 15 Australia2 IR of Iran 9 Malaysia 16 Singapore3 India 10 Republic of Korea 17 United Arab Emirates4 China 11 Myanmar 18 New Zealand5 Bangladesh 12 Tajikistan 19 Philippines6 Thailand 13 Kyrgyzstan 20 Taiwan*7 Uzbekistan 14 Indonesia
Countries With Good Potential for NGV
1 Vietnam 4 Macau**
2 Cambodia 5 Brunei3 Hong Kong**

3232
0.380.486.8614.2
84.1122.92
86.264.184.254.4820.17
5.196.64
2235148.4
25.8127.6
26.5464.7
144.31300
100162.92
159
0 500 1000 1500
BruneiMacau
Hong KongCambodia
VietnamTaiwan
PhilippinesNew Zealand
United Arab EmiratesSingapore
AustraliaKyrgyzstan
TajikistanIndonesiaMyanmar
KoreaMalaysia
JapanUzbekistan
ThailandBangladesh
ChinaIndia
IR of IranPakistan
Million People
Human Populations (2006)
3.5 BILLION PEOPLE IN THE 25 COUNTRIES
Source: World Bank (except for Taiwan).
Total Population = 3.5 Billion.
World Total Population = 6.5 Billions

3333
1. Energy
More natural gas reserves than oil
reserves.
Consumed more oil than produced.
Global oil price continues to increase.
Transportation sector consumed 35 to
40 % of final energy (mainly in the form
of gasoline and diesel).
Trans boundary pipelines and LNG
supplies ensure reliable supply of
natural gas.
Opportunity to use biomethane as
renewable and sustainable source.
KEY DRIVERS DRIVING COUNTRIES TOWARDS NGV

3434Source: Energy Information Administration, EIA.
13.80006.80.293.960.9
214.40
27.640.20.2
97.78100
751.4
66.214.755
53.3238.88
971.1528.15
0 100 200 300 400 500 600 700 800 900 1000
BruneiMacau
Hong KongCambodia
VietnamTaiwan
PhilippinesNew Zealand
United Arab EmiratesSingapore
AustraliaKyrgystanTajikistanIndonesiaMyanmar
KoreaMalaysia
JapanUzbekistan
ThailandBangladesh
ChinaIndia
IR of IranPakistan
Trillion Cubic Feet (TCF)
Natural Gas Reserves. TCF (2006)
1,629 TRILLION CUBIC FEET OF NATURAL GAS RESERVES IN THE 25 COUNTRIES
Total Natural Gas Reserves = 1,629 TCF.
World Natural Gas Reserves = 6,124 TCF.

3535
1.40000.600.10.1
97.801.4
4.3000.10
30.10.60.30
18.35.8
132.50.3
-10 10 30 50 70 90 110 130 150
BruneiMacau
Hong KongCambodia
VietnamTaiwan
PhilippinesNew Zealand
United Arab EmiratesSingapore
AustraliaIndonesia
KyrgyzstanTajikistanMyanmar
KoreaMalaysia
JapanUzbekistan
ThailandBangladesh
ChinaIndia
IR of IranPakistan
Billion Barrels
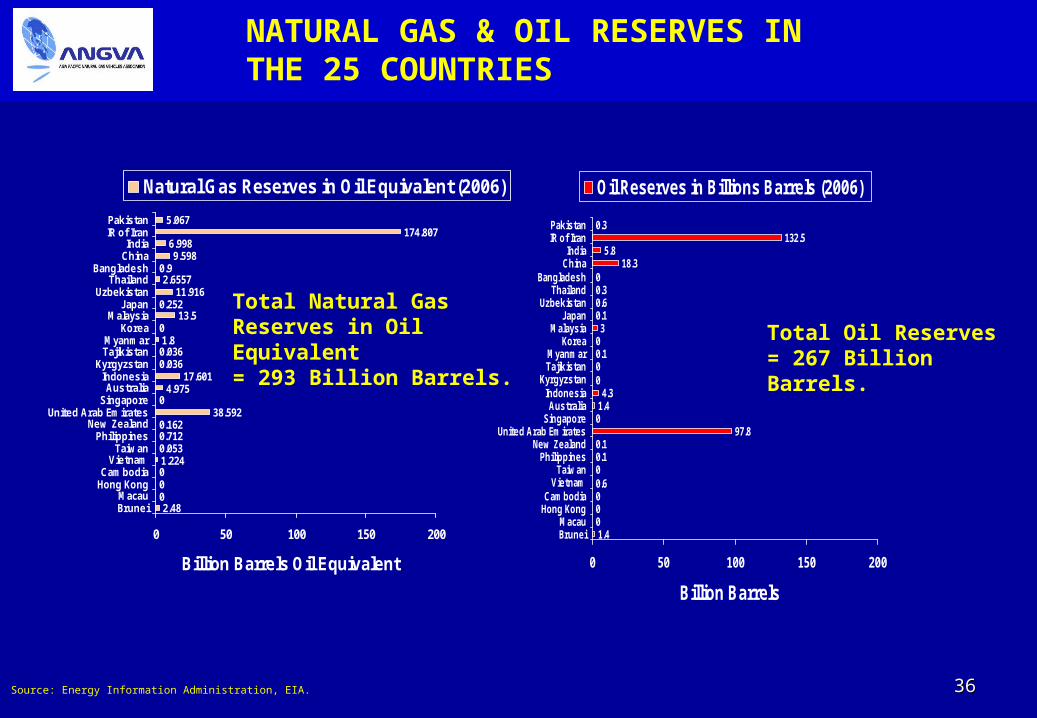
Oil Reserves in Billions Barrels (2006)
267 BILLION BARRELS OF OIL IN THE 25 COUNTRIES
Source: Energy Information Administration, EIA.
Total Oil Reserves = 267 Billion Barrels.
World Oil Reserves = 1,292 Billion Barrels.
3636
2.480001.2240.0530.7120.162
38.5920
4.97517.601
0.0360.0361.80
13.50.252
11.9162.6557
0.99.598
6.998174.807
5.067
0 50 100 150 200
BruneiMacau
Hong KongCambodia
VietnamTaiwan
PhilippinesNew Zealand
United Arab EmiratesSingapore
AustraliaIndonesia
KyrgyzstanTajikistanMyanmar
KoreaMalaysia
JapanUzbekistan
ThailandBangladesh
ChinaIndia
IR of IranPakistan
Billion Barrels Oil Equivalent
Natural Gas Reserves in Oil Equivalent (2006)
NATURAL GAS & OIL RESERVES IN THE 25 COUNTRIES
1.40000.600.10.1
97.801.44.3
000.103
0.10.60.30
18.35.8
132.50.3
0 50 100 150 200
BruneiMacau
Hong KongCambodia
VietnamTaiwan
PhilippinesNew Zealand
United Arab EmiratesSingapore
AustraliaIndonesia
KyrgyzstanTajikistanMyanmar
KoreaMalaysia
JapanUzbekistan
ThailandBangladesh
ChinaIndia
IR of IranPakistan
Billion Barrels
Oil Reserves in Billions Barrels (2006)
Source: Energy Information Administration, EIA.
Total Oil Reserves = 267 Billion Barrels.
Total Natural Gas Reserves in Oil Equivalent = 293 Billion Barrels.
3737
2. Economics
Prices of Gasoline and Diesel continue to
increase.
Government subsidies heavily gasoline and
diesel.
CNG/NGV are price lower than gasoline and
diesel.
Other incentives were also given.
KEY DRIVERS DRIVING COUNTRIES TOWARDS NGV

3838
0
5000
10000
15000
20000
25000
1980
1982
1984
1986
1988
1990
1992
1994
1996
1998
2000
2002
2004
2006
Bill
ion
Cu
bic
Fe
et,
BC
F
Asia Pacific GasProduction
Asia Pacific GasConsumption
TOTAL GAS PRODUCTION AND CONSUMPTION IN THE 25 COUNTRIES

3939
0
5000
10000
15000
20000
25000
30000
1980
1982
1984
1986
1988
1990
1992
1994
1996
1998
2000
2002
2004
2006
Th
ou
sa
nd
Ba
rre
ls P
er
Da
y
Asia Pacific OilProduction
Asia PacificPetroleum Products& Oil Consumption
TOTAL OIL PRODUCTION & PETROLEUM PRODUCTS & OIL CONSUMPTION IN THE 25 COUNTRIES

4040
3. Environment
Air quality in major cities are deteriorating,
major contributors are vehicles.
Vehicles Emission Standards are being
tightened in many countries.
Concern with Global Warming / Climate
Change.
KEY DRIVERS DRIVING COUNTRIES TOWARDS NGV

4141
PROJECTED GROWTH OF NATURAL GAS VEHICLES IN ASIA PACIFIC (Low Growth)
0
500000
1000000
1500000
2000000
2500000
2003 2004 2005 2006 2007 2008 2009 2010 2011 2012 2013
No
. of
Veh
icle
s
Pakistan IR of Iran India China
Bangladesh Uzbekistan Thailand Japan
Malaysia Republic of Korea Myanmar Tajikistan
Kyrgyzstan Australia Indonesia Singapore
United Arab Emirates New Zealand Philippines Taiwan
Total vehicles in 2013 = 5.2 Millions.(addition of around 1.6 millions vehicles from 2008).
Assume conservative growth of around 2.5 to 10 % per year.

4242
PROJECTED GROWTH OF NGV REFUELLING STATIONS IN ASIA PACIFIC (Low Growth)
Total stations in 2013 = 6,500 (addition of around 2,000 stations from 2008).
Assume conservative growth of around 2.5 to 10 % per year.
0
1000
2000
3000
2003 2004 2005 2006 2007 2008 2009 2010 2011 2012 2013
No
. of
Sta
tio
ns
Pakistan IR of Iran India China
Bangladesh Thailand Uzbekistan Japan
Malaysia Republic of Korea Myanmar Tajikistan
Kyrgyzstan Australia Indonesia Singapore
United Arab Emirates New Zealand Philippines Taiwan

4343
PROJECTED GROWTH OF NATURAL GAS VEHICLES IN ASIA PACIFIC (High Growth)
0
500000
1000000
1500000
2000000
2500000
3000000
No
. o
f V
eh
icle
s
Pakistan Iran India China
Bangladesh Uzbekistan Thailand Japan
Malaysia Republic of Korea Myanmar Tajikistan
Kyrgyzstan Australia Indonesia Singapore
United Arab Emirates New Zealand Philippines Taiwan
Total vehicles in 2013 = 7.35 Million.(addition of around 3.38 millions vehicles from 2008).Assume high growth of 10 to 20 % per year.

4444
PROJECTED GROWTH OF NGV REFUELLING STATIONS IN ASIA PACIFIC (High Growth)
Total stations in 2013 = 9400 (addition of around 5,000 stations from 2008).Assume growth of 10 to 20 % per year.
0
1000
2000
3000
4000
2003 2004 2005 2006 2007 2008 2009 2010 2011 2012 2013
No
. of
Sta
tio
ns
Pakistan Iran India China
Bangladesh Thailand Uzbekistan Japan
Malaysia Republic of Korea Myanmar Tajikistan
Kyrgyzstan Australia Indonesia Singapore
United Arab Emirates New Zealand Philippines Taiwan

4545
THE CHALLENGES

4646
Major Challenges:
1. Government Support & Policies
2. Gas Supply and Refuelling
Infrastructure
3. Technology and Know-how
4. Safety Standard and Enforcement
5. Market Awareness and Education
CHALLENGES FACED BY NGV PROGRAMMES

4747
1. Government Support & Policies
Strong support.
Transport energy policy.
Clear and consistent policy on NGV.
Incentives given to NGV.
Strong industry / government
partnership.
CHALLENGES FACED BY NGV PROGRAMMES

4848
2. Gas Supply and Refuelling Infrastructure
Tangible economic benefits to all players in the supply
chain.
Adequate and stable supply of natural gas.
Pricing mechanism to stations and vehicles clear and
consistent.
Adequate price differential between CNG and petrol &
diesel.
Adequate number of stations and at strategic
locations.
CHALLENGES FACED BY NGV PROGRAMMES

4949
3. Technology and Know How
Affordable and suitable to local conditions.
High cost of technology and equipment
impedes growth of NGV.
Local manufacturing / fabrication can lower
cost.
Skilled manpower for planning,
implementation, construction, operation and
maintenance needed.
CHALLENGES FACED BY NGV PROGRAMMES

5050
4. Safety Standards and Enforcement
Safety during planning, implementation,
operation and maintenance stages.
Safety Standards and Code of Practices.
Safety Management System for refuelling
stations and vehicles.
Enforcement of safety requirements.
Safety education and awareness.
Incidents investigation and findings.
Emergency Response Plan.
CHALLENGES FACED BY NGV PROGRAMMES

5151
5. Market Awareness and Education
Change traditional preference for gasoline and
diesel.
Emphasizes on cost savings and environmental
benefits.
Address technical limitations of NGV
Address operational and safety issues
• Education programmes.
• Awareness programmes.
• Promotional campaigns.
• Conferences, Seminars, Fora, Workshops.
• Formal trainings.
CHALLENGES FACED BY NGV PROGRAMMES

5252
The NGV markets in Asia Pacific will continue to
grow due to Energy, Economics, and Environment
requirement.
There are challenges to the NGV industry and each
country will face these challenges at different
levels, depending on local conditions.
The Asia Pacific Natural Gas Vehicles Association
(ANGVA) can be the focal point to facilitate the
exchange and sharing of information, knowledge
and experiences especially in areas of safety and
harmonisation.
SUMMARY

5353
THANK YOU
Related Documents