EFFECT OF INORGANIC SALTS ON LIQUID-LIQUID EQUILIBRIUM IN EXTRACTION OF LACTIC ACID USING 1-BUTANOL Kanungnit Chawong A Thesis Submitted in Partial Fulfillment of the Requirements for the Degree of Master of Engineering in Chemical Engineering Suranaree University of Technology Academic Year 2013

Welcome message from author
This document is posted to help you gain knowledge. Please leave a comment to let me know what you think about it! Share it to your friends and learn new things together.
Transcript
EFFECT OF INORGANIC SALTS ON LIQUID-LIQUID
EQUILIBRIUM IN EXTRACTION OF LACTIC ACID
USING 1-BUTANOL
Kanungnit Chawong
A Thesis Submitted in Partial Fulfillment of the Requirements for the
Degree of Master of Engineering in Chemical Engineering
Suranaree University of Technology
Academic Year 2013
ผลของเกลืออนินทรียตอสมดุลของเหลว – ของเหลว
ในการสกัดกรดแล็คติกดวย 1-บิวทานอล
นางสาวคนึงนิจ ชาวงษ
วิทยานิพนธนี้เปนสวนหนึงของการศึกษาตามหลักสูตรปริญญาวิศวกรรมศาสตรมหาบัณฑิต
สาขาวิชาวิศวกรรมเคมี
มหาวิทยาลัยเทคโนโลยีสุรนาร ี
ปการศึกษา 2556
EFFECT OF INORGANIC SALTS ON LIQUID-LIQUID
EQUILIBRIUM IN EXTRACTION OF LACTIC ACID
USING 1-BUTANOL
Suranaree University of Technology has approved this thesis submitted in
partial fulfillment of the requirements for a Master’s Degree.
Thesis Examining Committee
_______________________________________
(Dr. Terasut Sookkumnerd)
Chairperson
_______________________________________
(Asst. Prof. Dr. Panarat Rattanaphanee)
Member (Thesis Advisor)
_______________________________________
(Prof. Dr. Adrian E. Flood)
Member
_______________________________________
(Asst. Prof. Dr. Atichat Wongkoblap)
Member
________________________ _______________________________________
(Prof. Dr. Sukit Limpijumnong) (Assoc. Prof. Flt. Lt. Dr. Kontorn Chamniprasart)
Vice Rector for Academic Affairs Dean of Institute of Engineering
and Innovation
คนึงนิจ ชาวงษ : ผลของเกลืออนินทรียตอสมดุลของเหลว-ของเหลวในการสกัดกรดแล็ค-
ติกดวย 1-บิวทานอล (EFFECT OF INORGANIC SALTS ON LIQUID-LIQUID
EQUILIBRIUM IN EXTRACTION OF LACTIC ACID USING 1-BUTANOL)
อาจารยท่ีปรึกษา : ผูชวยศาสตราจารย ดร.พนารัตน รัตนพานี, 178 หนา.
วิทยานิพนธน้ีมีวัตถุประสงคเพ่ือศึกษาผลของเกลืออนินทรียตางชนิดตอสมดุลของเหลว-
ของเหลวของนํ้า 1-บิวทานอล และกรดแล็คติก และประยุกตใชผลการศึกษาท่ีไดในการสกัดแยก
กรดแล็คติกจากสารละลายเอเควียสดวย 1-บิวทานอล การศึกษาวิจัยในวิทยานิพนธแบงเปน 3 สวน
สวนแรกคือการศึกษาสมดุลของเหลว-ของเหลวของระบบผสมตัวทําละลายอิเล็กโทรไลตท่ี
ประกอบดวยน้ํา, 1-บิวทานอล และเกลืออนินทรียตางชนิด ไดแก โซเดียมคลอไรด, โซเดียม
ซัลเฟต, แอมโมเนียมคลอไรดและแอมโมเนียมซัลเฟตท่ีอุณหภูมิระหวาง 303.15 ถึง 323.15 เคลวิน
ภายใตความดันบรรยากาศ ผลการทดลองแสดงใหเห็นวา ความสามารถในการละลายระหวางน้ํา
และ 1- บิวทานอลลดลงเม่ือความเขมขนของเกลืออนินทรียในระบบเพิ่มขึ้น และอุณหภูมิในชวงท่ี
ทําการศึกษามีผลตอสมดุลของระบบดังกลาวเพียงเล็กนอย เม่ือหาคาสหสัมพันธของผลการทดลอง
ท่ีไดดวยแบบจําลอง Modified extended UNIQUAC พบวา แบบจําลองนี้มีความสอดคลองกับผล
การทดลองอยางนาพอใจ มีคาเบ่ียงเบนกําลังสองสัมบูรณเฉล่ียตํ่ากวา 1%
การศึกษาวิจัยสวนท่ีสองเปนการศึกษาสมดุลของเหลว-ของเหลวของระบบน้ํา, 1-บิว
ทานอลและกรดแล็คติกภายใตสภาวะความดันบรรยากาศ ท่ีอุณหภูมิ 303.15 เคลวิน และประเมิน
ความเปนไปไดในการสกัดกรดแล็กติกดวย 1-บิวทานอลจากคาสัมประสิทธ์ิการกระจายตัวของกรด
แล็กติกระหวางวัฎภาคเอเควียสและวัฏภาคสารอินทรีย ผลการศึกษาพบวาคาสัมประสิทธ์ิการ
กระจายและประสิทธิภาพในการสกัดกรดแล็คติกเพ่ิมขึ้นตามความเขมขนของกรดแล็คติกใน
สารละลายเริ่มตน ผลการหาคาสหสัมพันธของสมดุลของเหลว-ของเหลวของระบบดังกลาวดวย
แบบจําลอง UNIQUAC และ NRTL พบวา แบบจําลอง UNIQUAC มีความสอดคลองกับผลการ
ทดลองดีกวา โดยมีคาเบ่ียงเบนกําลังสองสัมบูรณเฉล่ียตํ่ากวา 0.5%
การศึกษาวิจัยสวนสุดทายเปนการประยุกตใชผลของเกลืออนินทรียตอพฤติกรรมสมดุล
ของเหลว - ของเหลวของระบบของผสมสององคประกอบนํ้า และ 1-บิวทานอล ในการสกัดกรด
แล็กติก ผลการศึกษาพบวาเกลือแตละชนิดสงผลกระทบอยางมีนัยสําคัญตอการกระจายตัวของ
กรดแล็คติกระหวางวัฏภาคเอเควียสและวัฏภาคสารอินทรีย โดยในระบบท่ีเติมโซเดียมคลอไรด
และแอมโมเนียมคลอไรด สัมประสิทธ์ิการกระจายตัวและประสิทธิภาพการสกัดกรดแล็กติกมีคา
ข
ลดลงเม่ือความเขมขนของเกลือในระบบเพ่ิมขึ้น เรียกปรากฏการณน้ีวา Salting in สวนระบบท่ีเติม
โซเดียมซัลเฟตและแอมโมเนียมซัลเฟตน้ัน สัมประสิทธิ์การกระจายตัวและประสิทธิภาพการสกัด
จะเพิ่มขึ้นตามความเขมขนของเกลือในระบบ เรียกปรากฏการณน้ีวา Salting out เม่ือพิจารณา
ความสามารถของเกลือแตละชนิดในการเพิ่มคาสัมประสิทธ์ิการกระจายตัวของกรดแล็คติกและ
เรียงลําดับความสามารถดังกลาวจากมากไปนอยจะไดวาโซเดียมซัลเฟตมีความสามารถมากกวา
แอมโมเนียมซัลเฟส โซเดียมคลอไรด และแอมโมเนียมคลอไรด ตามลําดับ ผลการศึกษาของ
วิทยานิพนธฉบับน้ีสรุปไดวา เกลืออนินทรียท้ัง 4 ชนิดมีผลตอสมดุลของเหลว-ของเหลวนํ้า 1-บิว
ทานอล และนํ้า 1-บิวทานอล กรดแล็กติก โดยโซเดียมซัลเฟต และแอมโมเนียมซัลเฟตทําให
ประสิทธิภาพการสกัดกรดแล็กติกจากน้ําดวย 1-บิวทานอลมีประสิทธิภาพดีขึ้น แตโซเดียมคลอไรด
และแอมโมเนียมคลอไรดทําใหกระบวนการสกัดน้ีมีประสิทธิภาพลดลง
สาขาวิชา วิศวกรรมเคมี ลายมือชื่อนักศึกษา
ปการศึกษา 2556 ลายมือชื่ออาจารยท่ีปรึกษา
KANUNGNIT CHAWONG : EFFECT OF INORGANIC SALTS ON
LIQUID-LIQUID EQUILIBRIUM IN EXTRACTION OF LACTIC ACID
USING 1-BUTANOL. THESIS ADVISOR : ASST. PROF. PANARAT
RATTANAPHANEE, Ph.D., 178 PP.
LACTIC ACID/ LIQUID-LIQUID EXTRACTION/ 1-BUTANOL/ INORGANIC
SALTS/ UNIQUAC MODEL/ MODIFIED EXTENDED UNIQUAC MODEL
This thesis aims to study effect of inorganic salts on liquid-liquid equilibrium
(LLE) of water, 1-butanol and lactic acid, and its application in extraction of the acid
from aqueous solution using 1-butanol. There are three parts of study in this thesis.
The first part is a study of liquid-liquid equilibrium of electrolyte mixture system
containing water, 1-butanol, and different inorganic salt i.e., NaCl, Na2SO4, NH4Cl
and ((NH4)2SO4 at temperatures in range of 303.15 to 323.15 K under atmospheric
pressure. Experimental results showed that solubility between water and 1-butanol
decreased with increasing inorganic salt concentration and the temperature in the
range studied here was found to have a minor effect on this system. Correlation of
experimental data by modified extended UNIQUAC model gave a satisfactory
agreement, with an average absolute root mean square deviation of less than 1%.
The second part studied liquid-liquid equilibrium of water, 1-butanol and
lactic acid system under atmospheric pressure at 303.15 K. Possibility of lactic acid
extraction using 1-butanol was evaluated from distribution coefficient of the acid
between aqueous and organic phases. The results showed that the distribution
coefficient and degree of lactic acid extraction increased with increasing lactic acid
IV
concentration in the starting solution. The correlation of experimental LLE data was
determined by UNIQUAC and NRTL models. It was found that the UNIQUAC
model was more consistent with experimental LLE data, with an average absolute
root mean square deviation less than 0.5%.
In the final part, the inorganic salt-modified LLE behavior of binary water and
1-butanol mixture was applied in the extraction of lactic acid. The results showed that
each salts have a significant effect on the distribution of lactic acid between aqueous
and organic phases. Upon addition of NaCl and NH4Cl, the distribution coefficient
and degree of lactic acid extraction were decreased with increasing salt concentration.
This effect is called salting in. Addition of Na2SO4 and (NH4)2SO4, on the other hand,
led to increasing of the distribution coefficient and degree of lactic acid extraction.
This effect is called salting out. Ability of these salts in increasing the distribution
coefficient of lactic acid can be arranged as Na2SO4 > (NH4)2SO4 > NaCl > NH4Cl.
All results from this thesis lead to the conclusion that the four inorganic salts could
liquid-liquid equilibrium of water, 1-butanol and water, 1-butanol, lactic acid. Na2SO4
and (NH4)2SO4 could increase of efficiency of lactic acid extraction from water using
1-butanol, while NaCl and NH4Cl could decrease the efficiency of this process.
School of Chemical Engineering Student’s Signature
Academic Year 2013 Advisor’s Signature
ACKNOWLEDGEMENTS
I would like to express my sincere thanks and gratitude to Asst. Prof. Dr.
Panarat Rattanaphanee, my graduate advisor for her guidance and support throughout
this work. Her guiding light, motivation, and patience was the most important source
of my accomplishment.
I also would like to thank my thesis committee; Dr Terasut Sookkumnerd,
Prof. Dr. Adrian E. Flood and Asst. Prof. Dr. Atichat Wongkoblap for their valuable
time to serve as my committee member, and for their unconditional help and advice
on the conduction of this work. I would like to thank all of lecturers at School of
Chemical Engineering, Suranaree University of Technology, who led me to the world
of Chemical Engineering.
I am thankful to Mr. Saran Dokmajkun for helping me with the laboratory
facilities and for the valuable recommendations.
Finally, I would also like to express my deep sense of gratitude to my parents
for their support and encouragement me throughout the course of this study at the
Suranaree University of Technology.
Kanungnit Chawong
TABLE OF CONTENTS
Page
ABSTRACT (THAI) .................................................................................................. I
ABSTRACT (ENGLISH) ........................................................................................ III
ACKNOWLEDGEMENTS ...................................................................................... V
TABLE OF CONTENTS ......................................................................................... VI
LIST OF TABLES ................................................................................................. XII
LIST OF FIGURES ................................................................................................ XV
SYMBOLS AND ABBREVIATIONS.................................................................. XIX
CHAPTER
I INTRODUCTION ............................................................................ 1
1.1 Background and Significance of the Problem .......................... 1
1.2 Research Objectives ................................................................ 5
1.3 Scope and Limitation of the Research ..................................... 6
1.4 Outputs of the Research .......................................................... 6
1.5 References .............................................................................. 7
II LIQUID-LIQUID EQUILIBRIUM OF WATER+
1-BUTANOL+INORGANIC SALTS SYSTEM .............................. 9
2.1 Abstract .................................................................................. 9
2.2 Introduction .......................................................................... 10
VII
TABLE OF CONTENTS (Continued)
Page
2.3 Theory .................................................................................. 12
2.3.1 Hofmeister Series ...................................................... 12
2.3.2 Mechanism of Salt Effect .......................................... 13
2.3.2.1 Hydration Theory ........................................... 13
2.3.2.2 Water Dipole Theory ..................................... 14
2.3.2.3 Electrostatic Theory ....................................... 14
2.3.2.4 Van der Waals Forces Theory ........................ 15
2.3.2.5 Internal Pressure Theory ................................ 15
2.3.3 Salting In and Salting Out Effect ............................... 15
2.3.4 Thermodynamic Theoty ............................................ 17
2.3.4.1 Liquid-Liquid Equilibrium ............................. 17
2.3.4.2 Modified Extended UNIQUAC Model ........... 17
2.3.4.3 Estimation of Parameters ............................... 23
2.4 Experimental Procedures....................................................... 25
2.4.1 Chemicals.................................................................. 25
2.4.2 Procedure for Liquid-Liquid Equilibrium
of water and 1-butanol ............................................... 25
2.4.3 Procedure for Solubility of Inorganic Salt
in Water and 1-butanol .............................................. 25
VIII
TABLE OF CONTENTS (Continued)
Page
2.4.4 Procedure for Liquid-Liquid Equilibrium
of Water+1-butanol+Inorganic Salt System ............... 26
2.4.5 Method of Analysis ................................................... 26
2.4.5.1 Gas Chromatography Analysis
of 1-Butanol ................................................... 26
2.4.5.2 Gas Chromatography Analysis of Water ........ 27
2.4.5.3 Drying of Salt ................................................ 27
2.5 Results and Discussion .......................................................... 28
2.5.1 Liquid-Liquid Equilibrium of Binary
System of Water and 1-Butanol ................................. 28
2.5.2 Solubility of Inorganic Salt in
Water and 1-Butanol ................................................. 31
2.5.3 Liquid-Liquid Equilibrium of Water
+1-Butanol+Inorganic Salt System ............................ 37
2.5.3.1 Effect of Inorganic Salt on
Liquid-liquid Equilibrium .............................. 37
2.5.3.2 Correlation Model and Evaluation
Of Parameter .................................................. 49
2.6 Conclusion ............................................................................ 65
2.7 References ............................................................................ 66
IX
TABLE OF CONTENTS (Continued)
Page
III LIQUID-LIQUID EQUILIBRIUM FOR
TERNATY SYSTEM OF WATER+1-BUTANOL
+LACTIC ACID SYSTEM ............................................................ 70
3.1 Abstract ................................................................................ 70
3.2 Introduction .......................................................................... 71
3.3 Theory .................................................................................. 74
3.3.1 Physical Extraction of Carboxylic Acids .................... 74
3.3.2 UNIQUAC Model ..................................................... 75
3.3.2 NRTL Model ............................................................. 77
3.4 Experimental Procedures....................................................... 79
3.4.1 Chemicals.................................................................. 79
3.4.2 Procedure for Liquid-Liquid Equilibrium of
Water+1-Butanol+Lactic Acid Ternary System ......... 79
3.4.3 High Performance Liquid Chromatography
Analysis of Lactic Acid ............................................. 79
3.5 Results and Discussion .......................................................... 80
3.5.1 Experimental LLE Data ............................................. 80
3.5.2 Correlation Model ..................................................... 85
3.6 Conclusion ............................................................................ 90
3.7 References ............................................................................ 91
X
TABLE OF CONTENTS (Continued)
Page
IV EFFECT OF INORGANIC SALT ON EXTRACTION
OF LACTIC ACID WITH 1-BUTANOL ...................................... 94
4.1 Abstract ................................................................................ 94
4.2 Introduction .......................................................................... 95
4.3 Theory .................................................................................. 97
4.4 Experimental Procedures....................................................... 99
4.4.1 Chemicals.................................................................. 99
4.4.2 Extraction of Lactic Acid ........................................... 99
4.4.3 Procedure for Extraction of Lactic Acid..................... 99
4.4.4 Method for Analysis of Salt ....................................... 99
4.5 Results and Discussion ........................................................ 101
4.6 Conclusion .......................................................................... 112
4.7 References .......................................................................... 113
V CONCLUSIONS AND RECOMMENDATIONS ....................... 114
5.1 Conclusions ........................................................................ 114
5.2 Recommendations ............................................................... 115
APPENDICES
APPENDIX A PROPERTIES OF LACTIC ACID,
1-BUTANOL AND INORGANIC SALT ................ 116
XI
TABLE OF CONTENTS (Continued)
Page
APPENDIX B EXAMPLE OF COMPONENT ANALYSIS
OF WATER, 1-BUTANOL, LACTIC ACID
AND INORGANIC SALT ...................................... 121
APPENDIX C LIQUID-LIQUID EQUILIBRIUM BY
UNIQUAC AND MODIFIED EXTENDED
UNIQUAC MODEL ............................................... 132
APPENDIX D LIST OF PUBLICATIONS ..................................... 160
BIOGRAPHY ....................................................................................................... 178
LIST OF TABLES
Table Page
2.1 The volume (r) and surface area (q) parameters
for UNIQUAC model .................................................................................. 23
2.2 Liquid-liquid equilibrium of binary water(1) and
1-butanol (2) system .................................................................................... 29
2.3 Solubility of inorganic salts in water at different temperatures ..................... 32
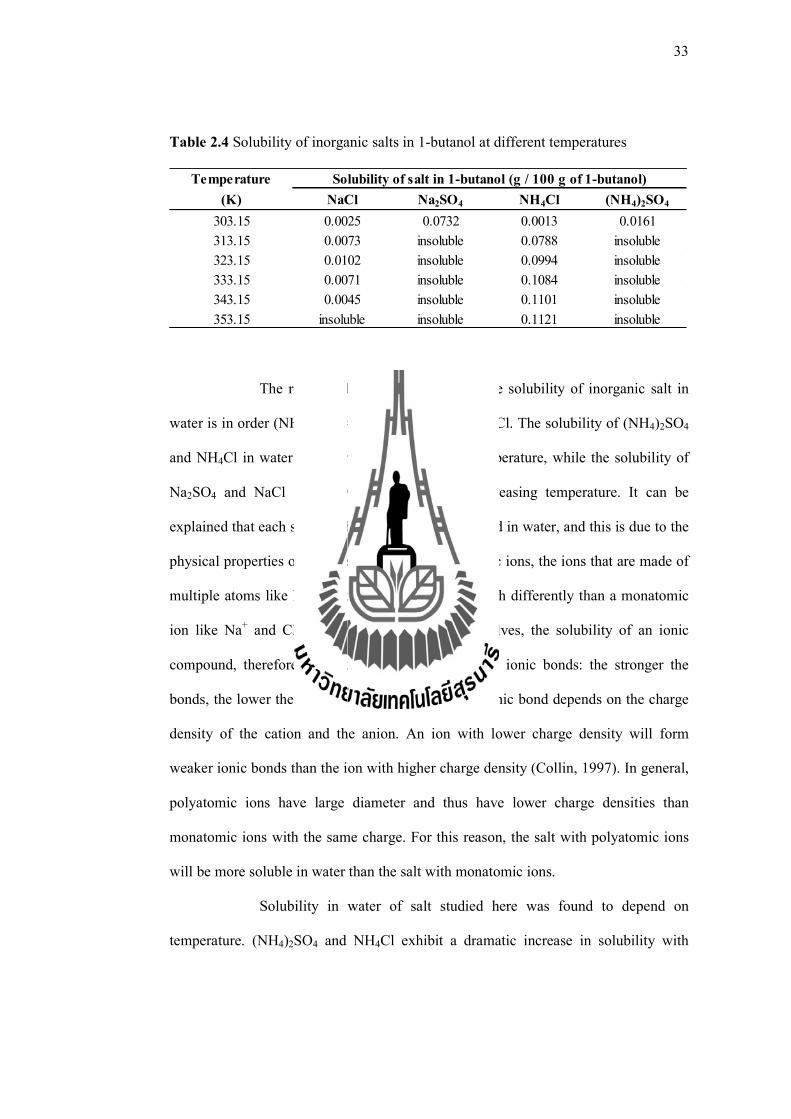
2.4 Solubility of inorganic salts in 1-butanol at different temperatures .............. 33
2.5 Experimental liquid-liquid equilibrium data of water(1)+
1-butanol(2)+NaCl(3) system under atmospheric pressure ........................... 38
2.6 Experimental liquid-liquid equilibrium data of water(1)+
1-butanol(2)+Na2SO4(3) system under atmospheric pressure ....................... 39
2.7 Experimental liquid-liquid equilibrium data of water(1)+
1-butanol(2)+ (NH4)2SO4(3) system under atmospheric pressure .................. 40
2.8 Experimental liquid-liquid equilibrium data of water(1)+
1-butanol(2)+ NH4Cl(3) system under atmospheric pressure ....................... 41
2.9 Experimental liquid-liquid equilibrium data of water(1)+
1-butanol(2)+ NH4Cl(3) system under atmospheric pressure
(Pirahmadi et. al., 2010) ............................................................................... 42
XIII
LIST OF TABLES (Continued)
Table Page
2.10 Binary interaction parameters and absolute deviations in this
work of the modified extended UNIQUAC model ....................................... 62
2.11 Binary interaction parameters and absolute deviations of the
modified extended UNIQUAC model from Pirahmadi et. al. (2010) ............. 63
3.1 Experimental liquid-liquid equilibrium data of water(1)
+1-butanol(2)+lactic acid(3) at 303.15 K under atmospheric pressure ......... 81
3.2 Distribution coefficient, degree of extraction and
separation factor as a function of initial lactic acid
concentration in aqueous phase at 303.15 K ................................................ 83
3.3 The binary interaction parameters and the objective
function for water(1)+1-butanol(2)+lactic acid(3) system
at 303.15 K in this work ............................................................................... 86
3.4 All adjusted of the binary interaction parameters
and the objective function for water(1)+1-butanol(2)+
lactic acid(3) system at 303.15 K in this work ............................................. 86
3.5 The binary interaction parameters and the objective
function for water(1)+1-butanol(2)+lactic acid(3)system
at 303.15 K from NRTL model .................................................................... 87
4.1 Liquid-liquid equilibrium data of water(1) + 1-buttanol(2)
+ lactic acid(3) + inorganic salt(4) system at 303.15 K ............................... 101
XIV
LIST OF TABLES (Continued)
Table Page
4.2 Distribution coefficient and degree of lactic acid extraction with
1-butanol containing inorganic salt in 1 M of lactic acid
aqueous solution at 303.15 K ..................................................................... 108
A.1 Chemical and physical properties of lactic acid ......................................... 118
A.2 Chemical and physical properties of 1-butanol .......................................... 119
A.3 Properties of some ions in aqueous solutions and
thermodynamic quantities of ion hydration at 298.15 K .............................. 120
LIST OF FIGURES
Figure Page
2.1 Mole fraction of 1-butanol in water at different temperature ........................ 30
2.2 Mole fraction of water in 1-butanol at different temperature ........................ 31
2.3 Solubility of inorganic salts in water at different temperatures ..................... 35
2.4 Solubility of inorganic salts in 1-butanol at different temperatures ............... 36
2.5 The relation between the concentration of 1-butanol and
ionic strength in water rich phase at 303.15 K ............................................. 46
2.6 The relation between the concentration of 1-butanol and
ionic strength in water rich phase at 313.15 K ............................................. 47
2.7 The relation between the concentration of 1-butanol and
ionic strength in water rich phase at 323.15 K .............................................. 48
2.8 Experimental (○) and calculated ( ) liquid-liquid equilibrium
tie-lines for water (1) + 1-butanol (2) + Na2SO4 (3) at 303.15 K .................. 50
2.9 Experimental (○) and calculated ( ) liquid-liquid equilibrium
tie-lines for water (1) + 1-butanol (2) + Na2SO4 (3) at 313.15 K .................. 51
2.10 Experimental (○) and calculated ( ) liquid-liquid equilibrium
tie-lines for water (1) + 1-butanol (2) + Na2SO4 (3) at 323.15 K .................. 52
2.11 Experimental (○) and calculated ( ) liquid-liquid equilibrium
tie-lines for water (1) + 1-butanol (2) + (NH4)2SO4 (3) at 303.15 K. ............ 53
XVI
LIST OF FIGURES (Continued)
Figure Page
2.12 Experimental (○) and calculated ( ) liquid-liquid equilibrium
tie-lines for water (1) + 1-butanol (2) + (NH4)2SO4 (3) at 313.15 K. ............ 54
2.13 Experimental (○) and calculated ( ) liquid-liquid equilibrium
tie-lines for water (1) + 1-butanol (2) + (NH4)2SO4 (3) at 323.15 K. ............. 55
2.14 Experimental (○) and calculated ( ) liquid-liquid equilibrium
tie-lines for water (1) + 1-butanol (2) + NaCl (3) at 303.15 K. ...................... 56
2.15 Experimental (○) and calculated ( ) liquid-liquid equilibrium
tie-lines for water (1) + 1-butanol (2) + NaCl (3) at 313.15 K. ...................... 57
2.16 Experimental (○) and calculated ( ) liquid-liquid equilibrium
tie-lines for water (1) + 1-butanol (2) + NaCl (3) at 323.15 K ....................... 58
2.17 Experimental (○) and calculated ( ) liquid-liquid equilibrium
tie-lines for water (1) + 1-butanol (2) + NH4Cl (3) at 303.15 K. ................... 59
2.18 Experimental (○) and calculated ( ) liquid-liquid equilibrium
tie-lines for water (1) + 1-butanol (2) + NH4Cl (3) at 313.15 K. ................... 60
2.19 Experimental (○) and calculated ( ) liquid-liquid equilibrium
tie-lines for water (1) + 1-butanol (2) + NH4Cl (3) at 323.15 K.. .................. 61
3.1 Equilibrium distribution diagram for the system water(1) +
1-butanol(2) + lactic acid(3) at 303.15 K. ..................................................... 84
XVII
LIST OF FIGURES (Continued)
Figure Page
3.2 Experimental (○) and calculated ( ) liquid-liquid equilibrium
Tie-lines for water (1) + 1-butanol (2) + lactic acid(3) at 303.15 K
when the interaction parameters between water-1-butanol were fixed .......... 88
3.3 Experimental (○) and calculated ( ) liquid-liquid equilibrium
tie-lines for water(1) + 1-butanol(2) + lactic acid(3) at 303.15 K
when all interaction parameters were adjusted .............................................. 89
4.1 Experimental ( ) of liquid-liquid equilibrium diagram for water(1)
+ 1-butanol(2) + lactic acid(3) + Na2SO4 system in 1 M
of initial lactic acid aqueous solution at 303.15 K ....................................... 102
4.2 Experimental ( ) of liquid-liquid equilibrium diagram for water(1)
+ 1-butanol(2) + lactic acid(3) + (NH4)2SO4 system in 1 M
of initial lactic acid aqueous solution at 303.15 K ....................................... 103
4.3 Experimental ( ) of liquid-liquid equilibrium diagram for water(1)
+ 1-butanol(2) + lactic acid(3) + NaCl system in 1 M
of initial lactic acid aqueous solution at 303.15 K ....................................... 104
4.4 Experimental ( ) of liquid-liquid equilibrium diagram for water(1)
+ 1-butanol(2) + lactic acid(3) + NH4Cl system in 1 M
of initial lactic acid aqueous solution at 303.15 K ....................................... 105
4.5 Effect of ionic strength on distribution of lactic acid for extraction
with initial acid concentration 1 M. ............................................................ 110
XVIII
LIST OF FIGURES (Continued)
Figure Page
A.1 Molecular structure of lactic acid ............................................................... 117
A.2 Molecular structure of -butanol .................................................................. 118
B.1 Calibration standard curve of water. ........................................................... 122
B.2 Calibration standard curve of lactic acid. .................................................... 123
B.3 Calibration standard curve of 1-butanol.. .................................................... 124
B.4 Water analysis in aqueous phase ................................................................ 125
B.5 Lactic acid analysis in aqueous phase ......................................................... 126
B.6 Water analysis in organic phase ................................................................. 128
B.7 Lactic acid analysis in organic phase .......................................................... 129
C.1 Calulation of binary interaction parameter diagram .................................... 133
SYMBOLS AND ABBREVIATIONS
Ax = Debye-Hückel parameter
A- = dissociated acid
a = binary interaction parameter
b = Debye-Hückel parameter
C = molar concentration (mol/L)
D = dielectric constant
D = distribution coefficient
d = density (kg/m3)
E = efficiency of acid extraction
e = electronic charge (c)
G = dimensionless interaction energy parameter
GE = excess Gibbs energy
g = interaction energy parameter (J/mol)
HA = carboxylic acid
H+ = hydrogen ion
I = ionic strength (mol/L)
Ix = mole fraction ionic strength
KD = dimerization coefficient
KHA = ionization coefficient
k = Boltzmann’s constant (J/K)
XX
SYMBOLS AND ABBREVIATIONS (Continued)
LA = lactic acid
M = molar mass of (kg/mol)
NA = Avogadro’s number (mol-1)
n = number of ions
OF = objective function
q = surface area parameter
R = gas constant (J∙mol-1∙K-1)
r = volume parameter
S = separation factor
T = temperature (K)
u = interaction energy parameter
V = volume (m3)
w = mass fraction
x = mole fraction
z = charge number
Greek Symbols
= closest approach parameter
= UNIQUAC parameter
= surface fraction
= volume fraction
XXI
SYMBOLS AND ABBREVIATIONS (Continued)
= Born radius (m)
ε0 = vacuum permittivity
= activity coefficient for component
= non dimensionless parameter in NRTL equation
= dimensionless interaction parameter
∆w = root mean square absolute deviation
Subscripts
i, j, k, l = component i, j, k, l
s = mixed solvent
w = water
0 = initial
aq = aqueous phase
org = organic phase
Superscripts
PDH = Debye-Hückel equation
UNIQUAC = UNIversal QUAsi Chemical equation
Born = Born equation
NRTL = Non-Random Two-Liquid
Comb = combinatorial part
Res = residual part
XXII
SYMBOLS AND ABBREVIATIONS (Continued)
I = equilibrium aqueous phase
II = equilibrium organic phase
M = number of tie lines
N = number of components
exp = experimental
calc = calculated
* = ion term
∞ = infinite dilution term
CHAPTER 1
INTRODUCTION
1.1 Background and Significance of the Problem
Lactic acid or 2-hydroxypropanoic acid is an organic acid that contains both
hydroxyl and carboxylic groups in its molecule. The acid is commonly used as
biologically produced acidulates and preservatives in food industry. It is also widely
used as a starting material for chemical synthesis due to its optical activity and its
hydroxyl and carboxyl moieties. In addition, the acid has a potential of becoming a
very large volume chemical, produced from renewable resources for use as a
feedstock for biodegradable plastics and other environmental-friendly green
compounds. But until now, the extensive use of lactic acid in chemical industry is
hampered by the high production costs of optically pure lactic acid (Borgardts et al,
1998), which is strictly required in the production of the biodegradable poly (lactic
acid) polymers, especially those to be used in biomedical applications and drug
delivery
The demand for lactic acid is increasing due to the expansion of its application
areas. Fermentation processes for the organic acid production generate multi-
component aqueous solutions with low concentration of the desired acid.
Consequently, separation methods for recovery of lactic acid from aqueous solutions
are receiving increasing attention. Recovery of these acids by purification and
concentration is challenging since the organic acids have a high affinity for water. The
2
classical method for recovery of lactic acid from fermentation broth is based on the
precipitation of lactic acid in form of calcium lactate by adding calcium hydroxide to
the aqueous fermentation broth. The solid is filtered off and treated with sulphuric
acid, which leads to precipitation of calcium sulphate. After filtration to separate the
precipitate, lactic acid is purified using activated carbon, evaporation and
crystallization to yield crystals of the lactic acid. These separation and final
purification stages account for approximately 50% of the production costs (Chaudhuri
and Pyle, 1992). Consequently, they are undesirable and also environmental
unfriendly due to consumption of lime and sulphuric acid and the production of
calcium sulphate sludge as a solid waste in large quantity (Kertes and King, 1986;
Wasewar et al, 2002).
Liquid-liquid extraction is a promising alternative to conventional methods for
the recovery of lactic acid from fermentation broth. The method provides high
selectivity and enhanced product recovery by utilizing a combination of an extractant
(also known as carrier) and diluents. In recent years, liquid-liquid extraction for
recovery lactic acid have been reported by several researchers. Amine extractants
have been extensively studied because of their high efficiency and selectivity. The
extraction mechanism of amine extractants is by competing with water available to
interact with the solute and transfer it into the organic phase. Examples of amine
extractants include tertiary amines, such as tri-n-octylamine (TOA), which forms a
water-insoluble complex with lactic acid and selective extract the acid from the
aqueous to the organic phase (Choudhury and Swaminathan, 1998). It has been
reported that aliphatic amines are capable of extracting organic acids from aqueous
3
solutions (Kertes and King, 1986). The strong interaction between the acid and the
amine creates acid-amine complexes and provides high equilibrium distribution ratios.
High acid-amine affinity also gives higher selectivity for the acid over other non-
acidic components in the fermentation medium. Other extractants that have been
reportedly used include alkyl phosphate esters, such as tributyl phosphate (TBP) and
trioctyl phosphine oxide (TOPO) as well as neutral extractants with oxygen-
containing polar groups such as ketones (e.g. methyl isobutyl ketone), alkyl
sulfoxides, or esters (e.g., tri-n-butyl phosphate and trioctylphosphine oxide) (Labbaci
et al, 2010). In addition, the extractants that is function as the ion exchangers.
Examples are quaternary ammonium salts such as the commercial extractant Aliquat
336 or tri-(C8C10) methylammonium chloride, where chloride anion is replaced by
anion of the acid during the extraction (Kyuchoukov et al, 2004). However, such
extractants usually have problem of physical properties and expensive extractant.
Different diuents were used to modifiy the properties of extractants (viscosity,
specipic gravity and surface tension). In order to overcome problems connected with
low solubility of the complexes formed in the organic phase. The frequently applied
diluents are octanol, decanol, oleyl alcohol, ketone and hexane.
Despite the high distribution coefficient obtained from extraction with
specified solvents, some of the extractants are expensive and might inherit some
toxicity. As a result, recovery of lactic acid by extraction with more economical and
environmental friendly solvents is still needed. Extraction of lactic acid from aqueous
solution using 1-butanol was reported by Chawong and Rattanaphanee (2011). It was
found that using 1-butanol as a single solvent was significantly on extraction
4
efficiency. The distribution coefficient increased considerably with increasing
concentration of lactic acid in aqueous solution. However, disadvantage of lactic acid
extraction with 1-butanol is the fact that this alcohol is partially miscible in water,
which, consequently, leads to incomplete solvent recovery after the operation.
Inorganic salts have been reported to affect the solubility of organic
component in an aqueous-organic solvent mixture. The distribution of the solute
between the two liquid phases mainly depends upon the concentration of salt.
Specifically, adding salt to an aqueous solution of an organic acid can result in either
decrease or increase in solubility of the solute in the solution (Khuntia and Swain,
2006). Several researchers in the past have worked on liquid-liquid extraction system
but few of them have worked on the salt effect on liquid-liquid extraction system. Tan
and Aravinth (1999) studied effects of sodium chloride (NaCl) and potassium chloride
(KCl) on liquid-liquid equilibrium (LLE) of water + acetic acid + 1-butanol system at
different temperatures. NaCl and KCl were experimentally shown to be effective in
modifying the liquid–liquid equilibrium in favour of the solvent extraction of acetic
acid from an aqueous solution with 1-butanol, particularly at high salt concentrations.
Both the salts marginally decreased the concentrations of 1-butanol and acetic acid in
the aqueous phase while significantly increased the concentrations of the same
components in the organic phase as well as in the result of LLE of propionic acid and
organic solvents (isopropyl methyl ketone and isobutyl methyl ketone) containing
with salt (NaCl and KCl) have been investigated by Vakili-Nezhaad et al. (2004). It is
observed that the use of salt has proven to be advantageous, although a relative few
5
significant advances and developments in this field are reported at the experimental
level. Therefore, the application of salt is interested to improve the extraction of acid.
Theoretical knowledge about phase equilibrium of mixed solvent electrolytes
systems is a prerequisite for process design in equilibrium system. An accurate
thermodynamic model is required to calculate the liquid-liquid equilibria and the
distribution of the solute between the liquid phases. Many thermodynamic models are
available that is able to give an accurate description of the distribution of product
between two liquid phases. It knows that presence of an electrolyte in a solvent
mixture can significantly change its equilibrium and salt effect has been
advantageously used in extraction. Hence, the separation by liquid-liquid extraction
becomes increasingly more difficult as the tie lines become parallel to the solvent
axis. By adding a suitable salt the tie lines of a liquid-liquid equilibrium mixture can
be significantly changed. As a result, the several thermodynamic models have been
developed to represent the liquid-liquid equilibrium in mixed solvent electrolyte
systems.
1.2 Research Objectives
The main objectives of this research are as below:
1.2.1 To study LLE of binary water + 1-butanol system and solubility of
inorganic salt in water and in 1-butanol.
1.2.2 To study LLE of ternary water + 1-butanol + salt and LLE of water +
1-butanol + lactic acid system and correlate experimental LLE data with
thermodynamic model.
6
1.2.3 To study effect of inorganic salts on extraction of lactic acid with 1-
butanol.
1.3 Scope and limitation of the research
In this research, liquid-liquid equilibrium of water + 1-butanol and solubility
of inorganic salts in water and in 1-butanol were investigated. The variables to be
studied include equilibrium temperatures range of 303.15-323.15 K and salt types, i.
e, NaCl, Na2SO4, NH4Cl, and (NH4)2SO4. Liquid-liquid equilibrium of water + 1-
butanol + salt system under atmospheric pressure will be studied effect of salts type,
salt concentration and temperatures. The salts type studied in this work are NaCl,
Na2SO4, NH4Cl and (NH4)2SO4 with the concentration range of 0.1 to 3 g. The
temperature studied at 303.15, 313.15 and 323.15 K. The modified extended
UNIQUAC model will be used to correlate the experimental tie lines data and binary
interaction parameters can be evaluated by this model. The liquid-liquid equilibrium
of ternary water + 1-butanol + lactic acid system at 303.15 K under atmospheric
pressure will be studied effect of lactic acid concentration in range of 0.1 to 3 M. The
UNIQUAC model will be used to correlate the experimental tie lines data and binary
interaction parameters can be evaluated by this model. In addition, effect of four
inorganic salt type will be studied on extraction of lactic acid using 1-butanol at
303.15 K under atmospheric pressure. The salt concentration in range of 1 to 3 g will
be studied in this work.
7
1.4 Output of the research
1.4.1 LLE data of water + 1-butanol and solubility data of inorganic salt in
water and in 1-butanol at temperature range of 303.15-323.15 K.
1.4.2 LLE data of water + 1-butanol + inorganic salt system at 303.15,
313.15 and 323.15 K and correlation of experimental tie lines data with modified
extended UNIQUAC model.
1.4.3 LLE data of water + 1-butanol + lactic acid with varies of lactic acid
concentration at 303.15 K and correlation of experimental tie lines data with
UNIQUAC model.
1.4.4 The distribution coefficient and degree of lactic acid extraction with 1-
butanol containing inorganic salt in aqueous solution at 303.15 K.
1.5 References
Borgardts, P., Krischke, W., Trosch, W., and Brunner, H. (1998). Integrated
bioprocess for the simultaneous production of lactic acid and dairy sewage
treatment. Bioprocess Eng. 19: 321-329.
Chaudhuri, J. B., and Pyle, D. L. (1992). Emulsion liquid membrane extraction of
organic acids—I. A theoretical model for lactic acid extraction with emulsion
swelling. Chem. Eng. Sci. 47: 41-48.
Kertes, A. S. and King, C. J. (1986). Extraction chemistry of fermentation product
carboxylic acids. Biotechnology and Bioengineering. 28: 269-282.
Choudhury, B. and Swaminathan, T. (1998). Lactic acid extraction with trioctyl
amine. Biopro. Eng. 19: 317-320.

8
Wasewar, K. L., Bert, A., Heesink, M., Versteeg, G. F., and Pangarkar, V. G. (2002).
Reactive extraction of lactic acid using Alamine 336 in MIBK: Equilibria and
Kinetics. Journal of Biotechnology. 97: 59-68.
Labbaci, A., Kyuchoukov, G., Albet, J., and Molinier, J. (2010). Detailed
investigation of lactic acid extraction with tributylphosphate dissolved in
dodecane. J. Chem. Eng. Data. 55: 228-233.
Kyuchoukov, G., Marinova, M., Albet, A., and Molinier, J. (2004). New method for
the extraction of lactic acid by means of a modified extractant (Aliquat 336).
Ind. Eng. Chem. Res. 43: 1179-1184.
Chawong, K., and Rattanaphanee, P. (2011). n-Butanol as an extractant for lactic acid
recovery. World Acad. Sci. Eng. Tech. 56: 1437-1440.
Khuntia, M. K. and Swain, J. R. (2006). Salt effect on liquid-liquid equilibrium for
ternaty system water+1-propanol+ethyl acetate. Department of Chemical
Engineering National Institute of Technology Rourkela.
Tan, T. C. and Aravinth, S. (1999). Liquid-liquid equilibria of water/acetic acid/1-
butanol system-effect of sodium (potassium) chloride and correlations. J.
Fluid Phase Equilibria. 163: 243-257.
Vakili-Nezhaad, G. R., Mohsen-Nia, M., Taghikhani, V., Behpoor, M., and
Aghahosseini, M. (2004). Salting-Out effect of NaCl and KCl on the ternay
LLE data for the systems of (water+propionic acid+isopropyl methyl ketone)
and of (water+propionic acid+isobuthyl methyl ketone). J. Chem.
Thermodymamics. 36: 341-348.
CHAPTER II
LIQUID-LIQUID EQUILIBRIUM OF WATER +
1-BUTANOL + INORGANIC SALT SYSTEM
2.1 Abstract
Liquid-liquid equilibrium (LLE) of mixed solvent electrolyte systems
containing 1-butanol, water and salt at temperatures of 303.15, 313.15 and 323.15 K
under atmospheric pressure have been studied experimentally and theoretically. The
Effect of different inorganic salts on the LLE data for the ternary systems was also
investigated. The results showed that the inorganic salts studies in this work, i. e.,
Na2SO4, (NH4)2SO4, NaCl and NH4Cl appeared to decrease mutual solubility between
water and 1-butanol and enlarge the area of two-phase region of the phase diagram,
particularly at high salt concentration. The temperature in the range studied here was
found to have a minor effect on the LLE behavior of this system. Experimental LLE
data were correlated by a modified extended UNIQUAC model, which is generally
used to describe phase behavior of water and organic solvent mixtures containing
inorganic salts. The model, which consists of the original UNIQUAC term, the Pizer-
Debye-Hückel term and the Born term, for contribution of the excess Gibbs free
energy, was found to satisfactory agree with the LLE data. The average absolute
deviation between the calculated and measured mass fractions of the mixture
components was less than 0.91%.
10
2.2 Introduction
Modeling of electrolyte systems and more specifically, mixed solvent-
electrolyte systems is important in chemical engineering because this type of mixture
is found in many processes such as extractive crystallization and liquid-liquid
extraction for mixtures containing of salt (Thomsen et al., 2004). The presence of
dissolved salt changes the phase equilibrium behavior of the mixture significantly.
The addition of non-volatile solute to a solvent mixture modifies the interaction
among the various solvent solute molecules resulting in shifting their phase
equilibrium even to the extent of eliminating the solute in liquid-liquid equilibrium.
Salt mainly affects the solubility of organic component in an aqueous-organic solvent
mixture. The distribution of the solute between the two liquid phases mainly depends
upon the concentration of electrolyte. Specifically, adding salt to an aqueous solution
of an organic acid can result in either decrease or increase in solubility of the solute in
the solution (Ghalami-Choobar et al., 2011). If the solute solubility is increased upon
addition of salt, the effect is called “salting in”. On the other hand, if its solubility is
diminished when the salt is added, the effect is called “salting out”. It can be used in
separation process such as extraction to alter the miscibility gabs to change the
distribution coefficient of the solute.
Addition of the salt to an aqueous solution of LLE mixture solvent system
increases its heterogeneity significantly. The area of heterogeneity is more as
compared to no salt condition. Salt mainly affects the solubility of solute and water
and the distribution coefficient of solute. Process selectivity, which is a ratio of
distribution coefficient of solute to that of water, is also changed significantly upon
salt addition. Experimental as well as theoretical knowledge about phase equilibrium
11
of mixed solvent electrolyte systems is a prerequisite for process design in such
systems. Several thermodynamic theories have been developed to represent in LLE of
mixed solvent containing electrolytes systems such as electrolyte NRTL model
(Santos et al., 2001; Vakili-Nezhaad et al., 2004 and Bhupesh et al., 2007) and
extended UNIQUAC model (Thomsen et al., 2004).
Pirahmadi et al. (2010) presented a modified extended UNIQUAC model by
explicitly taking into account the effect of mixed solvent on the liquid-liquid
equilibrium of 1-butanol/water/sodium nitrate system at temperature of 25 and 30°C.
The extended UNIQUAC model has previously been used for correlation of liquid-
liquid equilibrium in aqueous salt systems containing alcohols. In that model the
excess Gibbs energy consists of two terms, the original UNIQUAC term and Debye–
Hückel term which considers the alcohol as a nonelectrolyte solute. In this work, a
modified extended UNIQUAC model is used by taking into account mixed solvent
theories. The model consists of three terms, the original UNIQUAC term, Pitzer–
Debye–Hückel term and Born term. The model has been found to give a satisfactory
description of LLE data obtained in this work.
This Chapter studied salting-out agents from the “Hofmeister series”
(Hofmeister, 1888) for separating 1-butanol from aqueous solution. The LLE behavior
of 1-butanol-water system presence of Na2SO4, (NH4)2SO4, NaCl and NH4Cl are
measured. The LLE behavior is elucidated by correlating experimental data with
modified extended UNIQUAC model.
12
2.3 Theory
2.3.1 Hofmeister Series
The empirical Hofmeister series (Hofmeister, 1888) relates to the
minimal concentrations of various salts required to precipitate a given protein from
aqueous solution. There emerged an ordering of the ions depending on their
effectiveness, measured by concentration required to precipitate the protein. For a
given anions, the series is generally written as (Nostro and Ninham, 2012):
2 2 23 4 2 3 2 4 3 4CO SO S O H PO F Cl Br NO I ClO SCN
A less well developed series exists among cations is shown as following (Pegram and
Record, 2007 and Cacace et al., 1997):
3 4 3 2 2 4 2 3( ) ( ) ( )CH N CH NH K Na Cs Li NH Mg C NH
The effect of addition of salt into solutions of non-electrolytes is very complex, due to
the different types of intermolecular interactions that involve the ions, the solvent, and
the solute molecules. The salt effect theories are generally concerned with salting in
and salting out effect, and is used to indicate the degree of the salt effect. The causes
and effects of polar attraction of a dissolved salt for one component of a water non-
electrolyte solution have been explained by various theories. These theories can be
explained with respect to hydration, water dipole, electrostatic interaction, van der
Waals forces and internal pressure.
13
2.3.2 Mechanisms of the Salt Effect
2.3.2.1 Hydration Theory
This theory, salt ions attract and order surrounding a constant
number of water molecules forming hydration shell, thereby decreasing the activity of
the water. This bound water is then unavailable as solvent for the non-electrolyte. The
number of water molecules so bound by each salt ion is called the hydration number
of the ion. The hydration number is the number of solvating immobilized water
molecules per single ion, depends on the type of hydration. The water molecules
confined in the hydration shell are strongly influenced by ionic field. Generally,
cations have a higher degree of hydration than anions. The cations and anions are
responsible for salting out and salting in, respectively, and that the net salting effect of
an electrolyte depends on the balance of these two opposing forces. The major part of
the hydration theory explains the differences in effects due to solutes and ions by
assuming that each ion orients water molecules in a definite direction, and has no
effect on the solvent properties. Most importantly, the hydration theory is not
explained in the salting in effect.
In the system of liquid-liquid equilibrium containing salt, when
the salt ions are solvated, then water molecule become unavailable for the solutions.
As a result, the solutes are salted out from the aqueous phase. This salt effect can be
used for removing organic compounds from water. On the other hand, when a polar
solvent is added to an aqueous salt solution, it captures the water molecules that were
solvating the ions in a salting in affect. This effect may be used for recovering salt
from concentrated aqueous solutions.
14
2.3.2.2 Water Dipole Theory
This theory considers that the solvent dipole molecules in the
hydration shell around an ion are oriented. Cations attract the partially negative
oxygen atom, whereas anions attract the partially positive hydrogen side. Therefore,
ions play a significant role in enhancing or disfavoring the orientation of the water
molecules toward the non-electrolyte solute, depending on the ionic charge. Thus, if
there is a preferred orientation of water molecules toward a polar solute, then the ions
of one sign should have a tendency to increase its solubility (salting-in), while those
of opposite sign should have a tendency to decrease its solubility (salting-out). It has
been suggested that, if the structure of the electrolyte is such that it affects the field
beyond its hydration shell, then it will affect the water dipoles, which will determine
whether salting out or salting in will occur (Grover and Ryall, 2004).
2.3.2.3 Electrostatic Theory
Electrostatic theory was developed by Debye and McAuley in
1925. This theory considers the difference in work necessary to discharge the ions in
pure solvent from that required in a solution when the salt is dissolved in a solution
containing non-electrolyte, due to a change in the dielectric constant produced by
presence of the polar solute. This theory therefore related both salting in and salting
out to influence of the solute on dielectric constant of the solvent. On that basis, if the
saturated solution of solute has a dielectric constant less than water, the salting out
occurs, and if the saturated solution has a dielectric constant more than water, then
salting in occurs.
15
2.3.2.4 Van der Waals Forces Theory
The basis of this theory is that short-range electrostatic
interactions occur between ions and neutral molecules. They depend on properties
such as polarizability and ionizability of salt, solvent molecules, and non-electrolyte
solute molecules. The concept of van der Waals forces is supported by the fact the
predicted salting in of large ions. In the presence of the large ions having weak
electrostatic fields or in the presence of rather undissociated salt, the highly polar
water molecule may tend to associate much more strongly with each other than with
the solvent forcing the salt into the vicinity of the less polar non-electrolyte molecules
with which the salt is associated.
2.3.2.5 Internal Pressure Theory
According to the internal pressure concept proposed by
Tammann (1926) and applied by McDavit and Long (1952), the concentration in total
solution volume upon the addition of salt to water can be thought of as a compression
of the solvent. This compression makes the introduction of a molecule of
nonelectrolyte more difficult, and this result in salting out. An increase in total
volume upon the addition of a salt would produce the counter effect known as salting
in. McDavit and Long (1952), applied the internal pressure concept of Tammann
(1926) to non-polar and non-electrolytes, calculated the free energy of the transfer of
the latter from pure water to the salt solution.
2.3.3 Salting-In and Salting-Out Effect
Addition of salt to a solvent mixture can significantly change the
interaction between the solvent and solute molecules resulting in shifting of the phase
equilibrium. The salt mainly affects the solubility of organic component in an
16
aqueous-organic solvent mixture. When the ions are solvated, some of the water
becomes unavailable for solute which is then salted out from the aqueous phase. This
can be exploited to remove organic compounds from water. This is known as salting-
out effect which means the solubility of the solutr decreases with increasing salt
concentration in the system. The water molecules which surround the ions are not
available for the solution of non-electrolytes. The reason given for the greater
effectiveness of the smaller ions is that these have a greater charge density for a given
volume of ion and that it is this property which dictates the degree of hydration of the
ion, and hence it is salting-out power. The rule that the salting-out power of an ion
decreases as its size increases are, however, only roughly true and there are
exceptions, particularly in the case of the small cations.
On the other hand, salting in occur when a polar solvent is added to an
aqueous salt solution and is preferentially solvents the water and hence breaks the
hydration cages previously formed around the salt ions. The concept of ion hydration,
used to explain salting out, does not explain why very large ions can enhance the
solubility. This effect may be due in part to the large attractive forces, which will exist
between the non-polar part of these ions and the solute molecules. These ion-solute
interactions would be expected to increase with the size of the ion and would tend to
produce a congregation of non-electrolyte molecules around the ions at the expense of
the water molecules. A large ion with an unsymmetrical charge distribution and a
prominent non-polar region might be expected to show this effect particularly strong,
and such ions do in fact cause salting-in in many cases.
17
2.3.4 Thermodynamics Model
A very important part of the modeling of separation processes is the
modeling of phase equilibrium. The most relevant phase equilibrium for the work in
this thesis is liquid-liquid equilibrium (LLE). This type of equilibrium has in common
that the overall mixture has to split up into two liquid phases to reach a stable state,
called equilibrium. This equilibrium can be represented by thermodynamic equations.
Excellent descriptions on this subject can be found in the books by Smith and Van
Ness (1987) and the book by Prausnitz et al. (1999).
2.3.4.1 Liquid-Liquid Equilibrium
At liquid-liquid equilibrium, the composition of the two phases
(aqueous phase & organic phase) can be determined from the following equations:
( ) ( )i i I i i IIx x (2.1)
1I IIi ix x (2.2)
ix and i are mole fraction and activity coefficient for component i and subscripts I,
II represent the equilibrium aqueous and organic phase. This method of calculation
gives a single tie line.
2.3.4.2 Modified Extended UNIQUAC Model
The modified extended UNIQUAC model (Modified Extended
Universal Quasi-Chemical Model) for the excess Gibbs energy which is used in this
research consists of three contributions; the first contribution is an original
UNIQUAC term as given by Abrams and Prausnitz (1975) accounting for short-range
18
entropic and energetic effects in the mixture. A Pitzer–Debye–Hückel (PDH)
contribution (Pitzer, 1980) is contributed to long-range interaction effects. Finally,
The Born term is added to the model in order to explain energy associated with the
transfer of ionic species from an infinite dilution state in the mixed solvent to an
infinitively dilute aqueous phase (Marcus, 1985). The excess Gibbs free energy is
therefore given as:
, , ,E E UNIQUAC E PDH E BornG G G G
RT RT RT RT (2.3)
The UNIQUAC contribution for excess Gibbs energy is given as follows (Abrams and
Prausnitz, 1975):
, , ,ReE UNIQUAC E Comb E sG G G
RT RT RT (2.4)
The combinatorial and the residual terms are identical to the terms used in the
traditional UNIQUAC equation. The combinatorial, entropic term is
,
ln 5 lnE Comb
j j
j j jj j
j j
Gx q x
RT x
(2.5)
The parameters and are the surface and volume fractions, respectively. They
depend on the volume and surface area parameters ri and qi:
19
i ii
i ii
x r
x r
(2.6)
i ii
i ii
x q
x q
(2.7)
The residual, enthalpic term is
,Re
lnE s
j j k jkj k
Gq x
RT (2.8)
The parameter kj
is defined in terms of the binary energy interaction parameterkla :
exp expkl ll klkl
u u a
RT T
(2.9)
Where kl lka a and
0kk lla a , ukl and ull are characteristic parameters of the
energy of the k–l interactions, and are dependents of temperature. With the residual
term, short-range interactions of a centre molecule with its surrounding next
neighbors are introduced using binary interaction parameters (a). Interaction
parameters describe the sum of interactions between a nearest neighbor and a centre
molecule over the various binary interactions occurring per compound pair. The
interactions between identical and different molecule pairs are described by a number
of binary interaction parameters (Sabine et. al., 1997).
20
By partial molar differentiation of the combinatorial and the residual
UNIQUAC terms, the combinatorial and the residual parts of the rational,
symmetrical activity coefficients are obtained
,
ln 5 ln lnE UNIQUAC
j j
j j j j j k kjj j j k
j j
Gx q x q x
RT x
(2.10)
The PDH excess Gibbs energy is given as
,1/24
- ln(1 )E PDH
x xx
A IGI
RT (2.11)
The mole fraction ionic strength Ix is defined as
21
2x i iI z x (2.12)
Ax is the Debye–Hückel parameter on a mole fraction basis and can be evaluated as
1/2 3/21/2 2
0
21 1000
3 1000 4A s
x
s s
N d eA
M D kT
(2.13)
e is electronic charge, NA is Avogadro’s number, ε0 is the vacuum permittivity and k is
Boltzmann’s constant. Ms, ds and Ds are the molar mass, density and dielectric
constant of mixed solvent, respectively, which are defined as follows:
21
's j j
j
M x M (2.14)
'( / )s
s
j j jj
Md
x M d
(2.15)
's j j
j
D w D (2.16)
where 'jw and '
jx are the salt free mass fraction and mole fraction of solvent j,
respectively. jM ,
jd and jD are the molar mass, density and dielectric constant of
solvent j. The parameter is related to a hard-core collision diameter or the distance
of closest approach of ions in solution. The Born contribution to the excess Gibbs
energy is given as (Marcus, 1985):
2, 2
0 0
1 1
2 4 4
E Borni i
js w i
x zG e
RT kT D D
(2.17)
where wD is dielectric constant of water, and is the Born radius of the ions. Based
on Eq. (2.3), the activity coefficients of ions and solvents can be separated into terms
arising from relevant contributions:
* * * *ln ln ln lnUNIQUAC PDH Borni i i i (2.18)
22
ln ln ln lnUNIQUAC PDH Bornj j j j (2.19)
j and i refer to solvent and ions respectively, and the asterisk shows that activity
coefficients of the ions are defined using asymmetric convention. The activity
coefficient of solvents and the asymmetrical activity coefficient of ions can be derived
by straight-forward differentiation of excess Gibbs function:
3/21/2
1/2
2 4 1ln ln(1 )
1 2
1 3
2 2
j sPDH x x x xj x
x s solventsolvent
s s
s j s j
M MA I A II
I M x
d D
d x D x
(2.20)
22
20
1ln
2 4Born s i i
ji
s j i
D x ze
kT D x
(2.21)
ln 1 ln 5 ln 1
+ 1 ln
j j j jUNIQUACj j
j j j j
k jk
j k kjk k
l lkl
qx x
q
(2.22)
2 1/2 2* 1/2
1/2
2 2ln ln(1 )
1PDH x i x x i
i x
x
A z A I zI
I
(2.23)
22*
0 0
1 1ln
2 4 4Born i
i
s w i
ze
kT D D
(2.24)
23
*ln ln lnUNIQUAC UNIQUAC UNIQUACi i i (2.25)
The infinite dilution terms are obtained by setting xw=1 in Eq. (2.8)
ln ln 1 5 ln 1
+ 1 ln
UNIQUAC i i i w i wi i
w w w i w i
i wi iw
r r rq rqq
r r r q r q
q
(2.26)
The values of volume and surface area parameters (r and q) for lactic acid have been
taken from Paticia et al. (2007), while the values of water, 1-butanol and ions have
been extracted from Mascus (1997) and Pirahmadi et al. (2010 and 2012). In Table
2.1, the value of r and q are given for all components.
Table 2.1 The volume (r) and surface area (q) parameters for UNIQUAC model
2.3.4.3 Estimation of Parameters
From the above description of the modified extended
UNIQUAC model, it can be seen that the parameters in the model are the binary
interaction parameter aij for the interaction between species i and j. The water-1-
butanol, water-ion, 1-butanol-ion and ion-ion interaction parameters have been
correlated using experimental data. Due to the limited experimental data sets in this
Water 1-Butanol NH4+ Na
+Cl
-SO4
2-
r 0.9200 3.9243 0.5570 0.1820 1.0200 2.0920
q 1.4000 3.6600 0.6860 0.3260 1.0250 1.6560
24
research, all adjustable parameters have been determined by minimizing the
differences between the experimental and calculated mass fractions for each of the
components over all tie lines, using following objective function (OF) from Pirahmadi
et al. (2012):
2 2exp exp
1 1
- -M N
calc calcij ij ij ijI IIj i
OF w w w w
(2.27)
The quality of this correlation is measured by the average root mean
square absolute deviation of component mass fraction in both phases:
1/22 2,exp , ,exp ,
1 1
- -% 100
2
M NI I calc II II calcij ij ij ij
j i
w w w ww
MN
(2.28)
where j and i refer to solvent and ions, M and N are the number of tie-lines and the
number of components, wcalc and wexp signify mass fraction calculated by model and
experimental data, I and II represent the equilibrium phase.
In this work, The binary interaction parameter is defined in equation 2.9, and
these parameters were fitted to experimental data. It can be calculated the binary
interaction parameters from the experimental LLE data under atmospheric pressure by
step as follows the diagram in Figure C.1 on Appendix C.

25
2.4 Experimental Procedures
2.4.1 Chemicals
1-Butanol with 99.9% purity was purchased from Acros. Ammonium
sulfate ((NH4)2SO4), sodium sulfate (Na2SO4), ammonium Chloride (NH4Cl) and
sodium chloride (NaCl) were obtain from CARLO ERBA and deionized water was
used in the experiments.
2.4.2 Procedure for Liquid-Liquid Equilibrium of Water and 1-Butanol
Equal volumes (10 ml) of deionized water and 1-butanol were added
into Erlenmeyer flask and shaken with 90 rpm at desired temperature (30-80°C) in
temperature-controlled shaking bath for 12 h and settling for 12 h for a complete
phase separation, the mixture would split into two immiscible phases; the top phase
was the 1-butanol rich phase (organic phase) and bottom phase was the water rich
phase (aqueous phase). Samples of the top and bottom phase were taken for analysis
of 1-butanol and water.
2.4.3 Procedure for Solubility of Inorganic Salt in Water and 1-Butanol
Solid-liquid equilibrium was obtained by using an excess amount of
inorganic salt in 75 ml of the solvents. The solution was mixed in a 125 ml
Erlenmeyer flask and shaken at 90 rpm at the desired temperature (30-80°C) in a
temperature-controlled shaking bath for 24 h. The solution was kept still for 12 h to
allow the undissolved solids to settle down in the lower portion of the solution. After
enough time of solid-liquid mixing and gravitational settling, around 15 ml of clear
solution was quickly taken out to another weighted measuring tube, and the
compositions of saturated solutions were determined using the drying method.
26
2.4.4 Procedure for Liquid-Liquid Equilibrium of Water + 1-Butanol +
Inorganic Salt System
The inorganic salts with quantities between 0.1 to 3 g were added into
10 ml deionized water. Equal volume of 1-butanol was then mixed with the prepared
solution in 125 ml Erlenmeyer flask and shaken at 90 rpm at the desired temperature
(30, 40 and 50°C) in the temperature-controlled shaking bath for 12 h and settling for
12 h. In each system, the mixture would split into two immiscible phases; the top
phase was the organic phase with a small amount of dissolved salt, and the bottom
phase was aqueous phase, which is rich in salt due to the higher solubility of salt in
water than in 1-butanol. Samples of the top and bottom phase were taken for analysis
of all components.
2.4.5 Methods of Analysis
The compositions of the top and bottom phase obtained from the
liquid-liquid extraction are analyzed by the following methods:
2.4.5.1 Gas Chromatography Analysis of 1-Butanol
Concentrations of 1-butanol are analyzed by a Shimadzu Gas
chromatography (GC)-14B equipped with flame ionization detector (FID) using
helium (99.999 % purity) as the carrier gas. A TR-FFAP with 30m 0.53 mm 0.5
m capillary column is used to separate the sample. The samples are diluted with
deionized water before analysis. The oven is operated at variable-programmed
temperature. Initially, the temperature of the oven is held at 50oC for 3 minutes before
increased to 230oC at a rate of 10oC/min and held for 4 minutes. Temperature of
injector and detector are at 250oC.
27
2.4.5.2 Gas Chromatography Analysis of Water
Water contents are analyzed by a Varian Chrompack CP-3380
gas chromatography (GC) equipped with thermal conductivity detector using helium
(99.999 % purity) as the carrier gas at a flow rate 6.5 ml/min. A 2m x 1/8 in. stainless
steel column packed with Chromosorb 102 80/100 is used to separate the components.
The injection temperature is 100oC and the detector temperature is 250oC. All samples
are diluted with absolute ethanol before the analysis and the injection volume is 1 µL.
2.4.5.3 Drying of Salt
The sample of 5 ml was taken into tube for analysis of salt. Salt
contents are analyzed by drying the samples at 120°C for 12 h to completely remove
all the liquid.
28
2.5 Results and Discussion
2.5.1 Liquid-Liquid Equilibrium of Binary System of 1-Butanol and
Water
Equilibrium data of the binary mixtures obtained from LLE
experiments of 1-butanol and water at temperature ranged from 303.15 to 353.15 K
are listed in Table 2.2. Solubility of each component in the binary mixtures is
represented by their mole fraction in the organic and aqueous phases. It can be seen
that water and 1-butanol have some degree of mutual solubility. Each measured
solubility data are very similar to the solubility data from references. It means that,
these results show a good agreement with previous results. Alcohol molecule contains
hydroxyl group (OH) connecting a hydrocarbon chain. The solubility of the alcohol in
water depends on the balance between strength of hydrogen bonds formed between
water and -OH group and the strength of the van der Waals forces between the
hydrocarbon chains of the alcohol. In aqueous phase, 1-butanol molecules also make
hydrogen bonds at the -OH group, 1-butanol has four numbers of carbon atoms in
chain, so the hydrocarbon chain attracts one other by van der Waal’s forces and water
is more stable H-bonding with itself. This is a sufficient force to make 1-butanol less
soluble in water.
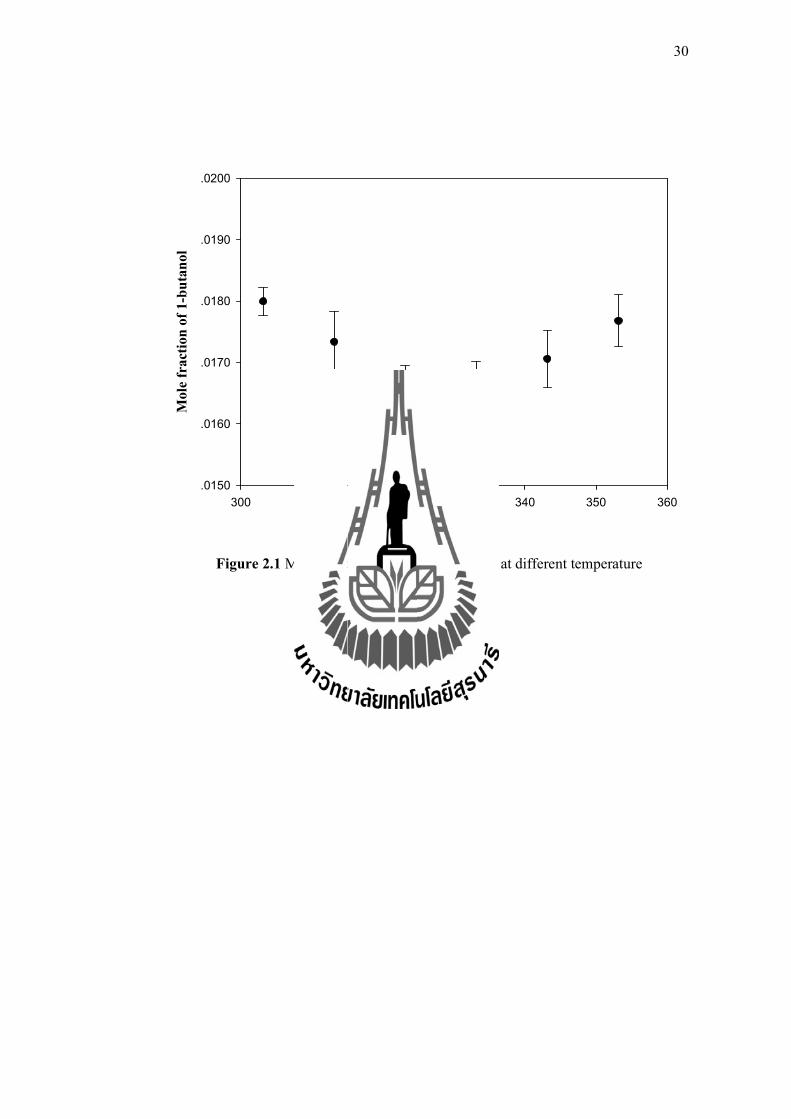
The solubility curve of 1-butanol in water is shown in Figure 2.1. It
can be seen that solubility of 1-butanol decrease with increasing of temperature until
the solubility is the minimum where the temperature increases to 323.15 K. After
that, the solubility is increased when the temperature increases. It should be noted
that, the solubility of 1-butanol in water changes significantly with temperature. This
29
could be due to the balance between strength of hydrogen bonds and strength of the
van der Waals forces.
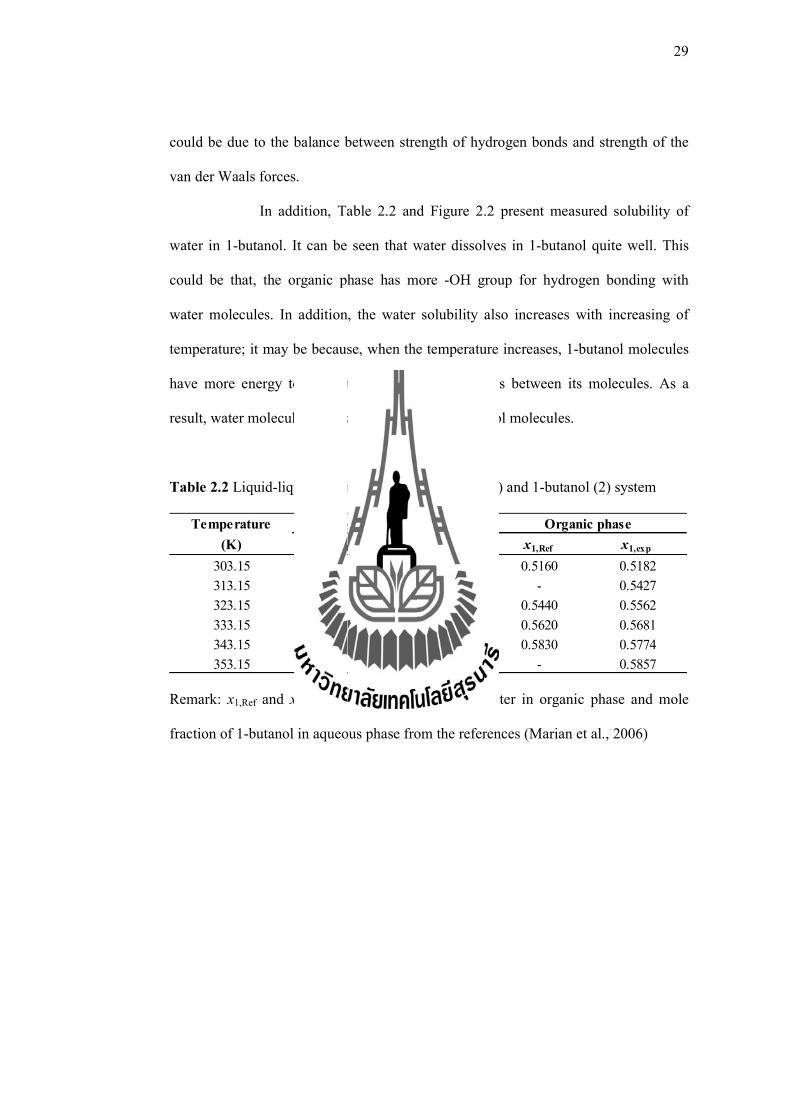
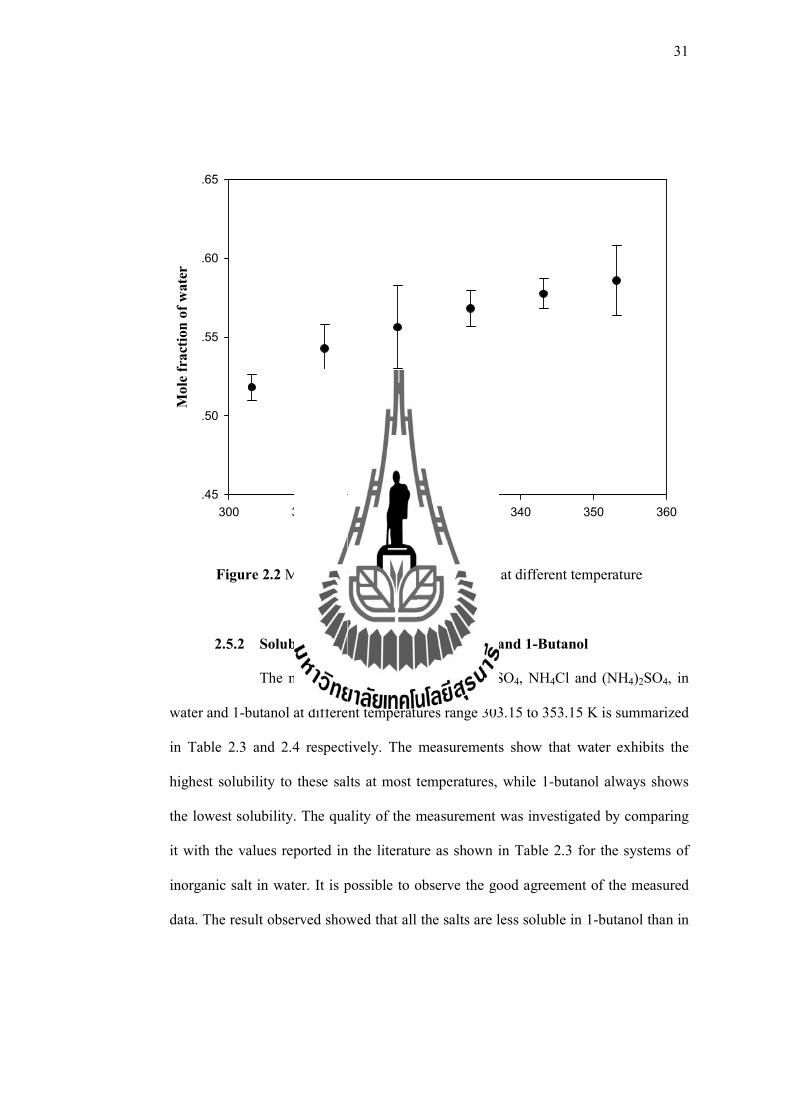
In addition, Table 2.2 and Figure 2.2 present measured solubility of
water in 1-butanol. It can be seen that water dissolves in 1-butanol quite well. This
could be that, the organic phase has more -OH group for hydrogen bonding with
water molecules. In addition, the water solubility also increases with increasing of
temperature; it may be because, when the temperature increases, 1-butanol molecules
have more energy to break the van der Waals forces between its molecules. As a
result, water molecules are likely to bind with 1-butanol molecules.
Table 2.2 Liquid-liquid equilibrium of binary water (1) and 1-butanol (2) system
Remark: x1,Ref and x2,Ref are the mole fraction of water in organic phase and mole
fraction of 1-butanol in aqueous phase from the references (Marian et al., 2006)
Temperature
(K) x2 ,Ref x2,exp x1,Ref x1,exp
303.15 0.0181 0.0180 0.5160 0.5182
313.15 0.0170 0.0173 - 0.5427
323.15 0.0165 0.0167 0.5440 0.5562
333.15 0.0166 0.0165 0.5620 0.5681
343.15 - 0.0171 0.5830 0.5774
353.15 0.0180 0.0177 - 0.5857
Aqueous phase Organic phase
30
Figure 2.1 Mole fraction of 1-butanol in water at different temperature
T (K)
300 310 320 330 340 350 360
Mol
e fr
acti
on o
f 1-
bu
tan
ol
.0150
.0160
.0170
.0180
.0190
.0200
31
Figure 2.2 Mole fraction of water in 1-butanol at different temperature
2.5.2 Solubility of Inorganic Salt in Water and 1-Butanol
The measured solubility of NaCl, Na2SO4, NH4Cl and (NH4)2SO4, in
water and 1-butanol at different temperatures range 303.15 to 353.15 K is summarized
in Table 2.3 and 2.4 respectively. The measurements show that water exhibits the
highest solubility to these salts at most temperatures, while 1-butanol always shows
the lowest solubility. The quality of the measurement was investigated by comparing
it with the values reported in the literature as shown in Table 2.3 for the systems of
inorganic salt in water. It is possible to observe the good agreement of the measured
data. The result observed showed that all the salts are less soluble in 1-butanol than in
T (K)
300 310 320 330 340 350 360
Mo
le f
ract
ion
of
wat
er
.45
.50
.55
.60
.65
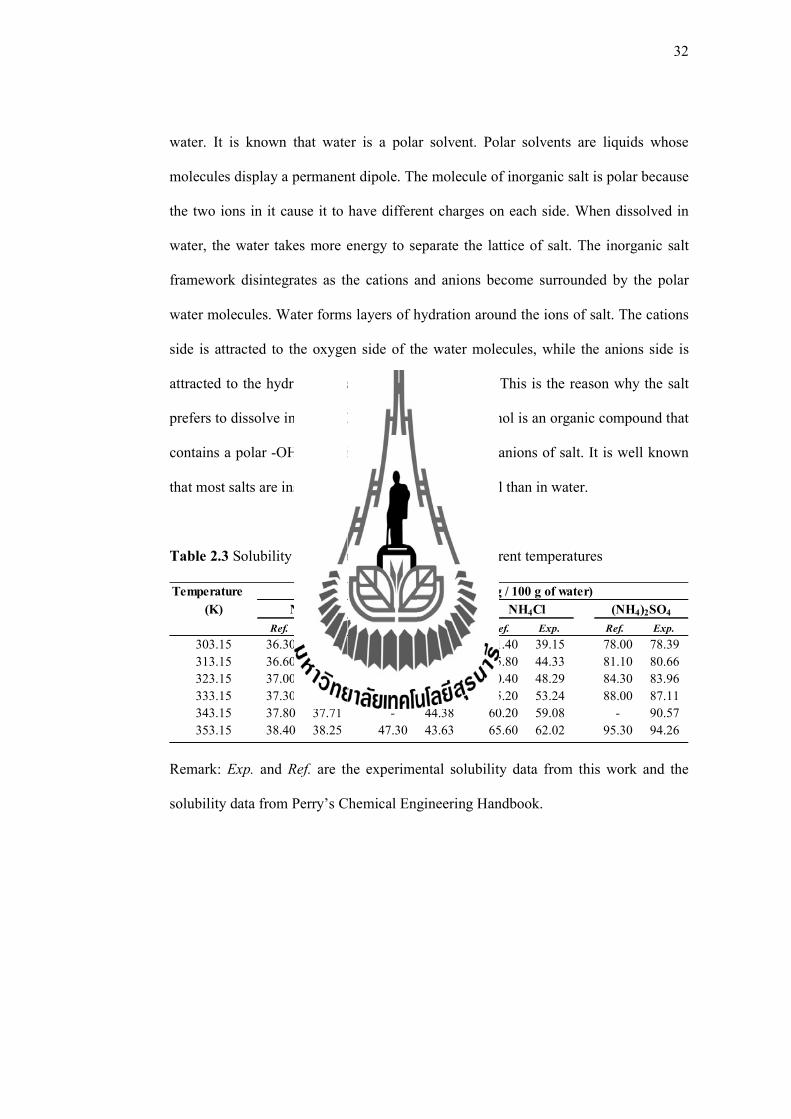
32
water. It is known that water is a polar solvent. Polar solvents are liquids whose
molecules display a permanent dipole. The molecule of inorganic salt is polar because
the two ions in it cause it to have different charges on each side. When dissolved in
water, the water takes more energy to separate the lattice of salt. The inorganic salt
framework disintegrates as the cations and anions become surrounded by the polar
water molecules. Water forms layers of hydration around the ions of salt. The cations
side is attracted to the oxygen side of the water molecules, while the anions side is
attracted to the hydrogen side of the water molecule. This is the reason why the salt
prefers to dissolve in water. On the other hand, 1-butanol is an organic compound that
contains a polar -OH group; it is maybe attracted the anions of salt. It is well known
that most salts are insoluble or less soluble in 1-butanol than in water.
Table 2.3 Solubility of inorganic salts in water at different temperatures
Remark: Exp. and Ref. are the experimental solubility data from this work and the
solubility data from Perry’s Chemical Engineering Handbook.
Temperature
(K)
Ref. Exp. Ref. Exp. Ref. Exp. Ref. Exp.
303.15 36.30 36.05 40.80 39.62 41.40 39.15 78.00 78.39
313.15 36.60 36.54 48.80 48.71 45.80 44.33 81.10 80.66
323.15 37.00 36.82 46.70 46.65 50.40 48.29 84.30 83.96
333.15 37.30 37.43 45.30 45.31 55.20 53.24 88.00 87.11
343.15 37.80 37.71 - 44.38 60.20 59.08 - 90.57
353.15 38.40 38.25 47.30 43.63 65.60 62.02 95.30 94.26
Solubility of salt in water (g / 100 g of water)
NaCl Na2SO4 NH4Cl (NH4)2SO4
33
Table 2.4 Solubility of inorganic salts in 1-butanol at different temperatures
The result in Figure 2.3 shows that the solubility of inorganic salt in
water is in order (NH4)2SO4 > NH4Cl > Na2SO4 > NaCl. The solubility of (NH4)2SO4
and NH4Cl in water considerably increases with temperature, while the solubility of
Na2SO4 and NaCl is nearly constant with the increasing temperature. It can be
explained that each salt acts differently when dissolved in water, and this is due to the
physical properties of the ions in each salt. Polyatomic ions, the ions that are made of
multiple atoms like NH4+ and SO4
2- ion, will act much differently than a monatomic
ion like Na+ and Cl- ion. When a salt crystal dissolves, the solubility of an ionic
compound, therefore, depends on the strength of its ionic bonds: the stronger the
bonds, the lower the solubility. The strength of the ionic bond depends on the charge
density of the cation and the anion. An ion with lower charge density will form
weaker ionic bonds than the ion with higher charge density (Collin, 1997). In general,
polyatomic ions have large diameter and thus have lower charge densities than
monatomic ions with the same charge. For this reason, the salt with polyatomic ions
will be more soluble in water than the salt with monatomic ions.
Solubility in water of salt studied here was found to depend on
temperature. (NH4)2SO4 and NH4Cl exhibit a dramatic increase in solubility with
Temperature
(K) NaCl Na2SO4 NH4Cl (NH4)2SO4
303.15 0.0025 0.0732 0.0013 0.0161
313.15 0.0073 insoluble 0.0788 insoluble
323.15 0.0102 insoluble 0.0994 insoluble
333.15 0.0071 insoluble 0.1084 insoluble
343.15 0.0045 insoluble 0.1101 insoluble
353.15 insoluble insoluble 0.1121 insoluble
Solubility of salt in 1-butanol (g / 100 g of 1-butanol)

34
increasing of temperature. On the other hand, Na2SO4 and NaCl exhibit little
variation. Generally, the solubility of salt in water increases with increasing of
temperature. It is because, when the temperature increases, the water molecules have
more energy to move around and break the chemical bonds of salt. The salt molecule
is easier to split for attracted with the oppositely charged end of the dipole in the
water molecule. However, there is no simple relationship between the structure of
substance and temperature dependence of its solubility. There is generally no good
way to predict how the solubility will vary with temperature.
The solubility of inorganic salts in 1-butanol is shown in Figure 2.4.
The result showed that the chloride salts can soluble in 1-butanol, while the sulfate
salts are insoluble. It should be noted that 1-butanol contains OH group, which can
attracted the salt ion. However, oxygen atom is slightly negative because the eletron
closer to it. Thus, there will be one side that is capable of binding with the salt ions. It
is likely that the solubility of salt in 1-butanol most likely occurs significantly with
ion dipole interaction between positive pole of 1-butanol and anion of salt. In
addition, it is known that the salt with the polyatomic ions will be better soluble in
solvent than that the monoatomic ions. This reason is clearly why NH4Cl can soluble
in 1-butanol more than NaCl.
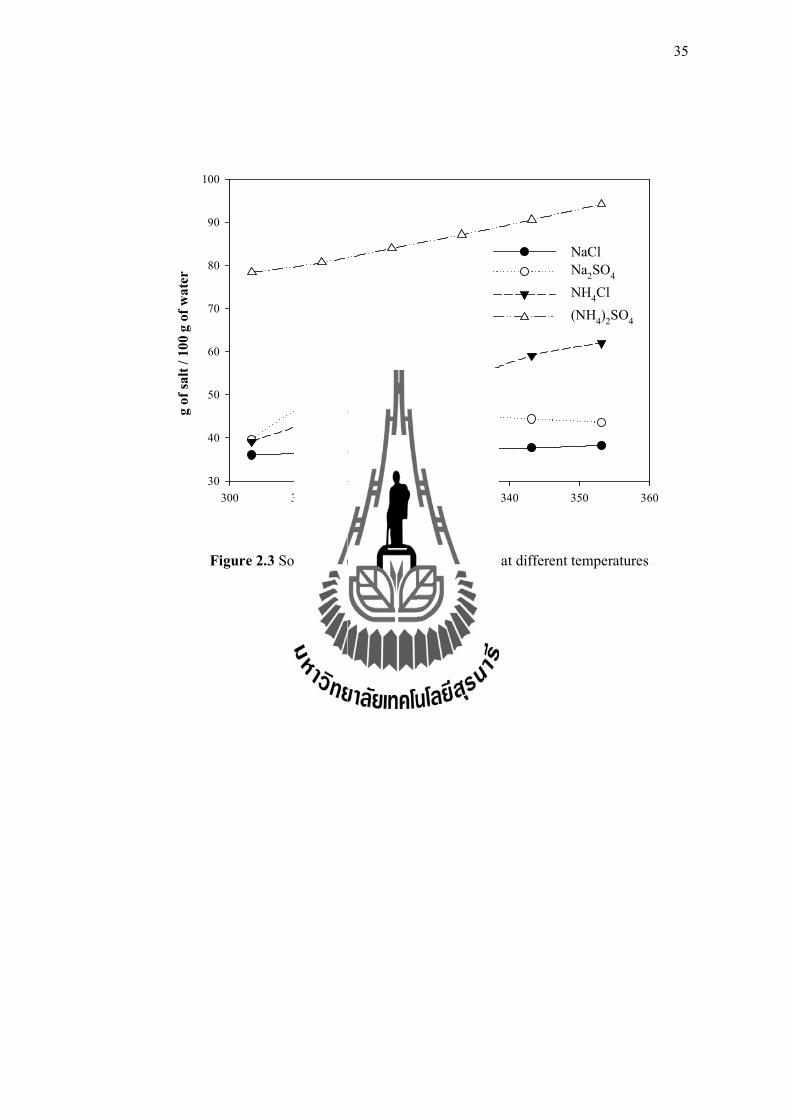
35
Figure 2.3 Solubility of inorganic salts in water at different temperatures
T (K)
300 310 320 330 340 350 360
g o
f sa
lt /
10
0 g
of
wa
ter
30
40
50
60
70
80
90
100
NaCl
Na2SO
4
NH4Cl
(NH4)
2SO
4
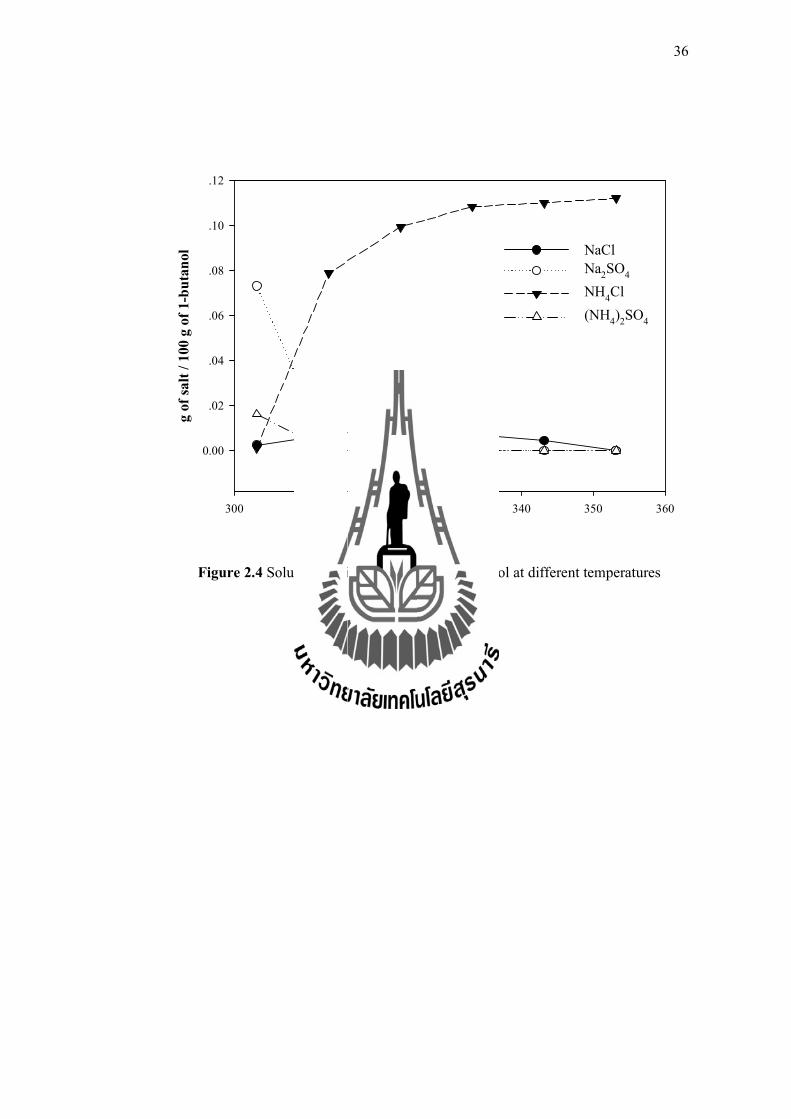
36
Figure 2.4 Solubility of inorganic salts in 1-butanol at different temperatures
T (K)
300 310 320 330 340 350 360
g o
f sa
lt /
100
g o
f 1-
bu
tan
ol
0.00
.02
.04
.06
.08
.10
.12
NaCl
Na2SO
4
NH4Cl
(NH4)2SO4
37
2.5.3 Liquid-liquid Equilibrium of Water + 1-Butanol + Salt System
2.5.3.1 Effect of Inorganic Salt on Liquid-Liquid Equilibrium
Experiments are conducted on the system of water + 1-butanol
+ inorganic salt with varying salt concentrations and varying temperatures. Four types
of inorganic salts: NaCl, Na2SO4, NH4Cl and (NH4)2SO4 were investigated under the
system temperatures of 303.15, 313.15 and 323.15 K. The measured LLE data of the
system with; NaCl, Na2SO4, NH4Cl and (NH4)2SO4 are presented in Table 2.5-2.8 and
are also depicted by the ternary diagrams in Figure 2.8-2.19, respectively. The
composition are presented in terms of mass percents (%wi) and mass fraction (wi).
It was found that, water and 1-butanol are partially miscible
and the salt more soluble in water than 1-butanol, which is consistent with the results
from 2.5.1 and 2.5.2. However, the presence of the salt decreases the concentration of
1-butanol in aqueous phase, especially at higher salt concentration. It means that, the
presence of salt decreases the mutual solubility of the system and increasing the
heterogeneous zone. Heterogeneous area is an important characteristic. It is evident
from the Figure 2.8-2.19 that the area of heterogeneity for all systems with salts are
larger than that the systems of without salts and this effect is observed higher in the
higher concentration of salts. In addition, similar LLE behaviors are observed at all
the temperature studied here. It can be observed that the temperature has a minor
effect of LLE conditions which cause of the measured data were obtained over a
relatively small temperature interval.
In addition, it was found that the mass percents of salt in the
system of Na2SO4, (NH4)2SO4 and NaCl are quite a small value while in the system of
NH4Cl is quite high. It can be observed that these results depend on the solubility of
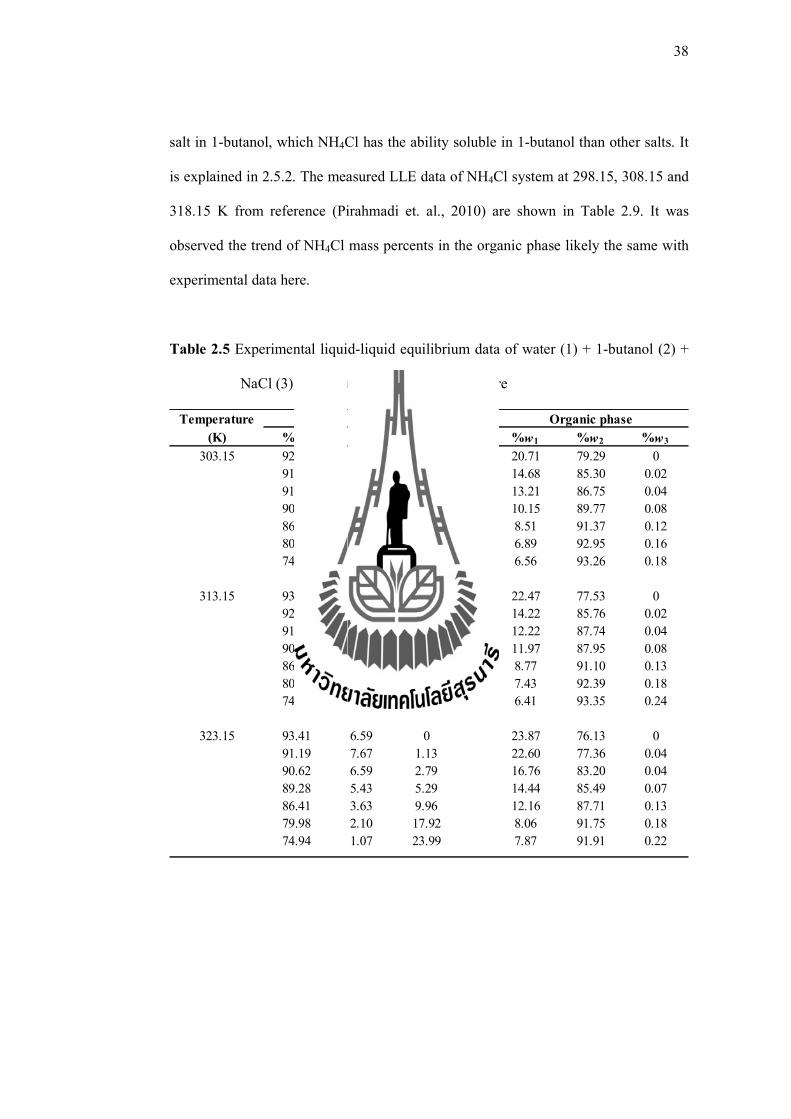
38
salt in 1-butanol, which NH4Cl has the ability soluble in 1-butanol than other salts. It
is explained in 2.5.2. The measured LLE data of NH4Cl system at 298.15, 308.15 and
318.15 K from reference (Pirahmadi et. al., 2010) are shown in Table 2.9. It was
observed the trend of NH4Cl mass percents in the organic phase likely the same with
experimental data here.
Table 2.5 Experimental liquid-liquid equilibrium data of water (1) + 1-butanol (2) +
NaCl (3) system under atmospheric pressure
Temperature
(K) %w1 %w2 %w3 %w1 %w2 %w3
303.15 92.98 7.02 0 20.71 79.29 0
91.84 7.12 1.04 14.68 85.30 0.02
91.11 6.18 2.71 13.21 86.75 0.04
90.00 4.80 5.20 10.15 89.77 0.08
86.93 3.20 9.87 8.51 91.37 0.12
80.58 1.69 17.73 6.89 92.95 0.16
74.59 1.13 24.28 6.56 93.26 0.18
313.15 93.23 6.77 0 22.47 77.53 0
92.41 6.46 1.13 14.22 85.76 0.02
91.48 5.76 2.75 12.22 87.74 0.04
90.04 4.62 5.34 11.97 87.95 0.08
86.60 3.42 9.98 8.77 91.10 0.13
80.10 1.93 17.97 7.43 92.39 0.18
74.30 1.15 24.55 6.41 93.35 0.24
323.15 93.41 6.59 0 23.87 76.13 0
91.19 7.67 1.13 22.60 77.36 0.04
90.62 6.59 2.79 16.76 83.20 0.04
89.28 5.43 5.29 14.44 85.49 0.07
86.41 3.63 9.96 12.16 87.71 0.13
79.98 2.10 17.92 8.06 91.75 0.18
74.94 1.07 23.99 7.87 91.91 0.22
Aqueous phase Organic phase

39
Table 2.6 Experimental liquid-liquid equilibrium data of water (1) + 1-butanol (2) +
Na2SO4 (3) system under atmospheric pressure
Temperature
(K) %w1 %w2 %w3 %w1 %w2 %w3
303.15 92.98 7.02 0 20.71 79.29 0
92.44 6.38 1.18 12.82 87.17 0.01
91.93 5.23 2.84 10.09 89.90 0.01
90.81 3.96 5.24 9.89 90.03 0.08
87.26 2.29 10.45 8.67 91.27 0.06
80.83 0.82 18.36 8.23 91.76 0.02
93.47 6.53 25.21 6.45 93.53 0.01
313.15 93.23 6.77 0 22.47 77.53 0
92.66 6.14 1.20 16.71 83.28 0.01
92.09 4.94 2.97 13.44 86.54 0.03
91.11 3.41 5.48 10.65 89.33 0.01
87.42 2.11 10.47 9.97 90.01 0.02
81.20 0.78 18.02 8.47 91.51 0.02
75.59 0.28 24.13 7.26 92.71 0.03
323.15 93.47 6.53 0 23.87 76.13 0
92.85 5.96 1.19 15.16 84.80 0.04
91.52 5.55 2.93 14.14 85.85 0.02
90.48 3.81 5.71 12.00 88.00 0.01
87.02 2.45 10.53 9.72 90.27 0.01
80.83 0.93 18.24 8.95 91.04 0.01
73.64 0.35 26.01 7.86 92.01 0.12
Aqueous phase Organic phase
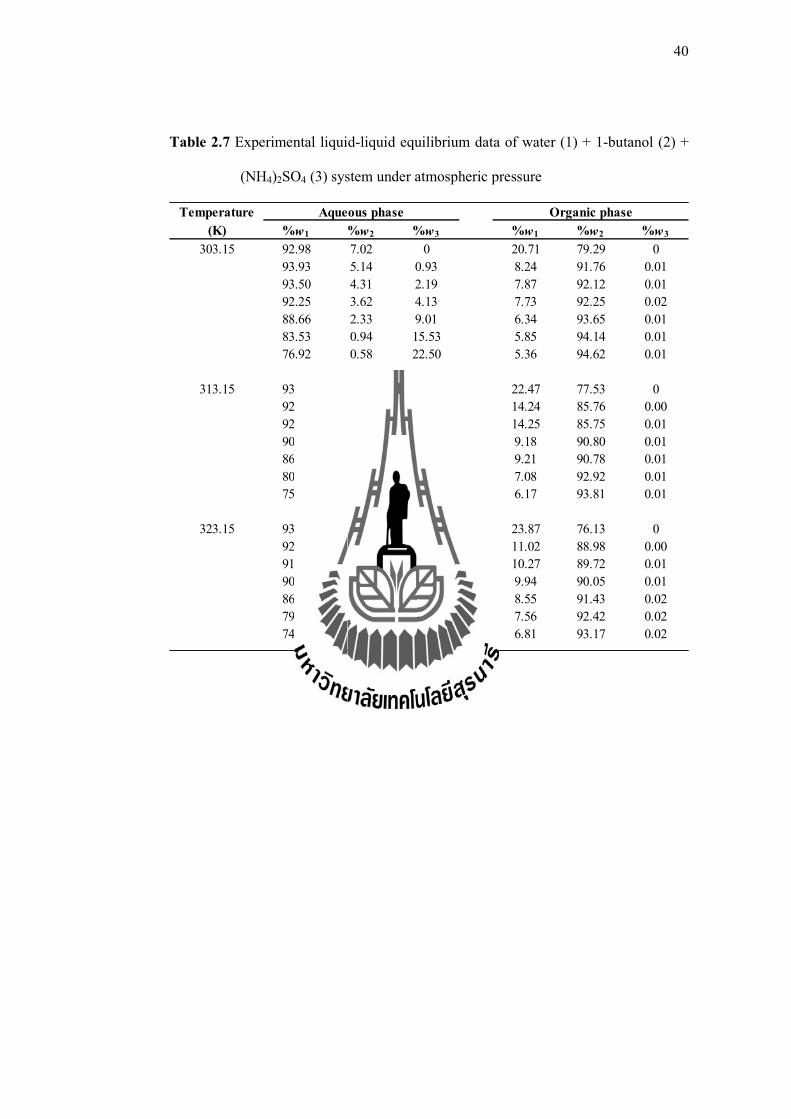
40
Table 2.7 Experimental liquid-liquid equilibrium data of water (1) + 1-butanol (2) +
(NH4)2SO4 (3) system under atmospheric pressure
Temperature
(K) %w1 %w2 %w3 %w1 %w2 %w3
303.15 92.98 7.02 0 20.71 79.29 0
93.93 5.14 0.93 8.24 91.76 0.01
93.50 4.31 2.19 7.87 92.12 0.01
92.25 3.62 4.13 7.73 92.25 0.02
88.66 2.33 9.01 6.34 93.65 0.01
83.53 0.94 15.53 5.85 94.14 0.01
76.92 0.58 22.50 5.36 94.62 0.01
313.15 93.23 6.77 0 22.47 77.53 0
92.41 6.35 1.24 14.24 85.76 0.00
92.19 5.02 2.79 14.25 85.75 0.01
90.09 3.96 5.94 9.18 90.80 0.01
86.14 2.76 11.10 9.21 90.78 0.01
80.22 1.17 18.61 7.08 92.92 0.01
75.55 0.87 23.58 6.17 93.81 0.01
323.15 93.47 6.53 0 23.87 76.13 0
92.14 6.65 1.21 11.02 88.98 0.00
91.39 5.57 3.04 10.27 89.72 0.01
90.19 4.23 5.58 9.94 90.05 0.01
86.53 2.78 10.70 8.55 91.43 0.02
79.96 1.24 18.80 7.56 92.42 0.02
74.49 0.35 25.16 6.81 93.17 0.02
Aqueous phase Organic phase

41
Table 2.8 Experimental liquid-liquid equilibrium data of water (1) + 1-butanol (2) +
NH4Cl (3) system under atmospheric pressure
Temperature
(K) %w1 %w2 %w3 %w1 %w2 %w3
303.15 92.98 7.02 0 20.71 79.29 0
92.21 6.69 1.10 15.20 84.75 0.05
90.68 6.42 2.90 12.71 87.21 0.07
89.10 5.63 5.27 11.11 88.72 0.17
87.24 4.35 8.40 9.87 89.78 0.35
82.29 2.68 15.03 7.72 91.74 0.54
73.77 2.53 23.70 6.47 92.80 0.73
313.15 93.23 6.77 0 22.47 77.53 0
91.88 7.01 1.11 15.30 84.66 0.04
91.01 6.31 2.69 12.69 87.21 0.10
89.35 5.47 5.19 11.61 88.19 0.20
86.25 4.09 9.67 9.29 90.36 0.35
79.63 3.04 17.33 8.28 91.13 0.59
73.46 2.71 23.83 7.02 92.17 0.80
323.15 93.47 6.53 0 23.87 76.13 0
90.93 8.15 0.92 11.55 88.43 0.019
89.71 7.86 2.43 9.57 90.41 0.022
87.90 7.25 4.85 9.03 90.90 0.069
84.56 6.10 9.33 8.16 91.60 0.234
78.48 4.60 16.91 5.93 93.59 0.472
72.51 3.80 23.69 5.25 94.05 0.701
Aqueous phase Organic phase
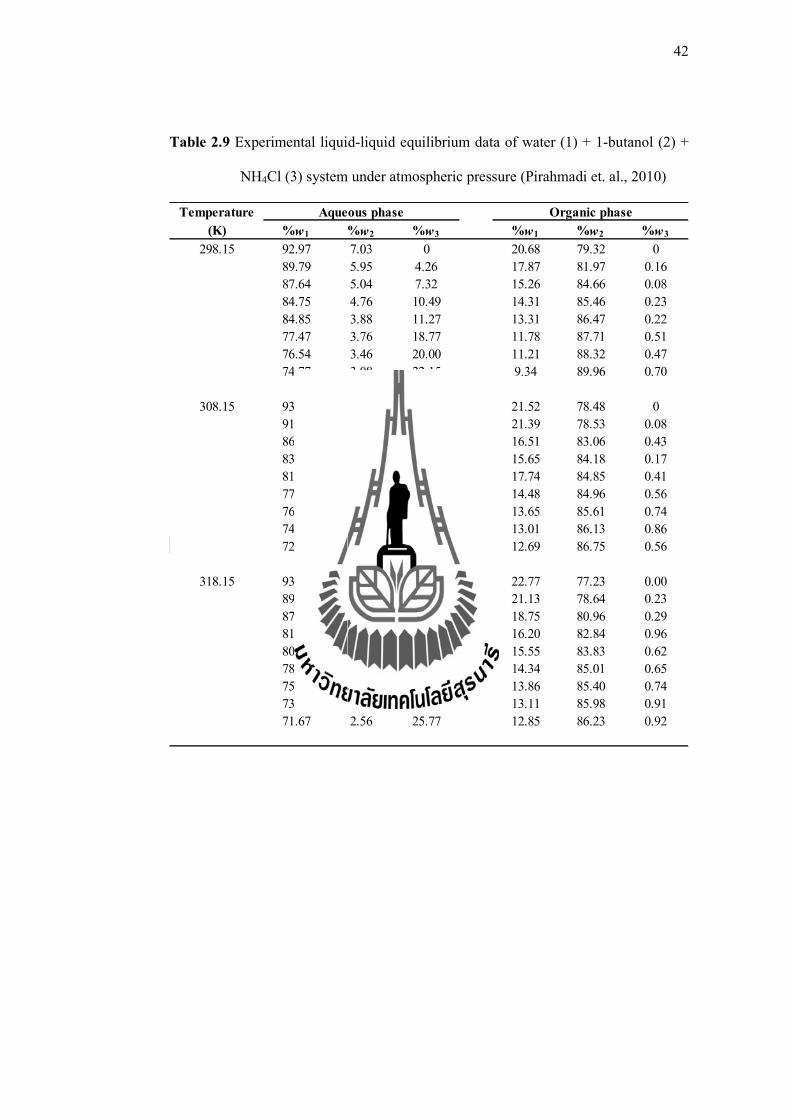
42
Table 2.9 Experimental liquid-liquid equilibrium data of water (1) + 1-butanol (2) +
NH4Cl (3) system under atmospheric pressure (Pirahmadi et. al., 2010)
Temperature
(K) %w1 %w2 %w3 %w1 %w2 %w3
298.15 92.97 7.03 0 20.68 79.32 0
89.79 5.95 4.26 17.87 81.97 0.16
87.64 5.04 7.32 15.26 84.66 0.08
84.75 4.76 10.49 14.31 85.46 0.23
84.85 3.88 11.27 13.31 86.47 0.22
77.47 3.76 18.77 11.78 87.71 0.51
76.54 3.46 20.00 11.21 88.32 0.47
74.77 3.08 22.15 9.34 89.96 0.70
308.15 93.97 6.30 0 21.52 78.48 0
91.47 5.18 3.35 21.39 78.53 0.08
86.37 4.52 9.11 16.51 83.06 0.43
83.88 3.98 12.14 15.65 84.18 0.17
81.05 3.64 15.31 17.74 84.85 0.41
77.20 3.56 19.24 14.48 84.96 0.56
76.21 3.35 20.44 13.65 85.61 0.74
74.19 3.20 22.60 13.01 86.13 0.86
72.54 3.01 24.45 12.69 86.75 0.56
318.15 93.95 6.05 0 22.77 77.23 0.00
89.51 5.13 5.36 21.13 78.64 0.23
87.18 4.92 7.90 18.75 80.96 0.29
81.47 4.35 14.18 16.20 82.84 0.96
80.91 3.77 15.32 15.55 83.83 0.62
78.46 3.44 18.1 14.34 85.01 0.65
75.84 3.03 21.13 13.86 85.40 0.74
73.12 2.95 23.93 13.11 85.98 0.91
71.67 2.56 25.77 12.85 86.23 0.92
Aqueous phase Organic phase
43
It is known that the presence of salt can significantly change
the equilibrium composition. When the ions are solvated, each salt ion attracts and
order surrounding water molecules forming hydration shells. The water dipole
molecules in the hydration shell around an ion are oriented; cations attract the
partially negative oxygen atom, whereas anions attract the partially positive hydrogen
side, thereby decreasing the activity of the water. The effect is called “salting-out”.
This effect can be used for removing organic compounds from water. It means that
the solubility of organic compounds is decreased when the salt is added. On the other
hand, if organic compounds solubility is increased upon addition of salt, the effect is
called “salting-in”.
Salting-in and salting-out effect of each salt are more apparent
when the mass percent of 1-butanol in aqueous phase is plotted against the ionic
strength of the aqueous solution in each system. Ionic strength (I) is a measure of the
concentration of ions in the solution and can be calculated from
1 22 1
nI C Zi ii
(1)
where Ci is molar concentration of the ith ion, Zi is the charge of the ion and n is the
number of ions presented in the solution. The plots, depicted in Figure 2.5-2.7 for the
system at 303.15, 313.15 and 323.15 K, respectively, that all the salts pose similar
effect on solubility of 1-butanol in aqueous phase as the concentration of 1-butanol in
this phase decreases with ionic strength of aqueous solution. It can be note that, at
increasing salt concentrations more 1-butanol is less soluble in aqueous phase. This is
44
referred to as salting-out effect. Presence of salts, mainly increase the concentrations
of 1-butanol in the organic phase and hence enlargement of the two-phase region
occurred. These effects increase with salt concentrations. The influence of salts in this
study on the salting-out effect in the following order:
2 4 4 2 4 4( )Na SO NH SO NaCl NH Cl
The greatest salting-out effect salts are obviously related to the properties of ions. It
can be seen that the rank of effectiveness of anions in salting-out of 1-butanol from
aqueous solution is SO42- > Cl-, and rank order of cations is Na+ > NH4
+. The salts
with divalent anion (SO42-) show stronger influence on partitioning 1-butanol from
aqueous solution than the salts with monovalent anion (Cl-). When the salt is added
into water and 1-butanol mixture, the water molecules surrounding the ions are
unavailable, so that 1-butanol is less soluble and enriched to the organic phase. This
salting out effect may be significantly affected by hydration radii and hydration
number of ions added. In general, divalent ions are more effective at salting-out than
monovalent ions, and ions with small radii more effective than large ions (Collins and
Washabaugh, 1985). It has been observed that SO42- has larger radii than Cl-.
However, SO42- has a higher hydration number (see Table A.3 on Appendix 3) to hold
their hydration shells more strongly, whereas the Cl- has a lower hydration number
and weaker hydration shells (Tansel et al., 2006). For cations, both ions are
monovalent cations, which is the Na+ has smaller radii and higher hydration number
than NH4+. It is clearly for cations effect on salting-out.
45
In addition, it was observed that the salting-in effect in the
system with NaCl and NH4Cl at 313.15 and 323.15 K in Figure 2.6 and 2.7 where the
mass percent of 1-butanol increased with the ionic strength. However, these systems
induces a salting-in effect with a magnitude dependent on the salt concentration.
When small amounts of NaCl and NH4Cl was added, mass percent of 1-butanol in
aqueous phase were increased, which signified that 1-butanol preferred to be in
aqueous phase rather than the organic phase. Then, the decreasing mass percent of 1-
butanol is, the higher concentration of NaCl and NH4Cl. The reason why salting-in is
found in the system with chloride salts, while sulfate salts present only salting-out; it
may be because, the chloride ion is monovalent anion and small hydration number.
When small amounts of chloride salt dissolved in water, less the ionic charge attracted
to the water molecule. Therefore, this result verifies the “salting-out” effect in the
present system by adding suitable amount of NaCl and NH4Cl.
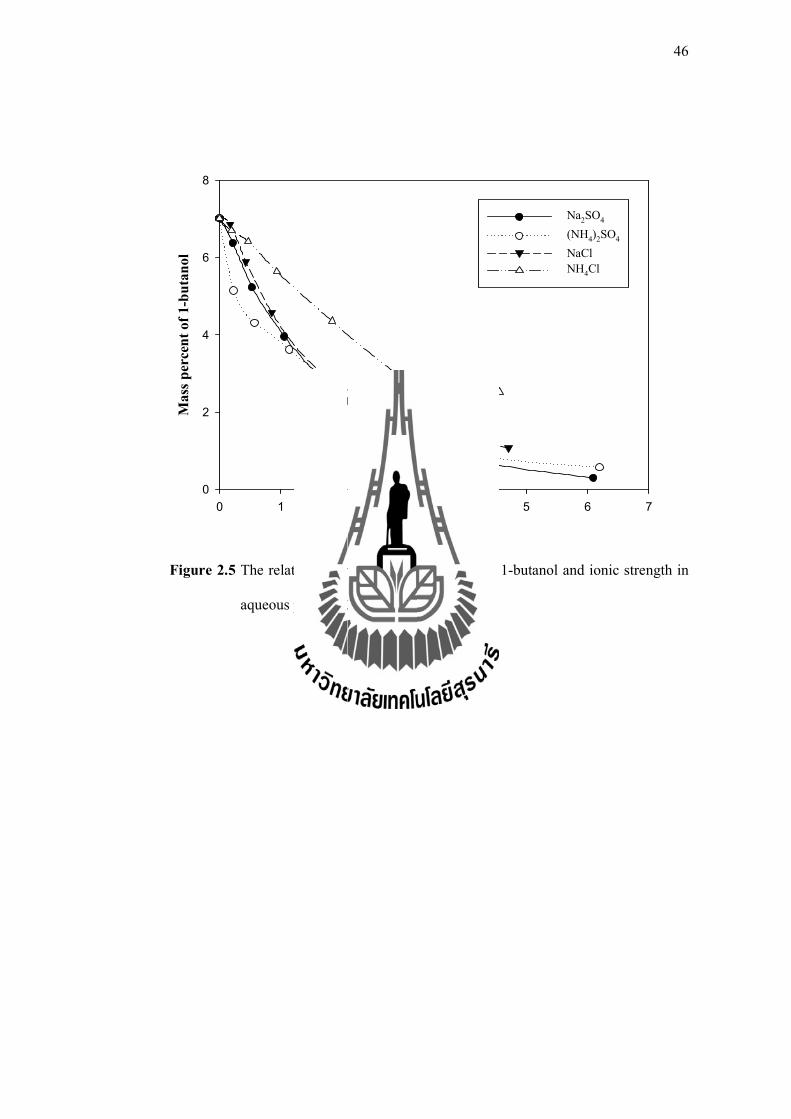
46
Figure 2.5 The relation between the concentration of 1-butanol and ionic strength in
aqueous phase at 303.15 K
Ionic strength (M)
0 1 2 3 4 5 6 7
Mas
s p
erce
nt
of
1-b
uta
no
l
0
2
4
6
8
Na2SO4
(NH4)2SO4
NaCl
NH4Cl
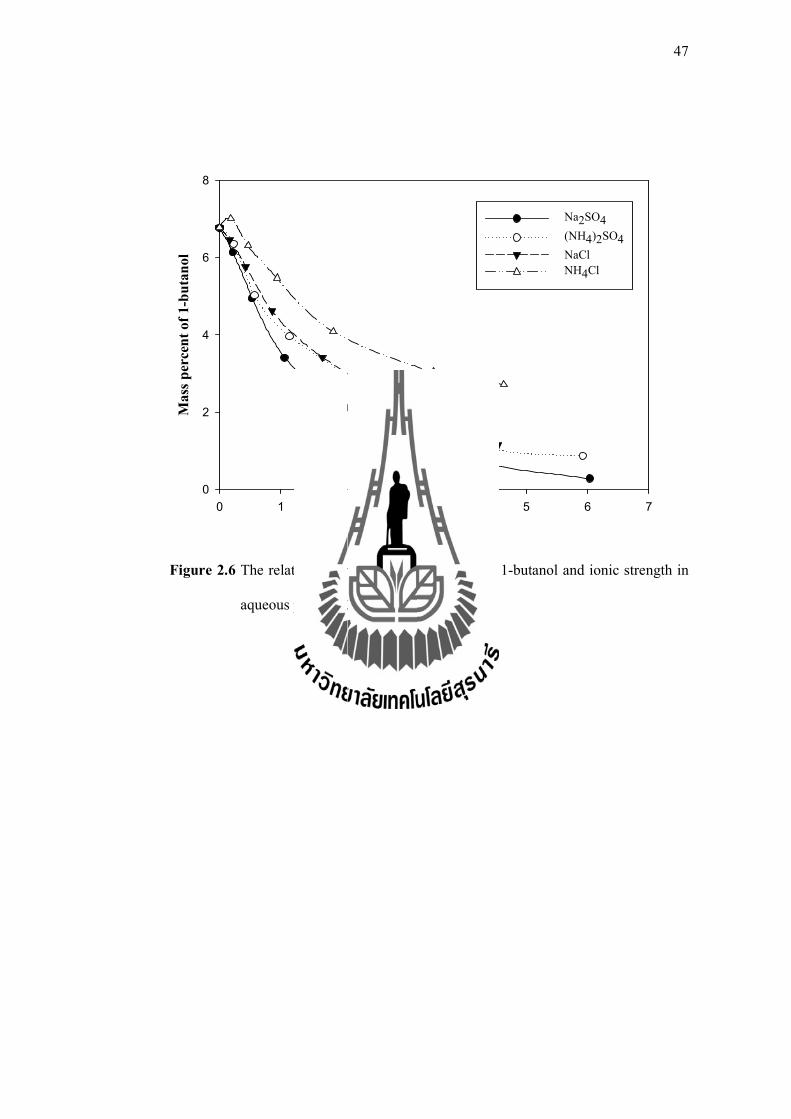
47
Figure 2.6 The relation between the concentration of 1-butanol and ionic strength in
aqueous phase at 313.15 K
Ionic strength (M)
0 1 2 3 4 5 6 7
Mas
s p
erce
nt
of
1-b
uta
no
l
0
2
4
6
8
Na2SO4
(NH4)2SO4
NaCl
NH4Cl
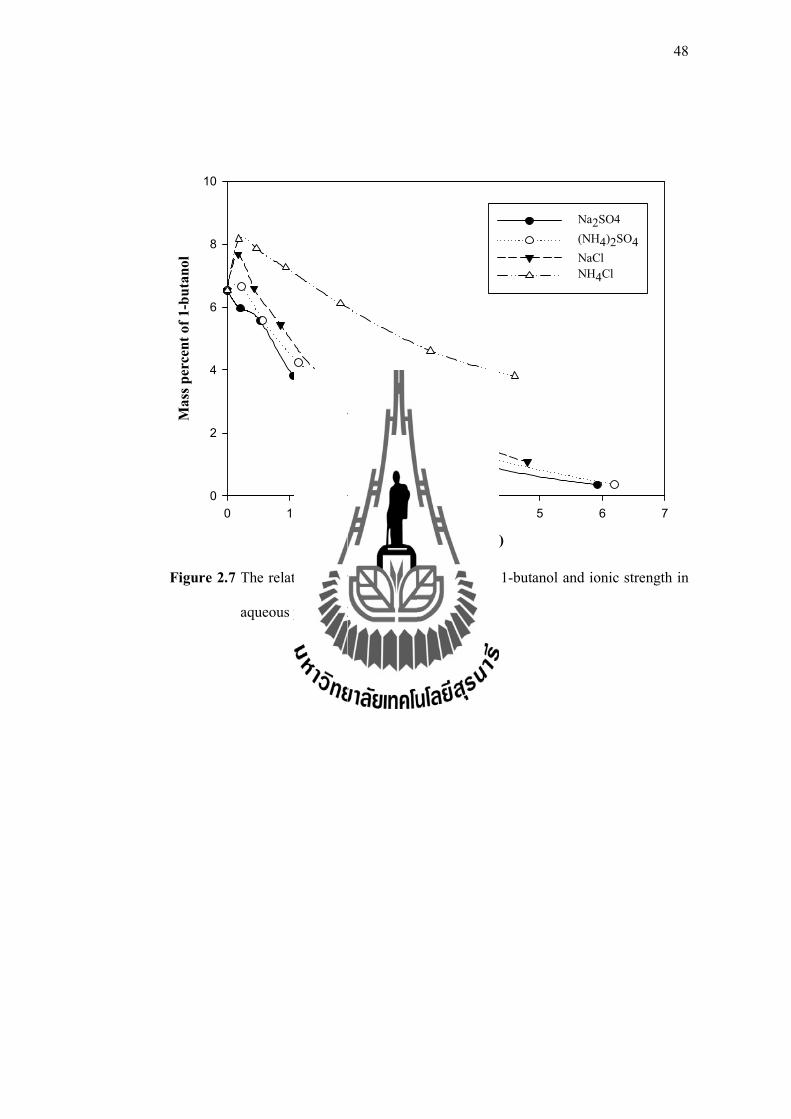
48
Figure 2.7 The relation between the concentration of 1-butanol and ionic strength in
aqueous phase at 323.15 K
Ionic strength (M)
0 1 2 3 4 5 6 7
Ma
ss p
erce
nt
of
1-b
uta
no
l
0
2
4
6
8
10
Na2SO4
(NH4)2SO4
NaCl
NH4Cl
49
2.5.3.2 Correlation Model and Evaluation of Parameters
The modified extended UNIQUAC model was used to correlate
the experimental LLE data. Water and 1-butanol are considered as the solvent, where
their activity coefficients are defined by symmetrical convention. The activity
coefficients of cationic and anionic species from dissociation of the salt are defined
using the asymmetric convention. The structure parameters r and q used in these
systems are presented in Table 2.1. All adjustable interaction parameters have been
determined by minimizing the differences between the experimental and calculated
mass fractions for each of the components over all tie lines, using the objective
function in Eq. 2-27. The quality of the correlation is measured by the root mean
square absolute deviation of component mass fraction in both phases following Eq.
(2.28).
The correlated results together with the experimental data for
each ternary system were plotted and are shown in Figure 2.8-2.19, the ternary phase
diagrams have been depicted in terms of the component mass fraction at temperatures
of 303.15, 313.15 and 323.15 K in the system of Na2SO4, (NH4)2SO4, NaCl and
NH4Cl, respectively. Although the 1-butanol-water interaction parameters were
reported by Pirahmadi, (2010) but these parameters are not used in this works because
these parameters are obtained from binary system between water-1-butanol, which is
different model and system. Therefore, all binary interaction parameters; ion-water,
ion-ion, water-1-butanol and ion-1-butanol have been estimated using the
experimental data measured in this work. Values of binary interaction parameters
obtained after the model optimization are given in Table 2.9.
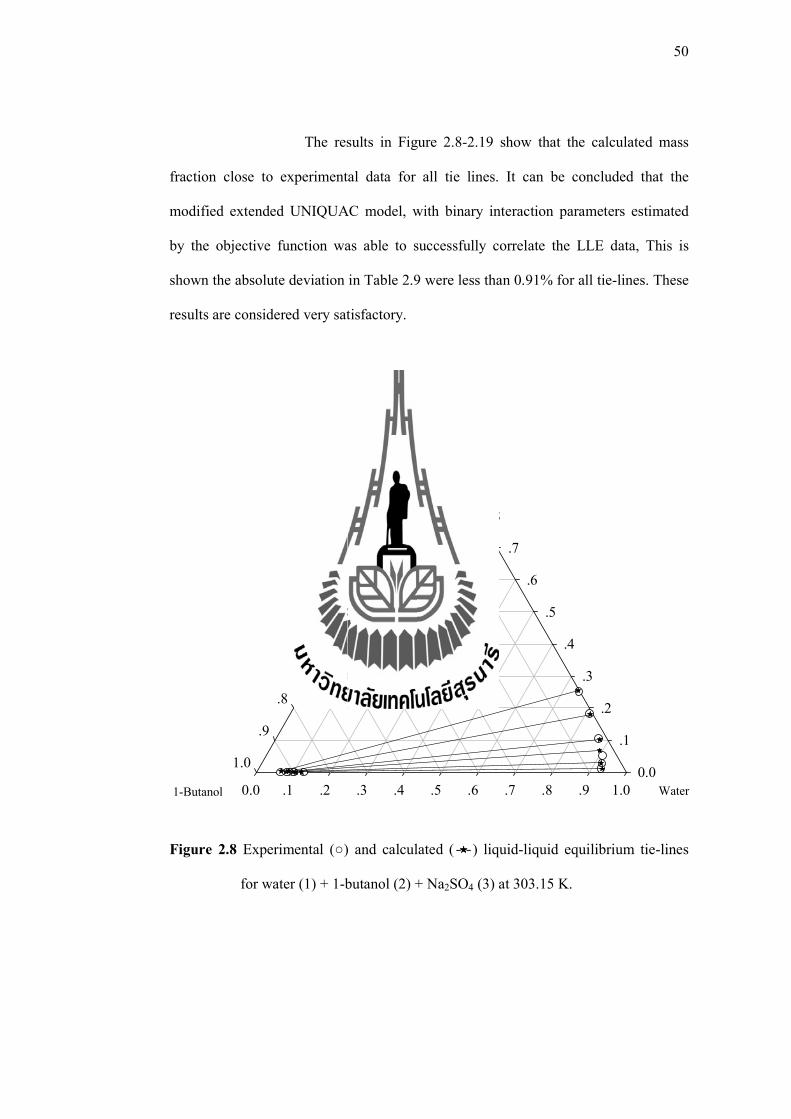
50
The results in Figure 2.8-2.19 show that the calculated mass
fraction close to experimental data for all tie lines. It can be concluded that the
modified extended UNIQUAC model, with binary interaction parameters estimated
by the objective function was able to successfully correlate the LLE data, This is
shown the absolute deviation in Table 2.9 were less than 0.91% for all tie-lines. These
results are considered very satisfactory.
Figure 2.8 Experimental (○) and calculated ( ) liquid-liquid equilibrium tie-lines
for water (1) + 1-butanol (2) + Na2SO4 (3) at 303.15 K.
Water0.0 .1 .2 .3 .4 .5 .6 .7 .8 .9 1.0
Na2SO4
0.0
.1
.2
.3
.4
.5
.6
.7
.8
.9
1.0
1-Butanol
0.0
.1
.2
.3
.4
.5
.6
.7
.8
.9
1.0
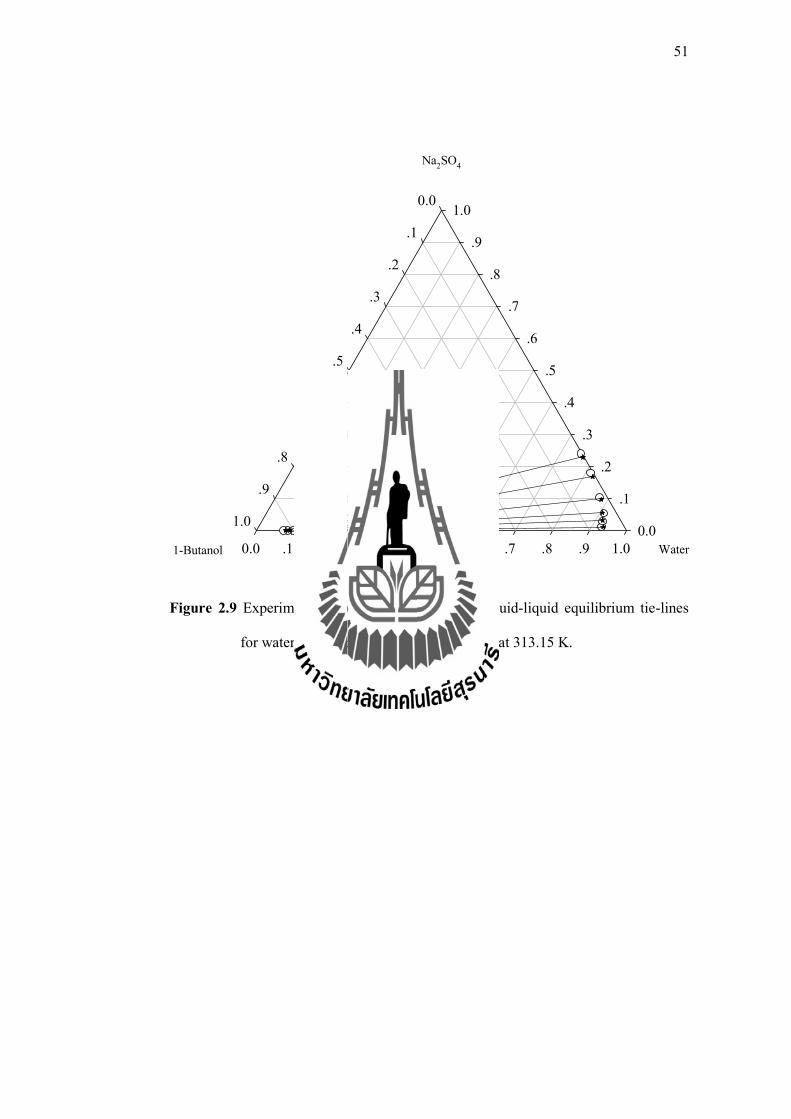
51
Figure 2.9 Experimental (○) and calculated ( ) liquid-liquid equilibrium tie-lines
for water (1) + 1-butanol (2) + Na2SO4 (3) at 313.15 K.
Water0.0 .1 .2 .3 .4 .5 .6 .7 .8 .9 1.0
Na2SO4
0.0
.1
.2
.3
.4
.5
.6
.7
.8
.9
1.0
1-Butanol
0.0
.1
.2
.3
.4
.5
.6
.7
.8
.9
1.0

52
Figure 2.10 Experimental (○) and calculated ( ) liquid-liquid equilibrium tie-lines
for water (1) + 1-butanol (2) + Na2SO4 (3) at 323.15 K.
Water0.0 .1 .2 .3 .4 .5 .6 .7 .8 .9 1.0
Na2SO4
0.0
.1
.2
.3
.4
.5
.6
.7
.8
.9
1.0
1-Butanol
0.0
.1
.2
.3
.4
.5
.6
.7
.8
.9
1.0

53
Figure 2.11 Experimental (○) and calculated ( ) liquid-liquid equilibrium tie-lines
for water (1) + 1-butanol (2) + (NH4)2SO4 (3) at 303.15 K.
Water0.0 .1 .2 .3 .4 .5 .6 .7 .8 .9 1.0
(NH4)2SO4
0.0
.1
.2
.3
.4
.5
.6
.7
.8
.9
1.0
1-Butanol
0.0
.1
.2
.3
.4
.5
.6
.7
.8
.9
1.0
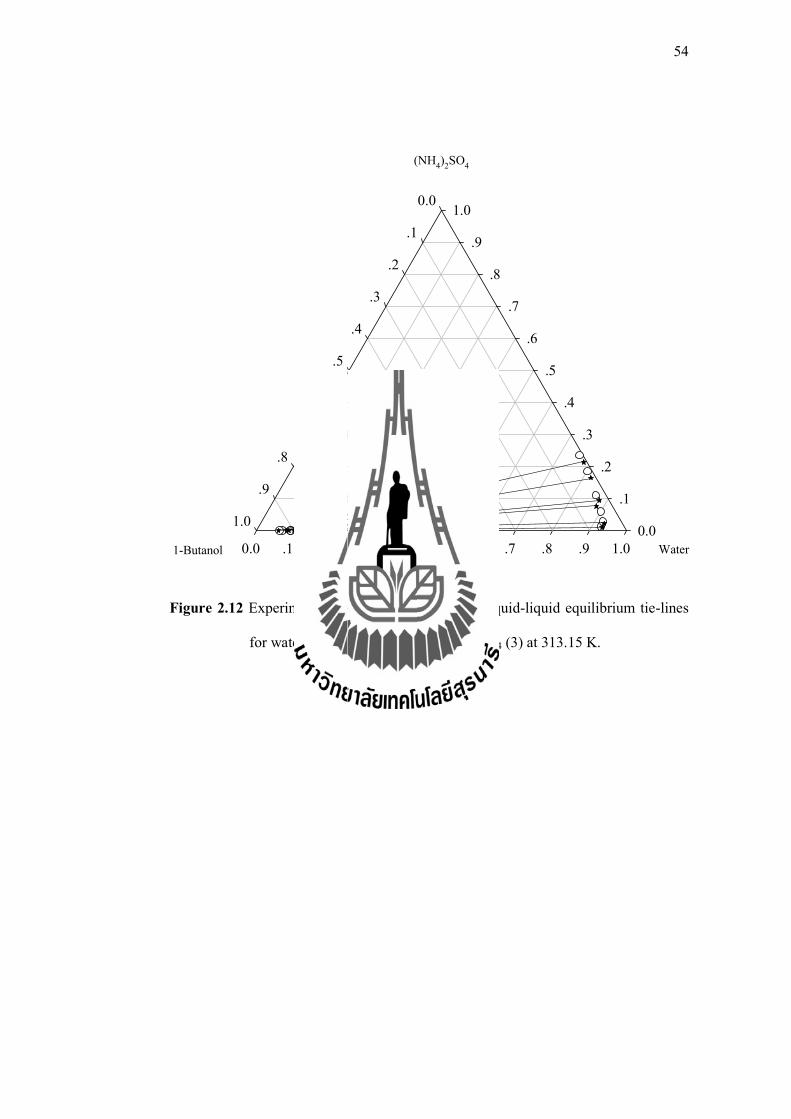
54
Figure 2.12 Experimental (○) and calculated ( ) liquid-liquid equilibrium tie-lines
for water (1) + 1-butanol (2) + (NH4)2SO4 (3) at 313.15 K.
Water0.0 .1 .2 .3 .4 .5 .6 .7 .8 .9 1.0
(NH4)2SO4
0.0
.1
.2
.3
.4
.5
.6
.7
.8
.9
1.0
1-Butanol
0.0
.1
.2
.3
.4
.5
.6
.7
.8
.9
1.0

55
Figure 2.13 Experimental (○) and calculated ( ) liquid-liquid equilibrium tie-lines
for water (1) + 1-butanol (2) + (NH4)2SO4 (3) at 323.15 K.
Water0.0 .1 .2 .3 .4 .5 .6 .7 .8 .9 1.0
(NH4)2SO4
0.0
.1
.2
.3
.4
.5
.6
.7
.8
.9
1.0
1-Butanol
0.0
.1
.2
.3
.4
.5
.6
.7
.8
.9
1.0

56
Figure 2.14 Experimental (○) and calculated ( ) liquid-liquid equilibrium tie-lines
for water (1) + 1-butanol (2) + NaCl (3) at 303.15 K.
Water0.0 .1 .2 .3 .4 .5 .6 .7 .8 .9 1.0
NaCl
0.0
.1
.2
.3
.4
.5
.6
.7
.8
.9
1.0
1-Butanol
0.0
.1
.2
.3
.4
.5
.6
.7
.8
.9
1.0

57
Figure 2.15 Experimental (○) and calculated ( ) liquid-liquid equilibrium tie-lines
for water (1) + 1-butanol (2) + NaCl (3) at 313.15 K.
Water0.0 .1 .2 .3 .4 .5 .6 .7 .8 .9 1.0
NaCl
0.0
.1
.2
.3
.4
.5
.6
.7
.8
.9
1.0
1-Butanol
0.0
.1
.2
.3
.4
.5
.6
.7
.8
.9
1.0

58
Figure 2.16 Experimental (○) and calculated ( ) liquid-liquid equilibrium tie-lines
for water (1) + 1-butanol (2) + NaCl (3) at 323.15 K.
Water0.0 .1 .2 .3 .4 .5 .6 .7 .8 .9 1.0
NaCl
0.0
.1
.2
.3
.4
.5
.6
.7
.8
.9
1.0
1-Butanol
0.0
.1
.2
.3
.4
.5
.6
.7
.8
.9
1.0

59
Figure 2.17 Experimental (○) and calculated ( ) liquid-liquid equilibrium tie-lines
for water (1) + 1-butanol (2) + NH4Cl (3) at 303.15 K.
Water0.0 .1 .2 .3 .4 .5 .6 .7 .8 .9 1.0
NH4Cl
0.0
.1
.2
.3
.4
.5
.6
.7
.8
.9
1.0
1-Butanol
0.0
.1
.2
.3
.4
.5
.6
.7
.8
.9
1.0

60
Figure 2.18 Experimental (○) and calculated ( ) liquid-liquid equilibrium tie-lines
for water (1) + 1-butanol (2) + NH4Cl (3) at 313.15 K.
Water0.0 .1 .2 .3 .4 .5 .6 .7 .8 .9 1.0
NH4Cl
0.0
.1
.2
.3
.4
.5
.6
.7
.8
.9
1.0
1-Butanol
0.0
.1
.2
.3
.4
.5
.6
.7
.8
.9
1.0

61
Figure 2.19 Experimental (○) and calculated ( ) liquid-liquid equilibrium tie-lines
for water (1) + 1-butanol (2) + NH4Cl (3) at 323.15 K.
Water0.0 .1 .2 .3 .4 .5 .6 .7 .8 .9 1.0
NH4Cl
0.0
.1
.2
.3
.4
.5
.6
.7
.8
.9
1.0
1-Butanol
0.0
.1
.2
.3
.4
.5
.6
.7
.8
.9
1.0
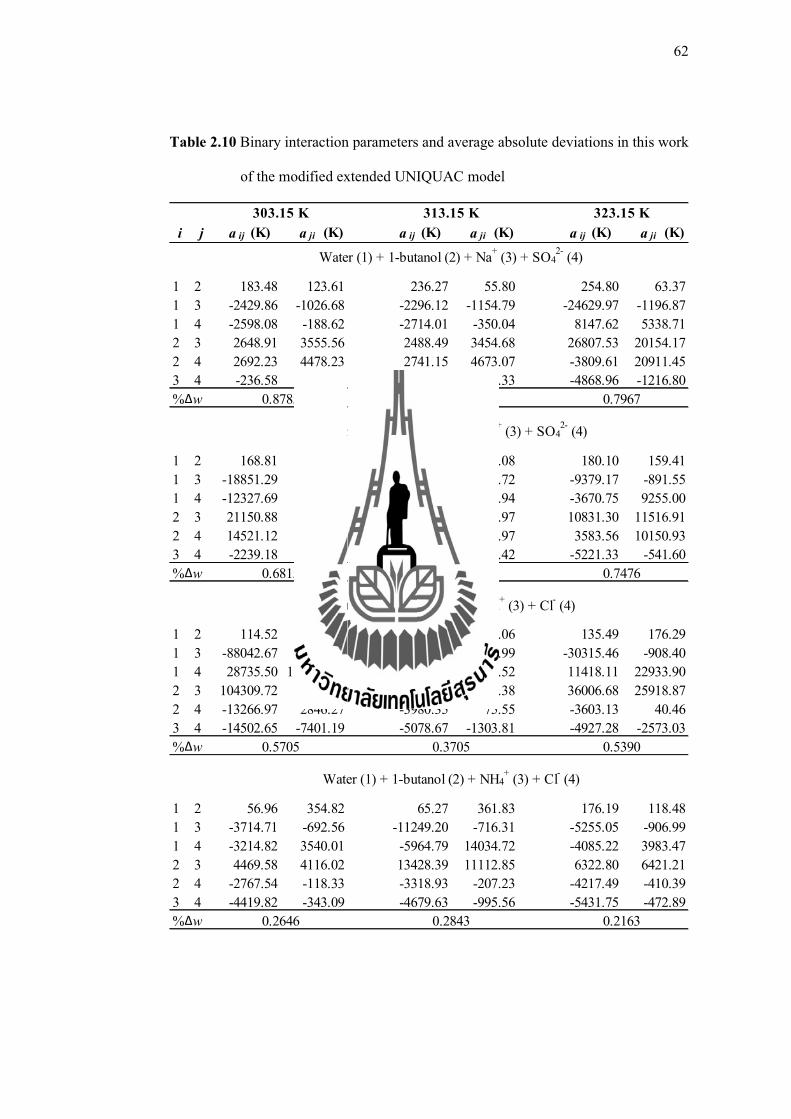
62
Table 2.10 Binary interaction parameters and average absolute deviations in this work
of the modified extended UNIQUAC model
i j a ij (K) a ji (K) a ij (K) a ji (K) a ij (K) a ji (K)
1 2 183.48 123.61 236.27 55.80 254.80 63.37
1 3 -2429.86 -1026.68 -2296.12 -1154.79 -24629.97 -1196.87
1 4 -2598.08 -188.62 -2714.01 -350.04 8147.62 5338.71
2 3 2648.91 3555.56 2488.49 3454.68 26807.53 20154.17
2 4 2692.23 4478.23 2741.15 4673.07 -3809.61 20911.45
3 4 -236.58 -116.83 -229.25 -98.33 -4868.96 -1216.80
%Δw
1 2 168.81 207.71 126.71 215.08 180.10 159.41
1 3 -18851.29 -763.87 -31691.33 -865.72 -9379.17 -891.55
1 4 -12327.69 4501.49 -4156.87 37038.94 -3670.75 9255.00
2 3 21150.88 24839.89 36754.21 34784.97 10831.30 11516.91
2 4 14521.12 23224.39 9754.03 17494.97 3583.56 10150.93
3 4 -2239.18 -870.54 -5643.68 -1980.42 -5221.33 -541.60
%Δw
1 2 114.52 225.44 130.38 223.06 135.49 176.29
1 3 -88042.67 -745.83 -16482.80 -804.99 -30315.46 -908.40
1 4 28735.50 115156.63 7302.73 21082.52 11418.11 22933.90
2 3 104309.72 63558.87 19365.35 11876.38 36006.68 25918.87
2 4 -13266.97 2846.27 -3980.35 75.55 -3603.13 40.46
3 4 -14502.65 -7401.19 -5078.67 -1303.81 -4927.28 -2573.03
%Δw
1 2 56.96 354.82 65.27 361.83 176.19 118.48
1 3 -3714.71 -692.56 -11249.20 -716.31 -5255.05 -906.99
1 4 -3214.82 3540.01 -5964.79 14034.72 -4085.22 3983.47
2 3 4469.58 4116.02 13428.39 11112.85 6322.80 6421.21
2 4 -2767.54 -118.33 -3318.93 -207.23 -4217.49 -410.39
3 4 -4419.82 -343.09 -4679.63 -995.56 -5431.75 -472.89
%Δw 0.2646 0.2843 0.2163
Water (1) + 1-butanol (2) + NH4+ (3) + SO4
2- (4)
Water (1) + 1-butanol (2) + Na+ (3) + Cl
- (4)
Water (1) + 1-butanol (2) + NH4+ (3) + Cl
- (4)
0.6815 0.7257 0.7476
0.5705 0.3705 0.5390
303.15 K 313.15 K 323.15 K
0.8785 0.9092 0.7967
Water (1) + 1-butanol (2) + Na+ (3) + SO4
2- (4)
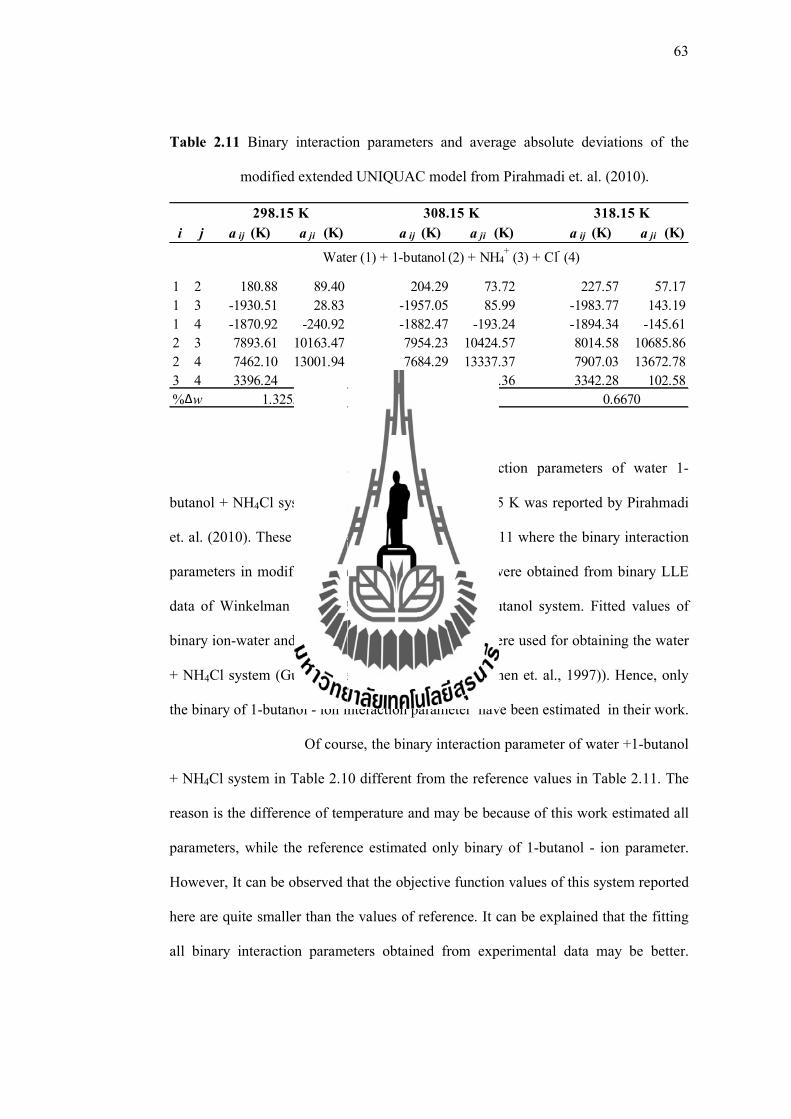
63
Table 2.11 Binary interaction parameters and average absolute deviations of the
modified extended UNIQUAC model from Pirahmadi et. al. (2010).
In addition, the binary interaction parameters of water 1-
butanol + NH4Cl system at 298.15, 308.15 and 318.15 K was reported by Pirahmadi
et. al. (2010). These parameters are shown in Table 2.11 where the binary interaction
parameters in modified extended UNIQUAC model were obtained from binary LLE
data of Winkelman et. al. (2009) for water and 1-butanol system. Fitted values of
binary ion-water and ion-ion interaction parameters were used for obtaining the water
+ NH4Cl system (Guedouzi et. al., (2001) and Korhonen et. al., 1997)). Hence, only
the binary of 1-butanol - ion interaction parameter have been estimated in their work.
Of course, the binary interaction parameter of water +1-butanol
+ NH4Cl system in Table 2.10 different from the reference values in Table 2.11. The
reason is the difference of temperature and may be because of this work estimated all
parameters, while the reference estimated only binary of 1-butanol - ion parameter.
However, It can be observed that the objective function values of this system reported
here are quite smaller than the values of reference. It can be explained that the fitting
all binary interaction parameters obtained from experimental data may be better.
i j a ij (K) a ji (K) a ij (K) a ji (K) a ij (K) a ji (K)
1 2 180.88 89.40 204.29 73.72 227.57 57.17
1 3 -1930.51 28.83 -1957.05 85.99 -1983.77 143.19
1 4 -1870.92 -240.92 -1882.47 -193.24 -1894.34 -145.61
2 3 7893.61 10163.47 7954.23 10424.57 8014.58 10685.86
2 4 7462.10 13001.94 7684.29 13337.37 7907.03 13672.78
3 4 3396.24 947.74 3369.58 984.36 3342.28 102.58
%Δw
298.15 K 308.15 K 318.15 K
Water (1) + 1-butanol (2) + NH4+ (3) + Cl
- (4)
1.3255 0.6944 0.6670
64
Because of the solubility behavior of each component in mixture has the effect on
LLE behavior. Therefore, using the obtained experimental data for estimation of all
parameters can be described this LLE behavior of water + 1-butanol + NH4Cl system
better than using some parameters from binary LLE system.
65
2.6 Conclusion
The equilibrium solubility between water and 1-butanol, solubility data of
inorganic salts in water and 1-butanol have been studied at temperatures range of
303.15-353.15 K and experimental liquid-liquid equilibrium data of mixed solvent
electrolyte systems containing 1-butanol, water and inorganic salt has been measured
at temperatures of 303.15, 313.15 and 323.15 K. The result of the solubility show that
water and 1-butanol is partially miscible and salt is less soluble in 1-butanol as
compared to the water. The experimental LLE data of water + 1-butanol + salt
systems show that the presence of salt changed the mutual solubility of the solvent in
the aqueous and organic phases. The salting-out effect is detected due to the addition
of salt; it can be found that the addition of salt decreases the 1-butanol concentration
in the aqueous phase as well as the water concentration in the organic phase. This
effect was observed at all temperatures in the range studied. The result shows that
Na2SO4 was most powerful in enhancing the salting-out. The influence of the salt in
this study on the salting-out effect is in order of Na2SO4 > (NH4)2SO4 > NaCl >
NH4Cl, which is the same arrangement as the Hofmeister series. However, the effect
of temperature was minimal in the temperature range 303.15-323.15 K.
The modified extended UNIQUAC model was used to correlate the
experimental LLE data. The corresponding optimized UNIQUAC binary interaction
parameters were also reported here. The model gave good agreement between the
experimental and the calculated data
66
2.7 References
Thomsen, K., Iliuta, M. C., and Rasmussen, P. (2004). Extended UNIQUAC model
for correlation and prediction of vapor-liquid-liquid-solid equilibria in aqueous
salt systems containing non-electrolytes. Part B. Alcohol (ethanol, propanols,
butanols)-water-salt systems. Chem. Eng. Sci. 59: 3631-3647.
Ghalami-Choobar, B., Ghanadzadeh, A, and Kousarimehr, S. (2011). Salt effect on
the liquid-liquid equilibrium of (water + propionic acid + cyclohexanol)
system at T = (298.2, 303.2, and 305.2) K. Chin. J. Chem. Eng. 19(4): 565-
569.
Santos, F. S., Saul, G. D., and Martin, A. (2001). Salt effect on liquid–liquid
equilibrium ofwater + 1-butanol + acetone system: experimentaldetermination
and thermodynamic modeling. J. Fluid Phase Equilibria. 187-188: 265-274.
Vakili-Nezhaad, G. R., Mohsen-Nia, M., Taghikhani, V., Behpoor, M., and
Aghahosseini, M. (2004). Salting-Out effect of NaCl and KCl on the ternay
LLE data for the systems of (water+propionic acid+isopropyl methyl ketone)
and of (water+propionic acid+isobuthyl methyl ketone). J. Chem.
Thermodynamics. 36: 341-348.
Bhupesh, C., Roy, M. R., Awual and Goto, M. (2007). Effect of in organic Salts on
Ternary Equilibrium Data of Propionic Acid-Water-Solvents Systems. Journal
of Applied Sciences. 7(7): 1053-1060, 2007.
Pirahmadi, F., Deghani, M. R., Behzadi, B., Seyedi, S. M., and Rabiee, H. (2010).
Experimental and theoretical study on liquid-liquid equilibrium of 1-
butanol+water+NaNO3. Fluid phase Equilibria. 299: 122-126.
67
Pirahmadi, F., Deghani, M. R., and Behzadi, B. (2012). Experimental and theoretical
study on liquid-liquid equilibrium of 1-butanol+water+NH4Cl. Fluid phase
Equilibria. 325: 1-5.
Hofmeister F. (1888). On the understanding of the effect of salts. Second report. On
regularities in the precipitating effect of salts and their relationship to their
physiological behavior. Naunyn-Schmiedebergs Arch Exp Pathol
Pharmakol (Leipzig). 24:247-260.
Nostro, P. L., and Ninham, B. W. (2012). Hofmeister phenomena: An update on ion
specificity in biology. Chem. Rev. 112: 2286-2322.
Pegram, L. M., and Record, M. T., Jr. (2007). Hofmeister Salt Effects on Surface
Tension Arise from Partitioning of Anions and Cations between Bulk Water
and the Air−Water Interface. J. Phys. Chem. B. 111: 5411-5417.
Cacace, M. G.; Landau, E. M., and Ramsden, J. J. (1997). The Hofmeister series: salt
and solvent effects on interfacial phenomena. Q. ReV. Biophys. 30: 241-277.
Grover, P. K., and Ryall. R. L. (2004). Critical appraisal of salting-out and its
applications for chemical and biological sciences. Chem. Rev. 105: 1-9.
Long, F. A., and McDevit, W. F. (1952). Activity coefficients of nonelectrolyte
solutes in aqueous salt solutions. Chemical Reviews. Washington, DC, United
States. 51: 119-69.
Debye, P., and McAuley, J. (1925). The electric field of the ions and the neutral salt
effect. Physik. Z. 26:2.
McDevit, W. F., and Long, F. A. (1952). The activity coefficient of benzene in
aqueous salt solutions. Journal of the American Chemical Society. 74:1773-
1777.
68
Tammann, G. Z. (1926). The molecular composition of water. Anorg. Allg. Chem.
158: 25.
Smith, J. M., and Van ness, H. C. (1987). Introduction to Chemical Engineering
Thermodynamics. 4th Edition. Mcgraw-Hill Chemical Engineering Series.
New York.
Prausnitz, J. M., Lichtenthaler, R. N., and Azevedo, E. G. d. (1999). Molecular
thermodynamics of fluid-phase equilibria. Prentice Hall PTR. Upper Saddle
River. N. J.
Abrams, D. S., and Prausnitz, J. M. (1975). Statistical thermodynamics of liquid
mixtures. New expression for the excess Gibbs energy of partly or completely
miscible systems. AIChE Journal. 21(1): 116-28.
Pitzer, K. S. (1980). Electrolytes. From dilute solutions to fused salts. Journal of the
American Chemical Society. 102(9): 2902-2906.
Debye, P., and Huckel, E. (1923). The theory of electrolytes. I. Lowering of freezing
point and related phenomena. Physikalische Zeitschrift. 24: 185-206.
Sabine, M., Agena, M. Sc., and Dipl.-Ing. (1997). Modelling of protein solution
properties. Ph. D. Philosophy. University of London, London.
Marcus, Y. (1985). Ion Solvation. Weiley. New York.
Marcus, Y. (1997). Ion Properties. 3rd ed. Marcel Dekker. Ind. Eng. New York.
Patricia, D., Mar´ıa, T. S., and Sagrario, B. (2007). Isobaric vapor–liquid equilibria
for the quaternary reactive system: Ethanol +water + ethyl lactate + lactic acid
at 101.33 kPa. Fluid Phase Equilibria. 225:17-23.
69
Marian, G., Barbara, W. G., and Andrzej, M. (2006). Recommended Liquid-Liquid
Equilibrium Data. Part 4.1-Alkanol-water Systems. J. Phts. Chem. Ref. Data.
35(3):1391-1414.
Collins, K. D. (1997). Charge density dependent strength of hydration and biological
structure. Biophysical Journal. 72(1): 65-76.
Collins, K. D., and Washabaugh, M. W. (1985). The Hofmeister effect and the
behaviour of water at interfaces. Q. Rev. Biophys. 18: 323-422.
Tansel, B., Sager, J., Rector, T., Garland, J., Strayer, R. F., Levine, L. F., Robert, M.,
Hummerick, M., and Bauer, J. (2006). Significance of hydrated radius and
hydration shells on ionic permeability during nanofiltration in dead end and
cross flow modes. Sep. Purif. Technol. 51(1): 40-47.
Winkelmam, J. G. M., Kraai, G. N., and Heeres, H. J. (2009). Binary, ternary and
quaternary liquid–liquid equilibria in 1-butanol, oleic acid, water and n-
heptane mixtures. Fluid Phase Equilibria. 284:71-79.
Guendouzi, M., Dinane, A., and Mounir, A. (2001). Water activities, osmotic and
activity coefficients in aqueous chloride solutions atT = 298.15 K by the
hygrometric method. J. Chem. Thermodyn. 33: 1059-1072.
Korhonen, P., Kulmala, M., and Viisanen, Y. (1997). J. Aerosol. Sci. 28: 901-999.
CHAPTER III
LIQUID-LIQUID EQUILIBRIUM FOR TERNARY
SYSTEM OF WATER+1-BUTANOL+LACTIC ACID
3.1 Abstract
Liquid-liquid equilibrium data for water, 1-butanol and lactic acid were
presented at 303.15 K under atmospheric pressure. The distribution coefficient of
lactic acid between aqueous and organic phase was used to evaluate the possibility for
its separation from its aqueous solution. Distribution coefficients and separation
factors were evaluated over the immiscibility regions. The results showed that 1-
butanol was partially miscible in the aqueous phase, and the areas of two-phase
regions primarily were dependent on the mutual solubility of water and 1-butanol. In
separation of lactic acid, it was found that 1-butanol was capable to extract lactic acid
from its aqueous solution, with the separation factors greater than 1. The distribution
coefficient and degree of lactic acid extraction were also enhanced by increasing
lactic acid concentration in the aqueous phase. The experimental tie-lines of the
ternary system were correlated using the UNIQUAC model. The results for the binary
interaction parameters for UNIQUAC model are also reported in this chapter. It was
concluded results that the UNIQUAC model provided a satisfactory description of
LLE data obtained in this work.
71
3.2 Introduction
Lactic acid is one of the most widely used carboxylic acids, as it has many
industrials applications. In recent years, the interest towards lactic acid recovery from
fermentation broth has been increased. This interest is caused by increasing the
demand for pure, naturally produced lactic acid, mainly for food industry,
pharmaceutical industry or for production of biodrgradable polymers (Yankov et al.,
2004). Recovery of lactic acid from aqueous solution is a growing requirement in
fermentation based industries and recovery from waste streams. The traditional
recovery process of lactic acid from fermentation broth is quite complicated.
Separation of this acid from dilute wastewater or fermentation broth is an economic
problem. The possibility to add value also causes interest in lactic acid removal from
water (Duke et al., 2008 and Geanta et al., 2013).
With an increase in demand for environmentally friendly chemicals, an
efficient separation of lactic acid from aqueous solution is an important method.
Nowadays, several separation methods have been employed, such as liquid-liquid
extraction, chromatographic method, reverse osmosis, evaporation, membrane
separation, ion exchange, distillation, crystallization, and precipitation. Liquid-liquid
extraction process is the most useful method for purification, enriching and separation
of components. This process is a process in which a solution is brought into contact
with a second liquid essentially immiscible or partially miscible with the first one in
the order to bring about transfer of one or more components from solution into
solvent. Separation of lactic acid by liquid-liquid extraction has been investigated by
several investigators. Juang and Huang (1997) and Kahya et al. (2001) works on
reactive extraction of lactic acid from aqueous solution with tri-n-octylamine (TOA)
72
in solvent. They reported that distribution coefficient increased with increasing TOA
concentration. Effect of temperature on extraction of lactic acid was explored by
Kertes and King (1986). Extraction temperature in the range of 20 to 90°C was found
to have a very slight effect on the distribution ratio of lactic acid into alcohols.
However, in the amine based solvent extraction systems, it was known that the
extractability of the single acid decreases with increasing temperature (Tamada et al,
1990). In addition, the effect of the pH on extraction of lactic acid was studied in
previous works. Yang et al. (1991) directed their studies towards understanding the
effects of pH on the extraction as well as on the fermentation before designing an
optimum extractive fermentation process. They found out that lower pH values result
in good separation of lactic acid by long chain tertiary amines. In the intermediate pH
range (3-5), distribution coefficient decreased with increasing equilibrium pH of the
aqueous phase. However, in the extremely high and low pH ranges, the distribution
coefficient remained insensitive to pH values. The results from investigators have
been summarized that the liquid-liquid extraction has the advantage that lactic acid
can be removed easily from the fermentation broth, preventing the lowering of pH.
Further, the lactic acid can be re-extracted and the extractant recycled to the
fermentation process. Despite the high distribution coefficient obtained from the
extraction, some of the solvents are expensive and might inherit some toxicity. Hence,
selection of solvent for the separation of this acid is still needed to improve.
Weiser and Geankoplis (1955) and Petritis and Geankoplis (1959) have been
investigated two solvents; 3-methyl-1-butanol and butyl alcohol for extraction of
lactic acid from aqueous solution at 25 ˚C. They found that the butyl alcohol was also
a good solvent for lactic acid extraction. Moreover, extraction of lactic acid with 1-
73
butanol was studied by Chawong and Rattanaphanee (2011). It was reported that the
process efficiency was significantly dependent on pH of the aqueous solution. The pH
effect was substantially pronounced at pH of the aqueous solution less than 1. Initial
lactic acid concentration appeared to have a positive effect on the distribution
coefficient and the degree of extraction.
Several thermodynamic theories have been developed to represent in LLE of
water + carboxylic acid + alcohol systems such as NRTL and UNIQUAC model.
Domingues et al. (2013) presented NRTL model on LLE of water + lactic acid + C4-
C7 alcohol (1-butanol, 1-pentanol, 1-hexanol and 1-heptanol) at 298.2 K. The result
indicated that the NRTL model gives a satisfactory description of LLE data of the
long carbon chain of alcohol system. The LLE systems of water + formic acid +
primary alcohol, i.e. 1-butanol, 1-pentanol, 1-hexanol and 1-heptanol were studied by
Gilani and Asan (2013). The experimental LLE data were correlated using the NRTL
and the UNIQUAC models. It was found that UNIQUAC gives a better agreeable
with the measured LLE data of the system containing 1-butanol than NRTL model.
Therefore, the purpose of this Chapter is to determine LLE data of water + 1-
butanol + lactic acid and application of 1-butanol on extraction of lactic acid. The
LLE data for the ternary systems was measured at 303.15 K and atmospheric
pressure. In addition, the measured LLE data of this ternary system were correlated by
UNIQUAC model in order to obtain the binary interaction parameters.
74
3.3 Theory
3.3.1 Physical Extraction of Carboxylic Acids
Carboxylic acids, mainly exist as dimmers in the organic phase owing
to strong intermolecular hydrogen bonding. On the contrary, in the aqueous phase,
they existed as monomers because of the intermolecular hydrogen bonding between
the acid is destroyed owing to their preferential hydrogen bonding with the water
molecules. At the pH less than the its pKa values, the acid can be assumed to be
transferred into organic solvent by the following mechanism (Kailas et al., 2010):
(i) Ionization of the acid in aqueous phase:
aqHA H A (3.1)
[ ][ ]
[ ]HA
H AK
HA
(3.2)
(ii) Distribution of undissociated molecular acid between the two phases,
aqueous and organic:
aq orgHA HA (3.3)
[ ]
[ ]
org
aq
HAD
HA (3.4)
(iii) Dimerization of the acid in the organic phase:
2,2 org orgHA HA (3.5)
2,[ ]
[ ]
org
D
org
HAK
HA (3.6)
75
Efficiency of acid extraction is represented by degree of extraction (%E).
0 0
0 0
[ ] [ ]% 100
[ ]
aq aqHA V HA VE
HA V
(3.7)
where subscripts aq and org represent the equilibrium aqueous and organic phase.
[HA] is the equilibrium concentration of acid
[A-] is the concentration of dissociated acid
[H+] is the concentration of hydrogen ion
V0 is the volume of starting solution
Vaq is the volume of the aqueous phase after extraction
KHA is ionization coefficient
D is distribution coefficient
KD is dimerization coefficient
3.3.2 UNIQUAC model
The UNIQUAC model is an extension of the quasi-chemical theory for
non-random mixtures containing components of different sizes. The UNIQUAC
model for the excess Gibbs energy (GE) consists of two parts: a combinatorial,
entropic contribution, which accounts the molecules size and shape effects, and a
residual, enthalpic contribution, that accounts for the energy. The UNIQUAC
contribution for excess Gibbs energy is given as follows (Abrams and Prausnitz,
1975):
76
The UNIQUAC equation is applicable to a wide variety of non-
electrolyte liquid mixtures containing nonpolar or polar fluids such as hydrocarbons,
alcohols, nitriles, ketones, aldehydes, organic acids, etc. and water, including partially
miscible mixtures.
, , ,ReE UNIQUAC E Comb E sG G G
RT RT RT (3.8)
The combinatorial and the residual terms are identical to the terms used in the
traditional UNIQUAC equation. The combinatorial, entropic term is
,
ln 5 lnE Comb
j j
j j jj j
j j
Gx q x
RT x
(3.9)
The parameters and are the surface and volume fractions, respectively. They
depend on the volume and surface area parameters ri and qi:
i ii
i ii
x r
x r
and
i ii
i ii
x q
x q
(3.10)
,Re
lnE s
j j k kjj k
Gq x
RT (3.11)
The parameter kj is defined in terms of the binary energy interaction parameter a
kl:
77
exp expkl ll klkl
u u a
T T
(3.12)
Where kl lka a and
0kk lla a . By partial molar differentiation of the combinatorial
and the residual UNIQUAC terms, the combinatorial and the residual parts of the
rational, symmetrical activity coefficients are obtained
,
ln 5 ln lnE UNIQUAC
j j
j j j j j k kjj j j k
j j
Gx q x q x
RT x
(3.13)
The values of the ri and qi used in this work are shown in Table 2.1 for water and 1-
butanol, for lactic acid is used r = 3.1648 and q = 2.8800 (Patricia et al., 2007).
3.3.3 The Non-Random Two-Liquid Model (NRTL Model)
The non-random two-liquid equation is based on the concept of local
compositions. Local compositions, different from overall compositions, are assumed
to account for the short range order and nonrandom molecular orientations that result
from differences in molecular size and intermolecular forces. The original NRTL
model was proposed by Renon and Prausnitz (1968). It is applicable to partially
miscible as well as completely miscible systems. The excess Gibb energy of the
NRTL equation for multicomponent mixtures is as follows:
1
1
m
ji ji jE mj i
i mi
li ll
G xG
xRT
G x
(3.14)
78
where ji ii
ji
g g
RT
(
ji ij ) (3.15)
exp( )ji ji jiG (ji ij ) (3.16)
The activity coefficient expressions for the NRTL equation can be
represented as follows:
1
1
1 1 1
ln
m m
ji ji j k kj kjmj j ij k l
i ijm m mj
li l lj l li ll l l
G x x Gx G
G x G x G x
(3.17)
The significance of ijg is an energy parameter characteristic of the i-j
interaction. The randomness factor (ij ) is a constant that the characteristic of the
randomness of the system. Walas (1985) recommends the values of 0.3 for non-
aqueous mixture and 0.4 for aqueous organic mixtures.
79
3.4 Experimental procedure
3.4.1 Chemicals
Lactic acid with concentration of 88 %wt and 1-butanol with 99.9%
purity were purchased from Acros. The deionized water was used in the experiments.
3.4.2 Procedure for Liquid-Liquid Equilibrium of Water + 1-Butanol +
Lactic Acid Ternary System
The aqueous solution containing 0.1 to 3 M of lactic acid was used for
the LLE study. 1-Butanol was used as an organic phase. Equal volumes (10 ml each)
of aqueous and organic phase were then mixed in 125 ml of Erlenmeyer flask and
shaken with 90 rpm at a constant temperature of 30°C in temperature-controlled
shaking bath for 12 h and settling for 12 h for a complete phase separation. After the
phase separation, volumes of the aqueous and organic phase were measured. Samples
of the top and bottom phase were taken for analysis. Water and 1-butanol
concentration was analyzed by GC (detail descripted in Chapter II). Lactic acid
concentration was determined by High performance liquid chromatography (HPLC).
3.4.3 High Performance Liquid Chromatography Analysis of Lactic
Acid
Lactic acid concentration was determined by HPLC from Agilent
Technologies using a Hypersil BDS-C18 column to separate the compounds and UV
detector was set at 210 nm. 10% of sulfuric acid concentrations of 0.005 M and 90%
of water were used as a mobile phase at a flow rate of 0.35 ml/min. The column oven
temperature was maintained at 50 C. All samples are diluted with deionized water
and the injection volume was 10 µL.
80
3.5 Results and Discussion
3.5.1 Experimental LLE data
The measured compositions of the LLE for water(1) + 1-butanol(2) +
lactic acid(3) ternary system at 303.15 K under atmospheric pressure are shown in
Table 3.1, in which wi denotes that mass fraction of the ith components. The
experimental LLE data and the calculated tie-lines for this system were plotted in
Figure 3.2 and 3.3. The organic solvent is one of most important factor which
influence the equilibrium characteristics and the immiscible region of this investigated
system. The area of two-phase region, primarily depend on the solubility of water and
1-butanol. As seen from the LLE phase diagram, the result shows that the 1-butanol is
less soluble in the aqueous phase and solubility of water in the organic phase increase
with increasing of the concentration of lactic acid.
Effect of initial concentration of lactic acid in the aqueous solution on
distribution coefficient and degree of lactic acid extraction were investigated in the
extraction where the pH was not controlled. The pH strongly affects the ionization of
carboxylic acids. Most carboxylic acids are weak acids. The partially ionize in the
aqueous solution according to Eq. 3.1. The concentrations of dissociated [A-] and
undissociated acids [HA] are affected by the concentration of hydrogen ions [H+] or
pH. At extremely low pH values, the acid is mainly in undissociated form. Most
organic solvent extract undissociated acids from the aqueous phase (Yang et al.,
1991). The dissociation coefficient of the lactic acid is 1.38 x 10⁻⁴ (for pKa = 3.86).
The results in Table 3.2 show that the pH depends on lactic acid concentration. The
pH values decrease from 2.30 to 1.65 when the lactic acid concentration increases
from 0.17 to 3.03 M. It can be seen that all the aqueous solution has the pH lower than
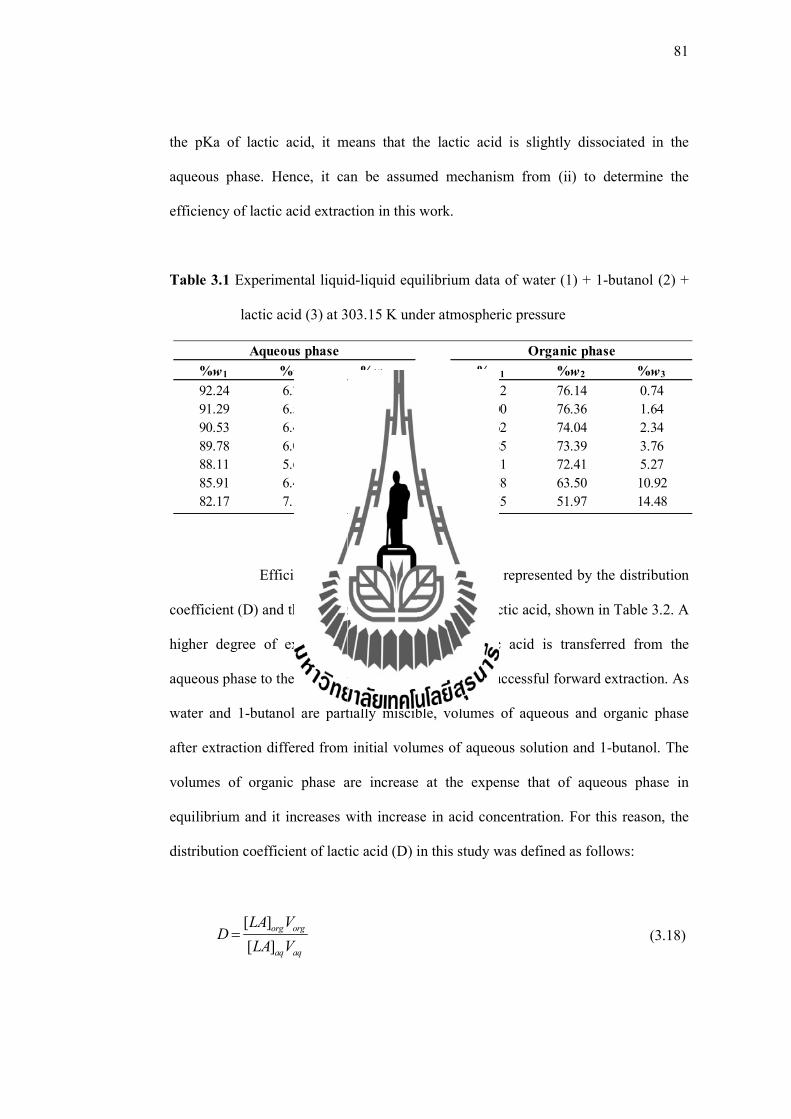
81
the pKa of lactic acid, it means that the lactic acid is slightly dissociated in the
aqueous phase. Hence, it can be assumed mechanism from (ii) to determine the
efficiency of lactic acid extraction in this work.
Table 3.1 Experimental liquid-liquid equilibrium data of water (1) + 1-butanol (2) +
lactic acid (3) at 303.15 K under atmospheric pressure
Efficiency of lactic acid extraction was represented by the distribution
coefficient (D) and the degree of extraction (%E) of lactic acid, shown in Table 3.2. A
higher degree of extraction means that more lactic acid is transferred from the
aqueous phase to the organic phase, which implies a successful forward extraction. As
water and 1-butanol are partially miscible, volumes of aqueous and organic phase
after extraction differed from initial volumes of aqueous solution and 1-butanol. The
volumes of organic phase are increase at the expense that of aqueous phase in
equilibrium and it increases with increase in acid concentration. For this reason, the
distribution coefficient of lactic acid (D) in this study was defined as follows:
[ ]
[ ]
org org
aq aq
LA VD
LA V (3.18)
%w1 %w2 %w3 %w1 %w2 %w3
92.24 6.73 1.03 23.12 76.14 0.74
91.29 6.51 2.21 22.00 76.36 1.64
90.53 6.48 2.99 23.62 74.04 2.34
89.78 6.02 4.20 22.85 73.39 3.76
88.11 5.65 6.24 22.31 72.41 5.27
85.91 6.41 7.68 25.58 63.50 10.92
82.17 7.19 10.65 33.55 51.97 14.48
Aqueous phase Organic phase
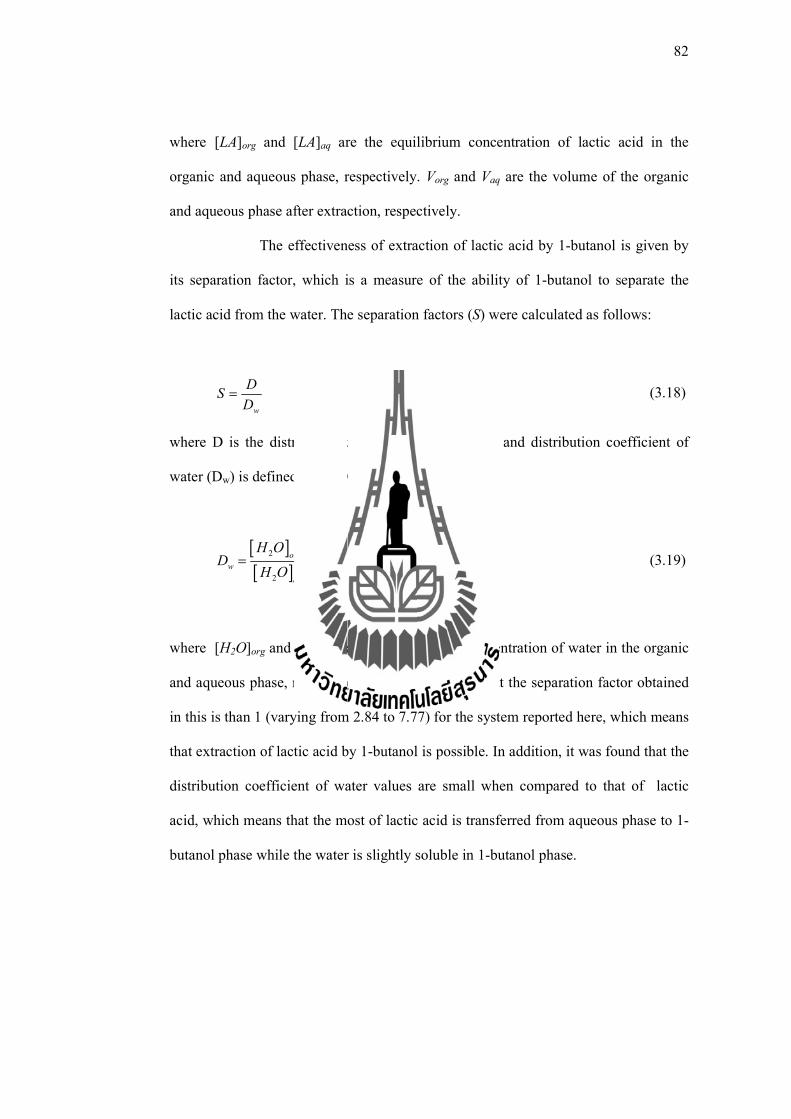
82
where [LA]org and [LA]aq are the equilibrium concentration of lactic acid in the
organic and aqueous phase, respectively. Vorg and Vaq are the volume of the organic
and aqueous phase after extraction, respectively.
The effectiveness of extraction of lactic acid by 1-butanol is given by
its separation factor, which is a measure of the ability of 1-butanol to separate the
lactic acid from the water. The separation factors (S) were calculated as follows:
w
DS
D (3.18)
where D is the distribution coefficient of lactic acid and distribution coefficient of
water (Dw) is defined as follows:
2
2
orgorg
w
aqaq
H O VD
H O V (3.19)
where [H2O]org and [H2O]aq are the equilibrium concentration of water in the organic
and aqueous phase, respectively. The results show that the separation factor obtained
in this is than 1 (varying from 2.84 to 7.77) for the system reported here, which means
that extraction of lactic acid by 1-butanol is possible. In addition, it was found that the
distribution coefficient of water values are small when compared to that of lactic
acid, which means that the most of lactic acid is transferred from aqueous phase to 1-
butanol phase while the water is slightly soluble in 1-butanol phase.
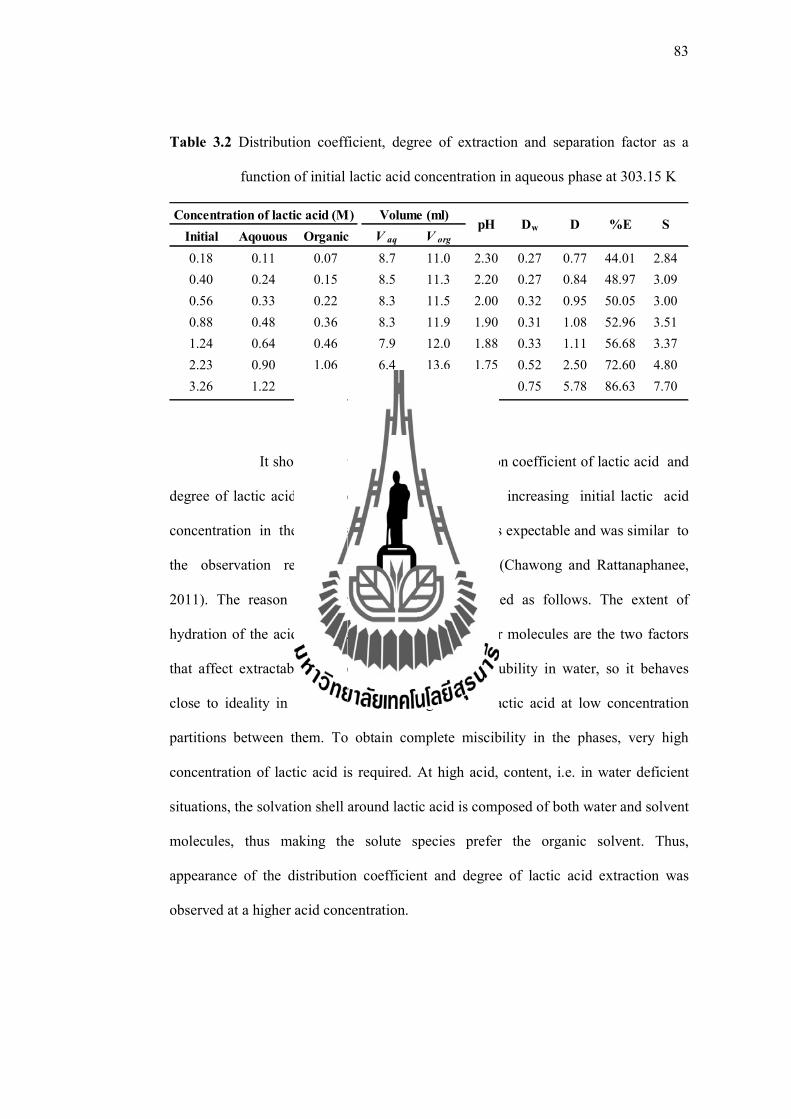
83
Table 3.2 Distribution coefficient, degree of extraction and separation factor as a
function of initial lactic acid concentration in aqueous phase at 303.15 K
It should be noted that the distribution coefficient of lactic acid and
degree of lactic acid extraction were enhanced with increasing initial lactic acid
concentration in the aqueous solution. This result was expectable and was similar to
the observation reported in the previous study (Chawong and Rattanaphanee,
2011). The reason of the behavior can be explained as follows. The extent of
hydration of the acid and energy of the bond to water molecules are the two factors
that affect extractability. 1-butanol has very low solubility in water, so it behaves
close to ideality in term of volume changes when lactic acid at low concentration
partitions between them. To obtain complete miscibility in the phases, very high
concentration of lactic acid is required. At high acid, content, i.e. in water deficient
situations, the solvation shell around lactic acid is composed of both water and solvent
molecules, thus making the solute species prefer the organic solvent. Thus,
appearance of the distribution coefficient and degree of lactic acid extraction was
observed at a higher acid concentration.
Initial Aqouous Organic V aq V org
0.18 0.11 0.07 8.7 11.0 2.30 0.27 0.77 44.01 2.84
0.40 0.24 0.15 8.5 11.3 2.20 0.27 0.84 48.97 3.09
0.56 0.33 0.22 8.3 11.5 2.00 0.32 0.95 50.05 3.00
0.88 0.48 0.36 8.3 11.9 1.90 0.31 1.08 52.96 3.51
1.24 0.64 0.46 7.9 12.0 1.88 0.33 1.11 56.68 3.37
2.23 0.90 1.06 6.4 13.6 1.75 0.52 2.50 72.60 4.80
3.26 1.22 1.41 3.3 16.6 1.65 0.75 5.78 86.63 7.70
%E SConcentration of lactic acid (M) Volume (ml)
pH Dw D
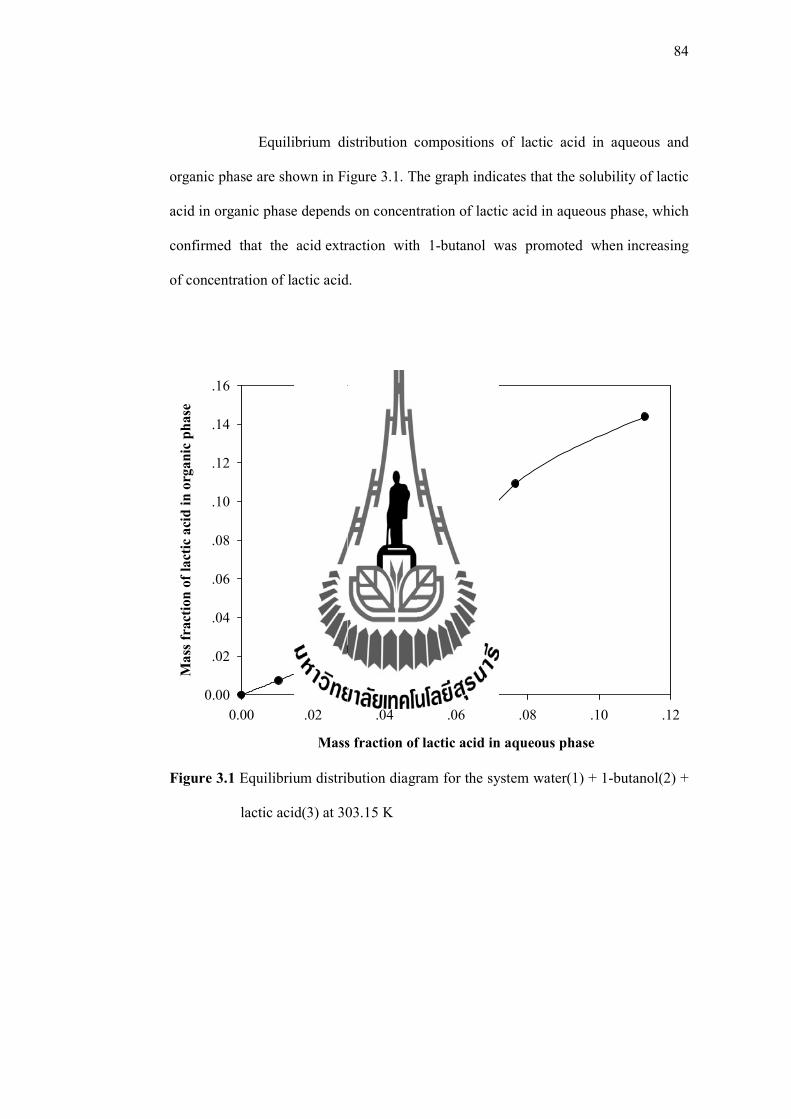
84
Equilibrium distribution compositions of lactic acid in aqueous and
organic phase are shown in Figure 3.1. The graph indicates that the solubility of lactic
acid in organic phase depends on concentration of lactic acid in aqueous phase, which
confirmed that the acid extraction with 1-butanol was promoted when increasing
of concentration of lactic acid.
Figure 3.1 Equilibrium distribution diagram for the system water(1) + 1-butanol(2) +
lactic acid(3) at 303.15 K
Mass fraction of lactic acid in aqueous phase
0.00 .02 .04 .06 .08 .10 .12
Ma
ss f
ract
ion
of
lact
ic a
cid
in
org
an
ic p
has
e
0.00
.02
.04
.06
.08
.10
.12
.14
.16
85
3.5.2 Correlation model
The UNIQUAC model was used to correlate the experimental LLE data
of the system water(1) + 1-butanol(2) + lactic acid(3) at 303.15 K. The adjustable
parameters have been estimated by minimizing the differences between the
experimental and calculated mass fractions of the components for all tie-lines, using
the objective function (OF) expressed in Eq. 2.28. In the present work, the binary
interaction parameters in the UNIQUAC model for the binary water+1-butanol
system was taken from Winkelman et al. (2009). These values are given in Table 3.3.
Therefore, this work has been using the values of binary water-1-butanol parameters
(a12 and a21) to estimate the values of water-lactic acid and 1-butanol-lactic acid
parameters. Fitted values of water-lactic acid and 1-butanol-lactic acid interaction
parameters are listed in Table 3.3. The tie-lines have been presented in Figure 3.2. It
can be seen that result is in good agreement between experimental and calculated data
with the OF of 0.0024 and %∆w of about 0.40%.
In addition, all adjustable binary interaction parameters in the
UNIQUAC model are investigated. The binary interaction parameters are shown in
Table 3.4, the tie lines were plotted and are presented in Figure 3.3. It can be seen that
the result is a good agreement between experimental and calculated data with the OF
of 0.0014 and %∆w of about 0.34%. However, it should be noted that the OF and
%∆w in this case are less than that the values with minimized by fixed a12 and a21 and
the all binary interaction parameters are significantly different from the parameters in
Table 3.3. Of course, the fact that these parameters are changed as a result of
changing the a12 and a21. In previous cases, both values are referred from the binary
LLE system of water and 1-butanol. While both values in this case are calculated

86
taking into account the effect of all components in the system. It is known that lactic
acid is miscible in both aqueous and organic phases, which the miscibility of lactic
acid may have a slight effect on the interaction between water and 1-butanol. This
reason is confirmed as seen that the a12 and a21 was slightly changed. As a result, the
other binary interaction parameters are changed.
Table 3.3 The binary interaction parameters and the objective function for water(1) +
1-butanol(2) + lactic acid(3) system at 303.15 K in this work
Remark: a12 and a21 from UNIQUAC model of the system water(1)+1-butanol(2)
(Winkelman et al., 2009)
Table 3.4 All adjusted of the binary interaction parameters and the objective function
for water(1) + 1-butanol(2) + lactic acid(3) system at 303.15 K in this work
In addition, the present work has a reported the correlated model of this
system at 298.20 K with NRTL model (Domingues et al., 2013). The binary
interaction parameters of NRTL model are shown in Table 3.5. It was observed that
i j a ij (K) a ji (K) OF %∆ w
1 2 192.60 81.68
1 3 397.18 615.44 0.0024 0.4022
2 3 402.66 6244.73
i j a ij (K) a ji (K) OF %∆ w
1 2 135.47 173.10
1 3 335.95 5251.91 0.0014 0.3417
2 3 383.43 14771.60
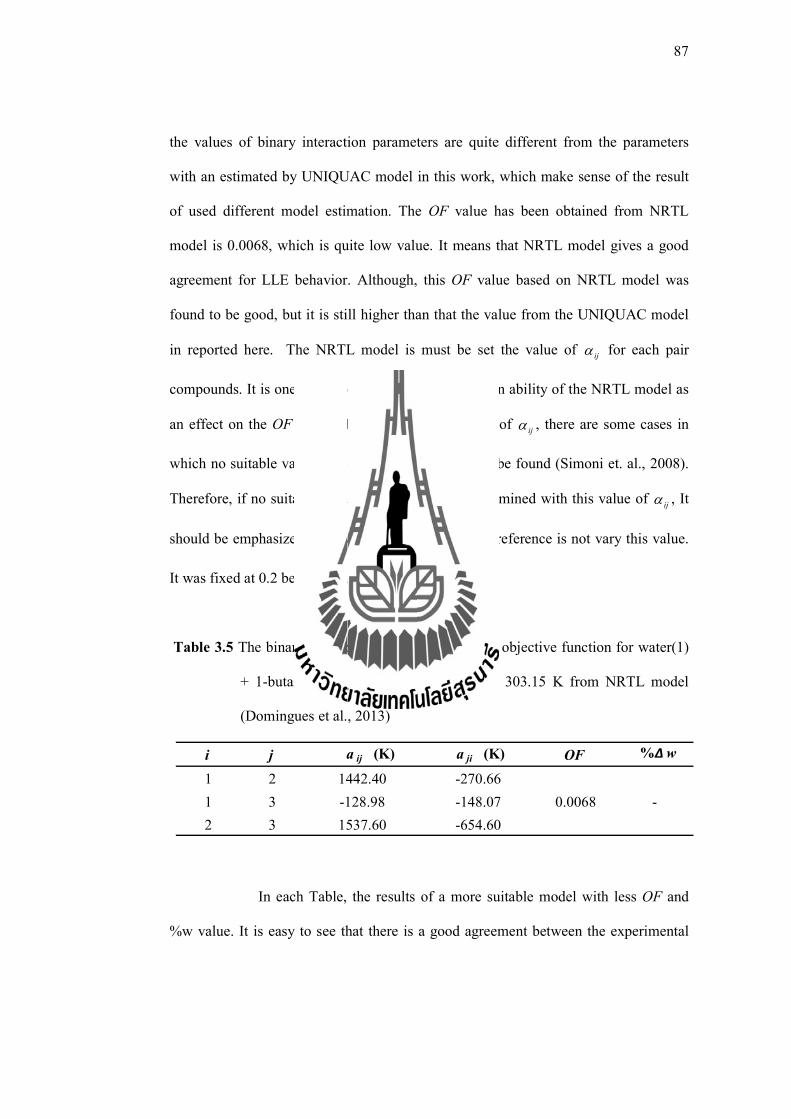
87
the values of binary interaction parameters are quite different from the parameters
with an estimated by UNIQUAC model in this work, which make sense of the result
of used different model estimation. The OF value has been obtained from NRTL
model is 0.0068, which is quite low value. It means that NRTL model gives a good
agreement for LLE behavior. Although, this OF value based on NRTL model was
found to be good, but it is still higher than that the value from the UNIQUAC model
in reported here. The NRTL model is must be set the value of ij for each pair
compounds. It is one of important factor that affects on ability of the NRTL model as
an effect on the OF value. However, with this value of ij , there are some cases in
which no suitable value of the binary parameters can be found (Simoni et. al., 2008).
Therefore, if no suitable parameter solutions are determined with this value of ij , It
should be emphasized that by varying ij , while this reference is not vary this value.
It was fixed at 0.2 between each pair of compounds.
Table 3.5 The binary interaction parameters and the objective function for water(1)
+ 1-butanol(2) + lactic acid(3) system at 303.15 K from NRTL model
(Domingues et al., 2013)
In each Table, the results of a more suitable model with less OF and
%w value. It is easy to see that there is a good agreement between the experimental
i j a ij (K) a ji (K) OF %∆ w
1 2 1442.40 -270.66
1 3 -128.98 -148.07 0.0068 -
2 3 1537.60 -654.60
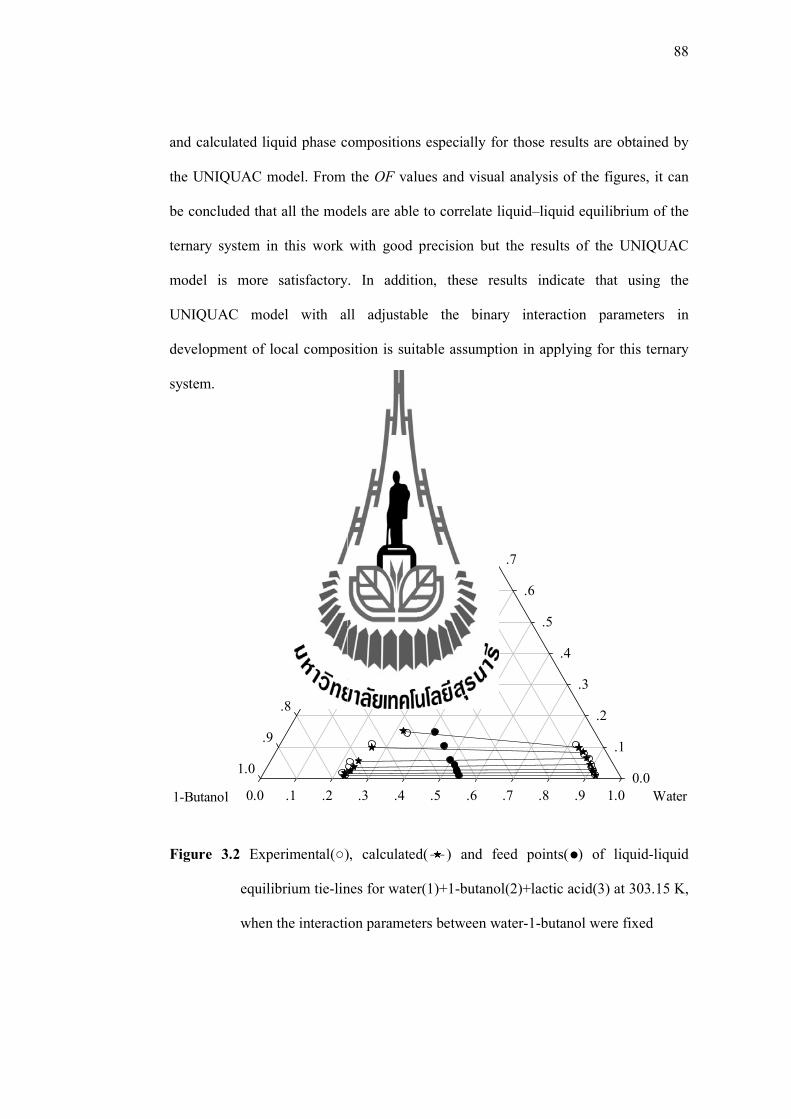
88
and calculated liquid phase compositions especially for those results are obtained by
the UNIQUAC model. From the OF values and visual analysis of the figures, it can
be concluded that all the models are able to correlate liquid–liquid equilibrium of the
ternary system in this work with good precision but the results of the UNIQUAC
model is more satisfactory. In addition, these results indicate that using the
UNIQUAC model with all adjustable the binary interaction parameters in
development of local composition is suitable assumption in applying for this ternary
system.
Figure 3.2 Experimental(○), calculated( ) and feed points( ) of liquid-liquid
equilibrium tie-lines for water(1)+1-butanol(2)+lactic acid(3) at 303.15 K,
when the interaction parameters between water-1-butanol were fixed
Water0.0 .1 .2 .3 .4 .5 .6 .7 .8 .9 1.0
Lactic acid
0.0
.1
.2
.3
.4
.5
.6
.7
.8
.9
1.0
1-Butanol
0.0
.1
.2
.3
.4
.5
.6
.7
.8
.9
1.0
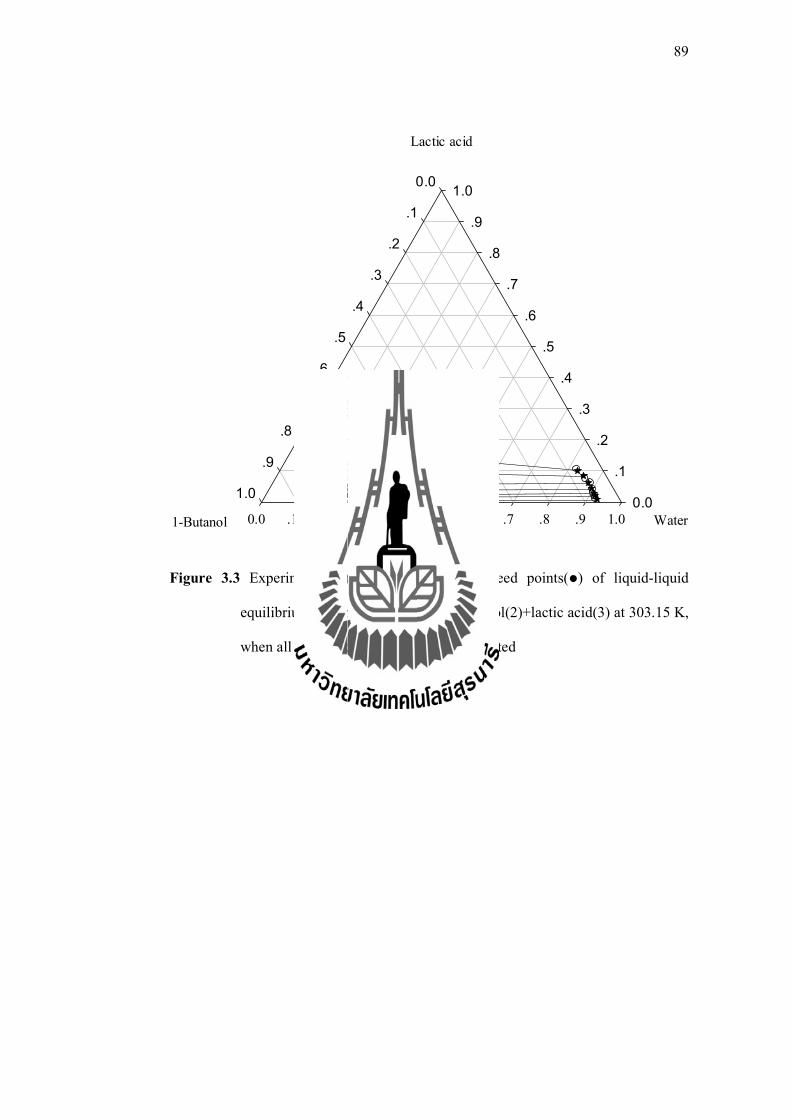
89
Figure 3.3 Experimental(○), calculated( ) and feed points( ) of liquid-liquid
equilibrium tie-lines for water(1)+1-butanol(2)+lactic acid(3) at 303.15 K,
when all interaction parameters were adjusted
Water0.0 .1 .2 .3 .4 .5 .6 .7 .8 .9 1.0
Lactic acid
0.0
.1
.2
.3
.4
.5
.6
.7
.8
.9
1.0
1-Butanol
0.0
.1
.2
.3
.4
.5
.6
.7
.8
.9
1.0
90
3.6 Conclusion
The LLE data of the ternary mixtures, water + 1-butanol + lactic acid was
presented at 303.15 K. The separation factor and distribution coefficient in this work
were calculated. The results show that 1-butanol is less soluble in organic phase as
compared to the aqueous phase, but miscible with lactic acid. In separation of lactic
acid, the experimental results indicate the 1-butanol is suitable separating agents for
lactic acid removal from water. The distribution coefficient and degree of extraction
was also enhanced by increasing lactic acid concentration in the aqueous phase.
However, since 1-butanol is partially miscible in water, proper organic-to-aqueous
volume ratio must be used in order to avoid the incorporation between both phases,
which might lead to an efficiency of solvent in the extraction.
In correlation model, the UNIQUAC model was used to calculate the phase
compositions of the mixtures. The corresponding optimized binary interaction
parameters were also calculated. It was observed that the UNIQUAC give a
satisfactory description of LLE data obtained in this work.
91
3.7 References
Yankov, D., Molinier, J., Albet, J., Malmary, G., and Kyuchoukov, G. (2004). Lactic
acid extraction from aqueous solution with tri-n-octylamine dissolved in
decanol and dodecane. Biochemical Engineering Journal. 21: 63-71.
Duke, M. C., Limb, A., da Luz, S. C., and Nielsen, L. (2008). Lactic acid enrichment
with inorganic nanofiltration and molecular sieving membranes by
pervaporation. Food Bioprod. Process. 86: 290–295.
Geanta, R. M., Ruiz, M. O., and Escudero, I. (2013). Micellar-enhanced
ultrafilteration for the recovery of lactic acid and citric acid from beet
molasses with sodium dodecyl sulphate. J. Membrane Sci. 430: 11-13.
Juang, R. S., and H, R. H. (1997). Equilibrium studies on reactive extraction of lactic
acid with amine extractant. The Chemical Engineering Journal. 65: 47-53
Kahya, E., Bayraktar, E., and Mehmetoglu, Ü. (2001). Optimization of Process
Parameters for Reactive Lactic Acid Extraction. Turkish Journal of
Chemistry. 25: 223-230.
Kertes, A. S. and King, C. J. (1986). Extraction chemistry of fermentation product
carboxylic acids. Biotechnology and Bioengineering. 28: 269-282.
Tamada, J. A., Kertes, A. S., and King, C. J.(1990). Extraction of carboxylic acids
with amine extractants, 3.Effect of Temperature, Water Coextraction, and
Process Considerations. Industrial Engineering and Chemistry Resources.
29: 333-1338.
Yang, S. T., White, S. A. and Hsu, S. T. (1991). Extraction of carboxylic acid with
tertiary and quaternary amines: Effect of pH. Ind. Eng. Chem. Res. 30: 1335-
1342.
92
Weiser, R. B., and Geankoplis, C. J. (1955). Lactic Acid Purification by Extraction.
Ind. Eng. Chem. 47: 858-863.
Petritis, V. E., and Geankoplis, C. J. (1959). Phase Equilibria in 1-Butanol-Water-
Lactic Acid System. J. Chem. Eng. Data. 4(3): 197-198.
Chawong, K., and Rattanaphanee, P. (2011). n-Butanol as an extractant for lactic acid
recovery. World Acad. Sci. Eng. Tech. 56: 1437-1440.
Domingues, L., Cussolin, P. A., da Silva Jr, J. L., de Oliveira, L. H., and Aznar, M.
(2013). Liquid-liquid equilibrium data for ternary systems of water + lactic
acid + C4-C7 alcohols at 298.20 K and atmospheric pressure. Fluid Phase
Equilibria. 354: 12-18.
Gilani, H. G., and Asan, Sh. (2013). Liquid–liquid equilibrium data for systems
containing of formic acid, water, and primary normal alcohols at T = 298.2 K.
Fluid Phase Equlibria. 354: 24-28.
Kailas, L., Wasewar, Amit, K., and Seema. (2010). Physical extraction of propionic
acid. IJRRAS. 3(3): 290-302.
Abrams, D. S., and Prausnitz, J. M. (1975). Statistical thermodynamics of liquid
mixtures. New expression for the excess Gibbs energy of partly or completely
miscible systems. AIChE Journal. 21(1): 116-28.
Renon, H., and Prausnitz, J. M. (1968). Local compositions in thermodynamic excess
functions for liquid Mixtures. American Institute of Chemical Engineers
Journal. 14: 135-144.
Walas, S. M. (1985). Phase equilibriumin chemical engineering. Butterworth. Boston
93
Patricia, D., María, T. S., and Sagrario, B. (2007). Isobaric vapor–liquid equilibria for
the quaternary reactive system: Ethanol + water + ethyl lactate + lactic acid at
101.33 kPa. Fluid Phase Equilibria. 255(1): 17-23.
Winkelmam, J. G. M., Kraai, G. N., and Heeres, H. J. (2009). Binary, ternary and
quaternary liquid–liquid equilibria in 1-butanol, oleic acid, water and n-
heptane mixtures. Fluid Phase Equilibria. 284:71-79.
Simoni, L. D., Lin, Y., Brennecke, J. F., and Stadtherr, M. A. (2008). Modeling
liquid-liquid equilibrium of ionic liquid system with NRTL, Electrolyte-NRTL
and UNIQUAC. Ind. Eng. Chem. Res. 47: 256-272.
CHAPTER IV
EFFECT OF INORGANIC SALTS ON EXTRACTION OF
LACTIC ACID WITH 1-BUTANOL
4.1 Abstract
Extraction of lactic acid from its aqueous solution using 1-butanol containing
inorganic salt at constant temperature of 303.15 K was studied. The effect of changing
process variables of salt type and concentration on extraction efficiency was
investigated. Four inorganic salts, i.e. NaCl, Na2SO4, NH4Cl and (NH4)2SO4 were
used. Efficiency of extraction was represented by value of the distribution coefficient
of lactic acid in each system. The result was compared with salt-free system of the
same extracting conditions. Salting-in and salting-out effects were clearly observed
for all the salts within the studied concentration. When the salt concentration was
sufficiently high, the distribution coefficient and degree of extraction increased with
increasing salt concentration. Among these four salts, Na2SO4 demonstrated the
highest distribution coefficient of lactic acid extraction using 1-butanol. It is
concluded that the salt enhanced the heterogeneity of the system in a way that
favoured the extraction of lactic acid from its aqueous solution using 1-butanol.
95
4.2 Introduction
Liquid-liquid extraction by a suitable organic solvent that gives high
distribution coefficient has been found to be a promising method for lactic acid
recovery. This process has the advantage that lactic acid can be removed easily from
aqueous solution. This technique depends greatly upon how solute distributes between
the aqueous and organic phase, which in Chapter III found that 1-butanol is partially
miscible in water, consequently, lead to incomplete solvent recovery after the
operation. Various means for altering the distribution is desirable way exists, but one
of the most commonly used nowadays is salting effect. The presence of salt may
influence the phase equilibrium behavior of a mixture significantly. This phenomena
is often referred to as salting in and salting out effect. This phenomena is often
referred to as salting in and salting out effect. The application of the salt effect in
extraction is important to alter miscibility gabs to change the distribution coefficient..
Addition of inorganic salts in an aqueous solution of an organic acid can result in
either decrease or increase in the solubility of the solute in the solution (Ghalami-
Choobar et al, 2011). In addition, inorganic salts were found to influence distribution
characteristic of other solutes between the partial miscible phases in the system.
Several researchers in the past have worked on this liquid-liquid extraction
system. But few of them have worked on the salt effect on liquid-liquid extraction
system. It is observed that the use of salt has proven to be advantageous, although a
relative few significant advances and developments in this field are reported at
experimental level. Tan and Aravinth (1999) studied effects of sodium chloride
(NaCl) and potassium chloride (KCl) on liquid-liquid equilibrium of water+acetic
acid+1-butanol system at different temperatures. NaCl and KCl were experimentally
96
shown to be effective in modifying the liquid–liquid equilibrium LLE in favour of the
solvent extraction of acetic acid from an aqueous solution with 1-butanol, particularly
at high salt concentrations. Both the salts enlarged the area of the two-phase region
decreased the mutual solubilitys of water and marginally decreased the concentrations
of 1-butanol and acetic acid in the aqueous phase while significantly increased the
concentrations of the same components in the organic phase.
Vakili-Nezhaad et al. (2004) and Roy et al. (2007) investigated effect of
electrolytes on the LLE for the ternary systems. The report showed that the
electrolytes studies in this work, i.e., NaCl and KCl significantly affected the
solubility of propionic acid (PA) in the organic solvents (isopropyl methyl ketone and
isobutyl methyl ketone) used in systems. Distribution coefficient of PA and the
selectivity of the solvents in extracting PA, increased in presence of electrolytes in the
systems. For extraction of lactic acid, Chawong and Rattanaphanee (2012) studied
effect of chloride salts: NaCl, MgCl2 and CaCl2 on extraction of lactic acid from its
aqueous solution. It was observed that, when the salt concentration was sufficiently
high, the distribution coefficient increased with increasing salt concentration.
This Chapter therefore, aims to investigate the extraction of lactic acid from its
aqueous solution using 1-butanol when different inorganic salts were added. Effects
of salt type and concentration on the distribution coefficient of the acid in these
systems were studied.

97
4.3 Theory
Separation processes in which two immiscible or partially soluble liquid
phases are brought into contact for the transfer of one or more components are
referred to as liquid-liquid extraction or solvent extraction. The processes taking place
are primarily physical, since the solutes being transferred are ordinarily recovered
without chemical change. On the other hand the physical equilibrium relationships on
which such operations are based depends mainly on the chemical characteristics of the
solutes and solvents. Thus, use of a solvent that chemically resembles one component
of a mixture more than the other components will lead to concentration of that
component in the solvent phase, with the exclusion from that phase of dissimilar
components.
Extraction is distribution of a solute between two liquids that must not be
completely mutually miscible. This method makes use of an organic compound
capable of extracting the solute of interest, or a complex of it, from the aqueous phase
into an immiscible organic solution. It consists in separation of one or several
substances (solute) present in liquid phase by contact with another liquid phase
(solvent). The extraction is governed by distribution law with states that at
equilibrium, a given solute will always be distributed between two essentially
immiscible liquids in the same proportion. Equilibrium is established when the
chemical potential (free energy) of the solute in the two phases is equal. The
distribution coefficient is a reflection of the relative solubilities of the solute in the
two phases.
98
For extraction of lactic acid in aqueous solution with 1-butanol, most of lactic
acid will be transfer to 1-butanol. Lactic acid must exist in the same form in both
phases and if there is no complex form between lactic acid and organic solvent, a
solute’s partitioning between two phases is described by the distribution coefficient
(D) and Efficiency of lactic acid extraction is represented by the degree of extraction
(%E). These values were calculated as follows Eq. (3.18) and (3.7), respectively.
99
4.4 Experimental procedure
4.4.1 Chemicals
Lactic acid with concentration of 88 %wt and 1-butanol with 99.9%
purity were purchased from Acros. Ammonium sulfate ((NH4)2SO4), sodium sulfate
(Na2SO4), ammonium Chloride (NH4Cl) and sodium chloride (NaCl) were obtain
from CARLO ERBA and deionized water was used in the experiments.
4.4.2 Preparation of Lactic Acid Aqueous Solution
Aqueous lactic acid solution was prepared by dissolving lactic acid
solution in deionized water until the desired concentration (1 M of lactic acid).
Inorganic salts (NaCl, Na2SO4, NH4Cl and (NH4)2SO4) with quantities in range of 1 to
3 g were added into 10 ml lactic acid solution.
4.4.3 Extraction of Lactic Acid
1-Butanol was used as a single solvent for extraction of lactic acid in
this study. Equal volumes (10 ml each) of aqueous and organic phase were then
mixed in 125 ml of Erlenmeyer flask and shaken with 90 rpm at a constant
temperature of 30°C in temperature-controlled shaking bath for 12 h and settling for
12 h for a complete phase separation. After the phase separation, pH and volume of
the aqueous phase were measured. Samples of the top and bottom phase were taken
for analysis.
4.4.4 Method for Analysis of Salt
In the system contain of lactic acid, salt content in the aqueous and
organic phase were determined by using rotary evaporator R-210/R-215. About 10 ml
of sample was charged into the flask, which was then attached to the rotary
evaporator. Evaporation temperature was controlled at 130°C. Pressure for

100
evaporation was initially at atmostpheric value before it was graduately decreased at a
rate of 5 mmHg per min until all the liquid was removed.
Water and 1-butanol concentration was analyzed by GC method (details
described in Chapter II). Lactic acid concentration was determined by HPLC (details
described in Chapter III) and salt content was determined by rotary evaporator.
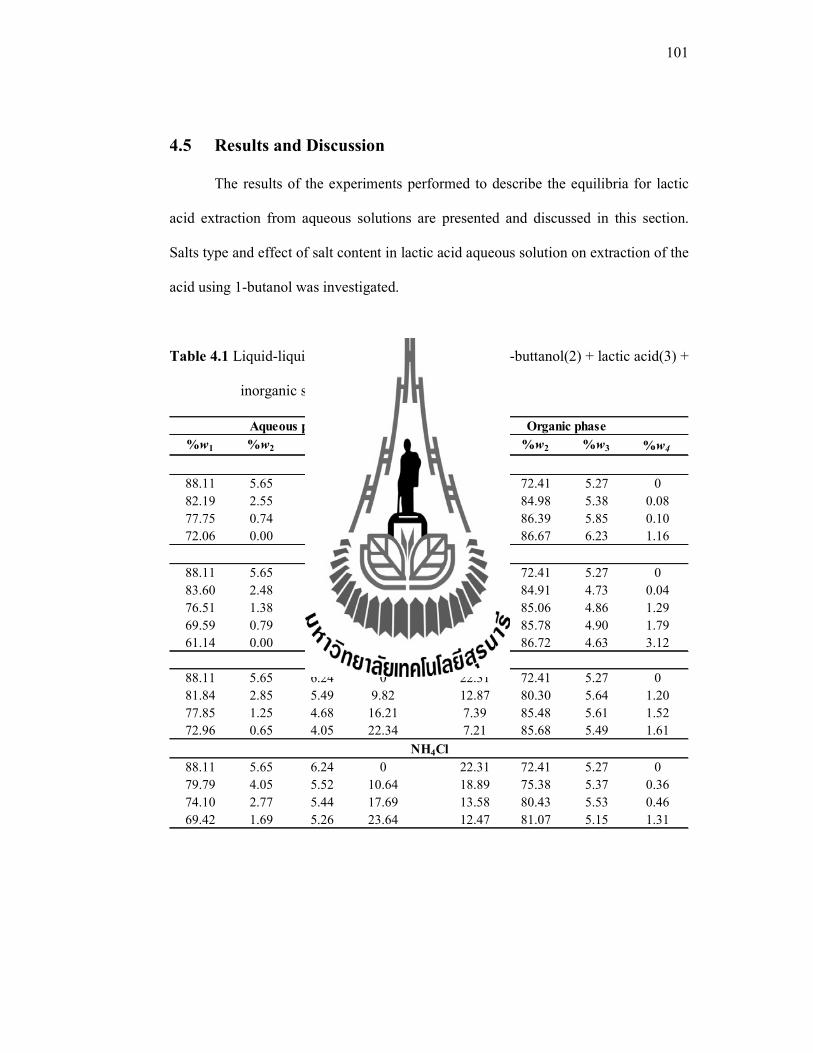
101
4.5 Results and Discussion
The results of the experiments performed to describe the equilibria for lactic
acid extraction from aqueous solutions are presented and discussed in this section.
Salts type and effect of salt content in lactic acid aqueous solution on extraction of the
acid using 1-butanol was investigated.
Table 4.1 Liquid-liquid equilibrium data of water(1) + 1-buttanol(2) + lactic acid(3) +
inorganic salt(4) system at 303.15 K
%w1 %w2 %w3 %w4 %w1 %w2 %w3 %w4
88.11 5.65 6.24 0 22.31 72.41 5.27 0
82.19 2.55 4.67 10.59 9.56 84.98 5.38 0.08
77.75 0.74 3.48 18.03 7.67 86.39 5.85 0.10
72.06 0.00 2.45 25.49 5.95 86.67 6.23 1.16
88.11 5.65 6.24 0 22.31 72.41 5.27 0
83.60 2.48 4.28 9.64 10.32 84.91 4.73 0.04
76.51 1.38 3.77 18.34 8.79 85.06 4.86 1.29
69.59 0.79 3.46 26.17 7.53 85.78 4.90 1.79
61.14 0.00 2.82 36.04 5.53 86.72 4.63 3.12
88.11 5.65 6.24 0 22.31 72.41 5.27 0
81.84 2.85 5.49 9.82 12.87 80.30 5.64 1.20
77.85 1.25 4.68 16.21 7.39 85.48 5.61 1.52
72.96 0.65 4.05 22.34 7.21 85.68 5.49 1.61
88.11 5.65 6.24 0 22.31 72.41 5.27 0
79.79 4.05 5.52 10.64 18.89 75.38 5.37 0.36
74.10 2.77 5.44 17.69 13.58 80.43 5.53 0.46
69.42 1.69 5.26 23.64 12.47 81.07 5.15 1.31
Aqueous phase Organic phase
Na2SO4
(NH4)2SO4
NaCl
NH4Cl
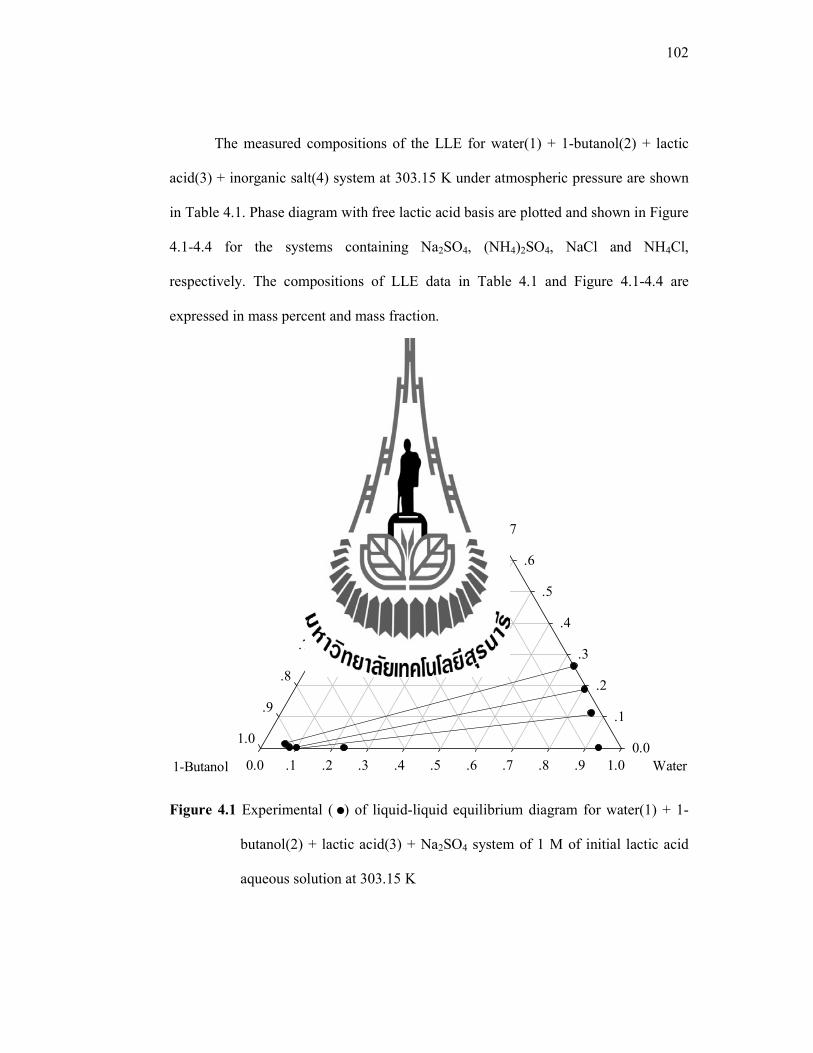
102
The measured compositions of the LLE for water(1) + 1-butanol(2) + lactic
acid(3) + inorganic salt(4) system at 303.15 K under atmospheric pressure are shown
in Table 4.1. Phase diagram with free lactic acid basis are plotted and shown in Figure
4.1-4.4 for the systems containing Na2SO4, (NH4)2SO4, NaCl and NH4Cl,
respectively. The compositions of LLE data in Table 4.1 and Figure 4.1-4.4 are
expressed in mass percent and mass fraction.
Figure 4.1 Experimental ( ) of liquid-liquid equilibrium diagram for water(1) + 1-
butanol(2) + lactic acid(3) + Na2SO4 system of 1 M of initial lactic acid
aqueous solution at 303.15 K
Water0.0 .1 .2 .3 .4 .5 .6 .7 .8 .9 1.0
Na2SO4
0.0
.1
.2
.3
.4
.5
.6
.7
.8
.9
1.0
1-Butanol
0.0
.1
.2
.3
.4
.5
.6
.7
.8
.9
1.0
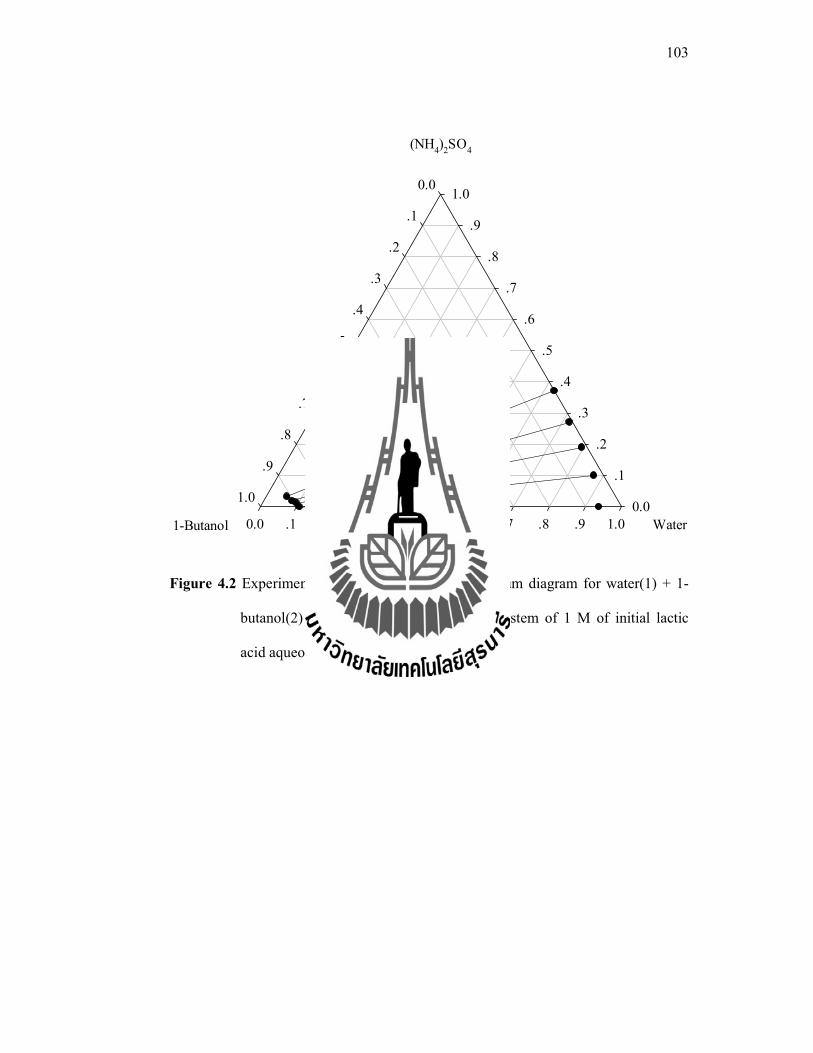
103
Figure 4.2 Experimental ( ) of liquid-liquid equilibrium diagram for water(1) + 1-
butanol(2) + lactic acid(3) + (NH4)2SO4 system of 1 M of initial lactic
acid aqueous solution at 303.15 K
Water0.0 .1 .2 .3 .4 .5 .6 .7 .8 .9 1.0
(NH4)
2SO
4
0.0
.1
.2
.3
.4
.5
.6
.7
.8
.9
1.0
1-Butanol
0.0
.1
.2
.3
.4
.5
.6
.7
.8
.9
1.0
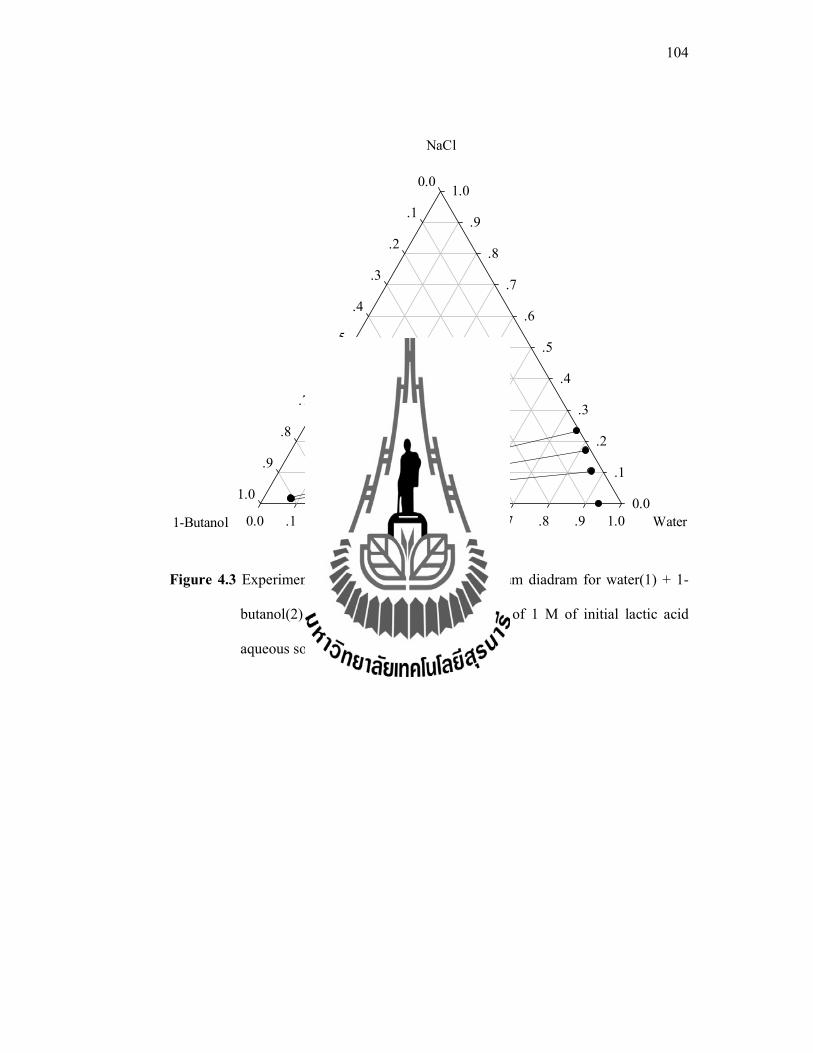
104
Figure 4.3 Experimental ( ) of liquid-liquid equilibrium diadram for water(1) + 1-
butanol(2) + lactic acid(3) + NaCl system of 1 M of initial lactic acid
aqueous solution at 303.15 K
Water0.0 .1 .2 .3 .4 .5 .6 .7 .8 .9 1.0
NaCl
0.0
.1
.2
.3
.4
.5
.6
.7
.8
.9
1.0
1-Butanol
0.0
.1
.2
.3
.4
.5
.6
.7
.8
.9
1.0
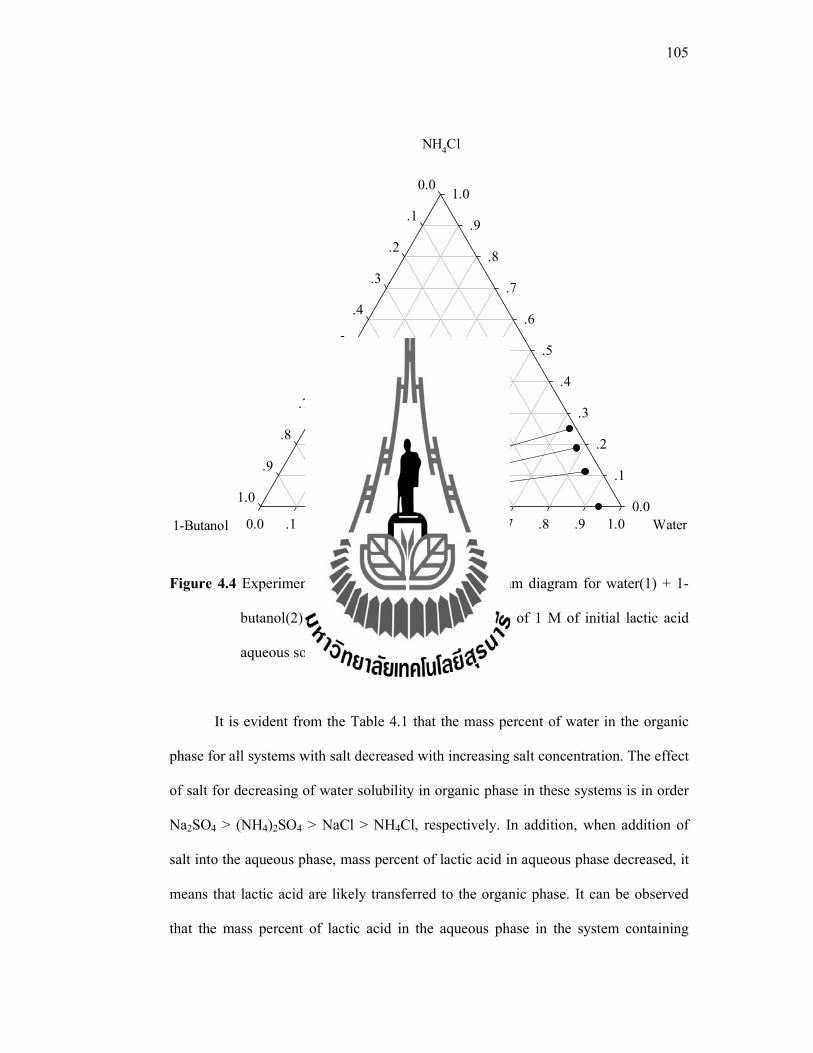
105
Figure 4.4 Experimental ( ) of liquid-liquid equilibrium diagram for water(1) + 1-
butanol(2) + lactic acid(3) + NH4Cl system of 1 M of initial lactic acid
aqueous solution at 303.15 K
It is evident from the Table 4.1 that the mass percent of water in the organic
phase for all systems with salt decreased with increasing salt concentration. The effect
of salt for decreasing of water solubility in organic phase in these systems is in order
Na2SO4 > (NH4)2SO4 > NaCl > NH4Cl, respectively. In addition, when addition of
salt into the aqueous phase, mass percent of lactic acid in aqueous phase decreased, it
means that lactic acid are likely transferred to the organic phase. It can be observed
that the mass percent of lactic acid in the aqueous phase in the system containing
Water0.0 .1 .2 .3 .4 .5 .6 .7 .8 .9 1.0
NH4Cl
0.0
.1
.2
.3
.4
.5
.6
.7
.8
.9
1.0
1-Butanol
0.0
.1
.2
.3
.4
.5
.6
.7
.8
.9
1.0
106
Na2SO4 decreased more than the system with (NH4)2SO4, NaCl and NH4Cl,
respectively. Amount of salt in the organic phase for its application on extraction of
lactic acid could be considered because it is important for separation of lactic acid
from the organic phase in the future. Figure 4.1-4.4, it should be noted that mass
fractions of all salts in organic phase are likely small values. Thus, it is quite sensible
to use the application of salt on extraction of lactic acid.
It is known that addition of a salt in a solvent mixture can significantly change
two-phase equilibrium. Specifically, addition of salt to an aqueous solution can result
in either decrease (salting-out) or increase (salting-in) in the solubility of the solute in
the solution. In addition to the behavior of a particular solute in aqueous solution,
ability to induce salting-in and salting-out of a solute in aqueous solution depends on
type and concentration of the salts as well as the ions presenting in the solution after
ionization of the salts.
The effectiveness of extraction of lactic acid by 1-butanol in the system
containing inorganic salt is given by its separation factor, which is a measure of the
ability of 1-butanol to separate the lactic acid from the aqueous acid solution
containing salt. The separation factors (S) were calculated as follows:
w s
DS
D D
(4.1)
where Ds is the distribution coefficient of salt, which is defined as follows:
107
orgorg
s
aqaq
Salt VD
Salt V (4.2)
where [Salt]org and [Salt]aq are the equilibrium concentration of salt in the
organic and aqueous phase, respectively. The results show that the separation factor
obtained in this is than 1 for the system reported here, which means that extraction of
lactic acid by 1-butanol in these system is possible. However, it was found that the
separation factor values at the same initial salt concentration of Na2SO4 system are
likely higher than (NH4)2SO4, NaCl and NH4Cl, respectively were the distribution
coefficient values of water and salt are slightly different. Therefore, the separation
factor depends on the distribution coefficient of lactic acid. If high separation factor
means mainly of lactic acid is transferred from the aqueous phase to organic phase.
Efficiency of lactic acid extraction was represented by the distribution
coefficient and degree of extraction as shown in Table 4.2. The extraction without salt
was used as a controlled experiment in order to reveal the effect of salt on the process
performance. A higher degree of extraction means that more lactic acid is transferred
from the aqueous phase to the organic phase, which implies a successful forward
extraction.
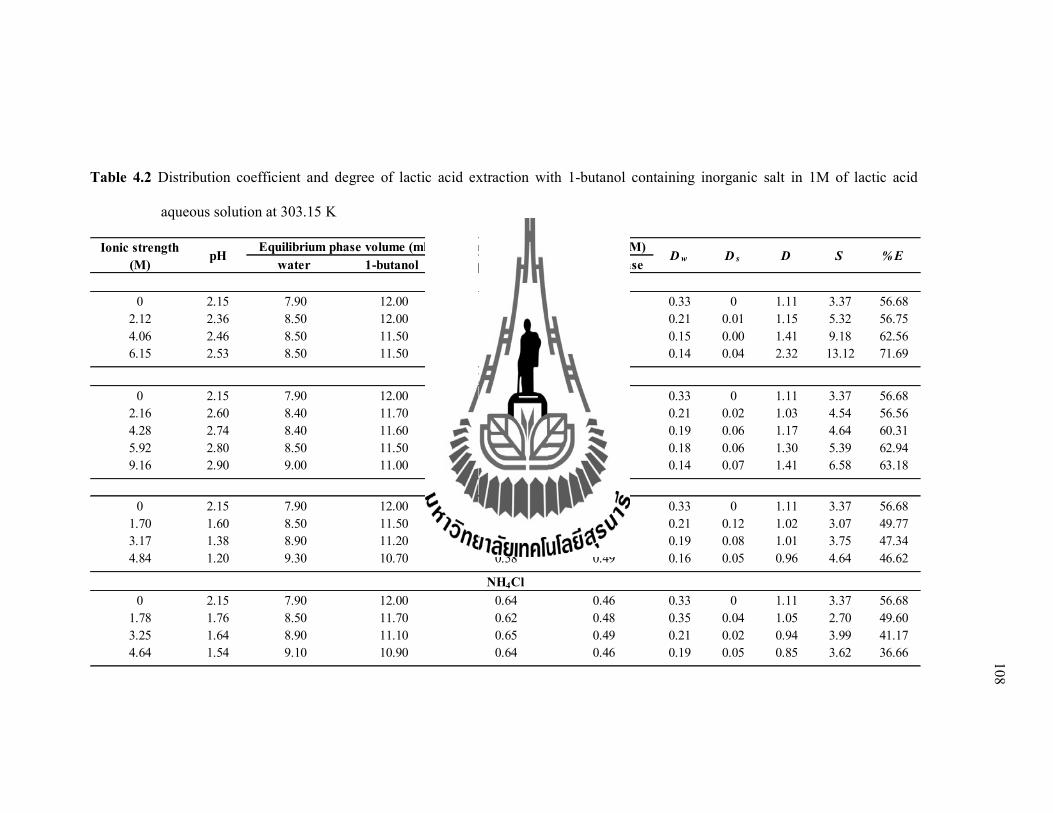
111
108
Table 4.2 Distribution coefficient and degree of lactic acid extraction with 1-butanol containing inorganic salt in 1M of lactic acid
aqueous solution at 303.15 K
Ionic strength
(M) water 1-butanol Aqueous phase organic phase
0 2.15 7.90 12.00 0.64 0.46 0.33 0 1.11 3.37 56.68
2.12 2.36 8.50 12.00 0.57 0.47 0.21 0.01 1.15 5.32 56.75
4.06 2.46 8.50 11.50 0.48 0.50 0.15 0.00 1.41 9.18 62.56
6.15 2.53 8.50 11.50 0.37 0.60 0.14 0.04 2.32 13.12 71.69
0 2.15 7.90 12.00 0.64 0.46 0.33 0 1.11 3.37 56.68
2.16 2.60 8.40 11.70 0.56 0.41 0.21 0.02 1.03 4.54 56.56
4.28 2.74 8.40 11.60 0.48 0.41 0.19 0.06 1.17 4.64 60.31
5.92 2.80 8.50 11.50 0.42 0.41 0.18 0.06 1.30 5.39 62.94
9.16 2.90 9.00 11.00 0.36 0.42 0.14 0.07 1.41 6.58 63.18
0 2.15 7.90 12.00 0.64 0.46 0.33 0 1.11 3.37 56.68
1.70 1.60 8.50 11.50 0.65 0.49 0.21 0.12 1.02 3.07 49.77
3.17 1.38 8.90 11.20 0.62 0.50 0.19 0.08 1.01 3.75 47.34
4.84 1.20 9.30 10.70 0.58 0.49 0.16 0.05 0.96 4.64 46.62
0 2.15 7.90 12.00 0.64 0.46 0.33 0 1.11 3.37 56.68
1.78 1.76 8.50 11.70 0.62 0.48 0.35 0.04 1.05 2.70 49.60
3.25 1.64 8.90 11.10 0.65 0.49 0.21 0.02 0.94 3.99 41.17
4.64 1.54 9.10 10.90 0.64 0.46 0.19 0.05 0.85 3.62 36.66
NH4Cl
Ds S %E
Na2SO4
(NH4)2SO4
NaCl
pHEquilibrium phase volume (ml) Concentration of lactic acid (M)
Dw D
109
For extraction of lactic acid using 1-butanol in presence of Na2SO4, it was
found that the distribution coefficient and degree of lactic acid extraction were
increased with concentration of Na2SO4 increasing and the effect of salt was more
significant at high the concentration of the salt. It can be explained that salt ions
solvated water in aqueous solution. Water was a preferred component for solvation. In
hydration theory, it was assumed that each salt ion binding with water molecules as a
shell of oriented water dipoles surrounding the ion. This “bound” water was then
unavailable as solvent for the lactic acid. Therefore, the lactic acid tends to be less
soluble in water and finally transfer to the organic phase. As the added mass of
Na2SO4 increased, more water molecules are bound to its ions, which led to the
increased of the distribution coefficient and degree of lactic acid extraction. It means
that Na2SO4 showed the salting-out effect of lactic acid extraction.
For case of extraction in a presence of (NH4)2SO4, the system with (NH4)2SO4
induces a salting-in effect with a magnitude dependent on the salt concentration. For
small amounts of (NH4)2SO4 was added, the distribution coefficient and degree of
lactic acid extraction were decreased, which signified that lactic acid preferred to be
in aqueous phase rather than the organic phase. The reason why salting-in effect
found in the system with a small amount of (NH4)2SO4 may be because of this salt
contain large monovalent ions (NH4+), which is small hydration number. So, when
small amounts dissolved in aqueous solution may less the ionic charges attracted to
the water molecules. Then, the higher the distribution coefficient and degree of lactic
acid extraction is, the higher concentration of (NH4)2SO4. This result verifies the
“salting-out” effect in the present system by adding suitable amount of (NH4)2SO4.
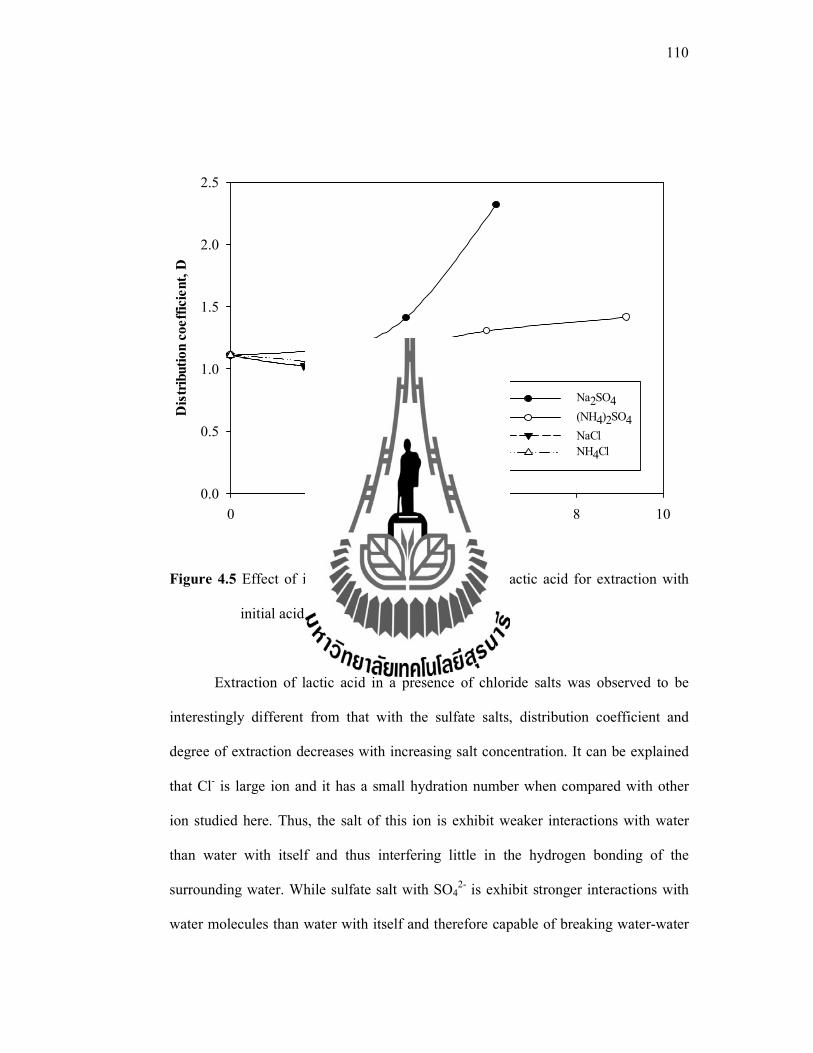
110
Figure 4.5 Effect of ionic strength on distribution of lactic acid for extraction with
initial acid concentration 1 M
Extraction of lactic acid in a presence of chloride salts was observed to be
interestingly different from that with the sulfate salts, distribution coefficient and
degree of extraction decreases with increasing salt concentration. It can be explained
that Cl- is large ion and it has a small hydration number when compared with other
ion studied here. Thus, the salt of this ion is exhibit weaker interactions with water
than water with itself and thus interfering little in the hydrogen bonding of the
surrounding water. While sulfate salt with SO42- is exhibit stronger interactions with
water molecules than water with itself and therefore capable of breaking water-water
Ionic strength (M)
0 2 4 6 8 10
Dis
trib
uti
on
coeff
icie
nt,
D
0.0
0.5
1.0
1.5
2.0
2.5
Na2SO4
(NH4)2SO4
NaCl
NH4Cl
111
hydrogen bonds (Santos et. al., 2010). As a result, when the addition of chloride salt,
lactic acid is likely surrounded by the salt counter ions (ions of opposite net charge)
and this screening results in decreasing electrostatic free energy of the lactic acid and
increasing activity of the water, which in turn, leads to increasing solubility of lactic
acid in aqueous solution (Debye and Hückel, 1923).
Salting-in and salting-out effect of each salt are more apparent when the
distribution coefficient was plotted against the ionic strength of aqueous solution in
each system. Figure 4.5 shows that Na2SO4 and (NH4)2SO4 pose similar effect on
lactic acid extraction using 1-butanol, i.e. values of the distribution coefficient and
degree of lactic acid extraction obtained from the system when equal amounts of these
salts were added are quite similar. However, the result indicates that Na2SO4 might be
more powerful to induce salting out of lactic acid since higher distribution coefficient
was achieved in the system with Na2SO4 than the system with (NH4)2SO4 of equal
ionic strength. Furthermore, the value of the distribution coefficient is in the order of
Na2SO4 > (NH4)2SO4 > NaCl > NH4Cl, which is the same arrangement of salts in
Hofmeister series as previously shown in Chapter II.
112
4.6 Conclusions
Extraction of lactic acid using 1-butanol with addition of inorganic salts was
studied. The results show that Na2SO4 was the most powerful in enhancing the
extraction of this acid under the experimental conditions used in this study. Ability of
the salts in increasing the distribution coefficient and degree of lactic acid extraction
is in the order of Na2SO4 > (NH4)2SO4 > NaCl > NH4Cl, which is the same
arrangement of these salts in Hofmeister series.
113
4.7 References
Ghalami-Choobar, B., Ghanadzadeh, A, and Kousarimehr, S. (2011). Salt effect on
the liquid-liquid equilibrium of (water + propionic acid + cyclohexanol)
system at T = (298.2, 303.2, and 305.2) K. Chin. J. Chem. Eng. 19(4): 565-
569.
Tan, T. C. and Aravinth, S. (1999). Liquid-liquid equilibria of water/acetic acid/1-
butanol system-effect of sodium (potassium) chloride and correlations. J.
Fluid Phase Equilibria. 163: 243-257.
Vakili-Nezhaad, G. R., Mohsen-Nia, M., Taghikhani, V., Behpoor, M., and
Aghahosseini, M. (2004). Salting-Out effect of NaCl and KCl on the ternay
LLE data for the systems of (water+propionic acid+isopropyl methyl ketone)
and of (water+propionic acid+isobuthyl methyl ketone). J. Chem.
Thermodynamics. 36: 341-348.
Chawong, K., and Rattanaphanee, P. (2012). Effect of chloride salt on extraction of
lactic acid with n-butanol. Engineering Transections. 15: 66-71.
Santos, A. P., Diehl, A., and Levin, Y. (2010). Surface tensions, surface potentials,
and the Hofmeister series of electrolyte solutions. Langmuir. 26: 10778-
10783.
Debye, P., and Hückel, E. (1923). The theory of electrolytes. I. Lowering of freezing
point and related phenomena. Physikalische Zeitschrift. 24: 185–206.
CHAPTER V
CONCLUSIONS AND RECOMMENDATION
5.1 CONCLUSIONS
5.1.1 The presence of inorganic salt changed mutual solubility upon solvent
in aqueous and organic phase, thus increase the heterogeneous zone of
the system.
5.1.2 Temperatures seem to pose a small effect on liquid-liquid equilibrium
behavior.
5.1.3 Distribution coefficient of lactic acid and selectivity of 1-butanol in
extraction of lactic acid increase with increasing of acid concentration.
5.1.4 Salting-in effect was observed in the system with NaCl and NH4Cl
where the distribution coefficient of lactic acid decreased with
increasing salt concentration.
5.1.5 Salting-out effect was observed in the system with Na2SO4 and (NH4)
2SO4 where the distribution coefficient of lactic acid increased with
increasing salt concentration.
5.1.6 Effect of salt increasing the distribution coefficient is in order:
Na2SO4 > (NH4)2SO4 > NaCl > NH4Cl, which is the same arrangement
of these salts in Hofmeister series.
115
5.1.7 The tie line data of water + 1-butanol + salt system and water +1-
butanol + lactic acid system were correlated using the modified
extended UNIQUAC and UNIQUAC model, respectively. Both models
appeared to accurately correlate the experimental data of each
concerning system.
5.2 Recommendation
Some recommendations for the future work are summarized as follows:
All the works in this thesis focus only on extraction of lactic acid from its
prepared aqueous solution. However, the actual future application of the
technique is aimed toward extraction of the acid from a fermentation broth
after it is biologically produced. It is concerned that other organics and
inorganic impurities in the fermentation broth might interfere with the acid
extraction and hinder the yield and purity of the acid product. As a result, it
should be worthwhile to extensively investigate the inorganic salt effect on
extraction of lactic acid from real fermentation broth using 1-butanol.
Stage extraction is more widely used in industry than a single batch extraction
due to its higher efficiency as well as smaller unit equipment and labor
operation required. Continuous or semi-continuous recovery of lactic acid
from aqueous solution using 1-butanol should, therefore, be investigated.
Kinetic parameters for the extraction should also be obtained, before designing
a pilot scale stage extractor for this purpose.

APPENDIX A
PROPERTIES OF LACTIC ACID, 1-BUTANOL AND
INORGANIC SALT

117
A.1 Lactic acid
Lactic acid, also known as 2-hydroxypropionic acid, is present in almost all
forms of organized life. Lactic acid is first produced by the fermentation of
carbohydrates such as sucrose, lactose, mannitol, starch and dextrin by Fremy in
1839. Industrial manufacture of lactic acid was established in 1881 (Elvers et al,
1990). Lactic acid which has both a hydroxyl group and a carboxyl group is the
simplest hydroxycarboxylic acid and one of the smallest molecules that is optically
active (Lipinsky and Sinclair, 1986). Structural formula of lactic acid is represented in
Figure A.1
Figure A.1 Molecular structure of lactic acid
This acid is an odorless and colorless substance and is normally obtained as a
concentrated solution up to 90 wt%. It is completely soluble in water, ethanol, diethyl
ether and other organic solvents that are miscible with water (Elvers et. al., 1990).
Physical and chemical properties of lactic acid are as follows
(http://en.wikipedia.org);
118
Table A.1 Chemical and physical properties of lactic acid
A.2 1-Butanol
1-butanol, C4H9OH (also referred to as n-butanol, butan-1-ol or butyl alcohol)
is a primary alcohol with a 4 carbon atoms, meaning that the carbon atom carrying the
hydroxyl group is connected to one other carbon atom. 1-butanol is of one of the
group of fusel alcohols, which have more than two carbon atoms and have significant
solubility in water. It can generally be produced along two different ways. First is a
petrochemical way which is well established for decades now, and second is a
biotechnological way, that also was in use in former days but has been outstripped by
the production on a fossil basis.
Figure A.2 Molecular structure of 1-butanol
Molecular formula: C3H6O3
Purity: 88%wt from ACROS organics
Molar mass: 90.08 g mol-1
Physical appearance: aqueous solution
Melting temperature: 53°C
Boiling temperature: 122°C at 12 mmHg
Density: 1.22 g cm-3
Acidity (pKa): 3.86
Dissociation Constant 1.38 x 10⁻⁴
Chemical and Physical properties
119
1-butanol is an intermediate in the production of butyl acrylate, butyl acetate,
dibutyl phthalate, dibutyl sebacate, and other butyl esters. Other industrial uses
include the manufacture of pharmaceuticals, polymers, pyroxylin plastics, herbicide
esters. It is also used as a diluent/reactant in the manufacture of urea–formaldehyde
and melamine–formaldehyde resins. In addition, It is used as a solvent for the
extraction process. Structural formula of lactic acid is represented in Figure A.2
The physical as well as chemical properties of the alcohols are determined
significantly by the presence and position of the functional groups (alkyl- and
hydroxyl groups). The physical and chemical properties of 1-butanol are shown in
Table A.2
Table A.2 Chemical and physical properties of 1-butanol
Molecular formula: C4H10O
Purity: 99.9%wt from ACROS organics
Molar mass: 74.12 g mol-1
Physical appearance: Colourless, refractive liquid
Melting temperature: -89.8 °C
Boiling temperature: 117 °C
Density: 0.81 g cm-3
Acidity (pKa): 16.1
Chemical and Physical properties
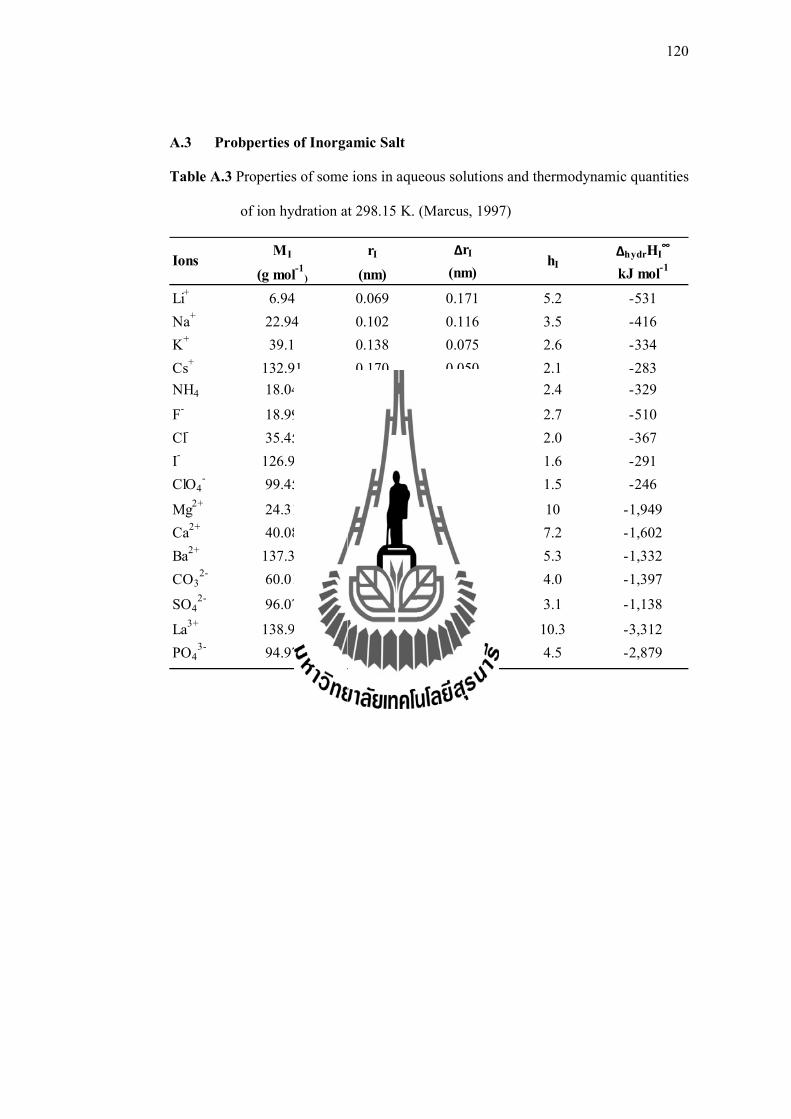
120
A.3 Probperties of Inorgamic Salt
Table A.3 Properties of some ions in aqueous solutions and thermodynamic quantities
of ion hydration at 298.15 K. (Marcus, 1997)
MI rI ∆rI ∆hydrHI∞
(g mol-1
) (nm) (nm) kJ mol-1
Li+
6.94 0.069 0.171 5.2 -531
Na+
22.94 0.102 0.116 3.5 -416
K+
39.1 0.138 0.075 2.6 -334
Cs+
132.91 0.170 0.050 2.1 -283
NH4 18.04 0.148 - 2.4 -329
F-
18.99 0.133 0.081 2.7 -510
Cl-
35.45 0.181 0.044 2.0 -367
I-
126.91 0.220 0.028 1.6 -291
ClO4-
99.45 0.240 0.023 1.5 -246
Mg2+
24.31 0.072 0.225 10 -1,949
Ca2+
40.08 0.100 0.169 7.2 -1,602
Ba2+
137.33 0.136 0.118 5.3 -1,332
CO32-
60.01 0.178 0.076 4.0 -1,397
SO42-
96.07 0.230 0.045 3.1 -1,138
La3+
138.91 0.105 0.197 10.3 -3,312
PO43-
94.97 0.238 0.057 4.5 -2,879
Ions hI
APPENDIX B
EXAMPLE OF COMPONENT ANALYSIS OF WATER,
1-BUTABOL, LACTIC ACID AND INORGANIC SALT
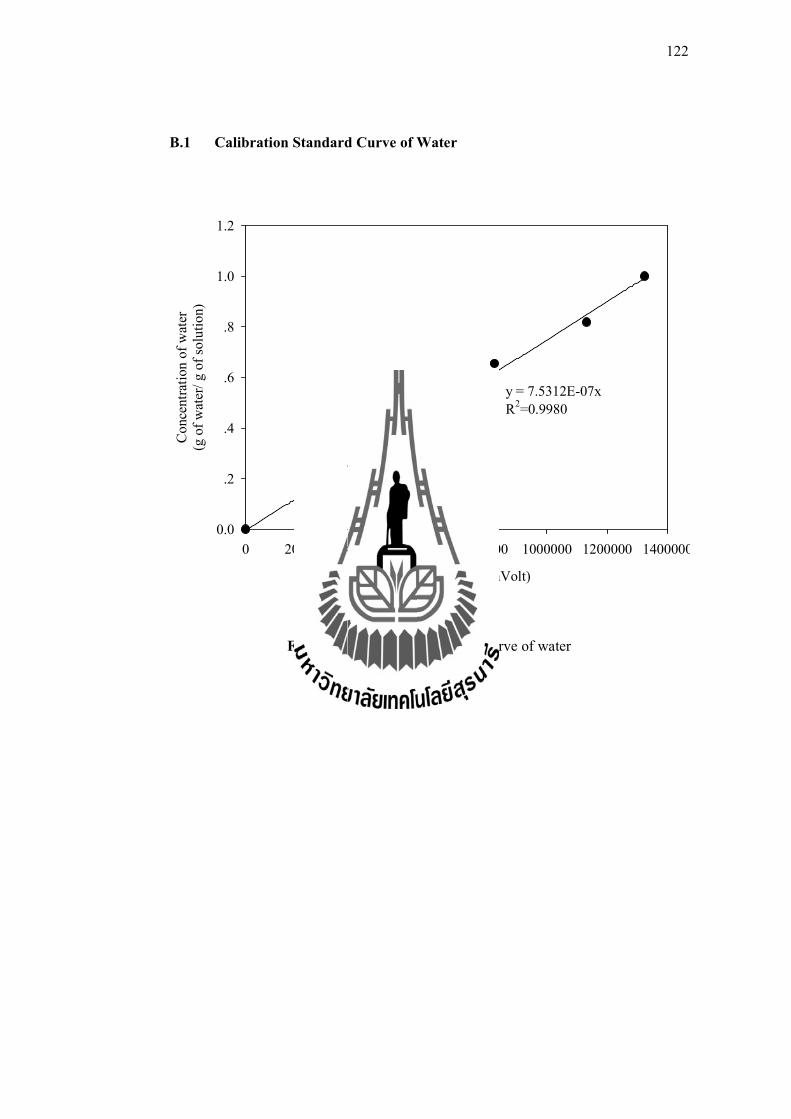
122
B.1 Calibration Standard Curve of Water
Figure B.1 Calibration standard curve of water
y = 7.5312E-07x
R2=0.9980
Area under curve (mVolt)
0 200000 400000 600000 800000 1000000 1200000 1400000
Co
ncen
trat
ion
of
wat
er(g
of
wat
er/
g of
so
luti
on)
0.0
.2
.4
.6
.8
1.0
1.2
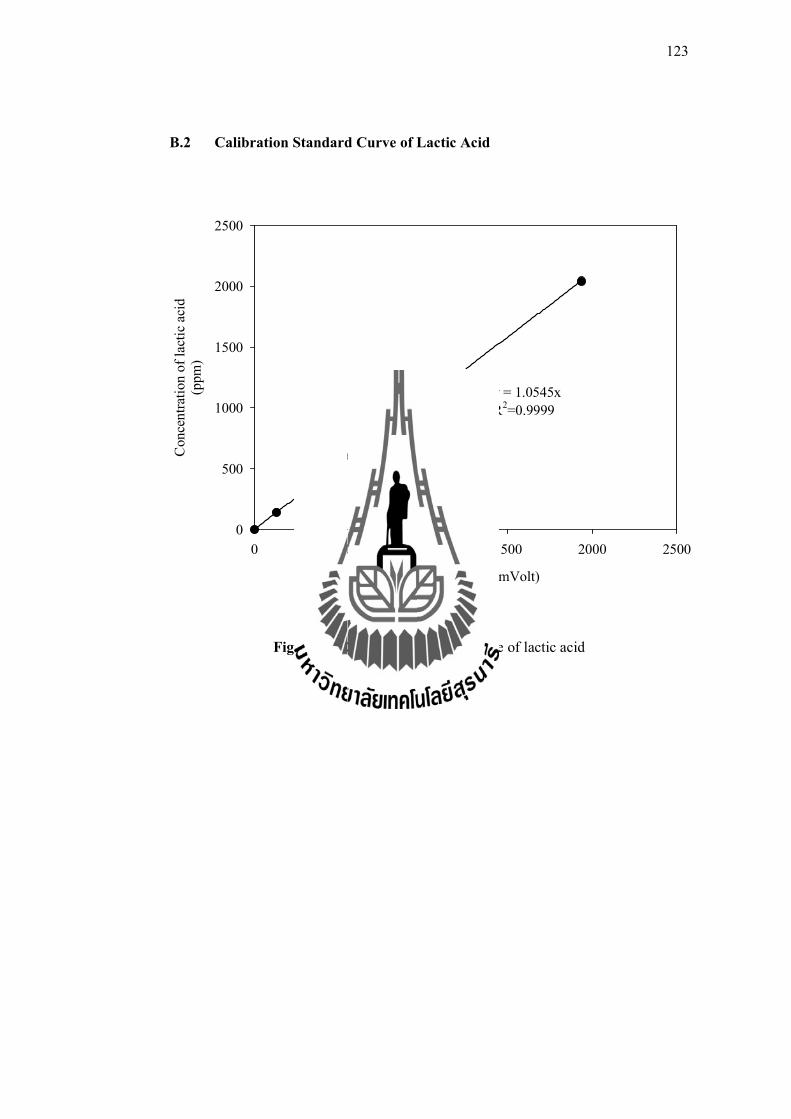
123
B.2 Calibration Standard Curve of Lactic Acid
Figure B.2 Calibration standard curve of lactic acid
y = 1.0545x
R2=0.9999
Area under curve (mVolt)
0 500 1000 1500 2000 2500
Con
cen
trat
ion
of
lact
ic a
cid
(ppm
)
0
500
1000
1500
2000
2500
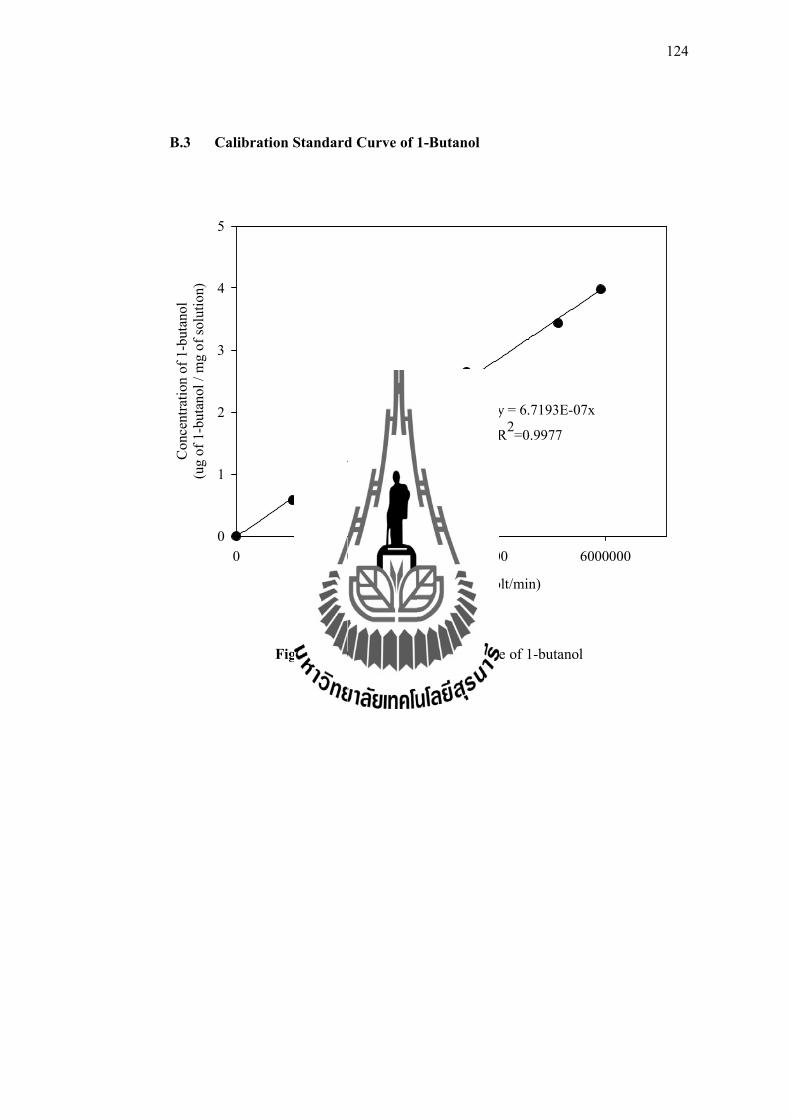
124
B.3 Calibration Standard Curve of 1-Butanol
Figure B.3 Calibration standard curve of 1-butanol
y = 6.7193E-07x
R2=0.9977
Area under curve (mVolt/min)
0 2000000 4000000 6000000
Co
ncen
trat
ion
of
1-b
utan
ol
(ug
of
1-bu
tan
ol /
mg
of
solu
tio
n)
0
1
2
3
4
5
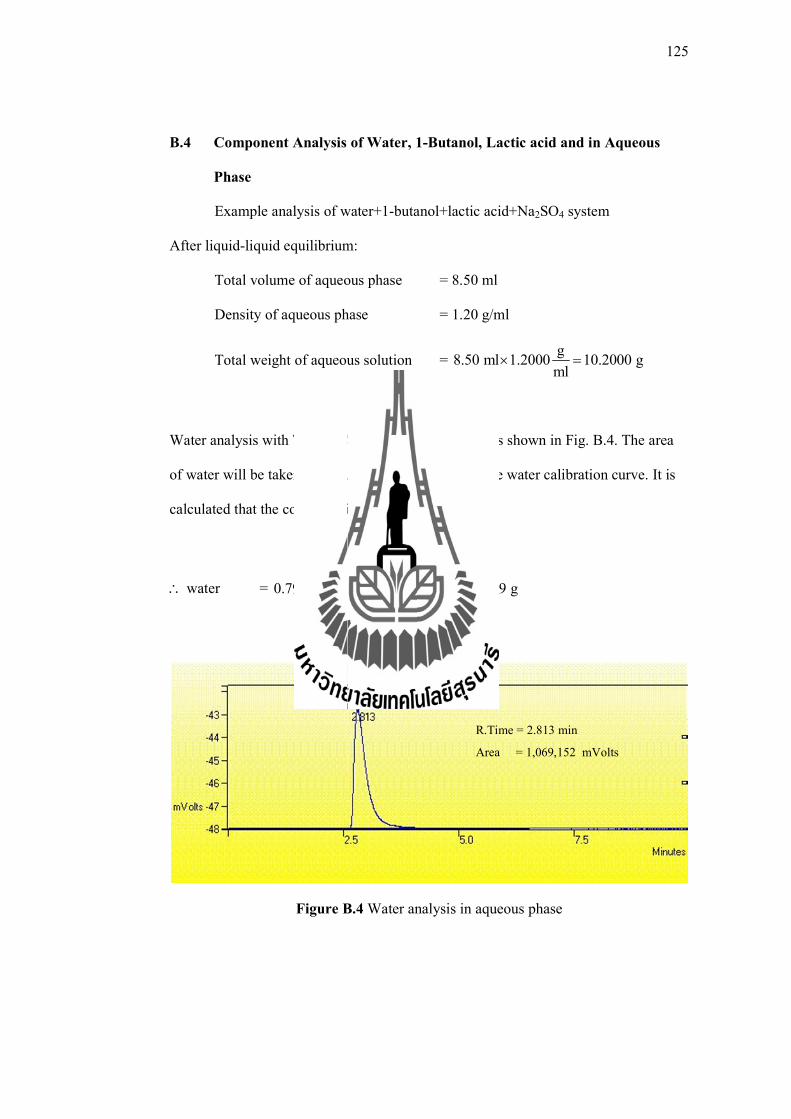
125
B.4 Component Analysis of Water, 1-Butanol, Lactic acid and in Aqueous
Phase
Example analysis of water+1-butanol+lactic acid+Na2SO4 system
After liquid-liquid equilibrium:
Total volume of aqueous phase = 8.50 ml
Density of aqueous phase = 1.20 g/ml
Total weight of aqueous solution = g
8.50 ml 1.2000 10.2000 gml
Water analysis with TCD-GC in 1 µL of pure sample is shown in Fig. B.4. The area
of water will be taken to calculate the quantity from the water calibration curve. It is
calculated that the concentration of water = 0.7984 g/g
water = g g
0.7984 1.2000 8.50ml 8.1439 gg ml
Figure B.4 Water analysis in aqueous phase
R.Time = 2.813 min
Area = 1,069,152 mVolts
water
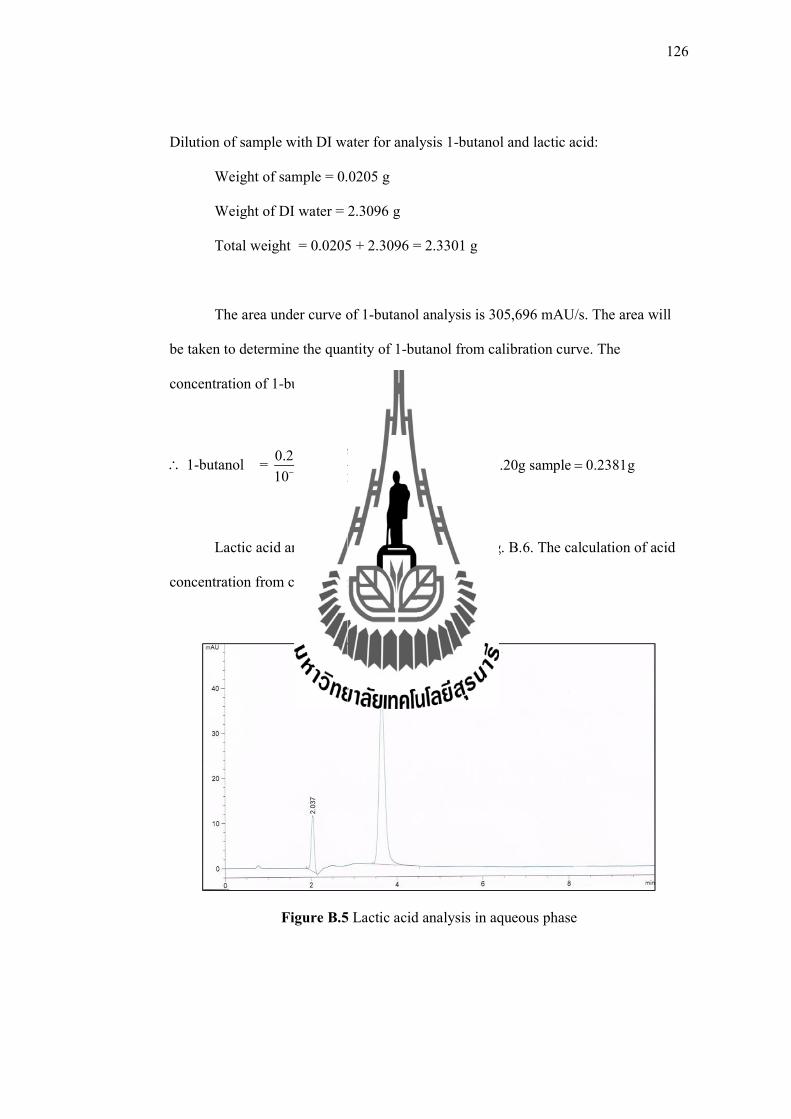
126
Dilution of sample with DI water for analysis 1-butanol and lactic acid:
Weight of sample = 0.0205 g
Weight of DI water = 2.3096 g
Total weight = 0.0205 + 2.3096 = 2.3301 g
The area under curve of 1-butanol analysis is 305,696 mAU/s. The area will
be taken to determine the quantity of 1-butanol from calibration curve. The
concentration of 1-butanol = 0.2054 µg/mg
1-butanol = 6
3
0.2054 10 g 2.3301g solution10.20g sample 0.2381g
10 g solution 0.0205g sample
Lactic acid analysis with HPLC is shown in Fig. B.6. The calculation of acid
concentration from calibration curve is 401.9633 ppm
Figure B.5 Lactic acid analysis in aqueous phase
Lactic acid
127
Lactic acid:
=
0.0205g sample 2.3096g waterg g
1.2000 0.9957401.9633mg ml ml 10.20g sample 0.4673 g
ml 0.0205g sample
Preparation of Na2SO4 analysis by Drying:
Weight of tube = 285.6800 g
Weight of sample = 5.1100 g
Total weight of tube + sample = 285.6800 + 5.1100 = 290.7900 g
After Drying:
Total weight of tube + sample = 286.2100 g
Na2SO4 = 10.20g
286.1800 285.6800 g 0.9980 g5.11g
Therefore, in total weight of aqueous phase (10.2000 g):
Water = 8.1439 g
1-butanol = 0.2318 g
Lactic acid = 0.4673 g
Na2SO4 = 0.9980 g
Total weight = 9.8272 g
Percent error =10.2000 9.8272
100 3.6549%10.2000
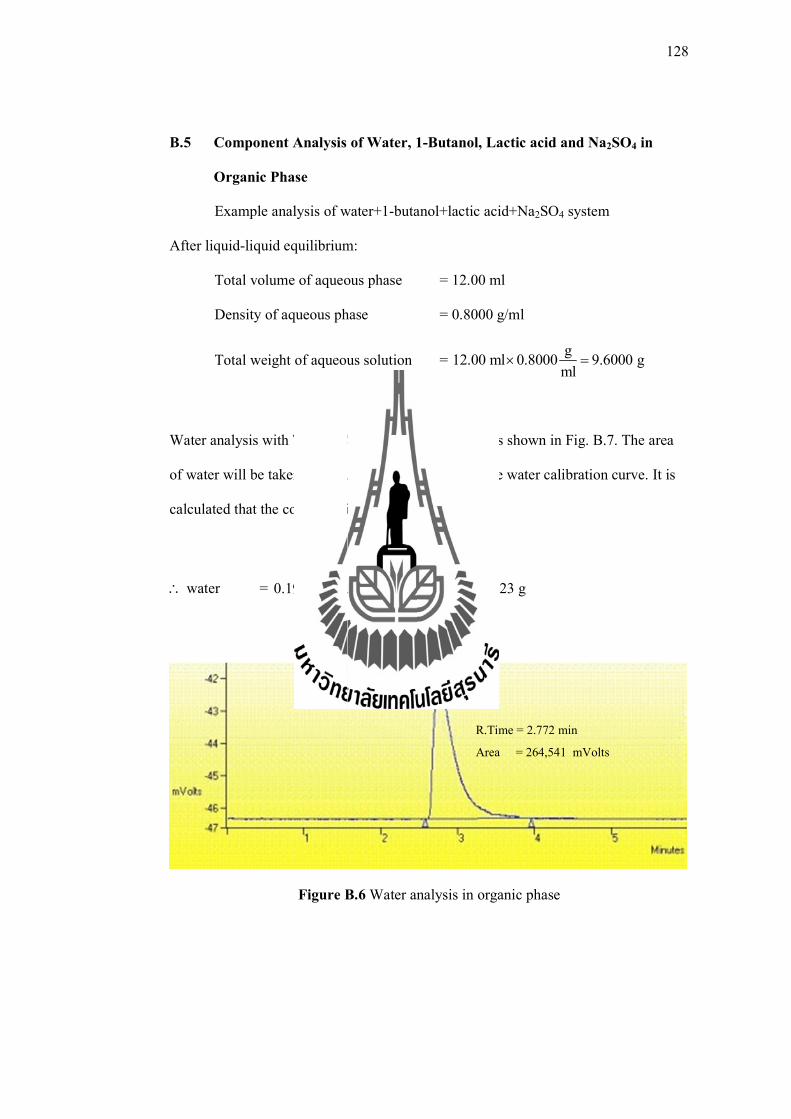
128
B.5 Component Analysis of Water, 1-Butanol, Lactic acid and Na2SO4 in
Organic Phase
Example analysis of water+1-butanol+lactic acid+Na2SO4 system
After liquid-liquid equilibrium:
Total volume of aqueous phase = 12.00 ml
Density of aqueous phase = 0.8000 g/ml
Total weight of aqueous solution = g
12.00 ml 0.8000 9.6000 gml
Water analysis with TCD-GC in 1 µL of pure sample is shown in Fig. B.7. The area
of water will be taken to calculate the quantity from the water calibration curve. It is
calculated that the concentration of water = 0.1992 g/g
water = g g
0.1992 0.8000 12.00ml 1.9123 gg ml
Figure B.6 Water analysis in organic phase
R.Time = 2.772 min
Area = 264,541 mVolts
water

129
Dilution of sample with DI water for analysis 1-butanol and lactic acid:
Weight of sample = 0.0085 g
Weight of DI water = 2.1622 g
Total weight = 0.0085 + 2.1622 = 2.1707 g
The area under curve of 1-butanol analysis is 4,856,607 mAU/s. The area will
be taken to determine the quantity of 1-butanol from calibration curve. The
concentration of 1-butanol = 3.2633 µg/mg
1-butanol = 6
3
3.2633 10 g 2.1707g solution9.6000g sample 8.0004g
10 g solution 0.0085g sample
Lactic acid analysis with HPLC is shown in Fig. B.9. The calculation of acid
concentration from calibration curve is 206.2453 ppm
Figure B.7 Lactic acid analysis in organic phase
Lactic acid
130
Lactic acid:
=
0.0085g sample 2.1622g waterg g
0.8000 0.9957206.2453mg ml ml 9.60g sample 0.5083 g
ml 0.0085g sample
Na2SO4 in organic phase determined by mass balance:
Initial weight of Na2SO4 in aqueous solution = 1.0036 g
Weight of Na2SO4 in aqueous phase = 0.9980 g
Weight of Na2SO4 in organic phase = 1.0036 + 0.9980 = 0.0056 g
Therefore, in total weight of aqueous phase (10.20 g):
Water = 0.1992 g
1-butanol = 8.0004 g
Lactic acid = 0.5083 g
Na2SO4 = 0.0056 g
Total weight = 8.7135 g
Percent error =9.6000 8.7135
100 9.2343%9.6000
131
B.6 Mass Balance
Total mass balance of water, 1-butanol, and lactic acid in aqueous and organic phase
shows that the percent error of each component is less than 10%
Initial weight of water = 9.1640 g
Initial weight of 1-butanol = 7.9141
Initial weight of lactic acid = 1.0163 g
Initial weight of Na2SO4 = 1.0036 g
Water = 8.1493+1.9123 = 10.0616 g
Percent error of water = 9.1640 10.0616
100 9.7948%9.1640
1-butanol = 2.2381+8.0004 = 8.2385 g
Percent error of 1-butanol = 7.9140 8.2385
100 4.1003%7.9140
Lactic acid = 0.4683+0.5083 = 0.9756 g
Percent error of lactic acid = 1.0163 0.9756
100 4.0047%10.0183
Na2SO4 = 0.9980+0.0056 = 1.0036 g
Percent error of Na2SO4 = 1.0036 1.0036
100 0%1.0036
APPENDIX C
LIQUID-LIQUID EQUILIBRIUM BY UNIQUAC AND
MODIFIED EXTENDED UNIQUAC MODELS
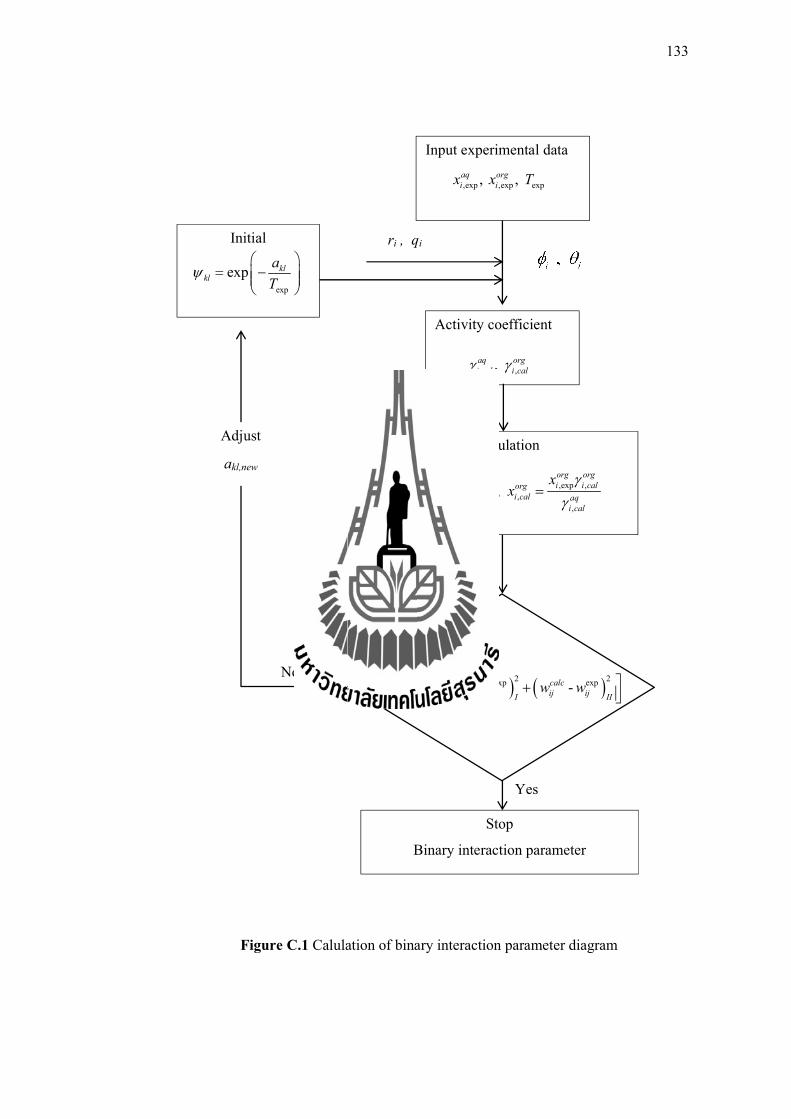
133
Input experimental data
Activity coefficient
Calculation
Initial
,exp ,exp exp, , aq orgi ix x T
exp
exp klkl
a
T
, ,, aq orgi cal i cal
,exp , ,exp ,
, ,
, ,
, aq aq org orgi i cal i i calaq org
i cal i calorg aqi cal i cal
x xx x
2 2exp exp
1 1
- -M N
calc calcij ij ij ijI IIj i
OF w w w w
Figure C.1 Calulation of binary interaction parameter diagram
Stop
Binary interaction parameter
Yes
No
Adjust
akl,new
ri , qi

134
Modified extended UNIQUAC model is used to correlation of the data of
liquid-liquid quilibrium of water + 1-butanol + inorganic salt system and UNIQUAC
model is used to correlation of the ternary water + 1-butanol + lactic acid system. The
tie lines of both model were optimized with the objective function. The regression
was ccomplished using MATLAB®(VersionR2012). The built-in optimization
function, fminunc was used which finds the minimum of an unconstrained multi
variable function.
C.1 UNIQUAC Model
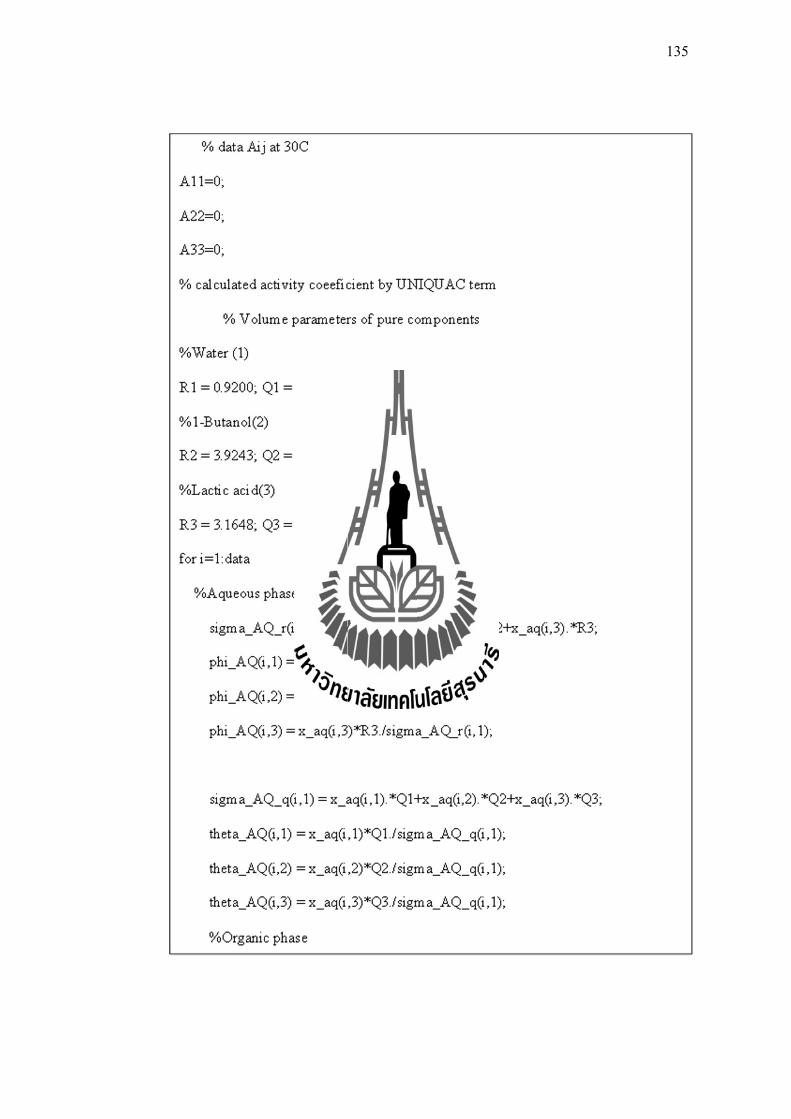
135
136
137
138
139
140
141
142
143
C.2 Modified extended UNIQUAC Model
144

145
146

147
148
149
150
151
152
153
154
155
156
157
158
159
APPENDIX D
LIST OF PUBLICATIONS

161
List of Publications
Chawong, K., and Rattanaphanee, P. (2012). Effect of Chloride Salts on Extraction of
Lactic Acid with n-Butanol. Engineering Transactions. 5(2): 66-71.
Chawong, K., and Rattanaphanee, P. (2014). Liquid-liquid equilibrium of water + 1-
butanol + (NH4)2SO4 and its application on lactic acid extraction. Pure and
Applied Chemistry International Conference (PACCON2014). Khon
Kaen, Thailand Proceeding of Pure and Applied Chemistry International
Conference 2014, p.196-199.
Chawong, K., Rayabsri, C., and Rattanaphanee, P. (2014). Extraction of Lactic Acid
in Mixed Solvent Electrolyte System Containing Water, 1-Butanol and
Ammonium Sulfate. GPE-4th International Congress on Green Process
Engineering. Swvilla, Spain.
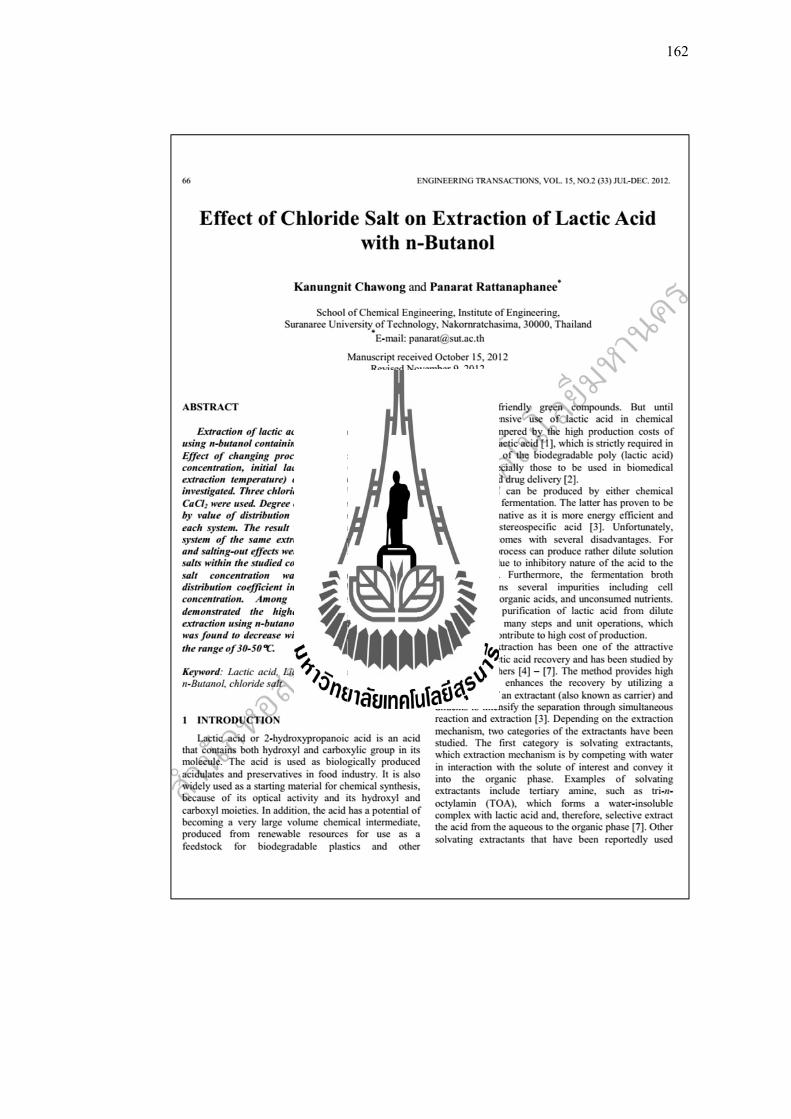
162
163

164
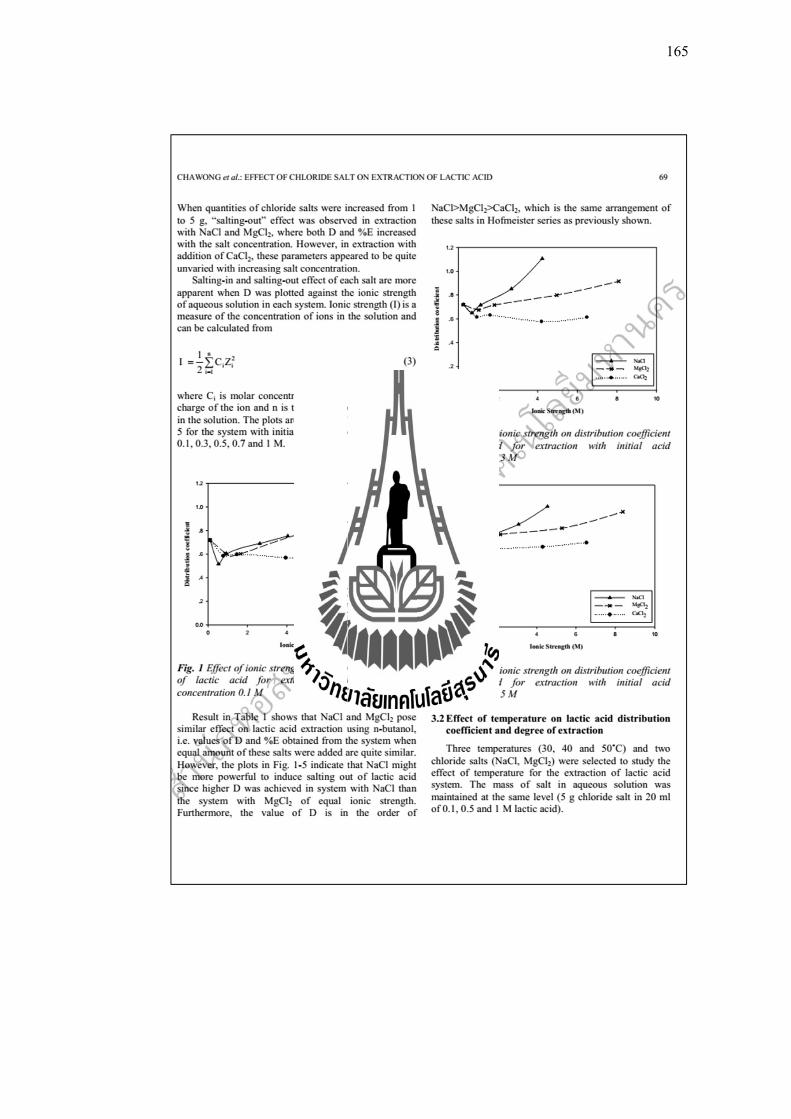
165
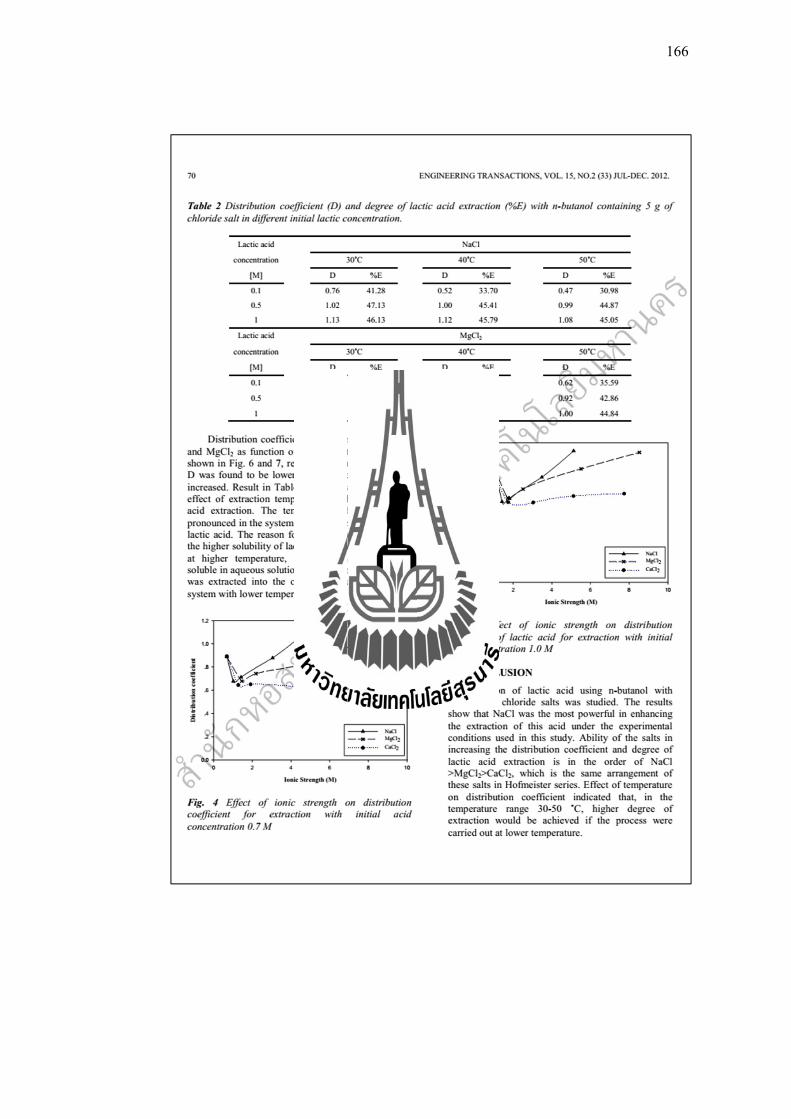
166
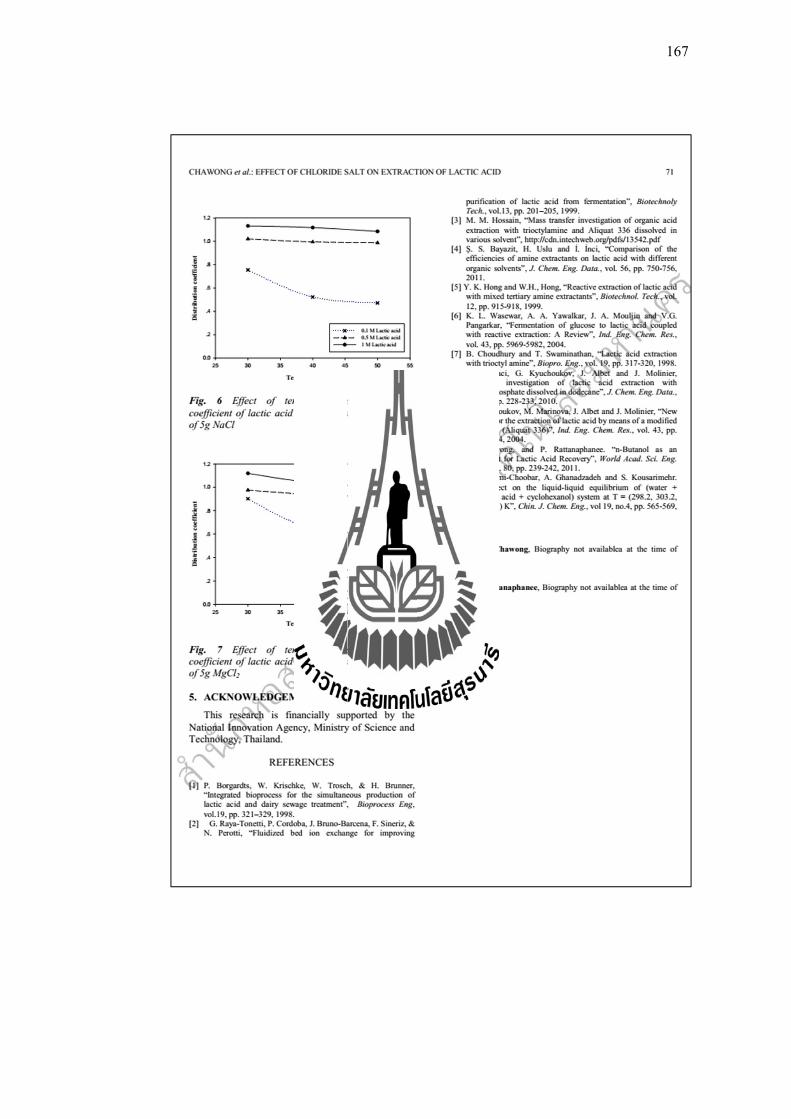
167
168
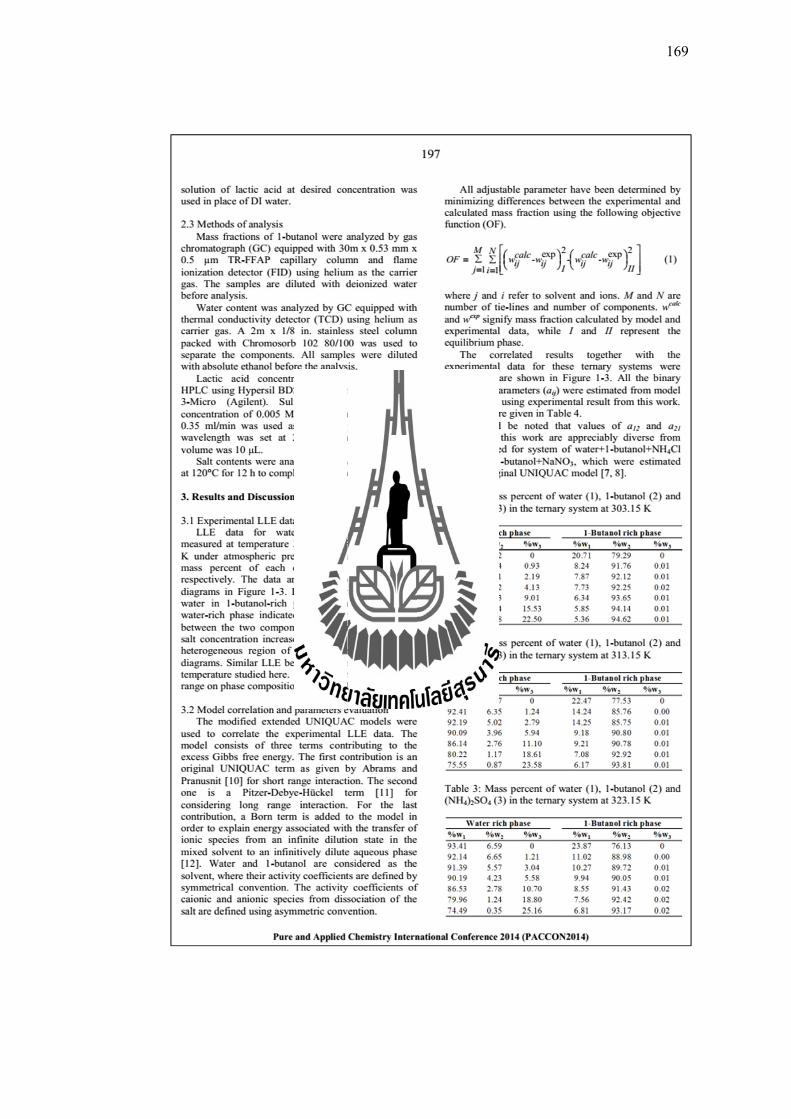
169
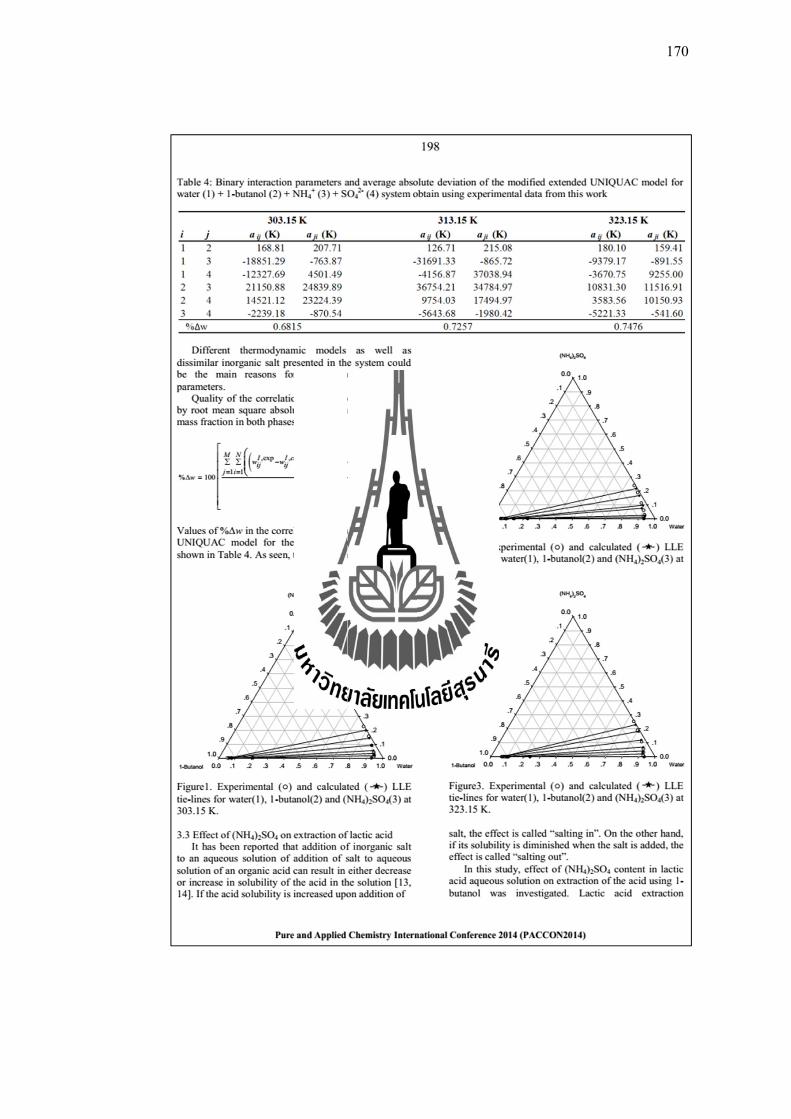
170
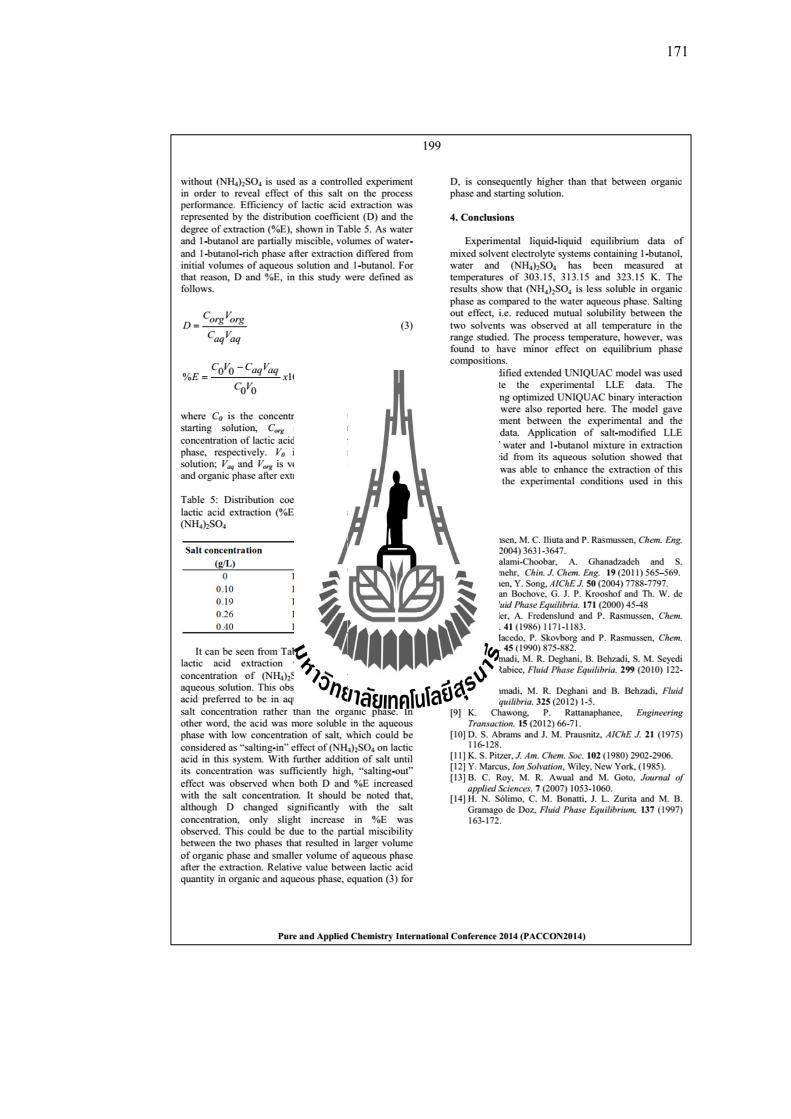
171
172
173
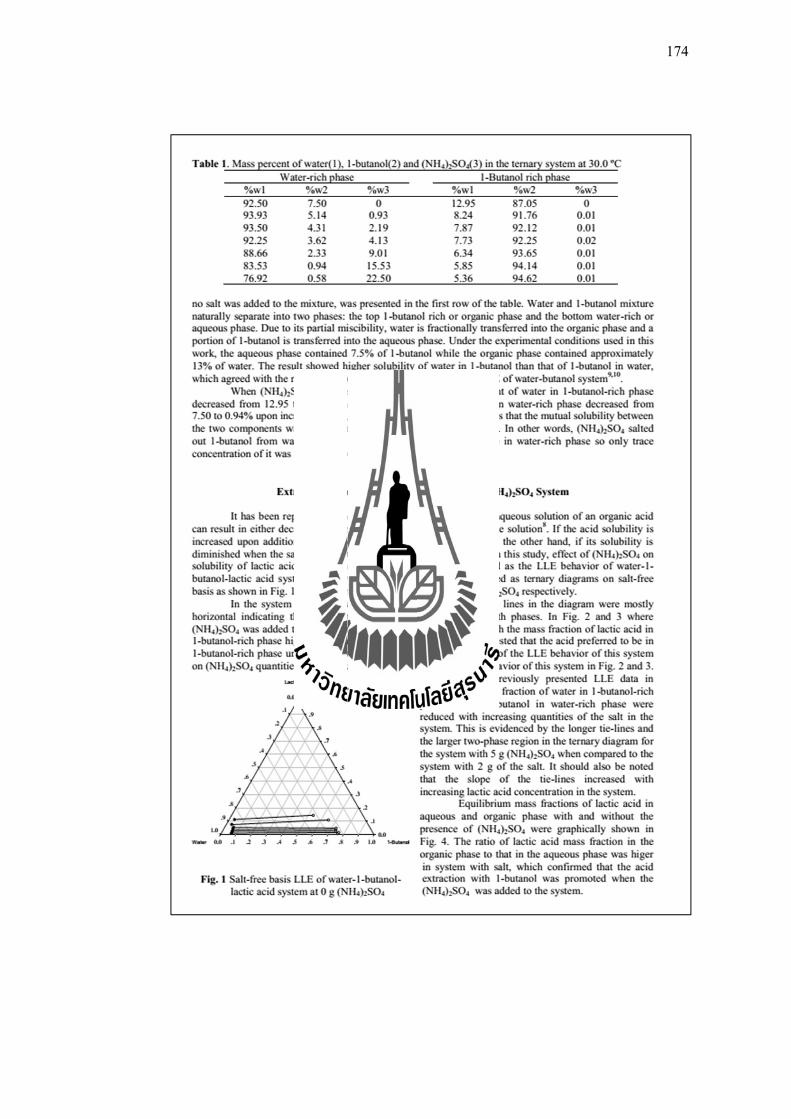
174
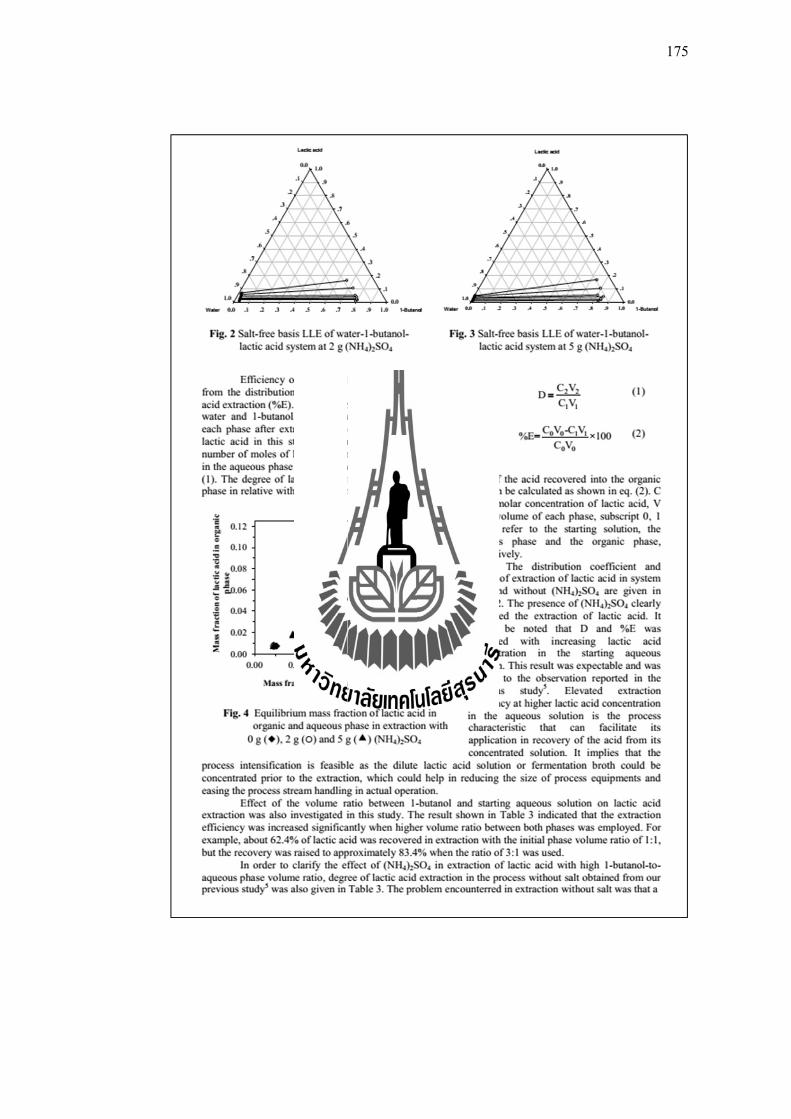
175
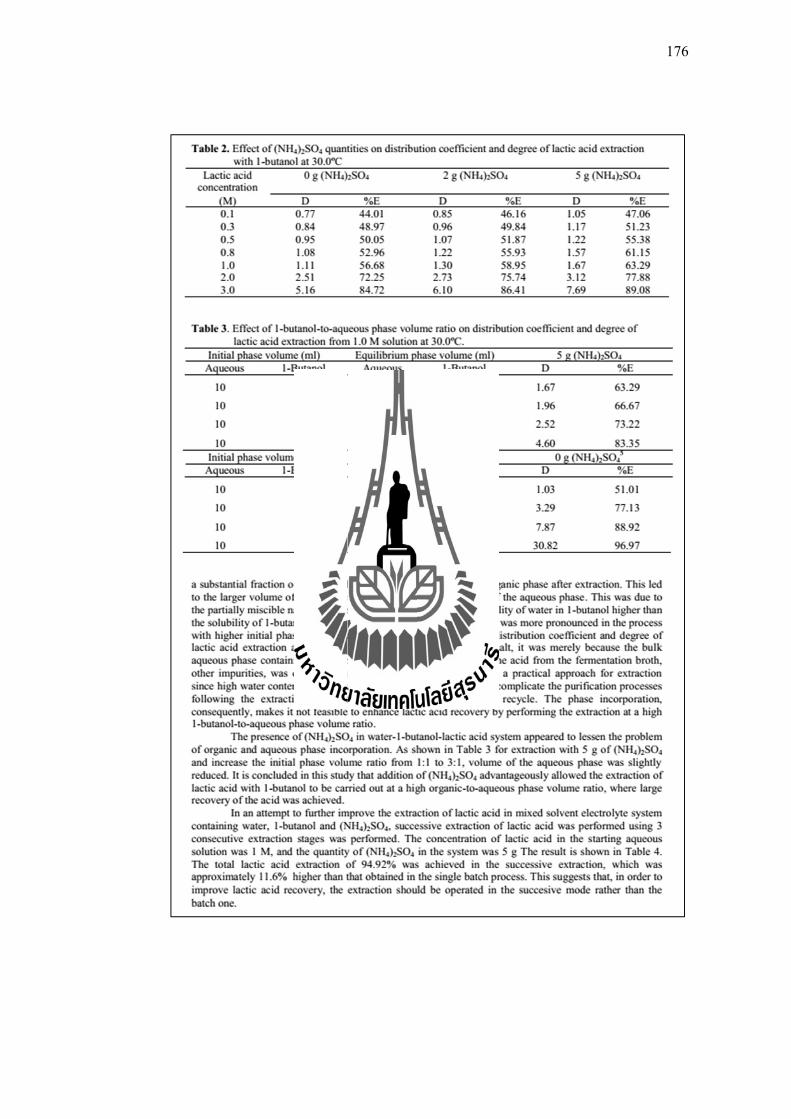
176
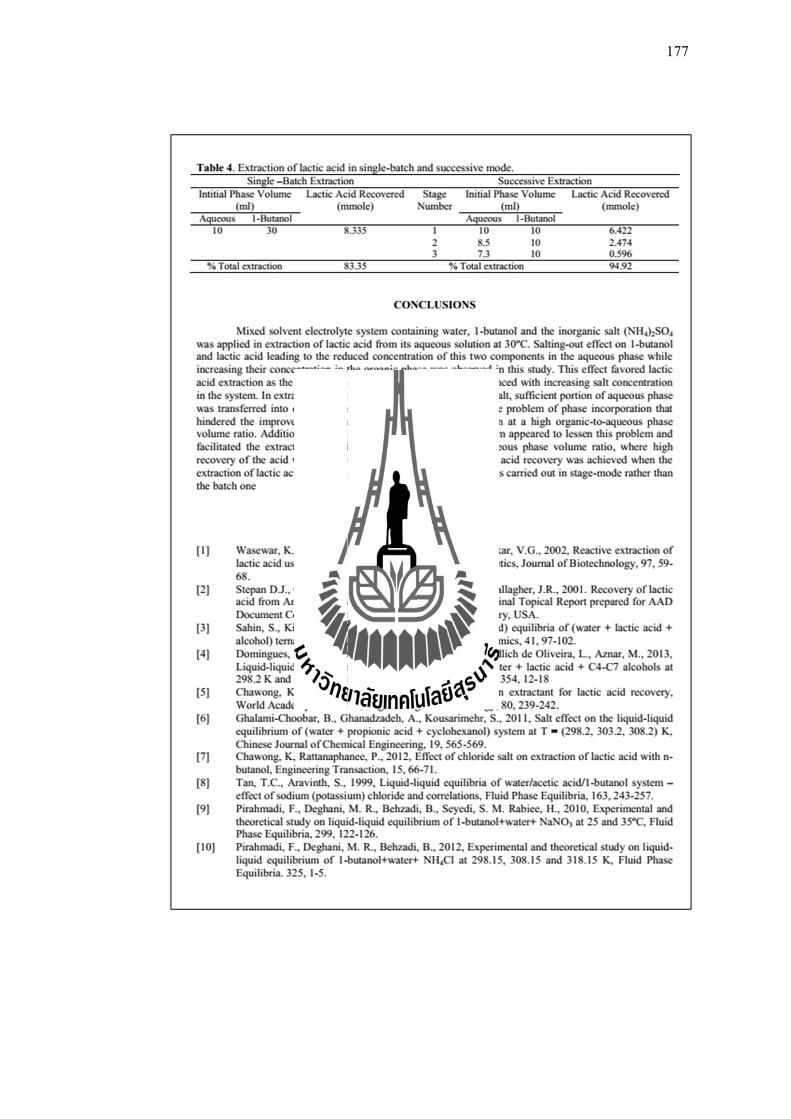
177
178
BIOGRAPHY
Miss Kanungnit Chawong was born on August 20, 1987 in Bangkok,
Thailand. She earned her Bachelor’s Degree in Chemical Engineering from Suranaree
University of Technology (SUT) in 2011. Her senior project was extraction of lactic
acid from aqueous solution with n-butanol. She then continued her Master’s Degree in
Chemical Engineering at School of Chemical Engineering, Institute of Engineering at
Suranaree University of Technology under the guidance Asst. Prof. Dr.Panarat
Rattanapanee. Her expertise includes the field of Liquid-liquid extraction. During her
Master’s degree study, she presented one oral presentation entitled of "Effect of
Chloride Salt on Extraction of Lactic acid with n-Butanol" in the 22nd Thai Institute of
Chemical Engineering and Applied Chemistry Conferrence, Nakhon Ratchasima,
Thailand and one poster presentation entitled of "Liquid-liquid equilibrium of 1-
butanol + water + (NH4)2SO4 and its application in lactic acid extraction" in The Pure
and Applied Chemical International Conference 2014, Khon Kaen, Thailand.
Related Documents