1 Climate Change: The Costs of Inaction Dr. ALI ABDALRAHMAN ALI President Of Arab Union of Sustainable Development & Environment (AUSDE) While the climate science debate is approaching closure, the climate economics debate is still wide open. Climate change is happening, it is threatening our future well-being – but how much can we afford to do about it? The most powerful argument for inaction today is no longer skepticism about the science, but rather the claim that the costs of reducing emissions would be intolerable. The damage to the economy, it is alleged, would be worse than the climate problem we are attempting to solve. The economic argument for inaction is wrong on two counts: it exaggerates the costs of reducing emissions, and it understates the harm that will occur if we continue to do little or nothing about climate change. My testimony primarily addresses the second point, on the costs of inaction. On the first point, the costs of reducing emissions, Nicholas Stern’s detailed review of the economics of climate change, for the British government, estimated that we need to spend one percent of global income for several decades to bring carbon dioxide emissions down to a relatively safe level. More recent studies of the costs of carbon reduction technologies by McKinsey & Company, an international consulting firm, have led to very similar estimates. The occasional claims of much higher costs are not nearly as well researched and documented as the Stern and McKinsey estimates. Thus one percent of global income is the best available estimate of the cost of solving the climate problem. In contrast, my research shows that for the United States as a whole, even a partial accounting of the costs of inaction exceeds one percent of GDP, and rises steadily over time. For some parts of the country, such as Florida, a similar, partial accounting of the costs of inaction reaches 5 percent of state income within this century. For

Welcome message from author
This document is posted to help you gain knowledge. Please leave a comment to let me know what you think about it! Share it to your friends and learn new things together.
Transcript
1
Climate Change: The Costs of Inaction
Dr. ALI ABDALRAHMAN ALI
President Of Arab Union of Sustainable Development & Environment
(AUSDE)
While the climate science debate is approaching closure, the
climate economics debate is still wide open. Climate change is
happening, it is threatening our future well-being – but how much can
we afford to do about it? The most powerful argument for inaction
today is no longer skepticism about the science, but rather the claim
that the costs of reducing emissions would be intolerable. The damage
to the economy, it is alleged, would be worse than the climate problem
we are attempting to solve.
The economic argument for inaction is wrong on two counts: it
exaggerates the costs of reducing emissions, and it understates the
harm that will occur if we continue to do little or nothing about climate
change. My testimony primarily addresses the second point, on the
costs of inaction.
On the first point, the costs of reducing emissions, Nicholas
Stern’s detailed review of the economics of climate change, for the
British government, estimated that we need to spend one percent of
global income for several decades to bring carbon dioxide emissions
down to a relatively safe level. More recent studies of the costs of
carbon reduction technologies by McKinsey & Company, an
international consulting firm, have led to very similar estimates. The
occasional claims of much higher costs are not nearly as well
researched and documented as the Stern and McKinsey estimates.
Thus one percent of global income is the best available estimate of
the cost of solving the climate problem.
In contrast, my research shows that for the United States as a
whole, even a partial accounting of the costs of inaction exceeds one
percent of GDP, and rises steadily over time. For some parts of the
country, such as Florida, a similar, partial accounting of the costs of
inaction reaches 5 percent of state income within this century. For
2
particularly vulnerable parts of the world, such as the islands of the
Caribbean, the costs will be disastrously greater – with one likely
consequence being a much-increased flow of refugees out of that
region.
Damages that will result from inaction include (but are not limited
to):
• the impacts of increasingly severe hurricanes
• more coastal property at risk from rising sea levels and storm
surges
• increased energy costs for air conditioning as temperatures rise
• growing scarcity and rising costs for water
• losses in agriculture due to hotter and drier conditions
• losses of tourism revenue as weather conditions worsen

3
4
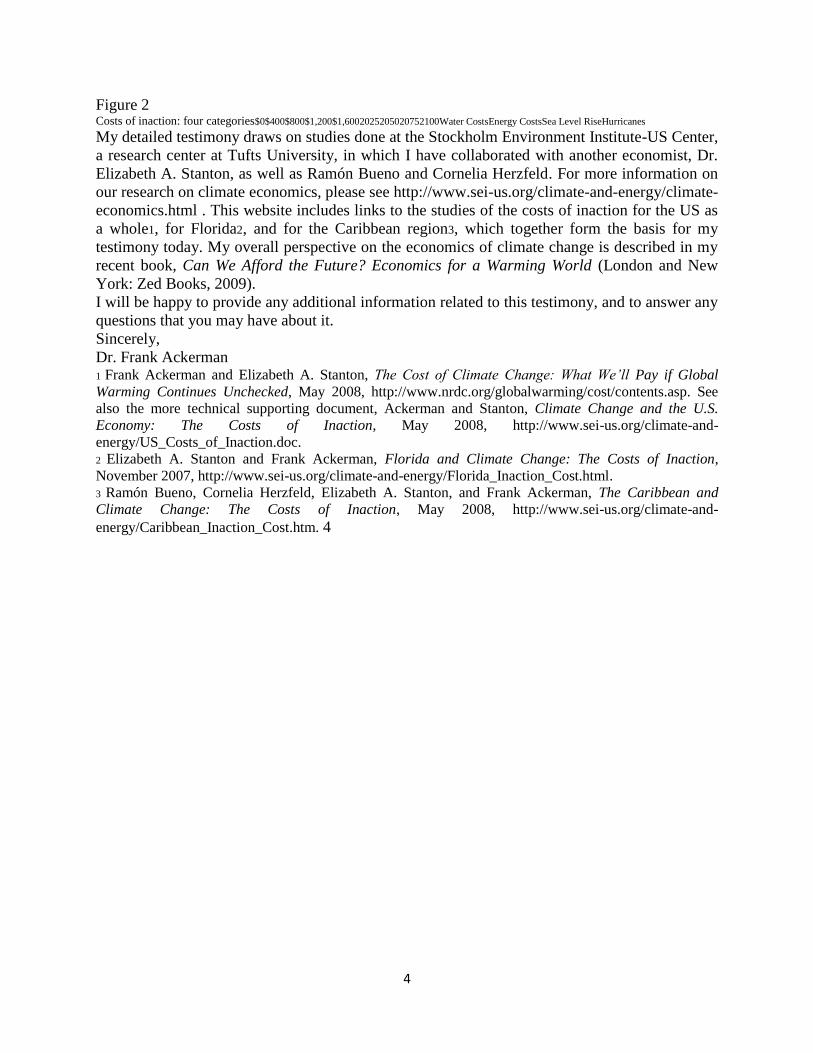
Figure 2 Costs of inaction: four categories$0$400$800$1,200$1,6002025205020752100Water CostsEnergy CostsSea Level RiseHurricanes
My detailed testimony draws on studies done at the Stockholm Environment Institute-US Center,
a research center at Tufts University, in which I have collaborated with another economist, Dr.
Elizabeth A. Stanton, as well as Ramón Bueno and Cornelia Herzfeld. For more information on
our research on climate economics, please see http://www.sei-us.org/climate-and-energy/climate-
economics.html . This website includes links to the studies of the costs of inaction for the US as
a whole1, for Florida2, and for the Caribbean region3, which together form the basis for my
testimony today. My overall perspective on the economics of climate change is described in my
recent book, Can We Afford the Future? Economics for a Warming World (London and New
York: Zed Books, 2009).
I will be happy to provide any additional information related to this testimony, and to answer any
questions that you may have about it.
Sincerely,
Dr. Frank Ackerman 1 Frank Ackerman and Elizabeth A. Stanton, The Cost of Climate Change: What We’ll Pay if Global
Warming Continues Unchecked, May 2008, http://www.nrdc.org/globalwarming/cost/contents.asp. See
also the more technical supporting document, Ackerman and Stanton, Climate Change and the U.S.
Economy: The Costs of Inaction, May 2008, http://www.sei-us.org/climate-and-
energy/US_Costs_of_Inaction.doc. 2 Elizabeth A. Stanton and Frank Ackerman, Florida and Climate Change: The Costs of Inaction,
November 2007, http://www.sei-us.org/climate-and-energy/Florida_Inaction_Cost.html. 3 Ramón Bueno, Cornelia Herzfeld, Elizabeth A. Stanton, and Frank Ackerman, The Caribbean and
Climate Change: The Costs of Inaction, May 2008, http://www.sei-us.org/climate-and-
energy/Caribbean_Inaction_Cost.htm. 4
5
Introduction: The Costs of Inaction
A scientific consensus has been reached: The earth’s climate is changing for the worse, as a
result of anthropogenic (human-caused) changes to the composition of the atmosphere. If
everyone works together, all around the world, to reduce the concentration of greenhouse gases
in our atmosphere, we can slow and even stop climate change. If we fail to do so, the
consequences will be increasingly painful – and expensive.
My research group’s analyses compare the economic consequences of two possible climate
futures: The business-as-usual case, the worst likely result of emissions that continue to increase
over time, unchecked by public policy, and the rapid stabilization case, the best likely result of a
program of rapid, ambitious worldwide abatement initiatives.4 It is too late to avoid all climate
damages; even the rapid stabilization case involves significant losses due to climate change.
However, the difference between the two scenarios – between the comparatively small losses
under rapid stabilization and the huge losses under business-as-usual – is avoidable if we act
soon.5 Failure to act means that we will incur a much bigger and more painful climate loss rather
than a smaller and more bearable one. The difference between the two is the cost of inaction.
My testimony begins with our analysis of the costs of inaction for the U.S., and then turns to our
findings for Florida and for the Caribbean. A brief conclusion summarizes the message and the
meaning of this testimony for climate policy decisions. 4 On many climate projections, the IPCC issues a range of possible forecasts, with estimates of
probabilities attached. Here we differ from the simple approach of reporting the median of the IPCC
range. Since the future will only happen once, and we want to know how bad the risks of future damages
could be, the median is misleading: there is a 50-50 chance that the future will be worse than that, perhaps
much worse. Instead, we use the upper (worst) limit of what IPCC calls the “likely” range of outcomes –
which they define to mean the 17th to the 83rd percentiles. That is, we report the 83rd percentile of IPCC
forecasts, generally using their rapidly growing A2 scenario to represent business as usual. Using similar
logic, our best case or rapid stabilization scenario represents the 17th percentile outcome of the more
slowly growing B1 scenario – or as good as it is likely to get, according to IPCC projections. Note that
IPCC projects a one-in-six chance that the worst case is worse, and the same odds that the best case is
better, than our estimates. 5 Throughout our analyses we assume that the size of the economy and population will be the same in
both scenarios. This (perhaps unrealistic) assumption is useful in clarifying the meaning of our two cases,
and the contrast between them: all the economic differences between the business-as-usual and rapid
stabilization cases reflect different climate impacts applied to the same economy, not changes in the
underlying projections of output or population.5
6
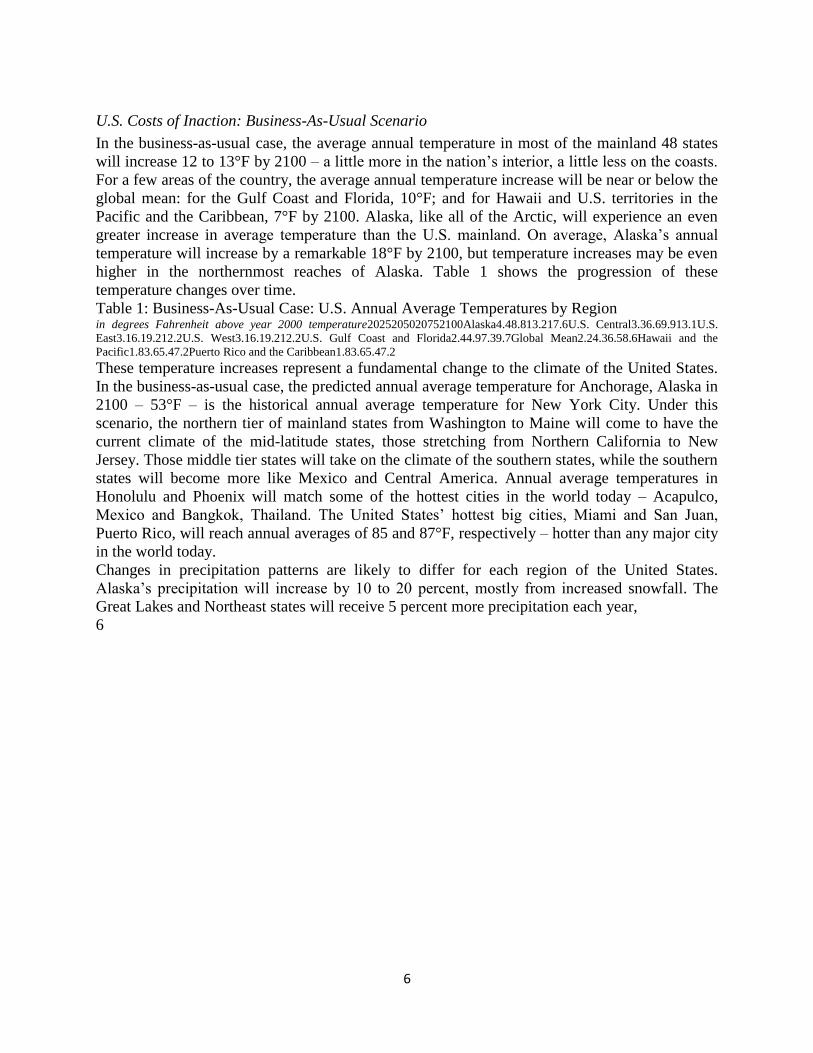
U.S. Costs of Inaction: Business-As-Usual Scenario
In the business-as-usual case, the average annual temperature in most of the mainland 48 states
will increase 12 to 13°F by 2100 – a little more in the nation’s interior, a little less on the coasts.
For a few areas of the country, the average annual temperature increase will be near or below the
global mean: for the Gulf Coast and Florida, 10°F; and for Hawaii and U.S. territories in the
Pacific and the Caribbean, 7°F by 2100. Alaska, like all of the Arctic, will experience an even
greater increase in average temperature than the U.S. mainland. On average, Alaska’s annual
temperature will increase by a remarkable 18°F by 2100, but temperature increases may be even
higher in the northernmost reaches of Alaska. Table 1 shows the progression of these
temperature changes over time.
Table 1: Business-As-Usual Case: U.S. Annual Average Temperatures by Region in degrees Fahrenheit above year 2000 temperature2025205020752100Alaska4.48.813.217.6U.S. Central3.36.69.913.1U.S.
East3.16.19.212.2U.S. West3.16.19.212.2U.S. Gulf Coast and Florida2.44.97.39.7Global Mean2.24.36.58.6Hawaii and the
Pacific1.83.65.47.2Puerto Rico and the Caribbean1.83.65.47.2
These temperature increases represent a fundamental change to the climate of the United States.
In the business-as-usual case, the predicted annual average temperature for Anchorage, Alaska in
2100 – 53°F – is the historical annual average temperature for New York City. Under this
scenario, the northern tier of mainland states from Washington to Maine will come to have the
current climate of the mid-latitude states, those stretching from Northern California to New
Jersey. Those middle tier states will take on the climate of the southern states, while the southern
states will become more like Mexico and Central America. Annual average temperatures in
Honolulu and Phoenix will match some of the hottest cities in the world today – Acapulco,
Mexico and Bangkok, Thailand. The United States’ hottest big cities, Miami and San Juan,
Puerto Rico, will reach annual averages of 85 and 87°F, respectively – hotter than any major city
in the world today.
Changes in precipitation patterns are likely to differ for each region of the United States.
Alaska’s precipitation will increase by 10 to 20 percent, mostly from increased snowfall. The
Great Lakes and Northeast states will receive 5 percent more precipitation each year,
6
7
mostly in winter. The U.S. Southwest, including California and Texas, will experience a decrease
in precipitation, down 5 to 15 percent, mostly from less winter rain. The U.S. Gulf Coast and
Florida will also receive 5 to 10 percent less rain each year. There will also be a higher risk of
winter flooding, earlier peak river flows for snow and glacier-fed streams; lower summer soil
moisture and river flows; and a shrinkage of sea ice, glaciers and permafrost. Climate change
also affects storm intensity; specifically, Atlantic hurricanes and Pacific typhoons will become
more destructive.
Our estimates for sea-level rise under the business-as-usual case diverge somewhat from the
scenarios presented in the latest IPCC report. This area of climate science has been developing
rapidly, but the most recent advances were released too late for inclusion in the IPCC process.
Based on our reading of this recent work, we use an estimate of 45 inches by 2100.6
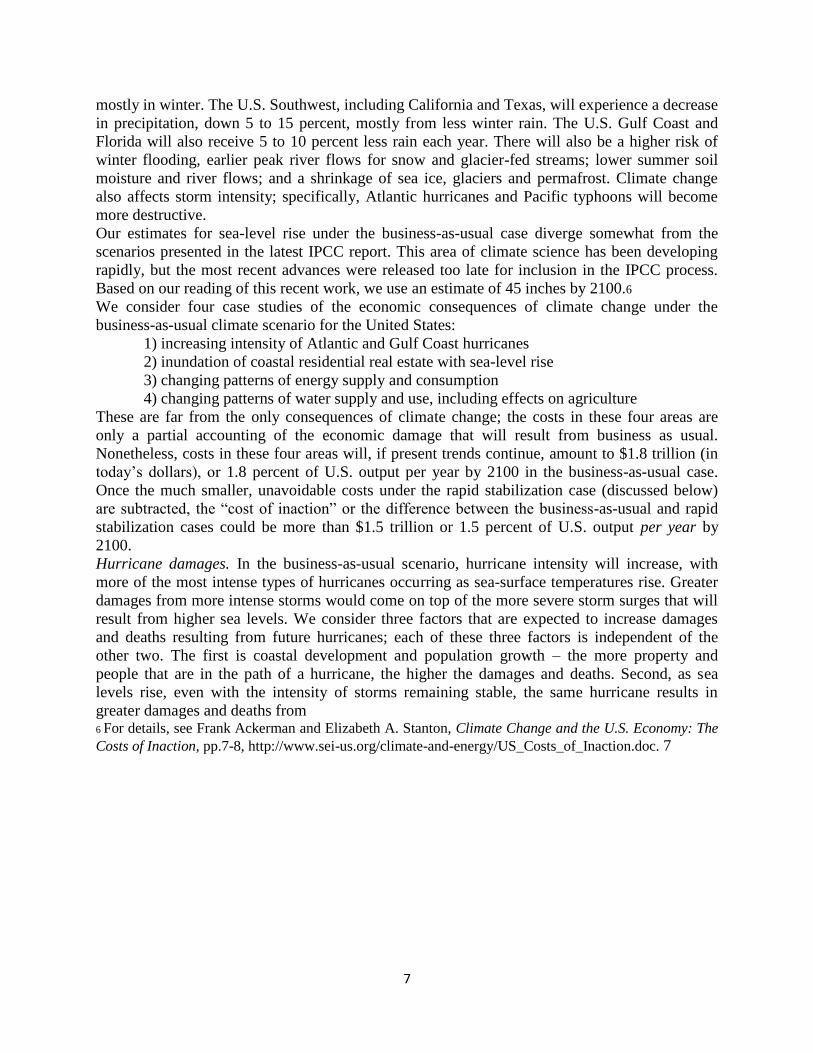
We consider four case studies of the economic consequences of climate change under the
business-as-usual climate scenario for the United States:
1) increasing intensity of Atlantic and Gulf Coast hurricanes
2) inundation of coastal residential real estate with sea-level rise
3) changing patterns of energy supply and consumption
4) changing patterns of water supply and use, including effects on agriculture
These are far from the only consequences of climate change; the costs in these four areas are
only a partial accounting of the economic damage that will result from business as usual.
Nonetheless, costs in these four areas will, if present trends continue, amount to $1.8 trillion (in
today’s dollars), or 1.8 percent of U.S. output per year by 2100 in the business-as-usual case.
Once the much smaller, unavoidable costs under the rapid stabilization case (discussed below)
are subtracted, the “cost of inaction” or the difference between the business-as-usual and rapid
stabilization cases could be more than $1.5 trillion or 1.5 percent of U.S. output per year by
2100.
Hurricane damages. In the business-as-usual scenario, hurricane intensity will increase, with
more of the most intense types of hurricanes occurring as sea-surface temperatures rise. Greater
damages from more intense storms would come on top of the more severe storm surges that will
result from higher sea levels. We consider three factors that are expected to increase damages
and deaths resulting from future hurricanes; each of these three factors is independent of the
other two. The first is coastal development and population growth – the more property and
people that are in the path of a hurricane, the higher the damages and deaths. Second, as sea
levels rise, even with the intensity of storms remaining stable, the same hurricane results in
greater damages and deaths from 6 For details, see Frank Ackerman and Elizabeth A. Stanton, Climate Change and the U.S. Economy: The
Costs of Inaction, pp.7-8, http://www.sei-us.org/climate-and-energy/US_Costs_of_Inaction.doc. 7
8
storm surges, flooding, and erosion. Third, hurricane intensity may increase as sea-surface
temperatures rise. Combining these effects together, the predicted increase to U.S. hurricane
damages for the year 2100 is $397 billion, or 0.39 percent of U.S. output in the business-as-usual
case.7
Rising sea levels. The effects of climate change will have severe consequences for low-lying
U.S. coastal real estate. If nothing were done to hold back rising waters, sea-level rise would
simply inundate many properties in low-lying, coastal areas. Even those properties that remained
above water would be more likely to sustain storm damage, as encroachment of the sea allows
storm surges to reach inland areas that were not previously affected. In the business-as-usual
case, the annual residential real estate losses in the 48 mainland states rise to $360 billion or 0.35
percent of U.S. output by 2100. No one expects coastal property owners to wait passively for
these damages to occur; those who can afford to do so will undoubtedly seek to protect their
properties. But all the available methods for protection against sea-level rise are problematical
and expensive. It is difficult to imagine any of them being used on a large enough scale to shelter
all low-lying U.S. coastal lands from the rising seas of the 21st century.
Energy demand. Climate change will affect both the demand for and the supply of energy: hotter
temperatures will mean more air conditioning and less heating for consumers – and more
difficult and expensive operating conditions for electric power plants. In the business-as-usual
case, increasing average temperatures drive up the costs of electricity above population and per-
capita increases. Not surprisingly, electricity demand rises most rapidly in the Southeast and
Southwest, as those regions experience more uncomfortably hot days. By the same token, our
model projects that while the Northeast and Midwest also have rising air conditioning costs,
those costs are largely offset by reduced demand for natural gas and heating oil expenditures.
That is, speaking very roughly, the colder half of the country nearly breaks even on energy costs,
experiencing reduced heating and increased air conditioning costs of the same magnitude. The
warmer half of the country, where heating costs are already small, suffers a substantial net
increase in energy costs due to rising air conditioning use.
Overall costs in the energy sector in the business-as-usual case, combining increased costs for
electricity and for new air conditioners, net of decreases in heating fuel costs, add up to $141
billion per year by 2100, or 0.14 percent of projected U.S. output.
Water supply. In the business-as-usual future, problems of water supply will become more
serious, as much hotter and in many areas drier conditions will increase demand. The average
temperature increase of 12-13oF across most of the country, and the decrease 7 These numbers represent a 6 percent reduction from our previously reported hurricane damage
estimates, to correct a technical error in the original numbers that led to a 6 percent overestimate, pointed
out by Roger Pielke Jr. (personal correspondence). 8
9
in precipitation across the South and Southwest, as described above, will lead to water scarcity
and increased costs in much of the country. Responses are likely to include intensified water
conservation measures, improved treatment and recycling of wastewater, construction and
upgrading of cooling towers to reduce power plant water needs, and a reduction in the extent of
irrigated agriculture. Extrapolating from the best available past research, we find that the costs of
business-as-usual for water supply could reach $950 billion per year by 2100, while the
anticipated gains in crop yields may be small, and would in any case vanish by mid-century.
The annual costs of these four effects alone adds up to $1.8 trillion in 2100 or 1.8 percent of U.S.
output in the business-as-usual scenario, as summarized in Table 3 below. The total cost of these
four types of damages, however, only represents a lower limit on the total cost of the business-
as-usual scenario; many other kinds of damages, while also likely to have important effects on
the U.S. economy, are more difficult to estimate. Damage to commercial real estate from
inundation, damage to or obsolesce of public and private infrastructure from rapidly changing
temperatures, and losses to regional tourism industries as the best summer and winter vacation
climates migrate north – just to name a few – are all likely effects of climate change that may be
costly in the United States. Effects on human health, natural environments, and endangered
species add other important climate damages, which are difficult or impossible to price.
U.S. Costs of Inaction: Rapid Stabilization Scenario
With immediate, large-scale reductions in greenhouse gas emissions, it is still possible for
changes in the world’s climate to remain relatively small. The rapid stabilization case is an
optimistic estimate of the impacts of the most rigorous policy prescription under discussion
today: “80 by 2050”, or an 80 percent reduction in U.S. emissions by 2050, accompanied by a 50
percent reduction in total world emissions and continuing reductions thereafter. By 2100 in the
rapid stabilization case, U.S. temperatures rise by 2 to 4ºF (see Table 2) and sea levels rise 7
inches, but precipitation levels and other climatic trends remain at their historical levels.
9
10
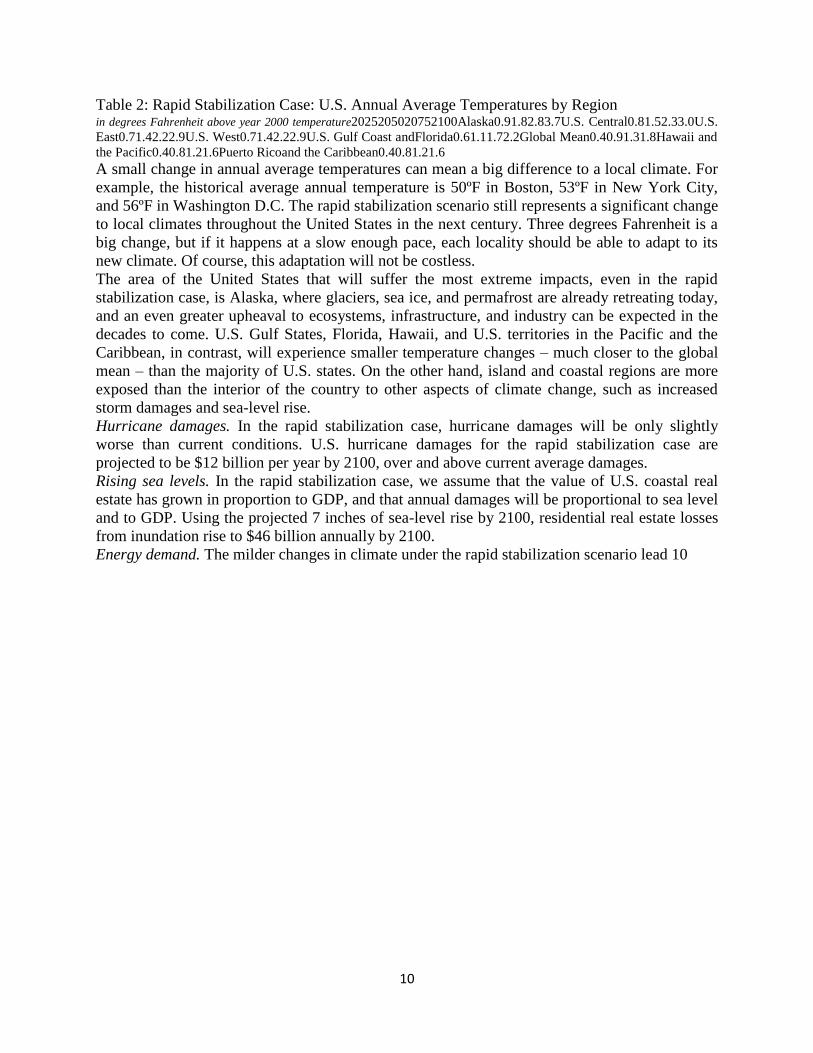
Table 2: Rapid Stabilization Case: U.S. Annual Average Temperatures by Region in degrees Fahrenheit above year 2000 temperature2025205020752100Alaska0.91.82.83.7U.S. Central0.81.52.33.0U.S.
East0.71.42.22.9U.S. West0.71.42.22.9U.S. Gulf Coast andFlorida0.61.11.72.2Global Mean0.40.91.31.8Hawaii and
the Pacific0.40.81.21.6Puerto Ricoand the Caribbean0.40.81.21.6
A small change in annual average temperatures can mean a big difference to a local climate. For
example, the historical average annual temperature is 50ºF in Boston, 53ºF in New York City,
and 56ºF in Washington D.C. The rapid stabilization scenario still represents a significant change
to local climates throughout the United States in the next century. Three degrees Fahrenheit is a
big change, but if it happens at a slow enough pace, each locality should be able to adapt to its
new climate. Of course, this adaptation will not be costless.
The area of the United States that will suffer the most extreme impacts, even in the rapid
stabilization case, is Alaska, where glaciers, sea ice, and permafrost are already retreating today,
and an even greater upheaval to ecosystems, infrastructure, and industry can be expected in the
decades to come. U.S. Gulf States, Florida, Hawaii, and U.S. territories in the Pacific and the
Caribbean, in contrast, will experience smaller temperature changes – much closer to the global
mean – than the majority of U.S. states. On the other hand, island and coastal regions are more
exposed than the interior of the country to other aspects of climate change, such as increased
storm damages and sea-level rise.
Hurricane damages. In the rapid stabilization case, hurricane damages will be only slightly
worse than current conditions. U.S. hurricane damages for the rapid stabilization case are
projected to be $12 billion per year by 2100, over and above current average damages.
Rising sea levels. In the rapid stabilization case, we assume that the value of U.S. coastal real
estate has grown in proportion to GDP, and that annual damages will be proportional to sea level
and to GDP. Using the projected 7 inches of sea-level rise by 2100, residential real estate losses
from inundation rise to $46 billion annually by 2100.
Energy demand. The milder changes in climate under the rapid stabilization scenario lead 10
11
to modest net increases in energy costs, amounting to $8 billion by 2100.
Water use. As temperatures rise, more water will be needed for irrigation, power plant cooling,
household needs, and other uses. Moreover, a higher air temperature leads to faster evaporation;
this could outweigh the gains from moderate increases in rainfall in some areas, leaving a smaller
amount of water available in rivers and reservoirs. The water sector costs for the rapid
stabilization case reach $220 billion in 2100; this is an important cost, but still far below the
economic burden for water supply under business as usual.
In the rapid stabilization scenario the annual costs of these four effects alone adds up to $287
billion in 2100, or 0.28 percent of U.S. output, as summarized in Table 3 below.
U.S. Costs of Inaction: Summary
How much can we reduce these climate-induced losses by limiting our emissions of greenhouse
gases? It is, unfortunately, no longer possible to avoid all adverse climate impacts. Some change
from the pre-industrial climate has already taken place, and more is bound to occur as a result of
greenhouse gases in the atmosphere, as well as the additional emissions that will be released in
the very near future (too soon for policy changes to take effect).
The cost of inaction is the difference between the estimates for the business-as-usual and rapid
stabilization cases, summarized in Table 3. The annual cost of inaction – the difference between
the two cases – reaches $1.56 trillion, or 1.53 percent of U.S. output by 2100. And there are
many other categories of costs that will be imposed by climate change, beyond the four areas we
have examined; the total cost of inaction is inevitably much greater.
The costs we have estimated are not evenly distributed throughout the country. Hurricane
damages are experienced almost entirely in the southeastern coastal states, on the Gulf Coast and
the Atlantic (Pacific storms that affect Hawaii and the West Coast are not included in this
calculation). Sea-level rise, of course, affects coastal areas. Energy costs are heavily concentrated
in southern states; many northern states would enjoy reductions in winter heating costs that are
roughly comparable to increased summer electricity expenses. Water supply costs are
concentrated in areas that become drier than at present, particularly the Southeast and Southwest.
Costs experienced in Alaska and Hawaii, and in Puerto Rico and other territories, are almost
entirely omitted from these calculations.
Moreover, the problem of climate change will not end at 2100. Under business as usual, the costs
of inaction will continue to mount, more and more rapidly, as time goes on. With rising
temperatures there will also be an ever-increasing probability of catastrophic
11

12
change, far worse than our estimates of non-catastrophic damages. Collapse of the Greenland ice
sheet would lead to sea-level rise of more than 20 feet, destroying coastal communities,
industries, and infrastructure everywhere; collapse of the West Antarctic ice sheet would be of a
similar magnitude. No one knows exactly at what point this would happen – but everyone knows
that ice melts faster as it gets warmer.
In short, the estimates in Table 3 are a very partial accounting for the costs of inaction on climate
change. The total costs are uncertain in detail, but are sure to be larger than our estimates.
Table 3: Costs of Inaction for Four Categories of Damages for the U.S. 20252050207521002025205020752100Hurricane DamagesBusiness-as-Usual$9$40$133$3970.05%0.12%0.22%0.39%Rapid
Stabilization$1$2$5$120.00%0.01%0.01%0.01%Cost of Inaction$9$38$128$3850.04%0.11%0.22%0.38%Real Estate LossesBusiness-as-Usual$34$80$173$3600.17%0.23%0.29%0.35%Rapid Stabilization$4$10$22$460.02%0.03%0.04%0.05%Cost of
Inaction$30$69$151$3140.15%0.20%0.25%0.31%Energy Sector CostsBusiness-as-Usual$28$47$82$1410.14%0.14%0.14%0.14%Rapid
Stabilization$2$3$5$80.01%0.01%0.01%0.01%Cost of Inaction$26$45$77$1330.13%0.13%0.13%0.13%Water CostsBusiness-as-Usual$200$336$565$9501.00%0.98%0.95%0.93%Rapid Stabilization$46$78$131$2200.23%0.23%0.22%0.22%Cost of
Inaction$154$258$434$7290.77%0.75%0.73%0.71%Total Costs for Four CategoriesBusiness-as-
Usual$271$503$953$1,8471.36%1.46%1.61%1.81%Rapid Stabilization$53$93$163$2870.27%0.27%0.28%0.28%Cost of
Inaction$218$410$790$1,5611.09%1.19%1.33%1.53%in billions of 2006 dollarsas a percentage of GDP
12
13
Florida: Higher Risks, Higher Costs
The costs of climate change, measured as a share of GDP, are lower for the U.S. than the world
as a whole. This is because the U.S. is colder than many parts of the world, is better supplied
with fresh water, and has an unusually large percentage of population and economic activity in
the interior of the country, far from the coastal damages caused by hurricanes and sea-level rise.
Yet the U.S., of course, is large and varied; in hotter, water-stressed, and coastal states, nature
and geography offer less protection against climate change.
A case in point is Florida, where a currently comfortable climate has led to a booming economy
and fast-growing population – and where the risks and the costs of climate change will be much
worse than the national average. In an analysis parallel to our national study, we found that a
partial accounting of the costs of inaction on climate change could amount to as much as 5
percent of Florida’s state income (gross state product, or GSP) by the end of this century. As
with the national estimates, this figure excludes many important costs of climate change for
which we could not develop meaningful monetary estimates; and all the costs will become larger
and larger as temperatures continue to rise beyond 2100.
Our Florida analysis used the same climate projections and the same two scenarios as the
national study. Although the temperature changes projected for Florida are slightly smaller than
for most other states, they are still important: business as usual will make Florida, on average,
5ºF warmer than today in 2050 and 10ºF warmer in 2100. The winter, when temperatures are
lowest, is currently the most popular time to visit Florida; how much of the state’s appeal to
visitors and residents will survive an increase in year-round temperatures?
Three of our four categories of national cost estimates could be calculated for Florida; each of
them was, unsurprisingly, more serious in the Sunshine State than elsewhere in the nation. The
impacts of sea-level rise will be felt all along Florida’s lengthy coastline. The calculation of
residential real estate losses due to sea-level rise, performed exactly as in the national study,
yields a larger percentage of the state economy.
And it is not only residential property that is at risk. Data available for Florida made it possible
for us to perform a GIS analysis of the effects of 27 inches of sea level rise – a level that will be
reached around 2060 under business as usual. If nothing is done to protect the coastline, 27
inches of sea level rise would put 9 percent of the state’s land area, including the homes of 1.5
million people, under water. Of the two counties at the southern tip of the state, Monroe County
– including the Keys and most of the Everglades – would lose 99.6 percent of its land area, while
Miami-Dade County would lose 70 percent of its area.
13
14
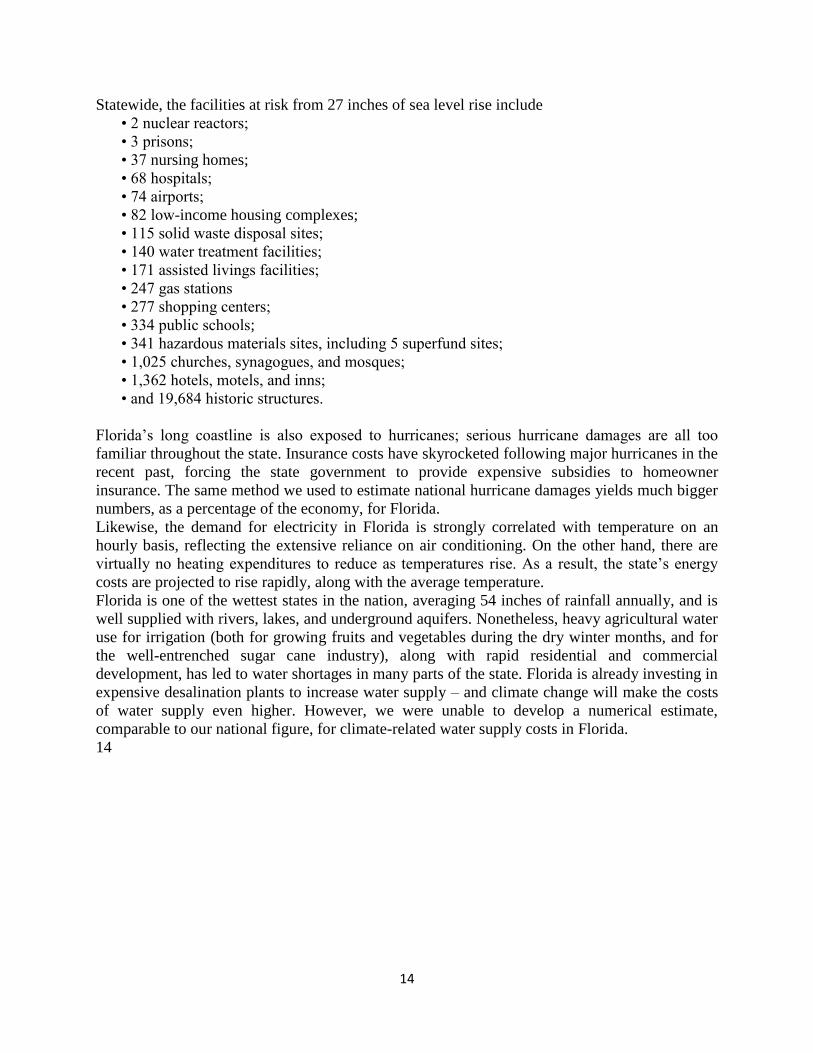
Statewide, the facilities at risk from 27 inches of sea level rise include
• 2 nuclear reactors;
• 3 prisons;
• 37 nursing homes;
• 68 hospitals;
• 74 airports;
• 82 low-income housing complexes;
• 115 solid waste disposal sites;
• 140 water treatment facilities;
• 171 assisted livings facilities;
• 247 gas stations
• 277 shopping centers;
• 334 public schools;
• 341 hazardous materials sites, including 5 superfund sites;
• 1,025 churches, synagogues, and mosques;
• 1,362 hotels, motels, and inns;
• and 19,684 historic structures.
Florida’s long coastline is also exposed to hurricanes; serious hurricane damages are all too
familiar throughout the state. Insurance costs have skyrocketed following major hurricanes in the
recent past, forcing the state government to provide expensive subsidies to homeowner
insurance. The same method we used to estimate national hurricane damages yields much bigger
numbers, as a percentage of the economy, for Florida.
Likewise, the demand for electricity in Florida is strongly correlated with temperature on an
hourly basis, reflecting the extensive reliance on air conditioning. On the other hand, there are
virtually no heating expenditures to reduce as temperatures rise. As a result, the state’s energy
costs are projected to rise rapidly, along with the average temperature.
Florida is one of the wettest states in the nation, averaging 54 inches of rainfall annually, and is
well supplied with rivers, lakes, and underground aquifers. Nonetheless, heavy agricultural water
use for irrigation (both for growing fruits and vegetables during the dry winter months, and for
the well-entrenched sugar cane industry), along with rapid residential and commercial
development, has led to water shortages in many parts of the state. Florida is already investing in
expensive desalination plants to increase water supply – and climate change will make the costs
of water supply even higher. However, we were unable to develop a numerical estimate,
comparable to our national figure, for climate-related water supply costs in Florida.
14
15
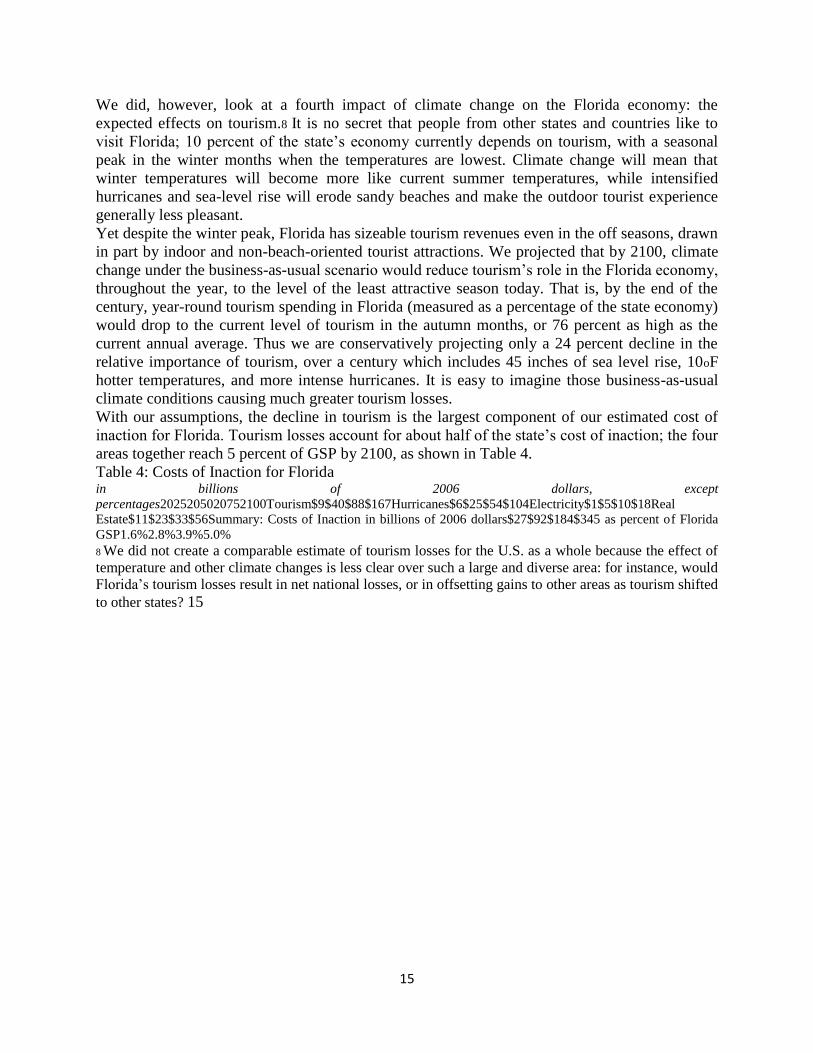
We did, however, look at a fourth impact of climate change on the Florida economy: the
expected effects on tourism.8 It is no secret that people from other states and countries like to
visit Florida; 10 percent of the state’s economy currently depends on tourism, with a seasonal
peak in the winter months when the temperatures are lowest. Climate change will mean that
winter temperatures will become more like current summer temperatures, while intensified
hurricanes and sea-level rise will erode sandy beaches and make the outdoor tourist experience
generally less pleasant.
Yet despite the winter peak, Florida has sizeable tourism revenues even in the off seasons, drawn
in part by indoor and non-beach-oriented tourist attractions. We projected that by 2100, climate
change under the business-as-usual scenario would reduce tourism’s role in the Florida economy,
throughout the year, to the level of the least attractive season today. That is, by the end of the
century, year-round tourism spending in Florida (measured as a percentage of the state economy)
would drop to the current level of tourism in the autumn months, or 76 percent as high as the
current annual average. Thus we are conservatively projecting only a 24 percent decline in the
relative importance of tourism, over a century which includes 45 inches of sea level rise, 10oF
hotter temperatures, and more intense hurricanes. It is easy to imagine those business-as-usual
climate conditions causing much greater tourism losses.
With our assumptions, the decline in tourism is the largest component of our estimated cost of
inaction for Florida. Tourism losses account for about half of the state’s cost of inaction; the four
areas together reach 5 percent of GSP by 2100, as shown in Table 4.
Table 4: Costs of Inaction for Florida in billions of 2006 dollars, except
percentages2025205020752100Tourism$9$40$88$167Hurricanes$6$25$54$104Electricity$1$5$10$18Real
Estate$11$23$33$56Summary: Costs of Inaction in billions of 2006 dollars$27$92$184$345 as percent of Florida
GSP1.6%2.8%3.9%5.0%
8 We did not create a comparable estimate of tourism losses for the U.S. as a whole because the effect of
temperature and other climate changes is less clear over such a large and diverse area: for instance, would
Florida’s tourism losses result in net national losses, or in offsetting gains to other areas as tourism shifted
to other states? 15
16
Maximum Vulnerability: Climate Costs in the Caribbean
Some parts of the U.S., such as Florida, will face larger climate costs than others. But the worst
climate impacts will be experienced in other countries that are uniquely vulnerable to the
anticipated changes. Low-lying coastal regions and, above all, small island nations, are most
immediately at risk.
In another study of the costs of inaction, we analyzed the expected costs of climate change for 24
island nations and territories in the Caribbean. Data limitations did not allow us to produce an
estimate that is strictly consistent with our U.S. and Florida projections.9 We did, however,
estimate three categories of climate damages: increased hurricane damages, infrastructure
damages due to sea-level rise, and losses of tourism revenues. The cost of inaction on climate
change – the difference between the business-as-usual and rapid stabilization scenarios –
amounted to 10 percent of the region’s GDP by 2050, and 22 percent by 2100.
While the average impact is large, the costs vary widely from one island to another. The largest,
most diversified and least tourism-dependent economies, such as Puerto Rico and Trinidad and
Tobago, face lower than average projected damages, as do a few of the smaller islands that lie
outside the usual path of hurricanes, or rise well above sea level. On the other hand, greater than
average damages are projected for low-lying islands, and those that are frequently struck by
hurricanes. Rising sea levels and increased intensity of hurricanes will make some islands
unattractive to tourists, if not entirely uninhabitable to the local population. For some islands that
are heavily dependent on tourism, the expected losses of visitors and revenues due to climate
change will all but destroy the local economy.
Haiti, the poorest nation of the region, is also projected to suffer overwhelming damage to its
infrastructure, which it will be unable to afford to replace – a projection that is sadly consistent
with that country’s experience of recent storm damages. The destruction of some Caribbean
economies by climate change will lead to increased migration out of the region, and the United
States will be one of the most likely destinations for the new climate refugees. Thus even in the
narrowest terms of self-interest (let alone a broader and more reasonable humanitarian
perspective), we cannot view the destruction of Caribbean nations by climate change as merely
someone else’s problem. 9 The U.S. and Florida projections discussed above include projections of expected growth in population
and incomes, based on standard government sources. For the 24 disparate political jurisdictions in the
Caribbean study, no such economic and demographic projections were available. Therefore, following the
example of an earlier World Bank study of some of the Caribbean islands, we assumed no change in
population or per capita income for the region. In cases where projected damages grow at the same rate as
GDP, our estimates for damages as a percentage of GDP will remain valid under a range of growth rates.
16
17
Conclusion: We Can’t Afford the Costs of Inaction
There are real costs involved in taking immediate and forceful action to reduce carbon emissions
and control the risks of climate change. The best-researched estimates, such as those from
Nicholas Stern, or from McKinsey & Company, suggest that roughly one percent of world output
needs to be spent on climate mitigation, for some years to come. This is not an amount that
should be spent lightly, without careful analysis and planning.
Yet the costs of emission reduction will be a bargain, compared to the high and steadily rising
costs of inaction. The message of my research, as summarized in this testimony, is that for the
United States as a whole, even a partial accounting of the costs of inaction is above one percent
of GDP by 2025, and grows steadily worse as time passes and temperatures rise. The most
vulnerable parts of the country, such as Florida, face proportionally much greater risks, with a
partial accounting of the costs of inaction exceeding five percent of that state’s income by the
end of this century. Just next door, in the Caribbean, some of the world’s most vulnerable nations
face more extreme damages, in some cases amounting to near-total destruction of islands and
their economies, from the projected business-as-usual climate impacts within this century. This
should be viewed by Americans, not just as a loss of exotic vacation opportunities, but as a
humanitarian crisis in our backyard, and a likely source of increasing numbers of desperate
refugees arriving on our shores.
The bottom line is clear: the cost of taking action to reduce emissions is an offer we can’t afford
to refuse.
17
Related Documents


