תדריך מעבדה– בדיקות לא הורסות בדיקת רדיוגרפיה1 . תקציר: 1 . שיטת הרדיוגרפיה בקרני הכרות עםx כבדיקה ללא הרס ולימוד המשתנים החשובים ביי שומה. 2 . ביצוע צילום ופיתוח של תמונה בשיטת הרדיוגרפיה. 3 . פענוח תמונה שצולמה בשיטת הרדיוגרפיה תוך שימוש בדגמי סטנדרט והמרת נתונים לדגמי הניסוי. * נלקח מאתר האינטרנטhtm . communitycollege / CommunityCollege / EducationResources / org . ed - ndt . www :// http 2 . רקע תיאורטי2.1. Present State of Radiography* In many ways, radiography has changed little from the early days of its use. We still capture a shadow image on film using similar procedures and processes technicians were using in the late 1800's. Today, however, we are able to generate images of higher quality and greater sensitivity through the use of higher quality films with a larger variety of film grain sizes. Film processing has evolved to an automated state, producing more consistent film quality by removing manual processing variables. Electronics and computers allow technicians to now capture images digitally. The use of "filmless radiography" provides a means of capturing an image, digitally enhancing, sending the image anywhere in the world, and archiving an image that will not deteriorate with time. Technological advances have provided industry with smaller, lighter, and very portable equipment that produce high quality X-rays. The use of linear accelerators provide a means of generating extremely short wavelength, highly penetrating radiation, a concept dreamed of only a few short years ago. While the process has changed little, technology has evolved allowing radiography to be widely used in numerous areas of inspection. Radiography has seen expanded

Welcome message from author
This document is posted to help you gain knowledge. Please leave a comment to let me know what you think about it! Share it to your friends and learn new things together.
Transcript
–תדריך מעבדה
בדיקות לא הורסות
בדיקת רדיוגרפיה
1.
: תקציר
1 .
xהכרות עם שיטת הרדיוגרפיה בקרני
כבדיקה
ללא הרס ולימוד המשתנים החשובים
ביי
.שומה
2 .
.ביצוע צילום ופיתוח של תמונה בשיטת הרדיוגרפיה
3 .
פענוח
תמונה שצולמה בשיטת הרדיוגרפיה תוך
שימוש
בדגמי סטנדרט והמרת נתונים לדגמי
.הניסוי
*
נלקח מאתר האינטרנט htm.communitycollege/CommunityCollege/EducationResources/org.ed-ndt.www://http
2.
רקע תיאורטי
2.1. Present State of Radiography*
In many ways, radiography has changed little from the early days of its use. We still
capture a shadow image on film using similar procedures and processes technicians
were using in the late 1800's. Today, however, we are able to generate images of
higher quality and greater sensitivity through the use of higher quality films with a
larger variety of film grain sizes. Film processing has evolved to an automated state,
producing more consistent film quality by removing manual processing variables.
Electronics and computers allow technicians to now capture images digitally. The use
of "filmless radiography" provides a means of capturing an image, digitally
enhancing, sending the image anywhere in the world, and archiving an image that will
not deteriorate with time. Technological advances have provided industry with
smaller, lighter, and very portable equipment that produce high quality X-rays. The
use of linear accelerators provide a means of generating extremely short wavelength,
highly penetrating radiation, a concept dreamed of only a few short years ago.
While the process has changed little, technology has evolved allowing radiography to
be widely used in numerous areas of inspection. Radiography has seen expanded
usage in industry to inspect not only welds and castings, but to radiographically
inspect items such as airbags and canned food products. Radiography has found use in
metallurgical material identification and security systems at airports and other
facilities. Gamma ray inspection has also changed considerably since the Curies'
discovery of radium. Man-made isotopes of today are far stronger and offer the
technician a wide range of energy levels and half-lives. The technician can select Co-
60 which will effectively penetrate very thick materials, or select a lower energy
isotope, such as Tm-170, which can be used to inspect plastics and very thin or low
density materials. Today gamma rays find wide application in industries such as
petrochemical, casting, welding, and aerospace.
2.2. Future Direction of Radiographic Education*
Although many of the methods and techniques developed over a century ago remain
in use, computers are slowly becoming a part of radiographic inspection. The future
of radiography will likely see many changes. As noted earlier, companies are
performing many inspections without the aid of film. Radiographers of the future will
capture images in digitized form and e-mail them to the customer when the inspection
has been completed. Film evaluation will likely be left to computers. Inspectors may
capture a digitized image, feed them into a computer and wait for a printout of the
image with an accept/reject report. Systems will be able to scan a part and present a
three-dimensional image to the radiographer, helping him or her to locate the defect
within the part. Inspectors in the future will be able to peal away layer after layer of a
part to evaluate the material in much greater detail. Color images, much like computer
generated ultrasonic C-scans of today, will make interpretation of indications much
more reliable and less time consuming.
Educational techniques and materials will need to be revised and updated to keep pace
with technology and meet the requirements of industry. These needs may well be met
with computers. Computer programs can simulate radiographic inspections using a
computer aided design (CAD) model of a part to produce physically accurate
simulated x-ray radiographic images. Programs allow the operator to select different
parts to inspect, adjust the placement and orientation of the part to obtain the proper
equipment/part relationships, and adjust all the usual x-ray generator settings to arrive
at the desired radiographic film exposure.
Computer simulation will likely have its greatest impact in the classroom, allowing
the student to see results in almost real-time. Simulators and computers may well
become the primary tool for instructors as well as students in the technical classroom.
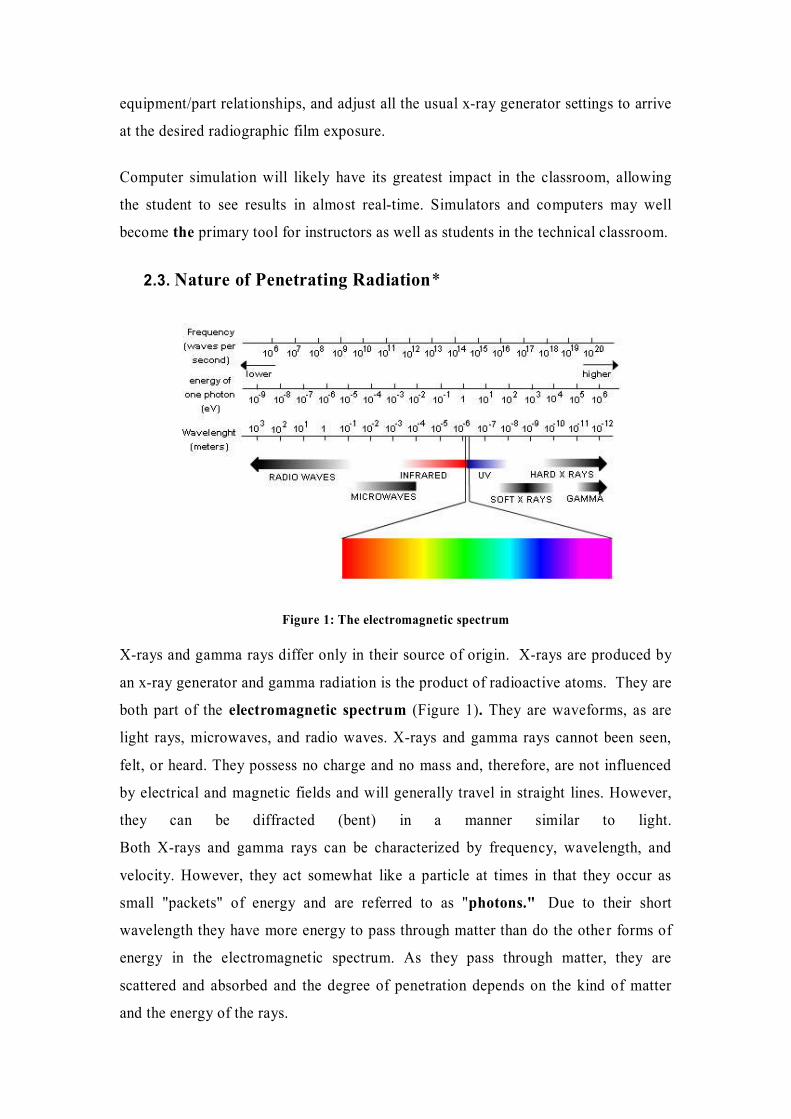
2.3. Nature of Penetrating Radiation*
Figure 1: The electromagnetic spectrum
X-rays and gamma rays differ only in their source of origin. X-rays are produced by
an x-ray generator and gamma radiation is the product of radioactive atoms. They are
both part of the electromagnetic spectrum (Figure 1). They are waveforms, as are
light rays, microwaves, and radio waves. X-rays and gamma rays cannot been seen,
felt, or heard. They possess no charge and no mass and, therefore, are not influenced
by electrical and magnetic fields and will generally travel in straight lines. However,
they can be diffracted (bent) in a manner similar to light.
Both X-rays and gamma rays can be characterized by frequency, wavelength, and
velocity. However, they act somewhat like a particle at times in that they occur as
small "packets" of energy and are referred to as "photons." Due to their short
wavelength they have more energy to pass through matter than do the other forms of
energy in the electromagnetic spectrum. As they pass through matter, they are
scattered and absorbed and the degree of penetration depends on the kind of matter
and the energy of the rays.
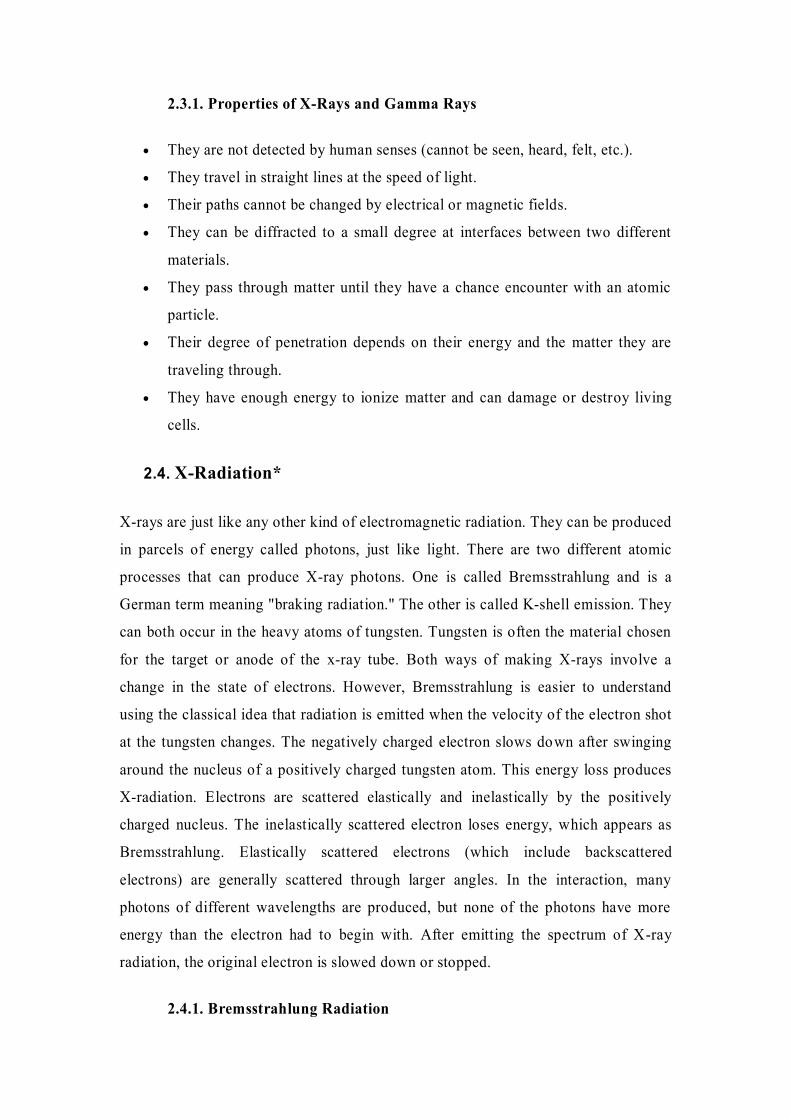
2.3.1. Properties of X-Rays and Gamma Rays
They are not detected by human senses (cannot be seen, heard, felt, etc.).
They travel in straight lines at the speed of light.
Their paths cannot be changed by electrical or magnetic fields.
They can be diffracted to a small degree at interfaces between two different
materials.
They pass through matter until they have a chance encounter with an atomic
particle.
Their degree of penetration depends on their energy and the matter they are
traveling through.
They have enough energy to ionize matter and can damage or destroy living
cells.
2.4. X-Radiation*
X-rays are just like any other kind of electromagnetic radiation. They can be produced
in parcels of energy called photons, just like light. There are two different atomic
processes that can produce X-ray photons. One is called Bremsstrahlung and is a
German term meaning "braking radiation." The other is called K-shell emission. They
can both occur in the heavy atoms of tungsten. Tungsten is often the material chosen
for the target or anode of the x-ray tube. Both ways of making X-rays involve a
change in the state of electrons. However, Bremsstrahlung is easier to understand
using the classical idea that radiation is emitted when the velocity of the electron shot
at the tungsten changes. The negatively charged electron slows down after swinging
around the nucleus of a positively charged tungsten atom. This energy loss produces
X-radiation. Electrons are scattered elastically and inelastically by the positively
charged nucleus. The inelastically scattered electron loses energy, which appears as
Bremsstrahlung. Elastically scattered electrons (which include backscattered
electrons) are generally scattered through larger angles. In the interaction, many
photons of different wavelengths are produced, but none of the photons have more
energy than the electron had to begin with. After emitting the spectrum of X-ray
radiation, the original electron is slowed down or stopped.
2.4.1. Bremsstrahlung Radiation
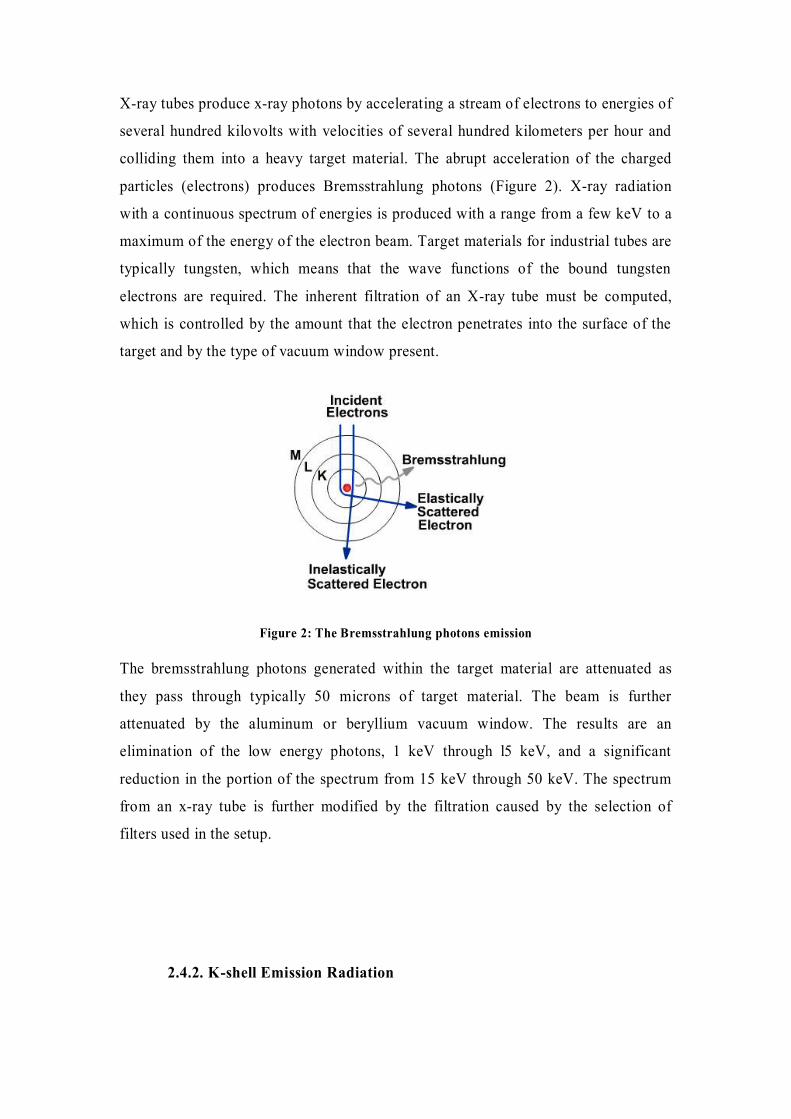
X-ray tubes produce x-ray photons by accelerating a stream of electrons to energies of
several hundred kilovolts with velocities of several hundred kilometers per hour and
colliding them into a heavy target material. The abrupt acceleration of the charged
particles (electrons) produces Bremsstrahlung photons (Figure 2). X-ray radiation
with a continuous spectrum of energies is produced with a range from a few keV to a
maximum of the energy of the electron beam. Target materials for industrial tubes are
typically tungsten, which means that the wave functions of the bound tungsten
electrons are required. The inherent filtration of an X-ray tube must be computed,
which is controlled by the amount that the electron penetrates into the surface of the
target and by the type of vacuum window present.
Figure 2: The Bremsstrahlung photons emission
The bremsstrahlung photons generated within the target material are attenuated as
they pass through typically 50 microns of target material. The beam is further
attenuated by the aluminum or beryllium vacuum window. The results are an
elimination of the low energy photons, 1 keV through l5 keV, and a significant
reduction in the portion of the spectrum from 15 keV through 50 keV. The spectrum
from an x-ray tube is further modified by the filtration caused by the selection of
filters used in the setup.
2.4.2. K-shell Emission Radiation
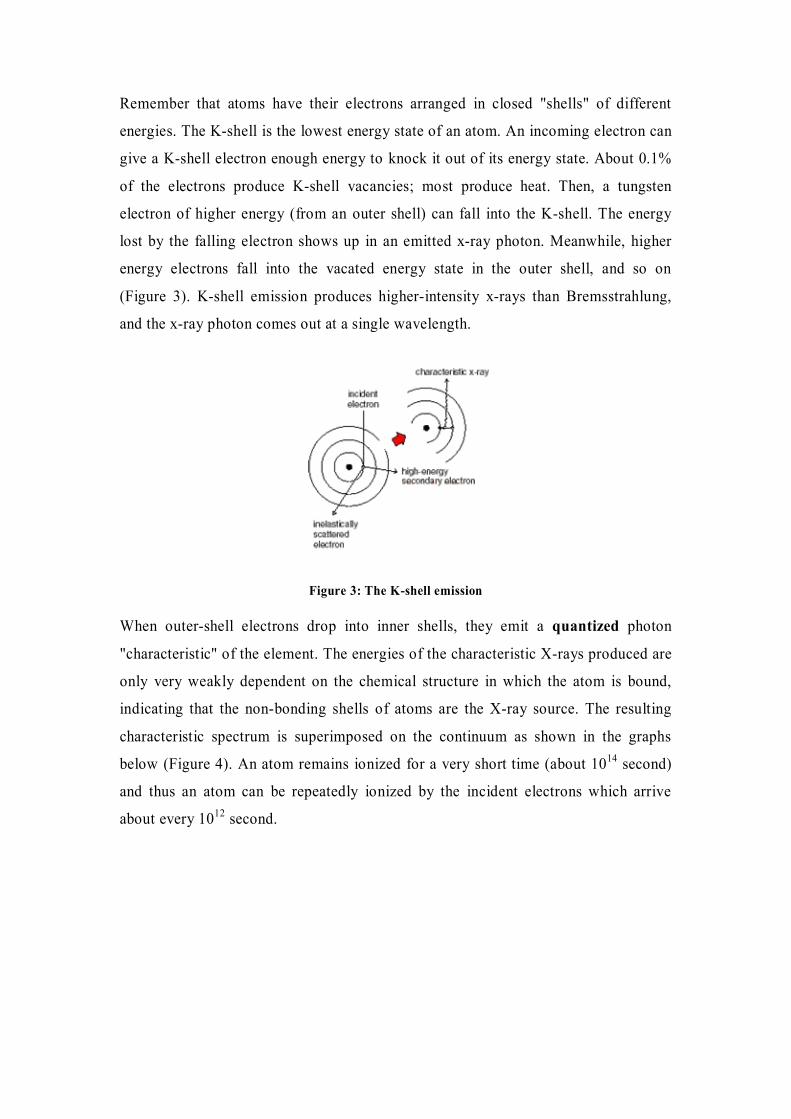
Remember that atoms have their electrons arranged in closed "shells" of different
energies. The K-shell is the lowest energy state of an atom. An incoming electron can
give a K-shell electron enough energy to knock it out of its energy state. About 0.1%
of the electrons produce K-shell vacancies; most produce heat. Then, a tungsten
electron of higher energy (from an outer shell) can fall into the K-shell. The energy
lost by the falling electron shows up in an emitted x-ray photon. Meanwhile, higher
energy electrons fall into the vacated energy state in the outer shell, and so on
(Figure 3). K-shell emission produces higher-intensity x-rays than Bremsstrahlung,
and the x-ray photon comes out at a single wavelength.
Figure 3: The K-shell emission
When outer-shell electrons drop into inner shells, they emit a quantized photon
"characteristic" of the element. The energies of the characteristic X-rays produced are
only very weakly dependent on the chemical structure in which the atom is bound,
indicating that the non-bonding shells of atoms are the X-ray source. The resulting
characteristic spectrum is superimposed on the continuum as shown in the graphs
below (Figure 4). An atom remains ionized for a very short time (about 1014
second)
and thus an atom can be repeatedly ionized by the incident electrons which arrive
about every 1012
second.
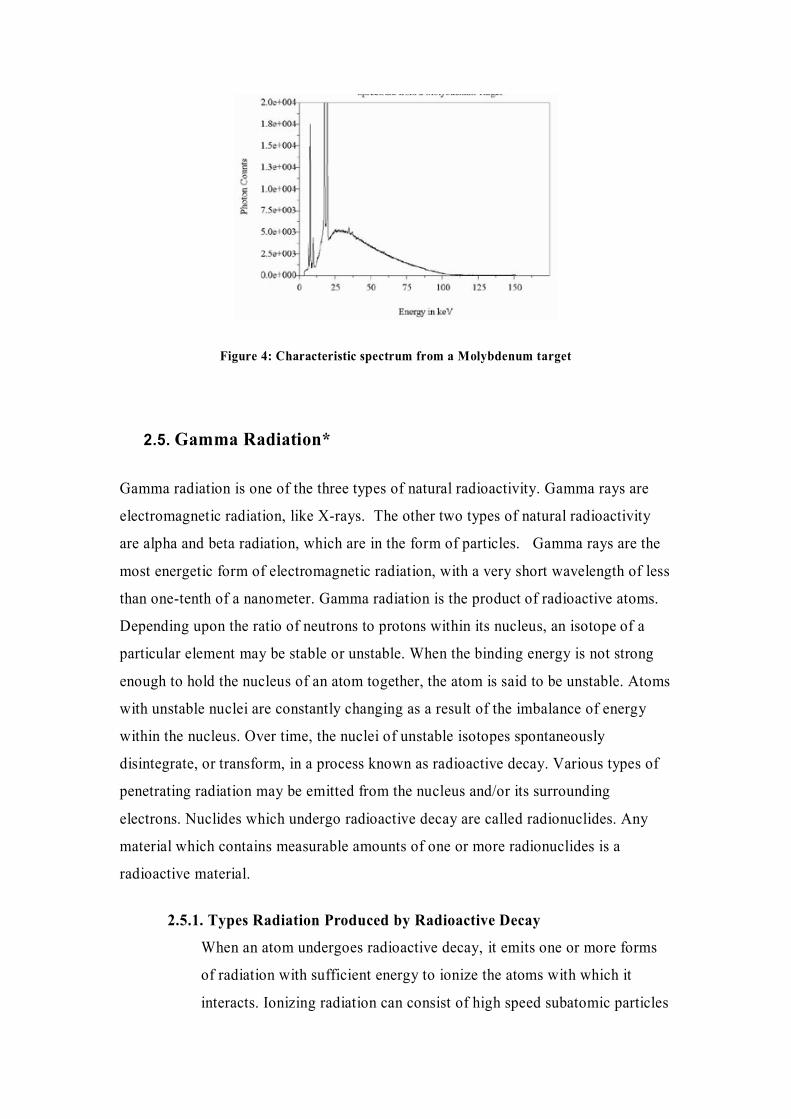
Figure 4: Characteristic spectrum from a Molybdenum target
2.5. Gamma Radiation*
Gamma radiation is one of the three types of natural radioactivity. Gamma rays are
electromagnetic radiation, like X-rays. The other two types of natural radioactivity
are alpha and beta radiation, which are in the form of particles. Gamma rays are the
most energetic form of electromagnetic radiation, with a very short wavelength of less
than one-tenth of a nanometer. Gamma radiation is the product of radioactive atoms.
Depending upon the ratio of neutrons to protons within its nucleus, an isotope of a
particular element may be stable or unstable. When the binding energy is not strong
enough to hold the nucleus of an atom together, the atom is said to be unstable. Atoms
with unstable nuclei are constantly changing as a result of the imbalance of energy
within the nucleus. Over time, the nuclei of unstable isotopes spontaneously
disintegrate, or transform, in a process known as radioactive decay. Various types of
penetrating radiation may be emitted from the nucleus and/or its surrounding
electrons. Nuclides which undergo radioactive decay are called radionuclides. Any
material which contains measurable amounts of one or more radionuclides is a
radioactive material.
2.5.1. Types Radiation Produced by Radioactive Decay
When an atom undergoes radioactive decay, it emits one or more forms
of radiation with sufficient energy to ionize the atoms with which it
interacts. Ionizing radiation can consist of high speed subatomic particles
ejected from the nucleus or electromagnetic radiation (gamma-rays)
emitted by either the nucleus or orbital electrons.
2.5.1.1.Alpha Particles
Certain radionuclides of high atomic mass (Ra226, U238, Pu239)
decay by the emission of alpha particles. These alpha particles are
tightly bound units of two neutrons and two protons each (He4
nucleus) and have a positive charge. Emission of an alpha particle
from the nucleus results in a decrease of two units of atomic number
(Z) and four units of mass number (A). Alpha particles are emitted
with discrete energies characteristic of the particular transformation
from which they originate. All alpha particles from a particular
radionuclide transformation will have identical energies.
2.5.1.2.Beta Particles
A nucleus with an unstable ratio of neutrons to protons may decay
through the emission of a high speed electron called a beta particle.
This results in a net change of one unit of atomic number (Z). Beta
particles have a negative charge and the beta particles emitted by a
specific radionuclide will range in energy from near zero up to a
maximum value, which is characteristic of the particular
transformation.
2.5.1.3.Gamma-rays
A nucleus which is in an excited state may emit one or more
photons (packets of electromagnetic radiation) of discrete energies.
The emission of gamma rays does not alter the number of protons or
neutrons in the nucleus but instead has the effect of moving the
nucleus from a higher to a lower energy state (unstable to stable).
Gamma ray emission frequently follows beta decay, alpha decay,
and other nuclear decay processes.
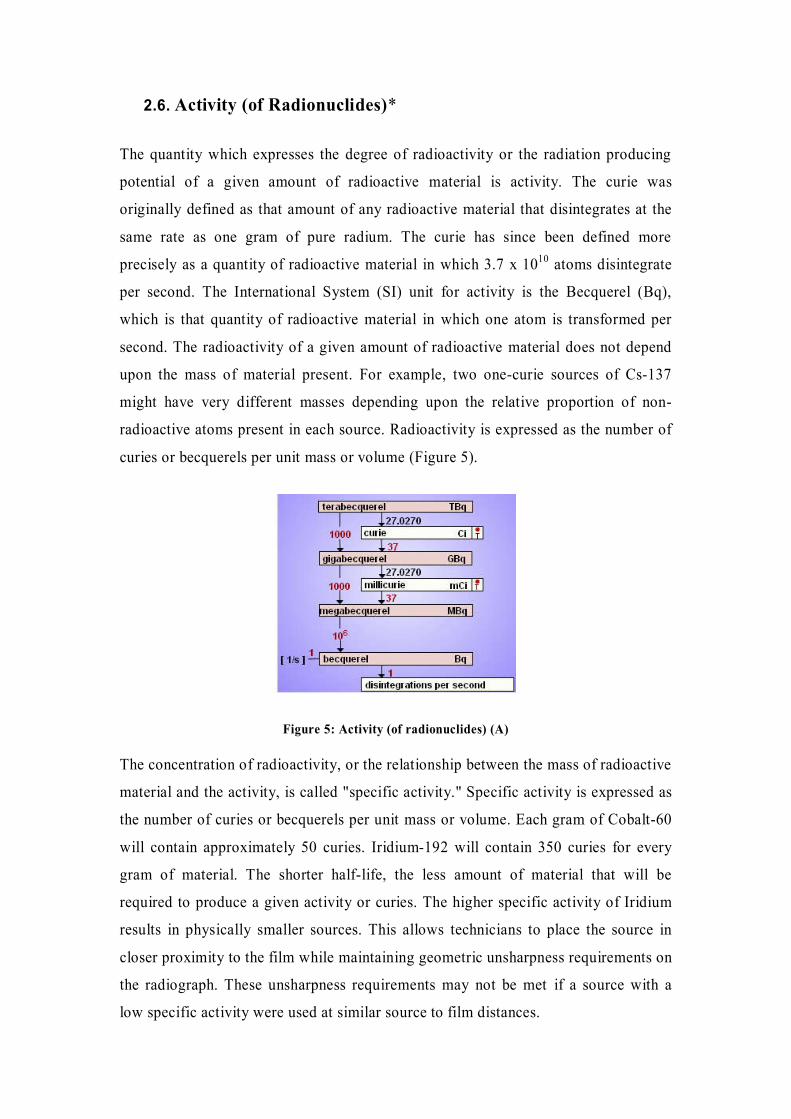
2.6. Activity (of Radionuclides)*
The quantity which expresses the degree of radioactivity or the radiation producing
potential of a given amount of radioactive material is activity. The curie was
originally defined as that amount of any radioactive material that disintegrates at the
same rate as one gram of pure radium. The curie has since been defined more
precisely as a quantity of radioactive material in which 3.7 x 10¹⁰
atoms disintegrate
per second. The International System (SI) unit for activity is the Becquerel (Bq),
which is that quantity of radioactive material in which one atom is transformed per
second. The radioactivity of a given amount of radioactive material does not depend
upon the mass of material present. For example, two one-curie sources of Cs-137
might have very different masses depending upon the relative proportion of non-
radioactive atoms present in each source. Radioactivity is expressed as the number of
curies or becquerels per unit mass or volume (Figure 5).
Figure 5: Activity (of radionuclides) (A)
The concentration of radioactivity, or the relationship between the mass of radioactive
material and the activity, is called "specific activity." Specific activity is expressed as
the number of curies or becquerels per unit mass or volume. Each gram of Cobalt-60
will contain approximately 50 curies. Iridium-192 will contain 350 curies for every
gram of material. The shorter half-life, the less amount of material that will be
required to produce a given activity or curies. The higher specific activity of Iridium
results in physically smaller sources. This allows technicians to place the source in
closer proximity to the film while maintaining geometric unsharpness requirements on
the radiograph. These unsharpness requirements may not be met if a source with a
low specific activity were used at similar source to film distances.
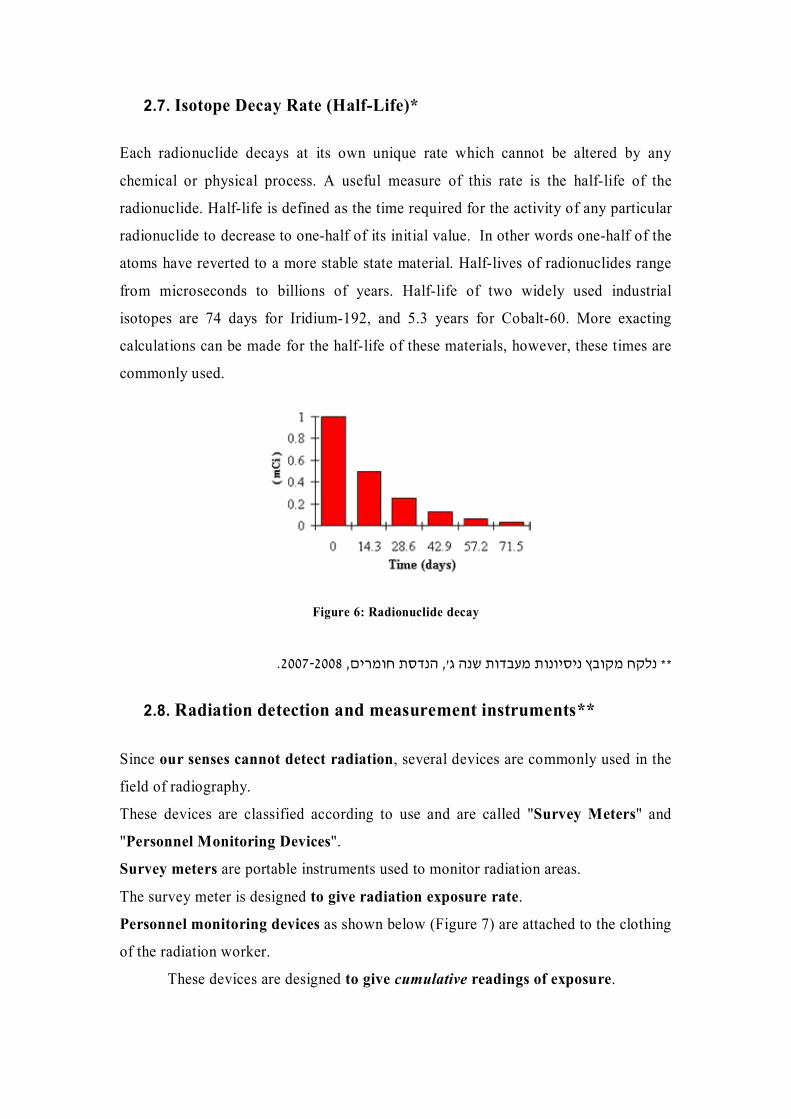
2.7. Isotope Decay Rate (Half-Life)*
Each radionuclide decays at its own unique rate which cannot be altered by any
chemical or physical process. A useful measure of this rate is the half-life of the
radionuclide. Half-life is defined as the time required for the activity of any particular
radionuclide to decrease to one-half of its initial value. In other words one-half of the
atoms have reverted to a more stable state material. Half-lives of radionuclides range
from microseconds to billions of years. Half-life of two widely used industrial
isotopes are 74 days for Iridium-192, and 5.3 years for Cobalt-60. More exacting
calculations can be made for the half-life of these materials, however, these times are
commonly used.
Figure 6: Radionuclide decay
**
', נלקח מקובץ ניסיונות מעבדות שנה ג
.2007-2008, הנדסת חומרים
2.8. Radiation detection and measurement instruments**
Since our senses cannot detect radiation, several devices are commonly used in the
field of radiography.
These devices are classified according to use and are called "Survey Meters" and
"Personnel Monitoring Devices".
Survey meters are portable instruments used to monitor radiation areas.
The survey meter is designed to give radiation exposure rate.
Personnel monitoring devices as shown below (Figure 7) are attached to the clothing
of the radiation worker.
These devices are designed to give cumulative readings of exposure.
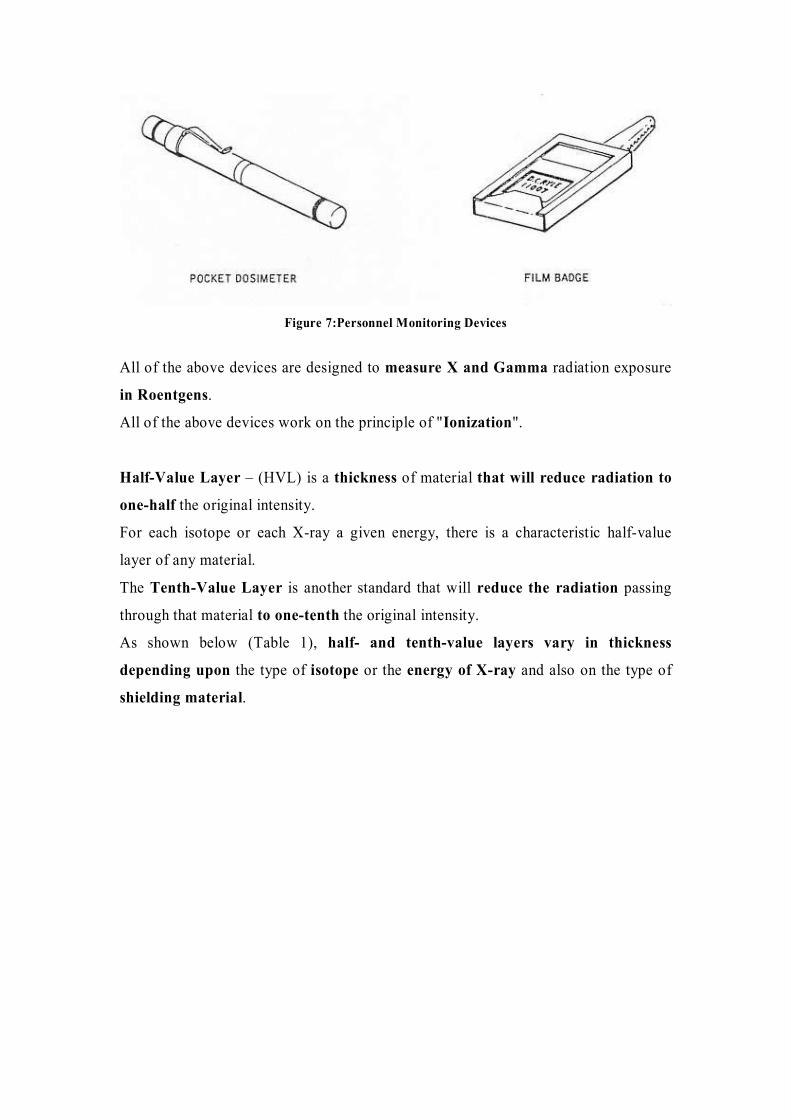
Figure 7:Personnel Monitoring Devices
All of the above devices are designed to measure X and Gamma radiation exposure
in Roentgens.
All of the above devices work on the principle of "Ionization".
Half-Value Layer – (HVL) is a thickness of material that will reduce radiation to
one-half the original intensity.
For each isotope or each X-ray a given energy, there is a characteristic half-value
layer of any material.
The Tenth-Value Layer is another standard that will reduce the radiation passing
through that material to one-tenth the original intensity.
As shown below (Table 1), half- and tenth-value layers vary in thickness
depending upon the type of isotope or the energy of X-ray and also on the type of
shielding material.
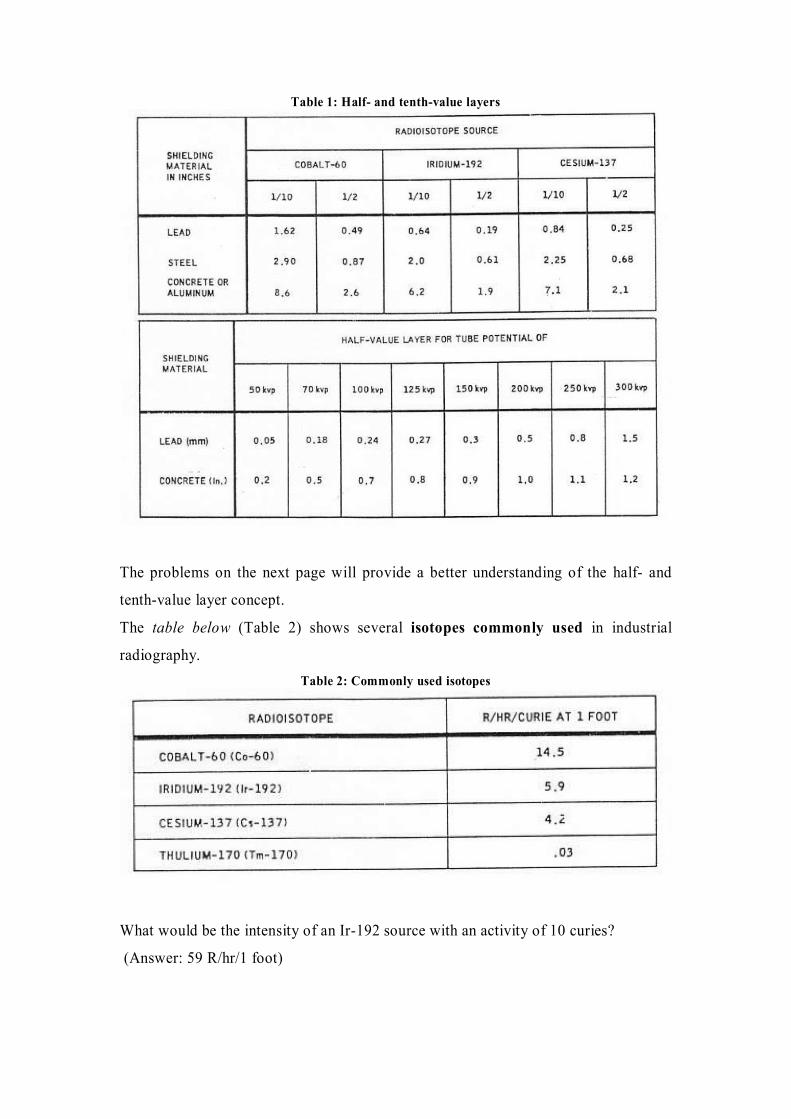
Table 1: Half- and tenth-value layers
The problems on the next page will provide a better understanding of the half- and
tenth-value layer concept.
The table below (Table 2) shows several isotopes commonly used in industrial
radiography.
Table 2: Commonly used isotopes
What would be the intensity of an Ir-192 source with an activity of 10 curies?
(Answer: 59 R/hr/1 foot)
2.9. Protection from radiation**
There are three basic means of providing protection from radiation:
1. Time – Controlling the length of time a person is exposed to radiation.
2. Distance – Controlling the distance between personnel and the source.
3. Shielding – Placing absorbing materials between personnel and source.
The above three factors must always be remembered when working in radiography
and will be discussed in this lesson.
Time
refers to the duration of radiation exposure.
The relationship of time to exposure is directly proportional. The longer you stay in
a radiation area, the more radiation exposure you receive.
(A person receiving 10mR in one hour would receive 80mR in 8 hours).
Distance
Radiation exposure decreases drastically as the distance from the source increases.
The mathematical law known as the "Inverse Square Law" states the relationship of
distance to varying radiation intensity.
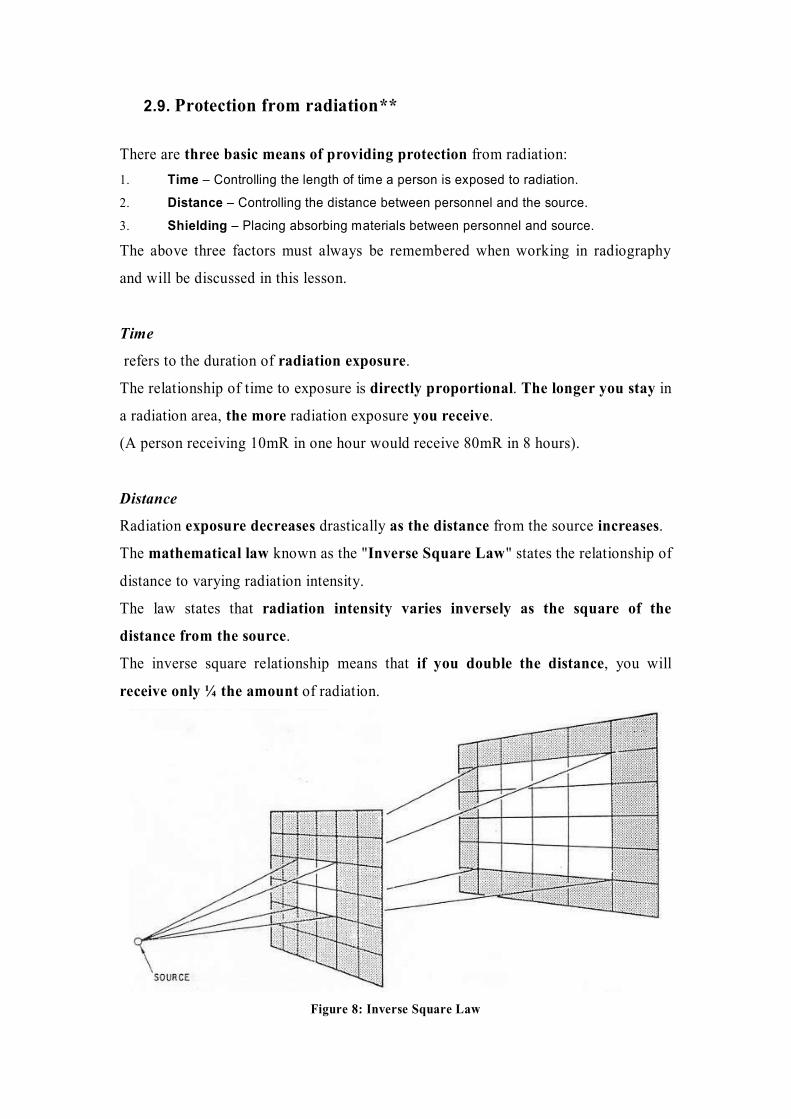
The law states that radiation intensity varies inversely as the square of the
distance from the source.
The inverse square relationship means that if you double the distance, you will
receive only ¼ the amount of radiation.
Figure 8: Inverse Square Law
In the diagram above (Figure 8), assume that the second series of squares is twice the
distance from the source as the first series.
This demonstrates that each of the 16 squares in the second series is receiving ¼ of
the amount as each of the four squares in the first series.
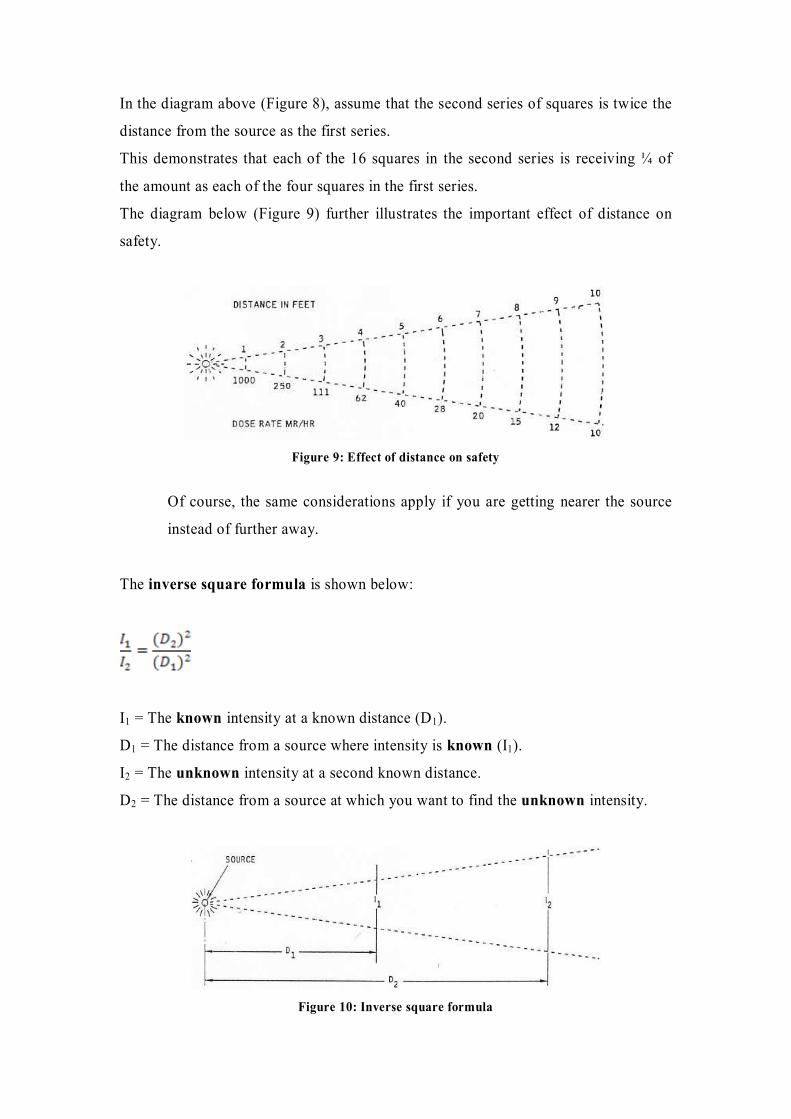
The diagram below (Figure 9) further illustrates the important effect of distance on
safety.
Figure 9: Effect of distance on safety
Of course, the same considerations apply if you are getting nearer the source
instead of further away.
The inverse square formula is shown below:
I1 = The known intensity at a known distance (D1).
D1 = The distance from a source where intensity is known (I1).
I2 = The unknown intensity at a second known distance.
D2 = The distance from a source at which you want to find the unknown intensity.
Figure 10: Inverse square formula
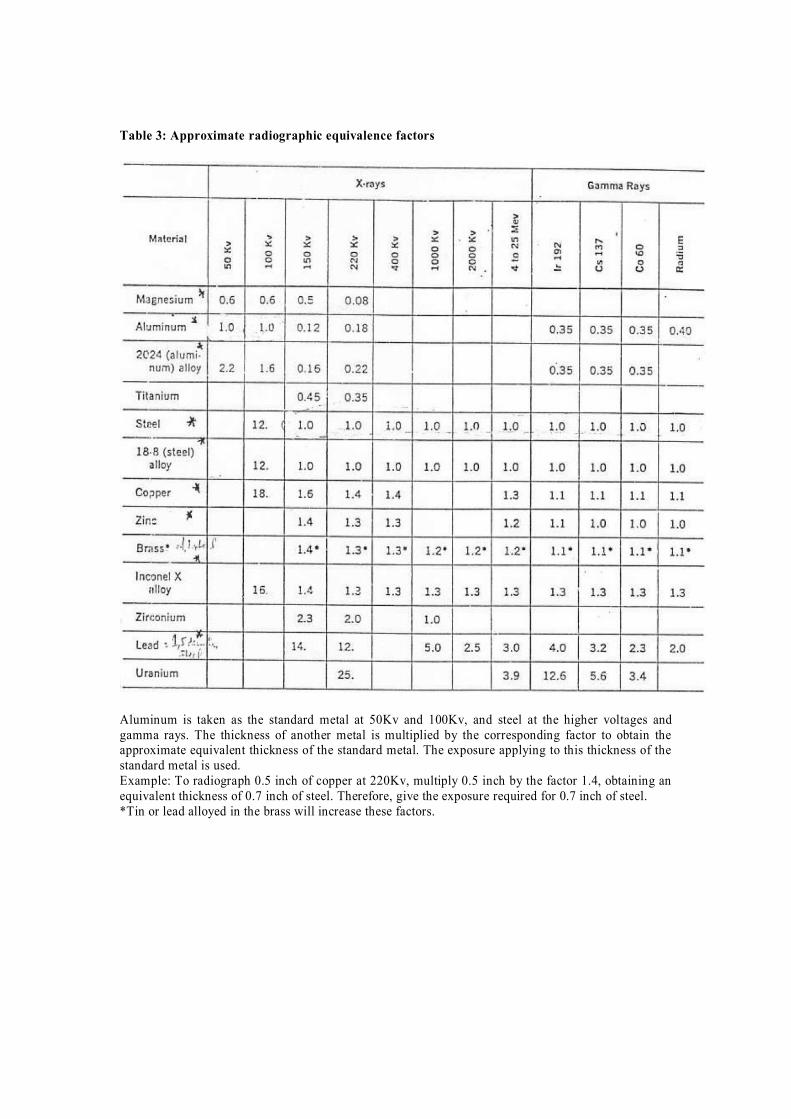
Table 3: Approximate radiographic equivalence factors
Aluminum is taken as the standard metal at 50Kv and 100Kv, and steel at the higher voltages and
gamma rays. The thickness of another metal is multiplied by the corresponding factor to obtain the approximate equivalent thickness of the standard metal. The exposure applying to this thickness of the
standard metal is used.
Example: To radiograph 0.5 inch of copper at 220Kv, multiply 0.5 inch by the factor 1.4, obtaining an
equivalent thickness of 0.7 inch of steel. Therefore, give the exposure required for 0.7 inch of steel.
*Tin or lead alloyed in the brass will increase these factors.
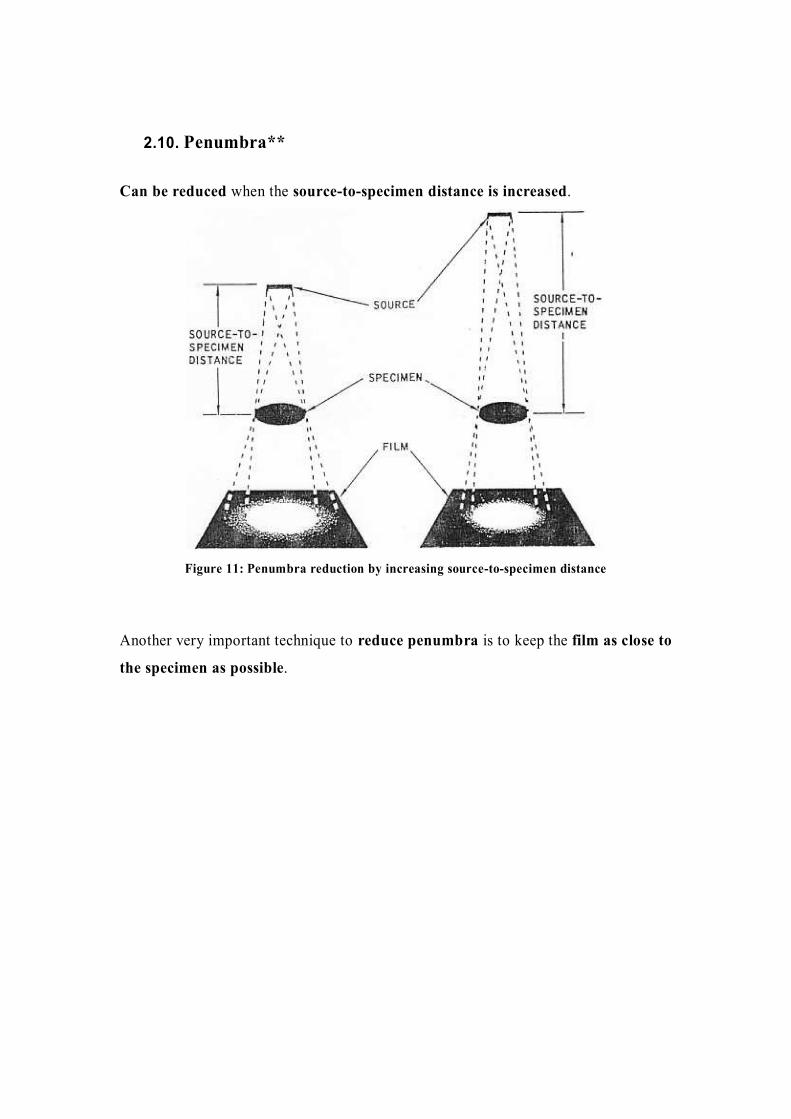
2.10. Penumbra**
Can be reduced when the source-to-specimen distance is increased.
Figure 11: Penumbra reduction by increasing source-to-specimen distance
Another very important technique to reduce penumbra is to keep the film as close to
the specimen as possible.
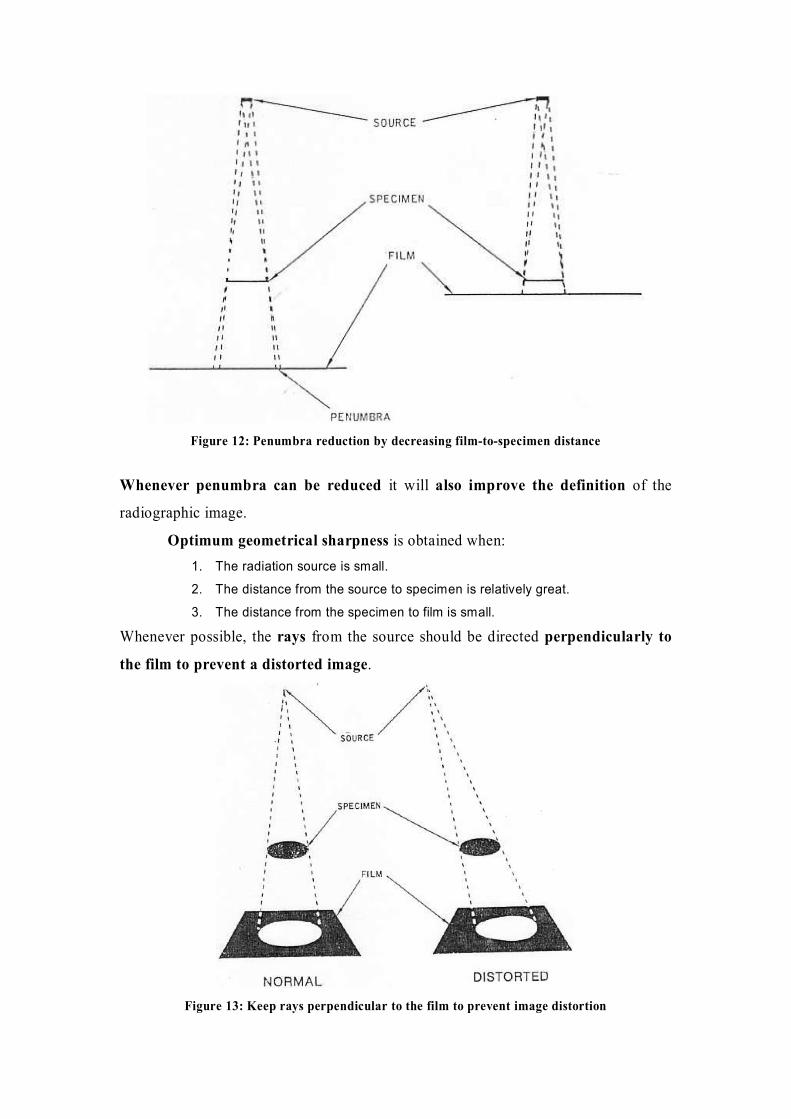
Figure 12: Penumbra reduction by decreasing film-to-specimen distance
Whenever penumbra can be reduced it will also improve the definition of the
radiographic image.
Optimum geometrical sharpness is obtained when:
1. The radiation source is small.
2. The distance from the source to specimen is relatively great.
3. The distance from the specimen to film is small.
Whenever possible, the rays from the source should be directed perpendicularly to
the film to prevent a distorted image.
Figure 13: Keep rays perpendicular to the film to prevent image distortion
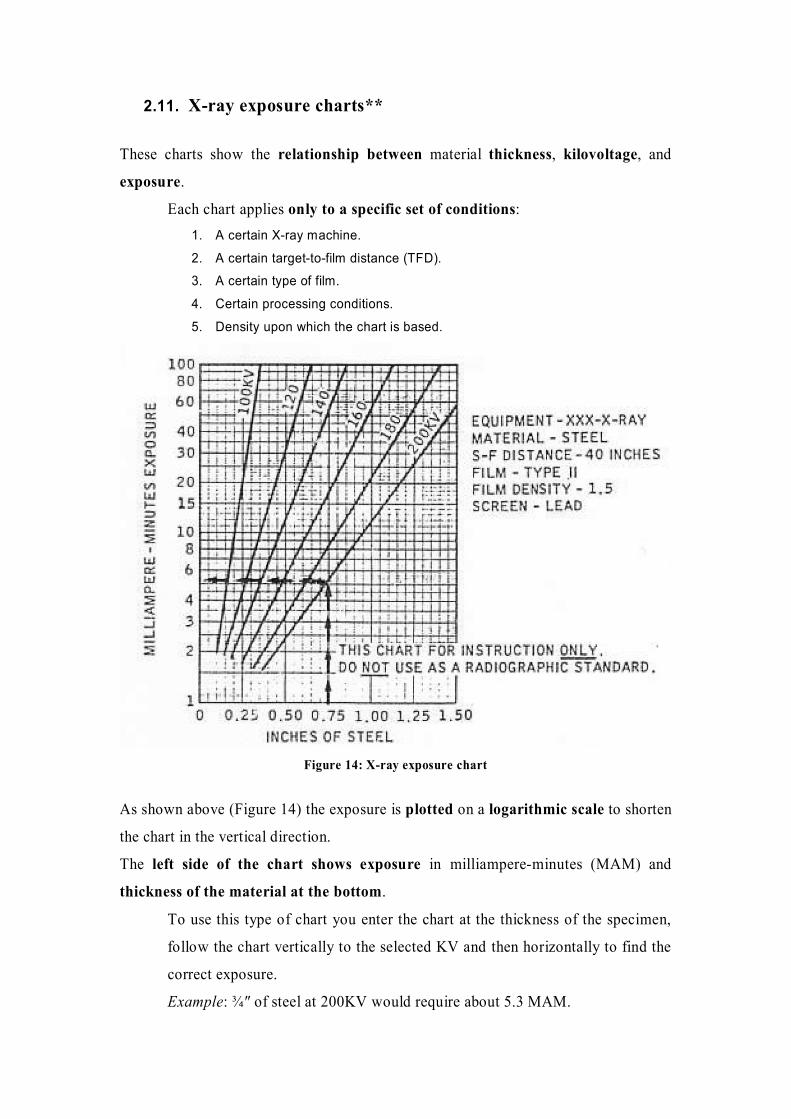
2.11. X-ray exposure charts**
These charts show the relationship between material thickness, kilovoltage, and
exposure.
Each chart applies only to a specific set of conditions:
1. A certain X-ray machine.
2. A certain target-to-film distance (TFD).
3. A certain type of film.
4. Certain processing conditions.
5. Density upon which the chart is based.
Figure 14: X-ray exposure chart
As shown above (Figure 14) the exposure is plotted on a logarithmic scale to shorten
the chart in the vertical direction.
The left side of the chart shows exposure in milliampere-minutes (MAM) and
thickness of the material at the bottom.
To use this type of chart you enter the chart at the thickness of the specimen,
follow the chart vertically to the selected KV and then horizontally to find the
correct exposure.
Example: ¾″ of steel at 200KV would require about 5.3 MAM.
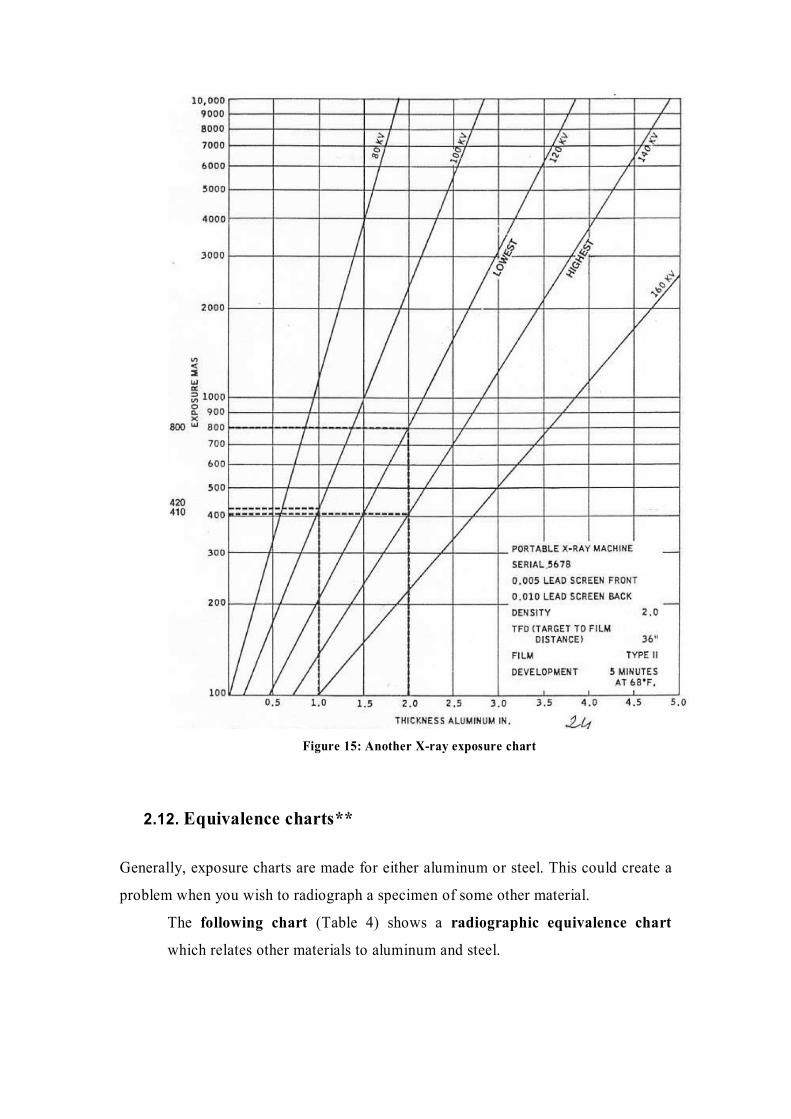
Figure 15: Another X-ray exposure chart
2.12. Equivalence charts**
Generally, exposure charts are made for either aluminum or steel. This could create a
problem when you wish to radiograph a specimen of some other material.
The following chart (Table 4) shows a radiographic equivalence chart
which relates other materials to aluminum and steel.
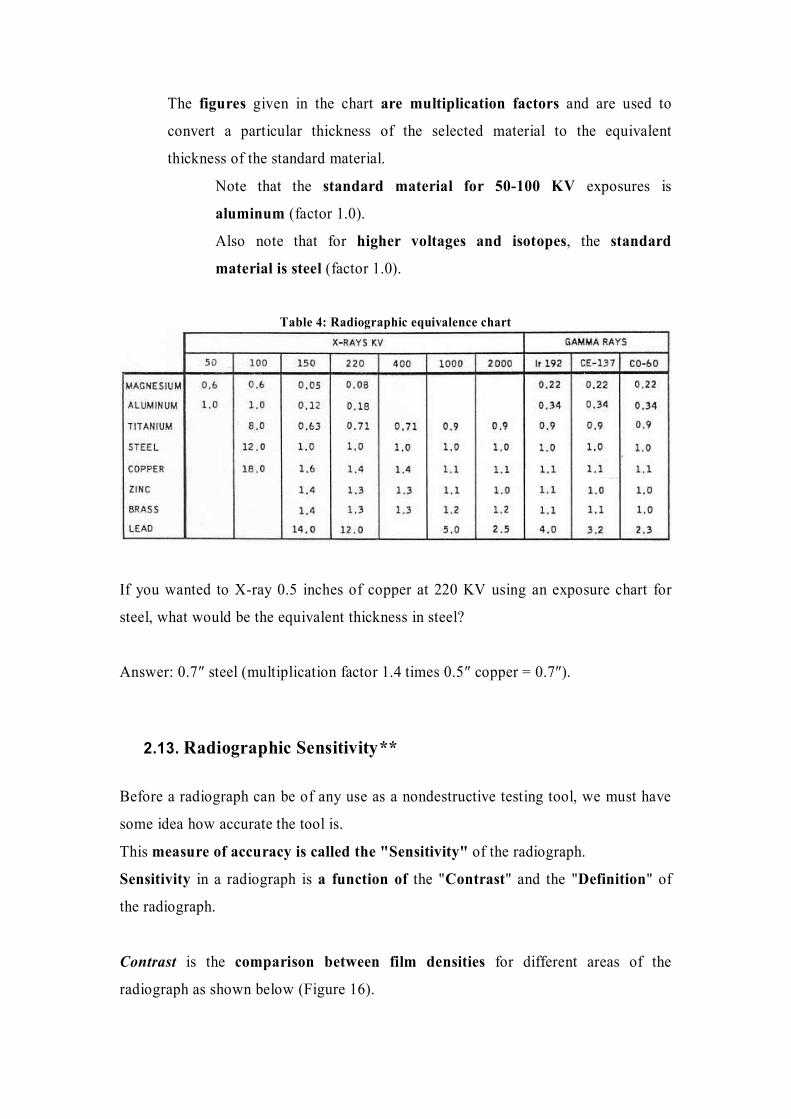
The figures given in the chart are multiplication factors and are used to
convert a particular thickness of the selected material to the equivalent
thickness of the standard material.
Note that the standard material for 50-100 KV exposures is
aluminum (factor 1.0).
Also note that for higher voltages and isotopes, the standard
material is steel (factor 1.0).
Table 4: Radiographic equivalence chart
If you wanted to X-ray 0.5 inches of copper at 220 KV using an exposure chart for
steel, what would be the equivalent thickness in steel?
Answer: 0.7″ steel (multiplication factor 1.4 times 0.5″ copper = 0.7″).
2.13. Radiographic Sensitivity**
Before a radiograph can be of any use as a nondestructive testing tool, we must have
some idea how accurate the tool is.
This measure of accuracy is called the "Sensitivity" of the radiograph.
Sensitivity in a radiograph is a function of the "Contrast" and the "Definition" of
the radiograph.
Contrast is the comparison between film densities for different areas of the
radiograph as shown below (Figure 16).
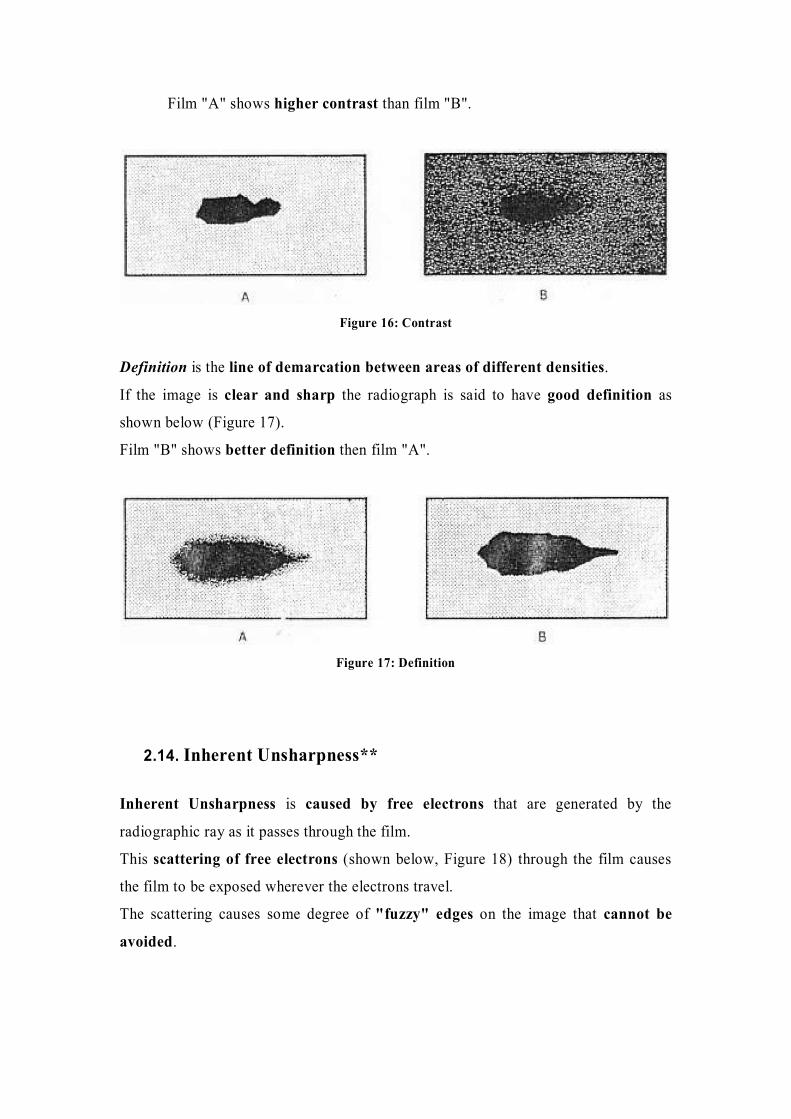
Film "A" shows higher contrast than film "B".
Figure 16: Contrast
Definition is the line of demarcation between areas of different densities.
If the image is clear and sharp the radiograph is said to have good definition as
shown below (Figure 17).
Film "B" shows better definition then film "A".
Figure 17: Definition
2.14. Inherent Unsharpness**
Inherent Unsharpness is caused by free electrons that are generated by the
radiographic ray as it passes through the film.
This scattering of free electrons (shown below, Figure 18) through the film causes
the film to be exposed wherever the electrons travel.
The scattering causes some degree of "fuzzy" edges on the image that cannot be
avoided.
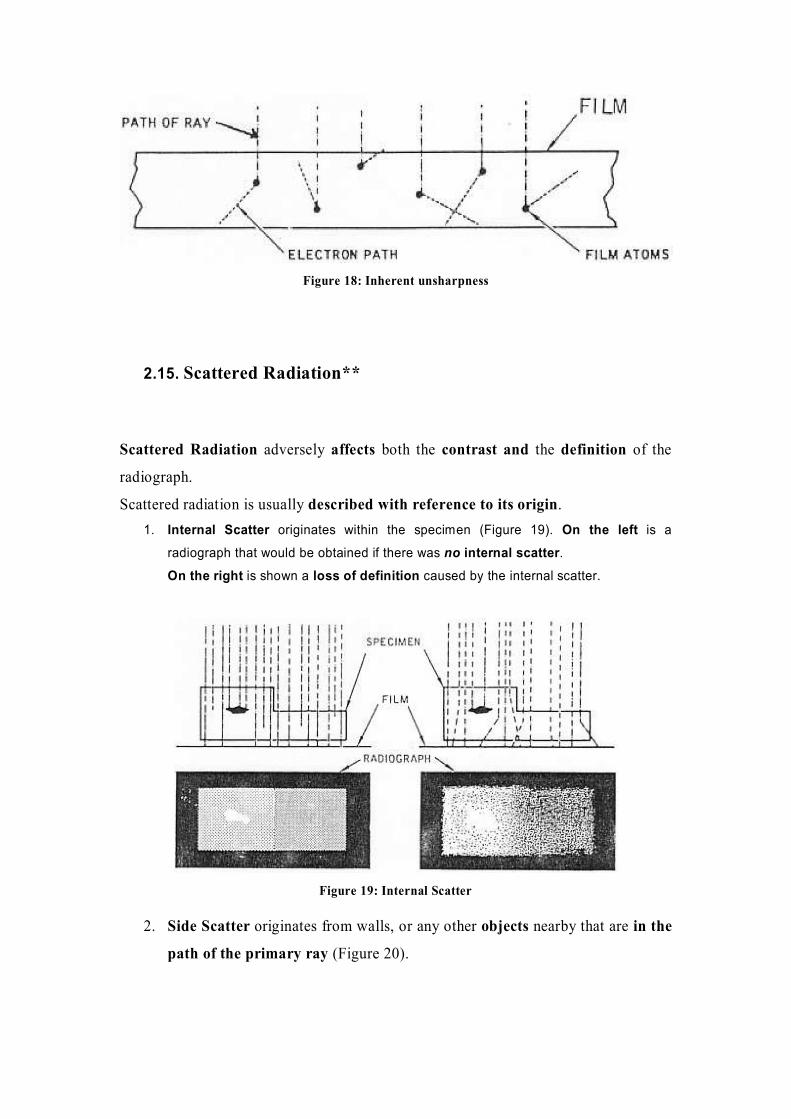
Figure 18: Inherent unsharpness
2.15. Scattered Radiation**
Scattered Radiation adversely affects both the contrast and the definition of the
radiograph.
Scattered radiation is usually described with reference to its origin.
1. Internal Scatter originates within the specimen (Figure 19). On the left is a
radiograph that would be obtained if there was no internal scatter. On the right is shown a loss of definition caused by the internal scatter.
Figure 19: Internal Scatter
2. Side Scatter originates from walls, or any other objects nearby that are in the
path of the primary ray (Figure 20).
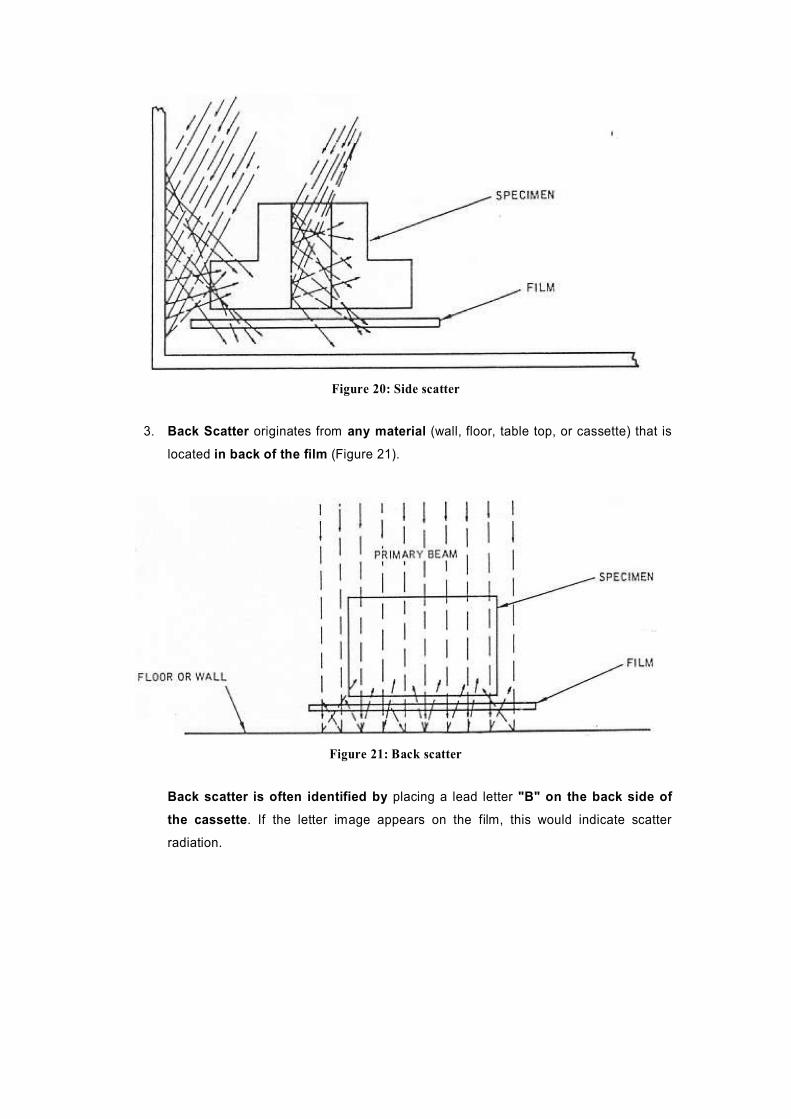
Figure 20: Side scatter
3. Back Scatter originates from any material (wall, floor, table top, or cassette) that is
located in back of the film (Figure 21).
Figure 21: Back scatter
Back scatter is often identified by placing a lead letter "B" on the back side of the cassette. If the letter image appears on the film, this would indicate scatter
radiation.
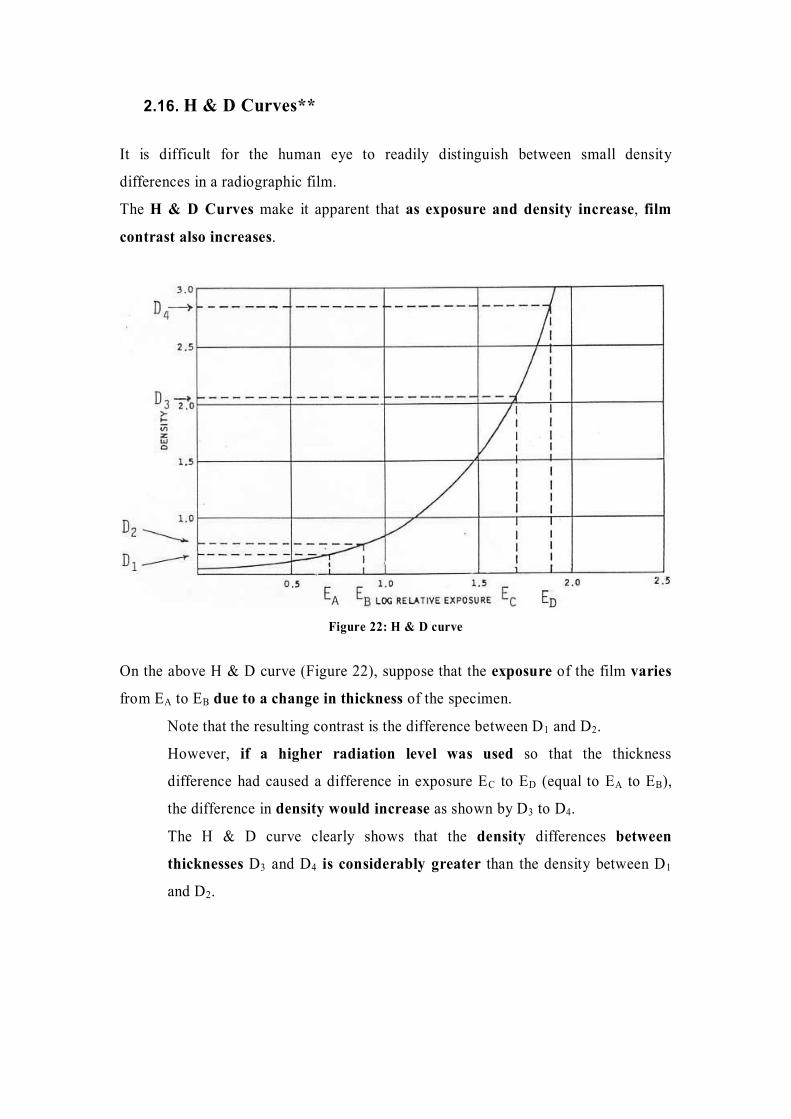
2.16. H & D Curves**
It is difficult for the human eye to readily distinguish between small density
differences in a radiographic film.
The H & D Curves make it apparent that as exposure and density increase, film
contrast also increases.
Figure 22: H & D curve
On the above H & D curve (Figure 22), suppose that the exposure of the film varies
from EA to EB due to a change in thickness of the specimen.
Note that the resulting contrast is the difference between D1 and D2.
However, if a higher radiation level was used so that the thickness
difference had caused a difference in exposure EC to ED (equal to EA to EB),
the difference in density would increase as shown by D3 to D4.
The H & D curve clearly shows that the density differences between
thicknesses D3 and D4 is considerably greater than the density between D1
and D2.
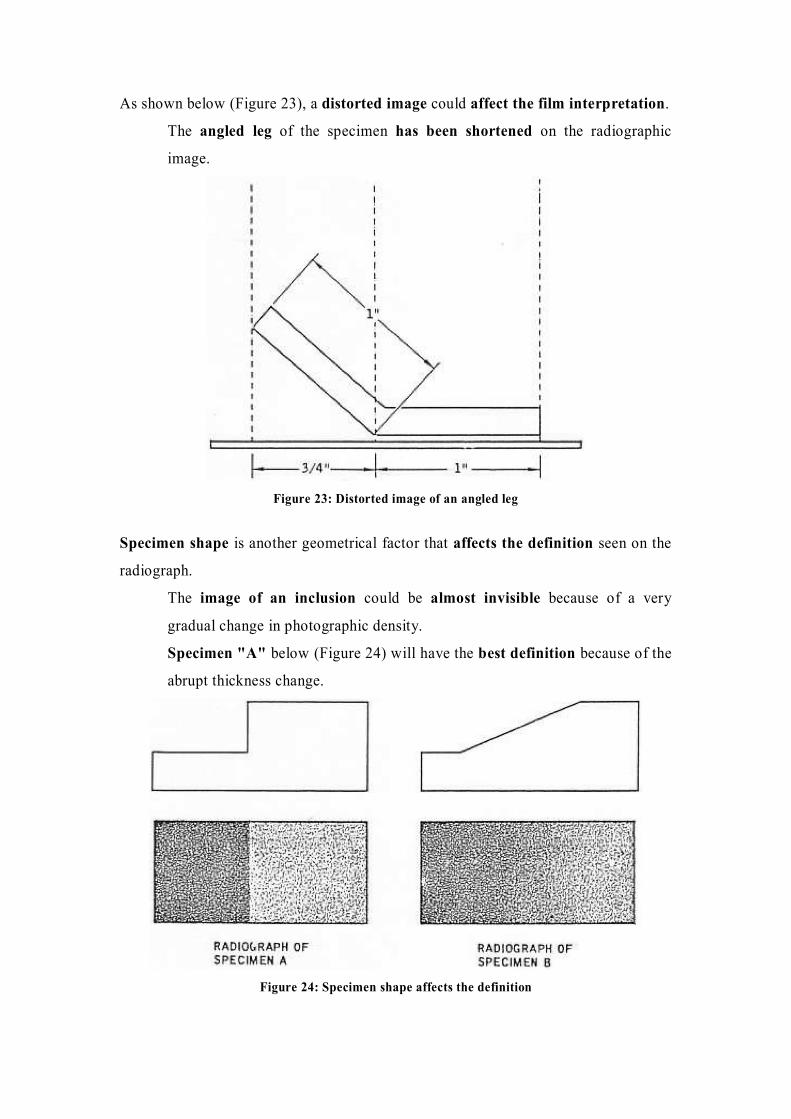
As shown below (Figure 23), a distorted image could affect the film interpretation.
The angled leg of the specimen has been shortened on the radiographic
image.
Figure 23: Distorted image of an angled leg
Specimen shape is another geometrical factor that affects the definition seen on the
radiograph.
The image of an inclusion could be almost invisible because of a very
gradual change in photographic density.
Specimen "A" below (Figure 24) will have the best definition because of the
abrupt thickness change.
Figure 24: Specimen shape affects the definition
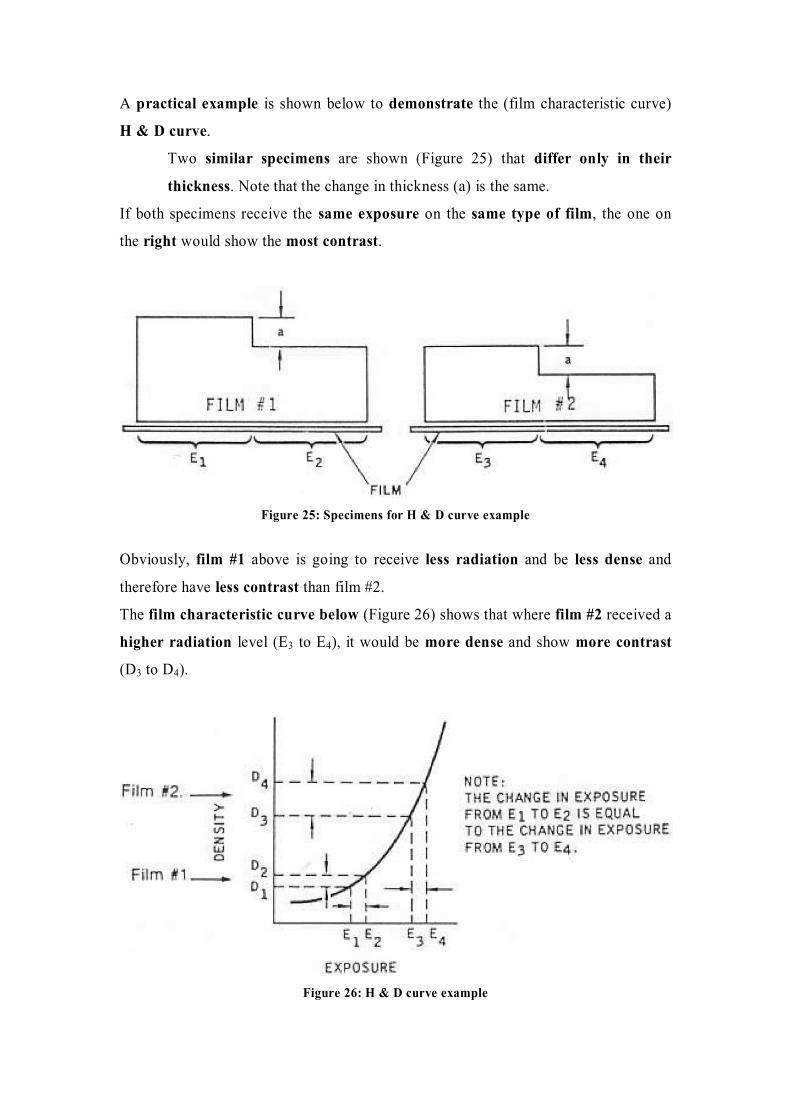
A practical example is shown below to demonstrate the (film characteristic curve)
H & D curve.
Two similar specimens are shown (Figure 25) that differ only in their
thickness. Note that the change in thickness (a) is the same.
If both specimens receive the same exposure on the same type of film, the one on
the right would show the most contrast.
Figure 25: Specimens for H & D curve example
Obviously, film #1 above is going to receive less radiation and be less dense and
therefore have less contrast than film #2.
The film characteristic curve below (Figure 26) shows that where film #2 received a
higher radiation level (E3 to E4), it would be more dense and show more contrast
(D3 to D4).
Figure 26: H & D curve example
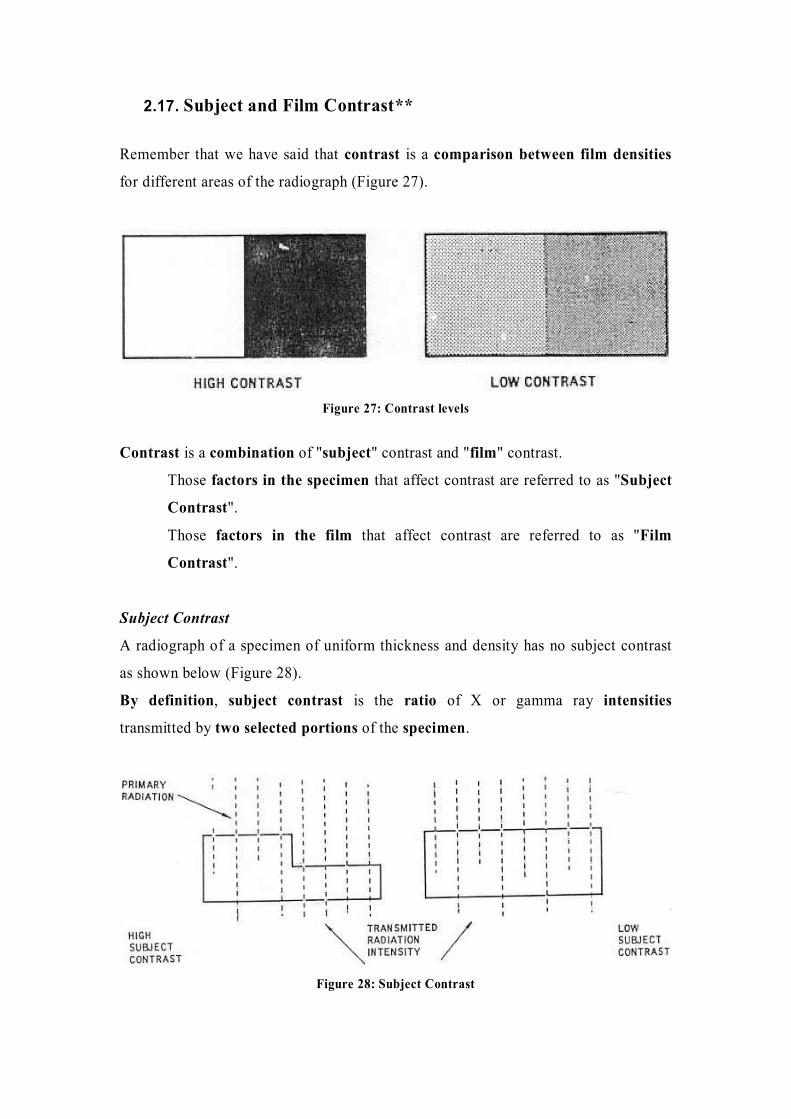
2.17. Subject and Film Contrast**
Remember that we have said that contrast is a comparison between film densities
for different areas of the radiograph (Figure 27).
Figure 27: Contrast levels
Contrast is a combination of "subject" contrast and "film" contrast.
Those factors in the specimen that affect contrast are referred to as "Subject
Contrast".
Those factors in the film that affect contrast are referred to as "Film
Contrast".
Subject Contrast
A radiograph of a specimen of uniform thickness and density has no subject contrast
as shown below (Figure 28).
By definition, subject contrast is the ratio of X or gamma ray intensities
transmitted by two selected portions of the specimen.
Figure 28: Subject Contrast
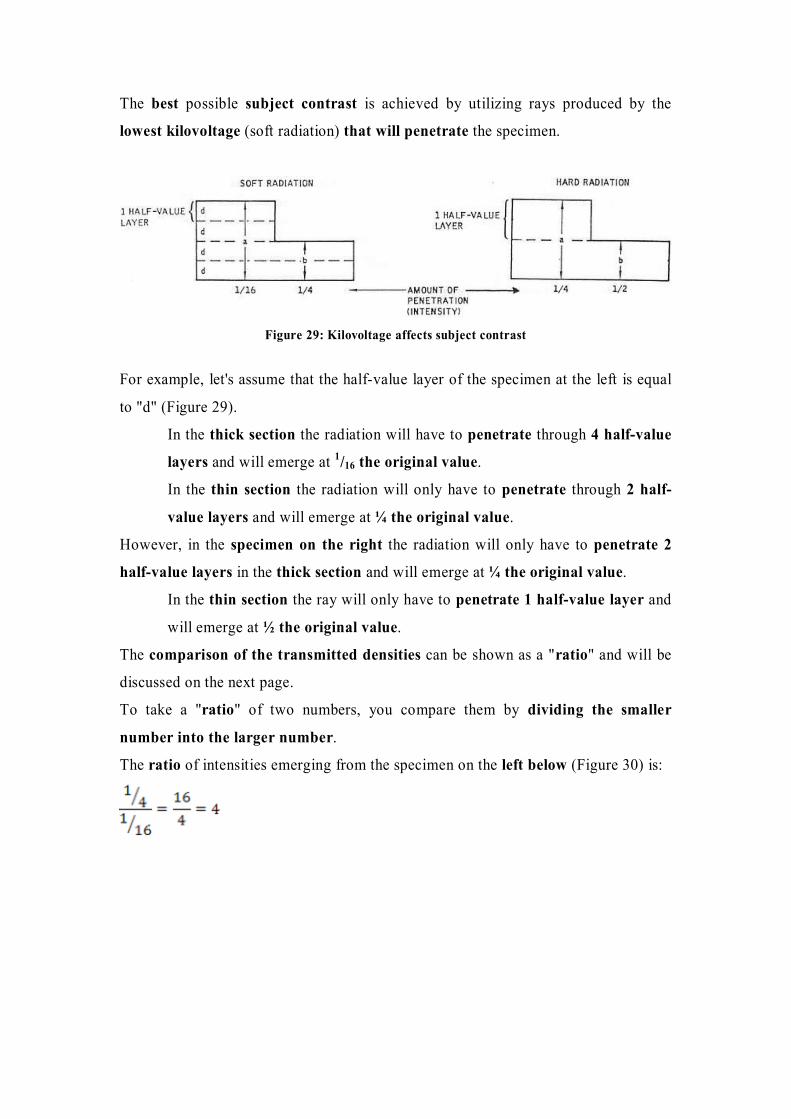
The best possible subject contrast is achieved by utilizing rays produced by the
lowest kilovoltage (soft radiation) that will penetrate the specimen.
Figure 29: Kilovoltage affects subject contrast
For example, let's assume that the half-value layer of the specimen at the left is equal
to "d" (Figure 29).
In the thick section the radiation will have to penetrate through 4 half-value
layers and will emerge at 1/16 the original value.
In the thin section the radiation will only have to penetrate through 2 half-
value layers and will emerge at ¼ the original value.
However, in the specimen on the right the radiation will only have to penetrate 2
half-value layers in the thick section and will emerge at ¼ the original value.
In the thin section the ray will only have to penetrate 1 half-value layer and
will emerge at ½ the original value.
The comparison of the transmitted densities can be shown as a "ratio" and will be
discussed on the next page.
To take a "ratio" of two numbers, you compare them by dividing the smaller
number into the larger number.
The ratio of intensities emerging from the specimen on the left below (Figure 30) is:
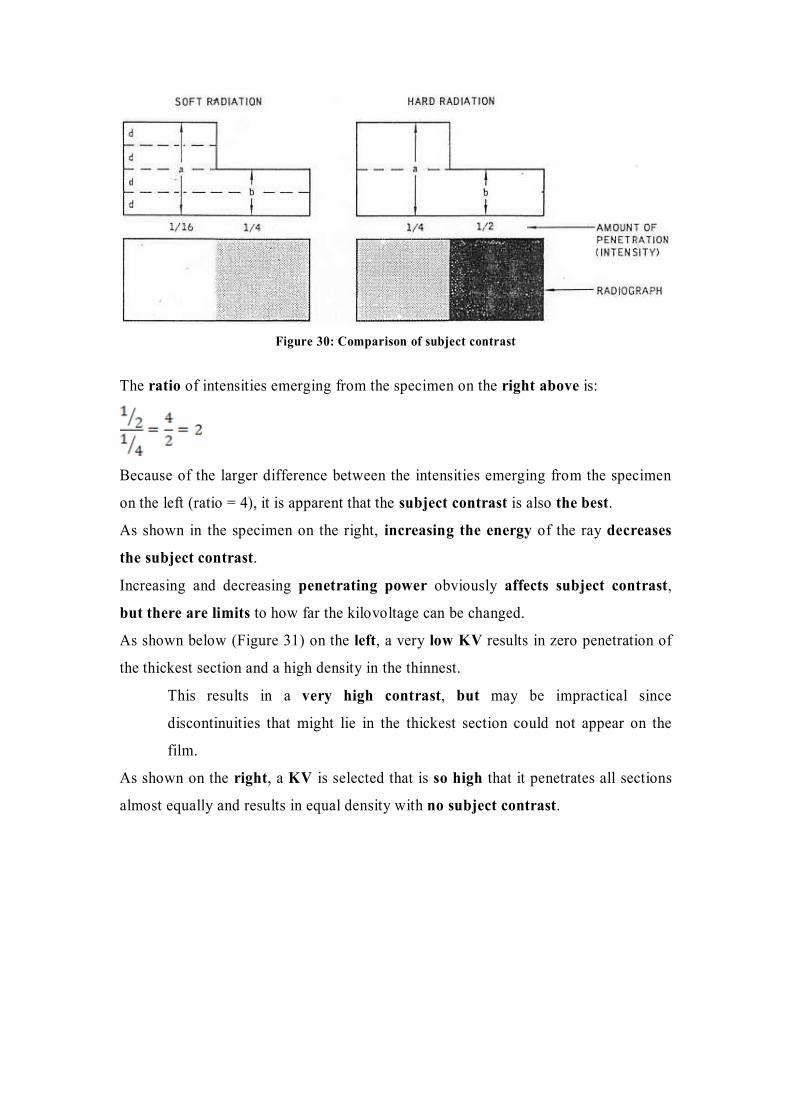
Figure 30: Comparison of subject contrast
The ratio of intensities emerging from the specimen on the right above is:
Because of the larger difference between the intensities emerging from the specimen
on the left (ratio = 4), it is apparent that the subject contrast is also the best.
As shown in the specimen on the right, increasing the energy of the ray decreases
the subject contrast.
Increasing and decreasing penetrating power obviously affects subject contrast,
but there are limits to how far the kilovoltage can be changed.
As shown below (Figure 31) on the left, a very low KV results in zero penetration of
the thickest section and a high density in the thinnest.
This results in a very high contrast, but may be impractical since
discontinuities that might lie in the thickest section could not appear on the
film.
As shown on the right, a KV is selected that is so high that it penetrates all sections
almost equally and results in equal density with no subject contrast.
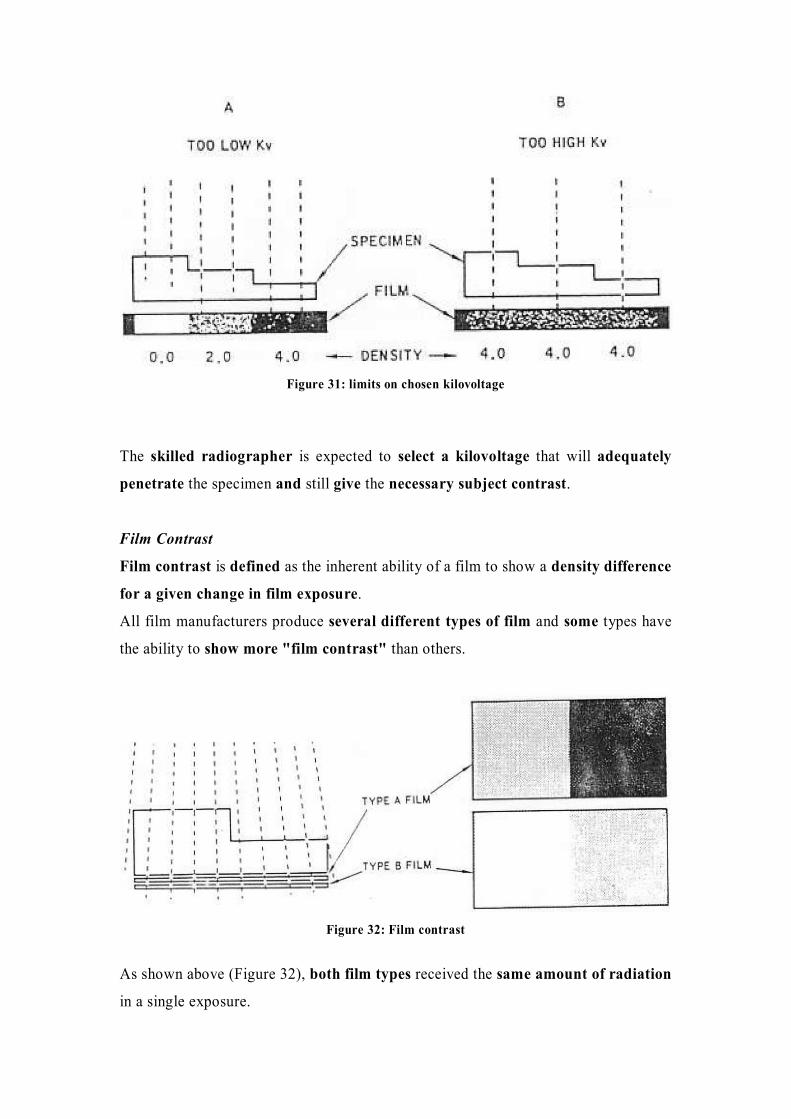
Figure 31: limits on chosen kilovoltage
The skilled radiographer is expected to select a kilovoltage that will adequately
penetrate the specimen and still give the necessary subject contrast.
Film Contrast
Film contrast is defined as the inherent ability of a film to show a density difference
for a given change in film exposure.
All film manufacturers produce several different types of film and some types have
the ability to show more "film contrast" than others.
Figure 32: Film contrast
As shown above (Figure 32), both film types received the same amount of radiation
in a single exposure.
However, the film on the top has the ability to show better "film contrast".
Film contrast values of any particular film are usually expressed as a
relationship between film exposure and resulting density.
The relationship is expressed in the form of film characteristic curves.
Total Radiographic Contrast is defined as the combination of "subject contrast"
and "film contrast" and depends upon:
Radiation applied, film type, exposure, film processing, specimen,
scattered radiation, and kind of screens used.
An important consideration to remember is the effect of low kilovoltage relating to
increased scattered radiation.
While it is desirable to attain good contrast by using a low radiation level,
the lower radiation will also produce more scatter.
Scatter from low energy radiation will cause "fuzziness" in the image.
As the voltage across a X-ray tube is increased some contrast is lost, but
also less scatter is produced to fog the film and cause fuzzy images.
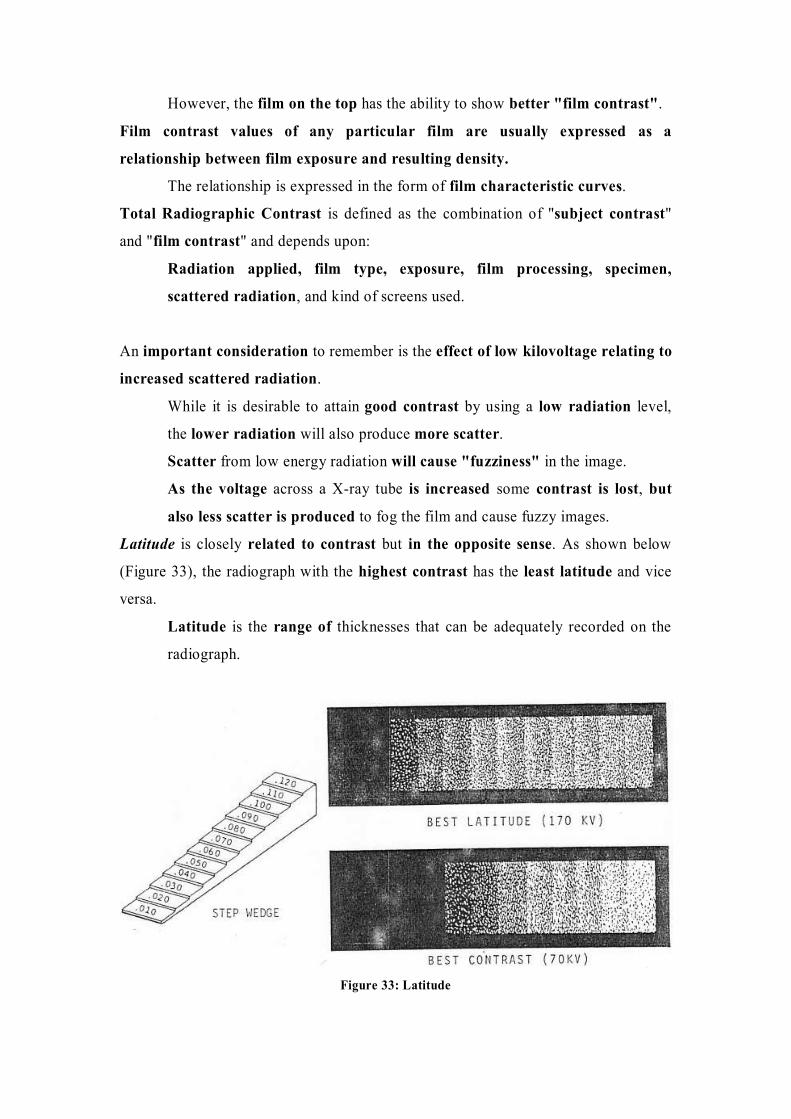
Latitude is closely related to contrast but in the opposite sense. As shown below
(Figure 33), the radiograph with the highest contrast has the least latitude and vice
versa.
Latitude is the range of thicknesses that can be adequately recorded on the
radiograph.
Figure 33: Latitude
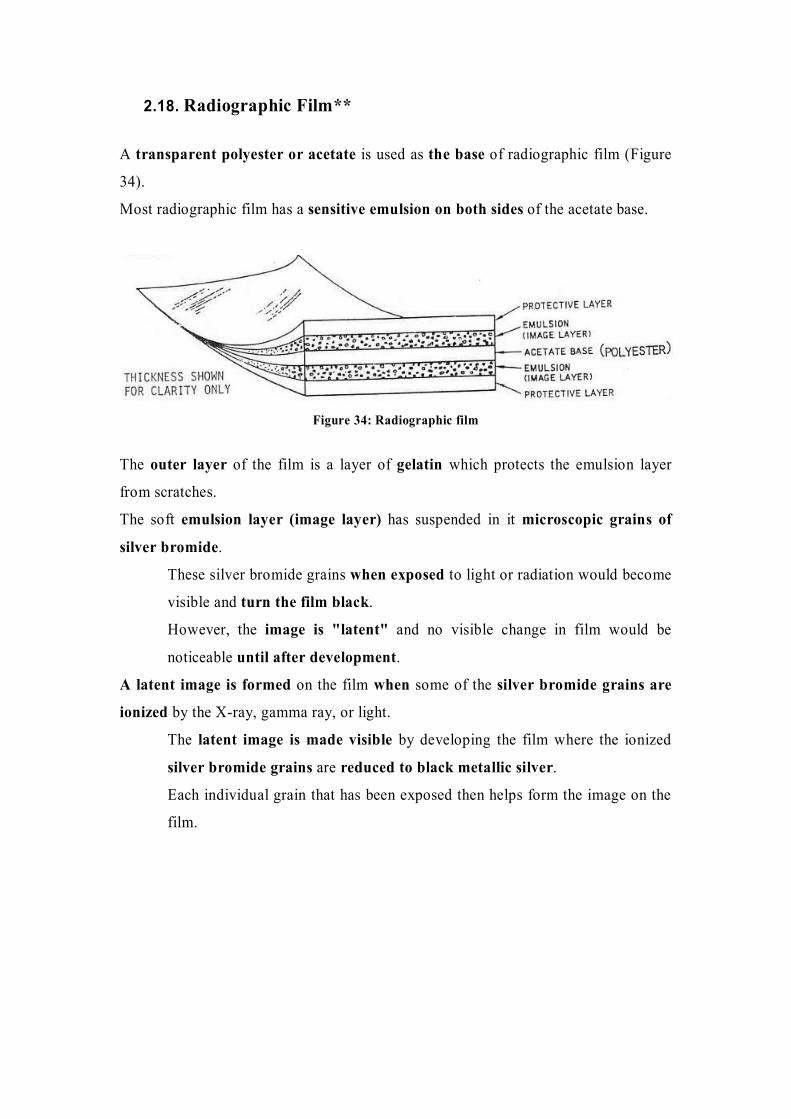
2.18. Radiographic Film**
A transparent polyester or acetate is used as the base of radiographic film (Figure
34).
Most radiographic film has a sensitive emulsion on both sides of the acetate base.
Figure 34: Radiographic film
The outer layer of the film is a layer of gelatin which protects the emulsion layer
from scratches.
The soft emulsion layer (image layer) has suspended in it microscopic grains of
silver bromide.
These silver bromide grains when exposed to light or radiation would become
visible and turn the film black.
However, the image is "latent" and no visible change in film would be
noticeable until after development.
A latent image is formed on the film when some of the silver bromide grains are
ionized by the X-ray, gamma ray, or light.
The latent image is made visible by developing the film where the ionized
silver bromide grains are reduced to black metallic silver.
Each individual grain that has been exposed then helps form the image on the
film.
There is no partial exposure of a silver grain.
Areas on the film of light and dark simply represent the number of grains
exposed in those areas.
More exposed grains give a darker image.
The difference in radiographic films is mainly due to the various grain sizes (even
the largest of which are microscopic).
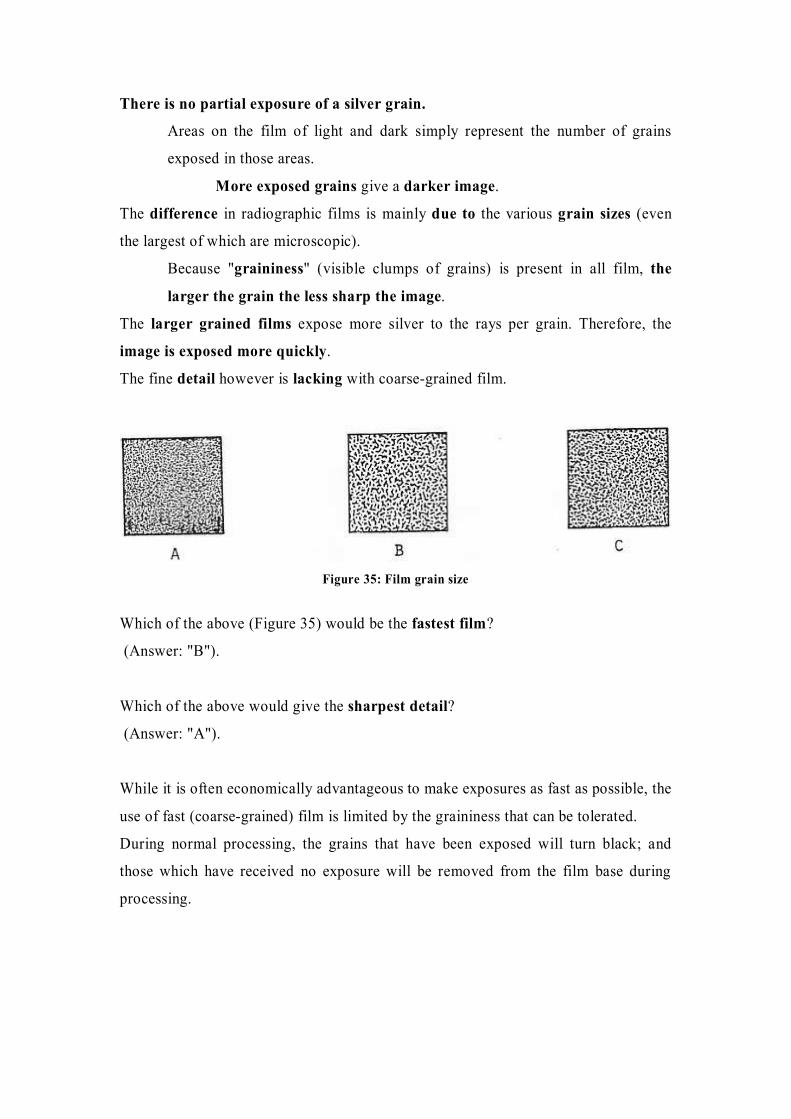
Because "graininess" (visible clumps of grains) is present in all film, the
larger the grain the less sharp the image.
The larger grained films expose more silver to the rays per grain. Therefore, the
image is exposed more quickly.
The fine detail however is lacking with coarse-grained film.
Figure 35: Film grain size
Which of the above (Figure 35) would be the fastest film?
(Answer: "B").
Which of the above would give the sharpest detail?
(Answer: "A").
While it is often economically advantageous to make exposures as fast as possible, the
use of fast (coarse-grained) film is limited by the graininess that can be tolerated.
During normal processing, the grains that have been exposed will turn black; and
those which have received no exposure will be removed from the film base during
processing.
2.19. Specialized radiographic equipment**
Screens – There are basically three types of radiographic screens that enable us to
use the radiation beam more effectively:
1. Lead Foil intensifying screen.
2. Fluorescent intensifying screen.
3. Fluorometallic intensifying screen.
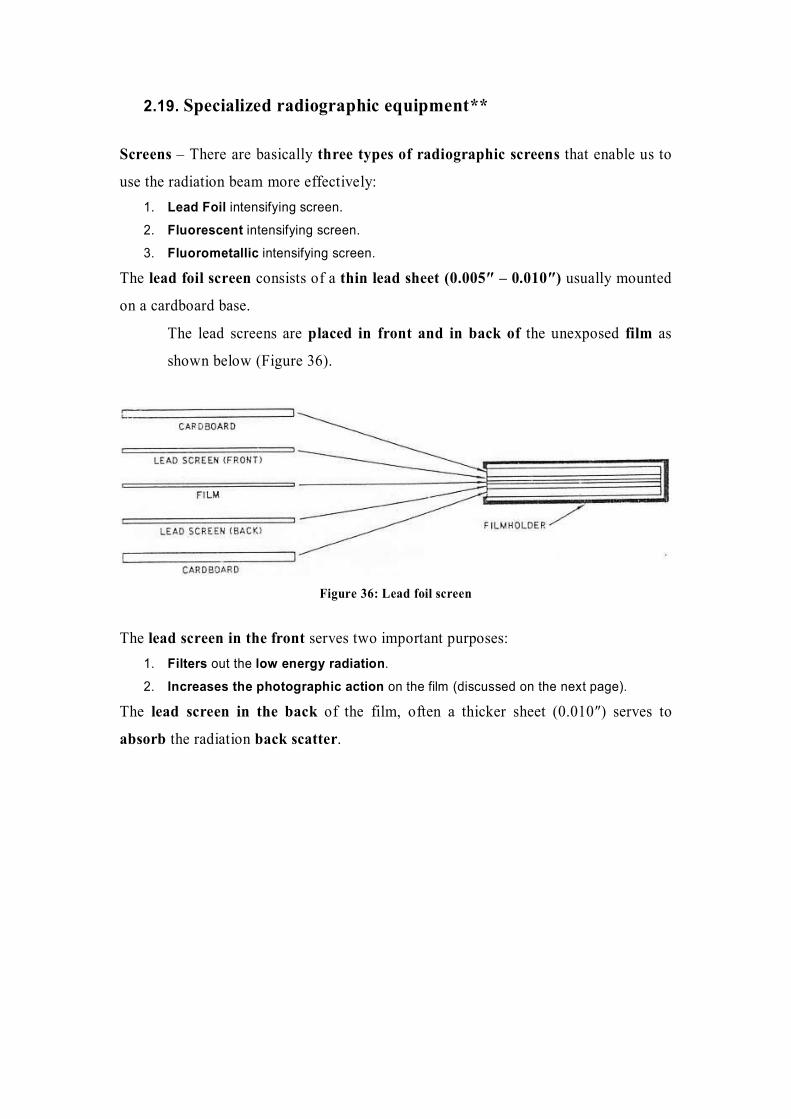
The lead foil screen consists of a thin lead sheet (0.005″ – 0.010″) usually mounted
on a cardboard base.
The lead screens are placed in front and in back of the unexposed film as
shown below (Figure 36).
Figure 36: Lead foil screen
The lead screen in the front serves two important purposes:
1. Filters out the low energy radiation.
2. Increases the photographic action on the film (discussed on the next page).
The lead screen in the back of the film, often a thicker sheet (0.010″) serves to
absorb the radiation back scatter.
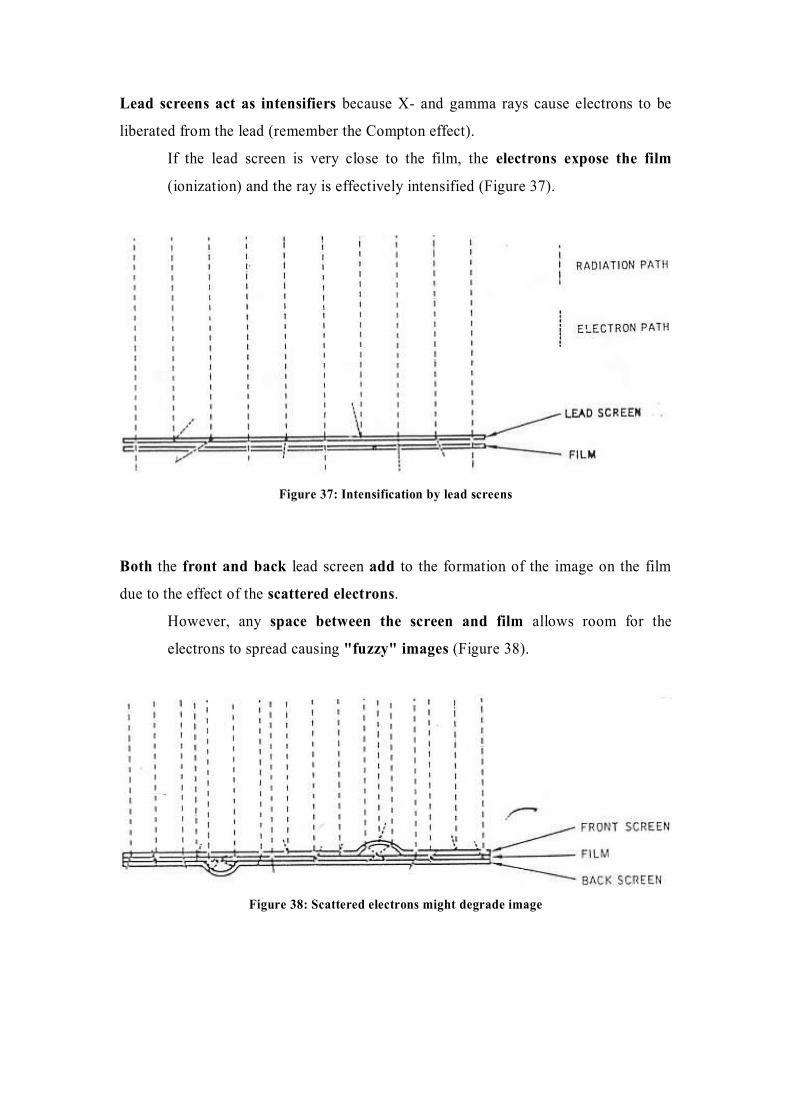
Lead screens act as intensifiers because X- and gamma rays cause electrons to be
liberated from the lead (remember the Compton effect).
If the lead screen is very close to the film, the electrons expose the film
(ionization) and the ray is effectively intensified (Figure 37).
Figure 37: Intensification by lead screens
Both the front and back lead screen add to the formation of the image on the film
due to the effect of the scattered electrons.
However, any space between the screen and film allows room for the
electrons to spread causing "fuzzy" images (Figure 38).
Figure 38: Scattered electrons might degrade image
Generally speaking, lead screens give better definition then fluorescent screens.
The poorer definition is caused by the spreading of visible light emitted from the
fluorescent screens.
However, fluorescent screens are useful when the penetrating voltage of the X-ray
unit is limited and you wish to radiograph a relatively thick specimen.
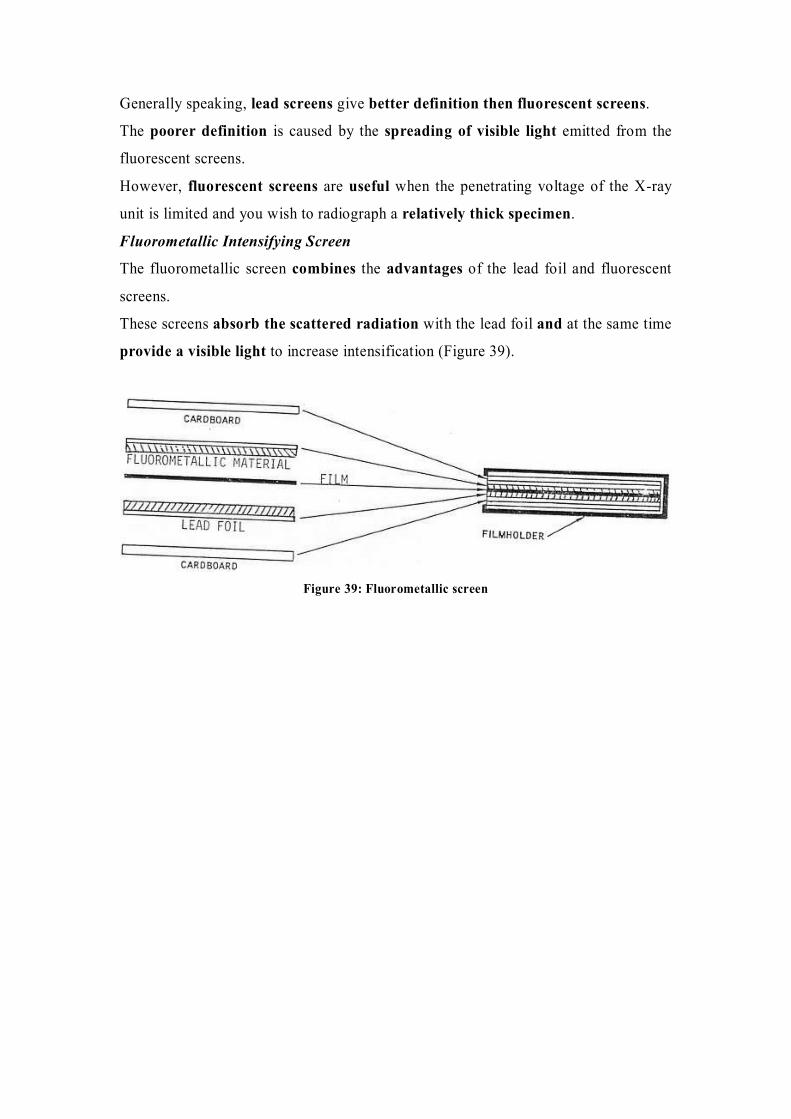
Fluorometallic Intensifying Screen
The fluorometallic screen combines the advantages of the lead foil and fluorescent
screens.
These screens absorb the scattered radiation with the lead foil and at the same time
provide a visible light to increase intensification (Figure 39).
Figure 39: Fluorometallic screen
3.
:מכשור
-
( Xהניסוי ייעשה במתקן תעשייתי לקרני
,)30595אינוונטר מספר דגם
200KVהמספק מתח האצה עד
.200W והספק מותר עד
המתקן מאפשר צילום של חלקים באמצעות סרטי צילום וגם תצפית ישירה באמצעות
. מסך פלורסנטי הממוקם מתחת לחלקים הנבדקים
-
X-rite model 301X: דנציטומטר
-
א
ילומינטורים
4.
.מהלך הניסוי
4.1.
: הכרת המכשיר
. הכנס למתקן קופסת מתכת סגורה ובה חפצים שונים
הדלק את
.השפופרת והתבונן במסך הפלורוסנטי בתוכן הקופסא המשוקף על המסך
4.2.
:הכרת שיטת הצילום
4.3.
.הכר את סולם צפיפות ההשחרה באמצעות סרטי דוגמא
4.4.
תרגל את הבחירה של תנאי החשיפה על פי עק
:ומות החשיפה
-
D7: סוג הסרט
D4) D7- ו
4 מהיר פי
).D4- מ
-
: השחרה רצויה
.1.5-2בדרך כלל
-
: מתח האצה
. מתח גבוה נחוץ לשיקוף חלקים עבים
במתח נמוך ההפרדה של פרטים
. טובה יותר
-
: זמן וזרם
.קשורים למתח ההאצה בגלל מגבלת ההספק המירבי של מכשיר
-
הוסף מסך עופרת דק
. בבדיקת חלקים עבים או מתכות כבדות
העופרת עוצרת קרינה
.מפוזרת ויוצרת תמונה חדה
4.5.
: הכר את אמצעי הכיול לקביעת רגישות העבודה
. דגם מדרגות ופנטרומטר חוטים
החוט
.הדק ביותר שניתן לאבחנה בצילום הוא גבול הגילוי של המערכת
4.6.
. בצע צילומים רדיוגרפיים של פריטים שונים
במידת
האפשר הוסף דגמי כיול לקביעת
(הרגישות
) כושר ההפרדה
:של כל צילום
-
.דגם מתיחה יצוק ובו נקבוביות
-
. pipeדגם אלומיניום יצוק בעל
-
. דגם קוביה עם חלל פנימי
-
חלק מלבני ארוך ועבה מאלומיניום עם חורים קדוחים בקטרים שונים ממילימטר אחד
ע
. ד שמונה מילימטרים
-
דגמי יציקה מסו
, ג אלומיניום
.מסוגסג בעופרת
-
-פלח סגסוגת אלומניום
Al-Mgמגנזיום
. מרותך במרכזו
-
6.1 .
:מהלך הצילום
-
.הכנס את הדגם וקבע את תנוחת הצילום הרצויה
-
penetration כוון כפתור
.0- ל
-
timerהפעל
. לזמן בהתאם לחישובייך
-
.אור אדום נדלק והשעון מתחיל לפעול
-
מעלים את המתח באמצע
penetrationות כפתור
. למתח הרצוי
-
בגמר הצילום נכבית המנורה האדומה ואפשר לפתוח את דלת תא הצילום
.ולהוציא את הדגם והסרט
6.2.
:פיתוח
.מותר לעבוד באור אדום
. א
rapid (x-ray(טבול את הסרט במפתח
D-19 או
. עד שרואים תמונה בעין חופשית
. ב
(שטוף במים
).עם מעט חומצת חומץ
. ג
) x-ray fixer(העבר לקובע
10-לכ
, דקות
15-20שטוף במים
. דקות
אפשר להיעז
ר
.בדטרגנט לניקוי הסרט
5.
"הנחיות לדו
.ח מסכם
1.
. תאר את הניסויים שביצעת
2 .
.xמהם היתרונות והמגבלות של הרדיוגרפיה בקרני
6.
.בביליוגרפיה
1. http://www.ndt-ed.org/EducationResources/CommunityCollege/communitycollege.htm
2.
קובץ ניסיונות מעבדות שנה
', ג
, 2007-2008, הנדסת חומרים
238-270' עמ
3. "Handbook of nondestructive evaluation", Charles J. Hellier, 2001 (TA 417.2.H45).
4. "Industrial radiography", R. Halmshaw, 1995 (TA 417.25 H292).
5. "Introduction to the non-destructive testing of welded joints", R. Halmshaw, 1996 (TA
492.W4H3555).
6. "Non destructive evaluation: a tool in design, manufacturing, and service", D on E.Bray, 1997
(TA 417.2.B63).
7. "Metals Handbook", 10th
ed., ASM , Vol.17 , Non Destructive Evaluation and Quality
Control, 1990 (TA 459 A5).
Related Documents