Competitiveness Report 2011
The
Africa
The Africa Competitiveness Report 2011
The Africa Competitiveness Report 2011 © 2011 World Economic Forum, the World Bank and the African Development Bank
The Africa Competitiveness Report 2011 is the result of
collaboration between the World Economic Forum, the
World Bank, and the African Development Bank.
AT THE WORLD ECONOMIC FORUM
Professor Klaus SchwabExecutive Chairman
Robert GreenhillChief Business Officer
Jennifer BlankeLead Economist, Head of the Centre for
Global Competitiveness and Performance
Ciara BrowneAssociate Director
Katherine TweedieDirector, Africa
AT THE WORLD BANK
Robert ZoellickPresident
Shantayanan Devarajan Chief Economist, Africa Region
Marilou UySector Director, Finance & Private Sector
Development, Africa Region
Michael FuchsActing Sector Manager, Finance & Private
Sector Development, Africa Region
Giuseppe IarossiSenior Economist, Finance & Private Sector
Development, Africa Region
AT THE AFRICAN DEVELOPMENT BANK
Donald KaberukaPresident
Mthuli NcubeChief Economist & Vice President, ECON
Complex
Désiré VencatachellumDirector, Development Research Department
Peter OndiegeChief Research Economist, Development
Research Department
Zuzana BrixiovaPrincipal Research Economist, Development
Research Department
We thank the Africa Commission and the Danish
Government for their financial contribution to
this Report.
We thank Hope Steele for her superb editing
work and Neil Weinberg for his excellent graphic
design and layout. Printing by SRO-Kundig.
Copyright © 2011
by the World Economic Forum, the
International Bank for Reconstruction and
Development/The World Bank, the African
Development Bank, and the Africa
Commission
Published by the World Economic Forum,
Geneva.
The findings, interpretations, and conclusions
expressed herein are those of the author(s)
and do not necessarily reflect the views of
the Executive Directors of The World Bank,
the African Development Bank, or the gov-
ernments they represent.
The World Bank, the African Development
Bank, and the World Economic Forum do
not guarantee accuracy of the data included
in this work. The boundaries, colors, denomi-
nations, and other information shown on any
map in this work do not imply any judgment
on the part of The World Bank, the African
Development Bank, or the World Economic
Forum concerning the legal status of any ter-
ritory or the endorsement or acceptance of
such boundaries.
All rights reserved. No part of this publica -
tion may be reproduced, stored in a retrieval
system, or transmitted, in any form or by any
means, electronic, mechanical, photocopying,
or otherwise without the prior permission of
the World Economic Forum.
The terms country and nation as used in this
report do not in all cases refer to a territorial
entity that is a state as understood by inter-
national law and practice. The terms cover
well-defined, geographically self-contained
economic areas that may not be states but
for which statistical data are maintained on a
separate and independent basis.
ISBN-13: 978-92-95044-97-5
The Africa Competitiveness Report 2011 © 2011 World Economic Forum, the World Bank and the African Development Bank
Contents
Preface...................................................................................................vby Donald Kaberuka (African Development Bank Group),
Søren Pind (Ministry of Development of Denmark),
Klaus Schwab (World Economic Forum), and Robert
Zoellick (World Bank Group)
Acknowledgments............................................................................vii
Overview..............................................................................................xi
Part 1: Assessing African Competitiveness
1.1 Exports, FDI, and Competitiveness in Africa.......................3by Jennifer Blanke (World Economic Forum),
Zuzana Brixiova (African Development Bank), Uri
Dadush (Carnegie Endowment), Tugba Gurcanlar
(World Bank), and Giuseppe Iarossi (World Bank)
Part 2: Capitalizing on Africa’s Resources
2.1 Reforming Higher Education: Access, Equity, and Financing in Botswana, Ethiopia, Kenya, South Africa, and Tunisia.......................................................39by Kwabena Gyimah-Brempong (University of
Southern Florida) and Peter Ondiege (African
Development Bank)
2.2 Strengthening Women’s Entrepreneurship........................67by Mary Hallward-Driemeier (World Bank)
2.3 Assessing Africa’s Travel & Tourism Competitiveness in the Wake of the Global Economic Crisis ......................89by Jennifer Blanke and Ciara Browne (World
Economic Forum) and Andres F. Garcia and
Hannah R. Messerli (World Bank)
Part 3: Competitiveness ProfilesHow to Read the Competitiveness Profiles .................115
List of Countries .............................................................123
Competitiveness Profiles ...............................................124
About the Authors..................................................................195
The Africa Competitiveness Report 2011 © 2011 World Economic Forum, the World Bank and the African Development Bank

The Africa Competitiveness Report 2011 © 2011 World Economic Forum, the World Bank and the African Development Bank
v
Pref
ace
The Africa Competitiveness Report 2011, the third reportjointly published by our organizations, comes out at atime when Africa’s recovery from the global economiccrisis has been faster than it has in many other parts ofthe world. Indeed, Africa has seen what can be termedan “economic resurgence” over the past decade: between2001 and 2010, gross domestic product growth on thecontinent averaged 5.2 percent annually—a rate alsoexpected in 2011, and higher than the global average of4.2 percent.
Questions remain, however, as to how sustainablethis growth will be over the longer term. Recent eventsin North Africa suggest that much remains to be doneto place Africa’s economic development on a moresolid footing.
The Africa Competitiveness Report highlights areaswhere we need urgent policy action and investment toensure that Africa sustains its economic recovery andcontinues to grow in the future. It maps out the conti-nent’s policy challenges and presents a unified vision,shared by all our organizations, of the areas requiringcritical attention. The Report can serve as a useful toolfor African decision makers in public and privatespheres to measure the business climate potential forfostering sustainable growth and prosperity.
As such, we hope this year’s Report will stimulatediscussion in both the private and public sectors on theissues at stake. The private sector can play a vital role in the process of reform. As essential stakeholders, busi-nesses can support and advocate both for reforms thatenhance competitiveness and for initiatives that createjobs. Governments will want to emphasize a soundbusiness climate as a catalyst for long-term shared growthand prosperity.
The Africa Competitiveness Report focuses on har -nessing Africa’s underutilized resources: skills, femaleentrepreneurship, and natural and cultural resources.The Report also contains in-depth assessments of thestate of competitiveness, the impact of foreign directinvestment on the continent, and the trade performanceof the region, including the potential of increased pro-ductivity growth in agriculture and agribusiness. Its finalsections provide detailed competitiveness profiles forseveral African countries.
To grow further and be globally competitive,Africa needs to put in place the conditions for a vibrantprivate sector. The time is propitious to support reformand to help Africa improve its competitiveness andgrowth prospects. In today’s interconnected world,Africa’s prosperity is important to all of us, both as asource of global growth and to promote an inclusiveand sustainable globalization.
PrefaceDONALD KABERUKA, President, African Development Bank Group
SØREN PIND, Minister of Development of Denmark
KLAUS SCHWAB, Executive Chairman, World Economic Forum
ROBERT B. ZOELLICK, President, World Bank Group
The Africa Competitiveness Report 2011 © 2011 World Economic Forum, the World Bank and the African Development Bank

The Africa Competitiveness Report 2011 © 2011 World Economic Forum, the World Bank and the African Development Bank
The Africa Competitiveness Report 2011 was preparedby a joint team comprised of Jennifer Blanke fromthe World Economic Forum, Giuseppe Iarossi fromthe World Bank, and Peter Ondiege and ZuzanaBrixiova from the African Development Bank. Thework was carried out under the general direction ofShantayanan Devarajan, Chief Economist for theAfrica Region, and Marilou Uy, Sector Director,Finance and Private Sector Development, AfricaRegion, The World Bank; Robert Greenhill, ChiefBusiness Officer, World Economic Forum; andMthuli Ncube, Chief Economist and VicePresident, Désiré Vencatachellum, Director,Development Research Department, and LéonceNdikumana, Director, Operational PoliciesDepartment, of the African Development Bank.
Our gratitude goes to the distinguished authorswho have shared with us their knowledge and expe-rience and contributed to this year’s Report.
We are similarly grateful to all staff from ourinstitutions who have worked so hard to make thisjoint report possible and who have provided com-ments at different stages of the report preparation. Inparticular, we thank Abdul B. Kamara, PeterWalkenhorst, John Anyanwu, Albert Mafusire,Abebe Shimeles, Vinay D. Ancharaz, EmellyMutambatsere, Ahmed Moummi, Wolassa L.Kumo, Goerge Honde, Andrew Mwaba, NatsukoObayashi, Edith Laszlo, Baboucarr S. Sarr,Mamadou S. Bah, Sunitar Pitamber, Agnes Soucat,Ruth Charo, Alain Mingat (Consultant), SylvainDessy (External Reviewer), Mina Baliamoune(Consultant), John Luiz (Consultant), ThourayaHadj Amor (Consultant), Kaouther Abderrahim(Consultant), and Ines Mahjoub (Statistical Assistant)from the African Development Bank; assistance wasalso provided by Rhoda Bangurah, Nana Cobbina,Abiana Nelson, and Ines Hajri. From the WorldBank, we thank Simon Bell and James Emery (peerreviewers); and Paul Brenton, Francisco Campos,Gary Fine, Michael Fuchs, Vincent Palmade, MiriaPigato, Jan Walliser, Michaela Weber, and YutakaYoshino, and the other staff who participated inreviewing the drafts. From the World Economic
Forum we thank Amrote Abdella, Ciara Browne,Sophie Bussmann-Kemdjo, Robert Crotti,Margareta Drzeniek Hanouz, Thierry Geiger, SatuKauhanen, Kamal Kimaoui, Dana Marquardt, IreneMia, Pearl Samandari, and Katherine Tweedie.From the Africa Commission we thank WinniePetersen.
vii
Ackn
owle
dgm
ents
Acknowledgments
The Africa Competitiveness Report 2011 © 2011 World Economic Forum, the World Bank and the African Development Bank
AlgeriaCentre de Recherche en Economie Appliquée
pour le Développement (CREAD)
Youcef Benabdallah, Assistant Professor
Yassine Ferfera, Director
AngolaMITC Investimentos
Estefania Jover, Senior Adviser
PROPETROL—Serviços Petroliferos
Arnaldo Lago de Carvalho, Managing Partner
South Africa-Angola Chamber of Commerce (SA-ACC)
Roger Ballard-Tremeer, Hon Chief Executive
BeninMicro Impacts of Macroeconomic Adjustment Policies
(MIMAP) Benin
Epiphane Adjovi, Business Coordinator
Maria-Odile Attanasso, Deputy Coordinator
Fructueux Deguenonvo, Researcher
BotswanaBotswana National Productivity Centre
Letsogile Batsetswe, Research Consultant and Statistician
Parmod Chandna, Acting Executive Director
Phumzile Thobokwe, Manager, Information and
Research Services Department
Burkina Fasolnstitut Supérieure des Sciences de la Population (ISSP),
University of Ouagadougou
Samuel Kabore, Economist and Head of Development Strategy
and Population Research
BurundiUniversity Research Centre for Economic and Social
Development (CURDES), National University of Burundi
Richard Ndereyahaga, Head of CURDES
Gilbert Niyongabo, Dean, Faculty of Economics
& Management
CameroonComité de Compétitivité (Competitiveness Committee)
Lucien Sanzouango, Permanent Secretary
Cape VerdeINOVE RESEARCH—Investigação e Desenvolvimento, Lda
Rosa Brito, Senior Researcher
Júlio Delgado, Partner and Senior Researcher
Frantz Tavares, Partner and Chief Executive Officer
ChadGroupe de Recherches Alternatives et de Monitoring
du Projet Pétrole-Tchad-Cameroun (GRAMP-TC)
Antoine Doudjidingao, Researcher
Gilbert Maoundonodji, Director
Celine Nénodji Mbaipeur, Programme Officer
Côte d’IvoireChambre de Commerce et d’Industrie de Côte d’Ivoire
Jean-Louis Billon, President
Jean-Louis Giacometti, Technical Advisor to the President
Mamadou Sarr, Director General
EgyptThe Egyptian Center for Economic Studies
Omneia Helmy, Deputy Director of Research and
Lead Economist
Magda Kandil, Executive Director and Director of Research
Malak Reda, Senior Economist
EthiopiaAfrican Institute of Management, Development and
Governance
Tegegne Teka, General Manager
Gambia, TheGambia Economic and Social Development Research
Institute (GESDRI)
Makaireh A. Njie, Director
GhanaAssociation of Ghana Industries (AGI)
Patricia Djorbuah, Projects Officer
Cletus Kosiba, Executive Director
Nana Owusu-Afari, President
KenyaInstitute for Development Studies, University of Nairobi
Mohamud Jama, Director and Associate Professor
Paul Kamau, Research Fellow
Dorothy McCormick, Associate Professor
LesothoMohloli Chamber of Business
LibyaNational Economic Development Board
Entisar Elbahi, Director, Relations and Supported Services
MadagascarCentre of Economic Studies, University of Antananarivo
Ravelomanana Mamy Raoul, Director
Razato Rarijaona Simon, Executive Secretary
MalawiMalawi Confederation of Chambers of Commerce and Industry
Chancellor L. Kaferapanjira, Chief Executive Officer
MaliGroupe de Recherche en Economie Appliquée et
Théorique (GREAT)
Massa Coulibaly, Coordinator
MauritaniaCentre d’Information Mauritanien pour le Développement
Economique et Technique (CIMDET/CCIAM)
Khira Mint Cheikhnani, Director
Lô Abdoul, Consultant and Analyst
Habib Sy, Analyst
MauritiusJoint Economic Council of Mauritius
Raj Makoond, Director
Board of Investment
Kevin Bessondyal, Assistant Director, Planning and Policy
Dev Chamroo, Director, Planning and Policy
Veekram Gowd, Senior Investment Advisor, Planning
and Policy
Raju Jaddoo, Managing Director
MoroccoUniversité Hassan II, LASAARE
Fouzi Mourji, Professor of Economics
MozambiqueEconPolicy Research Group, Lda.
Peter Coughlin, Director
Donaldo Miguel Soares, Researcher
Ema Marta Soares, Assistant
viii
Part
ner
Inst
itute
s
PARTNER INSTITUTES OF THE WORLD ECONOMIC FORUM
The Africa Competitiveness Report 2011 © 2011 World Economic Forum, the World Bank and the African Development Bank
NamibiaNamibian Economic Policy Research Unit (NEPRU)
Jacob Nyambe, Senior Researcher
Fanuel Tjingaete, Director
NigeriaNigerian Economic Summit Group (NESG)
Frank Nweke Jr., Director General
Sam Ohuabunwa, Chairman
Chris Okpoko, Research Director, Research
RwandaPrivate Sector Federation
Molly Rwigamba, Acting Chief Executive Officer
Emmanuel Rutagengwa, Policy Analyst
SenegalCentre de Recherches Economiques Appliquées (CREA),
University of Dakar
Diop Ibrahima Thione, Director
South AfricaBusiness Leadership South Africa
Friede Dowie, Director
Michael Spicer, Chief Executive Officer
Business Unity South Africa
Simi Siwisa, Director
Jerry Vilakazi, Chief Executive Officer
SwazilandFederation of Swaziland Employers and Chamber of Commerce
Zodwa Mabuza, Chief Executive Officer
Sihle Fakude,Research Analyst
TanzaniaResearch on Poverty Alleviation (REPOA)
Joseph Semboja, Professor and Executive Director
Lucas Katera, Director, Commissioned Research
Cornel Jahari, Researcher, Commissioned Research Department
TunisiaInstitut Arabe des Chefs d’Entreprises
Majdi Hassen, Executive Counsellor
Chekib Nouira, President
UgandaKabano Research and Development Centre
Robert Apunyo, Program Manager
Delius Asiimwe, Executive Director
Catherine Ssekimpi, Research Associate
ZambiaInstitute of Economic and Social Research (INESOR),
University of Zambia
Mutumba M. Bull, Director
Patricia Funjika, Staff Development Fellow
Jolly Kamwanga, Coordinator
ZimbabweGraduate School of Management, University of Zimbabwe
A. M. Hawkins, Professor
ix
Part
ner
Inst
itute
s
The Africa Competitiveness Report 2011 © 2011 World Economic Forum, the World Bank and the African Development Bank

The Africa Competitiveness Report 2011 © 2011 World Economic Forum, the World Bank and the African Development Bank
The Africa Competitiveness Report 2011 comes out as theworld emerges from the most significant financial andeconomic crisis in generations. While many advancedeconomies are still struggling to get their economiesback on a solid footing, Africa has, for the most part,weathered the storm remarkably well.
Indeed, despite a small dip in growth during the crisisperiod, Africa has staged a quick and strong comeback.Between 2001 and 2010, growth in gross domesticproduct (GDP) on the continent averaged 5.2 percentannually, with the African Economic Outlook (AEO) pro-jecting 5.2 percent growth in 2011 as well, higher thanthe global average of 4.2 percent projected by theInternational Monetary Fund (IMF). The key challengefor the continent is how to turn the ongoing recoveryinto strong, sustained, and shared growth that will leadto notable improvements in people’s lives.
Yet despite its generally solid performance, muchneeds to be done to ensure that this growth continuesinto the future. One of the reasons that Africa was lessaffected by the crisis than some other regions (e.g.,emerging Europe) was its limited integration, espe-cially of its financial markets, into the global economy.Although this sheltered African economies over theshorter term, it holds them back in their developmentover the longer term. Indeed, one of the ingredients forsustained growth identified by the Growth Commissionis the ability of a country to seize opportunities fromthe global economy, or, put differently, to engage withother countries and regions on mutually beneficialterms.1 In fact, as this Report discusses, those regionssuch as East Africa that have experienced greater tradediversification have demonstrated greater resilience during the crisis.
More generally, African economies must continueto develop economic environments that are based onproductivity enhancements to better enable them toensure solid future economic performance. This meanskeeping a clear focus on strengthening the institutional,physical, and human capital prerequisites for a strong andcompetitive private-sector-led development. And itmeans focusing in particular on policies and interven-tions that open up opportunities for entrepreneurshipand employment for all members of society. The statehas an important role to play in this regard—through
creating an enabling environment as well as identifyingand removing obstacles to high-potential sectors andindustries. This will be critical to ensuring that Africaaccelerates its progress in the positive direction that ithas taken over the past decade.
This year’s Africa Competitiveness Report is the thirdin a series within a partnership among three institutionsdeeply committed to Africa’s development. Followingon our first joint report in 2007, the World EconomicForum, the World Bank, and the African DevelopmentBank have come together once again to underscore theimportance of discussing the challenges of competitivenessin Africa. Each institution approaches the topic in its ownway, and together—when combined in this volume—they provide the reader with a rich set of complementaryviews about how to expand opportunities and increaseproductivity and growth in Africa (see Boxes 1 and 2).In addition, this year the Africa Commission and theDanish government have also provided their support tothe Report.
This joint publication looks at different factors thataffect competitiveness in Africa. By competitiveness wemean all of the factors, institutions, and policies thatdetermine a country’s level of productivity. The pro-ductivity of an economy, in turn, sets the sustainablelevel and path of prosperity that a country can achieve.In other words, more competitive economies tend tobe able to produce higher levels of income for their citizens. A country’s productivity level also determinesthe rates of return obtained by investment. Because therates of return are the fundamental drivers of growthrates, a more competitive economy is one that is likelyto grow faster over the medium to long term.
In today’s globalized world, a country’s trade per-formance and export sophistication and diversificationare critical indicators of its competitiveness and are drivers of economic performance. Much research hasdemonstrated the importance of international integra-tion and a strong export sector to enable small openeconomies to achieve high growth. In addition to pro-viding an important revenue source, the export sectorcreates an important feedback loop for improving pro-ductivity and reinforcing competitiveness by increasingcompetition in the home market and providing firmswith access to new technologies and techniques.
xi
Over
view
Overview
The Africa Competitiveness Report 2011 © 2011 World Economic Forum, the World Bank and the African Development Bank
xii
Over
view
The Executive Opinion SurveyThe Executive Opinion Survey (Survey) conducted annually bythe World Economic Forum captures the perceptions of leadingbusiness executives on numerous dimensions of the economyfrom a cross-section of firms representing its main sectors. TheSurvey compiles data in the following areas: government andpublic institutions, infrastructure, innovation and technology,education and human capital, financial environment, domesticcompetition, company operations and strategy, environment,social responsibility, Travel & Tourism, and health. All theseareas feed into the 12 pillars of the Global CompetitivenessIndex.
The Survey gauges the current condition of a giveneconomy’s business climate, and the data generated from the Survey comprise the core qualitative ingredient of theGlobal Competitiveness Index as well as a number of otherdevelopment-related studies and indexes carried out by theWorld Economic Forum and other institutions. The most recentSurvey data cover a record 139 countries, with responses frommore than 13,000 respondents worldwide, including 2,689 senior management respondents in 35 African countries.
In the Survey, business leaders are asked to assess specific aspects of the business environment in the country inwhich they operate. For each question, respondents are askedto give their opinion about the situation in their country of resi-dence, compared with a global norm. To conduct the Survey ineach country, the World Economic Forum relies on a network of over 150 Partner Institutes. Typically, the Partner Institutesare recognized economics departments of national universities,independent research institutes, or business organizations.
More information on the Executive Opinion Survey can befound in Chapter 2.1 of The Global Competitiveness Report2010–2011.
Enterprise SurveysThe World Bank’s Enterprise Surveys provide another importantsource of data for this Report, collecting both perception andobjective indicators of the business environment in each country. While not carried out in every country in every year,the Enterprise Surveys are made up of larger sample sizes that allow for a nuanced analysis of the results, for example by economic sector and gender of respondent. The data arecollected through face-to-face interviews with hundreds ofentrepreneurs; hence responses reflect the managers’ actualexperiences. The data collected span all major investment climate topics, ranging from infrastructure to access to financeand from corruption to crime. Detailed productivity informationincludes firm finances, costs such as labor and materials, sales,
and investment. The breadth and depth of data allow cross-country analysis by firm attributes (size, ownership, industry,etc.), and can probe the relationship between investment climate characteristics and firm productivity. Every year, 15–30Enterprise Surveys are implemented, with updates planned for each country every three to five years. This reflects theintense nature of administering firm surveys, given that firmsare required to respond to many detailed questions. So far over125 countries have been surveyed, including over 22,000 entre-preneurs, senior managers, and CEOs in over 40 African coun-tries. In 10 countries in Africa, surveys have been conductedmore than once; hence panel data are also available toresearchers around the globe. For more information, visitwww.enterprisesurveys.org.
Doing Business IndicatorsThe World Bank’s Doing Business Indicators are carried out on an annual basis, providing a quantitative measure of a par-ticular aspect relevant to competitiveness: business regulationsrelevant to the operation of domestic small- to medium-sizedenterprises (SMEs) throughout their life cycle. Specifically, theycover the following topics: Starting a Business, Dealing withConstruction Permits, Registering Property, Getting Credit,Protecting Investors, Paying Taxes, Trading Across Borders,Enforcing Contracts, and Closing a Business. The indicators arebuilt on the basis of standardized scenarios that permit consis-tency of approach and straightforward comparisons acrosscountries. They also enable the tracking of reform efforts overtime. Ease of use makes this a useful tool for policy analysis.The Doing Business data are updated annually; the most recentreport (published in September 2010) covers 183 economies, 50 of them in Africa. Some of these indicators are included inthe Global Competitiveness Index. For more information, visitwww.doingbusiness.org.
These three methodologies have similarities and differences.They are similar to the extent that they all focus on issues relat-ed to the business environment and they are based on a surveyof managers or experts. They differ in their objective: the WorldEconomic Forum Survey aims at capturing the differences in thebusiness environment across countries and at including theperspectives of CEOs and top managers, preferably with inter-national experience. The World Bank Enterprise Surveys, on theother hand, aim at measuring many different aspects of thebusiness environment and are more geared toward SMEs anddomestically focused firms; the Doing Business data attempt tomeasure the regulatory environment across countries.
Box 1: Data used in this Report
The Africa Competitiveness Report 2011 © 2011 World Economic Forum, the World Bank and the African Development Bank
Themes for improved competitivenessOver the last decade, many African countries focused on getting the economic fundamentals right. They put in place more sustainable fiscal policies, controlledinflation, and managed their debt. Some went further,addressing fundamental structural rigidities by divestingfrom private-sector activity, opening up some publiclydominated sectors—such as telecommunications—andreducing public-sector borrowing from the banking sec-tor, which was crowding out private investment. Thesereforms paid off. Investors both domestic and foreignwelcomed these reforms, and foreign direct investment(FDI) in particular increased from US$2.4 billion in1985 to US$53 billion in 2008. Similarly, exports fromAfrica increased significantly and continuously. Africancountries witnessed a period of sustained economicexpansion mostly fuelled by export-led growth.
Global integration offers incredible opportunitiesfor increased investment, greater growth, and job cre-ation. Africa must take advantage of this opportunity andmust claim a greater share of world trade. The conti-nent has made genuine progress in first-generationreforms. But to further boost competitiveness andincrease volume and sophistication of exports, Africamust tackle much tougher second-generation reforms.Two strategies can help the continent achieve this goal:diversifying its product and market base, and capitalizingon its own underutilized resources: managerial skills,female entrepreneurship, and natural and culturalresources.
Diversifying products and marketsA great deal of empirical evidence suggests that interna-tional trade is positively associated with high economicgrowth.2 The benefits of trade are well known: it raisesincome through specialization, increased competition,and the exploitation of economies of scale. It alsoincreases the variety of products and services available in the market and promotes technological innovation.
Yet, despite improving over recent decades,Africa’s share in world trade remains low, it is heavilyconcentrated in natural resources, and intra-Africantrade is particularly limited. Over the past 20 years,Africa has continued to depend heavily on naturalresources for export revenues, whereas other regionslargely diversified into processing industries. Only ahandful of countries in Africa were able to increasetheir world market share of exports over the last decade,and these still began from a very low base. Much can begained by diversifying exports and by further openingup regional trade.
The strategy each country must follow will dependon which industry it has a comparative advantage in.The cost of inputs (labor, capital, materials, energy), thequality of physical infrastructure, and the tax system arecritical in determining a country’s competitiveness inthe global export markets for simple manufacturers. The
availability of skilled labor and the capacity for innova-tion, along with input costs and the quality of policies,are the main drivers of competitiveness in heavy manu-facturing. More generally, the major cross-cutting poli-cy areas that constrain Africa’s competitiveness across allmain industry groups include those that increase indirectcosts—trade logistics and infrastructure; and those thatrelate to poor business environments—access to land,availability of skills, and ability to absorb technology. TheGlobal Competitiveness Index (GCI) discussed inChapter 1.1 shows that these are areas in which thecontinent scores relatively poorly.
Regional integration can help African countriesbecome more competitive and resilient to externalshocks, as the recent experience of East Africa during theglobal financial crisis illustrates. Clearly, a lack of well-functioning transport and trade facilitation regimes iswhat is hindering many countries from becoming bigger
xiii
Over
view
Box 2: The African Development Bank: Knowledgeto improve investment climate and competitiveness
The African Economic Outlook (AEO) is an annual publication jointly produced by the African DevelopmentBank and the OECD Development Centre beginning in2001–02. These organizations were joined in 2007 by the UNEconomic Commission for Africa and by the United NationsDevelopment Programme (UNDP) in 2010. The publicationreviews recent economic developments in Africa by adoptinga comparative approach and a common analytical frame-work. It provides forecasts for key macroeconomic variables.The AEO surveys and analyzes the current socioeconomicperformance of African economies and provides informationon a country-by-country basis about their socioeconomicprogress as well as on the short- to medium-term prospectsof these countries. Each year, the AEO addresses a specifictheme that focuses on a critical but under-researched areaof Africa’s socioeconomic development. The 2011 theme isEmerging Economic Partnerships. The AEO provides anoverview of specific international developments that mayimpact African economies, country notes on selected num-ber of countries, and a selected statistical appendix onAfrican countries. The current edition of the AEO is the 10thand covers 51 African countries—1 more than in the previ-ous edition. The key objectives of the AEO are to broaden theknowledge base on African economies and to offer valuablesupport for policymaking, investment decisions, and donors’interventions. Another important objective is to assist incapacity building. Through the involvement of Africanexperts and institutions in its preparation, the AEO increasesresearch capacity and reinforces their ownership. For moreinformation, visit www.africaneconomicoutlook.org.
The Africa Competitiveness Report 2011 © 2011 World Economic Forum, the World Bank and the African Development Bank
global players. Better logistics are strongly associatedwith trade expansion, export diversification, and theability to attract FDI.
FDI inflows play an important role in improvingcompetitiveness in African firms (both producers andsuppliers) through advancing their managerial skills andtechnological capacities. Measures to encourage regionalintegration and trade in Africa are likely to attract addi-tional market-seeking FDI. Similarly, services in most ofAfrica need to be further developed since the servicesector is both an important input into the competitive-ness of manufactures and an engine of growth in itsown right. In addition to augmenting the capital stock,FDI can play an important role in improving total fac-tor productivity (TFP) in African countries throughadvancing their technological capacities. The centralrole of FDI has been well recognized by African policy-makers: without the transfer of technological capabilitiesand home-grown innovation, the productivity gapbetween African countries and more advancedeconomies will not be reduced and could even widenfurther.
While attracting growth-enhancing FDI wouldhelp raise competitiveness, achieving it requires thathost countries create business environments where for-eign investors can boost the productivity of existingdomestic activities and generate positive spillovers.Open trade and investment regimes are critical in thisregard, as FDI has been found to be particularly benefi-cial for growth where it encourages trade.3 Raisinghuman capital and technological capacity as well asdeveloping infrastructure and financial sectors are crucialfor attracting FDI that would generate positivespillovers for domestic economies. In other words,more competitive economies will tend to attract moreFDI.
Finally, FDI is likely to exert the most positiveimpact on productivity and development in recipientAfrican countries if multinational enterprises (MNEs)take a broader perspective and support them in thisendeavor. Specifically, investing MNEs need to negoti-ate contracts that are fair and sustainable, adopt adequateand clean technologies, share knowledge, and in generaladhere to good standards of corporate behavior.4
Managerial skills and higher educationIn today’s globalized world, no country can thrivewithout a capacity to generate, transmit, and utilize newknowledge. Put differently, today’s globalized economyrequires countries to nurture pools of well-educatedworkers.
Much progress has been made in getting childreninto school and achieving parity between boys and girls in African classrooms at the primary school level,and to a lesser extent at the secondary school level. Butwhile rapid progress has been made in such basic-levelenrollments, university enrollment has barely advanced,
rising only from 4 percent in 1999 to 6 percent in 2007.Even though African countries have generally spent rel-atively large proportions of their national resources oneducation, the stock of human capital with a highereducation in Africa continues to be very low by inter-national standards.
Besides, research shows more and more that it iscognitive skills and learning, not years of schooling, thatmakes the difference. The reason is that cognitive skillscould foster innovation and promote technology diffu-sion by equipping the workforce with the ability toabsorb, process, and integrate new ideas into productionand service delivery. The areas of higher educationundertaken by a majority of African students are not infields such as science, engineering, technology, andbusiness, as is the case in rapidly growing emergingeconomies of Korea and China, but often in social sciences and the humanities. The result is a skill mis-match—university graduates remain unemployed, whileAfrican countries continue to face shortages of skilledlabor.
The good news is that the rate of return to skills ishigh in Africa. What is therefore needed is a big pushon quality education and skills, as was seen in Koreaand other East Asian countries to underpin their growthmiracles. The finding on the importance of cognitiveskills for long-run growth should be a wake-up call forAfrica, and should raise questions about the quality ofthe education now being provided.
The thriving telecommunications sector in manyAfrican countries can facilitate information transfer,knowledge, and learning. At the same time, tertiaryeducation curricula and pedagogy need to be reformed.The pedagogical approach makes a difference in thequality and effectiveness of entrepreneurship educationstudents receive. Consequently, a partnership betweenindustry and government on tertiary education shouldbe formed.
Women’s entrepreneurshipThe business case for expanding women’s economicopportunities is becoming increasingly evident. Theability of women to participate fully and productively in the labor market is constrained in many regions, bothby women’s lower educational levels relative to men’sand by social norms. This is inefficient, since increasedwomen’s labor force participation and earnings willenhance not only women’s own economic empower-ment, but also that of their children and the society as awhole.
The rate of women’s entrepreneurship is high inAfrica—higher than in any other region. However, thisis not necessarily a sign of economic empowerment. Infact, although there are no performance gaps betweenmen’s and women’s enterprises once differences in size,sector, and industry are taken into account, researchshows that women are concentrated in the informal,
xiv
Over
view
The Africa Competitiveness Report 2011 © 2011 World Economic Forum, the World Bank and the African Development Bank
micro, low-growth, low-profit areas. These includefood processing and vending, tailoring, batik making,beauty salons, selling charcoal, and producing handi-crafts, among others.
While women are less likely to be operating largerfirms in higher-value-added sectors, those who do so in fact manage firms that perform equally as well asthose run by men. Two sets of explanations help toaccount for why women are less likely to be active inthe higher-opportunity entrepreneurship activities. Thefirst has to do with human capital. Women’s educationhas continued to lag behind men’s, including in areas ofparticular relevance to running a business such as finan-cial literacy and management training. The second setof explanations regards control over assets. While busi-ness laws are largely gender blind, family, inheritance,labor, and land laws are often not. It is this group oflaws that determine legal capacity and control overassets within the household and often limit women’sdecision-making authority. Furthermore, the laws andregulations affecting businesses (including licensing pro-cedures) were designed for relatively large activities,which makes it difficult for micro enterprises to complywith them. Corruption and bureaucracy make mattersworse, especially for women who are more vulnerableto physical pressure from corrupt officials. Finally, themain barrier to performance of women-owned enter-prises is a cultural environment that makes it more diffi-cult for women to start and run enterprises because oftheir traditional reproductive roles: women often mustdivide their time and energy between their traditionalfamily and community roles and running the business.
Thus the agenda for expanding women’s economicopportunities is not to increase entrepreneurship per se,but rather to enable women to move into higher-value-added activities, both in terms of taking the step fromself-employment to being an employer, and in the typesof activities in which the women entrepreneurs engage.Increasing women’s human capital (education, manage-ment training, business mentors/networks), expandingthe awareness of women’s success as entrepreneurs, andimproving women’s voice in investment climate policycircles are important steps to achieve these results.
Cultural and natural resourcesAfrica is blessed by rich natural and cultural resources,which include a great deal more than the continent’svast supply of natural minerals. This unexploitedendowment has great potential for employment genera-tion, growth, and poverty reduction. One in twenty ofall jobs in sub-Saharan Africa are in Travel & Tourism(T&T). And as the T&T sector grows, its job creationand income-generating potential rise exponentially. AUS$250,000 investment in the tourism sector generates182 full-time formal jobs, according to a study by theNatural Resources Consultative Forum.5 This is nearly40 percent more than the same investment in agricul-
ture and over 50 percent more than in mining. At thesame time, the T&T sector compares well with othersectors in regard to opportunities for SME development,career advancement, and lifelong learning potential.
The Report analyzes the T&T competitiveness of countries across the continent, using the WorldEconomic Forum’s Travel & Tourism CompetitivenessIndex. This analysis is complemented by World Bankresearch on the drivers of Africa’s T&T competitivenessthat investigates visa administration, air transport access,hotels and lodges, tour operators, ecotourism and biodi-versity, and cultural heritage in Africa. This approachprovides a sense of the opportunities and challengesprovided by the tourism sector on the continent.
The development of the T&T sector offers signifi-cant opportunities for Africa to move up the valuechain, fostering growth and development in the region.Travel & Tourism in Africa has many advantages onwhich to build, including price competitiveness, astrong affinity for tourism, and rich natural resourcessupported by efforts toward environmental sustainabili-ty. However, evidence shows that a number of obsta-cles remain to improving the region’s competitiveness,notably improving safety and security, upgrading healthand hygiene levels, developing various forms of infra-structure, and fostering the region’s human capital.Given Africa’s many strengths, improvements in theseareas will greatly enhance its ability to reap the enor-mous potential benefits of tourism.
Framing the competitiveness agenda: National competitiveness councilsThe government plays a crucial role in fostering com-petitiveness within the African continent. And this roleshould not be limited to facilitating a business-friendlyenvironment and an adequate supply to human andphysical infrastructure. The state should also adoptactive and inclusive interventions in factors of produc-tion, especially in high-growth potential sectors. African governments need to be committed to fostering theireconomies’ competitiveness by incorporating competi-tiveness more broadly and effectively into their nationaldevelopment strategies. It is therefore important that any intervention be brought together within a compre-hensive strategy on competitiveness rather than being aseries of ad hoc interventions.
Yet improving competitiveness is not the responsi-bility of government alone. Businesses and civil societyalso have their roles to play. What is needed is an ongo-ing dialogue about measures needed and progress madein various areas, as well as incentives to keep up thereform process.
As the world economy continues to globalize, promoting competitiveness and growth has been mov-ing to the center of the attention of policymakers andbusiness. However, progress is not easy to achieve, as it
xv
Over
view
The Africa Competitiveness Report 2011 © 2011 World Economic Forum, the World Bank and the African Development Bank
often requires fundamental changes at all levels of socie-ty. Although government implementation of the righteconomic policy measures is a prerequisite to enhancingcompetitiveness, these measures need to be supportedby the private sector and civil society in order to makethem work efficiently. What makes the task even moredifficult is that competitiveness depends on a myriad of factors that span many areas of the economy. Yetsuccess is possible only if the underlying mechanisms are well understood and if the main actors are commit-ted to making continuous efforts.
The common denominator of successful approachesis close cooperation among the public sector, business,and civil society, the three key actors. Over the pastfew years, national competitiveness councils (NCCs)have proven to be one of the most successful approachesto institutionalizing public-private dialogue on compet -itiveness. Recognizing that competitiveness can beenhanced only through joint actions, a number ofcountries have created NCCs that often play a majorrole in economic policymaking.
Yet at present only a few African countries haveestablished active NCCs. Going forward, the creation of NCCs in Africa can play an important role in institutionalizing the ongoing process of reform andimprovement, and also the sharing of best practicesacross the continent.
Structure of the ReportThis Report includes four chapters, each addressing different aspects of competitiveness in Africa. The firstchapter of the Report analyzes competitiveness across the continent by looking at a wide range of factors ofthe business environment that have an impact on pro-ductivity, as well as Africa’s progress in integrating intothe global economy through exports and FDI. The subsequent chapters focus on how Africa can bettercapitalize on its rich resource base—through reforminghigher education, strengthening women’s entrepreneur-ship, and improving the environment for developingTravel & Tourism on the continent. A number of concrete policy recommendations are made within the chapters.
The final section of the Report provides detailedCompetitiveness Profiles for the African countriesincluded in the World Economic Forum’s GlobalCompetitiveness Index. These profiles present thedetailed rankings that go into the broader global competitiveness rankings.
Notes1 Launched in April 2006, the Commission on Growth and
Development brought together 22 leading practitioners from
government, business, and the policymaking arenas, mostly
from the developing world. The Commission was chaired by
Nobel Laureate Michael Spence, former Dean of the Stanford
Graduate Business School, with Danny Leipziger, former Vice-
President of the World Bank as its Vice-Chair. Over a period
of four years the Commission sought to gather the best under-
standing there was about the policies and strategies underlying
rapid and sustained economic growth and poverty reduction.
More information on the Commission and its findings can be
found at www.growthcommission.org.
2 Some earlier controversies notwithstanding, more recent empirical
literature (including a study focusing on within-country variations
in trade and growth rather than cross-country regressions) has
consistently showed positive links between trade and growth.
See, for example, Lee et al. 2004 and Dollar and Kraay 2002.
3 Moran et al. 2005.
4 OECD 2002.
5 Hamilton et al. 2007.
ReferencesAcs, Z. J. and A. Varga. 2005. “Entrepreneurship, Agglomeration and
Technological Change.” Small Business Economics 24 (3):
323–34.
Dollar, D. and A. Kraay. 2002. “Institutions, Trade, and Growth.” Journal
of Monetary Economics 50: 133–62.
Hamilton, K., G. Tembo, G. Sinyenga, S. Bandyopadhyay, A. Pope, B.
Guilon, B. Muwele, S. Mann, and J.-M. Pavy. 2007. The Real
Economic Impact of Nature Tourism in Zambia. Lusaka, Zambia:
Natural Resources Consultative Forum, Government of Zambia,
and the World Bank.
Lee, H. Y., L. Ricci, and R. Rigobon. 2004. “Once Again, Is Openness
Good for Growth?” Journal of Development Economics 75 (2):
451–72.
Moran, T., E. M. Graham, and M. Blomström, eds. 2005. Does Foreign
Direct Investment Promote Development? Washington DC:
Institute for International Economics and Center for Global
Development.
OECD (Organisation for Economic Co-operation and Development).
2002. Foreign Direct Investment for Development: Maximizing
Benefits, Minimizing Costs. Paris: OECD.
World Economic Forum. 2010. The Global Competitiveness Report
2010– 2011. Geneva: World Economic Forum.
———. 2011. The Travel & Tourism Competitiveness Report 2011.
Geneva: World Economic Forum.
xvi
Over
view
The Africa Competitiveness Report 2011 © 2011 World Economic Forum, the World Bank and the African Development Bank
Part 1 Assessing African Competitiveness
The Africa Competitiveness Report 2011 © 2011 World Economic Forum, the World Bank and the African Development Bank

The Africa Competitiveness Report 2011 © 2011 World Economic Forum, the World Bank and the African Development Bank
CHAPTER 1.1
Exports, FDI, andCompetitiveness in AfricaJENNIFER BLANKE, World Economic Forum
ZUZANA BRIXIOVA, African Development Bank
URI DADUSH, Carnegie Endowment
TUGBA GURCANLAR, World Bank
GIUSEPPE IAROSSI, World Bank
The aim of this Report is to highlight the prospects forstrong, sustained, and shared growth in Africa and,more importantly, the obstacles to the continent’s com-petitiveness and economic development. Such an assess-ment of Africa’s economies comes at an important time.A consensus among policymakers and researchers hasemerged that African countries have weathered theglobal economic crisis well. Yet questions remain as tohow sustainable this growth will be over the longerterm.
The recent economic downturn underscores theimportance of developing a competitiveness-supportingeconomic environment that is based on productivityenhancements in order to better enable national econ-omies to weather unexpected shocks and to ensuresolid, long-term economic performance. This chapterassesses the competitiveness landscape in Africa througha variety of lenses. We look at the factors driving pro-ductivity in general, as well as the export performanceand ability of African countries to attract growth-enhancing foreign direct investment (FDI).
Being for the most part small, open economies,African countries are well aware that a strong exportperformance is typically a prerequisite for reachingrobust, sustained, and shared growth. In Africa, strongexport performance does not mean only high exportgrowth, but also increased diversification from low-value-added activities (such as the export of unprocessedcommodities) to higher-value-added ones.1 Such diver-sification lowers the volatility of growth through areduced vulnerability of exports to external shocks.Exports of services can play an important role in thisregard. According to Newfarmer et al., exports of services raises export growth, competitiveness, anddiversification through lowering transaction costs inother export sectors, expanding existing activities, andcreating new ones.2 For example, tourism (discussed inChapter 2.3) can have a positive impact on exports inthe host country by creating foreign demand, enablingdeeper understanding of foreign preferences and spill -overs that raise quality standards, and thus making theexisting export activities more competitive. Mauritiusprovides an example of a successful experience withtourism helping to diversify exports.3
African policymakers have recognized that FDI can also play a positive role in promoting growth, pro-ductivity, and development in their economies. FDI canbe particularly beneficial for export sectors, as foreigncompanies help integrate developing countries into theglobal economy by easing access to foreign markets andincluding local enterprises in global production chains.Experiences from other world regions also suggest thatFDI can help facilitate export diversification.4
Recently, the literature on FDI has found it to be beneficial for the host countries’ growth when anenabling business environment—one that includes tradeand investment openness—is in place. Especially when
3
1.1:
Exp
orts
, FDI
, and
Com
petit
iven
ess
in A
fric
a
The Africa Competitiveness Report 2011 © 2011 World Economic Forum, the World Bank and the African Development Bank
FDI is accompanied by increased and diversified trade,host countries tend to accelerate their growth rates.5
Since the impact of FDI on growth and productivity istypically higher in manufacturing and services than inmining, FDI flows into the service sectors (e.g., tele-communications, banking) can support countries intheir efforts to diversify production and exports. Byslashing transaction costs, they also raise export compet-itiveness.
In this context, this chapter examines recent trendsand the main impediments for integrating Africaneconomies into global export markets, attracting growth-enhancing FDI, and raising overall competitiveness.
Trade and FDI in Africa: Recent trendsOver the last two decades, world trade (measured incurrent US dollars) has tripled. Many factors have con-tributed to this extraordinary advance. Among them arethe liberalization of trade, the falling costs of communi-cations and transportation, the slicing up of global pro-duction chains, an increased need for natural resourcesin fast-growing developing countries, and an increasedappetite for diversity as incomes rose across the globe.International trade in services has particularly taken off because of the reduction in communication costsand the digitization of services.
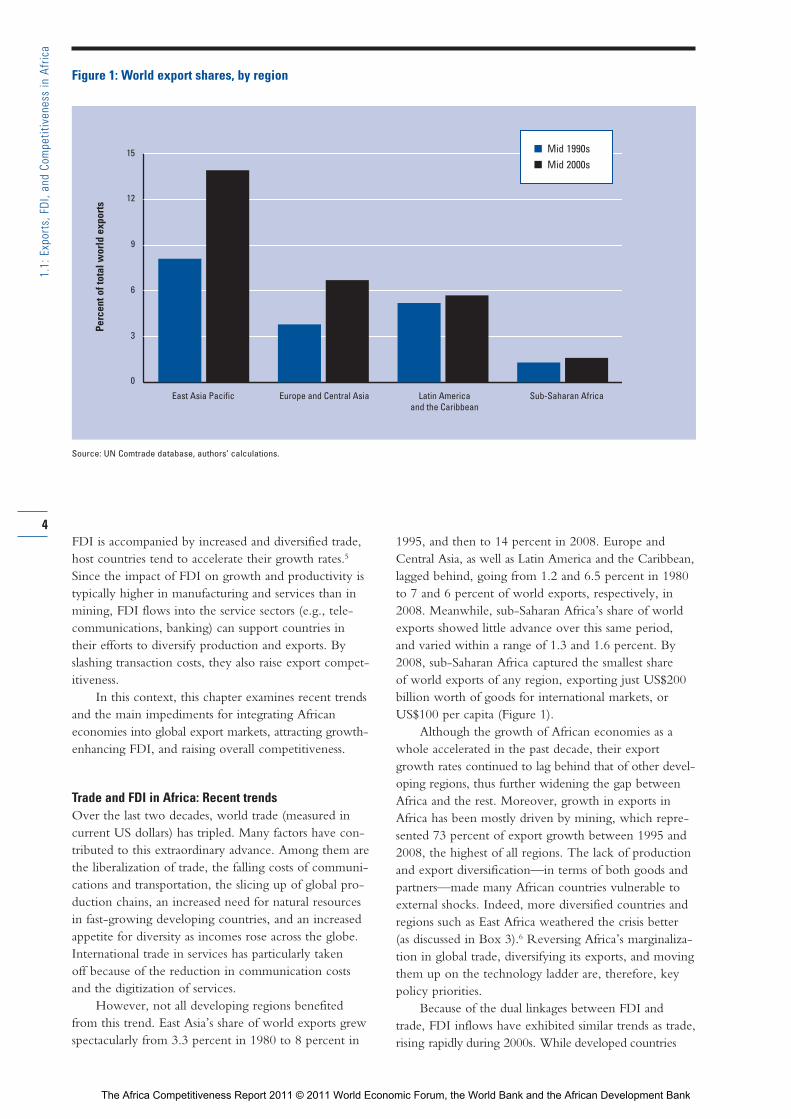
However, not all developing regions benefitedfrom this trend. East Asia’s share of world exports grewspectacularly from 3.3 percent in 1980 to 8 percent in
1995, and then to 14 percent in 2008. Europe andCentral Asia, as well as Latin America and the Caribbean,lagged behind, going from 1.2 and 6.5 percent in 1980to 7 and 6 percent of world exports, respectively, in2008. Meanwhile, sub-Saharan Africa’s share of worldexports showed little advance over this same period,and varied within a range of 1.3 and 1.6 percent. By2008, sub-Saharan Africa captured the smallest share of world exports of any region, exporting just US$200billion worth of goods for international markets, orUS$100 per capita (Figure 1).
Although the growth of African economies as awhole accelerated in the past decade, their exportgrowth rates continued to lag behind that of other devel-oping regions, thus further widening the gap betweenAfrica and the rest. Moreover, growth in exports inAfrica has been mostly driven by mining, which repre-sented 73 percent of export growth between 1995 and2008, the highest of all regions. The lack of productionand export diversification—in terms of both goods andpartners—made many African countries vulnerable toexternal shocks. Indeed, more diversified countries andregions such as East Africa weathered the crisis better (as discussed in Box 3).6 Reversing Africa’s marginaliza-tion in global trade, diversifying its exports, and movingthem up on the technology ladder are, therefore, keypolicy priorities.
Because of the dual linkages between FDI andtrade, FDI inflows have exhibited similar trends as trade,rising rapidly during 2000s. While developed countries
4
1.1:
Exp
orts
, FDI
, and
Com
petit
iven
ess
in A
fric
a
Figure 1: World export shares, by region
Source: UN Comtrade database, authors’ calculations.
0
3
6
9
12
15
East Asia Pacific Europe and Central Asia Latin Americaand the Caribbean
Sub-Saharan Africa
n Mid 1990sn Mid 2000s
Perc
ent o
f tot
al w
orld
exp
orts
The Africa Competitiveness Report 2011 © 2011 World Economic Forum, the World Bank and the African Development Bank
continued to receive the majority of FDI inflows until2009, the long-term geographical pattern has been grad-ually changing, with more inflows going to developingcountries, especially in Asia. Africa was no exception tothe general rise in FDI—in fact, FDI inflows to thecontinent more than tripled between 2001 and 2009.7
Looking ahead, a large body of literature hasunderscored how important it is for African countries tobe integrated in the world economy and have a strong,sophisticated, and well-diversified export sector in orderto maintain and achieve sustained growth. Moreover, the importance of creating enabling environment toattract FDI into high-growth potential sectors, beyondmining, cannot be overstated. Achieving these objec-tives will help Africa to improve competitiveness of itseconomies and raise productivity in order to achieverobust, sustained, and shared growth.8
Examining Africa’s competitivenessIn order to identify the priority areas requiring urgentand sustained policy attention to improve compet -itiveness in Africa, in this section we provide a bird’s eye view of the competitive landscape in Africa and an overview of where the continent stands vis-à-vis international benchmarks. We base this analysis on the World Economic Forum’s Global CompetitivenessIndex (GCI).9
Within the GCI, competitiveness is defined as the setof institutions, policies, and factors that determine the level ofproductivity of a country.10 The current and future levels of productivity, in turn, set the sustainable levels ofprosperity that can be earned by an economy. In otherwords, more competitive economies tend to be able toproduce higher levels of income for their citizens. Themeasurement of competitiveness is a complex undertak-ing. To this end, the GCI captures the idea that manydifferent elements matter for competitiveness by lookingat 12 distinct pillars:11 institutions (public and private),infrastructure, the macroeconomic environment, health and primary education, higher education and training,goods market efficiency, labor market efficiency, finan-cial market development, technological readiness, market size, business sophistication, and innovation.
Another important characteristic of the GCI is thatit explicitly takes into account the fact that countriesaround the world are at different stages of economicdevelopment. Accordingly, the GCI distinguishes threestages of development. In its first stage, economies arefactor-driven and countries compete based on their factorendowments—primarily unskilled labor and naturalresources. As wages rise with advancing development,countries move into the efficiency-driven stage of devel-opment (the second stage), when they must begin todevelop more efficient production processes and increaseproduct quality in order to continue to be competitive.Finally, as countries move into the innovation-driven
stage, they are able to sustain higher wages and the asso-ciated standard of living only if their businesses are ableto compete with new and unique products. At this thirdstage, companies must compete by producing new anddifferent goods and services using the most sophisticatedproduction processes.12 The full description of the GCIis shown in Appendix A.
This next section will assess the overall competi-tiveness of North Africa and sub-Saharan Africa as wellas the performance of individual countries comparedwith international standards. To put the analysis into aglobal context, we also include a number of comparatoreconomies and regions (Latin America and the
5
1.1:
Exp
orts
, FDI
, and
Com
petit
iven
ess
in A
fric
a
Table 1: Global Competitiveness Index 2010–2011 and2009–2010 comparisons
GCI 2010–2011 GCI 2009–2010Country/Region Rank* Score Rank†
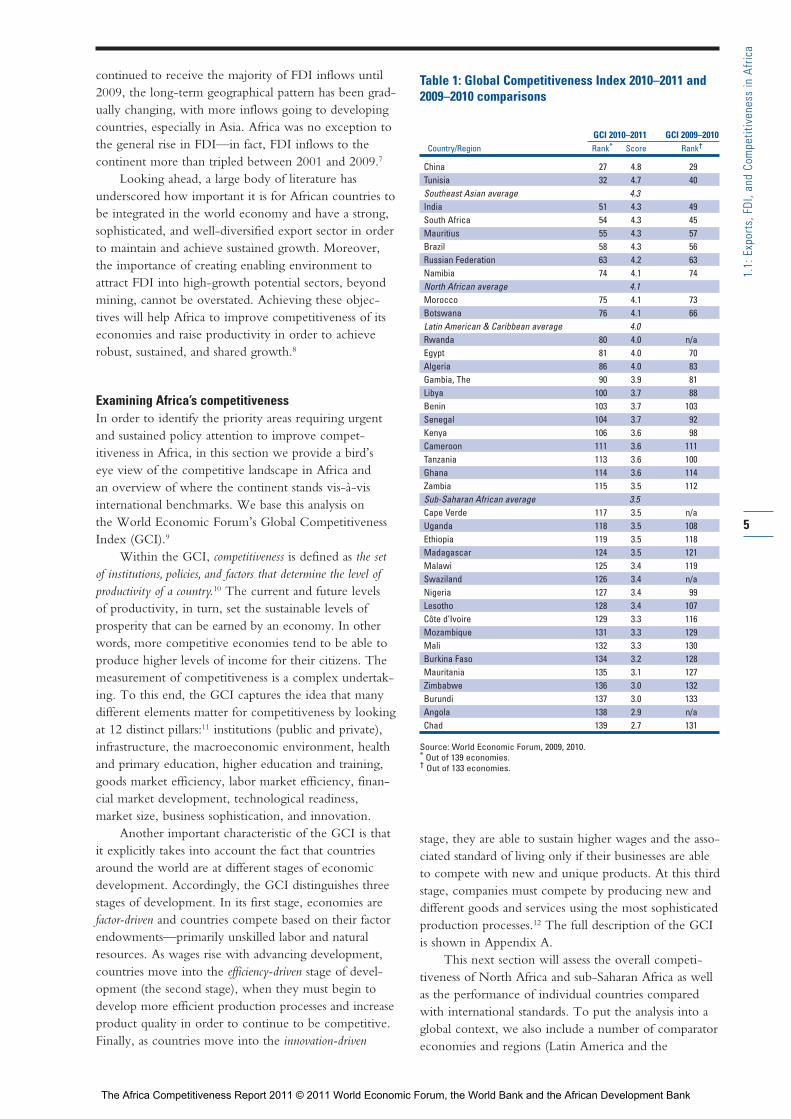
China 27 4.8 29Tunisia 32 4.7 40Southeast Asian average 4.3India 51 4.3 49South Africa 54 4.3 45Mauritius 55 4.3 57Brazil 58 4.3 56Russian Federation 63 4.2 63Namibia 74 4.1 74North African average 4.1Morocco 75 4.1 73Botswana 76 4.1 66Latin American & Caribbean average 4.0Rwanda 80 4.0 n/aEgypt 81 4.0 70Algeria 86 4.0 83Gambia, The 90 3.9 81Libya 100 3.7 88Benin 103 3.7 103Senegal 104 3.7 92Kenya 106 3.6 98Cameroon 111 3.6 111Tanzania 113 3.6 100Ghana 114 3.6 114Zambia 115 3.5 112Sub-Saharan African average 3.5Cape Verde 117 3.5 n/aUganda 118 3.5 108Ethiopia 119 3.5 118Madagascar 124 3.5 121Malawi 125 3.4 119Swaziland 126 3.4 n/aNigeria 127 3.4 99Lesotho 128 3.4 107Côte d’Ivoire 129 3.3 116Mozambique 131 3.3 129Mali 132 3.3 130Burkina Faso 134 3.2 128Mauritania 135 3.1 127Zimbabwe 136 3.0 132Burundi 137 3.0 133Angola 138 2.9 n/aChad 139 2.7 131
Source: World Economic Forum, 2009, 2010.* Out of 139 economies.† Out of 133 economies.
The Africa Competitiveness Report 2011 © 2011 World Economic Forum, the World Bank and the African Development Bank
Caribbean,13 Southeast Asia,14 and the BRIC countries—Brazil, Russia, India, and China).
Africa’s competitiveness in an international contextOn average, both North Africa and sub-Saharan Africaare outperformed by Southeast Asia and by all of theBRIC economies. North Africa is ahead of LatinAmerica, however, and also scores significantly higherthan sub-Saharan Africa. Recent events in North Africaare discussed in Box 1. Only three countries from theAfrican continent figure in the top half of the overallrankings: Tunisia (32nd), South Africa (54th), andMauritius (55th) (Table 2). Tunisia is outperformed byChina, the most competitive of the BRIC countries,but is more competitive than all other comparators inthe table. South Africa and Mauritius are also behindChina, as well as behind Southeast Asia and India, butahead of Brazil, Russia, and the other regional averages.
Table 1 shows that there is a second group of countries that cluster together at approximately the same competitiveness level as the North African aver-age, namely Namibia, Morocco, and Botswana, ranked 74th, 75th, and 76th, respectively. All countries that rank below these three perform worse than the LatinAmerican and the Caribbean average, with Algeria and Libya outperformed by a number of sub-SaharanAfrican countries. The remaining sub-Saharan Africancountries that do better than the regional average areRwanda, Gambia, Benin, Senegal, Kenya, Cameroon,Tanzania, Ghana, and Zambia (Table 4).
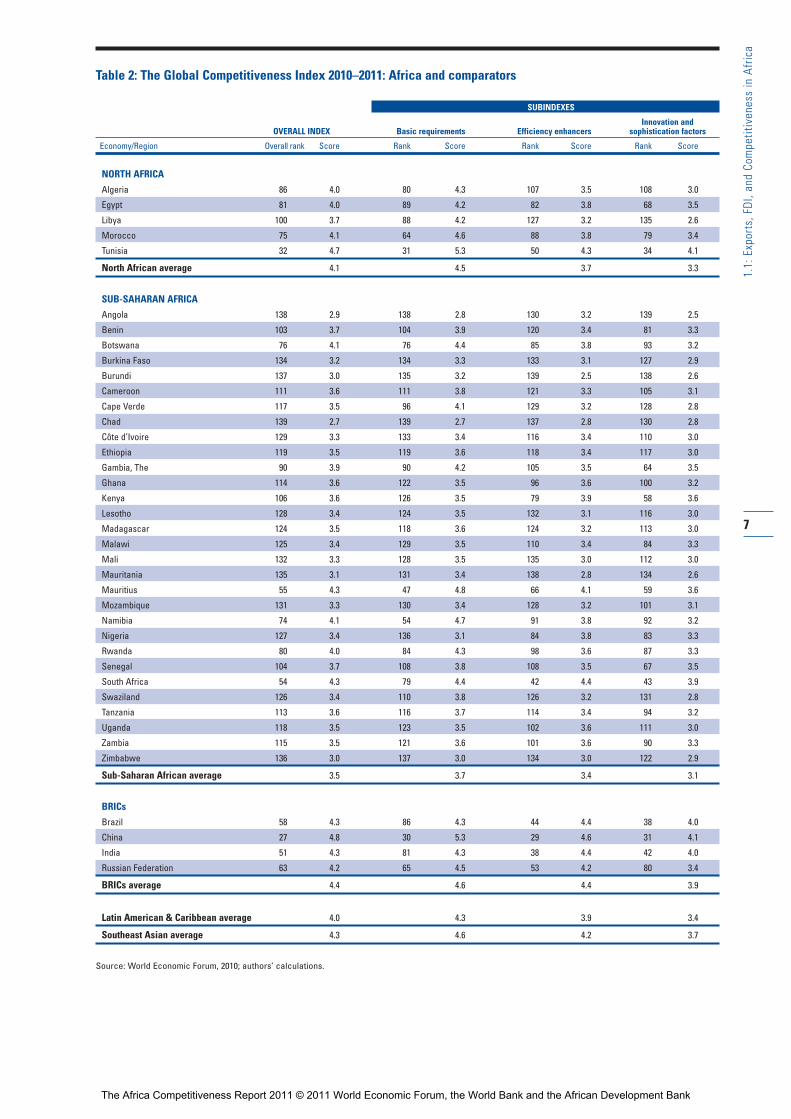
On average, as we have seen in past years, per-formances vary greatly between the countries in thenorth and the south of the continent (Table 2). NorthAfrica outperforms sub-Saharan Africa in 10 of the 12pillars, namely institutions, infrastructure, macroeco-nomic stability, health and primary education (by a largemargin), higher education and training, goods marketefficiency, technological readiness, market size, businesssophistication, and innovation. Sub-Saharan Africa out-performs North Africa on average in only two pillars:labor market efficiency and financial market sophistica-tion. Nevertheless, vast differences in the sophisticationof financial sectors exist even within sub-Saharan Africa,with financial sectors in low-income countries in thatregion being among the world’s least developed. In contrast, financial sectors in several sub-Saharan Africanmiddle-income countries/emerging markets (e.g.,Mauritius and South Africa) and a few frontier markets(e.g., Kenya) show much greater sophistication than therest of the continent. Sub-Saharan Africa’s middle-income countries also fare well relative to those in otherregions of the world.
A comparison with other regions and countrieshighlights Africa’s relative strengths and weaknesses. Inparticular, North Africa’s performance is very close tothe Southeast Asian average in the quality of institu-tions, infrastructure, and health and primary education
6
1.1:
Exp
orts
, FDI
, and
Com
petit
iven
ess
in A
fric
a
Box 1: Political unrest and competitiveness inNorth Africa
As discussed in the main text of this chapter, North Africa onaverage outperforms most sub-Saharan African countries,and Tunisia in particular receives a very strong assessment.The political unrest that the region has witnessed in recentmonths might make this assessment seem counterintuitive.However, it is very important to note that the GCI aims togauge the extent to which countries have put in place the factors ensuring sustainable growth through produc -tivity enhancements. It is not a measure of political risk.Nevertheless, it needs to be acknowledged that the recentpolitical changes are likely to have a negative impact on theeconomy in the near term. The ongoing political transitionwill need to be accompanied by structural changes thatcould accelerate employment-intensive growth.
The recent events do not detract from the fact thatTunisia has been successful over recent decades. Its solidgrowth rates, averaging more than 4.7 percent between 1990and 2010, have been widely attributed to the country’s abilityto put in place many factors favoring productivity, includingbetter education, a more favorable environment for doingbusiness, and the adoption of new technologies for produc-tivity enhancements. Still, growth was not broad-based.Higher growth rates—according to Abed and Iradian, in therange of 6–8 percent a year1—and also more job-rich growthare needed in order for the benefits to spread to the middleand lower classes (see Box 1, Chapter 2.1).
The recent political change can be attributed in part to Tunisia’s success across some areas and its less stellarperformance in others: the country now has a more highlyeducated and well-informed population, which is demandingbetter job opportunities for the future than currently exist. Itwould benefit from enhancing the sophistication and knowl-edge intensity of its production processes, thus moving theeconomy from low-cost, low-value-added to a higher-value-added that would bring about job opportunities for the edu-cated unemployed. At the same, adjustments to the educa-tional system—including higher education—will be neededto reduce the mismatch between the existing skills anddemand arising from these new job opportunities (seeChapter 2.1 on education).
In sum, we remain cautiously optimistic for Tunisia andthe region as a whole, as long as the countries continue toput into place the reforms necessary for ensuring strongcompetitiveness and resilient economies.
Source: Abed and Iradian, 2011.
Note
1 Abed and Iradian 2011.
The Africa Competitiveness Report 2011 © 2011 World Economic Forum, the World Bank and the African Development Bank
7
1.1:
Exp
orts
, FDI
, and
Com
petit
iven
ess
in A
fric
a
Table 2: The Global Competitiveness Index 2010–2011: Africa and comparators
SUBINDEXES
Innovation and OVERALL INDEX Basic requirements Efficiency enhancers sophistication factors
Economy/Region Overall rank Score Rank Score Rank Score Rank Score
NORTH AFRICA
Algeria 86 4.0 80 4.3 107 3.5 108 3.0
Egypt 81 4.0 89 4.2 82 3.8 68 3.5
Libya 100 3.7 88 4.2 127 3.2 135 2.6
Morocco 75 4.1 64 4.6 88 3.8 79 3.4
Tunisia 32 4.7 31 5.3 50 4.3 34 4.1
North African average 4.1 4.5 3.7 3.3
SUB-SAHARAN AFRICA
Angola 138 2.9 138 2.8 130 3.2 139 2.5
Benin 103 3.7 104 3.9 120 3.4 81 3.3
Botswana 76 4.1 76 4.4 85 3.8 93 3.2
Burkina Faso 134 3.2 134 3.3 133 3.1 127 2.9
Burundi 137 3.0 135 3.2 139 2.5 138 2.6
Cameroon 111 3.6 111 3.8 121 3.3 105 3.1
Cape Verde 117 3.5 96 4.1 129 3.2 128 2.8
Chad 139 2.7 139 2.7 137 2.8 130 2.8
Côte d’Ivoire 129 3.3 133 3.4 116 3.4 110 3.0
Ethiopia 119 3.5 119 3.6 118 3.4 117 3.0
Gambia, The 90 3.9 90 4.2 105 3.5 64 3.5
Ghana 114 3.6 122 3.5 96 3.6 100 3.2
Kenya 106 3.6 126 3.5 79 3.9 58 3.6
Lesotho 128 3.4 124 3.5 132 3.1 116 3.0
Madagascar 124 3.5 118 3.6 124 3.2 113 3.0
Malawi 125 3.4 129 3.5 110 3.4 84 3.3
Mali 132 3.3 128 3.5 135 3.0 112 3.0
Mauritania 135 3.1 131 3.4 138 2.8 134 2.6
Mauritius 55 4.3 47 4.8 66 4.1 59 3.6
Mozambique 131 3.3 130 3.4 128 3.2 101 3.1
Namibia 74 4.1 54 4.7 91 3.8 92 3.2
Nigeria 127 3.4 136 3.1 84 3.8 83 3.3
Rwanda 80 4.0 84 4.3 98 3.6 87 3.3
Senegal 104 3.7 108 3.8 108 3.5 67 3.5
South Africa 54 4.3 79 4.4 42 4.4 43 3.9
Swaziland 126 3.4 110 3.8 126 3.2 131 2.8
Tanzania 113 3.6 116 3.7 114 3.4 94 3.2
Uganda 118 3.5 123 3.5 102 3.6 111 3.0
Zambia 115 3.5 121 3.6 101 3.6 90 3.3
Zimbabwe 136 3.0 137 3.0 134 3.0 122 2.9
Sub-Saharan African average 3.5 3.7 3.4 3.1
BRICs
Brazil 58 4.3 86 4.3 44 4.4 38 4.0
China 27 4.8 30 5.3 29 4.6 31 4.1
India 51 4.3 81 4.3 38 4.4 42 4.0
Russian Federation 63 4.2 65 4.5 53 4.2 80 3.4
BRICs average 4.4 4.6 4.4 3.9
Latin American & Caribbean average 4.0 4.3 3.9 3.4
Southeast Asian average 4.3 4.6 4.2 3.7
Source: World Economic Forum, 2010; authors’ calculations.
The Africa Competitiveness Report 2011 © 2011 World Economic Forum, the World Bank and the African Development Bank
pillars. Yet it is weaker than the Latin America andCaribbean average in half of the pillars, namely healthand primary education, higher education and training,labor market efficiency, financial market development,technological readiness, and business sophistication.Sub-Saharan Africa’s institutions are better assessed thanthose of the Latin America and Caribbean region,Russia, and Brazil. Further, sub-Saharan Africa’s labormarkets are on average more efficient than those ofLatin America and the Caribbean on average, as well asthose of both India and Brazil.
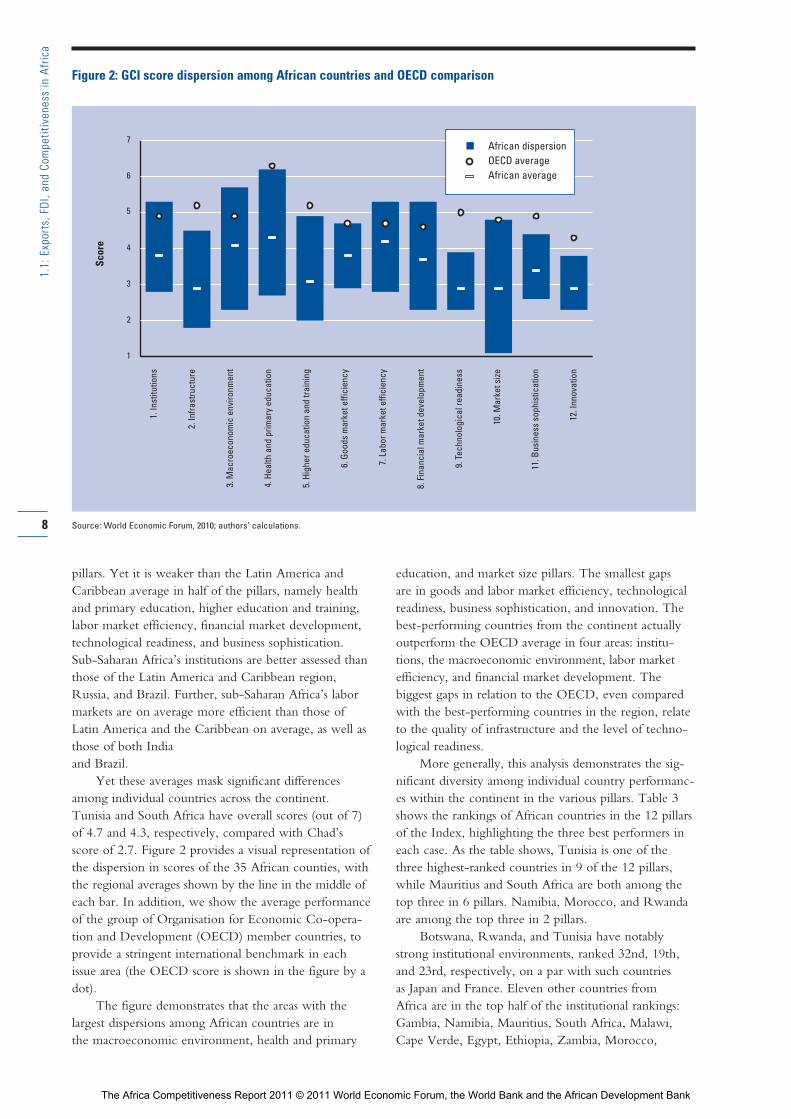
Yet these averages mask significant differencesamong individual countries across the continent.Tunisia and South Africa have overall scores (out of 7)of 4.7 and 4.3, respectively, compared with Chad’sscore of 2.7. Figure 2 provides a visual representation ofthe dispersion in scores of the 35 African counties, withthe regional averages shown by the line in the middle ofeach bar. In addition, we show the average performanceof the group of Organisation for Economic Co-opera-tion and Development (OECD) member countries, toprovide a stringent international benchmark in eachissue area (the OECD score is shown in the figure by adot).
The figure demonstrates that the areas with thelargest dispersions among African countries are in the macroeconomic environment, health and primary
education, and market size pillars. The smallest gaps are in goods and labor market efficiency, technologicalreadiness, business sophistication, and innovation. Thebest-performing countries from the continent actuallyoutperform the OECD average in four areas: institu-tions, the macroeconomic environment, labor marketefficiency, and financial market development. Thebiggest gaps in relation to the OECD, even comparedwith the best-performing countries in the region, relateto the quality of infrastructure and the level of techno-logical readiness.
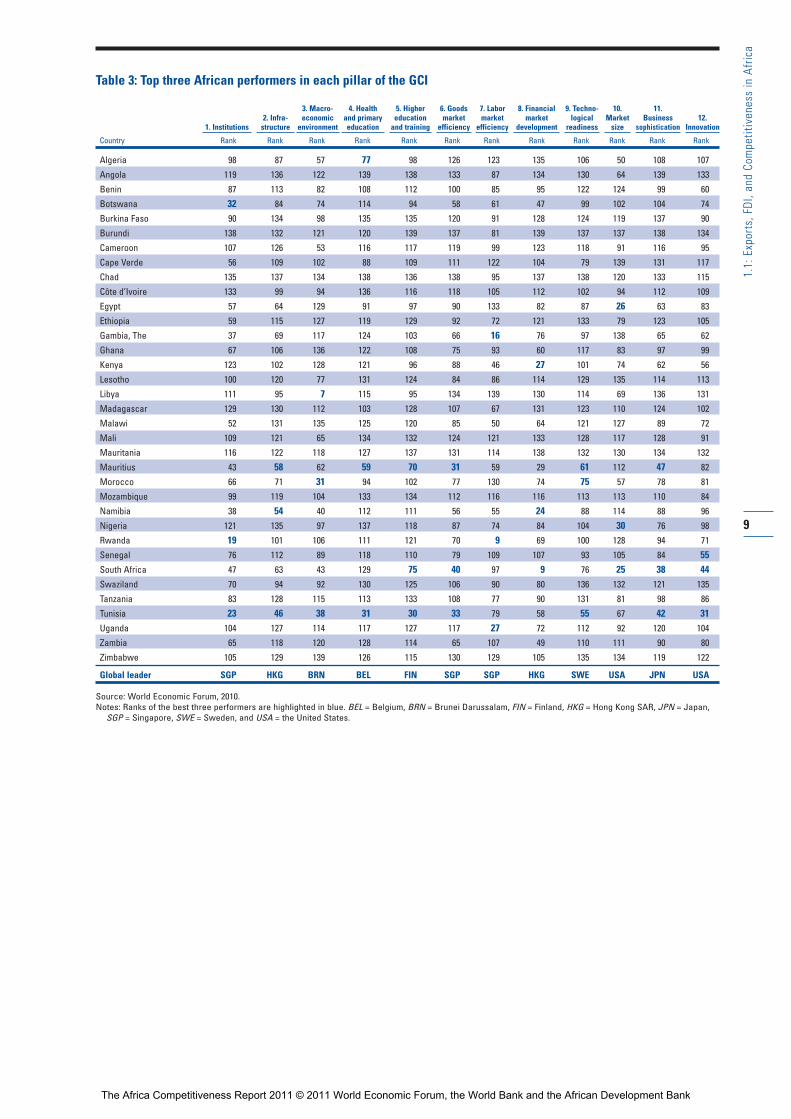
More generally, this analysis demonstrates the sig-nificant diversity among individual country performanc-es within the continent in the various pillars. Table 3 shows the rankings of African countries in the 12 pillarsof the Index, highlighting the three best performers ineach case. As the table shows, Tunisia is one of thethree highest-ranked countries in 9 of the 12 pillars,while Mauritius and South Africa are both among thetop three in 6 pillars. Namibia, Morocco, and Rwandaare among the top three in 2 pillars.
Botswana, Rwanda, and Tunisia have notablystrong institutional environments, ranked 32nd, 19th,and 23rd, respectively, on a par with such countries as Japan and France. Eleven other countries from Africa are in the top half of the institutional rankings:Gambia, Namibia, Mauritius, South Africa, Malawi,Cape Verde, Egypt, Ethiopia, Zambia, Morocco,
8
1.1:
Exp
orts
, FDI
, and
Com
petit
iven
ess
in A
fric
a
Figure 2: GCI score dispersion among African countries and OECD comparison
&&&
1
2
3
4
5
6
71.
Inst
itutio
ns
2. In
frast
ruct
ure
3. M
acro
econ
omic
env
ironm
ent
4. H
ealth
and
prim
ary
educ
atio
n
5. H
ighe
r edu
catio
n an
d tra
inin
g
6. G
oods
mar
ket e
ffici
ency
7. L
abor
mar
ket e
ffici
ency
8. F
inan
cial
mar
ket d
evel
opm
ent
9. T
echn
olog
ical
read
ines
s
10. M
arke
t size
11. B
usin
ess
soph
istic
atio
n
12. I
nnov
atio
n
Scor
e
n African dispersionOECD averageAfrican average
Source: World Economic Forum, 2010; authors’ calculations.
The Africa Competitiveness Report 2011 © 2011 World Economic Forum, the World Bank and the African Development Bank
9
1.1:
Exp
orts
, FDI
, and
Com
petit
iven
ess
in A
fric
a
Table 3: Top three African performers in each pillar of the GCI
Country Rank Rank Rank Rank Rank Rank Rank Rank Rank Rank Rank Rank
Algeria 98 87 57 77 98 126 123 135 106 50 108 107
Angola 119 136 122 139 138 133 87 134 130 64 139 133
Benin 87 113 82 108 112 100 85 95 122 124 99 60
Botswana 32 84 74 114 94 58 61 47 99 102 104 74
Burkina Faso 90 134 98 135 135 120 91 128 124 119 137 90
Burundi 138 132 121 120 139 137 81 139 137 137 138 134
Cameroon 107 126 53 116 117 119 99 123 118 91 116 95
Cape Verde 56 109 102 88 109 111 122 104 79 139 131 117
Chad 135 137 134 138 136 138 95 137 138 120 133 115
Côte d’Ivoire 133 99 94 136 116 118 105 112 102 94 112 109
Egypt 57 64 129 91 97 90 133 82 87 26 63 83
Ethiopia 59 115 127 119 129 92 72 121 133 79 123 105
Gambia, The 37 69 117 124 103 66 16 76 97 138 65 62
Ghana 67 106 136 122 108 75 93 60 117 83 97 99
Kenya 123 102 128 121 96 88 46 27 101 74 62 56
Lesotho 100 120 77 131 124 84 86 114 129 135 114 113
Libya 111 95 7 115 95 134 139 130 114 69 136 131
Madagascar 129 130 112 103 128 107 67 131 123 110 124 102
Malawi 52 131 135 125 120 85 50 64 121 127 89 72
Mali 109 121 65 134 132 124 121 133 128 117 128 91
Mauritania 116 122 118 127 137 131 114 138 132 130 134 132
Mauritius 43 58 62 59 70 31 59 29 61 112 47 82
Morocco 66 71 31 94 102 77 130 74 75 57 78 81
Mozambique 99 119 104 133 134 112 116 116 113 113 110 84
Namibia 38 54 40 112 111 56 55 24 88 114 88 96
Nigeria 121 135 97 137 118 87 74 84 104 30 76 98
Rwanda 19 101 106 111 121 70 9 69 100 128 94 71
Senegal 76 112 89 118 110 79 109 107 93 105 84 55South Africa 47 63 43 129 75 40 97 9 76 25 38 44Swaziland 70 94 92 130 125 106 90 80 136 132 121 135
Tanzania 83 128 115 113 133 108 77 90 131 81 98 86
Tunisia 23 46 38 31 30 33 79 58 55 67 42 31Uganda 104 127 114 117 127 117 27 72 112 92 120 104
Zambia 65 118 120 128 114 65 107 49 110 111 90 80
Zimbabwe 105 129 139 126 115 130 129 105 135 134 119 122
Global leader SGP HKG BRN BEL FIN SGP SGP HKG SWE USA JPN USA
Source: World Economic Forum, 2010.Notes: Ranks of the best three performers are highlighted in blue. BEL = Belgium, BRN = Brunei Darussalam, FIN = Finland, HKG = Hong Kong SAR, JPN = Japan,
SGP = Singapore, SWE = Sweden, and USA = the United States.
1. Institutions2. Infra-structure
3. Macro-economic
environment
4. Health and primary education
5. Higher education
and training
6. Goodsmarket
efficiency
7. Labor market
efficiency
8. Financialmarket
development
9. Techno-logical
readiness
10.Market
size
11. Business
sophistication12.
Innovation
The Africa Competitiveness Report 2011 © 2011 World Economic Forum, the World Bank and the African Development Bank
and Ghana. Having built up strong institutional environments by international standards, these countriesprovide examples to follow for other countries inAfrica. The large number of African countries at thebottom of the rankings in this area demonstrates theextent to which positive examples are critical for theregion.
Mauritius, Namibia, and Tunisia are the top-rankedAfrican countries for infrastructure, placing at 58th,54th, and 46th, respectively. These countries have builtgood transportation infrastructures by regional standards,particularly their roads and ports. They are joined in thetop half of the rankings by South Africa (63rd), Egypt(64th), and Gambia (69th). Yet even the ranks of thesebest regional performers remain middling, and the sheerunderdevelopment of infrastructure in most of the con-tinent is reflected by the much lower ranks of mostAfrican countries in this pillar.
The top three performers in the macroeconomicenvironment pillar include one oil-exporting country,Libya (ranked 7th), as well as two other North Africancountries, Morocco and Tunisia (ranked 31st and 38th,respectively). Six other countries are in the top half of the rankings (Namibia, South Africa, Cameroon,Algeria, Mauritius, and Mali). However, Table 3 showsthat most African countries receive a poor assessment,which is often related to the management of the gov-ernment finances. Although this is clearly a problemthat is not specific to Africa, even better fiscal and mon-etary management are needed in most countries, theimprovements achieved in the run-up to the globalfinancial crisis notwithstanding.
Health and primary education remains among thegreatest concerns for Africa, given that among the topthree regional performers—Algeria, Mauritius, andTunisia—only two of them, Tunisia and Mauritius, areranked in the top half of countries in this pillar. In fact,all but five countries are in the bottom third of the rank-ings, with many rounding out the very bottom group(indeed, all but one of the bottom-10 ranked countrieshail from Africa). Poor health indicators related in largepart to high rates of communicable diseases, low pri-mary education enrollment, and poor assessments ofmost national primary educational systems explain thispoor result. This is arguably the area requiring the mosturgent attention for improving Africa’s competitivenessin the aggregate.
In terms of higher education and training, althoughthe spread between the most and least successful coun-tries in this area is smaller than it is for some of the otherpillars, the overall performances are relatively weak. Thetop three ranked countries are Mauritius, South Africa,and Tunisia. However, of these three, only Tunisiaplaces in the top half of all countries, illustrating thequite low rankings for countries from the region overallin this pillar. It is perhaps not surprising that secondaryeducation and university enrollment rates and the assess-
ment of the quality of higher education remain weak inthe region, given that the primary educational base onwhich to build has not yet been put into place in mostcountries. This will be a critical area for attention ascountries move up the value chain toward more complexproduction.
The situation is somewhat more positive whenturning to the functioning of markets in Africa. The topthree countries in the goods market efficiency pillar—Mauritius, South Africa, and Tunisia—have goods markets that are similar to those of countries such asChile and Korea in their efficiency, although all remainbelow the average of OECD countries shown in Figure2. South Africa, in particular, is characterized by strongcompetition in the market, a taxation system that is notdistortive to business decisions, and an agricultural sec-tor that is not very costly to the economy (unlike inmany industrialized countries). Yet it is clear that mostcountries in Africa remain hobbled by regulations andother obstacles that diminish the efficiency with whichgoods and services are traded in their economies. Onlyfour other countries are in the top half of the rankingsin this pillar: Namibia, Botswana, Zambia, and Gambia.Eighteen African countries are in the bottom third ofthe rankings. Much can be done in the region to injectmore competition into markets and make starting abusiness in the region less difficult.
Labor markets constitute another area where a few countries stand out for their comparatively goodperformance while most lag behind, and where we seesome strong differences between North African andsub-Saharan African countries. Rwanda, Gambia, andUganda receive the highest assessments, ranked 9th,16th, and 27th, respectively, in this pillar. They arejoined at the top half of the rankings by six otherAfrican countries: Kenya, Malawi, Namibia, Mauritius,Botswana, and Madagascar. These countries, to varyingdegrees, can count on flexible hiring and firing practicesand relatively low non-wage labor costs. However,despite these relatively good performers, the table alsoshows that the labor markets in most African countriesare among the least flexible and least efficient in theworld, as also evidenced by high levels of unemploymentin middle-income countries such as South Africa,Tunisia, and Botswana, as well as very high “workingpoverty” levels in many of the poorest countries in theregion. Such labor market inefficiencies have beenamong the key factors setting off the political unrestthroughout North Africa in recent months. Much mustbe done on the continent to free Africa’s labor marketsand unleash the potential of the region’s workforce.
Financial markets provide a somewhat more positivepicture, although significant disparities in terms offinancial development remain. South Africa, ranked 1stin the region and an impressive 9th overall, has highlydeveloped financial markets on a par with Switzerlandand Canada, with relatively easy access to capital from
10
1.1:
Exp
orts
, FDI
, and
Com
petit
iven
ess
in A
fric
a
The Africa Competitiveness Report 2011 © 2011 World Economic Forum, the World Bank and the African Development Bank
various sources, sound banks, and a well-regulated securities market. Although their financial markets areless developed than that of South Africa, Namibia,Kenya, and Mauritius also are ranked in the top third inthis pillar, well ahead of most other countries in theregion. Six other countries have financial markets thatare placed in the top half of the rankings: Botswana,Zambia, Tunisia, Ghana, Malawi, and Rwanda. Yet,particularly given the turbulence seen in recent years inglobal financial markets, efforts to further develop anddeepen Africa’s financial markets, including additionalstrengthening of regulatory and supervisory frameworks,are necessary to ensure that financial resources in thesecountries are both available and allocated to their bestuse. It is notable that eight of the bottom-ten rankedcountries in this pillar are from Africa, including coun-tries from both North Africa and sub-Saharan Africa.
As Figure 2 shows, technological readiness is an area where African countries do overall quite poorly as a group and where they are well behind the OECDaverage. As shown in Table 3, the highest-ranked country in this area is Tunisia, at a relatively low 55th,and it is joined in the top half of the rankings only byMauritius (61st). In fact, 28 of the 35 African countriesare in the bottom third, and occupy eight of the bottomten places overall. This is a reflection of the very lowpenetration rates of most ICT tools on the continent,related in part to the low prioritization given by manygovernments to encouraging information communica-tion technologies (ICT) and other new technologyadoption, as well as to low educational attainment.Other bottlenecks, such as the vast gap in energy supplyand hence its relatively high cost, impede more wide-spread use of the Internet. Nevertheless, there are areaswhere Africa can be proud of its achievements—such as the innovative applications of m-banking (Kenya); m-agriculture (Niger, Senegal); and, in general, therapid adoption of the mobile technology. In fact, several African frontier markets (e.g., Ghana, Kenya,and Senegal) are ahead of major emerging marketeconomies such as India in the usage of mobile phones,demonstrating that in an enabling environment Africacan rapidly adopt modern technology.15 Moreover, inrecent years Africa has been the fastest-growing marketfor mobile phones in the world,16 albeit from a lowbase. Despite the recent significant uptake of sometechnologies, however, ICT overall is an area where, in many cases, countries in other regions are simplymoving faster. Given the significant potential of newtechnologies for information exchange and productivityenhancement, this is another clear area requiring urgentand sustained attention.
The size of markets also varies greatly amongAfrican countries. Table 3 highlights the three largestmarkets: those of South Africa, Egypt, and Nigeria.These three countries benefit from economies of scaleafforded by significant domestic and foreign (trade) markets. While many African countries clearly cannot
simply enlarge their domestic market size, they could do more to open their markets to trade and thus benefitfrom an enlarged foreign market size. There are manyoverlapping regional trade arrangements currently inplace on the continent, most of which have met withmixed success at best. Trade barriers remain endemic in the region despite the great benefits that could bereaped by greater regional integration. Africa’s exportperformance will be discussed in a later part of thischapter.
Turning to the most complex areas measured bythe GCI, business sophistication is not yet an area ofcritical concern for most African countries, since theycan still greatly enhance their productivity and competi-tiveness by improving on the more basic areas discussedabove. However, for the few African countries that arenearing the transition to the most advanced stage ofdevelopment, this area will become increasingly impor-tant. As luck would have it, the top three countries inthis pillar—Mauritius, South Africa, and Tunisia—areclassified in the efficiency-driven stage and therefore arenearing the stage when these more complex factors willbecome very important.
Finally, Kenya, Senegal, South Africa, and Tunisia are the top regional performers with respect to innova-tion, on a par with such innovative countries as Indiaand Italy. These countries have high-quality scientificresearch institutions, invest strongly in research anddevelopment, and are characterized by a significant levelof collaboration between business and universities inresearch. The low rankings of the other countries fromthe region should not be of significant concern at thisstage, given the importance of focusing on the morebasic areas for improvement first.
The overall picture is that strong area-specific performances are concentrated among a relatively smallgroup of African countries, although pockets of excel-lence exist in a number of others. This demonstrates that Africa is home to a number of countries that pro-vide strong best practice examples in various areas forthe other African countries struggling to improve theircompetitiveness.
The most problematic factors for doing business in AfricaThe results of the GCI thus provide a good sense of the many factors that are holding back Africa’s competi-tiveness. To complement this analysis, each year theWorld Economic Forum collects the perspective ofCEOs and top executives from around the world on themain bottlenecks to doing business in their countries.Specifically, they are asked to rank the most problematicfactors that they face in doing business in their countryout of 15 possible factors. Figures 3 and 4 show theaggregated results of these responses for North Africaand sub-Saharan Africa on average, respectively.
Figures 3 and 4 show that the top two factors forboth regions are the same, and in the same order: insuf-ficient access to financing and corruption. Although
11
1.1:
Exp
orts
, FDI
, and
Com
petit
iven
ess
in A
fric
a
The Africa Competitiveness Report 2011 © 2011 World Economic Forum, the World Bank and the African Development Bank
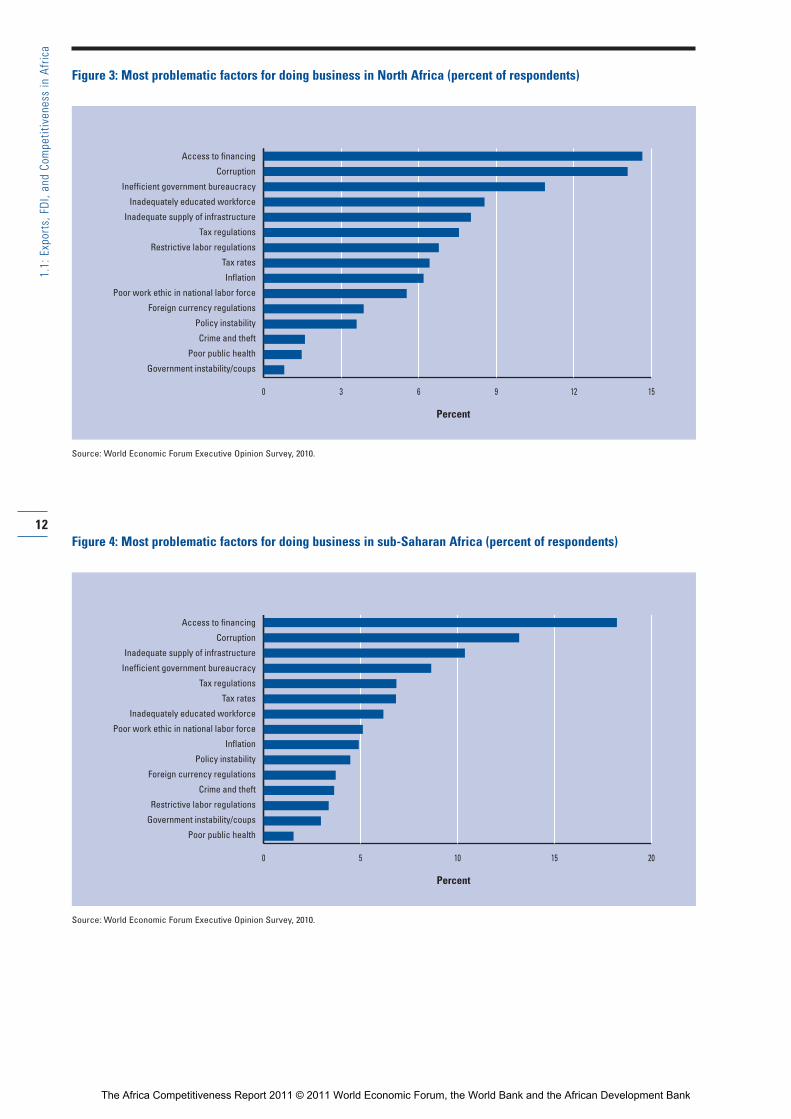
12
1.1:
Exp
orts
, FDI
, and
Com
petit
iven
ess
in A
fric
a
Figure 3: Most problematic factors for doing business in North Africa (percent of respondents)
Source: World Economic Forum Executive Opinion Survey, 2010.
0 3 6 9 12 15
Access to financing
Corruption
Inefficient government bureaucracy
Inadequately educated workforce
Inadequate supply of infrastructure
Tax regulations
Restrictive labor regulations
Tax rates
Inflation
Poor work ethic in national labor force
Foreign currency regulations
Policy instability
Crime and theft
Poor public health
Government instability/coups
Percent
Figure 4: Most problematic factors for doing business in sub-Saharan Africa (percent of respondents)
Source: World Economic Forum Executive Opinion Survey, 2010.
0 5 10 15 20
Access to financing
Corruption
Inadequate supply of infrastructure
Inefficient government bureaucracy
Tax regulations
Tax rates
Inadequately educated workforce
Poor work ethic in national labor force
Inflation
Policy instability
Foreign currency regulations
Crime and theft
Restrictive labor regulations
Government instability/coups
Poor public health
Percent
The Africa Competitiveness Report 2011 © 2011 World Economic Forum, the World Bank and the African Development Bank
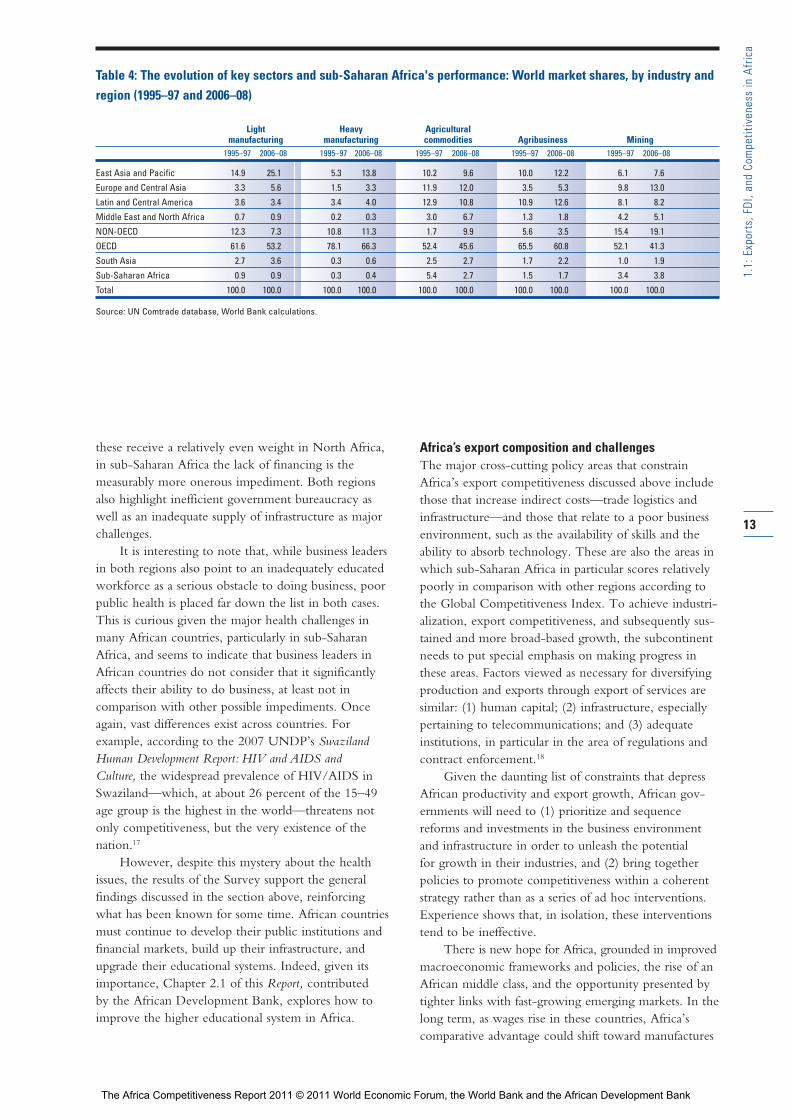
these receive a relatively even weight in North Africa,in sub-Saharan Africa the lack of financing is the measurably more onerous impediment. Both regionsalso highlight inefficient government bureaucracy aswell as an inadequate supply of infrastructure as majorchallenges.
It is interesting to note that, while business leadersin both regions also point to an inadequately educatedworkforce as a serious obstacle to doing business, poorpublic health is placed far down the list in both cases.This is curious given the major health challenges inmany African countries, particularly in sub-SaharanAfrica, and seems to indicate that business leaders inAfrican countries do not consider that it significantlyaffects their ability to do business, at least not in comparison with other possible impediments. Onceagain, vast differences exist across countries. For example, according to the 2007 UNDP’s SwazilandHuman Development Report: HIV and AIDS and Culture, the widespread prevalence of HIV/AIDS inSwaziland—which, at about 26 percent of the 15–49age group is the highest in the world—threatens notonly competitiveness, but the very existence of thenation.17
However, despite this mystery about the healthissues, the results of the Survey support the generalfindings discussed in the section above, reinforcing what has been known for some time. African countriesmust continue to develop their public institutions andfinancial markets, build up their infrastructure, andupgrade their educational systems. Indeed, given itsimportance, Chapter 2.1 of this Report, contributed by the African Development Bank, explores how toimprove the higher educational system in Africa.
Africa’s export composition and challengesThe major cross-cutting policy areas that constrainAfrica’s export competitiveness discussed above includethose that increase indirect costs—trade logistics andinfrastructure—and those that relate to a poor businessenvironment, such as the availability of skills and theability to absorb technology. These are also the areas inwhich sub-Saharan Africa in particular scores relativelypoorly in comparison with other regions according tothe Global Competitiveness Index. To achieve industri-alization, export competitiveness, and subsequently sus-tained and more broad-based growth, the subcontinentneeds to put special emphasis on making progress inthese areas. Factors viewed as necessary for diversifyingproduction and exports through export of services aresimilar: (1) human capital; (2) infrastructure, especiallypertaining to telecommunications; and (3) adequateinstitutions, in particular in the area of regulations andcontract enforcement.18
Given the daunting list of constraints that depressAfrican productivity and export growth, African gov-ernments will need to (1) prioritize and sequencereforms and investments in the business environmentand infrastructure in order to unleash the potential for growth in their industries, and (2) bring togetherpolicies to promote competitiveness within a coherentstrategy rather than as a series of ad hoc interventions.Experience shows that, in isolation, these interventionstend to be ineffective.
There is new hope for Africa, grounded in improvedmacroeconomic frameworks and policies, the rise of anAfrican middle class, and the opportunity presented bytighter links with fast-growing emerging markets. In thelong term, as wages rise in these countries, Africa’scomparative advantage could shift toward manufactures
13
1.1:
Exp
orts
, FDI
, and
Com
petit
iven
ess
in A
fric
a
Table 4: The evolution of key sectors and sub-Saharan Africa's performance: World market shares, by industry andregion (1995–97 and 2006–08)
Light Heavy Agriculturalmanufacturing manufacturing commodities Agribusiness Mining
1995–97 2006–08 1995–97 2006–08 1995–97 2006–08 1995–97 2006–08 1995–97 2006–08
East Asia and Pacific 14.9 25.1 5.3 13.8 10.2 9.6 10.0 12.2 6.1 7.6
Europe and Central Asia 3.3 5.6 1.5 3.3 11.9 12.0 3.5 5.3 9.8 13.0
Latin and Central America 3.6 3.4 3.4 4.0 12.9 10.8 10.9 12.6 8.1 8.2
Middle East and North Africa 0.7 0.9 0.2 0.3 3.0 6.7 1.3 1.8 4.2 5.1
NON-OECD 12.3 7.3 10.8 11.3 1.7 9.9 5.6 3.5 15.4 19.1
OECD 61.6 53.2 78.1 66.3 52.4 45.6 65.5 60.8 52.1 41.3
South Asia 2.7 3.6 0.3 0.6 2.5 2.7 1.7 2.2 1.0 1.9
Sub-Saharan Africa 0.9 0.9 0.3 0.4 5.4 2.7 1.5 1.7 3.4 3.8
Total 100.0 100.0 100.0 100.0 100.0 100.0 100.0 100.0 100.0 100.0
Source: UN Comtrade database, World Bank calculations.
The Africa Competitiveness Report 2011 © 2011 World Economic Forum, the World Bank and the African Development Bank
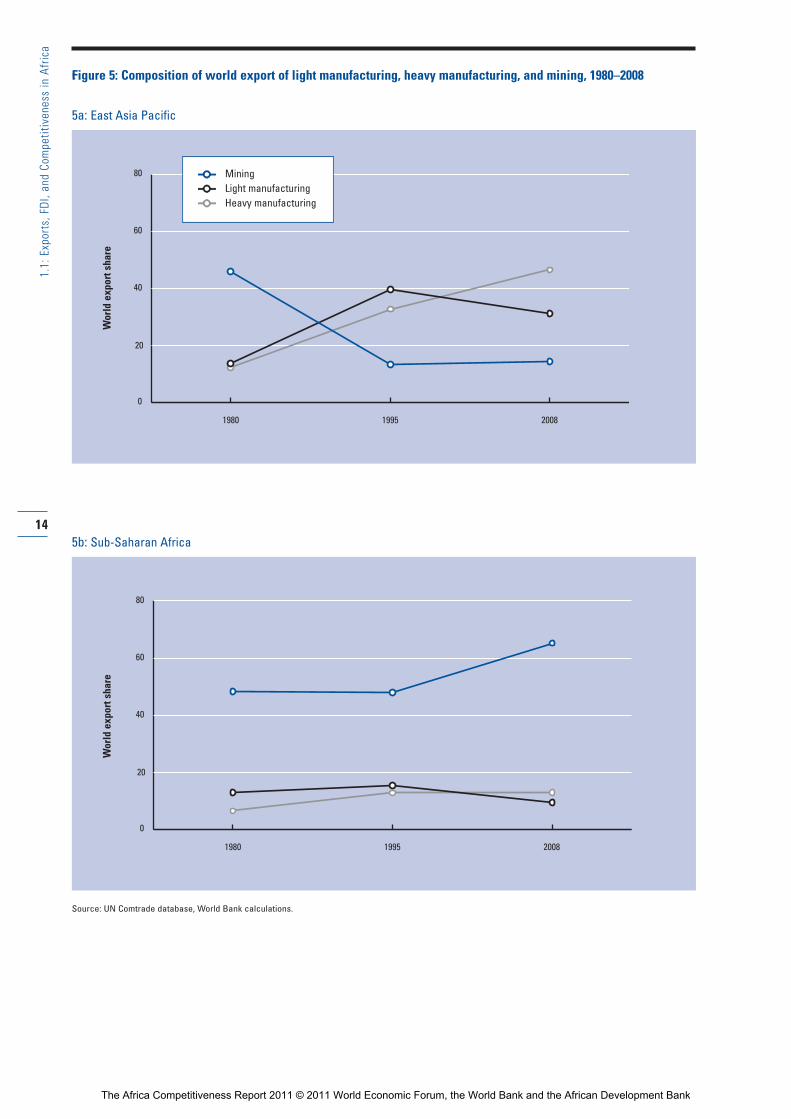
14
1.1:
Exp
orts
, FDI
, and
Com
petit
iven
ess
in A
fric
a
t
0
20
40
60
80
19951980 2008
0
20
40
60
80
19951980 2008
5b: Sub-Saharan Africa
Source: UN Comtrade database, World Bank calculations.
Figure 5: Composition of world export of light manufacturing, heavy manufacturing, and mining, 1980–2008
5a: East Asia Pacific
MiningLight manufacturingHeavy manufacturing
Wor
ld e
xpor
t sha
reW
orld
exp
ort s
hare
The Africa Competitiveness Report 2011 © 2011 World Economic Forum, the World Bank and the African Development Bank
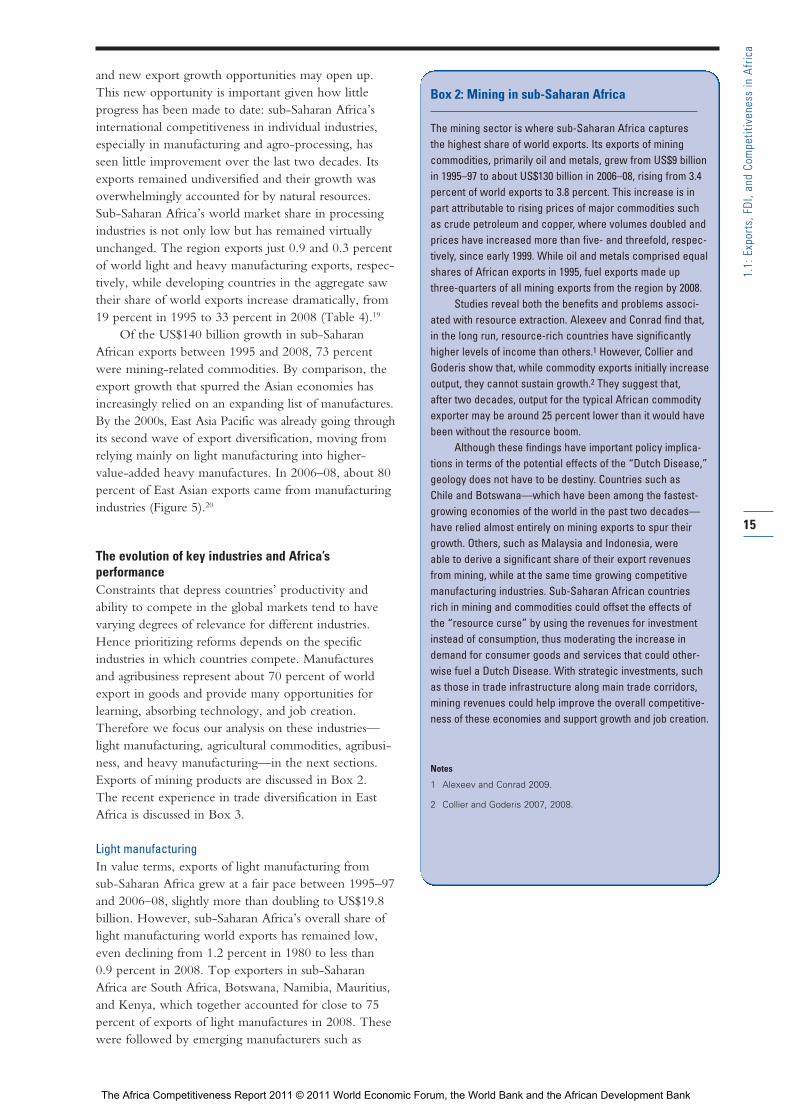
and new export growth opportunities may open up.This new opportunity is important given how littleprogress has been made to date: sub-Saharan Africa’sinternational competitiveness in individual industries,especially in manufacturing and agro-processing, hasseen little improvement over the last two decades. Itsexports remained undiversified and their growth wasoverwhelmingly accounted for by natural resources.Sub-Saharan Africa’s world market share in processingindustries is not only low but has remained virtuallyunchanged. The region exports just 0.9 and 0.3 percentof world light and heavy manufacturing exports, respec-tively, while developing countries in the aggregate sawtheir share of world exports increase dramatically, from19 percent in 1995 to 33 percent in 2008 (Table 4).19
Of the US$140 billion growth in sub-SaharanAfrican exports between 1995 and 2008, 73 percentwere mining-related commodities. By comparison, theexport growth that spurred the Asian economies hasincreasingly relied on an expanding list of manufactures.By the 2000s, East Asia Pacific was already going throughits second wave of export diversification, moving fromrelying mainly on light manufacturing into higher-value-added heavy manufactures. In 2006–08, about 80percent of East Asian exports came from manufacturingindustries (Figure 5).20
The evolution of key industries and Africa’s performanceConstraints that depress countries’ productivity and ability to compete in the global markets tend to havevarying degrees of relevance for different industries.Hence prioritizing reforms depends on the specificindustries in which countries compete. Manufactures and agribusiness represent about 70 percent of worldexport in goods and provide many opportunities forlearning, absorbing technology, and job creation.Therefore we focus our analysis on these industries—light manufacturing, agricultural commodities, agribusi-ness, and heavy manufacturing—in the next sections.Exports of mining products are discussed in Box 2. The recent experience in trade diversification in EastAfrica is discussed in Box 3.
Light manufacturingIn value terms, exports of light manufacturing from sub-Saharan Africa grew at a fair pace between 1995–97and 2006–08, slightly more than doubling to US$19.8billion. However, sub-Saharan Africa’s overall share oflight manufacturing world exports has remained low,even declining from 1.2 percent in 1980 to less than 0.9 percent in 2008. Top exporters in sub-Saharan Africa are South Africa, Botswana, Namibia, Mauritius,and Kenya, which together accounted for close to 75percent of exports of light manufactures in 2008. Thesewere followed by emerging manufacturers such as
15
1.1:
Exp
orts
, FDI
, and
Com
petit
iven
ess
in A
fric
a
Box 2: Mining in sub-Saharan Africa
The mining sector is where sub-Saharan Africa captures the highest share of world exports. Its exports of miningcommodities, primarily oil and metals, grew from US$9 billionin 1995–97 to about US$130 billion in 2006–08, rising from 3.4percent of world exports to 3.8 percent. This increase is inpart attributable to rising prices of major commodities suchas crude petroleum and copper, where volumes doubled andprices have increased more than five- and threefold, respec-tively, since early 1999. While oil and metals comprised equalshares of African exports in 1995, fuel exports made upthree-quarters of all mining exports from the region by 2008.
Studies reveal both the benefits and problems associ -ated with resource extraction. Alexeev and Conrad find that,in the long run, resource-rich countries have significantlyhigher levels of income than others.1 However, Collier andGoderis show that, while commodity exports initially increaseoutput, they cannot sustain growth.2 They suggest that, after two decades, output for the typical African commodityexporter may be around 25 percent lower than it would havebeen without the resource boom.
Although these findings have important policy implica-tions in terms of the potential effects of the “Dutch Disease,”geology does not have to be destiny. Countries such as Chile and Botswana—which have been among the fastest-growing economies of the world in the past two decades—have relied almost entirely on mining exports to spur theirgrowth. Others, such as Malaysia and Indonesia, were able to derive a significant share of their export revenuesfrom mining, while at the same time growing competitivemanufacturing industries. Sub-Saharan African countriesrich in mining and commodities could offset the effects of the “resource curse” by using the revenues for investmentinstead of consumption, thus moderating the increase indemand for consumer goods and services that could other-wise fuel a Dutch Disease. With strategic investments, suchas those in trade infrastructure along main trade corridors,mining revenues could help improve the overall competitive-ness of these economies and support growth and job creation.
Notes
1 Alexeev and Conrad 2009.
2 Collier and Goderis 2007, 2008.
The Africa Competitiveness Report 2011 © 2011 World Economic Forum, the World Bank and the African Development Bank
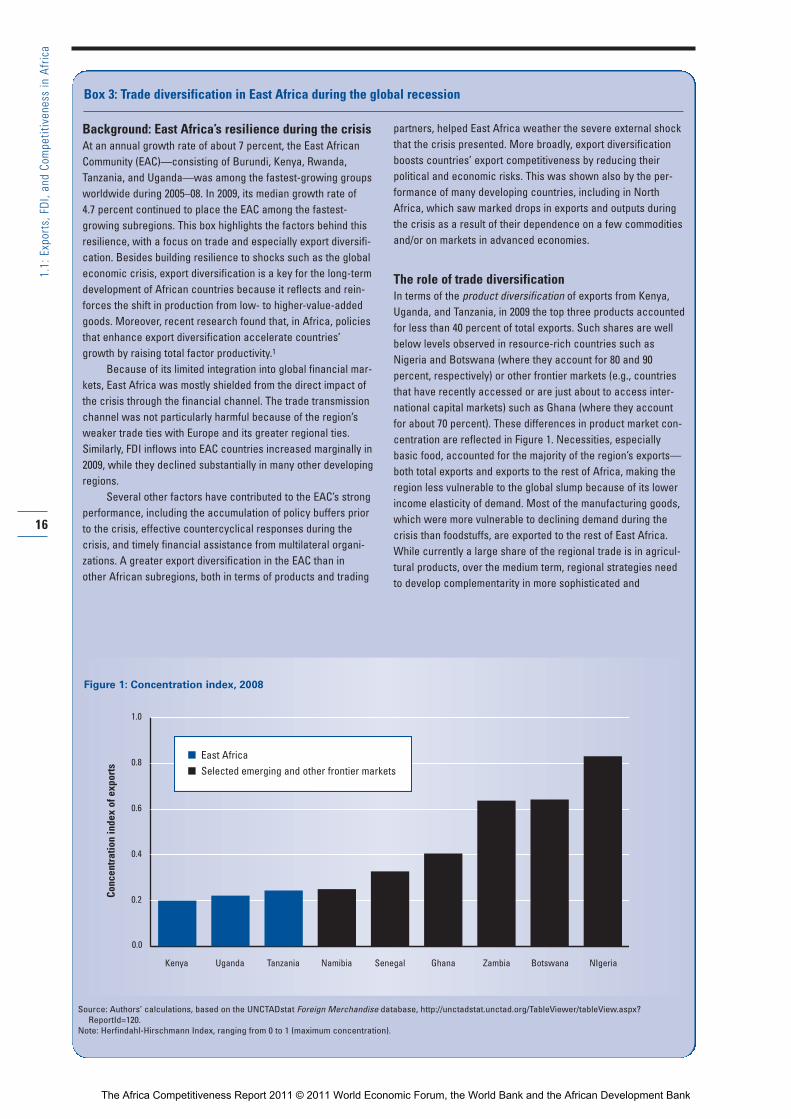
16
1.1:
Exp
orts
, FDI
, and
Com
petit
iven
ess
in A
fric
a
Background: East Africa’s resilience during the crisisAt an annual growth rate of about 7 percent, the East AfricanCommunity (EAC)—consisting of Burundi, Kenya, Rwanda,Tanzania, and Uganda—was among the fastest-growing groupsworldwide during 2005–08. In 2009, its median growth rate of 4.7 percent continued to place the EAC among the fastest-growing subregions. This box highlights the factors behind thisresilience, with a focus on trade and especially export diversifi-cation. Besides building resilience to shocks such as the globaleconomic crisis, export diversification is a key for the long-termdevelopment of African countries because it reflects and rein-forces the shift in production from low- to higher-value-addedgoods. Moreover, recent research found that, in Africa, policiesthat enhance export diversification accelerate countries’growth by raising total factor productivity.1
Because of its limited integration into global financial mar-kets, East Africa was mostly shielded from the direct impact ofthe crisis through the financial channel. The trade transmissionchannel was not particularly harmful because of the region’sweaker trade ties with Europe and its greater regional ties.Similarly, FDI inflows into EAC countries increased marginally in2009, while they declined substantially in many other developingregions.
Several other factors have contributed to the EAC’s strongperformance, including the accumulation of policy buffers priorto the crisis, effective countercyclical responses during the crisis, and timely financial assistance from multilateral organi-zations. A greater export diversification in the EAC than in other African subregions, both in terms of products and trading
partners, helped East Africa weather the severe external shockthat the crisis presented. More broadly, export diversificationboosts countries’ export competitiveness by reducing theirpolitical and economic risks. This was shown also by the per-formance of many developing countries, including in NorthAfrica, which saw marked drops in exports and outputs duringthe crisis as a result of their dependence on a few commoditiesand/or on markets in advanced economies.
The role of trade diversificationIn terms of the product diversification of exports from Kenya,Uganda, and Tanzania, in 2009 the top three products accountedfor less than 40 percent of total exports. Such shares are wellbelow levels observed in resource-rich countries such asNigeria and Botswana (where they account for 80 and 90 percent, respectively) or other frontier markets (e.g., countriesthat have recently accessed or are just about to access inter-national capital markets) such as Ghana (where they accountfor about 70 percent). These differences in product market con-centration are reflected in Figure 1. Necessities, especiallybasic food, accounted for the majority of the region’s exports—both total exports and exports to the rest of Africa, making theregion less vulnerable to the global slump because of its lowerincome elasticity of demand. Most of the manufacturing goods,which were more vulnerable to declining demand during thecrisis than foodstuffs, are exported to the rest of East Africa.While currently a large share of the regional trade is in agricul-tural products, over the medium term, regional strategies need to develop complementarity in more sophisticated and
Box 3: Trade diversification in East Africa during the global recession
0.0
0.2
0.4
0.6
0.8
1.0
BotswanaZambiaGhanaSenegalNamibiaTanzaniaUganda NIgeriaKenya
Figure 1: Concentration index, 2008
Source: Authors’ calculations, based on the UNCTADstat Foreign Merchandise database, http://unctadstat.unctad.org/TableViewer/tableView.aspx?ReportId=120.
Note: Herfindahl-Hirschmann Index, ranging from 0 to 1 (maximum concentration).
n East African Selected emerging and other frontier markets
Conc
entr
atio
n in
dex
of e
xpor
ts
The Africa Competitiveness Report 2011 © 2011 World Economic Forum, the World Bank and the African Development Bank
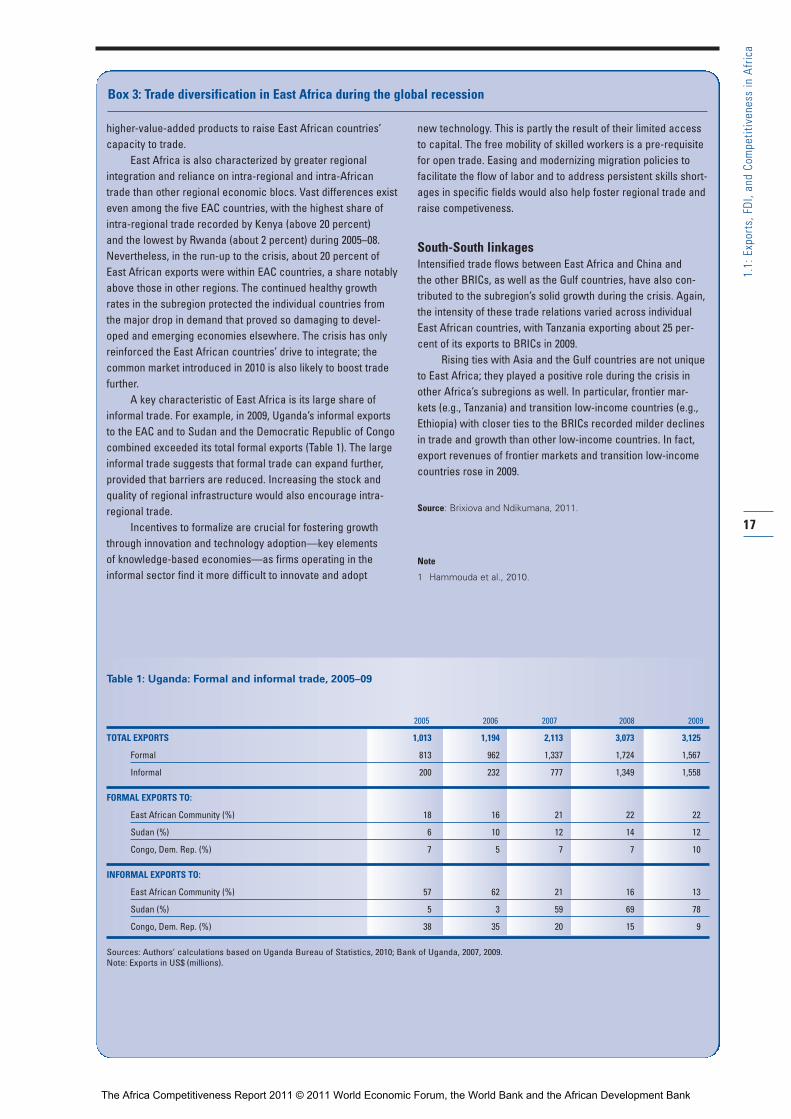
17
1.1:
Exp
orts
, FDI
, and
Com
petit
iven
ess
in A
fric
a
higher-value-added products to raise East African countries’capacity to trade.
East Africa is also characterized by greater regional integration and reliance on intra-regional and intra-Africantrade than other regional economic blocs. Vast differences existeven among the five EAC countries, with the highest share ofintra-regional trade recorded by Kenya (above 20 percent) and the lowest by Rwanda (about 2 percent) during 2005–08.Nevertheless, in the run-up to the crisis, about 20 percent ofEast African exports were within EAC countries, a share notablyabove those in other regions. The continued healthy growthrates in the subregion protected the individual countries fromthe major drop in demand that proved so damaging to devel-oped and emerging economies elsewhere. The crisis has onlyreinforced the East African countries’ drive to integrate; thecommon market introduced in 2010 is also likely to boost tradefurther.
A key characteristic of East Africa is its large share ofinformal trade. For example, in 2009, Uganda’s informal exportsto the EAC and to Sudan and the Democratic Republic of Congocombined exceeded its total formal exports (Table 1). The largeinformal trade suggests that formal trade can expand further,provided that barriers are reduced. Increasing the stock andquality of regional infrastructure would also encourage intra-regional trade.
Incentives to formalize are crucial for fostering growththrough innovation and technology adoption—key elements of knowledge-based economies—as firms operating in theinformal sector find it more difficult to innovate and adopt
new technology. This is partly the result of their limited accessto capital. The free mobility of skilled workers is a pre-requisitefor open trade. Easing and modernizing migration policies tofacilitate the flow of labor and to address persistent skills short-ages in specific fields would also help foster regional trade andraise competiveness.
South-South linkagesIntensified trade flows between East Africa and China and the other BRICs, as well as the Gulf countries, have also con-tributed to the subregion’s solid growth during the crisis. Again,the intensity of these trade relations varied across individualEast African countries, with Tanzania exporting about 25 per-cent of its exports to BRICs in 2009.
Rising ties with Asia and the Gulf countries are not uniqueto East Africa; they played a positive role during the crisis inother Africa’s subregions as well. In particular, frontier mar-kets (e.g., Tanzania) and transition low-income countries (e.g.,Ethiopia) with closer ties to the BRICs recorded milder declinesin trade and growth than other low-income countries. In fact,export revenues of frontier markets and transition low-incomecountries rose in 2009.
Source: Brixiova and Ndikumana, 2011.
Note
1 Hammouda et al., 2010.
Box 3: Trade diversification in East Africa during the global recession
Table 1: Uganda: Formal and informal trade, 2005–09
2005 2006 2007 2008 2009
TOTAL EXPORTS 1,013 1,194 2,113 3,073 3,125
Formal 813 962 1,337 1,724 1,567
Informal 200 232 777 1,349 1,558
FORMAL EXPORTS TO:
East African Community (%) 18 16 21 22 22
Sudan (%) 6 10 12 14 12
Congo, Dem. Rep. (%) 7 5 7 7 10
INFORMAL EXPORTS TO:
East African Community (%) 57 62 21 16 13
Sudan (%) 5 3 59 69 78
Congo, Dem. Rep. (%) 38 35 20 15 9
Sources: Authors’ calculations based on Uganda Bureau of Statistics, 2010; Bank of Uganda, 2007, 2009.Note: Exports in US$ (millions).
The Africa Competitiveness Report 2011 © 2011 World Economic Forum, the World Bank and the African Development Bank
Nigeria, Madagascar, and Lesotho, whose increasedexports of leather and apparel lead their success in this sector.21
The most significant boost to sub-Saharan Africalight manufacturing was perhaps the preferential treatments that were granted by the United States and the European Union under the Africa Growth andOpportunities Act (AGOA), the Everything but Arms(EBA) initiative, the Cotonou Agreement, and theLome Convention. These initiatives granted virtuallyduty- and quota-free access to nearly all countries inAfrica. For example, trade preferences under AGOAprovided sub-Saharan African countries with a priceadvantage of 10 to 20 percent relative to exporters incountries for which tariffs were levied. It is partiallythanks to AGOA that sub-Saharan Africa’s exports ofclothing grew threefold since 1995 to US$2.5 billion,on average, between 2006 and 2008, making up morethan 12 percent of all light manufacturing exports fromthe region. By 2008, for example, apparel made up the largest share of Madagascar’s exports, outgrowing its exports from rich mining resources and employing107,530 people. The recent decimation of Madagascar’sapparel production with the removal of AGOA eligibil-ity underlines the importance that such preferences have had on the competitiveness of African garmentproducers that were able to break into the export markets. The apparel industry across the subcontinentwas, for the most part, dominated by foreign investorsoriginating in Asia and occasionally in Europe and theUnited States, who aimed to exploit the advantagesconveyed by a combination of trade preferences andcheap labor.
While these preferential trade arrangements supported light manufacturing in select cases, on thewhole, sub-Saharan African exporters were unable tomatch the drop in prices by East Asian competitors,especially after the elimination of quotas in 2004. Theunit value of Chinese apparel exports was 28 percentlower in 2008 than in 2004, for example. By 2008,Vietnam alone exported more light manufacturingproducts than all sub-Saharan African countries combined.
Today, East Asia Pacific is the biggest exporter of light manufactures in the developing world, pro -ducing more than 25 percent of world exports in these industries. It has been the leader in this sectorsince 1995, and its share of world exports grew from 15 percent in 1995–97 to 25 percent in 2006–08.
East Asia Pacific’s success is driven not only by the high productivity of its workers and firms, but also by the enabling business environment that supportsseamless transport networks and reliable supplies ofinputs and energy. A number of studies on sub-SaharanAfrica’s business environments, including the previousedition of this Report, emphasized the importance ofhigh indirect costs in depressing the productivity of
African firms relative to other countries.22 Indeed, whilefactory-floor productivity is relatively low in manyAfrican countries, it is not so low—relative to wages—as to explain the continent’s weak manufacturing competitiveness.
Assessments on global manufacturing competitive-ness show that basic requirements of an enabling invest-ment climate—namely, the cost of labor and materials;energy cost; trade, finance, and tax systems; and thequality of physical infrastructure—are critical in deter-mining a country’s competitiveness in the global exportmarkets for simple manufacturers. A forthcoming studyon sub-Saharan African light manufacturing competi-tiveness suggests that many of the root causes of theproductivity and cost issues in African light manufactur-ing can be traced to policy problems relating to poortrade logistics and infrastructure, as well as to a lack ofcompetition and input industries.
Recent studies have showed that high indirect costs(infrastructure, logistics, and transport), combined withbusiness environment–related losses depress productivityin sub-Saharan Africa.23 Trade infrastructure and logis-tics become especially relevant for light manufacturingindustries because of the low margins and seasonalitythat characterize this industry. It is therefore telling thatthe countries that rank the highest in terms of infra-structure in the GCI are also the top exporters of lightmanufactures in sub-Saharan Africa. On the whole,Southeast Asian countries, whose market share of lightmanufacturing exports are exponentially higher thanthose in sub-Saharan Africa, score 24 percent higher in terms of the competitiveness of their economy inbasic requirement as measured by the GCI.
Agricultural commoditiesSub-Saharan Africa has been losing market share inglobal agriculture exports in terms of unprocessed commodities. Its share of world exports in agriculturalcommodities was slashed in half, from 5.4 percent in1995–97 to 2.7 percent in 2006–08. The decline wasmainly the result of lagging agricultural productivity in the region. Its number one export product, cocoa,accounted for more than 30 percent of the continent’sexports; cocoa was followed by coffee, tea, and tobacco.Top exporters of agricultural commodities were Côted’Ivoire, Ghana, Kenya, South Africa, Ethiopia, andNigeria, all of which (except Nigeria) lost market sharedespite increasing their exports in absolute terms.
Given its endowments of land, climate, and labor,sub-Saharan Africa should have a strong comparativeadvantage in agriculture. On the face of it, the sub -continent has the resources to both feed its growingpopulation and meet the world’s burgeoning demandfor food and other agricultural products. In sub-SaharanAfrica, demand for food is expected to reach US$100billion by 2015, double the levels in 2000. There areencouraging success stories, such as the production of
18
1.1:
Exp
orts
, FDI
, and
Com
petit
iven
ess
in A
fric
a
The Africa Competitiveness Report 2011 © 2011 World Economic Forum, the World Bank and the African Development Bank
cassava chips in Ghana, organic coffee in Tanzania, cutflowers in Kenya, and aquaculture in Malawi. However,these remain few and far between, and they have notbeen sufficient to improve the subcontinent’s overallexport performance in terms of both agribusiness and agricultural commodities. Although Africa has thehighest rate of people living in rural areas in the world,the continent still imports 45 percent of its rice and 85percent of its wheat.
AgribusinessAgribusiness accounts for a large and rising share ofgross domestic product (GDP) in developing countries.Though the share of agriculture typically decreases asper capita income increases, the share of agribusinesstends to increase, reaching 30 percent of GDP in someinstances.
There is immense potential to scale-up agribusinessin sub-Saharan Africa, as demonstrated by emerging successes in Kenya, Tanzania, and Ghana. However,this potential remains largely untapped. Sub-SaharanAfrica’s share of world exports in agribusiness is thelowest of all developing regions, followed closely by theMiddle East and North Africa. Its share, however, hasseen a modest rise—from 1.5 to 1.7 percent between1995–97 and 2006–08. The region’s exports grew at afair rate, more than doubling since 1995–97, which isslightly above world averages.
The top sub-Saharan African exporters of agri -business include South Africa, Kenya, Côte d’Ivoire,Namibia, Zimbabwe, Nigeria, Mauritius, Tanzania, andSenegal. Among these, the fastest growth was experi-enced by Nigeria and Senegal, which increased theirexports exponentially twenty- and sevenfold, respective-ly, although from a very low base. Fruits and vegetablesare the major agribusiness exports of the subcontinent,closely followed by fish and fish preparations, togetheraccounting for about 50 percent of sub-Saharan Africa’sagribusiness exports.
Africa’s poor performance in export markets foragribusiness is in part explained by its slow productivitygrowth. Value-chain studies focusing on sub-SaharanAfrica show that, while agricultural productivity improvedin parts of the region, it lagged behind vis-à-vis otherregions. Although farm-level unit production costs inAfrica are comparable with those found in Brazil andThailand, these farms suffer from low levels of produc-tivity, which in turn make agriculture economicallyimpoverishing and technically unsustainable. The inter-national and domestic logistics costs that provide naturalprotection for local producers pose a significant barrierto their competitiveness when it comes to exporting.For example, Mozambican cassava producers that arecompetitive in domestic markets would need to cuttheir logistics and production costs by more than 80percent to become competitive in European markets.Overall, the studies identified a lack of political com-
mitment, prejudice against small-holder agriculture,high transaction costs that are driven by weak physicalinfrastructure, widespread information asymmetries, low levels of marketed surplus, and high export taxes as the main constraints to agricultural productivity in sub-Saharan Africa.
The agricultural commercialization experiencesfrom these regions offer some interesting lessons for the future of agriculture in Africa. For example, studiesfrom Brazil and Thailand show that competitiveness inthese originally “backward” areas was reached in twostages, first in lower-value commodities and later inhigher-value and processed agricultural goods. Otherfactors contributing to their success included improvedagricultural technology developed by government supported agencies such as Empresa Brasileira dePesquisa Agropequária (Brazilian Agricultural ResearchCorporation, or EMBRAPA), permissive land policies,improved public infrastructure and business develop-ment services, a supportive policy environment, andliberalized markets that allowed international signals totransmit. As a result of these policies, Brazil andThailand became the leading global suppliers of soy-beans and cassava, among other agricultural exports.
Heavy manufacturingAt an aggregate level, the trends in exports of heavymanufactures in sub-Saharan Africa are similar to thoseof light manufacturing. Africa’s exports are tiny and captured only 0.4 percent of world markets, a slightincrease from 1995–97, when it produced 0.3 percent of world exports. Unlike light manufacturing, however,sources of origin for heavy manufacturing are less diversified. The overwhelming majority of exports, more than 75 percent, come from South Africa.Nigeria, Côte D’Ivoire, Swaziland, and Kenya are othermajor exporters of heavy manufactures.24
Despite beginning from a low base, heavy manu-facturing performed better in terms of export growthrates than both agribusiness and light manufacturingindustries in sub-Saharan Africa. Most of the growthcame from South Africa, Nigeria, Côte d’Ivoire, andKenya. In 2008, Nigeria primarily exported transportequipment, Côte d’Ivoire cleansing products, andKenya chemical elements and compounds. These werethe top exports for these countries also in 1995, exceptfor Kenya, which primarily exported iron and steel dur-ing this time.
Unlike light manufacturing, heavy manufacturingexports of developing regions are dominated by a hand-ful of emerging economies from each region such asChina, Mexico, Malaysia, Brazil, Turkey, and SouthAfrica. According to the 2010 Global ManufacturingCompetitiveness Index,25 the availability of skilled laborand capacity for innovation, the cost of labor and mate-rials, and energy cost and policies are the three maindrivers of manufacturing competitiveness reported by
19
1.1:
Exp
orts
, FDI
, and
Com
petit
iven
ess
in A
fric
a
The Africa Competitiveness Report 2011 © 2011 World Economic Forum, the World Bank and the African Development Bank
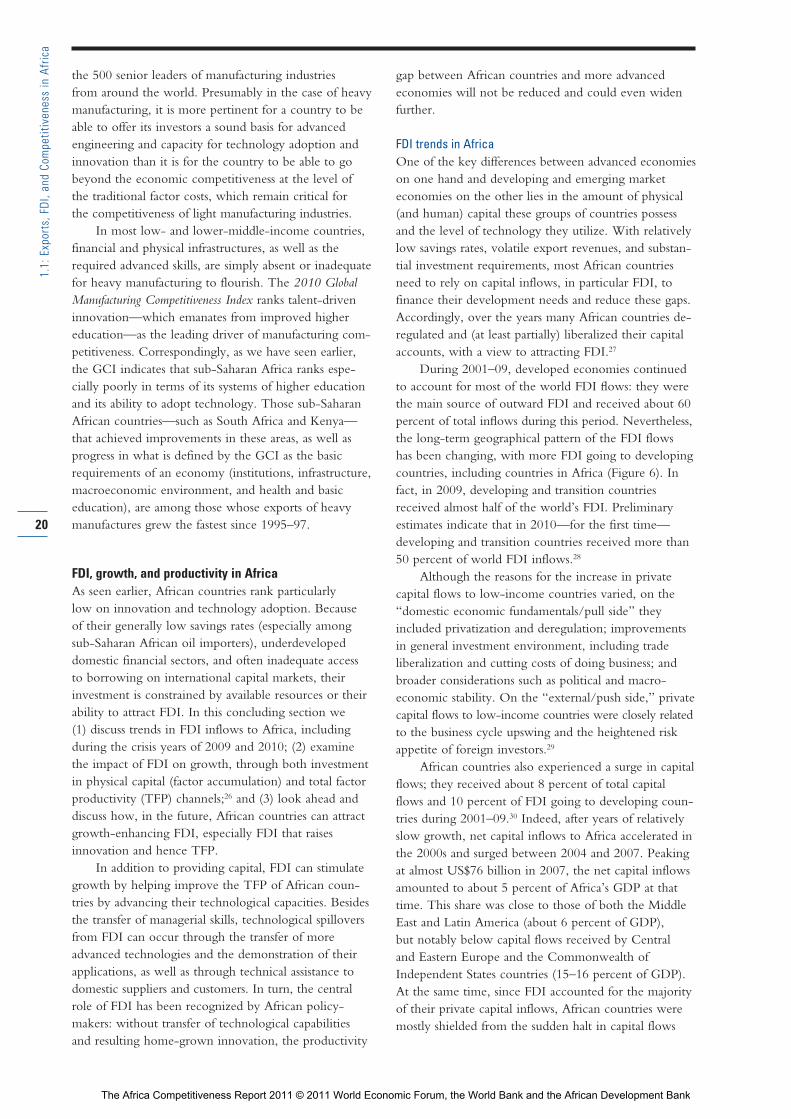
the 500 senior leaders of manufacturing industries from around the world. Presumably in the case of heavymanufacturing, it is more pertinent for a country to beable to offer its investors a sound basis for advancedengineering and capacity for technology adoption andinnovation than it is for the country to be able to gobeyond the economic competitiveness at the level of the traditional factor costs, which remain critical for the competitiveness of light manufacturing industries.
In most low- and lower-middle-income countries,financial and physical infrastructures, as well as therequired advanced skills, are simply absent or inadequatefor heavy manufacturing to flourish. The 2010 GlobalManufacturing Competitiveness Index ranks talent-driveninnovation—which emanates from improved highereducation—as the leading driver of manufacturing com-petitiveness. Correspondingly, as we have seen earlier,the GCI indicates that sub-Saharan Africa ranks espe-cially poorly in terms of its systems of higher educationand its ability to adopt technology. Those sub-SaharanAfrican countries—such as South Africa and Kenya—that achieved improvements in these areas, as well asprogress in what is defined by the GCI as the basicrequirements of an economy (institutions, infrastructure,macroeconomic environment, and health and basic education), are among those whose exports of heavymanufactures grew the fastest since 1995–97.
FDI, growth, and productivity in AfricaAs seen earlier, African countries rank particularly low on innovation and technology adoption. Because of their generally low savings rates (especially amongsub-Saharan African oil importers), underdevelopeddomestic financial sectors, and often inadequate accessto borrowing on international capital markets, theirinvestment is constrained by available resources or theirability to attract FDI. In this concluding section we (1) discuss trends in FDI inflows to Africa, includingduring the crisis years of 2009 and 2010; (2) examinethe impact of FDI on growth, through both investmentin physical capital (factor accumulation) and total factorproductivity (TFP) channels;26 and (3) look ahead anddiscuss how, in the future, African countries can attractgrowth-enhancing FDI, especially FDI that raises innovation and hence TFP.
In addition to providing capital, FDI can stimulategrowth by helping improve the TFP of African coun-tries by advancing their technological capacities. Besidesthe transfer of managerial skills, technological spilloversfrom FDI can occur through the transfer of moreadvanced technologies and the demonstration of theirapplications, as well as through technical assistance todomestic suppliers and customers. In turn, the centralrole of FDI has been recognized by African policy -makers: without transfer of technological capabilities and resulting home-grown innovation, the productivity
gap between African countries and more advancedeconomies will not be reduced and could even widenfurther.
FDI trends in AfricaOne of the key differences between advanced economieson one hand and developing and emerging marketeconomies on the other lies in the amount of physical(and human) capital these groups of countries possessand the level of technology they utilize. With relativelylow savings rates, volatile export revenues, and substan-tial investment requirements, most African countriesneed to rely on capital inflows, in particular FDI, tofinance their development needs and reduce these gaps.Accordingly, over the years many African countries de -regulated and (at least partially) liberalized their capitalaccounts, with a view to attracting FDI.27
During 2001–09, developed economies continuedto account for most of the world FDI flows: they werethe main source of outward FDI and received about 60percent of total inflows during this period. Nevertheless,the long-term geographical pattern of the FDI flows has been changing, with more FDI going to developingcountries, including countries in Africa (Figure 6). Infact, in 2009, developing and transition countriesreceived almost half of the world’s FDI. Preliminary estimates indicate that in 2010—for the first time—developing and transition countries received more than50 percent of world FDI inflows.28
Although the reasons for the increase in privatecapital flows to low-income countries varied, on the“domestic economic fundamentals/pull side” theyincluded privatization and deregulation; improvementsin general investment environment, including trade liberalization and cutting costs of doing business; andbroader considerations such as political and macro -economic stability. On the “external/push side,” privatecapital flows to low-income countries were closely relatedto the business cycle upswing and the heightened riskappetite of foreign investors.29
African countries also experienced a surge in capitalflows; they received about 8 percent of total capitalflows and 10 percent of FDI going to developing coun-tries during 2001–09.30 Indeed, after years of relativelyslow growth, net capital inflows to Africa accelerated inthe 2000s and surged between 2004 and 2007. Peakingat almost US$76 billion in 2007, the net capital inflowsamounted to about 5 percent of Africa’s GDP at thattime. This share was close to those of both the MiddleEast and Latin America (about 6 percent of GDP), but notably below capital flows received by Central and Eastern Europe and the Commonwealth ofIndependent States countries (15–16 percent of GDP).At the same time, since FDI accounted for the majorityof their private capital inflows, African countries weremostly shielded from the sudden halt in capital flows
20
1.1:
Exp
orts
, FDI
, and
Com
petit
iven
ess
in A
fric
a
The Africa Competitiveness Report 2011 © 2011 World Economic Forum, the World Bank and the African Development Bank
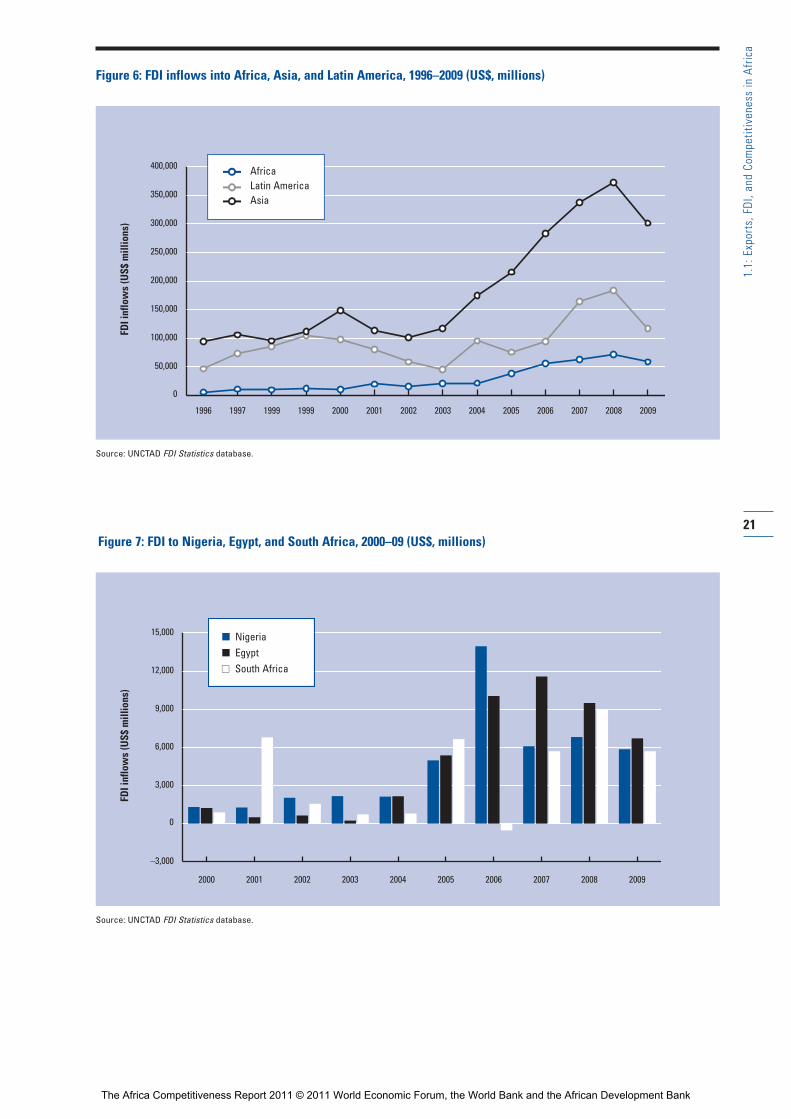
21
1.1:
Exp
orts
, FDI
, and
Com
petit
iven
ess
in A
fric
a
Figure 6: FDI inflows into Africa, Asia, and Latin America, 1996–2009 (US$, millions)
Source: UNCTAD FDI Statistics database.
0
50,000
100,000
150,000
200,000
250,000
300,000
350,000
400,000
2008200720062005200420032002200120001999199919971996 2009
FDI i
nflo
ws
(US$
mill
ions
)
Figure 7: FDI to Nigeria, Egypt, and South Africa, 2000–09 (US$, millions)
Source: UNCTAD FDI Statistics database.
–3,000
0
3,000
6,000
9,000
12,000
15,000
2000 20082007200620052004200320022001 2009
n Nigerian Egyptn South Africa
AfricaLatin AmericaAsia
FDI i
nflo
ws
(US$
mill
ions
)
The Africa Competitiveness Report 2011 © 2011 World Economic Forum, the World Bank and the African Development Bank
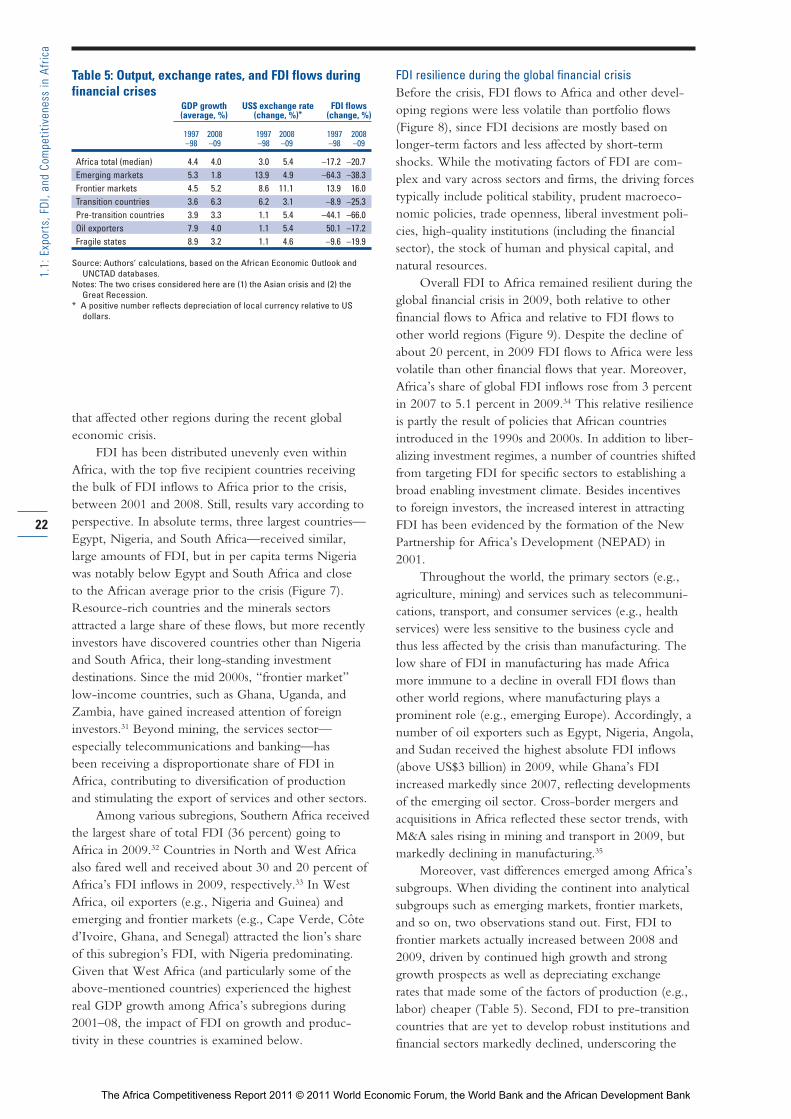
that af fected other regions during the recent global economic crisis.
FDI has been distributed unevenly even withinAfrica, with the top five recipient countries receivingthe bulk of FDI inflows to Africa prior to the crisis,between 2001 and 2008. Still, results vary according toperspective. In absolute terms, three largest countries—Egypt, Nigeria, and South Africa—received similar,large amounts of FDI, but in per capita terms Nigeriawas notably below Egypt and South Africa and close to the African average prior to the crisis (Figure 7).Resource-rich countries and the minerals sectors attracted a large share of these flows, but more recentlyinvestors have discovered countries other than Nigeriaand South Africa, their long-standing investment destinations. Since the mid 2000s, “frontier market”low-income countries, such as Ghana, Uganda, andZambia, have gained increased attention of foreigninvestors.31 Beyond mining, the services sector—especially telecommunications and banking—has been receiving a disproportionate share of FDI inAfrica, contributing to diversification of production and stimulating the export of services and other sectors.
Among various subregions, Southern Africa receivedthe largest share of total FDI (36 percent) going toAfrica in 2009.32 Countries in North and West Africaalso fared well and received about 30 and 20 percent ofAfrica’s FDI inflows in 2009, respectively.33 In WestAfrica, oil exporters (e.g., Nigeria and Guinea) andemerging and frontier markets (e.g., Cape Verde, Côted’Ivoire, Ghana, and Senegal) attracted the lion’s shareof this subregion’s FDI, with Nigeria predominating.Given that West Africa (and particularly some of theabove-mentioned countries) experienced the highestreal GDP growth among Africa’s subregions during2001–08, the impact of FDI on growth and produc -tivity in these countries is examined below.
FDI resilience during the global financial crisisBefore the crisis, FDI flows to Africa and other devel -oping regions were less volatile than portfolio flows(Figure 8), since FDI decisions are mostly based onlonger-term factors and less affected by short-termshocks. While the motivating factors of FDI are com-plex and vary across sectors and firms, the driving forcestypically include political stability, prudent macroeco-nomic policies, trade openness, liberal investment poli-cies, high-quality institutions (including the financialsector), the stock of human and physical capital, andnatural resources.
Overall FDI to Africa remained resilient during theglobal financial crisis in 2009, both relative to otherfinancial flows to Africa and relative to FDI flows toother world regions (Figure 9). Despite the decline ofabout 20 percent, in 2009 FDI flows to Africa were lessvolatile than other financial flows that year. Moreover,Africa’s share of global FDI inflows rose from 3 percentin 2007 to 5.1 percent in 2009.34 This relative resilienceis partly the result of policies that African countriesintroduced in the 1990s and 2000s. In addition to liber-alizing investment regimes, a number of countries shiftedfrom targeting FDI for specific sectors to establishing abroad enabling investment climate. Besides incentives to foreign investors, the increased interest in attractingFDI has been evidenced by the formation of the NewPartnership for Africa’s Development (NEPAD) in2001.
Throughout the world, the primary sectors (e.g.,agriculture, mining) and services such as telecommuni-cations, transport, and consumer services (e.g., healthservices) were less sensitive to the business cycle andthus less affected by the crisis than manufacturing. Thelow share of FDI in manufacturing has made Africamore immune to a decline in overall FDI flows thanother world regions, where manufacturing plays aprominent role (e.g., emerging Europe). Accordingly, anumber of oil exporters such as Egypt, Nigeria, Angola,and Sudan received the highest absolute FDI inflows(above US$3 billion) in 2009, while Ghana’s FDIincreased markedly since 2007, reflecting developmentsof the emerging oil sector. Cross-border mergers andacquisitions in Africa reflected these sector trends, withM&A sales rising in mining and transport in 2009, butmarkedly declining in manufacturing.35
Moreover, vast differences emerged among Africa’ssubgroups. When dividing the continent into analyticalsubgroups such as emerging markets, frontier markets,and so on, two observations stand out. First, FDI tofrontier markets actually increased between 2008 and2009, driven by continued high growth and stronggrowth prospects as well as depreciating exchange rates that made some of the factors of production (e.g.,labor) cheaper (Table 5). Second, FDI to pre-transitioncountries that are yet to develop robust institutions andfinancial sectors markedly declined, underscoring the
22
1.1:
Exp
orts
, FDI
, and
Com
petit
iven
ess
in A
fric
a
Table 5: Output, exchange rates, and FDI flows duringfinancial crises
GDP growth US$ exchange rate FDI flows (average, %) (change, %)* (change, %)
1997 2008 1997 2008 1997 2008–98 –09 –98 –09 –98 –09
Africa total (median) 4.4 4.0 3.0 5.4 –17.2 –20.7Emerging markets 5.3 1.8 13.9 4.9 –64.3 –38.3Frontier markets 4.5 5.2 8.6 11.1 13.9 16.0Transition countries 3.6 6.3 6.2 3.1 –8.9 –25.3Pre-transition countries 3.9 3.3 1.1 5.4 –44.1 –66.0Oil exporters 7.9 4.0 1.1 5.4 50.1 –17.2Fragile states 8.9 3.2 1.1 4.6 –9.6 –19.9
Source: Authors’ calculations, based on the African Economic Outlook andUNCTAD databases.
Notes: The two crises considered here are (1) the Asian crisis and (2) theGreat Recession.
* A positive number reflects depreciation of local currency relative to US dollars.
The Africa Competitiveness Report 2011 © 2011 World Economic Forum, the World Bank and the African Development Bank
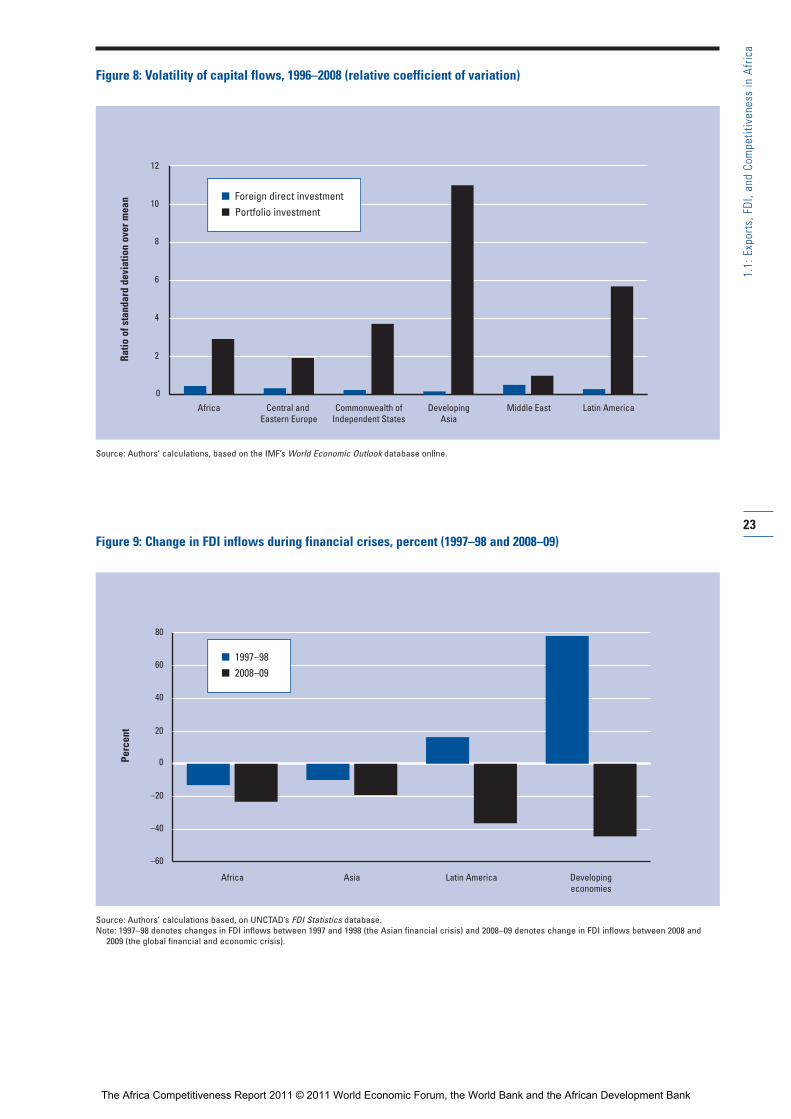
23
1.1:
Exp
orts
, FDI
, and
Com
petit
iven
ess
in A
fric
a
Figure 8: Volatility of capital flows, 1996–2008 (relative coefficient of variation)
Source: Authors’ calculations, based on the IMF’s World Economic Outlook database online.
0
2
4
6
8
10
12
Africa Central and Eastern Europe
Commonwealth ofIndependent States
DevelopingAsia
Latin AmericaMiddle East
Ratio
of s
tand
ard
devi
atio
n ov
er m
ean
Figure 9: Change in FDI inflows during financial crises, percent (1997–98 and 2008–09)
Source: Authors’ calculations based, on UNCTAD’s FDI Statistics database.Note: 1997–98 denotes changes in FDI inflows between 1997 and 1998 (the Asian financial crisis) and 2008–09 denotes change in FDI inflows between 2008 and
2009 (the global financial and economic crisis).
–60
–40
–20
0
20
40
60
80
Africa Asia Latin America Developingeconomies
n Foreign direct investmentn Portfolio investment
n 1997–98n 2008–09
Perc
ent
The Africa Competitiveness Report 2011 © 2011 World Economic Forum, the World Bank and the African Development Bank
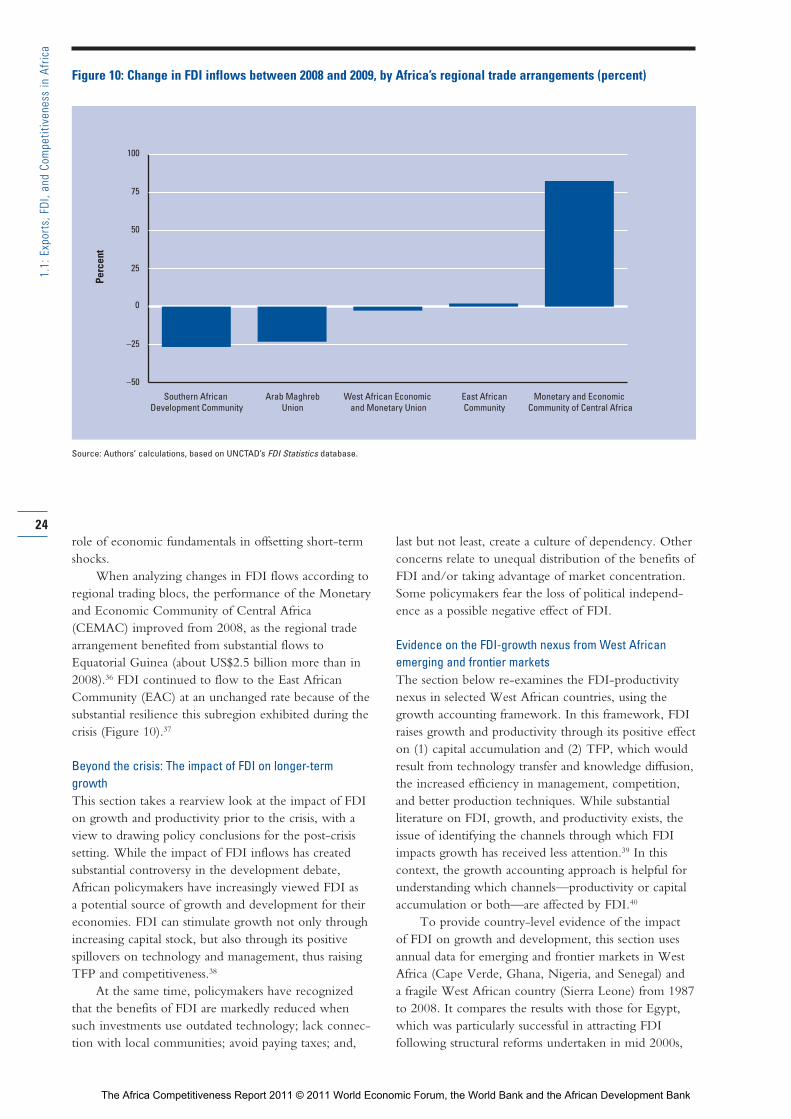
role of economic fundamentals in offsetting short-termshocks.
When analyzing changes in FDI flows according toregional trading blocs, the performance of the Monetaryand Economic Community of Central Africa(CEMAC) improved from 2008, as the regional tradearrangement benefited from substantial flows toEquatorial Guinea (about US$2.5 billion more than in2008).36 FDI continued to flow to the East AfricanCommunity (EAC) at an unchanged rate because of thesubstantial resilience this subregion exhibited during thecrisis (Figure 10).37
Beyond the crisis: The impact of FDI on longer-termgrowthThis section takes a rearview look at the impact of FDIon growth and productivity prior to the crisis, with aview to drawing policy conclusions for the post-crisissetting. While the impact of FDI inflows has createdsubstantial controversy in the development debate,African policymakers have increasingly viewed FDI as a potential source of growth and development for theireconomies. FDI can stimulate growth not only throughincreasing capital stock, but also through its positivespillovers on technology and management, thus raisingTFP and competitiveness.38
At the same time, policymakers have recognizedthat the benefits of FDI are markedly reduced whensuch investments use outdated technology; lack connec-tion with local communities; avoid paying taxes; and,
last but not least, create a culture of dependency. Otherconcerns relate to unequal distribution of the benefits ofFDI and/or taking advantage of market concentration.Some policymakers fear the loss of political independ-ence as a possible negative effect of FDI.
Evidence on the FDI-growth nexus from West Africanemerging and frontier marketsThe section below re-examines the FDI-productivitynexus in selected West African countries, using thegrowth accounting framework. In this framework, FDIraises growth and productivity through its positive effecton (1) capital accumulation and (2) TFP, which wouldresult from technology transfer and knowledge diffusion,the increased efficiency in management, competition,and better production techniques. While substantial literature on FDI, growth, and productivity exists, theissue of identifying the channels through which FDIimpacts growth has received less attention.39 In this context, the growth accounting approach is helpful forunderstanding which channels—productivity or capitalaccumulation or both—are affected by FDI.40
To provide country-level evidence of the impact of FDI on growth and development, this section usesannual data for emerging and frontier markets in WestAfrica (Cape Verde, Ghana, Nigeria, and Senegal) and a fragile West African country (Sierra Leone) from 1987to 2008. It compares the results with those for Egypt,which was particularly successful in attracting FDI following structural reforms undertaken in mid 2000s,
24
1.1:
Exp
orts
, FDI
, and
Com
petit
iven
ess
in A
fric
a
Figure 10: Change in FDI inflows between 2008 and 2009, by Africa’s regional trade arrangements (percent)
Source: Authors’ calculations, based on UNCTAD’s FDI Statistics database.
–50
–25
0
25
50
75
100
Southern African Development Community
Arab MaghrebUnion
West African Economic and Monetary Union
East AfricanCommunity
Monetary and Economic Community of Central Africa
Perc
ent
The Africa Competitiveness Report 2011 © 2011 World Economic Forum, the World Bank and the African Development Bank
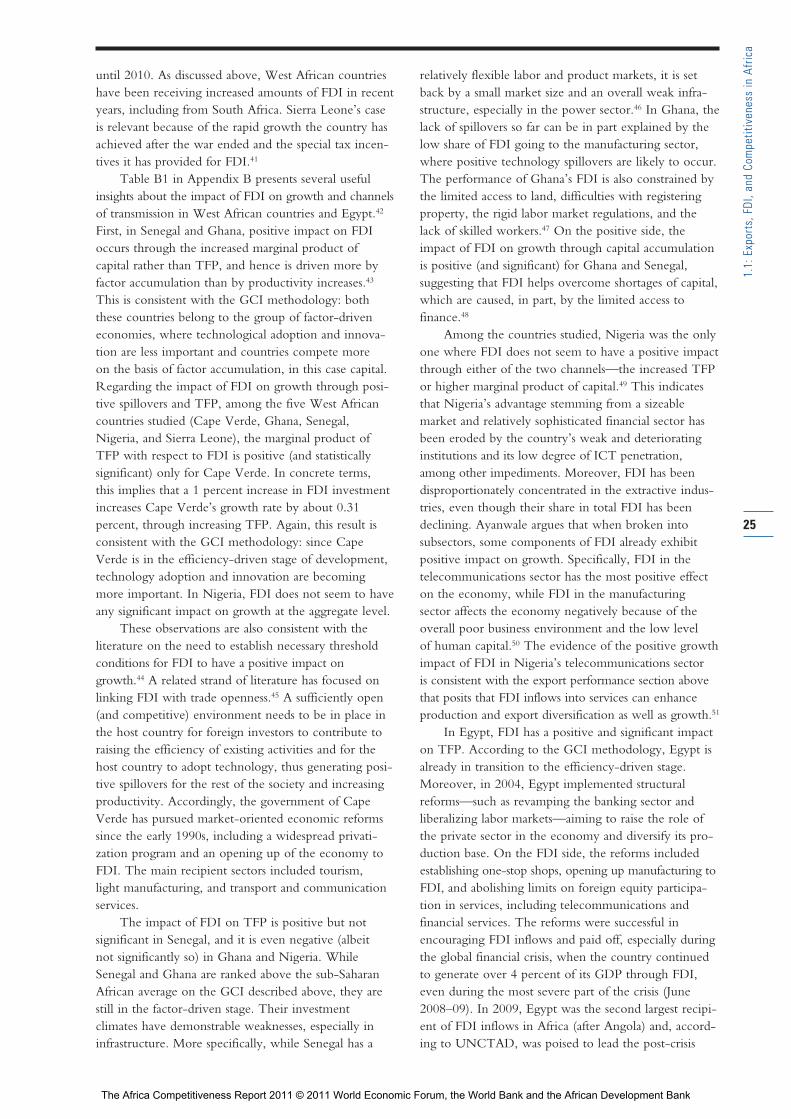
until 2010. As discussed above, West African countrieshave been receiving increased amounts of FDI in recentyears, including from South Africa. Sierra Leone’s case is relevant because of the rapid growth the country hasachieved after the war ended and the special tax incen-tives it has provided for FDI.41
Table B1 in Appendix B presents several usefulinsights about the impact of FDI on growth and channelsof transmission in West African countries and Egypt.42
First, in Senegal and Ghana, positive impact on FDIoccurs through the increased marginal product of capital rather than TFP, and hence is driven more byfactor accumulation than by productivity increases.43
This is consistent with the GCI methodology: boththese countries belong to the group of factor-driveneconomies, where technological adoption and innova-tion are less important and countries compete more on the basis of factor accumulation, in this case capital.Regarding the impact of FDI on growth through posi-tive spillovers and TFP, among the five West Africancountries studied (Cape Verde, Ghana, Senegal,Nigeria, and Sierra Leone), the marginal product ofTFP with respect to FDI is positive (and statistically significant) only for Cape Verde. In concrete terms, this implies that a 1 percent increase in FDI investmentincreases Cape Verde’s growth rate by about 0.31 percent, through increasing TFP. Again, this result isconsistent with the GCI methodology: since CapeVerde is in the efficiency-driven stage of development,technology adoption and innovation are becomingmore important. In Nigeria, FDI does not seem to haveany significant impact on growth at the aggregate level.
These observations are also consistent with the literature on the need to establish necessary thresholdconditions for FDI to have a positive impact ongrowth.44 A related strand of literature has focused onlinking FDI with trade openness.45 A sufficiently open(and competitive) environment needs to be in place inthe host country for foreign investors to contribute toraising the efficiency of existing activities and for thehost country to adopt technology, thus generating posi-tive spillovers for the rest of the society and increasingproductivity. Accordingly, the government of CapeVerde has pursued market-oriented economic reformssince the early 1990s, including a widespread privati -zation program and an opening up of the economy toFDI. The main recipient sectors included tourism, light manufacturing, and transport and communicationservices.
The impact of FDI on TFP is positive but not significant in Senegal, and it is even negative (albeit not significantly so) in Ghana and Nigeria. WhileSenegal and Ghana are ranked above the sub-SaharanAfrican average on the GCI described above, they arestill in the factor-driven stage. Their investment climates have demonstrable weaknesses, especially ininfrastructure. More specifically, while Senegal has a
relatively flexible labor and product markets, it is setback by a small market size and an overall weak infra-structure, especially in the power sector.46 In Ghana, thelack of spillovers so far can be in part explained by thelow share of FDI going to the manufacturing sector,where positive technology spillovers are likely to occur.The performance of Ghana’s FDI is also constrained bythe limited access to land, difficulties with registeringproperty, the rigid labor market regulations, and thelack of skilled workers.47 On the positive side, theimpact of FDI on growth through capital accumulationis positive (and significant) for Ghana and Senegal, suggesting that FDI helps overcome shortages of capital,which are caused, in part, by the limited access tofinance.48
Among the countries studied, Nigeria was the onlyone where FDI does not seem to have a positive impactthrough either of the two channels—the increased TFPor higher marginal product of capital.49 This indicatesthat Nigeria’s advantage stemming from a sizeable market and relatively sophisticated financial sector hasbeen eroded by the country’s weak and deterioratinginstitutions and its low degree of ICT penetration,among other impediments. Moreover, FDI has been disproportionately concentrated in the extractive indus-tries, even though their share in total FDI has beendeclining. Ayanwale argues that when broken into subsectors, some components of FDI already exhibitpositive impact on growth. Specifically, FDI in thetelecommunications sector has the most positive effecton the economy, while FDI in the manufacturing sector affects the economy negatively because of theoverall poor business environment and the low level of human capital.50 The evidence of the positive growthimpact of FDI in Nigeria’s telecommunications sector is consistent with the export performance section abovethat posits that FDI inflows into services can enhanceproduction and export diversification as well as growth.51
In Egypt, FDI has a positive and significant impacton TFP. According to the GCI methodology, Egypt isalready in transition to the efficiency-driven stage.Moreover, in 2004, Egypt implemented structuralreforms—such as revamping the banking sector and liberalizing labor markets—aiming to raise the role ofthe private sector in the economy and diversify its pro-duction base. On the FDI side, the reforms includedestablishing one-stop shops, opening up manufacturing toFDI, and abolishing limits on foreign equity participa-tion in services, including telecommunications andfinancial services. The reforms were successful inencouraging FDI inflows and paid off, especially duringthe global financial crisis, when the country continuedto generate over 4 percent of its GDP through FDI,even during the most severe part of the crisis (June2008–09). In 2009, Egypt was the second largest recipi-ent of FDI inflows in Africa (after Angola) and, accord-ing to UNCTAD, was poised to lead the post-crisis
25
1.1:
Exp
orts
, FDI
, and
Com
petit
iven
ess
in A
fric
a
The Africa Competitiveness Report 2011 © 2011 World Economic Forum, the World Bank and the African Development Bank
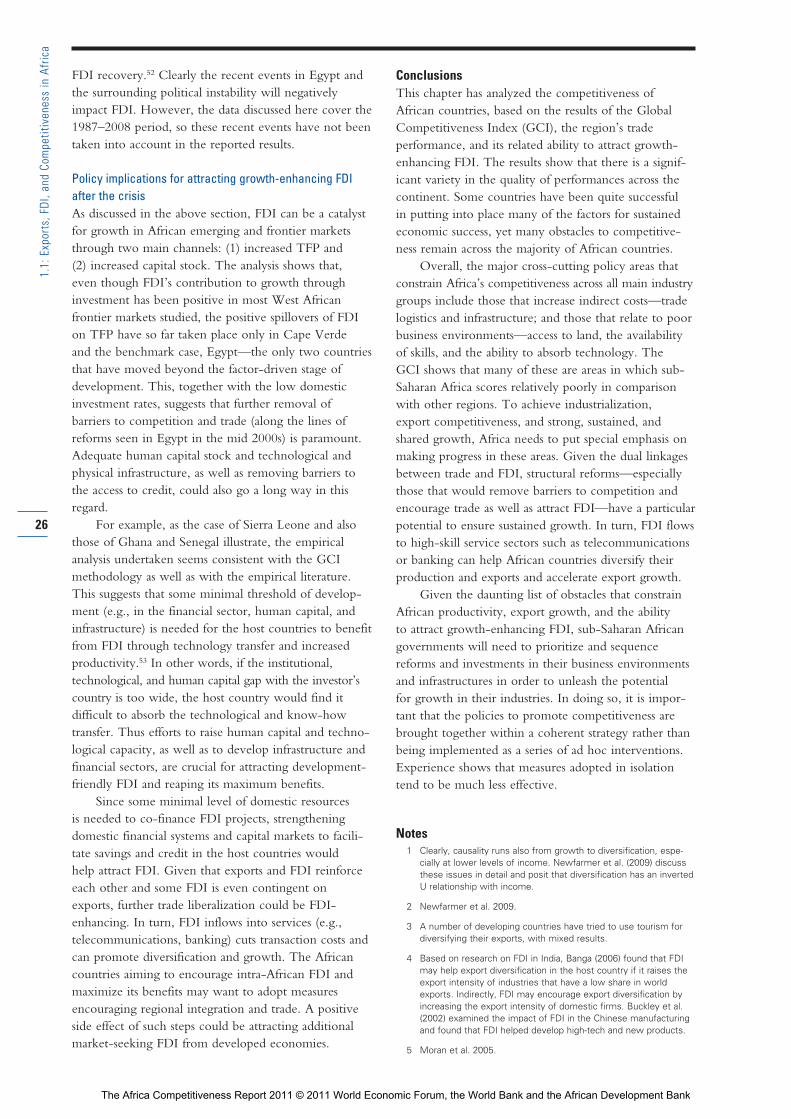
FDI recovery.52 Clearly the recent events in Egypt andthe surrounding political instability will negativelyimpact FDI. However, the data discussed here cover the1987–2008 period, so these recent events have not beentaken into account in the reported results.
Policy implications for attracting growth-enhancing FDIafter the crisisAs discussed in the above section, FDI can be a catalystfor growth in African emerging and frontier marketsthrough two main channels: (1) increased TFP and (2) increased capital stock. The analysis shows that, even though FDI’s contribution to growth throughinvestment has been positive in most West Africanfrontier markets studied, the positive spillovers of FDIon TFP have so far taken place only in Cape Verde and the benchmark case, Egypt—the only two countriesthat have moved beyond the factor-driven stage ofdevelopment. This, together with the low domesticinvestment rates, suggests that further removal of barriers to competition and trade (along the lines ofreforms seen in Egypt in the mid 2000s) is paramount.Adequate human capital stock and technological andphysical infrastructure, as well as removing barriers tothe access to credit, could also go a long way in thisregard.
For example, as the case of Sierra Leone and alsothose of Ghana and Senegal illustrate, the empiricalanalysis undertaken seems consistent with the GCImethodology as well as with the empirical literature.This suggests that some minimal threshold of develop-ment (e.g., in the financial sector, human capital, andinfrastructure) is needed for the host countries to benefitfrom FDI through technology transfer and increasedproductivity.53 In other words, if the institutional, technological, and human capital gap with the investor’scountry is too wide, the host country would find it difficult to absorb the technological and know-howtransfer. Thus efforts to raise human capital and techno-logical capacity, as well as to develop infrastructure andfinancial sectors, are crucial for attracting development-friendly FDI and reaping its maximum benefits.
Since some minimal level of domestic resources is needed to co-finance FDI projects, strengtheningdomestic financial systems and capital markets to facili-tate savings and credit in the host countries would help attract FDI. Given that exports and FDI reinforceeach other and some FDI is even contingent onexports, further trade liberalization could be FDI-enhancing. In turn, FDI inflows into services (e.g.,telecommunications, banking) cuts transaction costs andcan promote diversification and growth. The Africancountries aim ing to encourage intra-African FDI andmaximize its benefits may want to adopt measuresencouraging regional integration and trade. A positiveside effect of such steps could be attracting additionalmarket-seeking FDI from developed economies.
ConclusionsThis chapter has analyzed the competitiveness of African countries, based on the results of the GlobalCompetitiveness Index (GCI), the region’s trade performance, and its related ability to attract growth-enhancing FDI. The results show that there is a signif -icant variety in the quality of performances across thecontinent. Some countries have been quite successful in putting into place many of the factors for sustainedeconomic success, yet many obstacles to competitive-ness remain across the majority of African countries.
Overall, the major cross-cutting policy areas thatconstrain Africa’s competitiveness across all main industrygroups include those that increase indirect costs—tradelogistics and infrastructure; and those that relate to poorbusiness environments—access to land, the availabilityof skills, and the ability to absorb technology. The GCI shows that many of these are areas in which sub-Saharan Africa scores relatively poorly in comparisonwith other regions. To achieve industrialization, export competitiveness, and strong, sustained, andshared growth, Africa needs to put special emphasis onmaking progress in these areas. Given the dual linkagesbetween trade and FDI, structural reforms—especiallythose that would remove barriers to competition andencourage trade as well as attract FDI—have a particularpotential to ensure sustained growth. In turn, FDI flowsto high-skill service sectors such as telecommunicationsor banking can help African countries diversify theirproduction and exports and accelerate export growth.
Given the daunting list of obstacles that constrainAfrican productivity, export growth, and the ability to attract growth-enhancing FDI, sub-Saharan Africangovernments will need to prioritize and sequencereforms and investments in their business environmentsand infrastructures in order to unleash the potential for growth in their industries. In doing so, it is impor-tant that the policies to promote competitiveness arebrought together within a coherent strategy rather thanbeing implemented as a series of ad hoc interventions.Experience shows that measures adopted in isolationtend to be much less effective.
Notes1 Clearly, causality runs also from growth to diversification, espe-
cially at lower levels of income. Newfarmer et al. (2009) discuss
these issues in detail and posit that diversification has an inverted
U relationship with income.
2 Newfarmer et al. 2009.
3 A number of developing countries have tried to use tourism for
diversifying their exports, with mixed results.
4 Based on research on FDI in India, Banga (2006) found that FDI
may help export diversification in the host country if it raises the
export intensity of industries that have a low share in world
exports. Indirectly, FDI may encourage export diversification by
increasing the export intensity of domestic firms. Buckley et al.
(2002) examined the impact of FDI in the Chinese manufacturing
and found that FDI helped develop high-tech and new products.
5 Moran et al. 2005.
26
1.1:
Exp
orts
, FDI
, and
Com
petit
iven
ess
in A
fric
a
The Africa Competitiveness Report 2011 © 2011 World Economic Forum, the World Bank and the African Development Bank
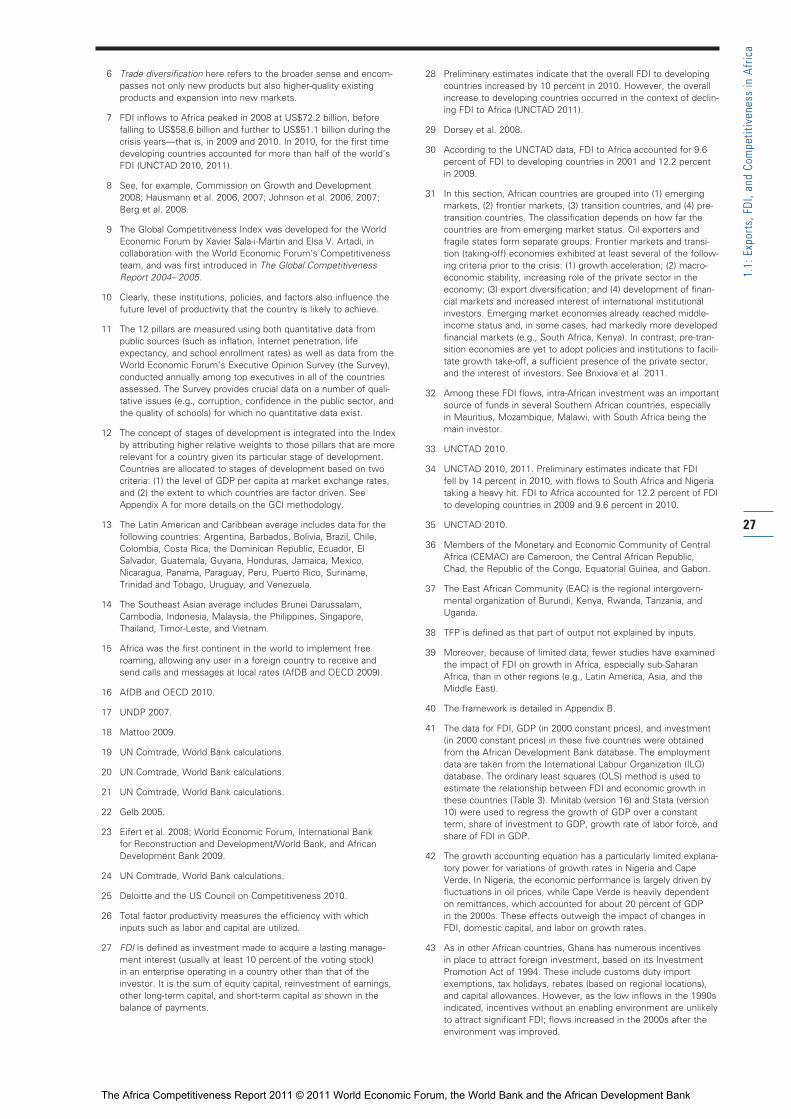
6 Trade diversification here refers to the broader sense and encom-
passes not only new products but also higher-quality existing
products and expansion into new markets.
7 FDI inflows to Africa peaked in 2008 at US$72.2 billion, before
falling to US$58.6 billion and further to US$51.1 billion during the
crisis years—that is, in 2009 and 2010. In 2010, for the first time
developing countries accounted for more than half of the world’s
FDI (UNCTAD 2010, 2011).
8 See, for example, Commission on Growth and Development
2008; Hausmann et al. 2006, 2007; Johnson et al. 2006, 2007;
Berg et al. 2008.
9 The Global Competitiveness Index was developed for the World
Economic Forum by Xavier Sala-i-Martin and Elsa V. Artadi, in
collaboration with the World Economic Forum’s Competitiveness
team, and was first introduced in The Global Competitiveness
Report 2004– 2005.
10 Clearly, these institutions, policies, and factors also influence the
future level of productivity that the country is likely to achieve.
11 The 12 pillars are measured using both quantitative data from
public sources (such as inflation, Internet penetration, life
expectancy, and school enrollment rates) as well as data from the
World Economic Forum’s Executive Opinion Survey (the Survey),
conducted annually among top executives in all of the countries
assessed. The Survey provides crucial data on a number of quali-
tative issues (e.g., corruption, confidence in the public sector, and
the quality of schools) for which no quantitative data exist.
12 The concept of stages of development is integrated into the Index
by attributing higher relative weights to those pillars that are more
relevant for a country given its particular stage of development.
Countries are allocated to stages of development based on two
criteria: (1) the level of GDP per capita at market exchange rates,
and (2) the extent to which countries are factor driven. See
Appendix A for more details on the GCI methodology.
13 The Latin American and Caribbean average includes data for the
following countries: Argentina, Barbados, Bolivia, Brazil, Chile,
Colombia, Costa Rica, the Dominican Republic, Ecuador, El
Salvador, Guatemala, Guyana, Honduras, Jamaica, Mexico,
Nicaragua, Panama, Paraguay, Peru, Puerto Rico, Suriname,
Trinidad and Tobago, Uruguay, and Venezuela.
14 The Southeast Asian average includes Brunei Darussalam,
Cambodia, Indonesia, Malaysia, the Philippines, Singapore,
Thailand, Timor-Leste, and Vietnam.
15 Africa was the first continent in the world to implement free
roaming, allowing any user in a foreign country to receive and
send calls and messages at local rates (AfDB and OECD 2009).
16 AfDB and OECD 2010.
17 UNDP 2007.
18 Mattoo 2009.
19 UN Comtrade, World Bank calculations.
20 UN Comtrade, World Bank calculations.
21 UN Comtrade, World Bank calculations.
22 Gelb 2005.
23 Eifert et al. 2008; World Economic Forum, International Bank
for Reconstruction and Development/World Bank, and African
Development Bank 2009.
24 UN Comtrade, World Bank calculations.
25 Deloitte and the US Council on Competitiveness 2010.
26 Total factor productivity measures the efficiency with which
inputs such as labor and capital are utilized.
27 FDI is defined as investment made to acquire a lasting manage-
ment interest (usually at least 10 percent of the voting stock)
in an enterprise operating in a country other than that of the
investor. It is the sum of equity capital, reinvestment of earnings,
other long-term capital, and short-term capital as shown in the
balance of payments.
28 Preliminary estimates indicate that the overall FDI to developing
countries increased by 10 percent in 2010. However, the overall
increase to developing countries occurred in the context of declin-
ing FDI to Africa (UNCTAD 2011).
29 Dorsey et al. 2008.
30 According to the UNCTAD data, FDI to Africa accounted for 9.6
percent of FDI to developing countries in 2001 and 12.2 percent
in 2009.
31 In this section, African countries are grouped into (1) emerging
markets, (2) frontier markets, (3) transition countries, and (4) pre-
transition countries. The classification depends on how far the
countries are from emerging market status. Oil exporters and
fragile states form separate groups. Frontier markets and transi-
tion (taking-off) economies exhibited at least several of the follow-
ing criteria prior to the crisis: (1) growth acceleration; (2) macro-
economic stability, increasing role of the private sector in the
economy; (3) export diversification; and (4) development of finan-
cial markets and increased interest of international institutional
investors. Emerging market economies already reached middle-
income status and, in some cases, had markedly more developed
financial markets (e.g., South Africa, Kenya). In contrast, pre-tran-
sition economies are yet to adopt policies and institutions to facili-
tate growth take-off, a sufficient presence of the private sector,
and the interest of investors. See Brixiova et al. 2011.
32 Among these FDI flows, intra-African investment was an important
source of funds in several Southern African countries, especially
in Mauritius, Mozambique, Malawi, with South Africa being the
main investor.
33 UNCTAD 2010.
34 UNCTAD 2010, 2011. Preliminary estimates indicate that FDI
fell by 14 percent in 2010, with flows to South Africa and Nigeria
taking a heavy hit. FDI to Africa accounted for 12.2 percent of FDI
to developing countries in 2009 and 9.6 percent in 2010.
35 UNCTAD 2010.
36 Members of the Monetary and Economic Community of Central
Africa (CEMAC) are Cameroon, the Central African Republic,
Chad, the Republic of the Congo, Equatorial Guinea, and Gabon.
37 The East African Community (EAC) is the regional intergovern-
mental organization of Burundi, Kenya, Rwanda, Tanzania, and
Uganda.
38 TFP is defined as that part of output not explained by inputs.
39 Moreover, because of limited data, fewer studies have examined
the impact of FDI on growth in Africa, especially sub-Saharan
Africa, than in other regions (e.g., Latin America, Asia, and the
Middle East).
40 The framework is detailed in Appendix B.
41 The data for FDI, GDP (in 2000 constant prices), and investment
(in 2000 constant prices) in these five countries were obtained
from the African Development Bank database. The employment
data are taken from the International Labour Organization (ILO)
database. The ordinary least squares (OLS) method is used to
estimate the relationship between FDI and economic growth in
these countries (Table 3). Minitab (version 16) and Stata (version
10) were used to regress the growth of GDP over a constant
term, share of investment to GDP, growth rate of labor force, and
share of FDI in GDP.
42 The growth accounting equation has a particularly limited explana-
tory power for variations of growth rates in Nigeria and Cape
Verde. In Nigeria, the economic performance is largely driven by
fluctuations in oil prices, while Cape Verde is heavily dependent
on remittances, which accounted for about 20 percent of GDP
in the 2000s. These effects outweigh the impact of changes in
FDI, domestic capital, and labor on growth rates.
43 As in other African countries, Ghana has numerous incentives
in place to attract foreign investment, based on its Investment
Promotion Act of 1994. These include customs duty import
exemptions, tax holidays, rebates (based on regional locations),
and capital allowances. However, as the low inflows in the 1990s
indicated, incentives without an enabling environment are unlikely
to attract significant FDI; flows increased in the 2000s after the
environment was improved.
27
1.1:
Exp
orts
, FDI
, and
Com
petit
iven
ess
in A
fric
a
The Africa Competitiveness Report 2011 © 2011 World Economic Forum, the World Bank and the African Development Bank
44 See Borensztein et al. 1998; Alfaro et al. 2004, and others.
Borensztein et al. 1998 showed that FDI positively impacts growth
only when the host country reaches a threshold level of human
capital, measured by years of schooling. Alfaro et al. 2004 found
that FDI raises growth when the host country has a developed
financial system. Applying the growth accounting framework to
69 countries in 1970–89, Wang and Wong 2009 clarified the chan-
nels through which the threshold conditions operate: FDI raises
productivity growth when the host country reaches a threshold
level of human capital; it promotes capital growth when a well-
functioning financial system is in place.
45 Kandiero and Chitiga 2003; Moran et al. 2005.
46 Senegal has been developing a special economic zone (SEZ) in
the Diamniadio-Bargny region with a view to attracting FDI as well
as domestic investors. The area will comprise an industrial and
commercial free zone with extensive, up-to-date infrastructure to
accommodate about 400 companies (Oxford Business Group
2010).
47 Aryeetey et al. 2010.
48 Ndikumana and Verick 2008 investigated the bilateral relationship
between domestic investment and FDI and found (1) that domes-
tic private investment with strong performance also crowds in
FDI and (2), in turn, that one way in which FDI can have a positive
impact on growth is through enhancing domestic capital accumu-
lation.
49 In 2006, Nigeria undertook reforms to encourage FDI. A “one-
stop-shop” investment center was created, cutting steps neces-
sary to obtain a business permit. In addition to free export pro-
cessing zones where firms are free from paying taxes, including
income and VAT taxes, the country offers fiscal incentives to
foreign investors. Nevertheless, unclear land property rights
remain a key hindrance to attracting FDI, alongside relatively
weak governance.
50 Ayanwale 2007. These findings are consistent with Alfaro’s 2003
empirical analysis. Using cross-country data for 1981–99, she
showed that the effect of FDI on growth depends on the
sector involved. FDI in the primary sector tends to have a nega-
tive effect, while investment in manufacturing a positive one.
51 For all five West African countries studied, taken together, FDI
had a positive impact on growth through factor accumulation
(at a 5 percent significance level) but not through technology
spillovers. For every 1 percent increase in investment, growth
would be higher by 0.55 percentage points. This is consistent
with the observation that, according to the GCI methodology,
all countries but Cape Verde are in the factor-driven stage of
their development.
52 UNCTAD 2010.
53 Hermes and Lensink 2003 showed that a more developed
financial system positively influences technological diffusion (and
growth) associated with FDI. Similarly, Borenzstein et al. 1998
found that FDI positively impacts productivity when a country has
sufficient human capital stock.
ReferencesAbed, G. and G. Iradian, 2011. “Tunisia: Short-Term Challenges, Long-
Term Opportunities.” IIF Research Note, February 10.
Washington DC: Institute for International Finance.
AfDB and OECD (African Development Bank and Organisation for
Economic Co-operation and Development). 2009. African
Economic Outlook 2009. Tunis and Paris: AfDB and OECD.
———. 2010. African Economic Outlook 2010. Tunis and Paris: AfDB
and OECD.
Alexeev, M. and R. Conrad. 2009. “The Elusive Curse of Oil.” The
Review of Economics and Statistics 91 (3): 586–93.
Alfaro, L., A. Chanda, S. Kalemli-Ozcan, and S. Sayek. 2004. “FDI and
Economic Growth: The Role of Local Financial Markets.” Journal
of International Economics 64 (1): 89–112.
Al-Mawali, N. 2004. “Revisiting the Trade-Growth Nexus: Further
Evidence from Egypt.” Review of Middle East Economics and
Finance 2 (3): 211–18.
Ayanwale, A. B. 2007. “FDI and Economic Growth: Evidence from
Nigeria.” AERC Research Paper No. 165. Nairobi: The African
Research Consortium.
Ayreetey, C., F. Barthel, M. Busse, C. Loehr, and R. Osei. 2010.
“Empirical Study on the Determinants and Pro-Development
Impacts of Foreign Direct Investment in Ghana.” GTZ Working
Paper. Available at http://www.hwwi.org/fileadmin/hwwi/
Leistungen/Gutachten/Report-FDI-Ghana-final.pdf.
Banga, R. 2006. “The Export-Diversifying Impact of Japanese and US
Foreign Investments in the Indian Manufacturing Sector.” Journal
of International Business Studies 37 (4): 558–68.
Bank of Uganda. 2007. The Informal Cross-Border Trade Survey
Report 2006. Kampala: Bank of Uganda. Available at
http://www.bou.or.ug/bouwebsite/export/sites/default/bou/
bou-downloads/publications/TradeStatistics/ICBTReports/
INFORMAL_CROSS_BORDER_TRADE_SURVEY_2006.pdf.
———. 2009. The Informal Cross Border Survey Trade Report 2008.
Kampala: Bank of Uganda. Available at http://www.bou.or.ug/
bouwebsite/export/sites/default/bou/bou-downloads/publications/
TradeStatistics/ICBTReports/Informal_Cross_Border_Trade_Report
_2008.pdf.
Berg, A., J. D. Ostry, and J. Zettelmeyer. 2008. “What Makes Growth
Sustained?” IMF Working Paper WP/08/59. Washington DC: IMF.
Borensztein, E., J. De Gregorio, and J.-W. Lee. 1998. “How Does
Foreign Direct Investment Affect Economic Growth?” Journal of
International Economics 45 (1): 115–35.
Brixiova, Z. and L. Ndikumana. 2011. “East Africa’s Resilience during
the Global Recession: Lessons and Policies.” Paper presented at
the 2011 ASSA Annual Meeting, Denver, January 6–9.
Brixiova, Z., L. Ndikumana, and K. Abderrahim. 2011.”Characterizing
Africa’s Dynamism.” African Development Bank Policy Brief,
forthcoming.
Buckley P. T., J. Clegg, and C. Wang. 2002. “The Impact of Inward FDI
on the Performance of Chinese Manufacturing Firms.” Journal of
International Business Studies 33 (4): 637–55.
Collier, P. 2007. The Bottom Billion. Oxford: Oxford University Press.
Collier, P. and B. Goderis. 2008. “Structural Policies for Shock-Prone
Commodity Exporters.” Oxford: Centre for the Study of African
Economies, Oxford University.
Commission on Growth and Development. 2008. The Growth Report:
Strategies for Growth and Inclusive Development. Washington
DC: World Bank on behalf of the Commission on Growth and
Development. Available at http://www.growthcommission.org/
index.php?Itemid=169&id=96&option=com_content&task=view.
Deloitte and the US Council on Competitiveness. 2010. 2010 Global
Manufacturing Competitiveness Index. Deloitte Touche and
Tohmatsu, June. Available at http://www.deloitte.com/view/
en_GX/global/industries/manufacturing/a1a52c646d069210VgnVC
M200000bb42f00aRCRD.htm.
Dorsey, T., H. Tadesse, S. Singh, and Z. Brixiova. 2008. “The
Landscape of Capital Flows to Low-Income Countries.” IMF
Working Paper WP/08/51. Washington DC: IMF.
Eifert, B., A. Gelb, and V. Ramachandran. 2005. “Business Environment
and Comparative Advantage in Africa: Evidence from the
Investment Climate Data.” Working Paper No. 56. Washington
DC: Center for Global Development. Available at
http://www.cgdev.org/content/publications/detail/2732/.
———. 2008. “The Cost of Doing Business in Africa: Evidence from
Enterprise Survey Data.” World Development 36 (9): 1531–46.
Hammouda, H. B., S. N. Karingi, A. E. Njuguna, and M. S. Jallab. 2010.
“Growth, Productivity and Diversification in Africa.” Journal of
Productivity Analysis 33 (2): 125–46.
Hausmann, R. J. Hwang, and D. Rodrik. 2007. “What You Export
Matters.” Journal of Economic Growth 12 (1): 1–25.
Hausmann, R., R. Rodriguez, and R. Wagner, 2006. “Growth Collapses.”
CID Working Paper No. 136. Cambridge, MA: Center for
International Development at Harvard University.
28
1.1:
Exp
orts
, FDI
, and
Com
petit
iven
ess
in A
fric
a
The Africa Competitiveness Report 2011 © 2011 World Economic Forum, the World Bank and the African Development Bank
Hermes, N. and R. Lensink. 2003. “Foreign Direct Investment, Financial
Development and Economic Growth.” Journal of Development
Studies 40 (1): 142–63.
Johnson, S., J. D. Ostry, and A. Subramanian. 2006. “Levers for Growth.”
Finance and Development 43 (1). Available at http://www.imf.org/
external/pubs/ft/fandd/2006/03/johnson.htm.
———. 2007. “Prospects for Sustained Growth in Africa: Benchmarking
the Constraints.” IMF Working Paper WP/07/52. Washington DC:
IMF.
Kandiero, T. and M. Chitiga. 2003. “Trade Openness and Foreign Direct
Investment in Africa.” Paper prepared for the Economic Society
of Southern Africa 2003 Annual Conference, Cape Town, South
Africa, October.
Mattoo, A. 2009. “Exporting Services.” In Breaking into New Markets:
Emerging Lessons for Export Diversification, ed. R. Newfarmer,
W. Shaw, and P. Walkenhorst. Washington DC: World Bank.
161–82.
Moran, T., E. Graham, and M. Blomsröm. 2005. Does Foreign
Investment Promote Development? Washington DC: Institute for
International Economics and Center for Global Development.
Ndikumana, L. and S. Verick. 2008. “The Linkages Between FDI and
Domestic Investment: Unraveling the Developmental Impact of
Foreign Investment in Sub-Saharan Africa.” Development Policy
Review 26 (6): 713–26.
Newfarmer, R., W. Shaw, and P. Walkenhorst, eds. 2009. Breaking into
New Markets: Emerging Lessons for Export Diversification.
Washington DC: World Bank.
Oxford Business Group. 2010. Senegal 2009: The Report. London:
Oxford Business Group.
Sadik, A. T. and A. A. Bolbol. 2001. “Capital Flows, FDI and Technology
Spillovers: Evidence from Arab Countries.” World Development
29 (12): 2111–25.
Uganda Bureau of Statistics. 2010. Statistical Abstract 2010. Kampala:
Uganda Bureau of Statistics. Available at http://www.ubos.org/
onlinefiles/uploads/ubos/pdf%20documents/2010StatAbstract.pdf.
UN Comtrade database. Available at http://comtrade.un.org/.
UNCTAD (United Nations Conference on Trade and Development).
UNCTADstat. Foreign merchandise database available at
http://unctadstat.unctad.org/TableViewer/tableView.aspx?
ReportId=120.
———. FDI Statistics database. Available at
http://www.unctad.org/Templates/Page.asp?intItemID=4979&
lang=1.
———. 2010. World Investment Report 2010. Geneva: UNCTAD.
———. 2011. “Global and Regional FDI Trends in 2010.” UNCTAD
Global Investment Trends Monitor No. 5 (January 11). Geneva:
UNCTAD.
UNDP (United Nations Development Programme). 2007. Swaziland
Human Development Report: HIV and AIDS and Culture, March.
Report commissioned by UNDP Swaziland. Available at http://
planipolis.iiep.unesco.org/upload/Swaziland/Swaziland_NHDR_200
8.pdf.
Wang, M. and M. C. S. Wong. 2009. “Foreign Direct Investment and
Economic Growth: The Growth Accounting Perspective.”
Economic Inquiry 47 (4): 701–10.
World Economic Forum. 2004. The Global Competitiveness Report
2004– 2005. Houndmills, Basingstoke, Hampshire and New York:
Palgrave MacMillan.
———. 2009. The Global Competitiveness Report 2009– 2010. Geneva:
World Economic Forum.
———. 2010. The Global Competitiveness Report 2010– 2011. Geneva:
World Economic Forum.
World Economic Forum, International Bank for Reconstruction and
Development/World Bank, and African Development Bank. 2009.
The Africa Competitiveness Report 2009. Geneva: World
Economic Forum.
29
1.1:
Exp
orts
, FDI
, and
Com
petit
iven
ess
in A
fric
a
The Africa Competitiveness Report 2011 © 2011 World Economic Forum, the World Bank and the African Development Bank

The Africa Competitiveness Report 2011 © 2011 World Economic Forum, the World Bank and the African Development Bank
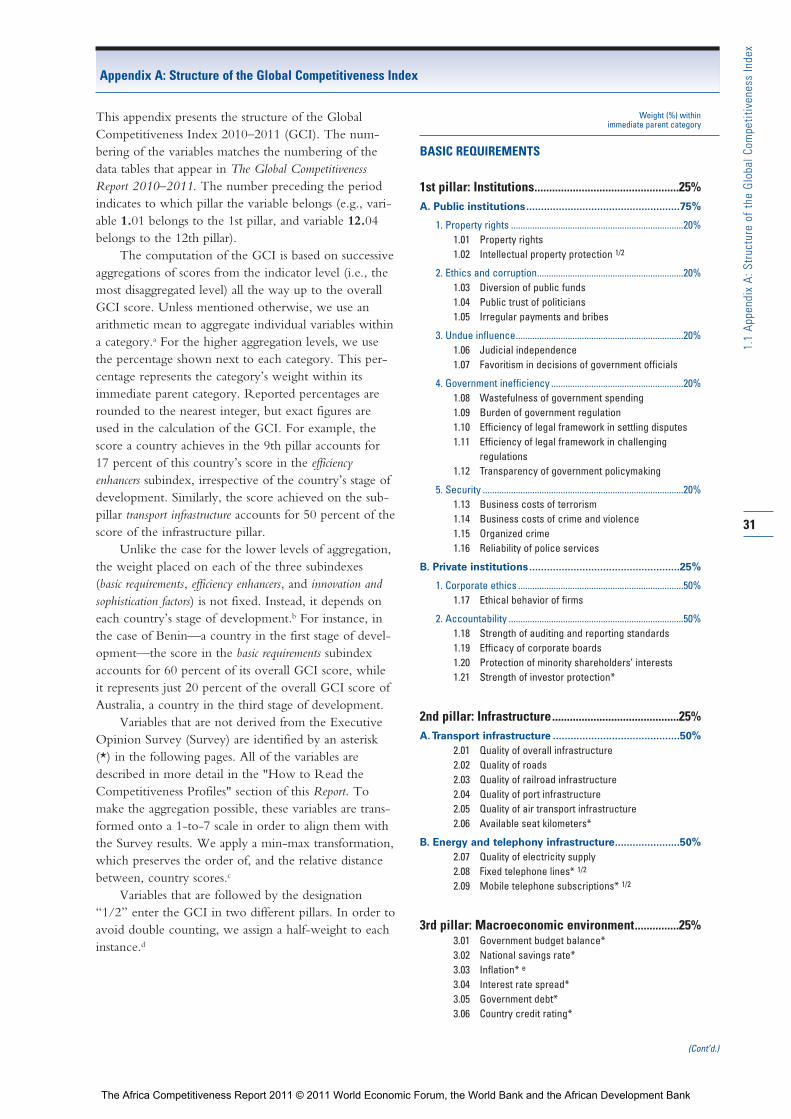
31
This appendix presents the structure of the GlobalCompetitiveness Index 2010–2011 (GCI). The num-bering of the variables matches the numbering of thedata tables that appear in The Global CompetitivenessReport 2010–2011. The number preceding the periodindicates to which pillar the variable belongs (e.g., vari-able 1.01 belongs to the 1st pillar, and variable 12.04belongs to the 12th pillar).
The computation of the GCI is based on successiveaggregations of scores from the indicator level (i.e., themost disaggregated level) all the way up to the overallGCI score. Unless mentioned otherwise, we use anarithmetic mean to aggregate individual variables withina category.a For the higher aggregation levels, we usethe percentage shown next to each category. This per-centage represents the category’s weight within itsimmediate parent category. Reported percentages arerounded to the nearest integer, but exact figures areused in the calculation of the GCI. For example, thescore a country achieves in the 9th pillar accounts for17 percent of this country’s score in the efficiencyenhancers subindex, irrespective of the country’s stage ofdevelopment. Similarly, the score achieved on the sub-pillar transport infrastructure accounts for 50 percent of thescore of the infrastructure pillar.
Unlike the case for the lower levels of aggregation,the weight placed on each of the three subindexes (basic requirements, efficiency enhancers, and innovation andsophistication factors) is not fixed. Instead, it depends oneach country’s stage of development.b For instance, inthe case of Benin—a country in the first stage of devel-opment—the score in the basic requirements subindexaccounts for 60 percent of its overall GCI score, whileit represents just 20 percent of the overall GCI score ofAustralia, a country in the third stage of development.
Variables that are not derived from the ExecutiveOpinion Survey (Survey) are identified by an asterisk(*) in the following pages. All of the variables aredescribed in more detail in the "How to Read theCompetitiveness Profiles" section of this Report. Tomake the aggregation possible, these variables are trans-formed onto a 1-to-7 scale in order to align them withthe Survey results. We apply a min-max transformation,which preserves the order of, and the relative distancebetween, country scores.c
Variables that are followed by the designation“1/2” enter the GCI in two different pillars. In order toavoid double counting, we assign a half-weight to eachinstance.d
Weight (%) within immediate parent category
BASIC REQUIREMENTS
1st pillar: Institutions.................................................25%A. Public institutions....................................................75%
1. Property rights .........................................................................20%1.01 Property rights1.02 Intellectual property protection 1/2
2. Ethics and corruption..............................................................20%1.03 Diversion of public funds1.04 Public trust of politicians1.05 Irregular payments and bribes
3. Undue influence.......................................................................20%1.06 Judicial independence1.07 Favoritism in decisions of government officials
4. Government inefficiency ........................................................20%1.08 Wastefulness of government spending1.09 Burden of government regulation1.10 Efficiency of legal framework in settling disputes1.11 Efficiency of legal framework in challenging
regulations1.12 Transparency of government policymaking
5. Security .....................................................................................20%1.13 Business costs of terrorism1.14 Business costs of crime and violence1.15 Organized crime1.16 Reliability of police services
B. Private institutions...................................................25%
1. Corporate ethics ......................................................................50%1.17 Ethical behavior of firms
2. Accountability ..........................................................................50%1.18 Strength of auditing and reporting standards1.19 Efficacy of corporate boards1.20 Protection of minority shareholders’ interests1.21 Strength of investor protection*
2nd pillar: Infrastructure...........................................25%A. Transport infrastructure ...........................................50%
2.01 Quality of overall infrastructure2.02 Quality of roads2.03 Quality of railroad infrastructure2.04 Quality of port infrastructure2.05 Quality of air transport infrastructure2.06 Available seat kilometers*
B. Energy and telephony infrastructure......................50%2.07 Quality of electricity supply2.08 Fixed telephone lines* 1/2
2.09 Mobile telephone subscriptions* 1/2
3rd pillar: Macroeconomic environment...............25%3.01 Government budget balance*3.02 National savings rate*3.03 Inflation* e
3.04 Interest rate spread*3.05 Government debt*3.06 Country credit rating*
Appendix A: Structure of the Global Competitiveness Index
1.1
Appe
ndix
A: S
truc
ture
of
the
Glob
al C
ompe
titiv
enes
s In
dex
(Cont’d.)
The Africa Competitiveness Report 2011 © 2011 World Economic Forum, the World Bank and the African Development Bank
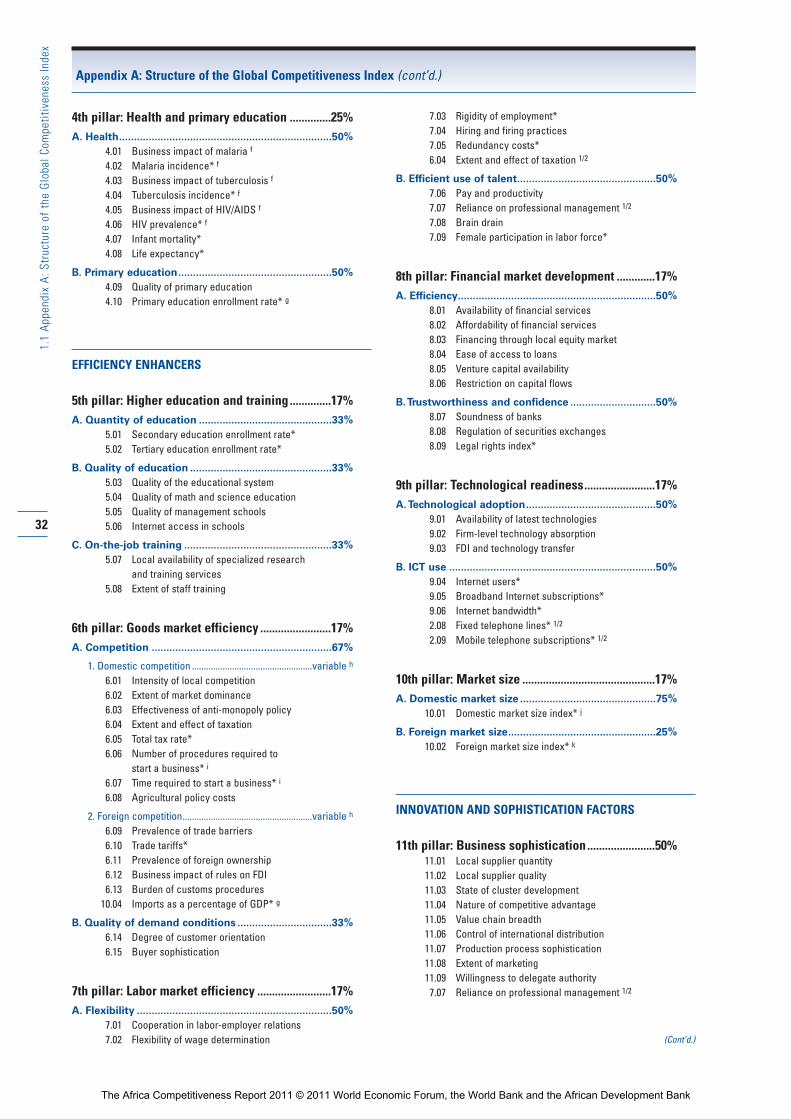
32
1.1
Appe
ndix
A: S
truc
ture
of
the
Glob
al C
ompe
titiv
enes
s In
dex
4th pillar: Health and primary education ..............25%A. Health........................................................................50%
4.01 Business impact of malaria f
4.02 Malaria incidence* f
4.03 Business impact of tuberculosis f
4.04 Tuberculosis incidence* f
4.05 Business impact of HIV/AIDS f
4.06 HIV prevalence* f
4.07 Infant mortality*4.08 Life expectancy*
B. Primary education....................................................50%4.09 Quality of primary education4.10 Primary education enrollment rate* g
EFFICIENCY ENHANCERS
5th pillar: Higher education and training ..............17%A. Quantity of education .............................................33%
5.01 Secondary education enrollment rate*5.02 Tertiary education enrollment rate*
B. Quality of education ................................................33%5.03 Quality of the educational system5.04 Quality of math and science education5.05 Quality of management schools5.06 Internet access in schools
C. On-the-job training ..................................................33%5.07 Local availability of specialized research
and training services5.08 Extent of staff training
6th pillar: Goods market efficiency ........................17%A. Competition .............................................................67%
1. Domestic competition ...................................................variable h
6.01 Intensity of local competition6.02 Extent of market dominance6.03 Effectiveness of anti-monopoly policy6.04 Extent and effect of taxation6.05 Total tax rate*6.06 Number of procedures required to
start a business* i
6.07 Time required to start a business* i
6.08 Agricultural policy costs
2. Foreign competition.......................................................variable h
6.09 Prevalence of trade barriers6.10 Trade tariffs*6.11 Prevalence of foreign ownership6.12 Business impact of rules on FDI6.13 Burden of customs procedures
10.04 Imports as a percentage of GDP* g
B. Quality of demand conditions ................................33%6.14 Degree of customer orientation6.15 Buyer sophistication
7th pillar: Labor market efficiency .........................17%A. Flexibility ..................................................................50%
7.01 Cooperation in labor-employer relations7.02 Flexibility of wage determination
7.03 Rigidity of employment*7.04 Hiring and firing practices7.05 Redundancy costs*6.04 Extent and effect of taxation 1/2
B. Efficient use of talent...............................................50%7.06 Pay and productivity7.07 Reliance on professional management 1/2
7.08 Brain drain7.09 Female participation in labor force*
8th pillar: Financial market development .............17%A. Efficiency...................................................................50%
8.01 Availability of financial services8.02 Affordability of financial services8.03 Financing through local equity market8.04 Ease of access to loans8.05 Venture capital availability8.06 Restriction on capital flows
B. Trustworthiness and confidence .............................50%8.07 Soundness of banks8.08 Regulation of securities exchanges8.09 Legal rights index*
9th pillar: Technological readiness........................17%A. Technological adoption............................................50%
9.01 Availability of latest technologies9.02 Firm-level technology absorption9.03 FDI and technology transfer
B. ICT use ......................................................................50%9.04 Internet users*9.05 Broadband Internet subscriptions*9.06 Internet bandwidth*2.08 Fixed telephone lines* 1/2
2.09 Mobile telephone subscriptions* 1/2
10th pillar: Market size .............................................17%A. Domestic market size ..............................................75%
10.01 Domestic market size index* j
B. Foreign market size..................................................25%10.02 Foreign market size index* k
INNOVATION AND SOPHISTICATION FACTORS
11th pillar: Business sophistication.......................50%11.01 Local supplier quantity11.02 Local supplier quality11.03 State of cluster development11.04 Nature of competitive advantage11.05 Value chain breadth11.06 Control of international distribution11.07 Production process sophistication11.08 Extent of marketing11.09 Willingness to delegate authority7.07 Reliance on professional management 1/2
(Cont’d.)
Appendix A: Structure of the Global Competitiveness Index (cont’d.)
The Africa Competitiveness Report 2011 © 2011 World Economic Forum, the World Bank and the African Development Bank
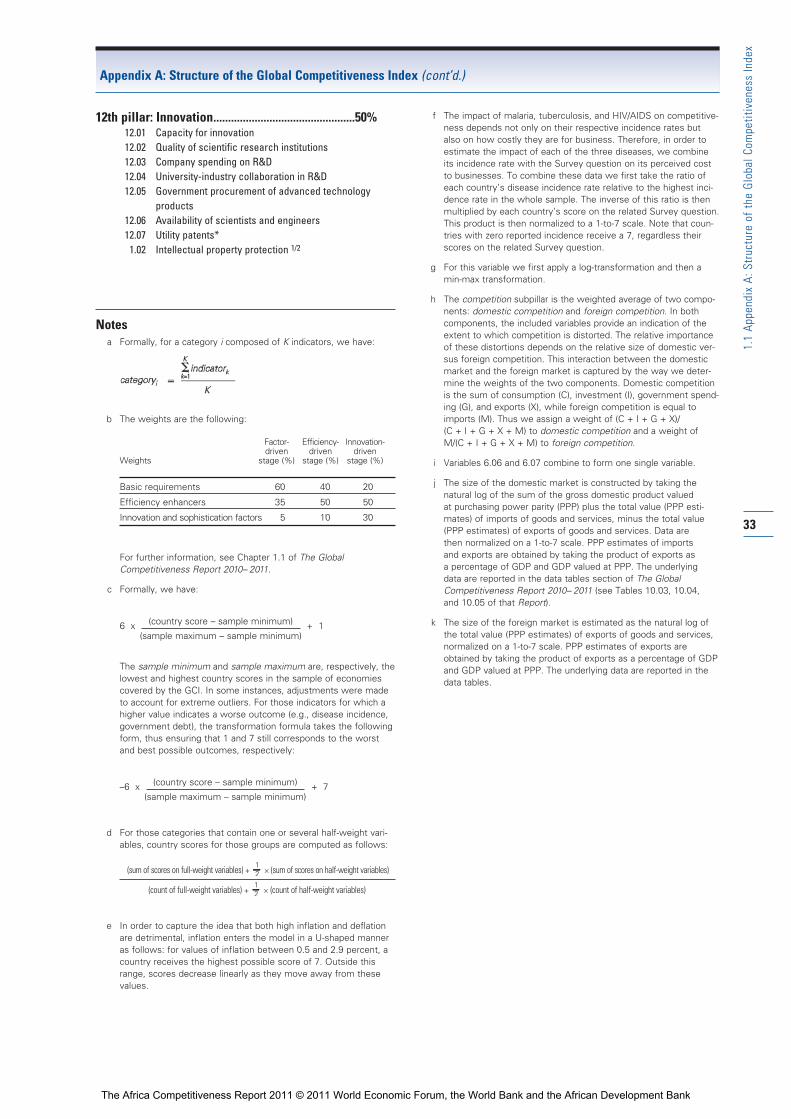
12th pillar: Innovation................................................50%12.01 Capacity for innovation12.02 Quality of scientific research institutions12.03 Company spending on R&D12.04 University-industry collaboration in R&D12.05 Government procurement of advanced technology
products12.06 Availability of scientists and engineers12.07 Utility patents*1.02 Intellectual property protection 1/2
Notesa Formally, for a category i composed of K indicators, we have:
b The weights are the following:
Factor- Efficiency- Innovation-driven driven driven
Weights stage (%) stage (%) stage (%)
Basic requirements 60 40 20
Efficiency enhancers 35 50 50
Innovation and sophistication factors 5 10 30
For further information, see Chapter 1.1 of The Global
Competitiveness Report 2010– 2011.
c Formally, we have:
6 x(country score – sample minimum)
+ 1 (sample maximum – sample minimum)
The sample minimum and sample maximum are, respectively, the
lowest and highest country scores in the sample of economies
covered by the GCI. In some instances, adjustments were made
to account for extreme outliers. For those indicators for which a
higher value indicates a worse outcome (e.g., disease incidence,
government debt), the transformation formula takes the following
form, thus ensuring that 1 and 7 still corresponds to the worst
and best possible outcomes, respectively:
–6 x(country score – sample minimum)
+ 7 (sample maximum – sample minimum)
d For those categories that contain one or several half-weight vari-
ables, country scores for those groups are computed as follows:
(sum of scores on full-weight variables) + × (sum of scores on half-weight variables)
(count of full-weight variables) + × (count of half-weight variables)
e In order to capture the idea that both high inflation and deflation
are detrimental, inflation enters the model in a U-shaped manner
as follows: for values of inflation between 0.5 and 2.9 percent, a
country receives the highest possible score of 7. Outside this
range, scores decrease linearly as they move away from these
values.
f The impact of malaria, tuberculosis, and HIV/AIDS on competitive-
ness depends not only on their respective incidence rates but
also on how costly they are for business. Therefore, in order to
estimate the impact of each of the three diseases, we combine
its incidence rate with the Survey question on its perceived cost
to businesses. To combine these data we first take the ratio of
each country’s disease incidence rate relative to the highest inci-
dence rate in the whole sample. The inverse of this ratio is then
multiplied by each country’s score on the related Survey question.
This product is then normalized to a 1-to-7 scale. Note that coun-
tries with zero reported incidence receive a 7, regardless their
scores on the related Survey question.
g For this variable we first apply a log-transformation and then a
min-max transformation.
h The competition subpillar is the weighted average of two compo-
nents: domestic competition and foreign competition. In both
components, the included variables provide an indication of the
extent to which competition is distorted. The relative importance
of these distortions depends on the relative size of domestic ver-
sus foreign competition. This interaction between the domestic
market and the foreign market is captured by the way we deter-
mine the weights of the two components. Domestic competition
is the sum of consumption (C), investment (I), government spend-
ing (G), and exports (X), while foreign competition is equal to
imports (M). Thus we assign a weight of (C + I + G + X)/
(C + I + G + X + M) to domestic competition and a weight of
M/(C + I + G + X + M) to foreign competition.
i Variables 6.06 and 6.07 combine to form one single variable.
j The size of the domestic market is constructed by taking the
natural log of the sum of the gross domestic product valued
at purchasing power parity (PPP) plus the total value (PPP esti-
mates) of imports of goods and services, minus the total value
(PPP estimates) of exports of goods and services. Data are
then normalized on a 1-to-7 scale. PPP estimates of imports
and exports are obtained by taking the product of exports as
a percentage of GDP and GDP valued at PPP. The underlying
data are reported in the data tables section of The Global
Competitiveness Report 2010– 2011 (see Tables 10.03, 10.04,
and 10.05 of that Report).
k The size of the foreign market is estimated as the natural log of
the total value (PPP estimates) of exports of goods and services,
normalized on a 1-to-7 scale. PPP estimates of exports are
obtained by taking the product of exports as a percentage of GDP
and GDP valued at PPP. The underlying data are reported in the
data tables.
Appendix A: Structure of the Global Competitiveness Index (cont’d.)
33
1.1
Appe
ndix
A: S
truc
ture
of
the
Glob
al C
ompe
titiv
enes
s In
dex
The Africa Competitiveness Report 2011 © 2011 World Economic Forum, the World Bank and the African Development Bank

The Africa Competitiveness Report 2011 © 2011 World Economic Forum, the World Bank and the African Development Bank
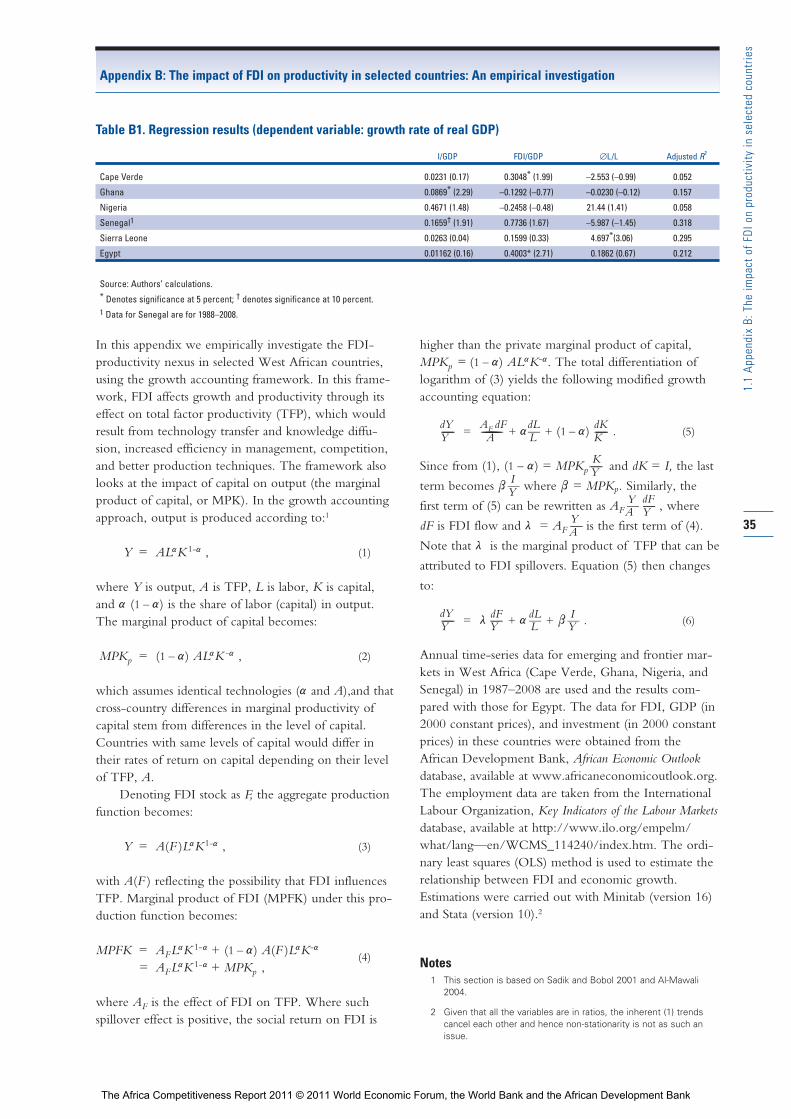
In this appendix we empirically investigate the FDI-productivity nexus in selected West African countries,using the growth accounting framework. In this frame-work, FDI affects growth and productivity through itseffect on total factor productivity (TFP), which wouldresult from technology transfer and knowledge diffu-sion, increased efficiency in management, competition,and better production techniques. The framework alsolooks at the impact of capital on output (the marginalproduct of capital, or MPK). In the growth accountingapproach, output is produced according to:1
Y = ALαK1-α, (1)
where Y is output, A is TFP, L is labor, K is capital,and α(1 –α) is the share of labor (capital) in output.The marginal product of capital becomes:
MPKp = (1 –α) ALαK -α, (2)
which assumes identical technologies (αand A),and thatcross-country differences in marginal productivity ofcapital stem from differences in the level of capital.Countries with same levels of capital would differ intheir rates of return on capital depending on their levelof TFP, A.
Denoting FDI stock as F, the aggregate productionfunction becomes:
Y = A(F )LαK1-α, (3)
with A(F ) reflecting the possibility that FDI influencesTFP. Marginal product of FDI (MPFK) under this pro-duction function becomes:
MPFK = AFLαK1-α+ (1 –α) A(F )LαK-α
MPFK = AFLαK1-α+ MPKp ,(4)
where AF is the effect of FDI on TFP. Where suchspillover effect is positive, the social return on FDI is
higher than the private marginal product of capital,MPKp = (1 –α) ALαK-α. The total differentiation oflogarithm of (3) yields the following modified growthaccounting equation:
dY———Y =
AF dF—————————A + αdL—L + (1 –α)
dK———K . (5)
Since from (1), (1 –α) = MPKpK——Y and dK = I, the last
term becomes βI—Y where β= MPKp. Similarly, the
first term of (5) can be rewritten as AFY—AdF——Y , where
dF is FDI flow and λ= AFY——A is the first term of (4).
Note that λ is the marginal product of TFP that can be
attributed to FDI spillovers. Equation (5) then changes
to:
dY———Y = λ
dF——Y + αdL—L + β
I—Y . (6)
Annual time-series data for emerging and frontier mar-kets in West Africa (Cape Verde, Ghana, Nigeria, andSenegal) in 1987–2008 are used and the results com-pared with those for Egypt. The data for FDI, GDP (in2000 constant prices), and investment (in 2000 constantprices) in these countries were obtained from theAfrican Development Bank, African Economic Outlookdatabase, available at www.africaneconomicoutlook.org.The employment data are taken from the InternationalLabour Organization, Key Indicators of the Labour Marketsdatabase, available at http://www.ilo.org/empelm/what/lang—en/WCMS_114240/index.htm. The ordi-nary least squares (OLS) method is used to estimate therelationship between FDI and economic growth.Estimations were carried out with Minitab (version 16)and Stata (version 10).2
Notes1 This section is based on Sadik and Bobol 2001 and Al-Mawali
2004.
2 Given that all the variables are in ratios, the inherent (1) trends
cancel each other and hence non-stationarity is not as such an
issue.
35
1.1
Appe
ndix
B: T
he im
pact
of
FDI o
n pr
oduc
tivity
in s
elec
ted
coun
trie
s
Appendix B: The impact of FDI on productivity in selected countries: An empirical investigation
Table B1. Regression results (dependent variable: growth rate of real GDP)
I/GDP FDI/GDP ∅L/L Adjusted R²
Cape Verde 0.0231 (0.17) 0.3048* (1.99) –2.553 (–0.99) 0.052
Ghana 0.0869* (2.29) –0.1292 (–0.77) –0.0230 (–0.12) 0.157
Nigeria 0.4671 (1.48) –0.2458 (–0.48) 21.44 (1.41) 0.058
Senegal1 0.1659† (1.91) 0.7736 (1.67) –5.987 (–1.45) 0.318
Sierra Leone 0.0263 (0.04) 0.1599 (0.33) 4.697*(3.06) 0.295
Egypt 0.01162 (0.16) 0.4003* (2.71) 0.1862 (0.67) 0.212
Source: Authors’ calculations.* Denotes significance at 5 percent; † denotes significance at 10 percent.1 Data for Senegal are for 1988–2008.
The Africa Competitiveness Report 2011 © 2011 World Economic Forum, the World Bank and the African Development Bank

The Africa Competitiveness Report 2011 © 2011 World Economic Forum, the World Bank and the African Development Bank
Part 2 Capitalizing on Africa’s Resources
The Africa Competitiveness Report 2011 © 2011 World Economic Forum, the World Bank and the African Development Bank

The Africa Competitiveness Report 2011 © 2011 World Economic Forum, the World Bank and the African Development Bank
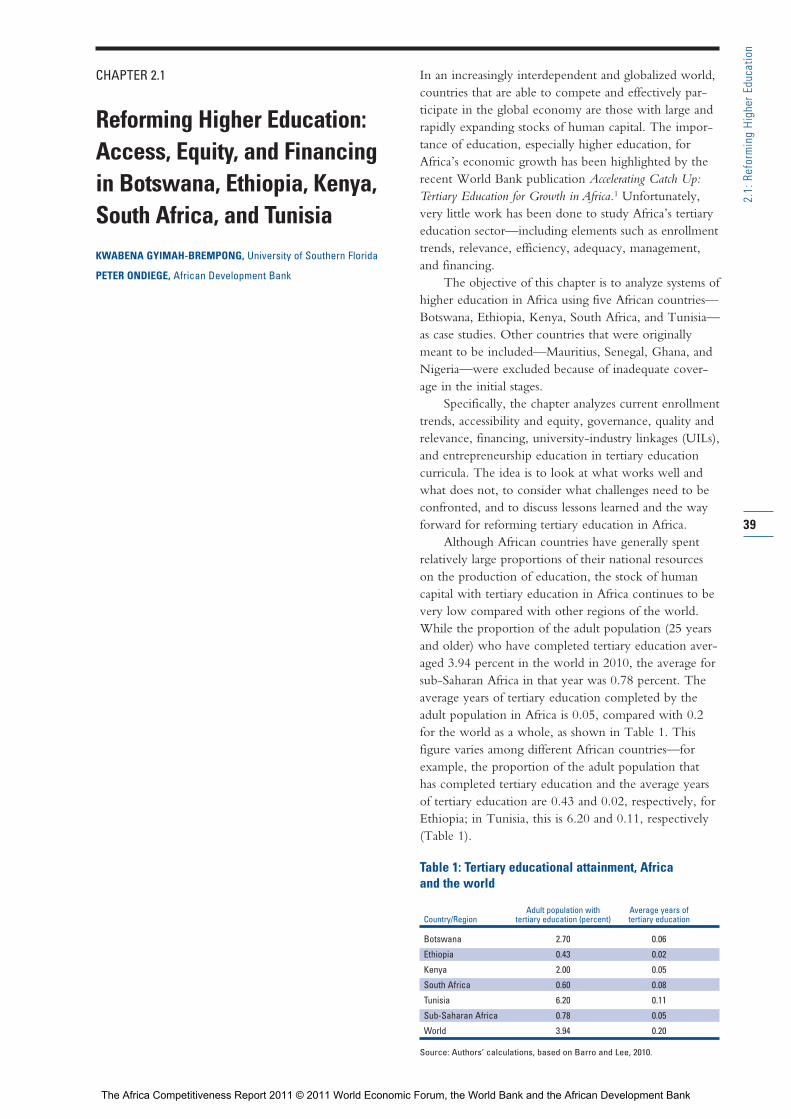
CHAPTER 2.1
Reforming Higher Education:Access, Equity, and Financingin Botswana, Ethiopia, Kenya,South Africa, and TunisiaKWABENA GYIMAH-BREMPONG, University of Southern Florida
PETER ONDIEGE, African Development Bank
In an increasingly interdependent and globalized world,countries that are able to compete and effectively par-ticipate in the global economy are those with large andrapidly expanding stocks of human capital. The impor-tance of education, especially higher education, forAfrica’s economic growth has been highlighted by therecent World Bank publication Accelerating Catch Up:Tertiary Education for Growth in Africa.1 Unfortunately,very little work has been done to study Africa’s tertiary education sector—including elements such as enrollmenttrends, relevance, efficiency, adequacy, management,and financing.
The objective of this chapter is to analyze systems ofhigher education in Africa using five African countries—Botswana, Ethiopia, Kenya, South Africa, and Tunisia—as case studies. Other countries that were originallymeant to be included—Mauritius, Senegal, Ghana, andNigeria—were excluded because of inadequate cover-age in the initial stages.
Specifically, the chapter analyzes current enrollmenttrends, accessibility and equity, governance, quality andrelevance, financing, university-industry linkages (UILs),and entrepreneurship education in tertiary educationcurricula. The idea is to look at what works well andwhat does not, to consider what challenges need to beconfronted, and to discuss lessons learned and the wayforward for reforming tertiary education in Africa.
Although African countries have generally spentrelatively large proportions of their national resourceson the production of education, the stock of humancapital with tertiary education in Africa continues to bevery low compared with other regions of the world.While the proportion of the adult population (25 yearsand older) who have completed tertiary education aver-aged 3.94 percent in the world in 2010, the average for sub-Saharan Africa in that year was 0.78 percent. Theaverage years of tertiary education completed by theadult population in Africa is 0.05, compared with 0.2for the world as a whole, as shown in Table 1. This figure varies among different African countries—forexample, the proportion of the adult population that has completed tertiary education and the average yearsof tertiary education are 0.43 and 0.02, respectively, forEthiopia; in Tunisia, this is 6.20 and 0.11, respectively(Table 1).
Table 1: Tertiary educational attainment, Africa and the world
Adult population with Average years ofCountry/Region tertiary education (percent) tertiary education
Botswana 2.70 0.06
Ethiopia 0.43 0.02
Kenya 2.00 0.05
South Africa 0.60 0.08
Tunisia 6.20 0.11
Sub-Saharan Africa 0.78 0.05
World 3.94 0.20
Source: Authors’ calculations, based on Barro and Lee, 2010.
39
2.1:
Ref
orm
ing
High
er E
duca
tion
The Africa Competitiveness Report 2011 © 2011 World Economic Forum, the World Bank and the African Development Bank
Other major concerns include the relevance of the fields of study, the curricula, and the effectiveness of pedagogy for the development needs of Africancountries as well as the general quality of programs andgraduates. While about 50 percent or more of studentsenrolled in tertiary educational institutions in fast-growing countries such as Korea, China, and Taiwan are enrolled in science, engineering, technology (SET)or business, only about 20 percent of tertiary educationstudents in Africa are enrolled in these subjects. Theresult is that while graduates of African tertiary educa-tional institutions go unemployed, African countriescontinue to face shortages of skilled labor. The per-ceived low quality and irrelevance of tertiary education-al institutions, as well as their small size, indicate that itmay be difficult for these institutions and their graduatesto lead Africa’s development.
There is solid theoretical and empirical evidencethat education—especially tertiary education thatemphasizes SET and business—has a strong positiveeffect on the growth rate of income in all countries.2
The quality of tertiary education, as well as the subjectsstudied, may be more important for growth than thequantity of people who have obtained a tertiary education. For example, a high-quality SET-based and empirical inquiry–driven tertiary education maycontribute more to a country’s growth than a social science–based education that is not driven by relevantresearch based on local needs. This positive effect couldcome through several channels, including knowledgecreation and spillovers,3 as well as the ability to borrowand adapt technologies.4
In a recent study, Teal concludes that African eco-nomic growth has been powered by increased invest-ment in physical capital rather than increased tertiaryeducation.5 However, he also finds that investment inphysical capital depends on the availability of an educat-ed workforce, suggesting that tertiary education indi-rectly contributes positively to income growth in Africa.
Several researchers argue that it is not only thequantity but also the quality of tertiary education thatmatters for income growth.6 In addition, democraticaccess to improved tertiary education can be a pro-poorgrowth strategy.7 When the quality of tertiary educationis unequal among groups, it generates inequality inincomes.8
Africa has devoted substantial resources to highereducation, especially in the last decade, during whichsome African countries have doubled or tripled capacityat considerable cost. Indeed, some African countriesspend a larger proportion of their GDPs on tertiaryeducation than most rich industrial nations. However,the stock of human capital with a tertiary education islow. The average quality of that education is equally low, with most African countries at the bottom ofworld rankings, as various analysts show. In addition,tertiary educational institutions are producing workers
with skills that are irrelevant to the needs of Africa. Theunemployment rates among graduates of tertiary institu-tions are in the double digits in most African countries,while businesses are not able to find the skilled laborthey need. This suggests a mismatch between what thetertiary institutions produce and the skills that businessesdemand. This has led to massive emigration of Africangraduates of tertiary education to the developed world,effectively making African countries pay for the trainingof workers for developed countries. There are alsoquestions of gender and of geographical and socioeco-nomic equity in access, as well as cost inefficiency, intertiary educational institutions in Africa.
The low endowment and low quality of tertiaryeducation in Africa has serious implications for the continent’s development in an increasingly globalizedworld in which economic growth and development iscritically dependent on knowledge intensities of coun-tries. A workforce with abundant high-quality, relevanttertiary education may hold the key to Africa’s futuredevelopment. Although economic growth rates inAfrican countries rose dramatically in the last decade,most of that growth was the result of commodity pricebooms. It is unlikely that this commodity price–ledgrowth will be the region’s recipe for long-term growthand development. African countries may have to transi-tion very quickly from natural resource–based growth to growth that is based on knowledge.
Knowledge creation and accumulation, togetherwith a positive work ethic, is seen as the key to long-term success in economic development.9 In addition to the well-established private benefits of higher educa-tion (including better employment possibilities, highersalaries, and a greater ability to save and invest), highereducation also has a major public benefit: it enhanceseconomic development through technological catch-up.10 This idea supports the proposition that expandingtertiary education may promote faster technologicalcatch-up and improve a country’s ability to maximizeits economic output. Raising tertiary education attain-ment as well as its quality in sub-Sahara Africa willenable these countries to stimulate innovation, promotethe diversification of products and services, and maxi-mize returns from capital assets through more efficientallocation and management.11 In the face of competitionfrom South and East Asian countries, a more skill-intensive route to development could provide bothresource-rich and resource-poor countries with anavenue for raising domestic value-added. These argu-ments underscore the importance of tertiary educationfor the development of African countries.
This analysis is timely, relevant, and important forAfrica’s development for a several reasons. First, this isthe first time a comprehensive and comparative study ofhigher educational systems in African countries has beendone. At the minimum, there is the need to ensure thatAfrican countries get suitable social and private returns
40
2.1:
Ref
orm
ing
High
er E
duca
tion
The Africa Competitiveness Report 2011 © 2011 World Economic Forum, the World Bank and the African Development Bank
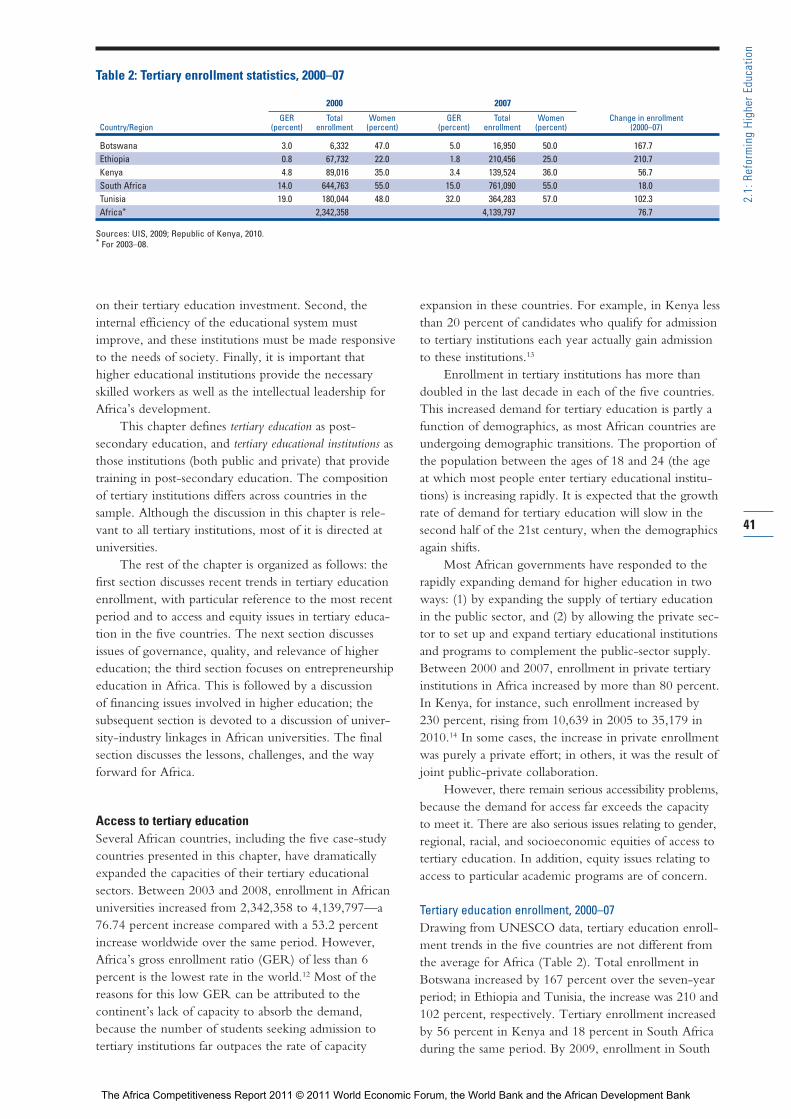
on their tertiary education investment. Second, theinternal efficiency of the educational system mustimprove, and these institutions must be made responsiveto the needs of society. Finally, it is important thathigher educational institutions provide the necessaryskilled workers as well as the intellectual leadership forAfrica’s development.
This chapter defines tertiary education as post-secondary education, and tertiary educational institutions asthose institutions (both public and private) that providetraining in post-secondary education. The compositionof tertiary institutions differs across countries in thesample. Although the discussion in this chapter is rele-vant to all tertiary institutions, most of it is directed atuniversities.
The rest of the chapter is organized as follows: thefirst section discusses recent trends in tertiary educationenrollment, with particular reference to the most recentperiod and to access and equity issues in tertiary educa-tion in the five countries. The next section discussesissues of governance, quality, and relevance of highereducation; the third section focuses on entrepreneurshipeducation in Africa. This is followed by a discussion of financing issues involved in higher education; thesubsequent section is devoted to a discussion of univer-sity-industry linkages in African universities. The finalsection discusses the lessons, challenges, and the wayforward for Africa.
Access to tertiary educationSeveral African countries, including the five case-studycountries presented in this chapter, have dramaticallyexpanded the capacities of their tertiary educational sectors. Between 2003 and 2008, enrollment in Africanuniversities increased from 2,342,358 to 4,139,797—a76.74 percent increase compared with a 53.2 percentincrease worldwide over the same period. However,Africa’s gross enrollment ratio (GER) of less than 6 percent is the lowest rate in the world.12 Most of thereasons for this low GER can be attributed to the continent’s lack of capacity to absorb the demand,because the number of students seeking admission totertiary institutions far outpaces the rate of capacity
expansion in these countries. For example, in Kenya lessthan 20 percent of candidates who qualify for admissionto tertiary institutions each year actually gain admissionto these institutions.13
Enrollment in tertiary institutions has more thandoubled in the last decade in each of the five countries.This increased demand for tertiary education is partly afunction of demographics, as most African countries areundergoing demographic transitions. The proportion ofthe population between the ages of 18 and 24 (the ageat which most people enter tertiary educational institu-tions) is increasing rapidly. It is expected that the growthrate of demand for tertiary education will slow in thesecond half of the 21st century, when the demographicsagain shifts.
Most African governments have responded to therapidly expanding demand for higher education in twoways: (1) by expanding the supply of tertiary educationin the public sector, and (2) by allowing the private sec-tor to set up and expand tertiary educational institutionsand programs to complement the public-sector supply.Between 2000 and 2007, enrollment in private tertiaryinstitutions in Africa increased by more than 80 percent.In Kenya, for instance, such enrollment increased by230 percent, rising from 10,639 in 2005 to 35,179 in2010.14 In some cases, the increase in private enrollmentwas purely a private effort; in others, it was the result ofjoint public-private collaboration.
However, there remain serious accessibility problems,because the demand for access far exceeds the capacityto meet it. There are also serious issues relating to gender,regional, racial, and socioeconomic equities of access totertiary education. In addition, equity issues relating toaccess to particular academic programs are of concern.
Tertiary education enrollment, 2000–07Drawing from UNESCO data, tertiary education enroll-ment trends in the five countries are not different fromthe average for Africa (Table 2). Total enrollment inBotswana increased by 167 percent over the seven-yearperiod; in Ethiopia and Tunisia, the increase was 210 and102 percent, respectively. Tertiary enrollment increasedby 56 percent in Kenya and 18 percent in South Africaduring the same period. By 2009, enrollment in South
41
2.1:
Ref
orm
ing
High
er E
duca
tion
Table 2: Tertiary enrollment statistics, 2000–07
2000 2007
GER Total Women GER Total Women Change in enrollmentCountry/Region (percent) enrollment (percent) (percent) enrollment (percent) (2000–07)
Botswana 3.0 6,332 47.0 5.0 16,950 50.0 167.7Ethiopia 0.8 67,732 22.0 1.8 210,456 25.0 210.7Kenya 4.8 89,016 35.0 3.4 139,524 36.0 56.7South Africa 14.0 644,763 55.0 15.0 761,090 55.0 18.0Tunisia 19.0 180,044 48.0 32.0 364,283 57.0 102.3Africa* 2,342,358 4,139,797 76.7
Sources: UIS, 2009; Republic of Kenya, 2010.* For 2003–08.
The Africa Competitiveness Report 2011 © 2011 World Economic Forum, the World Bank and the African Development Bank
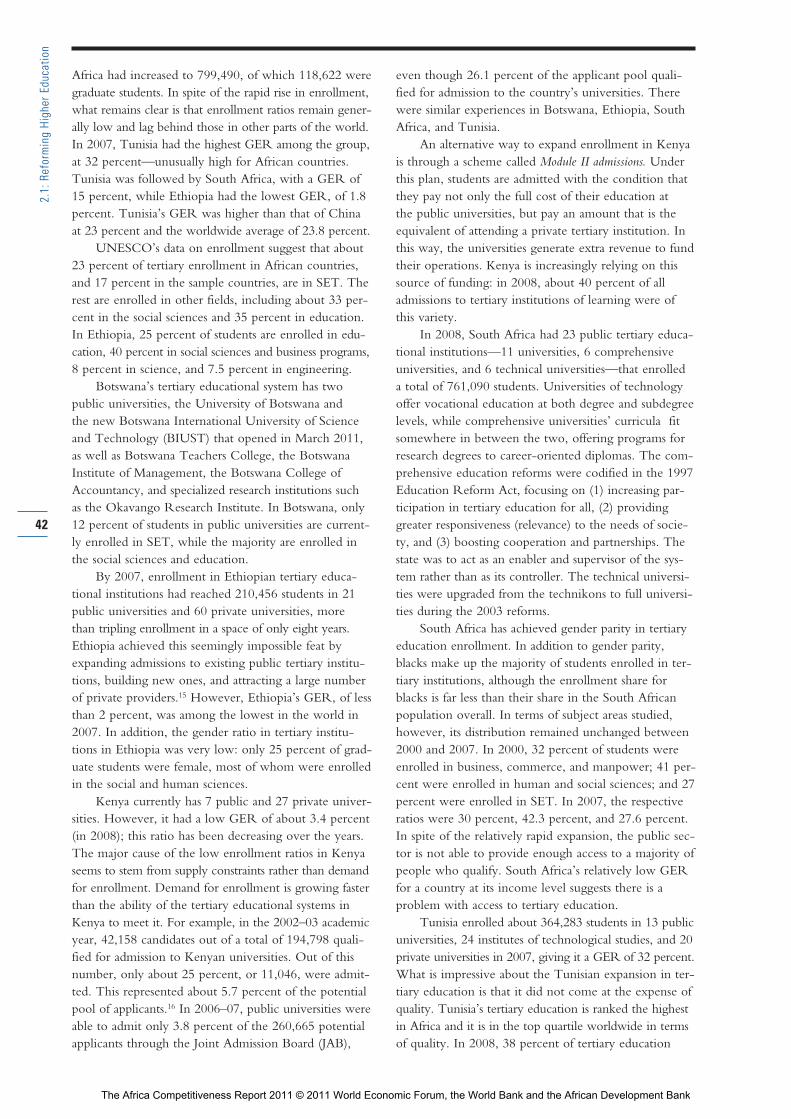
Africa had increased to 799,490, of which 118,622 weregraduate students. In spite of the rapid rise in enrollment,what remains clear is that enrollment ratios remain gener-ally low and lag behind those in other parts of the world.In 2007, Tunisia had the highest GER among the group,at 32 percent—unusually high for African countries.Tunisia was followed by South Africa, with a GER of15 percent, while Ethiopia had the lowest GER, of 1.8percent. Tunisia’s GER was higher than that of Chinaat 23 percent and the worldwide average of 23.8 percent.
UNESCO’s data on enrollment suggest that about23 percent of tertiary enrollment in African countries,and 17 percent in the sample countries, are in SET. Therest are enrolled in other fields, including about 33 per-cent in the social sciences and 35 percent in education.In Ethiopia, 25 percent of students are enrolled in edu-cation, 40 percent in social sciences and business programs,8 percent in science, and 7.5 percent in engineering.
Botswana’s tertiary educational system has two public universities, the University of Botswana and the new Botswana International University of Scienceand Technology (BIUST) that opened in March 2011, as well as Botswana Teachers College, the BotswanaInstitute of Management, the Botswana College ofAccountancy, and specialized research institutions suchas the Okavango Research Institute. In Botswana, only12 percent of students in public universities are current-ly enrolled in SET, while the majority are enrolled inthe social sciences and education.
By 2007, enrollment in Ethiopian tertiary educa-tional institutions had reached 210,456 students in 21public universities and 60 private universities, morethan tripling enrollment in a space of only eight years.Ethiopia achieved this seemingly impossible feat byexpanding admissions to existing public tertiary institu-tions, building new ones, and attracting a large numberof private providers.15 However, Ethiopia’s GER, of lessthan 2 percent, was among the lowest in the world in2007. In addition, the gender ratio in tertiary institu-tions in Ethiopia was very low: only 25 percent of grad-uate students were female, most of whom were enrolledin the social and human sciences.
Kenya currently has 7 public and 27 private univer-sities. However, it had a low GER of about 3.4 percent(in 2008); this ratio has been decreasing over the years.The major cause of the low enrollment ratios in Kenyaseems to stem from supply constraints rather than demandfor enrollment. Demand for enrollment is growing fasterthan the ability of the tertiary educational systems inKenya to meet it. For example, in the 2002–03 academicyear, 42,158 candidates out of a total of 194,798 quali-fied for admission to Kenyan universities. Out of thisnumber, only about 25 percent, or 11,046, were admit-ted. This represented about 5.7 percent of the potentialpool of applicants.16 In 2006–07, public universities wereable to admit only 3.8 percent of the 260,665 potentialapplicants through the Joint Admission Board (JAB),
even though 26.1 percent of the applicant pool quali-fied for admission to the country’s universities. Therewere similar experiences in Botswana, Ethiopia, SouthAfrica, and Tunisia.
An alternative way to expand enrollment in Kenyais through a scheme called Module II admissions. Underthis plan, students are admitted with the condition thatthey pay not only the full cost of their education at the public universities, but pay an amount that is theequivalent of attending a private tertiary institution. Inthis way, the universities generate extra revenue to fundtheir operations. Kenya is increasingly relying on thissource of funding: in 2008, about 40 percent of alladmissions to tertiary institutions of learning were ofthis variety.
In 2008, South Africa had 23 public tertiary educa-tional institutions—11 universities, 6 comprehensiveuniversities, and 6 technical universities—that enrolled a total of 761,090 students. Universities of technologyoffer vocational education at both degree and subdegreelevels, while comprehensive universities’ curricula fitsomewhere in between the two, offering programs forresearch degrees to career-oriented diplomas. The com-prehensive education reforms were codified in the 1997Education Reform Act, focusing on (1) increasing par-ticipation in tertiary education for all, (2) providinggreater responsiveness (relevance) to the needs of socie-ty, and (3) boosting cooperation and partnerships. Thestate was to act as an enabler and supervisor of the sys-tem rather than as its controller. The technical universi-ties were upgraded from the technikons to full universi-ties during the 2003 reforms.
South Africa has achieved gender parity in tertiaryeducation enrollment. In addition to gender parity,blacks make up the majority of students enrolled in ter-tiary institutions, although the enrollment share forblacks is far less than their share in the South Africanpopulation overall. In terms of subject areas studied,however, its distribution remained unchanged between2000 and 2007. In 2000, 32 percent of students wereenrolled in business, commerce, and manpower; 41 per-cent were enrolled in human and social sciences; and 27percent were enrolled in SET. In 2007, the respectiveratios were 30 percent, 42.3 percent, and 27.6 percent.In spite of the relatively rapid expansion, the public sec-tor is not able to provide enough access to a majority ofpeople who qualify. South Africa’s relatively low GERfor a country at its income level suggests there is aproblem with access to tertiary education.
Tunisia enrolled about 364,283 students in 13 publicuniversities, 24 institutes of technological studies, and 20private universities in 2007, giving it a GER of 32 percent.What is impressive about the Tunisian expansion in ter-tiary education is that it did not come at the expense ofquality. Tunisia’s tertiary education is ranked the highestin Africa and it is in the top quartile worldwide in termsof quality. In 2008, 38 percent of tertiary education
42
2.1:
Ref
orm
ing
High
er E
duca
tion
The Africa Competitiveness Report 2011 © 2011 World Economic Forum, the World Bank and the African Development Bank
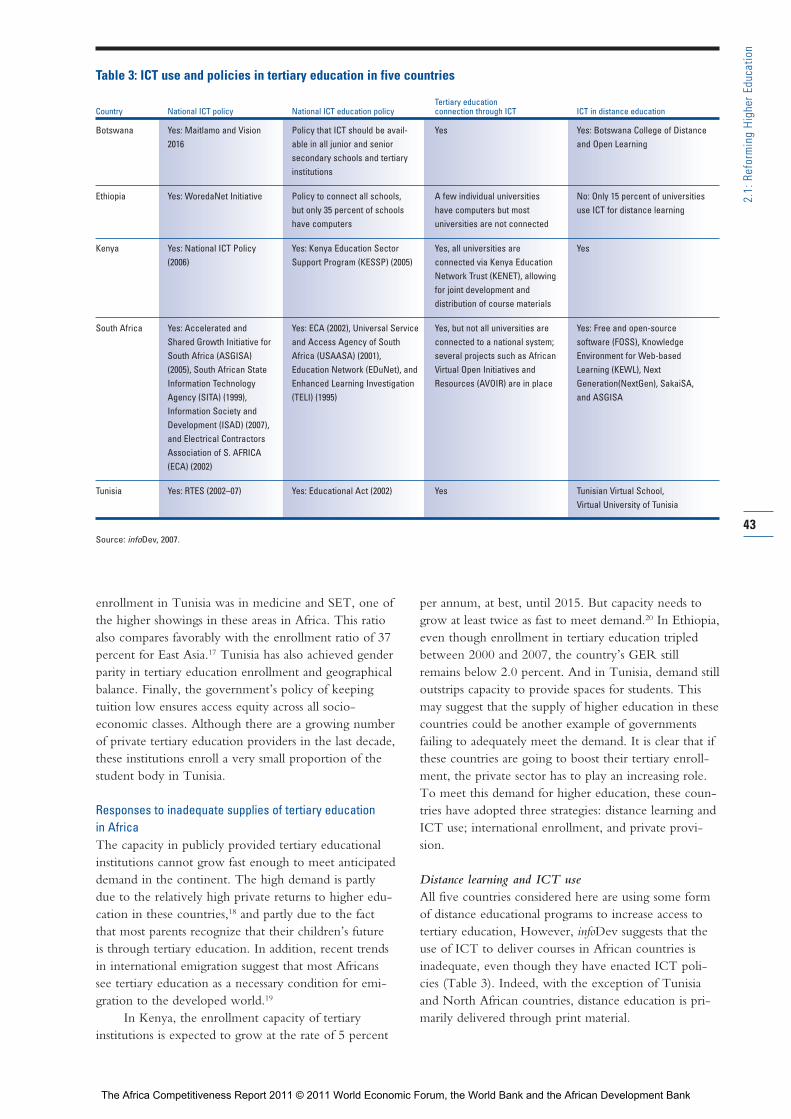
Table 3: ICT use and policies in tertiary education in five countries
Tertiary education Country National ICT policy National ICT education policy connection through ICT ICT in distance education
Botswana Yes: Maitlamo and Vision Policy that ICT should be avail- Yes Yes: Botswana College of Distance2016 able in all junior and senior and Open Learning
secondary schools and tertiary institutions
Ethiopia Yes: WoredaNet Initiative Policy to connect all schools, A few individual universities No: Only 15 percent of universities but only 35 percent of schools have computers but most use ICT for distance learninghave computers universities are not connected
Kenya Yes: National ICT Policy Yes: Kenya Education Sector Yes, all universities are Yes(2006) Support Program (KESSP) (2005) connected via Kenya Education
Network Trust (KENET), allowing for joint development and distribution of course materials
South Africa Yes: Accelerated and Yes: ECA (2002), Universal Service Yes, but not all universities are Yes: Free and open-source Shared Growth Initiative for and Access Agency of South connected to a national system; software (FOSS), Knowledge South Africa (ASGISA) Africa (USAASA) (2001), several projects such as African Environment for Web-based (2005), South African State Education Network (EDuNet), and Virtual Open Initiatives and Learning (KEWL), Next Information Technology Enhanced Learning Investigation Resources (AVOIR) are in place Generation(NextGen), SakaiSA, Agency (SITA) (1999), (TELI) (1995) and ASGISAInformation Society and Development (ISAD) (2007), and Electrical Contractors Association of S. AFRICA (ECA) (2002)
Tunisia Yes: RTES (2002–07) Yes: Educational Act (2002) Yes Tunisian Virtual School, Virtual University of Tunisia
Source: infoDev, 2007.
enrollment in Tunisia was in medicine and SET, one ofthe higher showings in these areas in Africa. This ratioalso compares favorably with the enrollment ratio of 37percent for East Asia.17 Tunisia has also achieved genderparity in tertiary education enrollment and geographicalbalance. Finally, the government’s policy of keepingtuition low ensures access equity across all socio -economic classes. Although there are a growing numberof private tertiary education providers in the last decade,these institutions enroll a very small proportion of thestudent body in Tunisia.
Responses to inadequate supplies of tertiary education in AfricaThe capacity in publicly provided tertiary educationalinstitutions cannot grow fast enough to meet anticipateddemand in the continent. The high demand is partlydue to the relatively high private returns to higher edu-cation in these countries,18 and partly due to the factthat most parents recognize that their children’s future is through tertiary education. In addition, recent trendsin international emigration suggest that most Africanssee tertiary education as a necessary condition for emi-gration to the developed world.19
In Kenya, the enrollment capacity of tertiary institutions is expected to grow at the rate of 5 percent
per annum, at best, until 2015. But capacity needs togrow at least twice as fast to meet demand.20 In Ethiopia,even though enrollment in tertiary education tripledbetween 2000 and 2007, the country’s GER stillremains below 2.0 percent. And in Tunisia, demand stilloutstrips capacity to provide spaces for students. Thismay suggest that the supply of higher education in thesecountries could be another example of governmentsfailing to adequately meet the demand. It is clear that ifthese countries are going to boost their tertiary enroll-ment, the private sector has to play an increasing role.To meet this demand for higher education, these coun-tries have adopted three strategies: distance learning andICT use; international enrollment, and private provi-sion.
Distance learning and ICT useAll five countries considered here are using some formof distance educational programs to increase access totertiary education, However, infoDev suggests that theuse of ICT to deliver courses in African countries isinadequate, even though they have enacted ICT poli-cies (Table 3). Indeed, with the exception of Tunisiaand North African countries, distance education is pri-marily delivered through print material.
43
2.1:
Ref
orm
ing
High
er E
duca
tion
The Africa Competitiveness Report 2011 © 2011 World Economic Forum, the World Bank and the African Development Bank
International enrollmentWealthy families in the five countries have been able to send their dependents abroad for tertiary education.For example, in 2004, about 14,123 Kenyan studentswere studying in universities based in Organisation forEconomic Co-operation and Development (OECD)countries and not Kenyan universities—this is equiva-lent to about 13 percent of all tertiary education studentsin Kenya. South Africa had about 5,619 students inOECD universities, representing 0.8 percent of SouthAfrican university students. Similarly, a large number ofstudents from Botswana, Ethiopia, and Tunisia, especiallyat the graduate level, were studying in European univer-sities. For most families with modest incomes, it may beimpossible to afford university education outside theircountries of origin short of a scholarship offer fromtheir government or from foreign organizations. Clearly,tertiary education outside Africa or out of a student’scountry of residence represents a relatively small fractionof the tertiary education enrollments in these countries.
Private provisionFrom a small number of institutions at the beginning ofthe 1990s, private tertiary institutions have increasedrapidly to fill the unmet demand. These private universitiesare either branches of well-established universities fromthe developed world that provide specific programs inAfrican countries or completely independent institutionsestablished in Africa. They tend to be relatively small,offering a limited range of courses and programs—such as those in business administration, technology,and nursing—that are in high demand. They focusmainly on instruction, with little emphasis on research.An important characteristic of these private universitiesis that they charge enough in tuition and fees to, at aminimum, fully cover the cost of the education theyprovide. These private universities operate with theencouragement of governments, which see them as away to relieve pressure on the public universities.21
Bjarnason et al. provide three typologies of privatesuppliers of tertiary education: elite, religious, anddemand absorbing.22 Elite private-sector providers referto world-class academic leadership, which is generallylimited to academic institutions in the United States. Atbest, private tertiary institutions in Africa are semi-elite,with an emphasis on good teaching and very littleresearch. They are mainly in business-related fields,focusing on business administration curricula, and oftenhave ties to foreign universities.
Religious providers, such as those affiliated withchurches and other religious institutions, tend to be nonprofit-oriented institutions but are set up to generally spread the ideology of the religion. By far the largest and the fastest-growing portion of privateproviders of higher education in Africa can be charac-terized as demand absorbing. They are market driven, areentrepreneurial in their approach, provide small niche
programs, are careful to minimize cost, and do not gen-erally have large overhead such as physical infrastructureand extensive student support services. In most cases,they charge “market-rate” tuition.
A major concern with the private provision of tertiary education in some of these countries has beenone of quality control. It is believed that, because of lack of strong administrative and quality controls, fly-by-night providers are able to set up shop in Africancountries, provide substandard degree programs in areasthat are in high demand, and charge exorbitant fees.23
The solution to these perceived or real quality problemslies in the regulation and governance of private higher-education providers. In South Africa, where private tertiary institutions are required to receive certificationbefore they offer any classes and where institutionsreceiving authorization are subject to review a year later, substandard private-sector tertiary education is lesslikely to be a problem than it is in countries that take a hands-off approach to tertiary education.
Botswana has 10 private universities that enrollabout 20 percent of the country’s higher-education students, and 2 public universities with 80 percent of the students. A 2008 White Paper on Higher Educationenvisages increasing the GER to 17 percent by 2016and ultimately to 25 percent by 2026.24 Botswana seesprivate universities as playing a key role in this expansion.Its private universities—such as Linkokwing Universityof Creative Technologies (a branch campus of anIndonesian university), NIIT, ABM University College,and Ba Isago University College—provide niche pro-grams in emerging skill needs such as ICT and businessadministration, among others. These institutions are for-profit and tend to be branch campuses of foreignuniversities. An interesting aspect of private provision in Botswana is the joint public-private collaboration inwhich the government subsidizes private tertiary educa-tion. In addition, the government pays for students’tuition costs at private tertiary institutions.
Ethiopia has aggressively pursued private highereducational institutions since 1990. There are currentlyover 60 private tertiary educational institutions, enrollingabout 17 percent of students. These institutions areeither operated as foreign branches of well-establishedEuropean, American, or other OECD universities orfor-profit independent private institutions. Most ofthese institutions are small and provide programs in oneor two areas of concentration—mostly in business, nurs-ing, and ICT—where market demand is very strongand highly related to labor market needs.
Kenya currently has 34 universities, of which 7 are public and 27 private. In 2009, the private sectorenrolled about 22 percent of the student population.This compares with an enrollment ratio of just over 13 percent in 2004, suggesting that enrollment in theprivate sector grew much faster than in the public sector. Private tertiary institutions tend to concentrate
44
2.1:
Ref
orm
ing
High
er E
duca
tion
The Africa Competitiveness Report 2011 © 2011 World Economic Forum, the World Bank and the African Development Bank
on providing programs in specific niche areas. Forexample, Kiriri Women’s University of Science andTechnology provides science and technology programsfor women, Strathmore University focuses on ICT andbusiness management, and Aga Khan University offersadvanced nursing and medicine programs.
There were about 103 private tertiary institutionsin South Africa in 2008, which together enrolled lessthan 10 percent of the tertiary-level students in thatyear. These institutions are relatively small, with enroll-ments ranging from under 1,000 to 20,000 students,and offer a small range of programs. Unlike their coun-terparts elsewhere, these institutions are not establishedin response to excess demand in the public sector butrather were set up to offer particular programs—such as business, theology, ICT, health, beauty, and fash-ion—not offered by public tertiary institutions. In 2008,these institutions were very much concentrated in a fewstates in South Africa: 93 percent were concentrated inonly three states—Gauteng (54 percent), Western Cape(21 percent), and Kwazulu-Natal (17 percent).
In 2008, there were about 20 private tertiary educational institutions in Tunisia, which enrolled lessthan 1 percent of the total number of students in pro-grams of higher education. They offer training in areassuch as technology, where demand exceeds supply inpublic institutions. Although the private sector currentlyplays an insignificant role in Tunisian tertiary education,the government anticipates that its role will increase inthe future because it is providing incentives to privateproviders. Public-private collaboration in the provisionof tertiary education in Tunisia takes several forms,including government subsidy for private tertiary educa-tional institutions. The government pays the tuition ofstudents who go to private tertiary institutions, providesland and subsidized capital construction (up to 25 per-cent of the cost of construction), provides subsidies forutilities, and pays some of the salaries of faculty for upto 10 years of the establishment of the institutions.
Equity of access to tertiary educationIssues associated with gender inequity, regional differ-ences in admission, and different groups enrolling inparticular subjects, as well as differences in enrollmentaccording to race and socioeconomic class, are also ofconcern. In 2000, of the five countries only SouthAfrica had achieved gender parity, with women consti-tuting 55 percent of university enrollment. By 2007,Botswana and Tunisia had also achieved gender parityin university enrollment, while, to date, Ethiopia andKenya still remain behind although both are makingprogress in this area (Table 2). Gender inequities alsomanifest itself in fields of study: women generally tendto be under-represented in SET and mathematics, whilethey tend to be over-represented in liberal arts andsocial sciences. Kenya’s educational plans envisionachieving gender parity through a variety of policy
approaches, including affirmative action and quotas. Inall five countries the female/male enrollment ratio ismuch higher in private than in public tertiary institu-tions. This may in part reflect the fact that private insti-tutions tend to enroll more students in social sciences,business, technology-related fields, and the humanitiesthan in the natural and laboratory sciences.
Another dimension of access inequity is related togeography and socioeconomic status. Often, becauseadmission is based strictly on performance in nationalexaminations, admission to universities tends to beskewed toward households with higher incomes andsocial connections that can afford to send their childrento the best secondary schools. Although the reliance on national examination results usually ensures higheracademic standards from incoming students, this processtends to discriminate against students from rural andpoorer regions of a country where secondary schoolstend to be of lower quality on account of poor resourceinputs. In Kenya, for example, in 2005 only 3.2 percentof students from the Coast Province met the minimumqualification for admission to a university, comparedwith 21.6 percent from Central Province. In Ethiopia,similar patterns exist between rural and urban areas,especially between Addis Ababa and other parts of thecountry. In South Africa, there is a concentration oftertiary educational institutions in Gauteng, Eastern andWestern Cape, and Kwazulu-Natal Provinces, whilesuch institutions in other provinces are very sparse. Thisinequity has implications for regional differences inenrollment in tertiary institutions.
These regional inequalities in access are exacerbatedby regional differences in income and wealth becausewealthier regions and districts tend to have the best secondary schools. The introduction of self-sponsorshipadmissions (full fee-paying admissions) into public terti-ary institutions increases the access inequality based onsocioeconomic status because students from poorerbackgrounds are less likely to be able to pay full tuitionfor their tertiary education in either public or privateinstitutions.
In addition, not all races have equal access to terti-ary education in Africa. This is especially the case inSouth Africa, where the apartheid regime systematicallyrestricted access to tertiary education for the majorityblack population as well as other non-white citizens.While the education reforms of 1997 attempted toaddress this inequality, racial inequality in enrollmentseems to persist. In 2008, blacks—who constitute 79percent of the South African population—made up 63percent of students enrolled in tertiary institutions; onthe other hand, whites—who constituted 10 percent ofthe population—made up 24 percent of tertiary schoolenrollment. Moreover, whites comprised 34 percent ofall university students while blacks made up 50 percent,but white enrollment in technical universities was ashigh as 77 percent.
45
2.1:
Ref
orm
ing
High
er E
duca
tion
The Africa Competitiveness Report 2011 © 2011 World Economic Forum, the World Bank and the African Development Bank
The current structure of enrollment by field ofstudy suggests that South African blacks tend to enrollin less prestigious tertiary institutions. There are alsowide variations in the racial composition of students indifferent fields of study. Blacks make up 60 percent of all SET enrollment, while whites make up 26 percent;and 78 percent of enrolled students in education areblack, while only 15 percent are white. This situation has implications for the future racial composition of the skilled workforce in South Africa.
Other accessibility issues: Entry pathways, differentiation,and articulationOther issues of access to tertiary education in all the fivecountries include different pathways of entry to tertiaryeducation, differentiation, and articulation. Thereappear to be no generally systematic policies in thesecountries to facilitate the admission of older students(those older than the prime college-attending age of19–24 years). However, some tertiary educational sys-tems have recognized this issue and are developing poli-cies to ease this problem. For example, Kenya’s newHigher Education Policy recognizes this need and isproviding pathways for older students to access tertiaryeducation, particularly through its Module II programs.
Other issues impinging on access are differentiationand articulation in the tertiary educational systems.Differentiation refers to the emergence of distinct types of tertiary educational institutions in response to acountry’s need for different types of skills; articulation is a mechanism that allows students to move from onetype of institution to another type, or to move laterallyamong the same type of institutions across geographicallocations. In theory, different institutions at the samelevel are supposed to specialize in different areas in orderto meet the needs of a country. After all, differentiationis supposed to allow universities to specialize and thusincrease efficiency and innovation in the areas they havechosen. In most of the five countries, institutions are setup to provide differentiation; in some, such as Kenya,South African, and Tunisia, there is also evidence ofcourse differentiation. However, as institutions begin toprovide programs in “hot areas,” they seem to encroachon each other’s territory. The result is a gradual erosionof the element of differentiation between institutions.
Governance, quality, and relevanceRapidly expanding enrollment in tertiary educationalinstitutions in these countries has raised concerns about the governance, efficiency, quality, and relevanceof tertiary education for the countries’ developmentneeds. There is a perception that these institutions areinefficient and produce relatively low-quality graduateswith skills that are not very relevant for the labor mar-ket. For example, although there is a shortage of skilledlabor in these countries, there is also evidence of both
open and disguised unemployment of graduates of tertiaryinstitutions.
The quality of output/service is partly a function ofthe quality of inputs, including managerial inputs andthe environment in which production takes place. Inputquality and a better environment are necessary, but theymay not be sufficient conditions to achieve a higher-quality output. The critical inputs include the physicaland social infrastructures—such as classrooms, offices,laboratories, library facilities, and student expectations—along with a well-qualified and motivated faculty andsupport staff; high-quality, motivated students; and acompetent and forward-looking visionary administra-tion. All these should be combined with the appropriatepolitical and financial support that sets out what out-comes are expected, what incentives will be given toachieve them, and what the consequences are for failingto achieve those objectives.
GovernanceThe productivity of the tertiary educational sector, itsefficiency, and the quality of its output as well as the relevance of its curricula are intimately related to the sector’s governance structure. Governance provides theinstitutional environment within which the educationalenterprise functions. Efficiency in both system gover-nance and institutional governance is necessary for theeducational system to produce the desired results. Thisrequires accountability and transparency, neither ofwhich can be possible without the autonomy of highereducational institutions. Autonomy implies freedom tomake management decisions, such as allocatingresources among programs and determining the optimalinput combination.
Good governance includes promoting quality,responsiveness, transparency, and accountability in thesector as well as providing it with appropriate standards,incentives, and information. Tertiary education gover-nance in these countries is a tricky business. On the one hand, the need to produce skilled labor to meetdevelopment needs, the amount of public resourcesdevoted to providing tertiary education, and the politi-cal power that students in tertiary educational institu-tions wield may suggest the need for the government’scentral control of these institutions. On the other hand,the need for academic freedom, the freedom to inno-vate in both teaching and research, to achieve efficiencygenerally, and the ability to respond to changing envi-ronments suggests that these institutions should be freefrom political control as much as possible if they are to succeed. The governance structure of tertiaryinstitutions that emerges in any country is the result of a balance between these contrasting forces. While somecountries set up structures that allow for the centralgovernment’s direct control of structures, others set upbuffers between the political administration and thegovernance system (Table 4).
46
2.1:
Ref
orm
ing
High
er E
duca
tion
The Africa Competitiveness Report 2011 © 2011 World Economic Forum, the World Bank and the African Development Bank
Table 4: Governance and quality assurance bodies in higher education in the five countries
Country Highest governance body Relevant legislation Accrediting body Relevant legislation
Botswana Tertiary Education Council Tertiary Education Act (1999) Tertiary Education Council Tertiary Education Council (1999)
Ethiopia Ministry of Education Higher Education Higher Education Relevance Higher Education Proclamation (2003) and Quality Agency (HERQA) Proclamation (2003)
(2003)
Kenya Commission for Higher Universities Act (1985) Commission for Higher Universities Act (1985)Education Education
South Africa National Council Higher Education Act (1997) Higher Education Higher Education Act (1997)on Higher Education Qualification Council (HEQC)
Tunisia Ministry of Higher Higher Educational n/a n/aEducation and Research Framework (1989), Law 4 (2008)
Source: Ng’ethe et al., 2008.Note: n/a means not available.
Table 5: Composition of membership on buffer governing boards
Academic Private Country Administration representative Students Government sector Undefined Total
Botswana 2 1 1 5 3 2 14
Ethiopia n/a n/a n/a n/a n/a n/a n/a
Kenya n/a n/a n/a 21–25 n/a 3 24–28
South Africa n/a n/a n/a n/a n/a 17 17
Tunisia n/a n/a n/a All n/a n/a n/a
Source: Saint et al., 2009.Note: n/a means not available.
Table 4 shows the highest governance bodies(external) and the relevant legislation that establishedthese bodies, and quality assurance agencies with theappropriate legislation that established them. In addition,there are internal governance bodies that are chargedwith the day-to-day administration of the universities—dealing with academic issues as well the hiring (and firing) of university staff, finance, different academic disciplines, and other aspects of tertiary education gov-ernance. The differences in the structures of governanceacross the five countries are based largely on the degreeto which the political system has direct control of thedecision-making process in higher education.
Table 5 shows the composition of buffer governingboards in the five countries. In general, there is a mix ofinternal and external members on these boards, with mostcountries trying to strike a balance between internal andexternal membership. However, in some cases—such asSouth Africa—it is not clear how membership on theseboards is determined. Another aspect of governanceauthority is who appoints the chair and members ofthese boards. In Botswana and Kenya, the head of state (who is the chancellor of the university) and the
minister of education appoint the chair; in South Africa,the chair and membership of this governing board areappointed based on a stakeholder representation formulastipulated by law.
The appointment of internal administrators of univer-sities also differs across countries. For example, inKenya, the chief operating officer is appointed on acompetitive basis, the university board appoints thechief officer’s deputies, and the deans are elected by staffwhile department heads are appointed by the vice chan-cellor. In South Africa, on the other hand, the boardappoints the chancellor and all senior management,including deans (but not department chairs).
Quality assuranceThe quality of a tertiary educational system is multi-dimensional, since tertiary institutions are multi-outputproducers—of teaching, research, and service, amongother outputs. An institution may excel in one or twodimensions but not in others. Similarly, evaluating thequality of a tertiary educational system is very difficultbecause different evaluators may emphasize differentaspects of quality; hence they will rank the same
47
2.1:
Ref
orm
ing
High
er E
duca
tion
The Africa Competitiveness Report 2011 © 2011 World Economic Forum, the World Bank and the African Development Bank
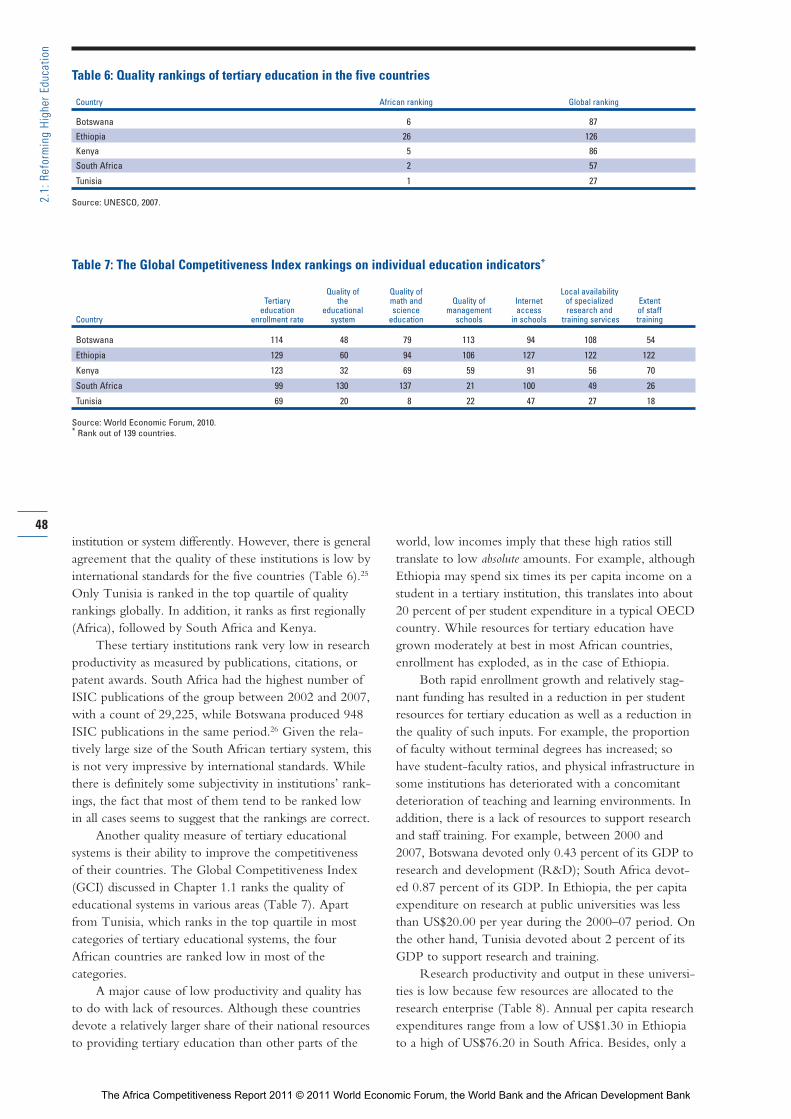
institution or system differently. However, there is generalagreement that the quality of these institutions is low byinternational standards for the five countries (Table 6).25
Only Tunisia is ranked in the top quartile of qualityrankings globally. In addition, it ranks as first regionally(Africa), followed by South Africa and Kenya.
These tertiary institutions rank very low in researchproductivity as measured by publications, citations, orpatent awards. South Africa had the highest number ofISIC publications of the group between 2002 and 2007,with a count of 29,225, while Botswana produced 948ISIC publications in the same period.26 Given the rela-tively large size of the South African tertiary system, thisis not very impressive by international standards. Whilethere is definitely some subjectivity in institutions’ rank-ings, the fact that most of them tend to be ranked lowin all cases seems to suggest that the rankings are correct.
Another quality measure of tertiary educational systems is their ability to improve the competitiveness of their countries. The Global Competitiveness Index(GCI) discussed in Chapter 1.1 ranks the quality of educational systems in various areas (Table 7). Apartfrom Tunisia, which ranks in the top quartile in mostcategories of tertiary educational systems, the fourAfrican countries are ranked low in most of the categories.
A major cause of low productivity and quality hasto do with lack of resources. Although these countriesdevote a relatively larger share of their national resourcesto providing tertiary education than other parts of the
world, low incomes imply that these high ratios stilltranslate to low absolute amounts. For example, althoughEthiopia may spend six times its per capita income on astudent in a tertiary institution, this translates into about20 percent of per student expenditure in a typical OECDcountry. While resources for tertiary education havegrown moderately at best in most African countries,enrollment has exploded, as in the case of Ethiopia.
Both rapid enrollment growth and relatively stag-nant funding has resulted in a reduction in per studentresources for tertiary education as well as a reduction inthe quality of such inputs. For example, the proportionof faculty without terminal degrees has increased; sohave student-faculty ratios, and physical infrastructure insome institutions has deteriorated with a concomitantdeterioration of teaching and learning environments. Inaddition, there is a lack of resources to support researchand staff training. For example, between 2000 and2007, Botswana devoted only 0.43 percent of its GDP toresearch and development (R&D); South Africa devot -ed 0.87 percent of its GDP. In Ethiopia, the per capitaexpenditure on research at public universities was lessthan US$20.00 per year during the 2000–07 period. Onthe other hand, Tunisia devoted about 2 percent of itsGDP to support research and training.
Research productivity and output in these universi-ties is low because few resources are allocated to theresearch enterprise (Table 8). Annual per capita researchexpenditures range from a low of US$1.30 in Ethiopiato a high of US$76.20 in South Africa. Besides, only a
48
2.1:
Ref
orm
ing
High
er E
duca
tion
Table 6: Quality rankings of tertiary education in the five countries
Country African ranking Global ranking
Botswana 6 87
Ethiopia 26 126
Kenya 5 86
South Africa 2 57
Tunisia 1 27
Source: UNESCO, 2007.
Table 7: The Global Competitiveness Index rankings on individual education indicators*
Quality of Quality of Local availabilityTertiary the math and Quality of Internet of specialized Extent
education educational science management access research and of staff Country enrollment rate system education schools in schools training services training
Botswana 114 48 79 113 94 108 54
Ethiopia 129 60 94 106 127 122 122
Kenya 123 32 69 59 91 56 70
South Africa 99 130 137 21 100 49 26
Tunisia 69 20 8 22 47 27 18
Source: World Economic Forum, 2010.* Rank out of 139 countries.
The Africa Competitiveness Report 2011 © 2011 World Economic Forum, the World Bank and the African Development Bank
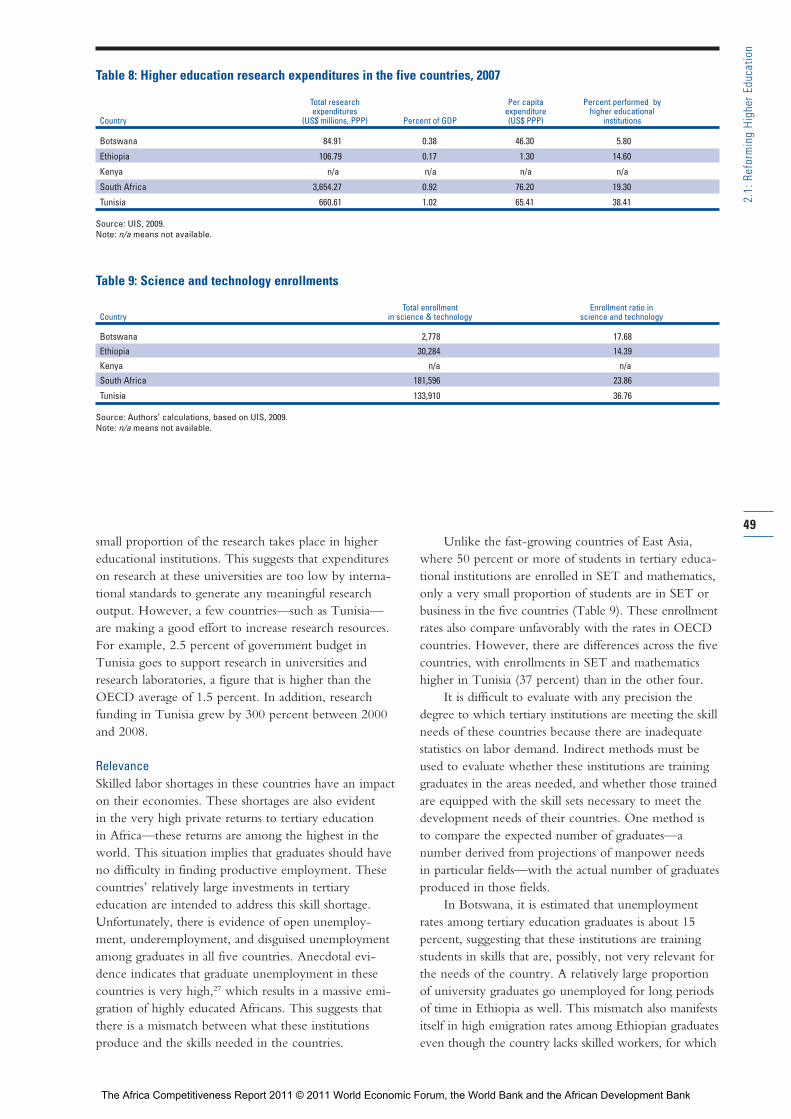
small proportion of the research takes place in highereducational institutions. This suggests that expenditureson research at these universities are too low by interna-tional standards to generate any meaningful researchoutput. However, a few countries—such as Tunisia—are making a good effort to increase research resources.For example, 2.5 percent of government budget inTunisia goes to support research in universities andresearch laboratories, a figure that is higher than theOECD average of 1.5 percent. In addition, researchfunding in Tunisia grew by 300 percent between 2000and 2008.
RelevanceSkilled labor shortages in these countries have an impacton their economies. These shortages are also evident in the very high private returns to tertiary education in Africa—these returns are among the highest in theworld. This situation implies that graduates should haveno difficulty in finding productive employment. Thesecountries’ relatively large investments in tertiary education are intended to address this skill shortage.Unfortunately, there is evidence of open unemploy-ment, underemployment, and disguised unemploymentamong graduates in all five countries. Anecdotal evi-dence indicates that graduate unemployment in thesecountries is very high,27 which results in a massive emi-gration of highly educated Africans. This suggests thatthere is a mismatch between what these institutionsproduce and the skills needed in the countries.
Unlike the fast-growing countries of East Asia,where 50 percent or more of students in tertiary educa-tional institutions are enrolled in SET and mathematics,only a very small proportion of students are in SET orbusiness in the five countries (Table 9). These enrollmentrates also compare unfavorably with the rates in OECDcountries. However, there are differences across the fivecountries, with enrollments in SET and mathematicshigher in Tunisia (37 percent) than in the other four.
It is difficult to evaluate with any precision thedegree to which tertiary institutions are meeting the skillneeds of these countries because there are inadequatestatistics on labor demand. Indirect methods must beused to evaluate whether these institutions are traininggraduates in the areas needed, and whether those trainedare equipped with the skill sets necessary to meet thedevelopment needs of their countries. One method is to compare the expected number of graduates—a number derived from projections of manpower needs in particular fields—with the actual number of graduatesproduced in those fields.
In Botswana, it is estimated that unemploymentrates among tertiary education graduates is about 15percent, suggesting that these institutions are trainingstudents in skills that are, possibly, not very relevant forthe needs of the country. A relatively large proportion of university graduates go unemployed for long periodsof time in Ethiopia as well. This mismatch also manifestsitself in high emigration rates among Ethiopian graduateseven though the country lacks skilled workers, for which
49
2.1:
Ref
orm
ing
High
er E
duca
tion
Table 8: Higher education research expenditures in the five countries, 2007
Total research Per capita Percent performed by expenditures expenditure higher educational
Country (US$ millions, PPP) Percent of GDP (US$ PPP) institutions
Botswana 84.91 0.38 46.30 5.80
Ethiopia 106.79 0.17 1.30 14.60
Kenya n/a n/a n/a n/a
South Africa 3,654.27 0.92 76.20 19.30
Tunisia 660.61 1.02 65.41 38.41
Source: UIS, 2009.Note: n/a means not available.
Table 9: Science and technology enrollments
Total enrollment Enrollment ratio inCountry in science & technology science and technology
Botswana 2,778 17.68
Ethiopia 30,284 14.39
Kenya n/a n/a
South Africa 181,596 23.86
Tunisia 133,910 36.76
Source: Authors’ calculations, based on UIS, 2009.Note: n/a means not available.
The Africa Competitiveness Report 2011 © 2011 World Economic Forum, the World Bank and the African Development Bank
it heavily relies on technical aid. In Kenya, too, thereappears to be a mismatch between industry skill needsand those possessed by university graduates.
The number of SET and business graduates pro-duced by the system in South Africa between 2003 and 2007 fell below what was expected by the Councilon Higher Education (CHE), while the number ofgraduates produced in the social and human sciencesexceeded the numbers expected in these fields. Thismay suggest that the South African system is not meet-ing the needs of the economy given that it is not pro-ducing an appropriate mix of skilled workers as envis-aged by the CHE. Although there are no serious overallshortages of skilled labor in the country, there are seri-ous shortages of skilled South Africans in critical areas ofSET that the system is not able to fill. South Africa hashad to rely on labor imports to meet demands in these critical areas.
It is estimated that unemployment rates amongTunisian tertiary education graduates is about 19 per-cent, even though it leads African countries in enrollingstudents in SET and mathematics and produces high-quality graduates. This has led to high rates of emigra-tion of these graduates, especially to OECD countries.This situation led the government to adopt the strategyof linking education to technical innovation by estab-lishing technology parks. However, it is important totake cognizance of the recent events in Tunisia andother North African countries that have led to revolu-tions in these countries (see Box 1), a situation arisingmainly from high graduate unemployment and thecountries’ inability to create adequate jobs and sharedgrowth in their economies.
Several reasons may account for why tertiary edu-cation in the five countries is generally of poor qualityand less relevant to their needs. These include eachcountry’s particular history, slow economic growth,labor market policies, a lack of university-industry link-ages (UILs), resource constraints, and the inability ofthese institutions to change and adapt curricula andpedagogy to the changing skill needs of the economybecause of inflexible governance and managementstructures. Most of these countries (possibly excludingEthiopia) inherited educational systems that were eithergeared toward colonial administration and thereforestressed medium-level administrative clerical skills ratherthan problem-solving skills, or they were geared towardensuring racial segregation (South Africa). The educa-tional system therefore focused on social sciences andthe humanities, and a pedagogy based on what is writ-ten in books rather than a focus on SET-based, practicalproblem-solving pedagogy. The skill sets developed inthese institutions may be less appropriate for thesecountries’ development needs in an increasingly global-ized world that depends on knowledge-intensive pro-duction. Unfortunately, most of these countries have
not been able to restructure and change their educa-tional systems to meet their development needs.
These economies have not grown fast enough toabsorb the growing supply of graduates. The rapid economic growth of some countries has been based onnatural resource extraction, which tends to demand fewskilled workers. For the most part, growth has not beena shared and job-creating growth. In addition, partlybecause of labor market policies that compensate gradu-ates equally, regardless of the skill shortages in differentfields and without regard to the marginal productivity of labor, there is no incentive for students to enroll inneeded fields such as SET. Also, because of the possibili-ty of emigration when a student graduates, studentsthink of their degrees as “passports” for emigration to adeveloped country.
On the supply side, governments do not discrimi-nate in terms of which subject areas are financed. Oncestudents are accepted to a university, the governmentsubsidy tends to be the same for each student withoutregard to the subjects studied. One of the major weak-nesses of tertiary education in these countries is theinflexibility and static nature of the programs offered.Instead of expanding areas that are in demand and contracting or eliminating areas that are not, the univer-sities continue to offer programs that may be of littlerelevance. Students are forced into existing programofferings and, once admitted into a program, are seldomallowed to transfer to another one. In this way dyingprograms are kept alive while the expansion of neededprograms is thwarted. The universities have moldedtheir teaching and research agendas on the “high stan-dards” of OECD countries focusing on niche areas.While this may be important in bringing fame to theresearcher, specialization in a very narrow niche may beof little relevance to the needs of the country.
One of the major reasons that the universities tendto educate and produce a labor force whose skill sets are not needed is that there are few linkages betweenuniversities and industry in these countries, and also the private sector is inadequately developed in most of them. Often industry has no idea what the curriculain universities are, is never asked for inputs in trainingprograms, and faculty research is unrelated to what busi-nesses are doing. Businesses, on the other hand, havecome to see universities as isolated islands of academic“pomposity” where academics do not to work with the industry and therefore are never approached to helpsolve real industry problems. While most of these coun-tries pay lip service to UILs, it will take serious nationalefforts at nurturing this linkage: it is not likely to groworganically on its own in the current economic andsocial climate.
Tertiary institutions generally train people for thefuture, and hence the way they train students should bein anticipation of the future labor and research needs of the country. In this regard, manpower planning by
50
2.1:
Ref
orm
ing
High
er E
duca
tion
The Africa Competitiveness Report 2011 © 2011 World Economic Forum, the World Bank and the African Development Bank
51
2.1:
Ref
orm
ing
High
er E
duca
tion
The recent political events have changed the political land-scape of the North Africa region and have had a potentialimpact on the economic performance of the region. Tunisia has been the catalyst for the current Arab unrest. With a well-educated—to the tertiary level—population, it was preciselythese unemployed graduates who took to the streets of Tunis,leading to the turbulence. It is interesting that the currentevents were sparked by a Tunisian graduate—who could not find work and took to selling fruit and vegetables from a cart that was demolished by local authorities, leading to hisself-immolation. With no jobs and no prospects, the future wasdismal for these graduates. The political upheavals in thesecountries call for governments to address issues related to thequality and relevance of education, to skills development andapprenticeship training, and to job-creating economic growth.
Tunisia has persistently high unemployment rates. Forinstance, in 2007, young people (aged 15–24) had the highestunemployment rates in the nation, exceeding 30 percent; theserates were gender neutral. On the other hand, unemploymentrates for the age groups 25–34 and 35–44, as well as the overallunemployment rate, were higher for women.
In fact, the persistently high unemployment rates amongthe educated seems to be a general feature of labor markets inNorth African countries, suggesting that there is a persistentmismatch between the demands of the economy and skillsoffered by recent university graduates. The unemployment ratefor those with a tertiary education (19 percent) is much higherthan the average rate of 14.1 percent. The second-highest rate
(which is also higher than the country’s average rate) is found among those with a secondary education. A similar picture of the unemployment rates is revealed in Algeria, Egypt, and Morocco.
Unemployment rates in Tunisia have been high for manyyears now, but the composition of unemployment by level of education has changed dramatically over the past twodecades. For example, in 1994, the total unemployment rate was 15.8 percent, and in 2007 it was 14.1 percent. The rate of unemployment among Tunisians who have completed tertiaryeducation increased by 500 percent; from 3.8 percent in 1994 to 19 percent in 2007. During the same period, unemployment among illiterate workers was reduced by about two-thirds (from 16.8 percent to 5.9 percent), and unemployment for workers with a primary education also declined significantly(from 19.2 percent to 13.5 percent). Finally, there was anincrease in unemployment rates for workers with a secondaryeducation (from 13 percent in 1994 to 15.45 in 2007).
Tunisia and most of the African countries need to address some important constraints and macroeconomic weaknesses, particularly the persistently high youth unemployment rates, especially among university graduates.They also need to continue strengthening the institutional and input prerequisites for a strong and competitive privatesector–led development, and to continue implementing policies and interventions that open up opportunities for productive entrepreneurship and employment for all membersof society.
Sources: AfDB, 2011; European Commission, 2010.
Box 1: Recent political events and graduate unemployment in Tunisia
these countries may be a necessary input into the curriculum development planning of universities if they are to succeed in producing graduates who havethe required skill sets for national development.
Entrepreneurship in higher-education curriculaEntrepreneurship is central to the growth and develop-ment of a country because it is the most important factor in bringing about innovation and new ideas thatmove an economy along.28 The role of entrepreneur-ship in least-developed countries may be more criticalto economic development than it is in high-income,developed countries. There is a consensus by govern-ments and development agencies that the developmentof small- and medium-sized enterprises (SMEs) based
on entrepreneurial knowledge and spirit is critical foreconomic development. The role of entrepreneurship in development is not limited to economic/businessactivities; indeed, social entrepreneurs, political entre-preneurs, and other types of entrepreneurs are all equal-ly important in moving the society forward.29 Africancountries now see entrepreneurship as a way of reduc-ing high rates of unemployment, especially among youth,and reducing poverty. In this regard, entrepreneurshipin higher-education curricula should be prioritized.
The objective of entrepreneurship education is toassist young people to become innovators and activeparticipants in the labor market.30 Urban makes a dis-tinction between traditional management education and entrepreneurship education:31 while the former isfunctional and does not care about the stage of the
The Africa Competitiveness Report 2011 © 2011 World Economic Forum, the World Bank and the African Development Bank
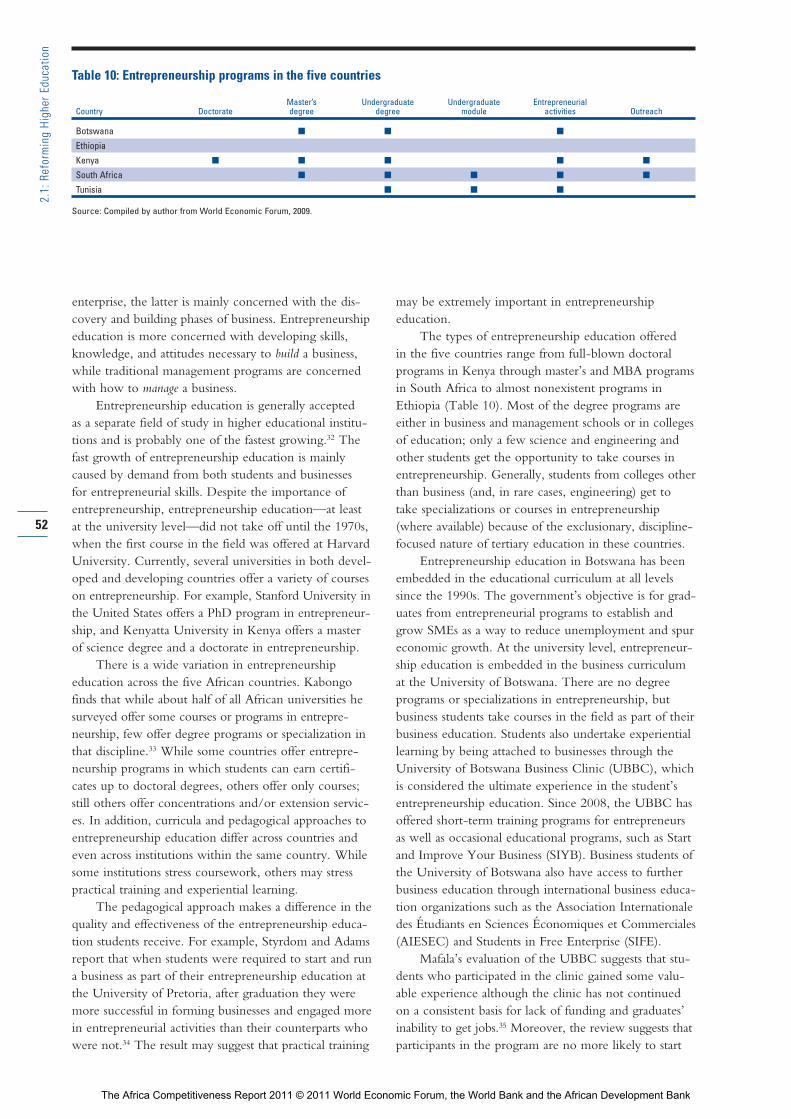
enterprise, the latter is mainly concerned with the dis-covery and building phases of business. Entrepreneurshipeducation is more concerned with developing skills,knowledge, and attitudes necessary to build a business,while traditional management programs are concernedwith how to manage a business.
Entrepreneurship education is generally accepted as a separate field of study in higher educational institu-tions and is probably one of the fastest growing.32 Thefast growth of entrepreneurship education is mainlycaused by demand from both students and businesses for entrepreneurial skills. Despite the importance of entrepreneurship, entrepreneurship education—at leastat the university level—did not take off until the 1970s,when the first course in the field was offered at HarvardUniversity. Currently, several universities in both devel-oped and developing countries offer a variety of courseson entrepreneurship. For example, Stanford University inthe United States offers a PhD program in entrepreneur-ship, and Kenyatta University in Kenya offers a masterof science degree and a doctorate in entrepreneurship.
There is a wide variation in entrepreneurship education across the five African countries. Kabongofinds that while about half of all African universities hesurveyed offer some courses or programs in entrepre-neurship, few offer degree programs or specialization inthat discipline.33 While some countries offer entrepre-neurship programs in which students can earn certifi-cates up to doctoral degrees, others offer only courses;still others offer concentrations and/or extension servic-es. In addition, curricula and pedagogical approaches toentrepreneurship education differ across countries andeven across institutions within the same country. Whilesome institutions stress coursework, others may stresspractical training and experiential learning.
The pedagogical approach makes a difference in thequality and effectiveness of the entrepreneurship educa-tion students receive. For example, Styrdom and Adamsreport that when students were required to start and runa business as part of their entrepreneurship education atthe University of Pretoria, after graduation they weremore successful in forming businesses and engaged morein entrepreneurial activities than their counterparts whowere not.34 The result may suggest that practical training
may be extremely important in entrepreneurship education.
The types of entrepreneurship education offered in the five countries range from full-blown doctoralprograms in Kenya through master’s and MBA programsin South Africa to almost nonexistent programs inEthiopia (Table 10). Most of the degree programs areeither in business and management schools or in collegesof education; only a few science and engineering andother students get the opportunity to take courses inentrepreneurship. Generally, students from colleges otherthan business (and, in rare cases, engineering) get totake specializations or courses in entrepreneurship(where available) because of the exclusionary, discipline-focused nature of tertiary education in these countries.
Entrepreneurship education in Botswana has beenembedded in the educational curriculum at all levelssince the 1990s. The government’s objective is for grad-uates from entrepreneurial programs to establish andgrow SMEs as a way to reduce unemployment and spureconomic growth. At the university level, entrepreneur-ship education is embedded in the business curriculumat the University of Botswana. There are no degree programs or specializations in entrepreneurship, butbusiness students take courses in the field as part of theirbusiness education. Students also undertake experientiallearning by being attached to businesses through theUniversity of Botswana Business Clinic (UBBC), whichis considered the ultimate experience in the student’sentrepreneurship education. Since 2008, the UBBC hasoffered short-term training programs for entrepreneursas well as occasional educational programs, such as Startand Improve Your Business (SIYB). Business students ofthe University of Botswana also have access to furtherbusiness education through international business educa-tion organizations such as the Association Internationaledes Étudiants en Sciences Économiques et Commerciales(AIESEC) and Students in Free Enterprise (SIFE).
Mafala’s evaluation of the UBBC suggests that stu-dents who participated in the clinic gained some valu-able experience although the clinic has not continuedon a consistent basis for lack of funding and graduates’inability to get jobs.35 Moreover, the review suggests thatparticipants in the program are no more likely to start
Table 10: Entrepreneurship programs in the five countries
Master’s Undergraduate Undergraduate Entrepreneurial Country Doctorate degree degree module activities Outreach
Botswana n n n
Ethiopia
Kenya n n n n n
South Africa n n n n n
Tunisia n n n
Source: Compiled by author from World Economic Forum, 2009.
52
2.1:
Ref
orm
ing
High
er E
duca
tion
The Africa Competitiveness Report 2011 © 2011 World Economic Forum, the World Bank and the African Development Bank
or develop a business than their counterparts who didnot participate. In addition, Moremong-Nganunu andothers’ evaluation of the SIYB program suggests thatthe program has no significant effect on entrepreneurialactivities in Botswana, implying that entrepreneurshipeducation in Botswana has not been effective.36
Ethiopia sees entrepreneurship as a way out of highunemployment rates and abject poverty. There are nodegree programs or specific set of courses systematicallydevoted to entrepreneurship education at the country’suniversities. However, there appears to be a number ofprograms at vocational and technical training schoolsdesigned to develop skills. Several private universitiesthat focus on providing business courses have beenestablished in recent years, but no Ethiopian universityhas a program with strong industry linkages.
Entrepreneurship education has long been a part of the Kenyan educational philosophy and landscape.The publication of the Kamunge Report in 1988 putentrepreneurship education at the center of Kenyan tertiary education.37 Kenya views entrepreneurship as a vehicle for self-employment, hence as a way to reduceunemployment, increase income, and reduce poverty.Entrepreneurship education is part and parcel of thecurriculum of technical and vocational schools inKenya. Its success is reflected in the fact that KenyattaUniversity offers both PhD and master’s degree pro-grams in entrepreneurship development, Moi Universityand the University of Nairobi offer undergraduatecourses in entrepreneurship, and Higher Diplomadegree programs are offered at Kenya TechnicalTeachers College. Training in these programs includescoursework, research, and attachment to industry. Inaddition, the government has established the RegionalCenter of Entrepreneurship Development at KenyattaUniversity for outreach activities in entrepreneurship.Besides research and teaching entrepreneurship as a gen-uine field of academic study, Kenyan universities arealso engaged in training teachers of entrepreneurship for secondary and vocational training schools.
Although there has not been any formal evaluationof the effectiveness of entrepreneurship education inKenya, it appears that this training has been successful.Kenya is one of the most dynamic countries in Africawhen it comes to the development of SMEs, especiallyin the ICT sector. While a large proportion of SMEsestablished may fail or may not grow, the fact that theycontinue to be established in both the formal and infor-mal sectors suggests that entrepreneurship education inKenya has succeeded in developing the entrepreneurialspirit that gives confidence to would-be entrepreneursto start new businesses.
Entrepreneurship education in South Africa is institutionalized by the Higher Education Act of 1997,which reformed the higher educational system. In addi-tion, the National Small Business Act of 1996 mandatedentrepreneurship education. The government of South
Africa established the Small Enterprise DevelopmentAgency that is linked to its Outcomes Based EducationStrategy. The objective of education reforms in SouthAfrica is the development of skills—especially technicaland entrepreneurial skills of the majority of citizens—toincrease economic growth as a way to reduce unem-ployment. Several South African universities and aca-demic departments provide entrepreneurship education.
As in most countries, the degree to which entre-preneurship education is embraced in a university’s edu-cation agenda differs across universities in South Africa.While some universities offer entrepreneurship as a fulldegree program at both graduate and undergraduatelevels, others offer it as a concentration within a degreeprogram (such as an MBA); still others offer a course or two in entrepreneurship studies within anotherdegree program. Entrepreneurship education is morelikely to be offered by the universities of technologiesthat focus on training people in technical skills than bythose universities that focus on training students forintellectual endeavors. Most South African universitiesthat offer these programs do so through their colleges of business or commerce; some universities, however,provide an entrepreneurship module within engineeringdegree programs. Most of the universities that offerentrepreneurship degree programs also engage in out-reach activities, in part because these activities generateincomes for the institutions. Pedagogy involves bothcoursework and practical training; however, the relativeweight given to coursework and experiential learningdiffer across universities and programs.
An important aspect of entrepreneurship educationis the pedagogy used in training these students. There isevidence that, at least in South Africa, entrepreneurshipeducation is more effective when there is an element ofexperiential learning involved. Whether entrepreneur-ship education is succeeding in creating a class of entre-preneurs in South Africa or not is not yet known, sincethere has not been a systematic evaluation of these programs. However, the GEM 2006 South AfricaCountry Report suggests that: (1) entrepreneurship edu-cation does not encourage entrepreneurship as a career,(2) a paradigm of entrepreneurship does not exist inSouth Africa, and (3) entrepreneurship skills are lackingin South Africa.38 The report’s conclusions suggest thatentrepreneurship education may not be achieving itsobjectives.
In Tunisia, entrepreneurship education is embodiedin law as enshrined in the 2002 Educational ReformAct.39 Entrepreneurial skills are to be developed throughindividual and group activities in all courses within theeducational system. Thus not only does the law requirethat entrepreneurship education be implemented inevery course in the entire educational system, it alsosuggests the pedagogical approach to be used to achievethis objective. To provide for entrepreneurship activi-ties, Tunisia established several technology parks to spur
53
2.1:
Ref
orm
ing
High
er E
duca
tion
The Africa Competitiveness Report 2011 © 2011 World Economic Forum, the World Bank and the African Development Bank
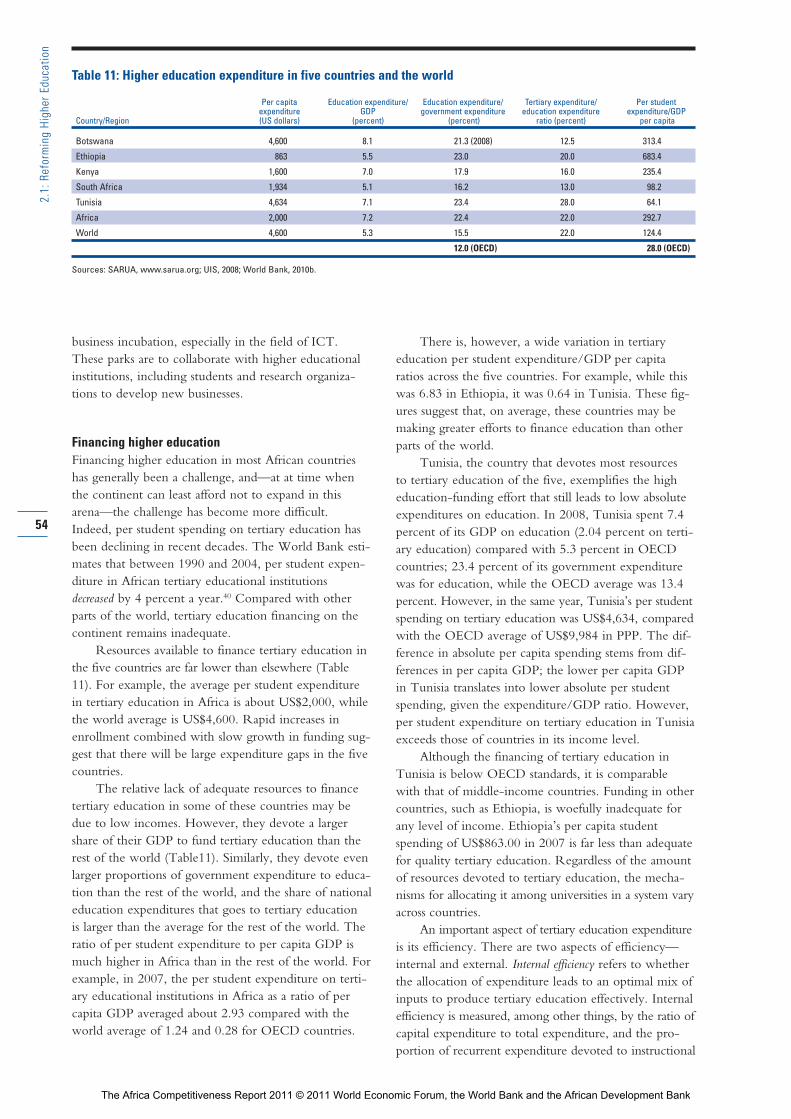
business incubation, especially in the field of ICT.These parks are to collaborate with higher educationalinstitutions, including students and research organiza-tions to develop new businesses.
Financing higher educationFinancing higher education in most African countrieshas generally been a challenge, and—at at time whenthe continent can least afford not to expand in thisarena—the challenge has become more difficult.Indeed, per student spending on tertiary education hasbeen declining in recent decades. The World Bank esti-mates that between 1990 and 2004, per student expen-diture in African tertiary educational institutionsdecreased by 4 percent a year.40 Compared with otherparts of the world, tertiary education financing on thecontinent remains inadequate.
Resources available to finance tertiary education inthe five countries are far lower than elsewhere (Table11). For example, the average per student expenditurein tertiary education in Africa is about US$2,000, whilethe world average is US$4,600. Rapid increases inenrollment combined with slow growth in funding sug-gest that there will be large expenditure gaps in the fivecountries.
The relative lack of adequate resources to financetertiary education in some of these countries may bedue to low incomes. However, they devote a largershare of their GDP to fund tertiary education than therest of the world (Table11). Similarly, they devote evenlarger proportions of government expenditure to educa-tion than the rest of the world, and the share of nationaleducation expenditures that goes to tertiary education is larger than the average for the rest of the world. Theratio of per student expenditure to per capita GDP ismuch higher in Africa than in the rest of the world. Forexample, in 2007, the per student expenditure on terti-ary educational institutions in Africa as a ratio of percapita GDP averaged about 2.93 compared with theworld average of 1.24 and 0.28 for OECD countries.
There is, however, a wide variation in tertiary education per student expenditure/GDP per capitaratios across the five countries. For example, while thiswas 6.83 in Ethiopia, it was 0.64 in Tunisia. These fig-ures suggest that, on average, these countries may bemaking greater efforts to finance education than otherparts of the world.
Tunisia, the country that devotes most resources to tertiary education of the five, exemplifies the higheducation-funding effort that still leads to low absoluteexpenditures on education. In 2008, Tunisia spent 7.4percent of its GDP on education (2.04 percent on terti-ary education) compared with 5.3 percent in OECDcountries; 23.4 percent of its government expenditurewas for education, while the OECD average was 13.4percent. However, in the same year, Tunisia’s per studentspending on tertiary education was US$4,634, comparedwith the OECD average of US$9,984 in PPP. The dif-ference in absolute per capita spending stems from dif-ferences in per capita GDP; the lower per capita GDPin Tunisia translates into lower absolute per studentspending, given the expenditure/GDP ratio. However,per student expenditure on tertiary education in Tunisiaexceeds those of countries in its income level.
Although the financing of tertiary education inTunisia is below OECD standards, it is comparable with that of middle-income countries. Funding in othercountries, such as Ethiopia, is woefully inadequate forany level of income. Ethiopia’s per capita studentspending of US$863.00 in 2007 is far less than adequatefor quality tertiary education. Regardless of the amountof resources devoted to tertiary education, the mecha-nisms for allocating it among universities in a system varyacross countries.
An important aspect of tertiary education expenditureis its efficiency. There are two aspects of efficiency—internal and external. Internal efficiency refers to whetherthe allocation of expenditure leads to an optimal mix ofinputs to produce tertiary education effectively. Internalefficiency is measured, among other things, by the ratio ofcapital expenditure to total expenditure, and the pro-portion of recurrent expenditure devoted to instructional
54
2.1:
Ref
orm
ing
High
er E
duca
tion
Table 11: Higher education expenditure in five countries and the world
Per capita Education expenditure/ Education expenditure/ Tertiary expenditure/ Per student expenditure GDP government expenditure education expenditure expenditure/GDP
Country/Region (US dollars) (percent) (percent) ratio (percent) per capita
Botswana 4,600 8.1 21.3 (2008) 12.5 313.4
Ethiopia 863 5.5 23.0 20.0 683.4
Kenya 1,600 7.0 17.9 16.0 235.4
South Africa 1,934 5.1 16.2 13.0 98.2
Tunisia 4,634 7.1 23.4 28.0 64.1
Africa 2,000 7.2 22.4 22.0 292.7
World 4,600 5.3 15.5 22.0 124.4
12.0 (OECD) 28.0 (OECD)
Sources: SARUA, www.sarua.org; UIS, 2008; World Bank, 2010b.
The Africa Competitiveness Report 2011 © 2011 World Economic Forum, the World Bank and the African Development Bank
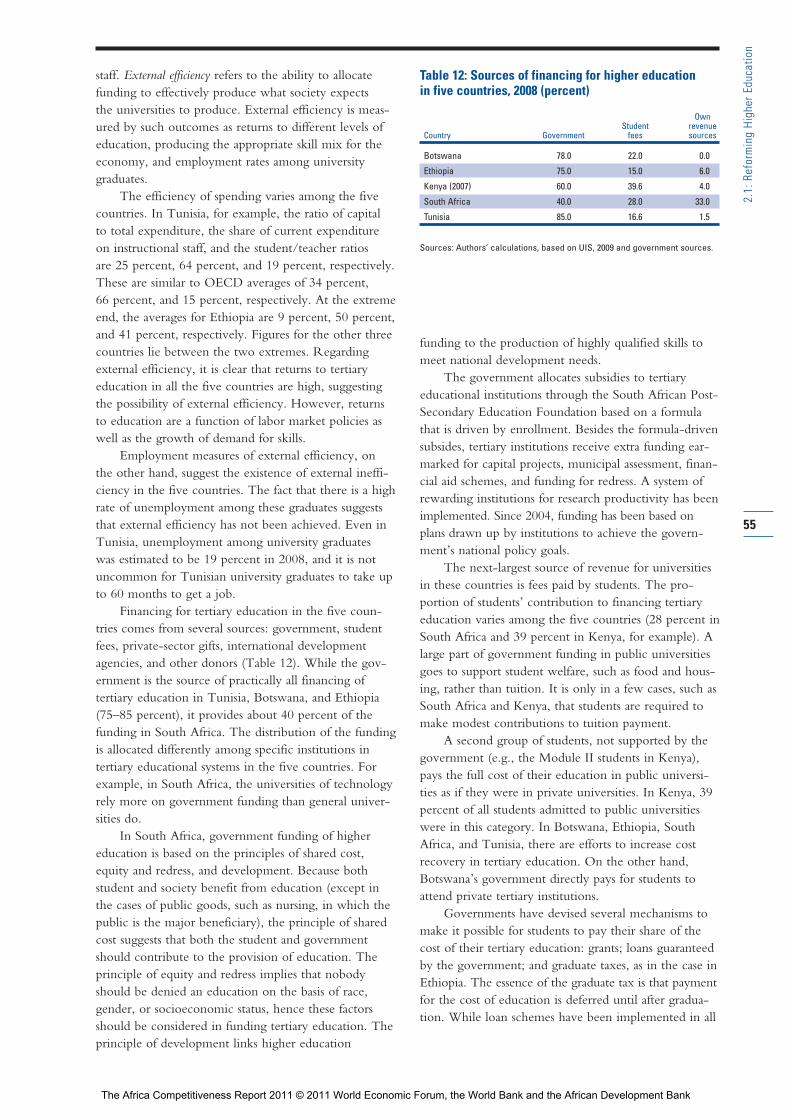
staff. External efficiency refers to the ability to allocatefunding to effectively produce what society expects the universities to produce. External efficiency is meas-ured by such outcomes as returns to different levels ofeducation, producing the appropriate skill mix for theeconomy, and employment rates among university graduates.
The efficiency of spending varies among the fivecountries. In Tunisia, for example, the ratio of capital to total expenditure, the share of current expenditure on instructional staff, and the student/teacher ratios are 25 percent, 64 percent, and 19 percent, respectively.These are similar to OECD averages of 34 percent, 66 percent, and 15 percent, respectively. At the extremeend, the averages for Ethiopia are 9 percent, 50 percent,and 41 percent, respectively. Figures for the other threecountries lie between the two extremes. Regardingexternal efficiency, it is clear that returns to tertiary education in all the five countries are high, suggestingthe possibility of external efficiency. However, returnsto education are a function of labor market policies aswell as the growth of demand for skills.
Employment measures of external efficiency, onthe other hand, suggest the existence of external ineffi-ciency in the five countries. The fact that there is a highrate of unemployment among these graduates suggeststhat external efficiency has not been achieved. Even inTunisia, unemployment among university graduates was estimated to be 19 percent in 2008, and it is notuncommon for Tunisian university graduates to take upto 60 months to get a job.
Financing for tertiary education in the five coun-tries comes from several sources: government, studentfees, private-sector gifts, international developmentagencies, and other donors (Table 12). While the gov-ernment is the source of practically all financing of tertiary education in Tunisia, Botswana, and Ethiopia(75–85 percent), it provides about 40 percent of thefunding in South Africa. The distribution of the fundingis allocated differently among specific institutions in tertiary educational systems in the five countries. Forexample, in South Africa, the universities of technologyrely more on government funding than general univer-sities do.
In South Africa, government funding of highereducation is based on the principles of shared cost, equity and redress, and development. Because both student and society benefit from education (except inthe cases of public goods, such as nursing, in which thepublic is the major beneficiary), the principle of sharedcost suggests that both the student and governmentshould contribute to the provision of education. Theprinciple of equity and redress implies that nobodyshould be denied an education on the basis of race, gender, or socioeconomic status, hence these factorsshould be considered in funding tertiary education. Theprinciple of development links higher education
funding to the production of highly qualified skills tomeet national development needs.
The government allocates subsidies to tertiary educational institutions through the South African Post-Secondary Education Foundation based on a formulathat is driven by enrollment. Besides the formula-drivensubsides, tertiary institutions receive extra funding ear-marked for capital projects, municipal assessment, finan-cial aid schemes, and funding for redress. A system ofrewarding institutions for research productivity has beenimplemented. Since 2004, funding has been based onplans drawn up by institutions to achieve the govern-ment’s national policy goals.
The next-largest source of revenue for universitiesin these countries is fees paid by students. The pro -portion of students’ contribution to financing tertiaryeducation varies among the five countries (28 percent inSouth Africa and 39 percent in Kenya, for example). Alarge part of government funding in public universitiesgoes to support student welfare, such as food and hous-ing, rather than tuition. It is only in a few cases, such asSouth Africa and Kenya, that students are required tomake modest contributions to tuition payment.
A second group of students, not supported by thegovernment (e.g., the Module II students in Kenya),pays the full cost of their education in public universi-ties as if they were in private universities. In Kenya, 39percent of all students admitted to public universitieswere in this category. In Botswana, Ethiopia, SouthAfrica, and Tunisia, there are efforts to increase costrecovery in tertiary education. On the other hand,Botswana’s government directly pays for students toattend private tertiary institutions.
Governments have devised several mechanisms tomake it possible for students to pay their share of thecost of their tertiary education: grants; loans guaranteedby the government; and graduate taxes, as in the case inEthiopia. The essence of the graduate tax is that paymentfor the cost of education is deferred until after gradua-tion. While loan schemes have been implemented in all
55
2.1:
Ref
orm
ing
High
er E
duca
tion
Table 12: Sources of financing for higher education in five countries, 2008 (percent)
Own Student revenue
Country Government fees sources
Botswana 78.0 22.0 0.0
Ethiopia 75.0 15.0 6.0
Kenya (2007) 60.0 39.6 4.0
South Africa 40.0 28.0 33.0
Tunisia 85.0 16.6 1.5
Sources: Authors’ calculations, based on UIS, 2009 and government sources.
The Africa Competitiveness Report 2011 © 2011 World Economic Forum, the World Bank and the African Development Bank
the five countries, evidence suggests that loan repay-ment remains a challenge.
A third source of revenue for university financing isinternally generated funds. These are mainly fromtuition fees for part-time studies, certificate courses, ICTcourses, distance education, and other market-drivencourses. For example, in Ethiopia, while full-time stu-dents in public tertiary educational institutions pay notuition fees, all part-time students in these institutionspay modest tuition fees. In addition to these fees, uni-versities also generate modest revenues from contractresearch and other services that they provide to privatebusinesses and the community as a whole. The amountsof income generated from this source differ not onlyacross countries but also across institutions in the samecountry. For example, while this source of revenue isalmost absent in Botswana and Tunisia, it is sizable inSouth Africa.
There is very little external support for tertiaryeducation, including international resources. However,there is indirect support through graduate scholarships,research collaboration, and student and faculty exchanges.In general, there is not much financial support of terti-ary education from the private business sector in thesecountries.
The cost of tertiary education and the fundingmechanisms in each country depend on the objectivesof the government and the political economy of educa-tion in that country. For example, in Tunisia, the gov-ernment pays about 85 percent of tuition and providesscholarship, grants, and loans that are means tested. Inaddition, tuition is deliberately kept low to ensure equi-table access for all socioeconomic classes. Admission totertiary institutions, however, depends on performancein entrance examinations, secondary school grades,coursework, and enrollment quotas placed on specificprograms. Private institutions are allowed to chargehigher tuition fees than public ones. Affordability isensured through a system of grants and loans that makesit possible for students from low-income households to participate. However, there is evidence of socio -economic inequality since a disproportionately largershare of university students come from middle- or high-income backgrounds. On the other hand, students pay alarger share of the cost of tertiary education in Kenyaand South Africa than in the other three countries.
The current systems of funding tertiary educationin the five countries face challenges on issues of equity:students from well-to-do families tend to benefit at theexpense of students from low-income ones. Studentsfrom high-income households are more likely to gainadmission to universities and benefit under the currentsystems than students from low-income backgrounds. Inthe same way, the existing funding systems are likely tobenefit urban areas at the expense of rural areas and thosewithout good secondary schools. If there is genderinequity in university admission, as is the case with
Ethiopia and Kenya, the current funding approacheswill perpetuate the gender inequity in tertiary educa-tion.
The discussion above shows that governments havebeen the major source of funding for tertiary educationin the five countries. With the possible exception ofTunisia, this funding has not kept up with the rapidgrowth in enrollment, resulting in decreases in per student funding. Given the relatively low growth ofsome of these economies and the fact that most Africancountries have just started demographic transitions, it is unlikely that government revenues can grow fastenough to keep pace with enrollment growth in theforeseeable future. Thus there is a need to find new and innovative ways of financing tertiary education inAfrican countries.
University-industry linkagesUniversities and other tertiary educational institutionshave and continue to play leading roles in the develop-ment of societies, training skilled labor for the economyand creating processes and knowledge that lead to newproducts and technologies. The quality of human capitaland tertiary institutions determines which countriesmove to the technology frontier in the world and whichcountries do not.41 If skilled labor trained by these terti-ary institutions is to be useful to the economy, it mustmeet the needs of the economy. Hence the tertiaryinstitutions must take into account the skill needs of thesociety. If knowledge created in these institutions is tobe useful to society, it has to be transferred to industryrather than kept in the labs of the institutions. Thisknowledge transfer can be achieved through constantcommunication and collaboration between universitiesand industry in R&D as well as other innovative activi-ties. UILs therefore become critical if the universities areto play meaningful roles in the development of nations.UILs focus on how universities interact with industry asa whole for their mutual benefit and to support thedevelopment of countries. In addition, countries with adeveloped private sector that enables entrepreneurshipto flourish are likely to tap into UILs by creating adomestic market for university-produced technologies.
In an era of open innovation, R&D efforts inindustry alone are not sufficient to drive innovation in a country;42 innovation requires strong UILs. UILs havebeen instrumental in the development of industrializedcountries. In the United States, for example, researchfrom land grant universities fueled the development ofmodern agriculture and agro-industries; current innova-tion revolves around universities creating growth polessuch as California’s Silicon Valley and Boston’s Route128. In the developing world, there are strong UILs incountries such as China, Korea, and Brazil, among oth-ers. UILs provide incentives for universities to conductresearch with practical applications through the funding
56
2.1:
Ref
orm
ing
High
er E
duca
tion
The Africa Competitiveness Report 2011 © 2011 World Economic Forum, the World Bank and the African Development Bank
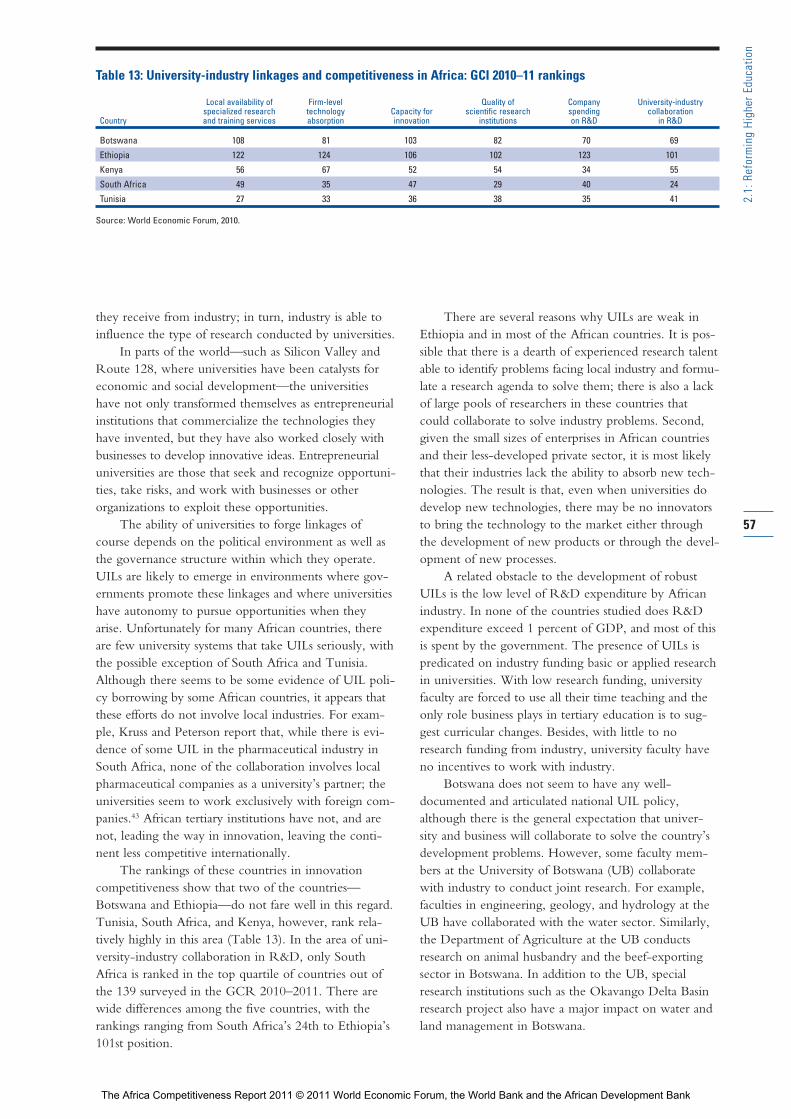
they receive from industry; in turn, industry is able toinfluence the type of research conducted by universities.
In parts of the world—such as Silicon Valley andRoute 128, where universities have been catalysts foreconomic and social development—the universitieshave not only transformed themselves as entrepreneurialinstitutions that commercialize the technologies theyhave invented, but they have also worked closely withbusinesses to develop innovative ideas. Entre preneurialuniversities are those that seek and recognize opportuni-ties, take risks, and work with businesses or otherorganizations to exploit these opportunities.
The ability of universities to forge linkages ofcourse depends on the political environment as well asthe governance structure within which they operate.UILs are likely to emerge in environments where gov-ernments promote these linkages and where universitieshave autonomy to pursue opportunities when theyarise. Unfortunately for many African countries, thereare few university systems that take UILs seriously, withthe possible exception of South Africa and Tunisia.Although there seems to be some evidence of UIL poli-cy borrowing by some African countries, it appears thatthese efforts do not involve local industries. For exam-ple, Kruss and Peterson report that, while there is evi-dence of some UIL in the pharmaceutical industry inSouth Africa, none of the collaboration involves localpharmaceutical companies as a university’s partner; theuniversities seem to work exclusively with foreign com-panies.43 African tertiary institutions have not, and arenot, leading the way in innovation, leaving the conti-nent less competitive internationally.
The rankings of these countries in innovation competitiveness show that two of the countries—Botswana and Ethiopia—do not fare well in this regard.Tunisia, South Africa, and Kenya, however, rank rela-tively highly in this area (Table 13). In the area of uni-versity-industry collaboration in R&D, only SouthAfrica is ranked in the top quartile of countries out ofthe 139 surveyed in the GCR 2010–2011. There arewide differences among the five countries, with therankings ranging from South Africa’s 24th to Ethiopia’s101st position.
There are several reasons why UILs are weak inEthiopia and in most of the African countries. It is pos-sible that there is a dearth of experienced research talentable to identify problems facing local industry and formu-late a research agenda to solve them; there is also a lackof large pools of researchers in these countries thatcould collaborate to solve industry problems. Second,given the small sizes of enterprises in African countriesand their less-developed private sector, it is most likelythat their industries lack the ability to absorb new tech-nologies. The result is that, even when universities dodevelop new technologies, there may be no innovatorsto bring the technology to the market either throughthe development of new products or through the devel-opment of new processes.
A related obstacle to the development of robustUILs is the low level of R&D expenditure by Africanindustry. In none of the countries studied does R&Dexpenditure exceed 1 percent of GDP, and most of thisis spent by the government. The presence of UILs ispredicated on industry funding basic or applied researchin universities. With low research funding, universityfaculty are forced to use all their time teaching and theonly role business plays in tertiary education is to sug-gest curricular changes. Besides, with little to noresearch funding from industry, university faculty haveno incentives to work with industry.
Botswana does not seem to have any well-documented and articulated national UIL policy,although there is the general expectation that univer -sity and business will collaborate to solve the country’sdevelopment problems. However, some faculty mem-bers at the University of Botswana (UB) collaboratewith industry to conduct joint research. For example,faculties in engineering, geology, and hydrology at theUB have collaborated with the water sector. Similarly,the Department of Agriculture at the UB conductsresearch on animal husbandry and the beef-exportingsector in Botswana. In addition to the UB, specialresearch institutions such as the Okavango Delta Basinresearch project also have a major impact on water andland management in Botswana.
57
2.1:
Ref
orm
ing
High
er E
duca
tion
Table 13: University-industry linkages and competitiveness in Africa: GCI 2010–11 rankings
Local availability of Firm-level Quality of Company University-industryspecialized research technology Capacity for scientific research spending collaboration
Country and training services absorption innovation institutions on R&D in R&D
Botswana 108 81 103 82 70 69
Ethiopia 122 124 106 102 123 101
Kenya 56 67 52 54 34 55
South Africa 49 35 47 29 40 24
Tunisia 27 33 36 38 35 41
Source: World Economic Forum, 2010.
The Africa Competitiveness Report 2011 © 2011 World Economic Forum, the World Bank and the African Development Bank
In Ethiopia, the National Science and TechnologyPolicy (NSTP) of 1993 mandated tertiary educationalinstitutions to help build, generate, select, upgrade, anddisseminate appropriate technology for the developmentof Ethiopia. The NSTP was not mandated to encourageor facilitate UILs, and, as a result, it has not been success-ful in UILs. However, some individual faculty membersand groups have made attempts at forging university-industry relationships. For example, the technology faculty of Addis Ababa University formed the TechnologyFaculty Industry Linkage (TFIL) in 2000 to foster col-laboration between the engineering faculty and industry.This effort failed for lack of funding. There were attemptsto replace TFIL with the Higher Education IndustryResources Integration Center (HEIRIC), funded byindustry and the Chamber of Commerce. HEIRIC alsofailed for lack of funding and general support. Overall,UILs in Ethiopia have not succeeded partly because ofthe over-concentration of UIL activities in AddisAbaba, with no linkages to different regions and enter-prises, and partly because of a lack of interest fromresearchers, a lack of skills, and a lack of funding.
However, there are examples of successful linkagesbetween foreign universities and industry in Ethiopia.One example is the highly successful small-scale agricultural extension program of Haramaya University,a largely experiential BSc program in agriculture thatforces the faculty to bring the classroom to the field.The program provides constant extension services tosmall-scale farmers and also helps the academic staff torevise their curricula to reflect local conditions.
Although Kenya does not have a national policy on UILs and does not vigorously promote such link-ages, there do exist some linkages between individualacademic departments in a few universities and someindustries at the student and faculty levels. Most degreeprograms in business, engineering, law, and ICT inKenyan universities require internship and industrialattachment for graduation. Two private universities inKenya—Strathmore University and the United StatesInternational University—require industrial attachmentfor all degree programs. In addition, a few universitydepartments have signed collaborative agreements andconduct joint research with industry. For example, in2006, Safaricom Kenya Limited signed an agreementwith Moi University to set up and support a moderntelecommunications laboratory on the latter’s campus.The agreement also included faculty internship atSafaricom so the former could improve their skills at the university’s laboratories.
Kenya established the National Council for Scienceand Technology in 1977 to advise the government ontechnology and UILs. In addition, the government pro-vides research grants to faculty through the Commissionfor Higher Education. The report of the Taskforce forthe Development of National Strategy for UniversityEducation in Kenya of 2008 suggests that there exist
formal channels for university-industry relationships, butthat these channels are not fully used by either side.44
The report also suggests increasing R&D expenditure to 1 percent of GDP and establishing a venture capitalfund to finance technology transfer from university toindustry. The report suggests several strategies to makethese linkages effective. One is to establish a nationalpolicy on university-industry collaborative research;another is to develop policies on university-industryinnovation clusters and/or technology parks, and yetanother is to promote joint research between universi-ties and industry and other research organizations.
In addition to local universities, Kenya hosts a largenumber of local and foreign research institutes, some of which are affiliated with foreign universities thatinteract with local industry, government, and otherresearch institutions. For example, the InternationalLivestock Research Institute has been instrumental forthe development of the Kenyan livestock industry, whileICRISAT Nairobi has been instrumental in the devel-opment of semi-arid agriculture in Kenya and the restof East Africa. These institutions employ a large numberof Kenyan science graduates who then go on to workwith either industry or other academic institutions, thustransferring research skills to industry.
South Africa spent about 0.98 percent of its GDPon R&D in 2007, a ratio that is lower than those ofOECD and East Asian countries, but comparable to thosecountries that are in similar stages of development, suchas Brazil. Of the 0.98 percent of GDP spent on R&D,58 percent—more than half—comes from industry, suggesting a strong potential for meaningful UILs. TheHigher Education Act of 1997 gave South African universities three missions: social and industry outreach(mainly market-driven, entrepreneurial activities basedon spinoffs of research results), research parks, and university-business joint research. The well-endoweduniversities emphasize research, while some of the less-well-endowed—such as the universities of technology—focus more on teaching and skilled development missions.
South Africa adopted a comprehensive science andtechnology (S&T) policy in 2002 to bring structuraltransformation to the economy based on developed-country models of encouraging collaboration amongtertiary institutions, industry, other research institutionsand government.45 While UILs are not widespread inSouth Africa, a few industries have forged linkages withuniversities based on the abilities of universities to helpsolve specific industry problems. Large mining compa-nies that need the specific research skills of universitiesto complement the work of in-house research haveforged research alliances with universities; so has thewine industry. In the ICT sector, Telekom SouthAfrica has established centers of excellence in selectedengineering departments to conduct joint research.
South African universities are not making mucheffort to commercialize their research results. For
58
2.1:
Ref
orm
ing
High
er E
duca
tion
The Africa Competitiveness Report 2011 © 2011 World Economic Forum, the World Bank and the African Development Bank
example, the HIV/AIDS vaccine project at the Universityof Cape Town has very little UIL with local industry.Where South African universities collaborate withindustry, they do so with foreign companies rather thanlocal ones, as in the case of the biotechnology industry.However, the wine industry collaborates with SouthAfrican universities in R&D. In a survey of a large number of firms, Kruss and others found that only large,technology- and export-oriented firms engaged in collaborative research with universities.46 Large miningcompanies with large internal research departments collaborate with universities, while a large number ofSMEs do not.
Between 1998 and 2006, enrollment in computerscience in tertiary institutions in Tunisia increased from4,000 to 40,000. In addition to the rapid expansion ofscience education, the government has also establishedsix technology parks distributed across the country andhas financed technology transfers and adoption throughthe Société d’Investissement en Capital à Risque(SICAR). Tunisia spends about 2 percent of its GDPon R&D, a proportion comparable to the low end ofthat of OECD countries and far higher than lower-mid-dle-income countries. The government provides 80percent of research funding, and university researchabsorbs 67 percent of R&D expenditures in Tunisia.
UILs, which are coordinated by the Higher Councilfor Scientific Research and Technology, are crucial ifthe government is to achieve its objective of rapid tech-nical transformation and get a return on its investment.Innovation policies that encourage UILs have beenimplemented through a series of programs, includingthe 1992 Research Results Valorization, which fundsprojects involving partnerships among industry, univer-sities, research organizations, and professional groups.Less than 100 projects have benefitted from this projectso far. The 1994 Decree 94-536, Premium InnovationResearch and Development, supports original researchleading to the development of new products or process.The government pays up to 50 percent of the cost ofthe project; to date about 43 projects have been submit-ted by 40 companies for consideration.
In 2003, the Federative Research Program was created with the intention of setting industry, researchinstitutions, and universities to tackle problems innationally defined priority areas, such as ICT, biotech-nology, and water. The National Program of Researchand Innovation was set up in 2003 to respond toTunisian industry needs for innovation and improve-ment in competitiveness. Projects on innovation wereto be collaborative efforts between universities, industry,and other research institutions. UIL efforts in Tunisiaseem to be top-heavy and mandated, organized, andfinanced by the government, with no organic develop-ment of the relationship between universities and indus-try. It is not clear to what extent these relationshipshave been successful.
Lessons, challenges, and the way forwardThe five African countries considered in this chapterhave shown both similarities and differences in theirapproaches to increasing the efficiency and efficacy oftheir tertiary educational systems. Some have been moresuccessful in various ways than others—for example,some have achieved gender parity in enrollment, butsome have not. The next section considers the lessonsthat can be learned, the challenges that lie ahead, andthe way forward for African countries to make highereducation a key player in its development efforts.
Summary and lessonsEnrollments in tertiary educational institutions in thefive African countries over the last two decades haveincreased rapidly—by an average of more than 200 percent—with Ethiopia recording a much faster rate of expansion than the others. This was faster than theenrollment growth rate in any other region of theworld. Progress has been made toward gender parity intertiary education enrollment in all five countries, andthree have achieved full gender parity to date. In spite of the rapid growth in enrollment, the GERs continueto rank among the lowest in the world: Ethiopia’s GERcomes in at less than 2 percent. Tunisia, however, hasseen an increase in enrollment ratios up to internationalstandards. Socioeconomic and regional inequity, as wellas gender inequity, have occurred in some cases.
The majority of students are enrolled in the socialsciences and the humanities; there is relatively lowenrollment in the SET and mathematics fields.However, most of these five countries have not beenable to transform their tertiary educational systems tomeet the needs of their increasingly technology-driveneconomies. The result is that a large proportion of grad-uates have acquired skills that are less in demand, whileskill shortages abound. The mismatch between skillneeds and skills produced by these institutions is mani-fested in increased unemployment among graduates inthe midst of skill shortages. Another consequence is theemigration of some of the graduates.
Funding has not kept pace with increasing enroll-ments, with the result that per student funding hasdecreased by an average of 4 percent annually over theperiod 1994–2004. This has happened in spite of thefact that these countries spend a larger proportion oftheir resources on tertiary education than do other partsof the world. Low per student funding has resulted in a deterioration of physical infrastructure; inadequatelibrary and laboratory space; increased student/facultyratios; and, in some cases, inadequately qualified seniorprofessors to guide the academic enterprise. The netresult is that the quality of tertiary education hasdecreased by international standards, along with therapid expansion of enrollment. A major reason for thedecrease in quality is the inability of government tofinance the rapid growth in tertiary education.
59
2.1:
Ref
orm
ing
High
er E
duca
tion
The Africa Competitiveness Report 2011 © 2011 World Economic Forum, the World Bank and the African Development Bank
The inability of the public-sector institutions toabsorb the increasing number of students seeking admis-sion has led to the rapid expansion of private tertiaryeducation in these countries. Often, these private insti-tutions provide programs that are in high demand atreasonable cost, and although they charge the full costof providing this education, in some cases they evenmake a profit. The rapid growth of private tertiary insti-tutions and their ability to compete with publicly fund-ed institutions suggests two things: (1) some tertiaryeducation students are capable of paying for their owneducation and the government need not support them,and (2) the cost of providing a tertiary education in thepublic sector may be too high, and efficiency may needto improve in publicly funded tertiary institutions.These two factors suggest that governments should bejudicious in financing students at the tertiary educationlevel, financing only those who are unable to pay fortheir education and ensure an efficient allocation offunding in these institutions.
Entrepreneurship education has not been systemati-cally incorporated into the curricula of tertiary institu-tions in many of these countries. In most of them it isnot offered at all as part of the university curriculum; in cases where it is taught, it is not offered as a major or integrated into the whole curriculum, leaving it as a series of disjointed courses. The only exception isKenya, where some universities offer master’s and doctoral degrees in entrepreneurship. Similarly, in spiteof the need for university-industry collaboration to spur development, these countries do not have well-articulated and established UILs, suggesting that tertiaryinstitutions may not be contributing to the developmentof industry in the countries.
Countries have different structures of tertiary edu-cation governance. These may manifest themselves indifferences in efficiency and in their ability to adjust tonew circumstances in order to take advantage of newopportunities to train students in innovative directions.Despite written policies that purport to provide tertiaryinstitutions with operational autonomy, some govern-ments still exert political control over their day-to-dayadministration. Internal governance of tertiary institu-tions has not been efficient by international standards, asa relatively larger share of tertiary education expendituregoes to current expenditure than is optimal, and a lowerpercentage than optimal is spent on instruction. Giventhat graduates frequently remain unemployed in the faceof skill shortages, one can argue that these tertiary insti-tutions are not externally efficient either.
Tertiary education efforts and outcomes in Tunisiaseem to be the exception among the five countries.Tunisia’s experience suggests that it is possible to simul-taneously and rapidly expand tertiary education enroll-ment, ensure gender equity, improve quality, and redi-rect education toward fields that are deemed nationalpriorities. At the same time, Tunisia transformed its
tertiary education curricula to one emphasizing S&Twithout compromising quality. Indeed, Tunisia’s terti-ary educational system was consistently ranked in thetop quartile worldwide.
The experiences described in these case studies—in particular, the Tunisian experience—offer lessons forAfrican countries on how to expand tertiary education.The first lesson is that tertiary education in Africa canbe dramatically expanded, transformed, and improved atthe same time. Second, such improvements and expan-sion require an increased infusion of resources becauseexpansion and quality improvement cannot be had “onthe cheap”—Tunisia spends a relatively large proportionof its national resources on tertiary education. The thirdlesson is that education policy and efforts should beintrinsically linked to national development policy andthat tertiary education reforms should be part and parcelof education reforms generally. The Tunisian reformswere linked to national priorities; tertiary educationpolicy was linked to economic development, research,and industrial policies. Tertiary education reforms arelikely to fail if pre-tertiary education is also notreformed. In Tunisia, education reforms involved trans-forming the pre-tertiary education curricula to empha-size science, mathematics, and information technologies,thus making it possible for the reforms at the tertiarylevels to be successful. The fourth lesson is that tertiaryeducation requires a continuous and full commitmentfrom the government. In Tunisia, education reform was a central priority of the government, which ofteninitiated and pushed the reforms from the top. Finally,education reform is a continuous process—policy reformsmay need continuous monitoring and revisions.
ChallengesThere are several challenges facing these five countriesas they provide tertiary education for their growingpopulations. The inability to meet the rapidly expand-ing demand for tertiary education that is partly causedby the burgeoning demographic transition is a majorconcern. Among the challenges are the need to over-come capacity constraints; to prevent or reverse declinesin quality; to ensure the relevance of tertiary educationto the countries’ needs and also its contribution toindustrial development; and to provide for its cost,financing, and governance. These challenges are likelyto persist in the coming years and need to be addressed.
The tertiary educational systems in these countriesface the major problem of their inability to generateenough resources to finance the expansion needed tomeet increasing demand. While demand has beengrowing at exponential rates, the resources to financethat expansion have, at best, grown at arithmetic rates,thus setting up a Malthusian catastrophe in tertiary edu-cation. The typical response has been to expand capaci-ty without resources to support the expansion, resulting in decreased quality, increased student-faculty ratios, a
60
2.1:
Ref
orm
ing
High
er E
duca
tion
The Africa Competitiveness Report 2011 © 2011 World Economic Forum, the World Bank and the African Development Bank
deterioration of the physical infrastructure, and the use of often inexperienced or adjunct faculty to staffcourses. The faculty has very little time for research,thus decreasing knowledge creation. Another aspect of the preoccupation with teaching is the inability toreform the curriculum to reflect the needs of the coun-try, thus making tertiary education less relevant. Most ofthe countries are therefore producing graduates who arenot employable in the midst of skill shortages. The lackof research efforts and productivity on the part of facul-ty means that tertiary institutions cannot collaboratewith local industry to solve countries’ developmentproblems.
Exacerbating the inability to finance expansion oftertiary education is the fact that, in most of these coun-tries, governments bear an overwhelming financial bur-den. For example, in Tunisia, Botswana, and Ethiopia,about 80 percent of the cost of tertiary education isborne by the government regardless of the student’sability to pay. Worse, students are funded whether or not they study subjects in fields that countries regard asnational priorities. In addition, the systems of fundingcreate social inequities. Often the systems of rationinguniversity admissions also create socioeconomic andregional inequalities. If there are gender inequalities inadmissions, a gender bias is added to these inequalities in funding. Such a system of funding perpetuates andindeed expands social inequalities in society.
The lack of adequate funding means that tertiaryinstitutions are not able to attract the best faculty intheir specific fields, which leads to quality decline; norare they able to retain those they have on staff. In anincreasingly globalized world, these tertiary institutionsface a global market for academic talent and should be prepared to offer competitive wages and workingconditions to attract and retain staff.
An essential aspect of any quality academic envi -ronment is one of shared governance and academic freedom. Unfortunately, in some countries, academicdepartments have very little input in terms of courseand curriculum design and faculty evaluation. Promotionand tenure decisions tend to be politicized, making itdifficult to recruit and retain good faculty. At the sys-tems level, the leadership of institutions and the highestpolicymaking bodies are usually appointed by either the head of state or government, or the minister of education.
These tertiary institutions also face a cost structurethat is too high, in both absolute and relative terms.Some countries are spending three to four times percapita GDP on a tertiary education student, comparedwith 40 percent in OECD countries. Part of the highercost of producing tertiary education is a result of thelow quality of inputs. The high cost of producing terti-ary education in African countries may also be due tothe relatively small sizes of individual institutions, espe-cially as individual institutions in a system compete to
provide similar programs. Finally, tertiary institutions inthese countries are extremely costly because they tendto provide services to students—such as food, housing,and healthcare—that are not part of education itself at no cost to the students. These services are provided by governments because they are politically popular. The challenge is for governments to find the politicalcourage to eliminate these expenditures.
The way forwardThe major challenges facing tertiary education inAfrican countries are how to expand access and at thesame time improve quality and relevance, how to makeit more equitable, and how to provide adequate finan-cial resources. Overcoming these challenges will involvea massive expansion and restructuring of tertiary educa-tional systems in particular, and education generally.Based on the evidence from the five countries, thisshould be based on three pillars: quantity and equity,quality and relevance, and financing.
Quantity and equity: Expanding accessOne of the major challenges facing African countries isproviding enough resources to expand access to tertiaryeducation. Part of the problem can be traced to govern-ments’ willingness to finance everyone who gainsadmission to a tertiary institution. One way to expandaccess is to make students contribute to their own education. This is already occurring in some Africannations, such as Kenya, through cost recovery andModule II programs, but the scope needs to be increased.Given that private returns to tertiary education are highin African countries, cost recovery should be increasedand, where possible, governments should aim for fullcost recovery. The popularity of private, for-profitproviders of tertiary education in Africa suggests that alarge number of students can afford to pay fully for theirtertiary education.
Second, to ensure that the right sets of skills areacquired by students, government support for tertiaryeducation should be geared to high-priority fields forthe nation’s development. It should not cover studentwelfare expenditures, since these are not related to edu-cation. This approach to funding would allow govern-ment to support more students who are truly needy, and would also introduce some form of equity into thefinancing of tertiary education in African countries.
Expanding access also would entail providing differ-ent pathways to higher education. The current systemof admissions is focused almost exclusively on secondary-school graduates and full-time students; there should bea mechanism to admit nontraditional students who maynot attend a tertiary institution on a full-time basis orwho may attend through Module II.
One possible way of expanding access to tertiaryeducation is through the use of ICT for distance learn-ing. Most providers use either a residential model or an
61
2.1:
Ref
orm
ing
High
er E
duca
tion
The Africa Competitiveness Report 2011 © 2011 World Economic Forum, the World Bank and the African Development Bank
on-campus delivery system. This is one of the reasonswhy the per course cost of higher education in Africa is so high. A possible way around this is to use ICT todeliver tertiary educational instruction through distancelearning. Another possible way to reduce the unit costis through increased specialization by institutions.Although most African tertiary institutions were set upto cater to certain specialties, recently most have startedto offer the same sets of courses and programs. Theresult is that they do not excel in any area. More impor-tantly, because tertiary institutions try to provide a smallportion of every discipline, the unit cost of providingany specific program is high because institutions are notable to take advantage of economies of scale. To takeadvantage of economies of scale, differentiation amongtertiary educational institutions needs to be encouraged.
Given that the public sector is unable to meet thedemand for tertiary education in the foreseeable future,private provision of tertiary education is increasinglycritical. Governments should provide the appropriateregulatory framework and the right incentives for theprivate sector to expand their provision of tertiary edu-cation. These incentives may include student loans, taxholidays, subsidies for the construction of infrastructure,subsidies to hire faculty, the ability to bid for govern-ment research grants, and the ability of students to usegovernment scholarships to attend private tertiary insti-tutions. To ensure quality, all private tertiary educationproviders in a country should be brought under samequality assurance mechanisms as the public universitiesand should be continuously monitored. There could bepublic-private partnerships in the provision of tertiaryeducation in which the private sector may be contractedto provide some services (e.g., housing) directly to students.
Quality and relevanceThe quality of education is more important than thequantity for development outcomes. This implies that,for African countries to benefit from improved tertiaryeducation, they should focus with laser-like precisionon improving quality and relevance even as they strug-gle to increase quantity. This can be achieved onlythrough a radical restructuring of existing tertiary edu-cational systems by carrying out curricular reforms,instituting appropriate funding mechanisms, and provid-ing incentives.
The central focus of any reform should be high-quality improvements and upgrades. The quality of anyoutput or service partly depends on the quality of itsinputs—physical infrastructure, faculty, staff, and, aboveall, management. Maintaining infrastructure and retain-ing faculty and staff should be the top priority. Whileworkers are trained in these countries with the appro-priate skills to become high-quality faculty members,they have often emigrated because of poor workingconditions in their home countries. Tertiary institutionscould attract appropriate talent by providing appropriate
working conditions, including academic freedom,shared governance, and research support. Improvingquality would also involve setting quality standards andstrengthening the oversight of quality assurance bodies.
No systematic quality control mechanism existseither through accreditation boards or internal self-study,or through periodic program evaluations. The result isthat programs continue to be offered long after theyhave outlived their usefulness or when their quality isnot up to the desired standards. Quality assurance bod-ies could set minimum standards expected of graduatesand researchers from such programs, and tertiary institu-tions should be held accountable for reaching thesestandards. Programs that consistently fail to meet theseminimum standards should then lose their accreditation.Another way to ensure high quality is to link the fund-ing of universities to quality outcomes; institutions thatconsistently meet or exceed these standards would havetheir funding increased, while those that consistently failto meet these standards would have their fundingdecreased.
A focus on quality without relevance to the needsof Africa is an inappropriate and inefficient way of providing tertiary education for Africa. To make it relevant, curricula must be completely restructured. Theemphasis should be on moving from an emphasis onsocial sciences and the humanities to one focusing onscience, engineering, mathematics, and entrepreneurshipwith particular application to African problems. Thecurricular redesign should involve inputs from industryand non-tertiary academic institutions, as well as otherstakeholders. If the curricula are to focus on the solu-tion of African problems, then the pedagogical approachshould be one of experiential learning. Experientiallearning can also be conducive and supportive of strongUILs in Africa, which would also encourage the privatesector to support tertiary institutions.
A radical restructuring and redirection of tertiaryeducation toward S&T is not likely to be successfulunless primary and secondary education is also re-designed to emphasize S&T to prepare students for the new curriculum at the tertiary level. Finally, it maybe necessary for tertiary educational systems to moveaway from the disciplinary silos approach and allow students to take courses from many disciplines beforedeclaring a major. Allowing students to pursue a pro-gram of general education before specializing in a par-ticular field will not only broaden the outlook of thestudents but also allow them to combine several areas,thus getting a more rounded education. Successfulentrepreneurs, for example, are generally those whocombine skills from different fields to solve a problem.Constraining students to a particular field, as the currentsystem does, limits the problem-solving potential ofthese graduates.
Achieving high quality and relevance in tertiaryeducational programs may be impossible without quality
62
2.1:
Ref
orm
ing
High
er E
duca
tion
The Africa Competitiveness Report 2011 © 2011 World Economic Forum, the World Bank and the African Development Bank
governance and leadership. Thus the quality of gover-nance in tertiary educational systems in African coun-tries needs to improve. In practically all five countries,the heavy hand of government in the governance of tertiary education is everywhere, both at the systemslevel and the institutional level. Although most coun-tries have buffer bodies that make policy and set general rules and standards for the system, most members ofthese bodies are chosen by the government and aredirectly responsible to the minister of education or thehead of state. More often, governments have used theirappointing powers to staff these bodies with politicalsupporters. These factors have led to decisions based onpolitical considerations rather than on what is in thelong-term interest of tertiary education. Making theseboards truly independent of political control—throughmechanisms such as staggered terms that are far longerthan any presidential term, and the ability to remain inoffice once appointed and confirmed, regardless ofchanges in the political environment—would be a steptoward effective leadership.
Internally, the current system of hiring the chiefexecutives and the appointment of university councilsinvolves a great deal of political influence. Thus the current process may not yield the best candidate to leadthe institution but rather one whose political views maybe similar to those of the incumbent government. Away to overcome this is for the chief executive to bechosen through a competitive, transparent hiringprocess conducted by an independent search committeeformed by the university community at large with theparticipation of other stakeholders. In addition to hir-ing, the chief executive should be responsible to anindependent board of trustees dedicated to the longterm-interests of the institution. The board would thenset the standards of performance for the chief executiveand provide the incentives (both positive and negative)to achieve these objectives.
FinancingThe current system of financing tertiary education in the five countries, and in Africa generally, is not sustainable. These countries need to explore several possible additional sources of funding. The establish-ment of endowment funds to finance tertiary educationis a well-established practice in North American andEuropean universities, yet this is not a funding sourcethat has been explored by African universities.Administrations of tertiary educational institutions couldapproach their alumni, businesses, foundations, individ-uals, and families to contribute to endowment funds. Inthis connection, the universities could forge strong linkswith their alumni in the diaspora. Businesses could beencouraged—through tax breaks and other incentives—to contribute to endowed research and teaching profes-sorships in their fields of interest.
Another possible source of funding is the entrepre-neurial activities of the universities themselves.Although some tertiary educational institutions offershort courses at more than their cost, there are far toofew of these courses. Given the pent-up demand forsuch courses, tertiary institutions should expand theseprograms. These institutions can also raise additionalfunding through consulting and other contract researchwith business and other government entities. Thisrequires close cooperation with businesses—hence theimportance of establishing strong and extended UILs.The use of this source of funding is also likely toincrease the relevance of tertiary education for Africaneconomies, since the research and teaching efforts of theinstitutions are likely to focus on African problems ifthey rely in part on industry collaboration for funding.This source of funding and the associated UILs will besuccessful only if university faculty and students aregiven appropriate incentives to work with industry.
Another possible source of funding of tertiary edu-cation is emigration “fees.” A disproportionately largeshare of the students of African tertiary institutions emigrate to work in developed countries and the oil-exporting Gulf countries after graduation. While thedestination countries benefit from the skills of theseemigrants, they do not contribute to the cost of theirtraining. Since African countries are training graduatesfor the use of destination countries, they could negoti -ate with the destination countries to pay a training feefor their services. This could be a fixed amount for each graduate employed by the destination country. The income so generated could then be used to fundexpansion and quality improvements in African tertiaryinstitutions to finance more training.
The role of development partnersMultilateral and bilateral development partners can com-plement the efforts of African countries to improve ter-tiary education. Given that one of the major constraintson expanding, improving, and transforming tertiary education in Africa is a lack of funding, developmentpartners can help African countries by providing addi-tional funding and educational resources. Currently,development partners provide very little direct support,if any, for tertiary education, although they do providesupport for education generally. One of the reasons forthis lack of support for tertiary education stems from theperceived belief that it does not contribute to socialdevelopment as much as earlier education. However,with the publication of the World Bank’s 2008 reporton the subject, this perception is now changing.47
Modest external financial support directed specifi-cally at the tertiary educational sector in African coun-tries could achieve major improvements to the sector.The funding should be strictly targeted for specific pur-poses and should be in addition to, rather than in placeof, countries’ own contributions. The contribution of
63
2.1:
Ref
orm
ing
High
er E
duca
tion
The Africa Competitiveness Report 2011 © 2011 World Economic Forum, the World Bank and the African Development Bank
development partners could be conditional on extracontributions by African countries. To ensure that thesefunds are effectively utilized to expand, improve, andtransform tertiary education, they could be given on acash-on-provision basis—that is, countries actuallyreceive the funding only if they deliver the desired out-come. In addition to financing, institutions of higherlearning in development partner countries can helpimprove tertiary education in African countries by pro-viding and sharing reading and other library resources,especially electronic materials. Finally, these institutionscould provide free educational materials—such as thoseprovided by MIT’s OpenCourseWare—to African universities.48
In addition, development partners—such as theAfrican Development Bank and the World Bank—could support the training of senior tertiary educationstaff in education management techniques and curriculadevelopment. One of the major weaknesses in Africantertiary education is weakness in its governance andadministration, especially as they relate to curriculardevelopment, enrollment management, optimalresource combination, and cost reduction. This trainingcould involve collaborative arrangements whereby sen-ior managers from institutions in a development partnercountry are seconded to institutions in an African coun-try to help in developing institutional management andstaff. This training should be done in African countriesso that any management training not only focuses onwhat is of importance to the African countries but alsotakes into consideration African institutions and envi-ronment.
Clearly, African tertiary educational institutionshave a lot of work in front of them. There are manychallenges to transforming them into effective, relevant,and accessible institutions that work for African coun-tries. But it is possible to make use of the lessons thathave been learned in some of the five countries consid-ered here, and the potential rewards are great.
Notes1 World Bank 2008a.
2 Barro and Lee 2010; Gyimah-Brempong et al. 2006; Krueger and
Lundhal 2001; Mankiw et al. 1992; Self and Grabowski 2003;
World Bank 2008a; World Economic Forum 2009; among others.
3 Caselli and Coleman 2006.
4 Commission on Growth and Development 2008. The report
reflects the views of a Commission consisting of 19 well-known
and experienced policy, government, and business leaders, mostly
from the developing world, and two renowned economists. It was
written over two years during which the Commission interacted,
consulted with, and learned from leading academics, business
leaders, policymakers, and NGOs. The report reflects the learning
over this period and is informed by the Commission members’
own experience.
5 Teal 2010.
6 Altinok and Murseli 2006; Hanushek and Kimko 2000; Hanushek
and Wobmann 2007.
7 Morley at al. 2009.
8 Hanushek and Kimko 2000.
9 Landes 1998.
10 Bloom et al. 2006.
11 World Bank 2008a.
12 UNESCO 2007. According to UNESCO, the gross enrollment ratio,
tertiary level, is the sum of all tertiary-level students enrolled at
the start of the school year, expressed as a percentage of the mid-
year population in the 5-year age group after the official secondary
school–leaving age.
13 Republic of Kenya 2008a.
14 Republic of Kenya 2010.
15 Teshome and Kebede 2009.
16 See Republic of Kenya, 2008a.
17 See World Bank 2008b.
18 Psacharopoulus and Patronis 2004.
19 Nyarko 2010.
20 See Republic of Kenya 2008a.
21 See Altbach et al. 2009.
22 Bjarnason et al. 2009.
23 See Alemu 2010; Levy 2007; Materu 2007; Oketch 2004.
24 Government of Botswana 2008.
25 This assessment is based on UNESCO 2007.
26 ISIC refers to International Standard Industrial Classification of all
economic activities. The ISIC Code 2212 refers to the publishing
of newspapers, journals, and periodicals. This is the code descrip-
tion and numeric code of an international classification system.
27 Gyimah-Brempong, forthcoming.
28 Schumpeter 2003.
29 Tracey and Phillips 2007.
30 UNESCO 2007.
31 Urban 2010.
32 Urban 2010.
33 Kabongo 2009.
34 Styrdom and Adams 2009.
35 Mafala 2009.
36 Moremong-Nganunu et al. 2008.
37 Republic of Kenya 1988.
38 Bosma and Harding 2007.
39 Act 2002-80, Tunisia’s 2002 Educational Reform Act.
40 World Bank 2010.
41 Caselli and Coleman 2006.
42 Chesbrough 2007.
43 Kruss and Peterson 2009.
44 Republic of Kenya 2008b.
45 Government of the Republic of South Africa 2002.
46 Kruss et al. 2009.
47 World Bank 2008a.
48 The Massachusetts Institute of Technology provides free, online
lecture notes, exams, and videos through its OpenCourseWare
program. See http://ocw.mit.edu/index.htm for more information.
64
2.1:
Ref
orm
ing
High
er E
duca
tion
The Africa Competitiveness Report 2011 © 2011 World Economic Forum, the World Bank and the African Development Bank
ReferencesAbdessalam, T. 2010. “Financing Higher Education in Tunisia.” In
Financing Higher Education in Arab Countries, ed. A. Galal and T.
Kanaan. Cairo: Economic Research Forum Policy Research
Report. PRR No. 34. 117–38.
AfDB (African Development Bank). 2011. “Economic Recovery and
Competitiveness: The Case of Tunisia, Tunis.” Study undertaken
by the African Development Bank.
Alemu, D. S. 2010. “Expansion vs. Quality: Emerging Issues of
For-Profit Private Higher Education Institutions in Ethiopia.”
International Review of Education 56: 51–61.
Altbach, P. G., L. Reisberg, and L. E. Rumbley 2009. Trends in Global
Higher Education: Tracking an Academic Revolution. Report
prepared for the UNESCO 2009 World Conference on Higher
Education. Paris: UNESCO.
Altinok, N. and H. Murseli. 2006. “International Database on Human
Capital Quality.” Economic Letters 96 (2): 237–44.
Atuahene, F. 2009. “Financing Higher Education through Value Added
Tax: A Review of the Contribution of Ghana Education Trust Fund
(GETFund) in Fulfillment of Act 581.” Journal of Higher Education
in Africa 7 (3): 29–60.
Avanitis, R. and M. Hatem. 2008. “Innovation Policies in the Context of
North Africa: New Trends in Morocco and Tunisia.” MPRA
Working Paper No. 17939. Munich: University Library of Munich,
Germany.
Barro, R. and J-W. Lee. 2010. “A New Data Set of Educational
Attainment in the World, 1950–2010.” NBER Working Paper No.
15902. Cambridge, MA: National Bureau of Economic Research.
Bjarnason, S., K-M Cheng, J. Fielden, M.-J. Lemaitre, D. Levy, and N. V.
Varghese. 2009. “A New Dynamic: Private Higher Education.”
Paper presented at the UNESCO World Conference on Higher
Education, Paris, July 5–8.
Bloom, D., D. Canning, and K. Chan. 2006. “Higher Education and
Economic Development in Africa.” World Bank Policy Working
Paper. Washington DC: World Bank.
Bosma, N. and R. Harding. 2007. Global Entrepreneurship Monitor 2006
Summary Results. Babson Park, MA, and London: Babson
College and London Business School.
Brock-Utne, B. 2003. “Formulating Higher Education Policies in Africa:
The Pressure from External Forces and the Neoliberal Agenda.”
Journal of Higher Education in Africa 1 (1): 24–56.
Brookes, M. and N. Becket. 2007. ”Quality Management in Higher
Education: A Review of International Issues and Practice.”
International Journal for Quality and Standards 1 (1): 1–37.
Caselli, F. and W. J. Coleman. 2006. “The World Technology Frontier.”
American Economic Review 96 (2): 499–522.
Chesbrough, H. 2007. Open Business Models. Cambridge, MA: Harvard
Business School Press.
Commission on Growth and Development. 2008. The Growth Report:
Strategies for Sustained Growth and Inclusive Development.
Washington DC: World Bank.
Downs, C. 2010. “Increasing Equity and Compensating Historically
Academically Disadvantaged Students at a Tertiary Level: Benefits
of a Science Foundation Programme as a Way of Access.”
Teaching in Higher Education 15 (1): 97–107.
European Commission. 2010. Labor Markets Performance and
Migration Flows in Arab Mediterranean Countries: Determinants
and Effects. Volume 2: National Background Papers Maghreb
(Morocco, Algeria, Tunisia). European Economy Occasional Papers
No. 60. April.
Farstad, H. 2002. Integrated Entrepreneurship Education in Botswana,
Uganda, and Kenya: Final Report. Oslo: National Institute of
Technology.
Galal, A. and T. Kanaan. 2010. “Financing Higher Education in Arab
Countries.” Economic Research Forum Policy Research Report
No. 34. Cairo: Economic Research Forum (ERF).
Giuliani, E., A. Morrison, C. Pietrobelli, and R. Rabellotti. 2010. “Who
Are the Researchers that Are Collaborating with Industry? An
Analysis of the Wine Sectors in Chile, South Africa, and Italy.”
Research Policy 39 (6): 748–61.
Giuliani, E. and V. Arza. 2009. “What Drives the Formation of ‘Valuable’
University-Industry Linkages? Insights from the Wine Industry.”
Research Policy 38 (6): 905–21.
Govender, K. 2008. “Addressing Employability and Fostering
Entrepreneurship among University Students in South Africa: An
Analysis of the ‘Junior Enterprise Concept.’” Master’s Thesis,
University of KwaZulu-Natal, Durban, South Africa.
Government of Botswana 2008. Towards a Knowledge Society: Tertiary
Education Policy. April. Ministry of Education: Gaborone,
Botswana.
Government of the Republic of South Africa. 2002. South Africa’ s
National Research and Development Strategy. Pretoria: DST
(Department of Science and Technology).
Gyimah-Brempong, K. Forthcoming. “Education.” In Oxford Companion
to Economics of Africa, ed. E. Aryeetey, S. Devrajan, R. Kanbur,
and L. Kasekende. Oxford: Oxford University Press.
Gyimah-Brempong, K., O. Paddison, and W. Mitiku. 2006. “Higher
Education and Economic Growth in Africa.” Journal of
Development Studies 42 (3): 509–29.
Hanushek, E. A. and D. D. Kimko. 2000, “Schooling, Labor-Force
Quality, and the Growth of Nations.” The American Economic
Review 90 (5): 1184–208.
Hanushek, E. and L. Wobmann. 2007. “The Role of Education Quality in
Economic Growth.” World Bank Policy Research Working Paper
No. 4122. Washington DC: World Bank.
infoDev. 2007. Survey of ICT and Education in Africa. Volume 2: 53
Country Reports. Available at http://www.infodev.org.
Jamison, E. A., D. T. Jamison, and E. A. Hanushek. 2007. “The Effects
of Education Quality on Income Growth and Mortality Decline.”
Economics of Education Review 26 (6): 771–88.
Johnstone, D. B. 2004. “Higher Education Finance and Accessibility:
Tuition Fees and Student Loans in Sub-Saharan Africa.” Journal of
Higher Education in Africa 2 (2): 11–36.
Kabongo, J. D. 2009. “The Status of Entrepreneurship Education in
Colleges and Universities in Sub-Saharan Africa.” Department of
Business Administration, Millersville University, Millersville PA.
Available at https://www.decisionsciences.org/Proceedings/
DSI2008/docs/545-2365.pdf.
Krueger, A. and M. Lindhal. 2001. “Education for Growth: Why and for
Whom.” Journal of Economic Literature 34: 1101–36.
Kruss, G., J. Lorentzen, and I. Petersen. 2009. Knowledge for
Development: University-Firm Interaction in Sub-Saharan Africa.
Final Report, IDRC Project No. 103470-009. Cape Town: Human
Science Research Council.
Landes, D. 1998. The Wealth and Poverty of Nations. London: Abacus.
Levy, D. 2007. “A Recent Echo: African Private Higher Education in an
International Perspective.” Journal of Higher Education in Africa 5
(2&3): 197–220.
Mabizala, M., D.C. Levy, and W. Otieno. 2011. “Private Surge amid
Public Dominance: Dynamics of the Private Provision of Higher
Education in Africa.” Journal of Higher Education in Africa Special
Issue 5 (2 & 3). Forthcoming.
Mafala, L. 2009. “Entrepreneurship Education and Community
Outreach at the University of Botswana.” Eastern Africa Social
Science Research Review 25 (2): 31–52.
Mankiw, G., D. Romer, and D. Weil. 1992. “A Contribution to the
Empirics of Economic Growth.” Quarterly Journal of Economics
107 (2): 407–437.
Martínez, A. C., J. Levie, D. J. Kelley, R. J. Saemundsson, and T.
Schøtt. 2010. Global Entrepreneurship Monitor Special Report: A
Global Perspective on Entrepreneurship Education and Training.
Global Entrepreneurship Monitor (GEM). Available at
http://www3.babson.edu/ESHIP/research-publications/upload/
GEM_Education_Training_Report.pdf.
65
2.1:
Ref
orm
ing
High
er E
duca
tion
The Africa Competitiveness Report 2011 © 2011 World Economic Forum, the World Bank and the African Development Bank
Materu, P. 2007. “Higher Education Quality Assurance in Sub-Saharan
Africa: Status, Challenge, Opportunities, and Promising
Practices.” World Bank Working Paper No. 124. Washington DC:
World Bank.
Mingat, A., B. Ledoux, and R. Rakotomalala. 2010. Developing Post-
Primary Education in Sub-Saharan Africa: Assessing the Financial
Sustainability of Alternative Pathways. Washington DC: World
Bank.
Moremong-Nganunu, T., E. Cunningham, and K. Hindle. 2008.
“Evaluating the World’s Largest Entrepreneurial Education
Program.” AGSE 2008: 83–97. Available at http://www.
swinburne.edu.au/lib/ir/onlineconferences/agse2008/000138.pdf.
Morley, L., F. Leach, and R. Lugg. 2009. “Democratising Higher
Education in Ghana, Tanzania: Opportunity Structures and Social
Inequalities.” International Journal of Education Development 29
(1): 56–64.
Nafukho, F. and M. A. Helen Muyia. 2010. “Entrepreneurship and
Socioeconomic Development in Africa: A Reality of Myth?”
Journal of European Industrial Training 34 (2): 96–109.
Ngengebule, T. 2009. An Overview and Analysis of Policy for Distance
Education in South African Higher Education: Roles Identified for
Distance Education and Developments in the Arena from 1948.
South African Institute for Distance Education. Available at
http://www.saide.org.za/frontend/.
Ng’ethe, N., G. Subotzky, and G. Afeti. 2008. “Differentiation and
Articulation in Tertiary Education Systems: A Study of Twelve
African Countries.” World Bank Working Paper No. 145.
Washington DC: World Bank.
Nyarko, Y. 2010. “EU Policies and African Human Capital
Development.” EUI Working Paper RSCAS 2010/30. San
Domenico di Fiesole, Italy: European Report on Development
(ERD). Available at http://cadmus.eui.eu/bitstream/handle/
1814/13856/RSCAS_2010_30.pdf?sequence=1.
OECD (Organisation for Economic Co-operation and Development).
2008. Review of National Policies for Education: South Africa.
Paris: OECD.
Oketch, M. O. 2004. “The Emergence of Private University Education in
Kenya: Trends, Prospects, and Challenges.” International Journal
of Educational Development 24 (2): 119–36.
Otieno, W. and D. Levy. 2007. “Public Disorder, Private Boon?
Inter-Sectoral Dynamics Illustrated by Kenyan Case.” PROPHE
Working Paper No. 9. Albany, NY: SUNY at Albany.
Psacharopoulus, G, and H. A. Patronis. 2004. “Returns to Investment
in Education: A Further Update.” Education Economics 12 (2):
111–34.
Raufflet, E. 2009. “Mobilizing Business for Post-Secondary Education:
CIDA University, South Africa.” Journal of Business Ethics 89 (2):
191–202.
Republic of Kenya. 1988. Report of the Presidential Working Party
on Education and Manpower Training for the Next Decade and
Beyond (Kamunge Report). Nairobi: Government Printer.
———. 2008a. The Development of Education: National Report of
Kenya. Report presented by the Ministry of Education at the
International Conference on Education, Geneva, November 25–28.
———. 2008b. Investing in the Future of University Education: The
National Strategy for University Education, 2007– 2015. Nairobi,
Kenya: Ministry of Higher Education, Science and Technology.
Report prepared by the Taskforce for the Development of the
National Strategy for University Education and presented to the
Ministry of Higher Education, Science and Technology, June.
———. 2010. Commission for Higher Education Annual Report and
Database. Nairobi: Ministry of Higher Education, Research,
Science and Technology.
Saint, W. and C. Lao with P. Materu. 2009. “Legal Frameworks
for Tertiary Education in Sub-Saharan Africa: The Quest for
Institutional Responsiveness.” World Bank Working Paper
No. 175. Washington DC: World Bank.
SARUA (Southern African Regional Universities Association). 2009.
SARUA handbook. Available at www.sarua.org.
Sawyyer, A. and B. Boubakar. 2009. “African Higher Education
and Industry: What Are the Linkages?” Annual World Bank
Conference on Development Economics, ed. Y. Lin and B.
Pleskovic. Oxford: Oxford University Press for the World Bank.
Schumpeter, J. A. 2003. The Theory of Economic Development: An
Inquiry into Profits, Credit, Capital, Interest and the Business
Cycle. Springer.
Self, S. and R. Grabowski. 2004. “Does Education at All Levels Cause
Growth? India, a Case Study.” Economics of Education Review
23 (1): 47–55.
Styrdom, R. and M. Adams. 2009. “Evaluating the Learning Experience
of Undergraduate Entrepreneurship Students Exposed to an
Unconventional Teaching Approach: A South African Case Study.”
Southern African Journal for Entrepreneurship and Small Business
Management 2 (1): 50–67.
Teal, F. 2010. “Higher Education and Economic Development in Africa:
A Review of Channels and Interactions.” Center for Study of
African Economies Working Paper No. 33. Oxford: Oxford
University, Center for Study of African Economies.
Tefera, T. L., A. Tegegne, and D. Hoekstra. 2009. “Linking Graduate
Research to Market-Oriented Agricultural Development: IPMS
Experience with Ethiopian Higher Learning Institutions.” Paper
presented at the 5th International Conference on Ethiopian
Development Studies, Adama University, Adama, Ethiopia,
November 12–14.
Teshome, T. and K. Kebede. 2009. “Quality Assurance for Enhancement
of Higher Education in Ethiopia: Challenges Faced and Lessons
Learned.” Paper presented at the10th Biennial INQAAHE
Conference, March 30–April 2, Dubai, United Arab Republic.
Tessema, A. 2009. “The Unfolding Trends and Consequences of
Expanding Higher Education in Ethiopia: Massive Universities,
Massive Challenges.” Higher Education Quarterly 63 (1): 29–45.
Tracey, P. and N. Phillips. 2007. “The Distinctive Challenges of
Educating Social Entrepreneurs: A Postscript and Rejoinder to the
Special Issues on Entrepreneurship Education.” Academy of
Management Learning and Education 6 (2): 264–271.
UNESCO. 2007. UNESCO National Education Support Strategy. Paris:
UNESCO.
UIS (UNESCO Institute for Statistics). 2008. Data Centre. Available at
http://www.uis.unesco.org/ev.php?ID=2867_201&ID2=DO_TOPIC.
———. 2009. Stats database. Available at http://stats.uis.unesco.org/
unesco/TableViewer/tableView.aspx?ReportId=172.
Urban, B., ed. 2010. Frontiers in Entrepreneurship. Berlin: Springer-
Verlag.
van Zyl, A., J. Amadi-Echendu, and T. J. D. Bothma. 2007. “Nine Drivers
of Knowledge Transfer Between Universities and Industry R&D
Partners in South Africa.” South African Journal of Information
Management 9 (1): March.
World Bank. 2008a. Accelerating Catch Up: Tertiary Education for
Growth in Africa. Washington DC: World Bank.
———. 2008b. The Road Not Traveled: Education Reform in the Middle
East and Africa. Development Report. Washington DC: World
Bank.
———. 2010a. Financing Higher Education in Africa. Washington DC:
World Bank.
———. 2010b. World Development Indicators, 2010 online edition.
Available at http://data.worldbank.org/data-catalog/
world-development-indicators.
World Economic Forum. 2009. Educating the Next Wave of
Entrepreneurs: Unlocking Entrepreneurial Capabilities to Meet the
Global Challenges of the 21st Century. Geneva: World Economic
Forum.
———. 2010. The Global Competitiveness Report 2010– 2011. Geneva:
World Economic Forum.
66
2.1:
Ref
orm
ing
High
er E
duca
tion
The Africa Competitiveness Report 2011 © 2011 World Economic Forum, the World Bank and the African Development Bank
CHAPTER 2.2
Strengthening Women’sEntrepreneurshipMARY HALLWARD-DRIEMEIER, World Bank
The rate of women’s entrepreneurship is high in Africa—higher than in any other region. However, this is notnecessarily a sign of economic empowerment. Indeed,among entrepreneurs, the share of those who are self-employed compared with those who are employers ishighest in Africa, particularly in low-income sub-SaharanAfrica. While women account for 40 percent of thenon-agricultural labor force, they make up 50 percentof the self-employed but only 25 percent of employers.
Beyond the question of rates of entrepreneurship,there is also a question of whether there are perform-ance gaps between men’s and women’s enterprises.Among employers, we find that—after accounting fordifferences in size, sector, and industry—any gender gap in performance becomes statistically insignificant.Among the self-employed, there is more variation andsome evidence of gender gaps (particularly wherewomen work part-time and/or in rural areas). Rather,where gender patterns are most striking is in firm sizeand sector and industry type: women are disproportion-ately found in smaller firms, in the informal sector, andin lower-value-added industries. Thus the agenda forexpanding women’s economic opportunities is one of enabling women to move into higher-value-addedactivities, both in terms of taking the step from self-employment to being an employer, and in broadeningthe types of activities in which they engage.
This chapter begins by looking at gender-disaggregated patterns of entrepreneurship acrossregions, and then by income groups within Africa.1
It compares the performance of women’s and men’senterprises, focusing on the performance of employers,as the enterprises they run have the greatest productivityand growth potential. It examines the distribution bygender across types of entrepreneurial activities beingpursued. It shows the importance of controlling for key characteristics of enterprises (sector, size, industry)and entrepreneur (particularly education) in accountingfor most gender gaps in firm performance. In under-standing the differences in gender sorting across types of enterprises and entrepreneurial activities, the chapterexamines gender differences in human capital and accessto finance and assets. However, additional constraints inthe investment climate could also be important—withwomen entrepreneurs well positioned to identify them
67
2.2:
Str
engt
heni
ng W
omen
’s E
ntre
pren
eurs
hip
This chapter draws on the forthcoming work Expanding
Opportunities for Women Entrepreneurs in Africa by the same
author, with the assistance of Reyes Aterido, Mark Blackden,
Ousman Gajigo, Tazeen Hasan, and Alejandro Rasteletti. It also
complements the 2007 Africa Competitiveness Report chapter
“Gender, Entrepreneurship, and Competitiveness in Africa” by
Bardasi et al. It uses updated data from countries in the region,
compares self-employment with being an employer, and focuses
on additional dimensions of how to strengthen women’s oppor-
tunities—by addressing gender gaps in access to assets, incor-
porating a wider set of measures of human capital, and finding
ways to strengthen women’s voices in policymaking decisions.
The Africa Competitiveness Report 2011 © 2011 World Economic Forum, the World Bank and the African Development Bank
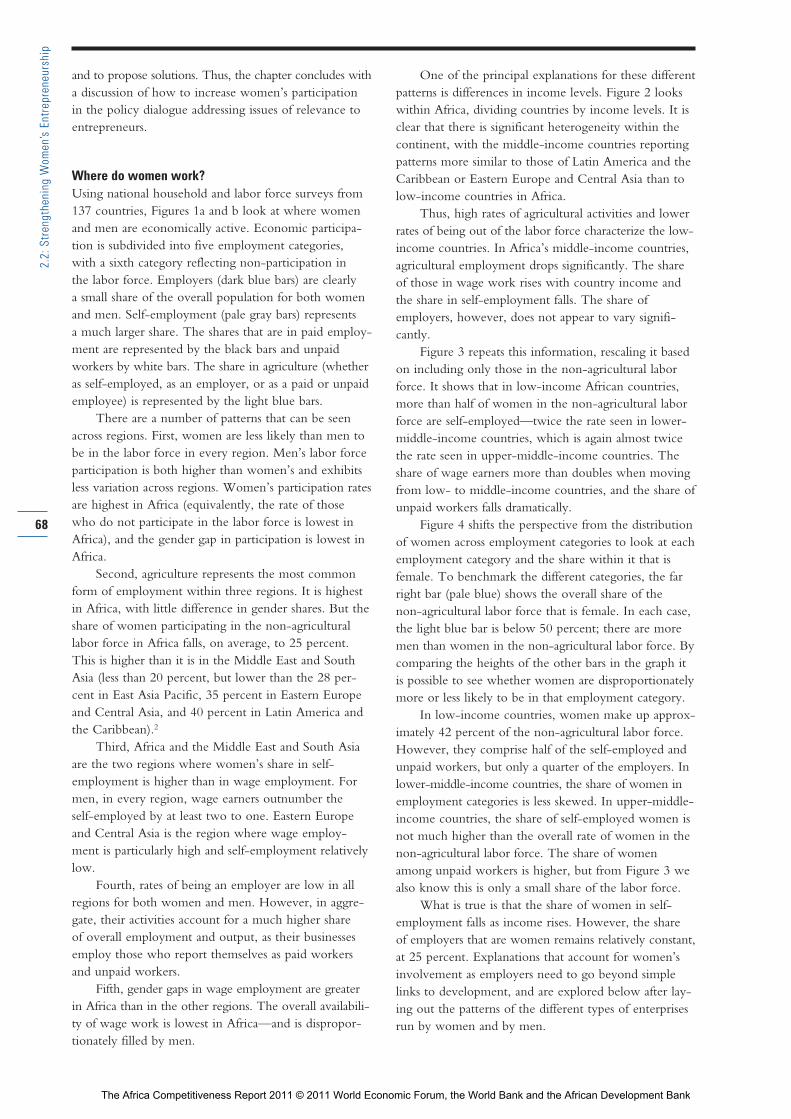
and to propose solutions. Thus, the chapter concludes witha discussion of how to increase women’s participationin the policy dialogue addressing issues of relevance toentrepreneurs.
Where do women work?Using national household and labor force surveys from137 countries, Figures 1a and b look at where womenand men are economically active. Economic participa-tion is subdivided into five employment categories, with a sixth category reflecting non-participation in the labor force. Employers (dark blue bars) are clearly a small share of the overall population for both womenand men. Self-employment (pale gray bars) represents a much larger share. The shares that are in paid employ-ment are represented by the black bars and unpaidworkers by white bars. The share in agriculture (whetheras self-employed, as an employer, or as a paid or unpaidemployee) is represented by the light blue bars.
There are a number of patterns that can be seenacross regions. First, women are less likely than men tobe in the labor force in every region. Men’s labor forceparticipation is both higher than women’s and exhibitsless variation across regions. Women’s participation ratesare highest in Africa (equivalently, the rate of thosewho do not participate in the labor force is lowest inAfrica), and the gender gap in participation is lowest inAfrica.
Second, agriculture represents the most commonform of employment within three regions. It is highestin Africa, with little difference in gender shares. But theshare of women participating in the non-agriculturallabor force in Africa falls, on average, to 25 percent.This is higher than it is in the Middle East and SouthAsia (less than 20 percent, but lower than the 28 per-cent in East Asia Pacific, 35 percent in Eastern Europeand Central Asia, and 40 percent in Latin America andthe Caribbean).2
Third, Africa and the Middle East and South Asiaare the two regions where women’s share in self-employment is higher than in wage employment. Formen, in every region, wage earners outnumber the self-employed by at least two to one. Eastern Europeand Central Asia is the region where wage employ-ment is particularly high and self-employment relativelylow.
Fourth, rates of being an employer are low in allregions for both women and men. However, in aggre-gate, their activities account for a much higher share of overall employment and output, as their businessesemploy those who report themselves as paid workersand unpaid workers.
Fifth, gender gaps in wage employment are greaterin Africa than in the other regions. The overall availabili-ty of wage work is lowest in Africa—and is dispropor-tionately filled by men.
One of the principal explanations for these differentpatterns is differences in income levels. Figure 2 lookswithin Africa, dividing countries by income levels. It isclear that there is significant heterogeneity within thecontinent, with the middle-income countries reportingpatterns more similar to those of Latin America and theCaribbean or Eastern Europe and Central Asia than tolow-income countries in Africa.
Thus, high rates of agricultural activities and lowerrates of being out of the labor force characterize the low-income countries. In Africa’s middle-income countries,agricultural employment drops significantly. The shareof those in wage work rises with country income andthe share in self-employment falls. The share ofemployers, however, does not appear to vary signifi-cantly.
Figure 3 repeats this information, rescaling it basedon including only those in the non-agricultural laborforce. It shows that in low-income African countries,more than half of women in the non-agricultural laborforce are self-employed—twice the rate seen in lower-middle-income countries, which is again almost twicethe rate seen in upper-middle-income countries. Theshare of wage earners more than doubles when movingfrom low- to middle-income countries, and the share ofunpaid workers falls dramatically.
Figure 4 shifts the perspective from the distributionof women across employment categories to look at eachemployment category and the share within it that isfemale. To benchmark the different categories, the farright bar (pale blue) shows the overall share of the non-agricultural labor force that is female. In each case,the light blue bar is below 50 percent; there are moremen than women in the non-agricultural labor force. Bycomparing the heights of the other bars in the graph itis possible to see whether women are disproportionatelymore or less likely to be in that employment category.
In low-income countries, women make up approx-imately 42 percent of the non-agricultural labor force.However, they comprise half of the self-employed andunpaid workers, but only a quarter of the employers. Inlower-middle-income countries, the share of women inemployment categories is less skewed. In upper-middle-income countries, the share of self-employed women isnot much higher than the overall rate of women in thenon-agricultural labor force. The share of womenamong unpaid workers is higher, but from Figure 3 wealso know this is only a small share of the labor force.
What is true is that the share of women in self-employment falls as income rises. However, the share of employers that are women remains relatively constant,at 25 percent. Explanations that account for women’sinvolvement as employers need to go beyond simplelinks to development, and are explored below after lay-ing out the patterns of the different types of enterprisesrun by women and by men.
68
2.2:
Str
engt
heni
ng W
omen
’s E
ntre
pren
eurs
hip
The Africa Competitiveness Report 2011 © 2011 World Economic Forum, the World Bank and the African Development Bank
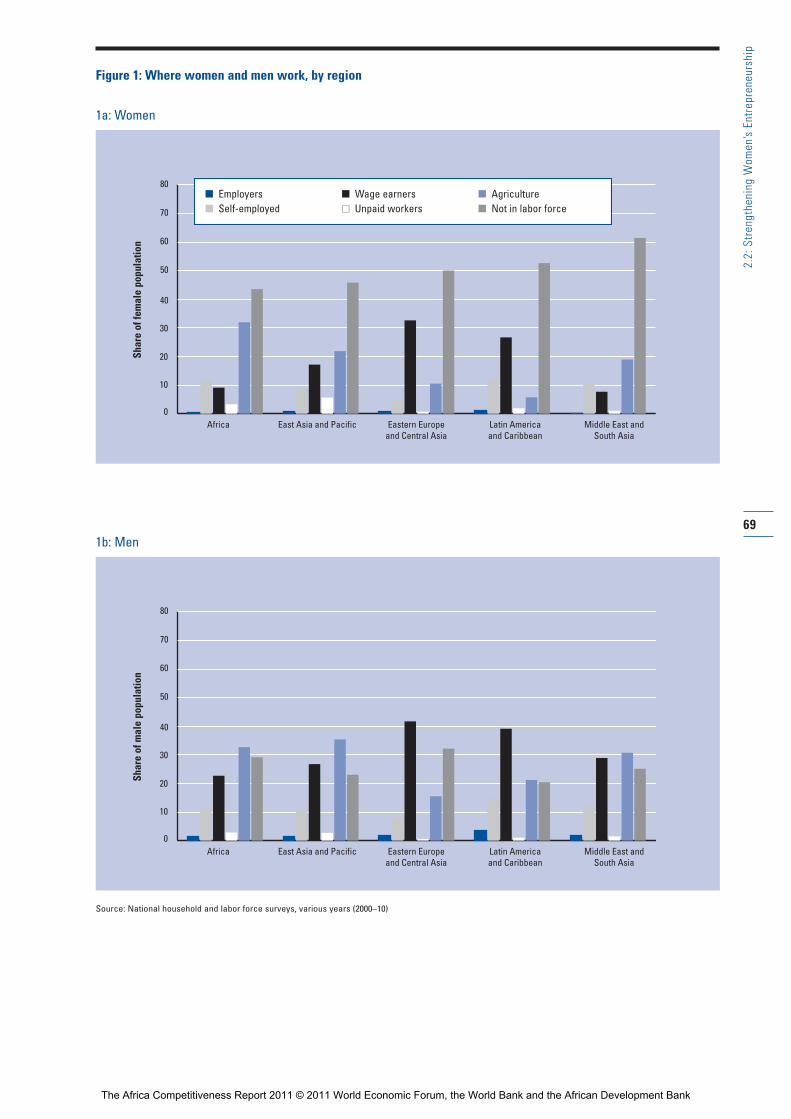
69
2.2:
Str
engt
heni
ng W
omen
’s E
ntre
pren
eurs
hip
0
10
20
30
40
50
60
70
80
Latin Americaand Caribbean
Eastern Europeand Central Asia
East Asia and PacificAfrica Middle East andSouth Asia
0
10
20
30
40
50
60
70
80
Latin Americaand Caribbean
Eastern Europeand Central Asia
East Asia and PacificAfrica Middle East andSouth Asia
1b: Men
Source: National household and labor force surveys, various years (2000–10)
Figure 1: Where women and men work, by region
1a: Women
n Employersn Self-employed
n Wage earnersn Unpaid workers
n Agriculturen Not in labor force
Shar
e of
fem
ale
popu
latio
nSh
are
of m
ale
popu
latio
n
The Africa Competitiveness Report 2011 © 2011 World Economic Forum, the World Bank and the African Development Bank
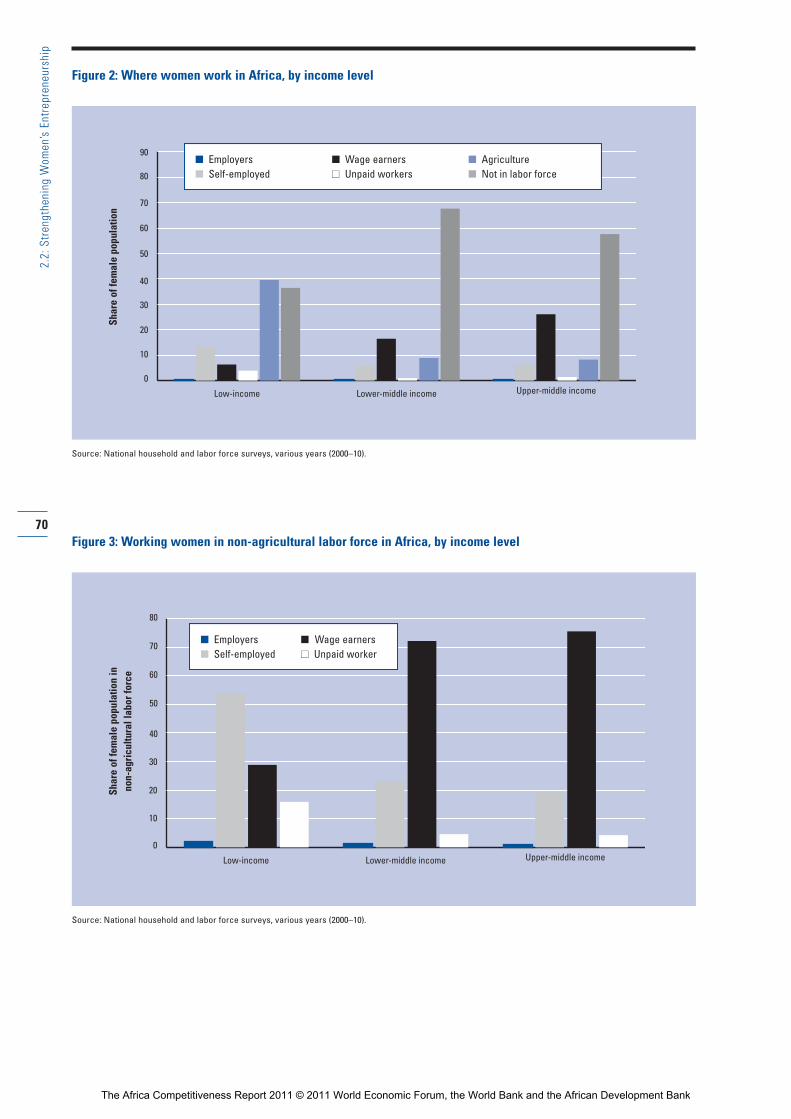
70
2.2:
Str
engt
heni
ng W
omen
’s E
ntre
pren
eurs
hip
Figure 2: Where women work in Africa, by income level
Source: National household and labor force surveys, various years (2000–10).
0
10
20
30
40
50
60
70
80
90
Lower-middle incomeLow-income Upper-middle income
Shar
e of
fem
ale
popu
latio
n
Figure 3: Working women in non-agricultural labor force in Africa, by income level
Source: National household and labor force surveys, various years (2000–10).
0
10
20
30
40
50
60
70
80
Low-income Lower-middle income Upper-middle income
Shar
e of
fem
ale
popu
latio
n in
no
n-ag
ricu
ltura
l lab
or fo
rce
n Employers n Self-employed
n Wage earnersn Unpaid worker
n Employers n Self-employed
n Wage earnersn Unpaid workers
n Agriculturen Not in labor force
The Africa Competitiveness Report 2011 © 2011 World Economic Forum, the World Bank and the African Development Bank
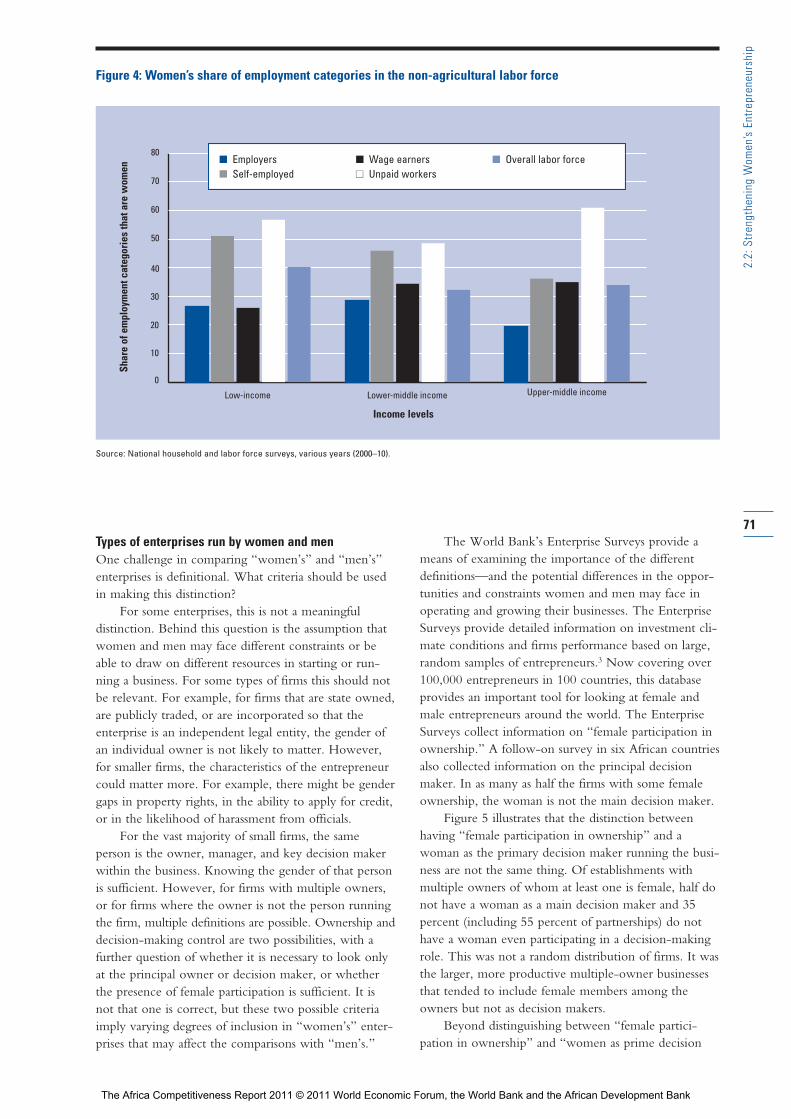
Types of enterprises run by women and menOne challenge in comparing “women’s” and “men’s”enterprises is definitional. What criteria should be usedin making this distinction?
For some enterprises, this is not a meaningful distinction. Behind this question is the assumption thatwomen and men may face different constraints or beable to draw on different resources in starting or run-ning a business. For some types of firms this should notbe relevant. For example, for firms that are state owned,are publicly traded, or are incorporated so that theenterprise is an independent legal entity, the gender ofan individual owner is not likely to matter. However, for smaller firms, the characteristics of the entrepreneurcould matter more. For example, there might be gendergaps in property rights, in the ability to apply for credit,or in the likelihood of harassment from officials.
For the vast majority of small firms, the same person is the owner, manager, and key decision makerwithin the business. Knowing the gender of that personis sufficient. However, for firms with multiple owners, or for firms where the owner is not the person runningthe firm, multiple definitions are possible. Ownership anddecision-making control are two possibilities, with afurther question of whether it is necessary to look onlyat the principal owner or decision maker, or whetherthe presence of female participation is sufficient. It isnot that one is correct, but these two possible criteriaimply varying degrees of inclusion in “women’s” enter-prises that may affect the comparisons with “men’s.”
The World Bank’s Enterprise Surveys provide ameans of examining the importance of the different definitions—and the potential differences in the oppor-tunities and constraints women and men may face inoperating and growing their businesses. The EnterpriseSurveys provide detailed information on investment cli-mate conditions and firms performance based on large,random samples of entrepreneurs.3 Now covering over100,000 entrepreneurs in 100 countries, this databaseprovides an important tool for looking at female andmale entrepreneurs around the world. The EnterpriseSurveys collect information on “female participation inownership.” A follow-on survey in six African countriesalso collected information on the principal decisionmaker. In as many as half the firms with some femaleownership, the woman is not the main decision maker.
Figure 5 illustrates that the distinction betweenhaving “female participation in ownership” and awoman as the primary decision maker running the busi-ness are not the same thing. Of establishments withmultiple owners of whom at least one is female, half donot have a woman as a main decision maker and 35percent (including 55 percent of partnerships) do nothave a woman even participating in a decision-makingrole. This was not a random distribution of firms. It wasthe larger, more productive multiple-owner businessesthat tended to include female members among theowners but not as decision makers.
Beyond distinguishing between “female partici -pation in ownership” and “women as prime decision
71
2.2:
Str
engt
heni
ng W
omen
’s E
ntre
pren
eurs
hip
Figure 4: Women’s share of employment categories in the non-agricultural labor force
Source: National household and labor force surveys, various years (2000–10).
0
10
20
30
40
50
60
70
80
Low-income Lower-middle income Upper-middle income
Shar
e of
em
ploy
men
t cat
egor
ies
that
are
wom
en
Income levels
n Employersn Self-employed
n Wage earners n Unpaid workers
n Overall labor force
The Africa Competitiveness Report 2011 © 2011 World Economic Forum, the World Bank and the African Development Bank
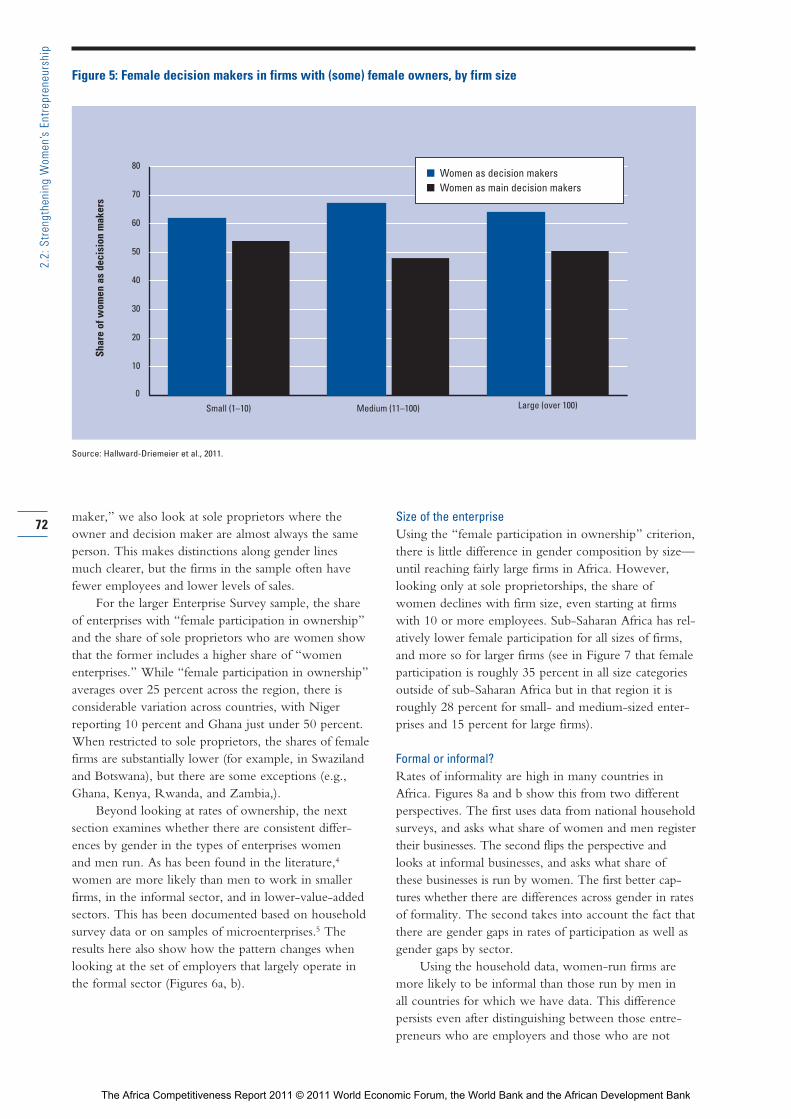
maker,” we also look at sole proprietors where theowner and decision maker are almost always the sameperson. This makes distinctions along gender lines much clearer, but the firms in the sample often havefewer employees and lower levels of sales.
For the larger Enterprise Survey sample, the shareof enterprises with “female participation in ownership”and the share of sole proprietors who are women showthat the former includes a higher share of “womenenterprises.” While “female participation in ownership”averages over 25 percent across the region, there is considerable variation across countries, with Nigerreporting 10 percent and Ghana just under 50 percent.When restricted to sole proprietors, the shares of femalefirms are substantially lower (for example, in Swazilandand Botswana), but there are some exceptions (e.g.,Ghana, Kenya, Rwanda, and Zambia,).
Beyond looking at rates of ownership, the next section examines whether there are consistent differ-ences by gender in the types of enterprises women and men run. As has been found in the literature,4
women are more likely than men to work in smallerfirms, in the informal sector, and in lower-value-addedsectors. This has been documented based on householdsurvey data or on samples of microenterprises.5 Theresults here also show how the pattern changes whenlooking at the set of employers that largely operate inthe formal sector (Figures 6a, b).
Size of the enterpriseUsing the “female participation in ownership” criterion,there is little difference in gender composition by size—until reaching fairly large firms in Africa. However,looking only at sole proprietorships, the share ofwomen declines with firm size, even starting at firmswith 10 or more employees. Sub-Saharan Africa has rel-atively lower female participation for all sizes of firms,and more so for larger firms (see in Figure 7 that femaleparticipation is roughly 35 percent in all size categoriesoutside of sub-Saharan Africa but in that region it isroughly 28 percent for small- and medium-sized enter-prises and 15 percent for large firms).
Formal or informal?Rates of informality are high in many countries inAfrica. Figures 8a and b show this from two differentperspectives. The first uses data from national householdsurveys, and asks what share of women and men registertheir businesses. The second flips the perspective andlooks at informal businesses, and asks what share ofthese businesses is run by women. The first better cap-tures whether there are differences across gender in ratesof formality. The second takes into account the fact thatthere are gender gaps in rates of participation as well asgender gaps by sector.
Using the household data, women-run firms aremore likely to be informal than those run by men in all countries for which we have data. This differencepersists even after distinguishing between those entre-preneurs who are employers and those who are not
72
2.2:
Str
engt
heni
ng W
omen
’s E
ntre
pren
eurs
hip
0
10
20
30
40
50
60
70
80
Medium (11–100)Small (1–10) Large (over 100)
Shar
e of
wom
en a
s de
cisi
on m
aker
s
Figure 5: Female decision makers in firms with (some) female owners, by firm size
Source: Hallward-Driemeier et al., 2011.
n Women as decision makers n Women as main decision makers
The Africa Competitiveness Report 2011 © 2011 World Economic Forum, the World Bank and the African Development Bank
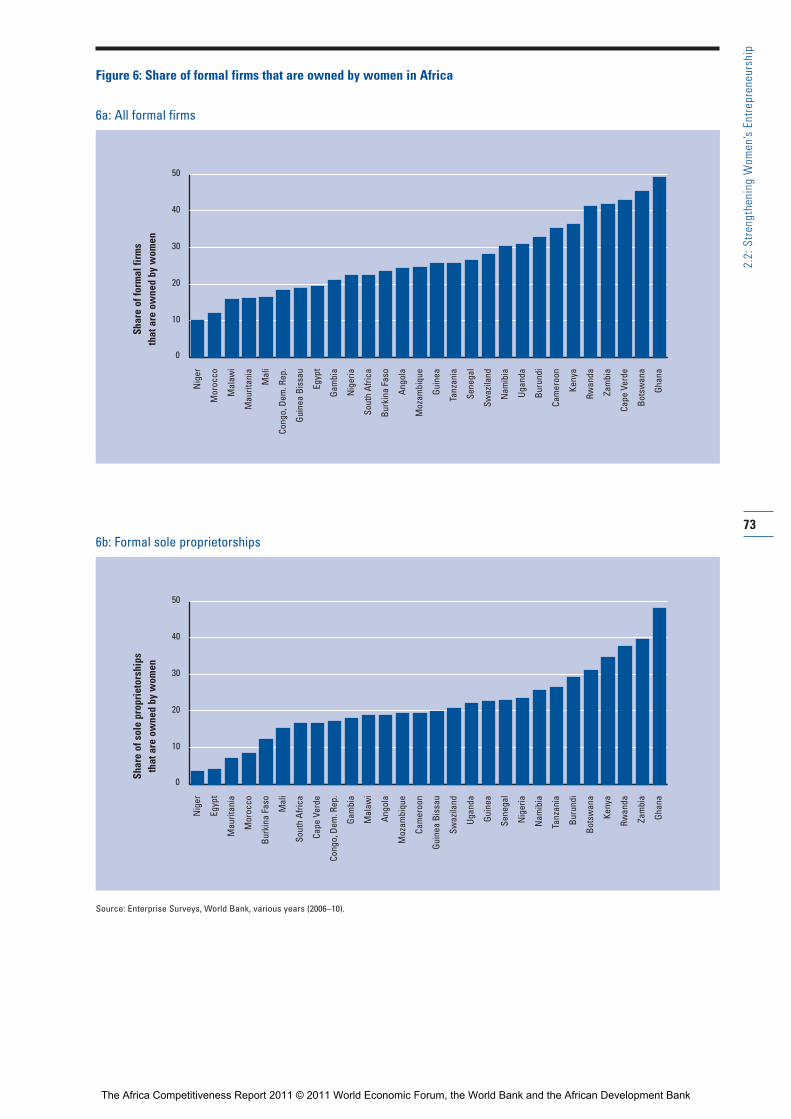
73
2.2:
Str
engt
heni
ng W
omen
’s E
ntre
pren
eurs
hip
0
10
20
30
40
50
Nig
er
Mor
occo
Mal
awi
Mau
ritan
ia
Mal
i
Cong
o, D
em. R
ep.
Guin
ea B
issa
u
Egyp
t
Gam
bia
Nig
eria
Sout
h Af
rica
Burk
ina
Faso
Ango
la
Moz
ambi
que
Guin
ea
Tanz
ania
Sene
gal
Swaz
iland
Nam
ibia
Ugan
da
Buru
ndi
Cam
eroo
n
Keny
a
Rwan
da
Zam
bia
Cape
Ver
de
Bots
wan
a
Ghan
a
0
10
20
30
40
50
Nig
er
Egyp
t
Mau
ritan
ia
Mor
occo
Burk
ina
Faso
Mal
i
Sout
h Af
rica
Cape
Ver
de
Cong
o, D
em. R
ep.
Gam
bia
Mal
awi
Ango
la
Moz
ambi
que
Cam
eroo
n
Guin
ea B
issa
u
Swaz
iland
Ugan
da
Guin
ea
Sene
gal
Nig
eria
Nam
ibia
Tanz
ania
Buru
ndi
Bots
wan
a
Keny
a
Rwan
da
Zam
bia
Ghan
a
6b: Formal sole proprietorships
Source: Enterprise Surveys, World Bank, various years (2006–10).
Figure 6: Share of formal firms that are owned by women in Africa
6a: All formal firmsSh
are
of fo
rmal
firm
s th
at a
re o
wne
d by
wom
enSh
are
of s
ole
prop
riet
orsh
ips
that
are
ow
ned
by w
omen
The Africa Competitiveness Report 2011 © 2011 World Economic Forum, the World Bank and the African Development Bank
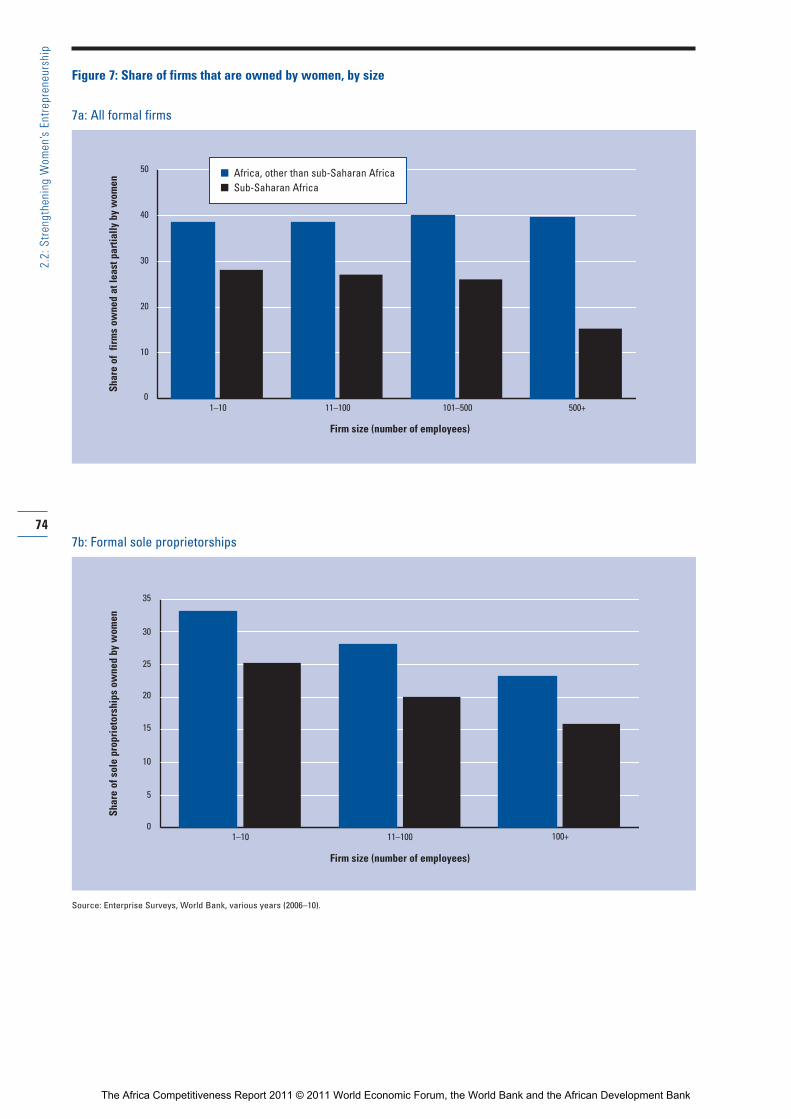
74
2.2:
Str
engt
heni
ng W
omen
’s E
ntre
pren
eurs
hip
0
10
20
30
40
50
101–50011–1001–10 500+
0
5
10
15
20
25
30
35
11–1001–10 100+
7b: Formal sole proprietorships
Source: Enterprise Surveys, World Bank, various years (2006–10).
Figure 7: Share of firms that are owned by women, by size
7a: All formal firms
n Africa, other than sub-Saharan Africa n Sub-Saharan Africa
Shar
e of
fir
ms
owne
d at
leas
t par
tially
by
wom
enSh
are
of s
ole
prop
riet
orsh
ips
owne
d by
wom
en
Firm size (number of employees)
Firm size (number of employees)
The Africa Competitiveness Report 2011 © 2011 World Economic Forum, the World Bank and the African Development Bank
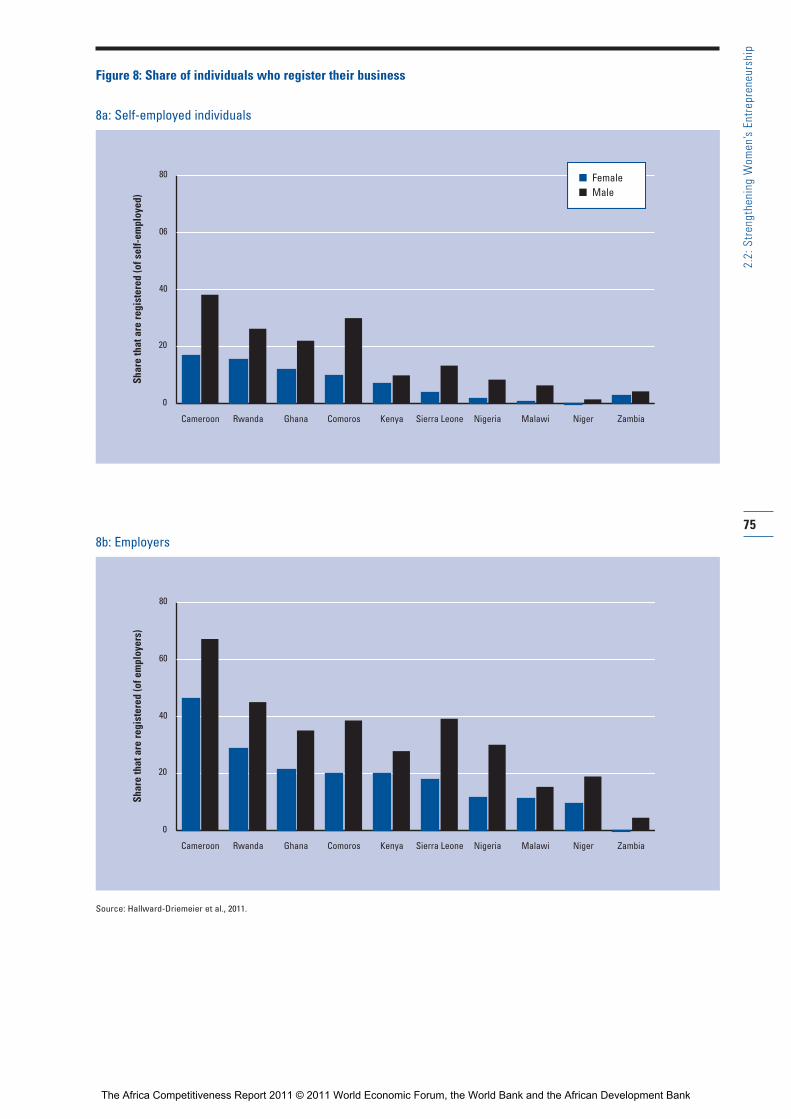
75
2.2:
Str
engt
heni
ng W
omen
’s E
ntre
pren
eurs
hip
0
20
40
06
80
Cameroon Rwanda Ghana Comoros Kenya Sierra Leone Nigeria Malawi Niger Zambia
0
20
40
60
80
Cameroon Rwanda Ghana Comoros Kenya Sierra Leone Nigeria Malawi Niger Zambia
8b: Employers
Source: Hallward-Driemeier et al., 2011.
Figure 8: Share of individuals who register their business
8a: Self-employed individualsSh
are
that
are
regi
ster
ed (o
f sel
f-em
ploy
ed)
Shar
e th
at a
re re
gist
ered
(of e
mpl
oyer
s)
n Female n Male
The Africa Competitiveness Report 2011 © 2011 World Economic Forum, the World Bank and the African Development Bank
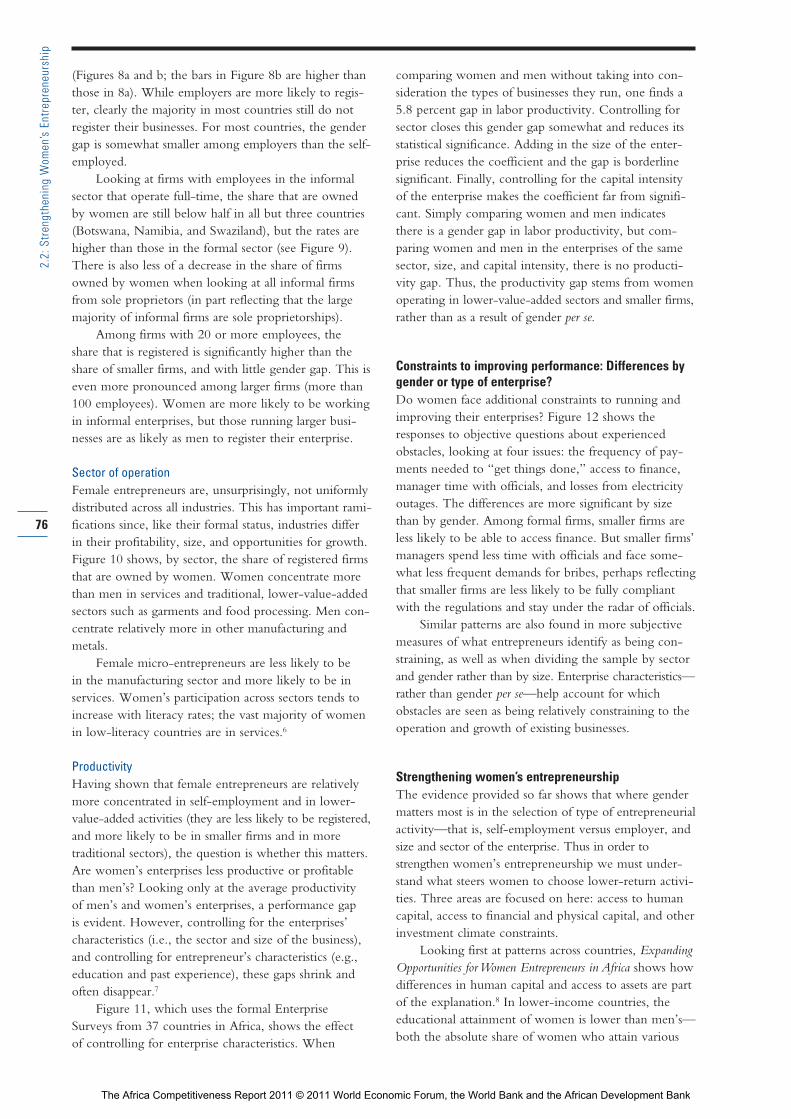
(Figures 8a and b; the bars in Figure 8b are higher thanthose in 8a). While employers are more likely to regis-ter, clearly the majority in most countries still do notregister their businesses. For most countries, the gendergap is somewhat smaller among employers than the self-employed.
Looking at firms with employees in the informalsector that operate full-time, the share that are ownedby women are still below half in all but three countries(Botswana, Namibia, and Swaziland), but the rates arehigher than those in the formal sector (see Figure 9).There is also less of a decrease in the share of firmsowned by women when look ing at all informal firmsfrom sole proprietors (in part reflecting that the largemajority of informal firms are sole proprietorships).
Among firms with 20 or more employees, the share that is registered is significantly higher than theshare of smaller firms, and with little gender gap. This iseven more pronounced among larger firms (more than100 employees). Women are more likely to be workingin informal enterprises, but those running larger busi-nesses are as likely as men to register their enterprise.
Sector of operationFemale entrepreneurs are, unsurprisingly, not uniformlydistributed across all industries. This has important rami-fications since, like their formal status, industries differ in their profitability, size, and opportunities for growth.Figure 10 shows, by sector, the share of registered firmsthat are owned by women. Women concentrate morethan men in services and traditional, lower-value-addedsectors such as garments and food processing. Men con-centrate relatively more in other manufacturing andmetals.
Female micro-entrepreneurs are less likely to be in the manufacturing sector and more likely to be inservices. Women’s participation across sectors tends toincrease with literacy rates; the vast majority of womenin low-literacy countries are in services.6
ProductivityHaving shown that female entrepreneurs are relativelymore concentrated in self-employment and in lower-value-added activities (they are less likely to be registered,and more likely to be in smaller firms and in more traditional sectors), the question is whether this matters.Are women’s enterprises less productive or profitablethan men’s? Looking only at the average productivity of men’s and women’s enterprises, a performance gap is evident. However, controlling for the enterprises’characteristics (i.e., the sector and size of the business),and controlling for entrepreneur’s characteristics (e.g.,education and past experience), these gaps shrink andoften disappear.7
Figure 11, which uses the formal EnterpriseSurveys from 37 countries in Africa, shows the effect of controlling for enterprise characteristics. When
comparing women and men without taking into con-sideration the types of businesses they run, one finds a5.8 percent gap in labor productivity. Controlling forsector closes this gender gap somewhat and reduces itsstatistical significance. Adding in the size of the enter-prise reduces the coefficient and the gap is borderlinesignificant. Finally, controlling for the capital intensityof the enterprise makes the coefficient far from signifi-cant. Simply comparing women and men indicatesthere is a gender gap in labor productivity, but com -paring women and men in the enterprises of the samesector, size, and capital intensity, there is no producti -vity gap. Thus, the productivity gap stems from womenoperating in lower-value-added sectors and smaller firms,rather than as a result of gender per se.
Constraints to improving performance: Differences bygender or type of enterprise?Do women face additional constraints to running andimproving their enterprises? Figure 12 shows theresponses to objective questions about experiencedobstacles, looking at four issues: the frequency of pay-ments needed to “get things done,” access to finance,manager time with officials, and losses from electricityoutages. The differences are more significant by sizethan by gender. Among formal firms, smaller firms areless likely to be able to access finance. But smaller firms’managers spend less time with officials and face some-what less frequent demands for bribes, perhaps reflectingthat smaller firms are less likely to be fully compliantwith the regulations and stay under the radar of officials.
Similar patterns are also found in more subjectivemeasures of what entrepreneurs identify as being con-straining, as well as when dividing the sample by sectorand gender rather than by size. Enterprise characteristics—rather than gender per se—help account for whichobstacles are seen as being relatively constraining to theoperation and growth of existing businesses.
Strengthening women’s entrepreneurshipThe evidence provided so far shows that where gendermatters most is in the selection of type of entrepreneurialactivity—that is, self-employment versus employer, andsize and sector of the enterprise. Thus in order tostrengthen women’s entrepreneurship we must under-stand what steers women to choose lower-return activi-ties. Three areas are focused on here: access to humancapital, access to financial and physical capital, and otherinvestment climate constraints.
Looking first at patterns across countries, ExpandingOpportunities for Women Entrepreneurs in Africa shows howdifferences in human capital and access to assets are partof the explanation.8 In lower-income countries, theeducational attainment of women is lower than men’s—both the absolute share of women who attain various
76
2.2:
Str
engt
heni
ng W
omen
’s E
ntre
pren
eurs
hip
The Africa Competitiveness Report 2011 © 2011 World Economic Forum, the World Bank and the African Development Bank
levels of education is lower than the share of men andthe relative educational achievement gap with men islarger. As women’s education improves and the gender-education gap closes, their inclusion among wage earnersincreases. Thus relatively lower levels of education helpaccount for the relatively higher share of self-employedwomen.
The other dimension of access to capital is access to assets, which is associated with security of propertyrights. Improving the Legal Investment Climate for Women in Africa introduces the Women’s Legal and EconomicEmpowerment Database (Women LEED Africa), whichillustrates the various ways that women’s formal legalcapacity and property rights differ from men’s.9 It showsthat gender gaps in legal and economic rights are rela-tively widespread across the region. It should be notedthat the pattern of gaps does not follow clear incomepatterns: middle-income countries are as likely as low-income countries to have gender gaps in formal eco-nomic rights. However, the pattern of rights is associat-ed with the share of women who are employers; wherewomen’s economic rights are stronger, the share ofemployers who are women is higher. The association is robust to controlling for both income and level ofeducation of the country.
Strengthening access to human and physical capitalHuman capital is a key asset of entrepreneurs. Itincludes not only formal education, but also specificbusiness skills such as management techniques, as well asthe experience the entrepreneur brings to the business.
EducationEducation is the most documented measure of humancapital—and one where a gender gap has persisted foryears.
In most countries, three patterns emerge (Figure 13).First, men (gray and white) tend to be more educatedthan women (blue and black). Second, employers aremore educated than self-employed entrepreneurs. Third,this is particularly true within gender (i.e., male employ-ers are more educated than male self-employed entre-preneurs; female employers are more educated thanfemale self-employed entrepreneurs), but often not acrossgenders. Self-employed women are almost always theleast educated among the four categories.
An individual’s level of education is strongly corre-lated with the success of the enterprise. Entrepreneurswith more education are more likely to earn higherprofits and their enterprises to be more productive. Andwomen and men benefit similarly from higher educa-tion. In most countries in the region, women have less education than men, although the gap is closingwith younger generations. Not controlling for theentrepreneur’s education can result in apparent gendergaps in performance. However, when comparing those
with similar levels of education, there is no significantgender gap.
Managerial techniquesEducation is not the only measure of human capital thathas been tested for and found to matter. There has beena particular interest in specific types of human capital,namely managerial techniques that should be associatedwith higher productivity. Recent research shows theimportance of management techniques in improvingfirms’ performance across a range of developed anddeveloping countries.10 Using a similar set of indicators infive sub-Saharan African countries, Hallward-Driemeierand Aterido’s analysis shows that the use of these tech-niques is relatively low in the region—but significantlycorrelated with higher productivity. Women wereslightly less likely to use these techniques. But thosewho did benefitted from them to the same extent asmen.11
Prior labor market experienceAnother important human capital variable is experience.Entrepreneurship-related experience may, in some cases,be a bigger determinant of productivity than non-specialized formal education. Because of the likely pres-ence of learning by doing, heterogeneity in experienceis important. This could be the result of a better under-standing of the available opportunities in particularproduct lines (and, correspondingly, a better apprecia-tion of relevant constraints and how to navigate them).It also reflects the development of valuable contacts forfinance and/or the accumulation of non-tangible butimportant management and production skills that can belearned only on the job.12 Gender is also likely to affectlabor supply. The time demand for men and women athome vary, and this sometimes leads to different elastic-ities of labor supply. Consequently, both the durationand type of experience may differ by gender.13
As in education, when it comes to the backgroundof entrepreneurs, the difference between the formal andinformal sectors is greater than the difference acrossgender. New entrepreneurs were far more likely to start an enterprise in the sector in which they had been employed prior to starting their business. Within a sector, the types of prior experience women had is far more similar to that of their male colleagues in thatsame sector than to women in other sectors.14
However, there was some evidence of a gender gap inthe informal sector. Female entrepreneurs in the infor-mal sector were significantly more likely to have beenunemployed and looking for a job in the months pre-ceding their entry into entrepreneurship than maleentrepreneurs in the informal sector (29 percent versus21.6 percent). The percentage of men in the informalsector who used to be paid enterprise (both formal andinformal) employees (50 percent) significantly exceedsthe percentage of women in that category (39 percent).
77
2.2:
Str
engt
heni
ng W
omen
’s E
ntre
pren
eurs
hip
The Africa Competitiveness Report 2011 © 2011 World Economic Forum, the World Bank and the African Development Bank
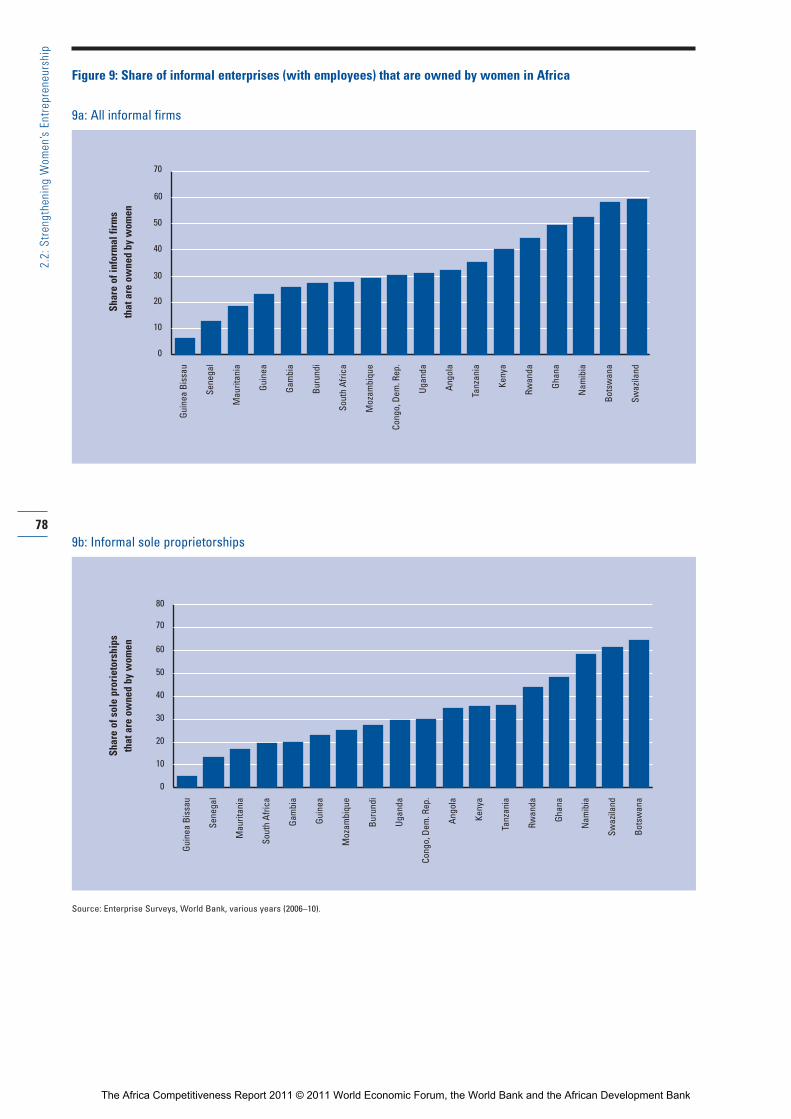
78
2.2:
Str
engt
heni
ng W
omen
’s E
ntre
pren
eurs
hip
0
10
20
30
40
50
60
70Gu
inea
Bis
sau
Sene
gal
Mau
ritan
ia
Guin
ea
Gam
bia
Buru
ndi
Sout
h Af
rica
Moz
ambi
que
Cong
o, D
em. R
ep.
Ugan
da
Ango
la
Tanz
ania
Keny
a
Rwan
da
Ghan
a
Nam
ibia
Bots
wan
a
Swaz
iland
0
Guin
ea B
issa
u
Sene
gal
Mau
ritan
ia
Sout
h Af
rica
Gam
bia
Guin
ea
Moz
ambi
que
Buru
ndi
Ugan
da
Cong
o, D
em. R
ep.
Ango
la
Keny
a
Tanz
ania
Rwan
da
Ghan
a
Nam
ibia
Swaz
iland
Bots
wan
a
10
20
30
40
50
60
70
80
9b: Informal sole proprietorships
Source: Enterprise Surveys, World Bank, various years (2006–10).
Figure 9: Share of informal enterprises (with employees) that are owned by women in Africa
9a: All informal firmsSh
are
of in
form
al fi
rms
that
are
ow
ned
by w
omen
Shar
e of
sol
e pr
orie
tors
hips
that
are
ow
ned
by w
omen
The Africa Competitiveness Report 2011 © 2011 World Economic Forum, the World Bank and the African Development Bank
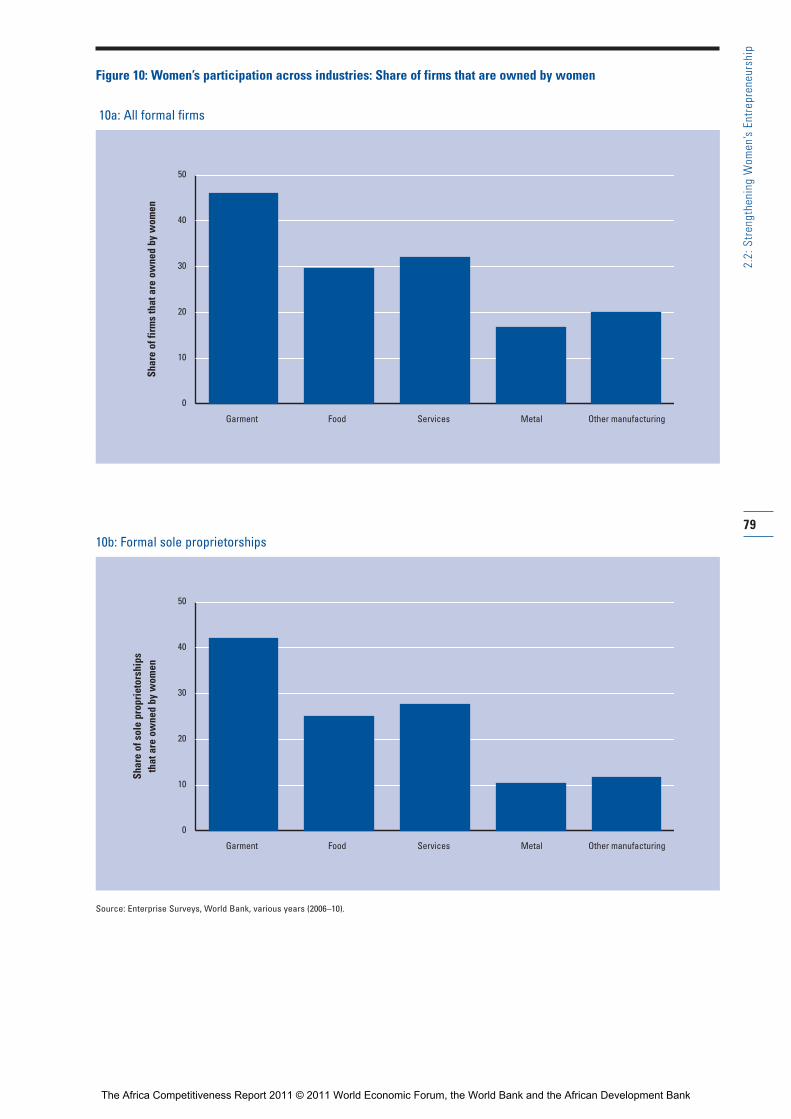
79
2.2:
Str
engt
heni
ng W
omen
’s E
ntre
pren
eurs
hip
0
10
20
30
40
50
MetalServicesFood Other manufacturingGarment
0
10
20
30
40
50
MetalServicesFood Other manufacturingGarment
10b: Formal sole proprietorships
Source: Enterprise Surveys, World Bank, various years (2006–10).
Figure 10: Women’s participation across industries: Share of firms that are owned by women
10a: All formal firms
Shar
e of
firm
s th
at a
re o
wne
d by
wom
enSh
are
of s
ole
prop
riet
orsh
ips
that
are
ow
ned
by w
omen
The Africa Competitiveness Report 2011 © 2011 World Economic Forum, the World Bank and the African Development Bank
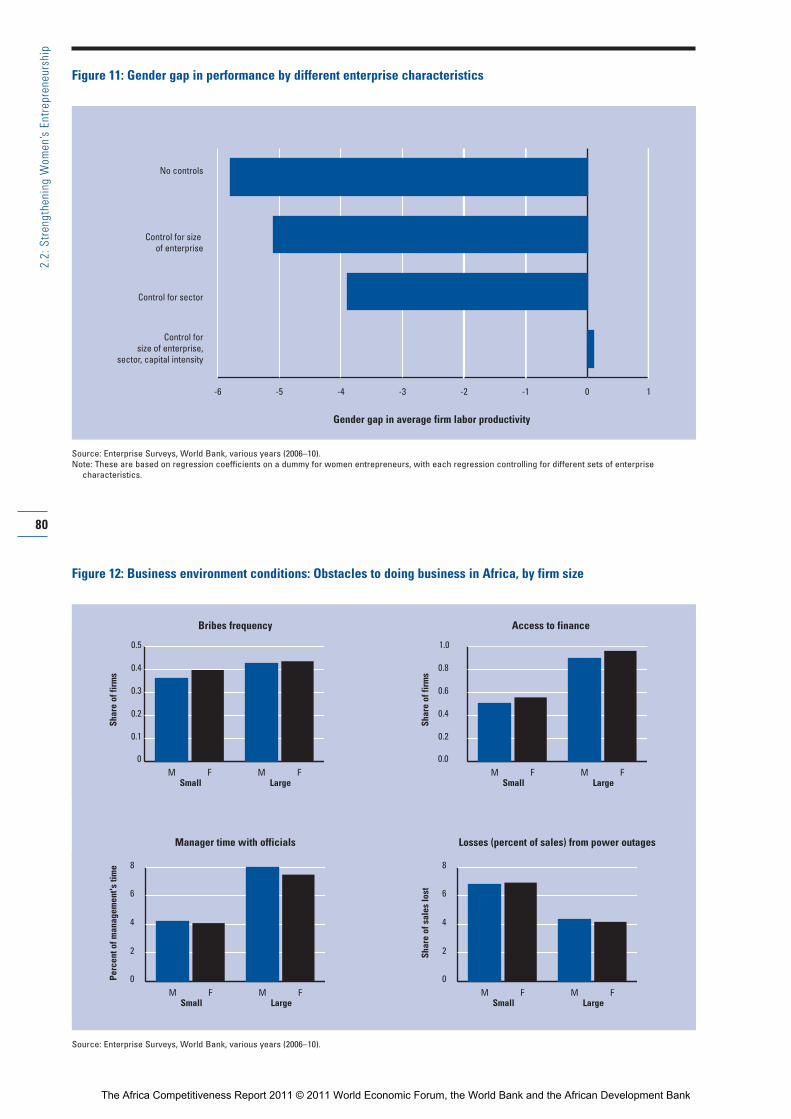
80
2.2:
Str
engt
heni
ng W
omen
’s E
ntre
pren
eurs
hip
Figure 11: Gender gap in performance by different enterprise characteristics
Source: Enterprise Surveys, World Bank, various years (2006–10).Note: These are based on regression coefficients on a dummy for women entrepreneurs, with each regression controlling for different sets of enterprise
characteristics.
-6 -5 -4 -3 -2 -1 0 1
Control for sector
No controls
Control forsize of enterprise,
sector, capital intensity
Control for size of enterprise
Gender gap in average firm labor productivity
0
0.1
0.2
0.3
0.4
0.5
Small LargeM F M F
0
2
4
6
8
M F M FSmall Large
0
2
4
6
8
M F M FSmall Large
0.0
0.2
0.4
0.6
0.8
1.0
M F M FSmall Large
Figure 12: Business environment conditions: Obstacles to doing business in Africa, by firm size
Bribes frequency Access to finance
Manager time with officials
Shar
e of
firm
s
Shar
e of
firm
s
Perc
ent o
f man
agem
ent's
tim
e
Shar
e of
sal
es lo
st
Losses (percent of sales) from power outages
Source: Enterprise Surveys, World Bank, various years (2006–10).
The Africa Competitiveness Report 2011 © 2011 World Economic Forum, the World Bank and the African Development Bank
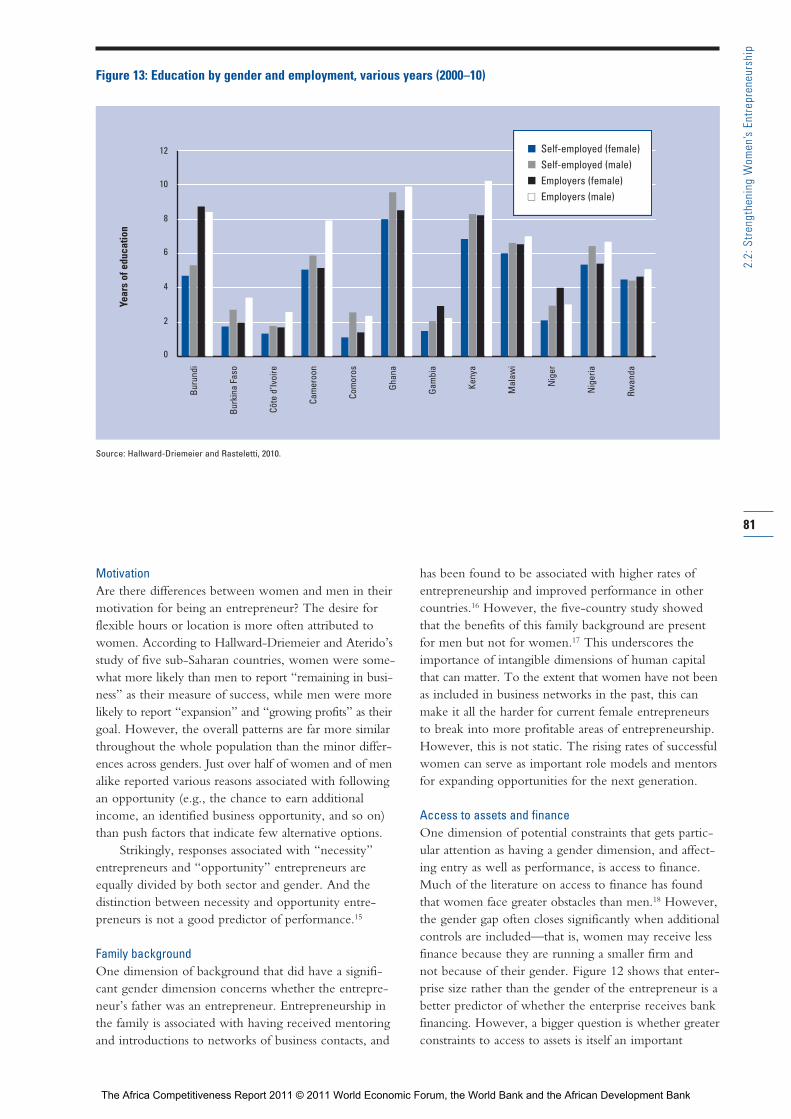
MotivationAre there differences between women and men in theirmotivation for being an entrepreneur? The desire forflexible hours or location is more often attributed towomen. According to Hallward-Driemeier and Aterido’sstudy of five sub-Saharan countries, women were some-what more likely than men to report “remaining in busi-ness” as their measure of success, while men were morelikely to report “expansion” and “growing profits” as theirgoal. However, the overall patterns are far more similarthroughout the whole population than the minor differ-ences across genders. Just over half of women and of menalike reported various reasons associated with followingan opportunity (e.g., the chance to earn additionalincome, an identified business opportunity, and so on)than push factors that indicate few alternative options.
Strikingly, responses associated with “necessity”entrepreneurs and “opportunity” entrepreneurs areequally divided by both sector and gender. And the distinction between necessity and opportunity entre -preneurs is not a good predictor of performance.15
Family backgroundOne dimension of background that did have a signifi-cant gender dimension concerns whether the entrepre-neur’s father was an entrepreneur. Entrepreneurship inthe family is associated with having received mentoringand introductions to networks of business contacts, and
has been found to be associated with higher rates ofentrepreneurship and improved performance in othercountries.16 However, the five-country study showedthat the benefits of this family background are presentfor men but not for women.17 This underscores theimportance of intangible dimensions of human capitalthat can matter. To the extent that women have not beenas included in business networks in the past, this canmake it all the harder for current female entrepreneursto break into more profitable areas of entrepreneurship.However, this is not static. The rising rates of successfulwomen can serve as important role models and mentorsfor expanding opportunities for the next generation.
Access to assets and financeOne dimension of potential constraints that gets partic-ular attention as having a gender dimension, and affect-ing entry as well as performance, is access to finance.Much of the literature on access to finance has foundthat women face greater obstacles than men.18 However,the gender gap often closes significantly when additionalcontrols are included—that is, women may receive lessfinance because they are running a smaller firm and not because of their gender. Figure 12 shows that enter-prise size rather than the gender of the entrepreneur is abetter predictor of whether the enterprise receives bankfinancing. However, a bigger question is whether greaterconstraints to access to assets is itself an important
81
2.2:
Str
engt
heni
ng W
omen
’s E
ntre
pren
eurs
hip
Figure 13: Education by gender and employment, various years (2000–10)
Source: Hallward-Driemeier and Rasteletti, 2010.
0
2
4
6
8
10
12
Buru
ndi
Burk
ina
Faso
Côte
d’Iv
oire
Cam
eroo
n
Com
oros
Ghan
a
Gam
bia
Keny
a
Mal
awi
Nig
er
Nig
eria
Rwan
da
Year
s of
edu
catio
n
n Self-employed (female)n Self-employed (male)n Employers (female)n Employers (male)
The Africa Competitiveness Report 2011 © 2011 World Economic Forum, the World Bank and the African Development Bank
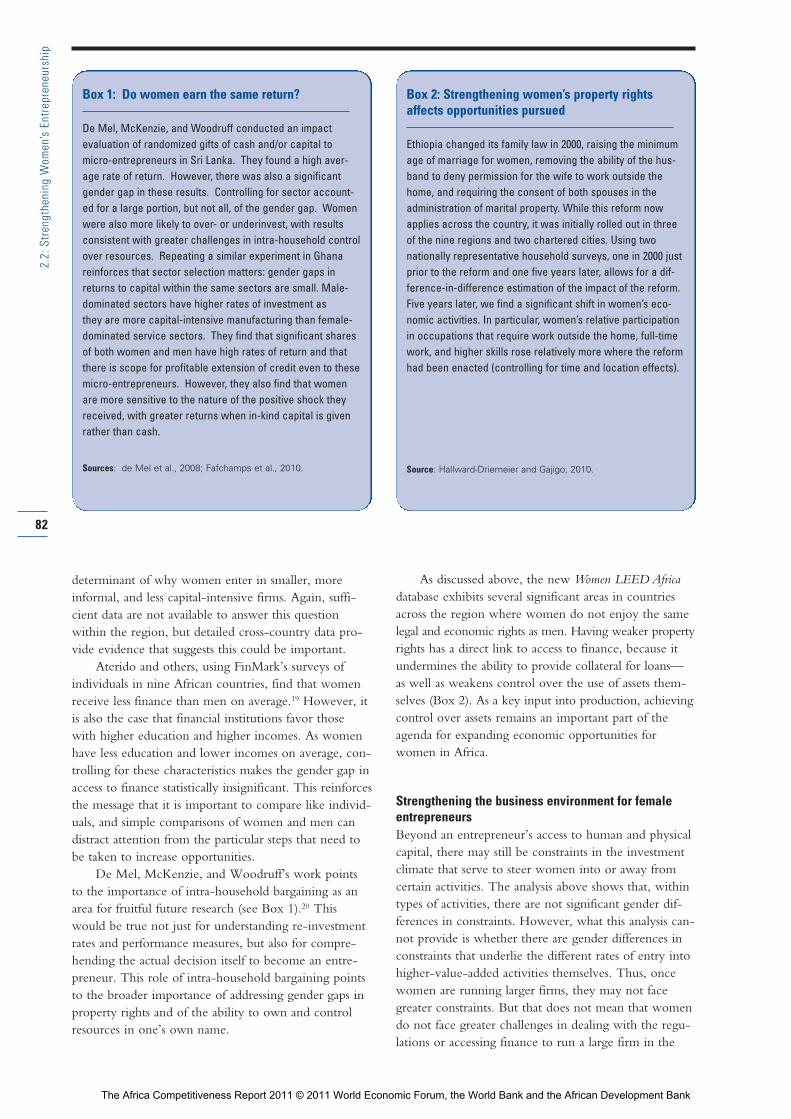
determinant of why women enter in smaller, moreinformal, and less capital-intensive firms. Again, suffi-cient data are not available to answer this questionwithin the region, but detailed cross-country data pro-vide evidence that suggests this could be important.
Aterido and others, using FinMark’s surveys ofindividuals in nine African countries, find that womenreceive less finance than men on average.19 However, itis also the case that financial institutions favor thosewith higher education and higher incomes. As womenhave less education and lower incomes on average, con-trolling for these characteristics makes the gender gap inaccess to finance statistically insignificant. This reinforcesthe message that it is important to compare like individ-uals, and simple comparisons of women and men candistract attention from the particular steps that need tobe taken to increase opportunities.
De Mel, McKenzie, and Woodruff’s work pointsto the importance of intra-household bargaining as anarea for fruitful future research (see Box 1).20 Thiswould be true not just for understanding re-investmentrates and performance measures, but also for compre-hending the actual decision itself to become an entre-preneur. This role of intra-household bargaining pointsto the broader importance of addressing gender gaps inproperty rights and of the ability to own and controlresources in one’s own name.
As discussed above, the new Women LEED Africadatabase exhibits several significant areas in countriesacross the region where women do not enjoy the samelegal and economic rights as men. Having weaker propertyrights has a direct link to access to finance, because itundermines the ability to provide collateral for loans—as well as weakens control over the use of assets them-selves (Box 2). As a key input into production, achievingcontrol over assets remains an important part of theagenda for expanding economic opportunities forwomen in Africa.
Strengthening the business environment for femaleentrepreneursBeyond an entrepreneur’s access to human and physicalcapital, there may still be constraints in the investmentclimate that serve to steer women into or away fromcertain activities. The analysis above shows that, withintypes of activities, there are not significant gender dif-ferences in constraints. However, what this analysis can-not provide is whether there are gender differences inconstraints that underlie the different rates of entry intohigher-value-added activities themselves. Thus, oncewomen are running larger firms, they may not facegreater constraints. But that does not mean that womendo not face greater challenges in dealing with the regu-lations or accessing finance to run a large firm in the
82
2.2:
Str
engt
heni
ng W
omen
’s E
ntre
pren
eurs
hip
Box 1: Do women earn the same return?
De Mel, McKenzie, and Woodruff conducted an impact evaluation of randomized gifts of cash and/or capital tomicro-entrepreneurs in Sri Lanka. They found a high aver-age rate of return. However, there was also a significantgender gap in these results. Controlling for sector account-ed for a large portion, but not all, of the gender gap. Womenwere also more likely to over- or underinvest, with resultsconsistent with greater challenges in intra-household controlover resources. Repeating a similar experiment in Ghanareinforces that sector selection matters: gender gaps inreturns to capital within the same sectors are small. Male-dominated sectors have higher rates of investment as they are more capital-intensive manufacturing than female-dominated service sectors. They find that significant sharesof both women and men have high rates of return and thatthere is scope for profitable extension of credit even to thesemicro-entrepreneurs. However, they also find that womenare more sensitive to the nature of the positive shock theyreceived, with greater returns when in-kind capital is givenrather than cash.
Sources: de Mel et al., 2008; Fafchamps et al., 2010.
Box 2: Strengthening women’s property rightsaffects opportunities pursued
Ethiopia changed its family law in 2000, raising the minimumage of marriage for women, removing the ability of the hus-band to deny permission for the wife to work outside thehome, and requiring the consent of both spouses in theadministration of marital property. While this reform nowapplies across the country, it was initially rolled out in threeof the nine regions and two chartered cities. Using twonationally representative household surveys, one in 2000 justprior to the reform and one five years later, allows for a dif-ference-in-difference estimation of the impact of the reform.Five years later, we find a significant shift in women’s eco-nomic activities. In particular, women’s relative participationin occupations that require work outside the home, full-timework, and higher skills rose relatively more where the reformhad been enacted (controlling for time and location effects).
Source: Hallward-Driemeier and Gajigo, 2010.
The Africa Competitiveness Report 2011 © 2011 World Economic Forum, the World Bank and the African Development Bank
first place. To examine the role of different dimensionsof the investment climate as potential barriers to entry,additional data would need to be available. Individualdata over multiple periods would be needed, includingcoverage of those who are not entrepreneurs. Thiswould allow for the examination of the selection ofwho becomes an entrepreneur and why particular busi-ness activities are pursued by particular individuals.
What is clear from the pattern of enterprises wherewomen are concentrated is that measures that targetsmaller firms and those in the informal sector woulddisproportionately help women entrepreneurs. Thiscould include streamlining regulatory requirements,curbing corruption, and facilitating the formalization of small firms.
In addition, there may be more nuanced constraintsthat are not well captured in the Enterprise Survey,including those that make entry into entrepreneurshipitself a challenge. Women entrepreneurs themselves arean important source of information—both in identifyingconstraints and in advocating for ways to address them.Taking advantage of this resource calls for expandingwomen’s voices in policy reform surrounding issues relevant to entrepreneurship and business growth.
Expanding women’s voices in business environmentreformTwo distinct sets of issues are of importance with respectto strengthening women’s voices in business policymak-ing. The first is having women at the table where deci-sions are made. While women operate a significantshare of businesses, they are rarely included when busi-ness-related policies are discussed. The second concernswomen’s role in setting the agenda and in framing the policy debate. This in turn has two components—one relating to the extent to which issues specific towomen in business (a gender perspective) are identifiedand addressed, and one relating to the ways in whichwomen participate in, and contribute to, advocacy onissues that are not gender-specific but are of importanceto business more generally.
There is an ongoing debate as to whether it is bet-ter for women to establish and work through parallelstructures focused on women, or to seek stronger integration into, and engagement with, “mainstream”mechanisms of policy dialogue and business associations.The review of experience summarized here suggests adual-track approach, involving both separate women’smechanisms and better integration into the mainstream,is required.
Strengthening women’s involvement in improving the business environmentWomen need to be active in business environmentreform. This is important not only because they arethemselves strongly engaged as entrepreneurs and
employers, but also because the obstacles and constraintsthey face, and the perspectives they bring, can be quitedifferent from those of their male counterparts. Women’sgreater engagement in business-climate reforms can besupported in four key ways.
1: Expand gender-disaggregated analyses of business opportunities and constraintsFirst, advocacy for policy reforms needs to be groundedin solid analysis of the opportunities and constraints inthe business environment, and, specifically, of the waysin which these opportunities and constraints differ for men andwomen. Insufficient data have often been a constraint.Lack of sex-disaggregated data and gender analysismakes it difficult to identify and assess the nature andextent of gender-based barriers in the business environ-ment, and to develop appropriate ways to address them.
International organizations have been filling the gap in recent years. The Organisation for EconomicCo-operation and Development (OECD)’s SocialInstitutions and Gender Index (SIGI) database looks at howcustomary practices affect women’s standing;21 theWorld Bank’s Women, Business and the Law providesindicators of where legal rights for women differ fromthose of men,22 and its Enterprise Surveys provide gen-der-disaggregated data that can be used to examine theeffects of the investment climate on male- and female-owned businesses; and the World Economic Forumpublishes its Global Gender Gap Report.
Country-specific analyses can also be important.Gender and Growth Assessments, such as those conduct-ed in Tanzania, Kenya and Uganda, provide good exam-ples.23 These assessments provided a foundation fordefining specific reforms that were responsive towomen’s concerns. In Uganda, a gender coalition wasestablished to lobby for the implementation of the rec-ommendations of the assessment. And, as a result, somesuccess was achieved in relation to legal and regulatoryreform aimed at benefiting women.
A lack of awareness of methodologies on how toconduct gender-disaggregated analyses of business envi-ronment reforms was also a constraint. The World BankGroup has recently published a practitioners’ guide toaddressing the gender dimensions of investment climatereform.24 It includes detailed suggestions on data to col-lect as well as strategies for addressing the threeapproaches discussed below.
2: Strengthen women’s involvement in business associationsand networksThe advantages of business networking are clear.Developing a strong business network and participatingin a formal business organization facilitates sharing ofmarket information, helps members identify businessopportunities, generates cross-referrals, and is a supportmechanism for individual entrepreneurs who might otherwise feel isolated. However, women are often
83
2.2:
Str
engt
heni
ng W
omen
’s E
ntre
pren
eurs
hip
The Africa Competitiveness Report 2011 © 2011 World Economic Forum, the World Bank and the African Development Bank
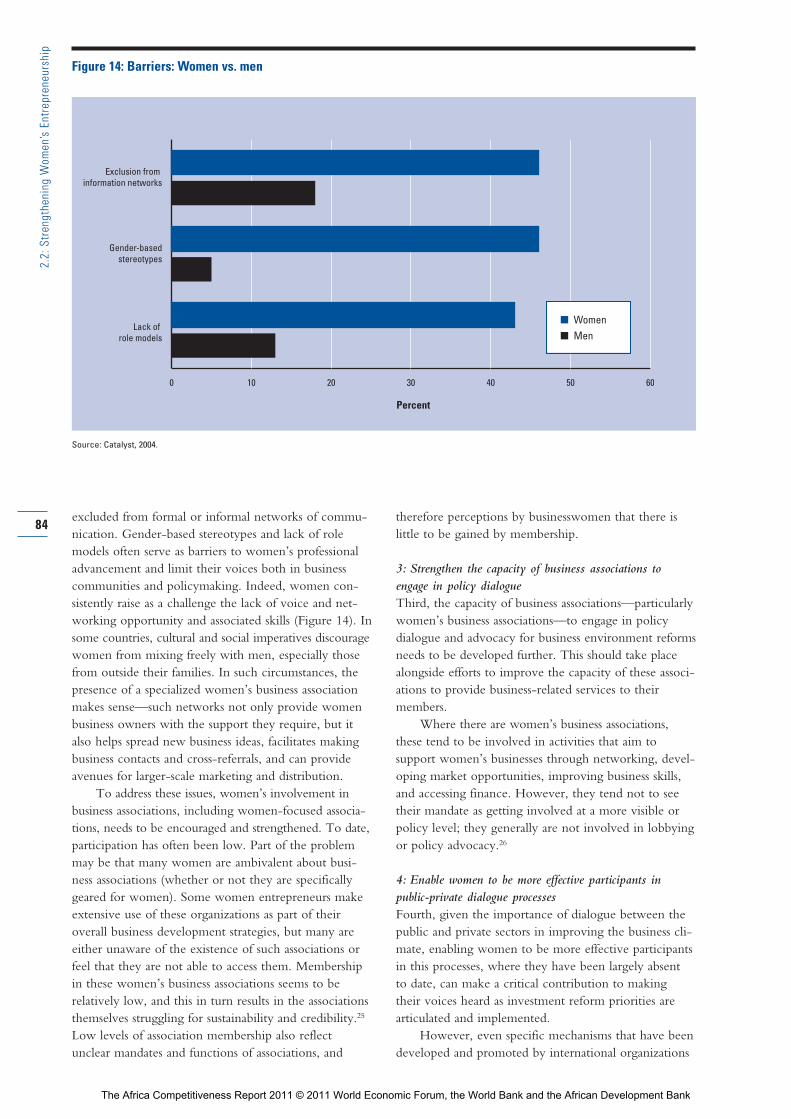
excluded from formal or informal networks of commu-nication. Gender-based stereotypes and lack of rolemodels often serve as barriers to women’s professionaladvancement and limit their voices both in businesscommunities and policymaking. Indeed, women con -sistently raise as a challenge the lack of voice and net-working opportunity and associated skills (Figure 14). Insome countries, cultural and social imperatives discouragewomen from mixing freely with men, especially thosefrom outside their families. In such circumstances, thepresence of a specialized women’s business associationmakes sense—such networks not only provide womenbusiness owners with the support they require, but italso helps spread new business ideas, facilitates makingbusiness contacts and cross-referrals, and can provideavenues for larger-scale marketing and distribution.
To address these issues, women’s involvement inbusiness associations, including women-focused associa-tions, needs to be encouraged and strengthened. To date,participation has often been low. Part of the problemmay be that many women are ambivalent about busi-ness associations (whether or not they are specificallygeared for women). Some women entrepreneurs makeextensive use of these organizations as part of theiroverall business development strategies, but many areeither unaware of the existence of such associations orfeel that they are not able to access them. Membershipin these women’s business associations seems to be relatively low, and this in turn results in the associationsthemselves struggling for sustainability and credibility.25
Low levels of association membership also reflectunclear mandates and functions of associations, and
therefore perceptions by businesswomen that there islittle to be gained by membership.
3: Strengthen the capacity of business associations toengage in policy dialogueThird, the capacity of business associations—particularlywomen’s business associations—to engage in policy dialogue and advocacy for business environment reformsneeds to be developed further. This should take placealongside efforts to improve the capacity of these associ-ations to provide business-related services to their members.
Where there are women’s business associations,these tend to be involved in activities that aim to support women’s businesses through networking, devel-oping market opportunities, improving business skills,and accessing finance. However, they tend not to seetheir mandate as getting involved at a more visible orpolicy level; they generally are not involved in lobbyingor policy advocacy.26
4: Enable women to be more effective participants in public-private dialogue processesFourth, given the importance of dialogue between thepublic and private sectors in improving the business cli-mate, enabling women to be more effective participantsin this processes, where they have been largely absent to date, can make a critical contribution to making their voices heard as investment reform priorities arearticulated and implemented.
However, even specific mechanisms that have beendeveloped and promoted by international organizations
84
2.2:
Str
engt
heni
ng W
omen
’s E
ntre
pren
eurs
hip
Figure 14: Barriers: Women vs. men
Source: Catalyst, 2004.
0 10 20 30 40 50 60
Exclusion from information networks
Gender-basedstereotypes
Lack of role models
n Womenn Men
Percent
The Africa Competitiveness Report 2011 © 2011 World Economic Forum, the World Bank and the African Development Bank
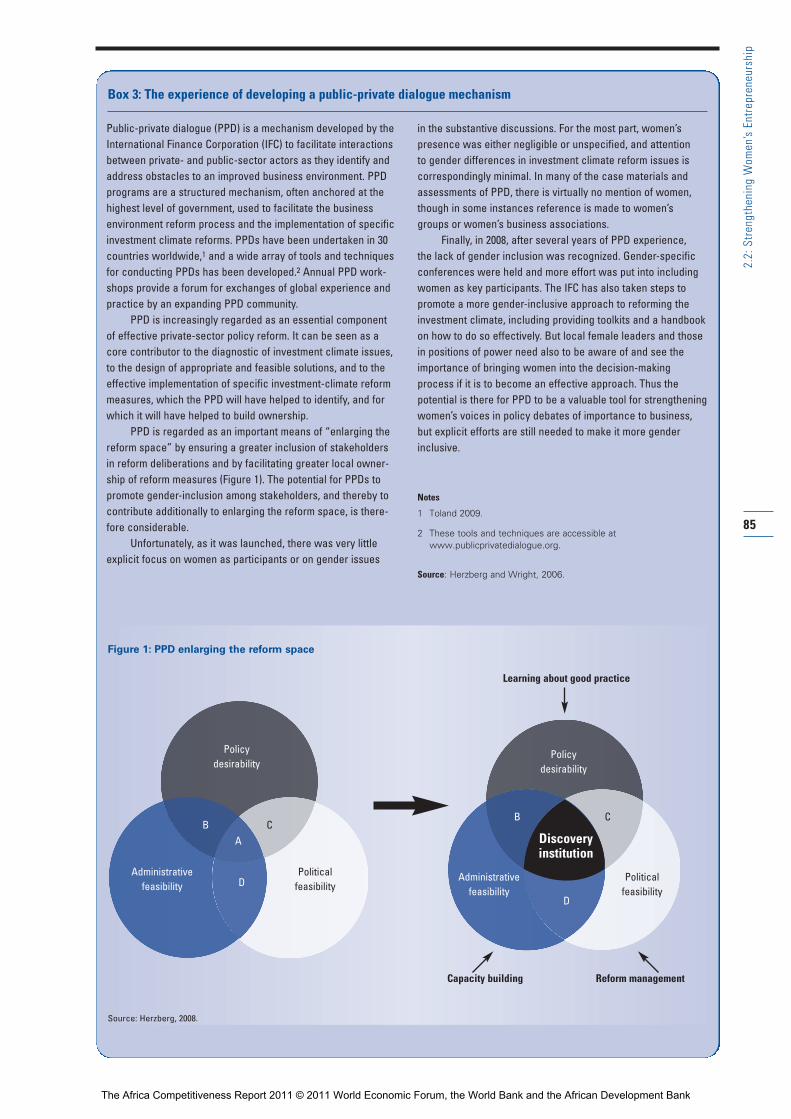
Policydesirability
Administrativefeasibility
Politicalfeasibility
Policydesirability
Administrativefeasibility
Politicalfeasibility
Discoveryinstitution
AB C
D
B C
D
Capacity building
Learning about good practice
Reform management
85
2.2:
Str
engt
heni
ng W
omen
’s E
ntre
pren
eurs
hip
Public-private dialogue (PPD) is a mechanism developed by theInternational Finance Corporation (IFC) to facilitate interactionsbetween private- and public-sector actors as they identify andaddress obstacles to an improved business environment. PPDprograms are a structured mechanism, often anchored at thehighest level of government, used to facilitate the businessenvironment reform process and the implementation of specificinvestment climate reforms. PPDs have been undertaken in 30countries worldwide,1 and a wide array of tools and techniquesfor conducting PPDs has been developed.2 Annual PPD work-shops provide a forum for exchanges of global experience andpractice by an expanding PPD community.
PPD is increasingly regarded as an essential componentof effective private-sector policy reform. It can be seen as acore contributor to the diagnostic of investment climate issues,to the design of appropriate and feasible solutions, and to theeffective implementation of specific investment-climate reformmeasures, which the PPD will have helped to identify, and forwhich it will have helped to build ownership.
PPD is regarded as an important means of “enlarging thereform space” by ensuring a greater inclusion of stakeholdersin reform deliberations and by facilitating greater local owner-ship of reform measures (Figure 1). The potential for PPDs topromote gender-inclusion among stakeholders, and thereby tocontribute additionally to enlarging the reform space, is there-fore considerable.
Unfortunately, as it was launched, there was very littleexplicit focus on women as participants or on gender issues
in the substantive discussions. For the most part, women’s presence was either negligible or unspecified, and attention to gender differences in investment climate reform issues iscorrespondingly minimal. In many of the case materials andassessments of PPD, there is virtually no mention of women,though in some instances reference is made to women’s groups or women’s business associations.
Finally, in 2008, after several years of PPD experience, the lack of gender inclusion was recognized. Gender-specificconferences were held and more effort was put into includingwomen as key participants. The IFC has also taken steps to promote a more gender-inclusive approach to reforming theinvestment climate, including providing toolkits and a handbookon how to do so effectively. But local female leaders and thosein positions of power need also to be aware of and see theimportance of bringing women into the decision-makingprocess if it is to become an effective approach. Thus thepotential is there for PPD to be a valuable tool for strengtheningwomen’s voices in policy debates of importance to business,but explicit efforts are still needed to make it more gender inclusive.
Notes
1 Toland 2009.
2 These tools and techniques are accessible at
www.publicprivatedialogue.org.
Source: Herzberg and Wright, 2006.
Box 3: The experience of developing a public-private dialogue mechanism
Figure 1: PPD enlarging the reform space
Source: Herzberg, 2008.
The Africa Competitiveness Report 2011 © 2011 World Economic Forum, the World Bank and the African Development Bank
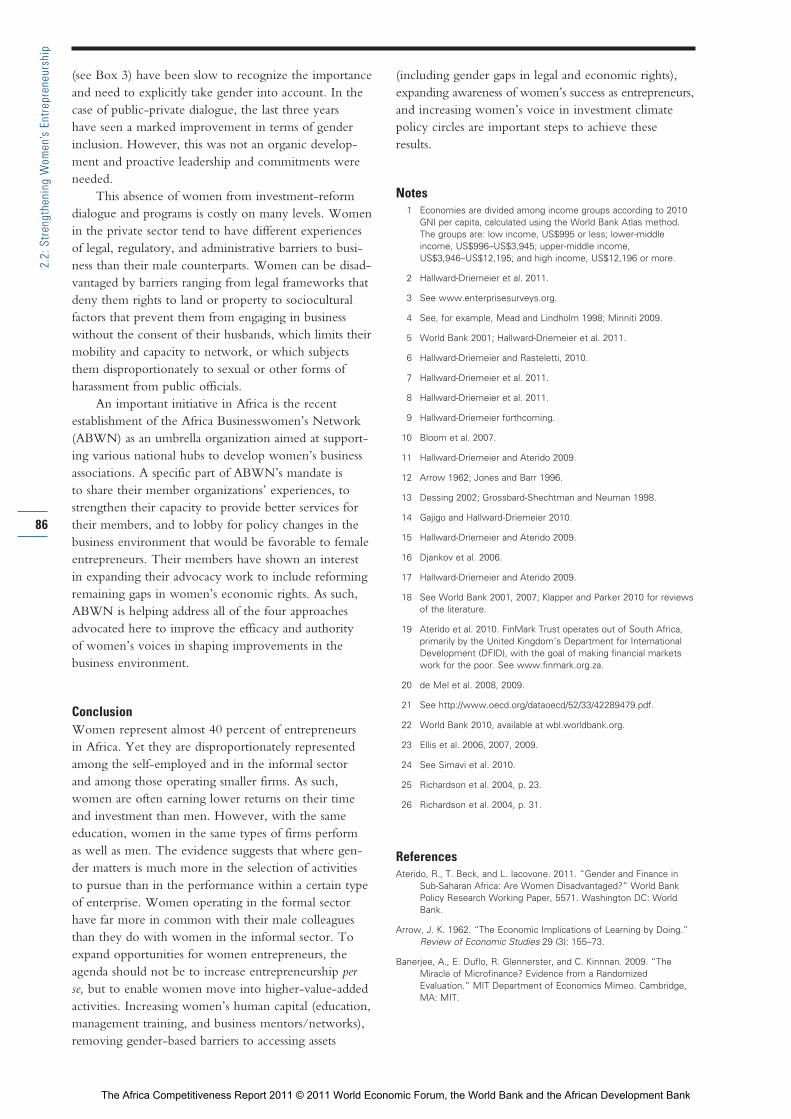
(see Box 3) have been slow to recognize the importanceand need to explicitly take gender into account. In thecase of public-private dialogue, the last three years have seen a marked improvement in terms of genderinclusion. However, this was not an organic develop-ment and proactive leadership and commitments wereneeded.
This absence of women from investment-reformdialogue and programs is costly on many levels. Womenin the private sector tend to have different experiencesof legal, regulatory, and administrative barriers to busi-ness than their male counterparts. Women can be disad-vantaged by barriers ranging from legal frameworks thatdeny them rights to land or property to socioculturalfactors that prevent them from engaging in businesswithout the consent of their husbands, which limits theirmobility and capacity to network, or which subjectsthem disproportionately to sexual or other forms ofharassment from public officials.
An important initiative in Africa is the recent establishment of the Africa Businesswomen’s Network(ABWN) as an umbrella organization aimed at support-ing various national hubs to develop women’s businessassociations. A specific part of ABWN’s mandate is to share their member organizations’ experiences, tostrengthen their capacity to provide better services fortheir members, and to lobby for policy changes in thebusiness environment that would be favorable to femaleentrepreneurs. Their members have shown an interestin expanding their advocacy work to include reformingremaining gaps in women’s economic rights. As such,ABWN is helping address all of the four approachesadvocated here to improve the efficacy and authority of women’s voices in shaping improvements in thebusiness environment.
ConclusionWomen represent almost 40 percent of entrepreneurs in Africa. Yet they are disproportionately representedamong the self-employed and in the informal sector and among those operating smaller firms. As such,women are often earning lower returns on their timeand investment than men. However, with the same education, women in the same types of firms perform as well as men. The evidence suggests that where gen-der matters is much more in the selection of activities to pursue than in the performance within a certain type of enterprise. Women operating in the formal sectorhave far more in common with their male colleaguesthan they do with women in the informal sector. Toexpand opportunities for women entrepreneurs, theagenda should not be to increase entrepreneurship perse, but to enable women move into higher-value-addedactivities. Increasing women’s human capital (education,management training, and business mentors/networks),removing gender-based barriers to accessing assets
(including gender gaps in legal and economic rights),expanding awareness of women’s success as entrepreneurs,and increasing women’s voice in investment climate policy circles are important steps to achieve theseresults.
Notes1 Economies are divided among income groups according to 2010
GNI per capita, calculated using the World Bank Atlas method.
The groups are: low income, US$995 or less; lower-middle
income, US$996–US$3,945; upper-middle income,
US$3,946–US$12,195; and high income, US$12,196 or more.
2 Hallward-Driemeier et al. 2011.
3 See www.enterprisesurveys.org.
4 See, for example, Mead and Lindholm 1998; Minniti 2009.
5 World Bank 2001; Hallward-Driemeier et al. 2011.
6 Hallward-Driemeier and Rasteletti, 2010.
7 Hallward-Driemeier et al. 2011.
8 Hallward-Driemeier et al. 2011.
9 Hallward-Driemeier forthcoming.
10 Bloom et al. 2007.
11 Hallward-Driemeier and Aterido 2009.
12 Arrow 1962; Jones and Barr 1996.
13 Dessing 2002; Grossbard-Shechtman and Neuman 1998.
14 Gajigo and Hallward-Driemeier 2010.
15 Hallward-Driemeier and Aterido 2009.
16 Djankov et al. 2006.
17 Hallward-Driemeier and Aterido 2009.
18 See World Bank 2001, 2007; Klapper and Parker 2010 for reviews
of the literature.
19 Aterido et al. 2010. FinMark Trust operates out of South Africa,
primarily by the United Kingdom’s Department for International
Development (DFID), with the goal of making financial markets
work for the poor. See www.finmark.org.za.
20 de Mel et al. 2008, 2009.
21 See http://www.oecd.org/dataoecd/52/33/42289479.pdf.
22 World Bank 2010, available at wbl.worldbank.org.
23 Ellis et al. 2006, 2007, 2009.
24 See Simavi et al. 2010.
25 Richardson et al. 2004, p. 23.
26 Richardson et al. 2004, p. 31.
ReferencesAterido, R., T. Beck, and L. Iacovone. 2011. “Gender and Finance in
Sub-Saharan Africa: Are Women Disadvantaged?” World Bank
Policy Research Working Paper, 5571. Washington DC: World
Bank.
Arrow, J. K. 1962. “The Economic Implications of Learning by Doing.”
Review of Economic Studies 29 (3): 155–73.
Banerjee, A., E. Duflo, R. Glennerster, and C. Kinnnan. 2009. “The
Miracle of Microfinance? Evidence from a Randomized
Evaluation.” MIT Department of Economics Mimeo. Cambridge,
MA: MIT.
86
2.2:
Str
engt
heni
ng W
omen
’s E
ntre
pren
eurs
hip
The Africa Competitiveness Report 2011 © 2011 World Economic Forum, the World Bank and the African Development Bank
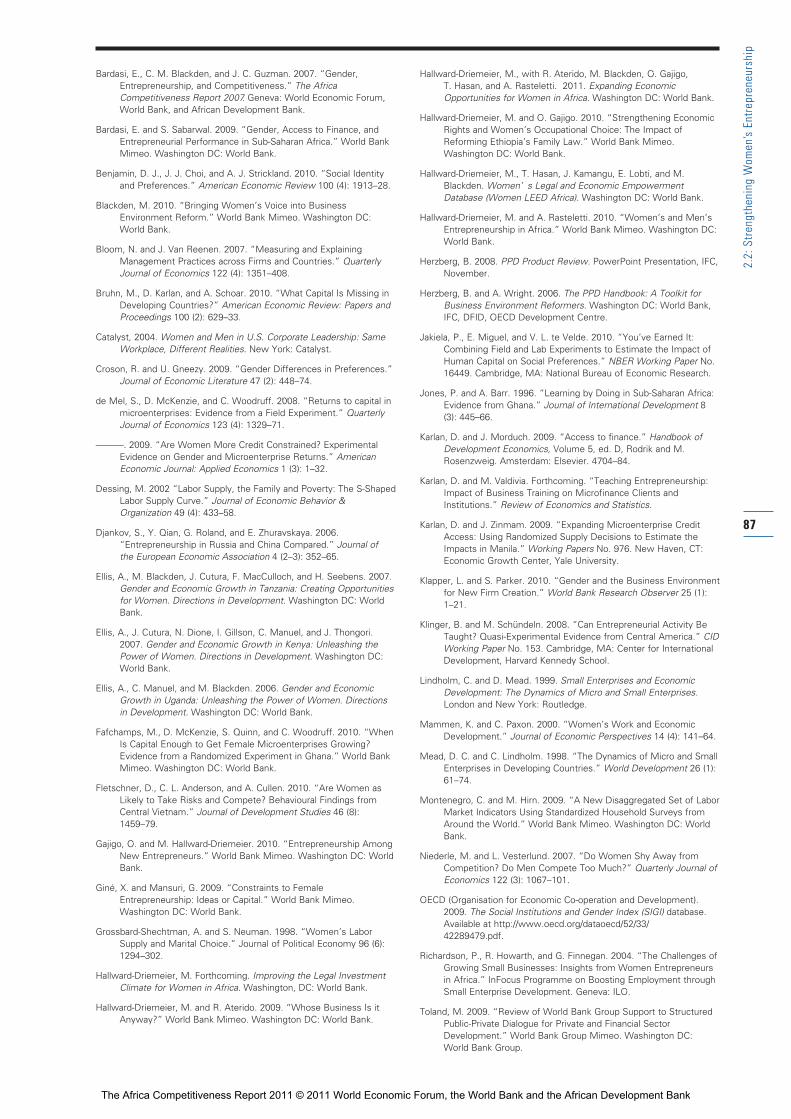
Bardasi, E., C. M. Blackden, and J. C. Guzman. 2007. “Gender,
Entrepreneurship, and Competitiveness.” The Africa
Competitiveness Report 2007. Geneva: World Economic Forum,
World Bank, and African Development Bank.
Bardasi, E. and S. Sabarwal. 2009. “Gender, Access to Finance, and
Entrepreneurial Performance in Sub-Saharan Africa.” World Bank
Mimeo. Washington DC: World Bank.
Benjamin, D. J., J. J. Choi, and A. J. Strickland. 2010. “Social Identity
and Preferences.” American Economic Review 100 (4): 1913–28.
Blackden, M. 2010. “Bringing Women’s Voice into Business
Environment Reform.” World Bank Mimeo. Washington DC:
World Bank.
Bloom, N. and J. Van Reenen. 2007. “Measuring and Explaining
Management Practices across Firms and Countries.” Quarterly
Journal of Economics 122 (4): 1351–408.
Bruhn, M., D. Karlan, and A. Schoar. 2010. “What Capital Is Missing in
Developing Countries?” American Economic Review: Papers and
Proceedings 100 (2): 629–33.
Catalyst, 2004. Women and Men in U.S. Corporate Leadership: Same
Workplace, Different Realities. New York: Catalyst.
Croson, R. and U. Gneezy. 2009. “Gender Differences in Preferences.”
Journal of Economic Literature 47 (2): 448–74.
de Mel, S., D. McKenzie, and C. Woodruff. 2008. “Returns to capital in
microenterprises: Evidence from a Field Experiment.” Quarterly
Journal of Economics 123 (4): 1329–71.
———. 2009. “Are Women More Credit Constrained? Experimental
Evidence on Gender and Microenterprise Returns.” American
Economic Journal: Applied Economics 1 (3): 1–32.
Dessing, M. 2002 “Labor Supply, the Family and Poverty: The S-Shaped
Labor Supply Curve.” Journal of Economic Behavior &
Organization 49 (4): 433–58.
Djankov, S., Y. Qian, G. Roland, and E. Zhuravskaya. 2006.
“Entrepreneurship in Russia and China Compared.” Journal of
the European Economic Association 4 (2–3): 352–65.
Ellis, A., M. Blackden, J. Cutura, F. MacCulloch, and H. Seebens. 2007.
Gender and Economic Growth in Tanzania: Creating Opportunities
for Women. Directions in Development. Washington DC: World
Bank.
Ellis, A., J. Cutura, N. Dione, I. Gillson, C. Manuel, and J. Thongori.
2007. Gender and Economic Growth in Kenya: Unleashing the
Power of Women. Directions in Development. Washington DC:
World Bank.
Ellis, A., C. Manuel, and M. Blackden. 2006. Gender and Economic
Growth in Uganda: Unleashing the Power of Women. Directions
in Development. Washington DC: World Bank.
Fafchamps, M., D. McKenzie, S. Quinn, and C. Woodruff. 2010. “When
Is Capital Enough to Get Female Microenterprises Growing?
Evidence from a Randomized Experiment in Ghana.” World Bank
Mimeo. Washington DC: World Bank.
Fletschner, D., C. L. Anderson, and A. Cullen. 2010. “Are Women as
Likely to Take Risks and Compete? Behavioural Findings from
Central Vietnam.” Journal of Development Studies 46 (8):
1459–79.
Gajigo, O. and M. Hallward-Driemeier. 2010. “Entrepreneurship Among
New Entrepreneurs.” World Bank Mimeo. Washington DC: World
Bank.
Giné, X. and Mansuri, G. 2009. “Constraints to Female
Entrepreneurship: Ideas or Capital.” World Bank Mimeo.
Washington DC: World Bank.
Grossbard-Shechtman, A. and S. Neuman. 1998. “Women’s Labor
Supply and Marital Choice.” Journal of Political Economy 96 (6):
1294–302.
Hallward-Driemeier, M. Forthcoming. Improving the Legal Investment
Climate for Women in Africa. Washington, DC: World Bank.
Hallward-Driemeier, M. and R. Aterido. 2009. “Whose Business Is it
Anyway?” World Bank Mimeo. Washington DC: World Bank.
Hallward-Driemeier, M., with R. Aterido, M. Blackden, O. Gajigo,
T. Hasan, and A. Rasteletti. 2011. Expanding Economic
Opportunities for Women in Africa. Washington DC: World Bank.
Hallward-Driemeier, M. and O. Gajigo. 2010. “Strengthening Economic
Rights and Women’s Occupational Choice: The Impact of
Reforming Ethiopia’s Family Law.” World Bank Mimeo.
Washington DC: World Bank.
Hallward-Driemeier, M., T. Hasan, J. Kamangu, E. Lobti, and M.
Blackden. Women’ s Legal and Economic Empowerment
Database (Women LEED Africa). Washington DC: World Bank.
Hallward-Driemeier, M. and A. Rasteletti. 2010. “Women’s and Men’s
Entrepreneurship in Africa.” World Bank Mimeo. Washington DC:
World Bank.
Herzberg, B. 2008. PPD Product Review. PowerPoint Presentation, IFC,
November.
Herzberg, B. and A. Wright. 2006. The PPD Handbook: A Toolkit for
Business Environment Reformers. Washington DC: World Bank,
IFC, DFID, OECD Development Centre.
Jakiela, P., E. Miguel, and V. L. te Velde. 2010. “You’ve Earned It:
Combining Field and Lab Experiments to Estimate the Impact of
Human Capital on Social Preferences.” NBER Working Paper No.
16449. Cambridge, MA: National Bureau of Economic Research.
Jones, P. and A. Barr. 1996. “Learning by Doing in Sub-Saharan Africa:
Evidence from Ghana.” Journal of International Development 8
(3): 445–66.
Karlan, D. and J. Morduch. 2009. “Access to finance.” Handbook of
Development Economics, Volume 5, ed. D, Rodrik and M.
Rosenzweig. Amsterdam: Elsevier. 4704–84.
Karlan, D. and M. Valdivia. Forthcoming. “Teaching Entrepreneurship:
Impact of Business Training on Microfinance Clients and
Institutions.” Review of Economics and Statistics.
Karlan, D. and J. Zinmam. 2009. “Expanding Microenterprise Credit
Access: Using Randomized Supply Decisions to Estimate the
Impacts in Manila.” Working Papers No. 976. New Haven, CT:
Economic Growth Center, Yale University.
Klapper, L. and S. Parker. 2010. “Gender and the Business Environment
for New Firm Creation.” World Bank Research Observer 25 (1):
1–21.
Klinger, B. and M. Schündeln. 2008. “Can Entrepreneurial Activity Be
Taught? Quasi-Experimental Evidence from Central America.” CID
Working Paper No. 153. Cambridge, MA: Center for International
Development, Harvard Kennedy School.
Lindholm, C. and D. Mead. 1999. Small Enterprises and Economic
Development: The Dynamics of Micro and Small Enterprises.
London and New York: Routledge.
Mammen, K. and C. Paxon. 2000. “Women’s Work and Economic
Development.” Journal of Economic Perspectives 14 (4): 141–64.
Mead, D. C. and C. Lindholm. 1998. “The Dynamics of Micro and Small
Enterprises in Developing Countries.” World Development 26 (1):
61–74.
Montenegro, C. and M. Hirn. 2009. “A New Disaggregated Set of Labor
Market Indicators Using Standardized Household Surveys from
Around the World.” World Bank Mimeo. Washington DC: World
Bank.
Niederle, M. and L. Vesterlund. 2007. “Do Women Shy Away from
Competition? Do Men Compete Too Much?” Quarterly Journal of
Economics 122 (3): 1067–101.
OECD (Organisation for Economic Co-operation and Development).
2009. The Social Institutions and Gender Index (SIGI) database.
Available at http://www.oecd.org/dataoecd/52/33/
42289479.pdf.
Richardson, P., R. Howarth, and G. Finnegan. 2004. “The Challenges of
Growing Small Businesses: Insights from Women Entrepreneurs
in Africa.” InFocus Programme on Boosting Employment through
Small Enterprise Development. Geneva: ILO.
Toland, M. 2009. “Review of World Bank Group Support to Structured
Public-Private Dialogue for Private and Financial Sector
Development.” World Bank Group Mimeo. Washington DC:
World Bank Group.
87
2.2:
Str
engt
heni
ng W
omen
’s E
ntre
pren
eurs
hip
The Africa Competitiveness Report 2011 © 2011 World Economic Forum, the World Bank and the African Development Bank
Simavi, S., C. Manuel, and M. Blackden. 2010. Gender Dimensions of
Investment Climate Reform: A Guide for Policy Makers and
Practitioners. Washington DC: World Bank.
World Bank. 2001. Engendering Development Through Gender Equality
in Rights, Resources and Voice. Washington DC: World Bank.
———. 2007. Global Monitoring Report 2007. Millennium Development
Goals: Confronting the Challenges of Gender Equality and Fragile
States. Washington DC: World Bank.
———. 2010. Women, Business and the Law. Washington DC: World
Bank. Available at wbl.worldbank.org.
World Economic Forum. 2010. The Global Gender Gap Report 2010.
Geneva: World Economic Forum.
88
2.2:
Str
engt
heni
ng W
omen
’s E
ntre
pren
eurs
hip
The Africa Competitiveness Report 2011 © 2011 World Economic Forum, the World Bank and the African Development Bank
CHAPTER 2.3
Assessing Africa’s Travel &Tourism Competitiveness in theWake of the Global EconomicCrisisJENNIFER BLANKE, World Economic Forum
CIARA BROWNE, World Economic Forum
ANDRES F. GARCIA, World Bank
HANNAH R. MESSERLI, World Bank
The last two years have been difficult ones for thetourism industry as it has confronted shock after shock.These have ranged from the global economic crisis andvolatile oil prices to specific climatic disturbances (theIcelandic volcanic ash cloud, extreme weather conditionson multiple continents), political instability, and healthissues such as the H1N1 influenza pandemic. Tourism isoften referred to as one of the most dynamic sectors. Inits current performance, the sector continues to demon-strate the aptness of such a characterization.
During the global economic turmoil, Africa’sTravel & Tourism (T&T) industry was less hard hitthan the world average with respect to internationaltourism receipts. Globally, emerging markets are nowleading the way in the gradual recovery from the effectsof the global economic crisis, while the traditional markets of Europe and North America are laggingbehind.
The tourism sector across Africa is now experienc-ing uneven and fast-changing patterns of demand. Mostrecently, as civil unrest has spread across North Africa,international tourism to individual countries has droppeddramatically—in some cases it has nearly stopped. Animpact on neighboring countries can be felt due to trav-elers expanding the boundaries of their security concerns.There are also signs that civil unrest in some destinationsmay lead to a windfall in others, as travelers previouslyplanning to travel to Egypt or Tunisia are potentiallyrewriting their itineraries for Kenya and Morocco.
Africa’s achievements in capturing tourism revenuesand arrivals must be understood in the context of thecontinent’s relatively unexploited tourism potential.Indeed, according to the United Nations World TourismOrganization (UNWTO), in 2010 Africa still accountedfor only 3.4 percent of global tourism receipts and 5.2percent of tourist arrivals, despite accounting for almost15 percent of the world’s population.1 Given the well-understood potential for a growing national T&T sectorto contribute to employment, raise national income,and reduce poverty, Africa still has ample opportunity to boost its ability to fully reap the benefits the sectoroffers. The rapidly unfolding changes in destinations,particularly across North Africa, may lead to new spurtsof tourism demand as countries move from a focus onleadership changes to concerted efforts to strengtheneconomies. This arena is anticipated to provide abundantoccasions for Travel & Tourism to demonstrate itsresilience. As a growing component of the broad servic-es sector, Travel & Tourism has a vital role to play inenabling export diversification and attracting foreigndirect investment (FDI). What are the pillars that willcontribute to the sector achieving its full potential?
This chapter brings together data from the WorldEconomic Forum’s Travel & Tourism CompetitivenessIndex (TTCI) with specific World Bank research on thedrivers of Africa’s T&T competitiveness. Specifically, theTTCI findings for 35 African countries are benchmarked
89
2.3:
Ass
essi
ng A
fric
a’s
Trav
el &
Tou
rism
Com
petit
iven
ess
The Africa Competitiveness Report 2011 © 2011 World Economic Forum, the World Bank and the African Development Bank
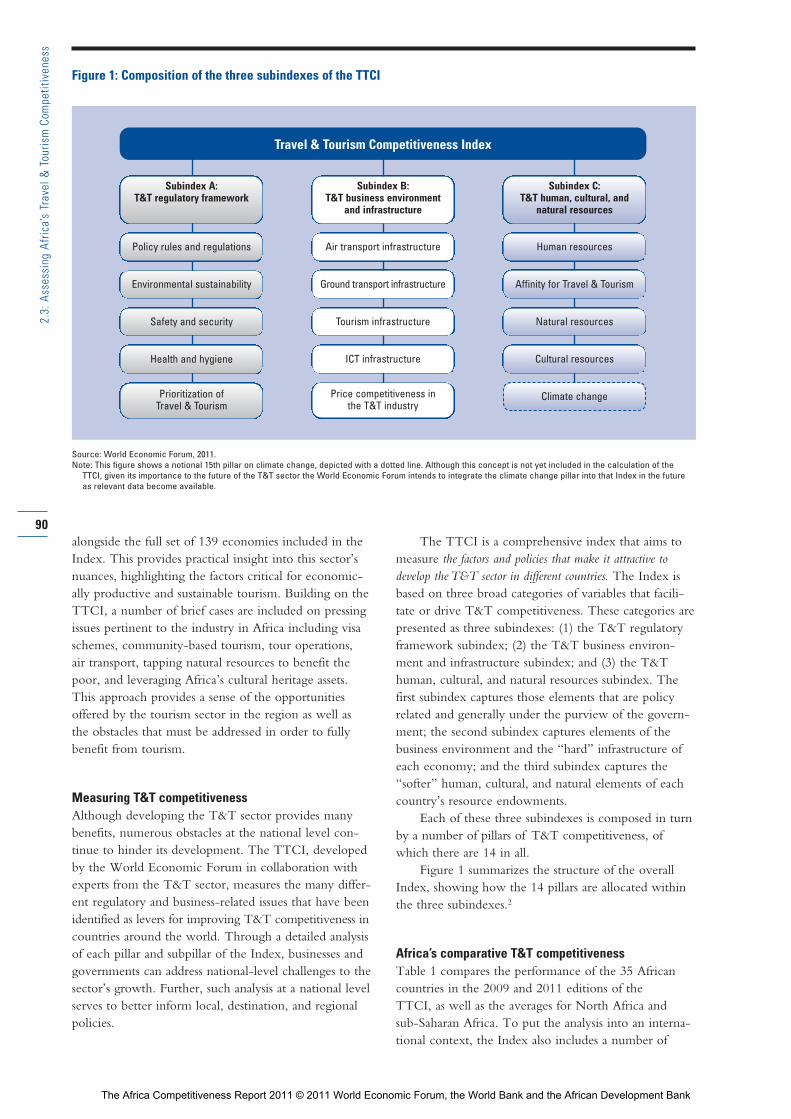
alongside the full set of 139 economies included in theIndex. This provides practical insight into this sector’snuances, highlighting the factors critical for economic -ally productive and sustainable tourism. Building on theTTCI, a number of brief cases are included on pressingissues pertinent to the industry in Africa including visaschemes, community-based tourism, tour operations, air transport, tapping natural resources to benefit thepoor, and leveraging Africa’s cultural heritage assets.This approach provides a sense of the opportunitiesoffered by the tourism sector in the region as well asthe obstacles that must be addressed in order to fullybenefit from tourism.
Measuring T&T competitivenessAlthough developing the T&T sector provides manybenefits, numerous obstacles at the national level con -tinue to hinder its development. The TTCI, developedby the World Economic Forum in collaboration withexperts from the T&T sector, measures the many differ-ent regulatory and business-related issues that have beenidentified as levers for improving T&T competitiveness incountries around the world. Through a detailed analysisof each pillar and subpillar of the Index, businesses andgovernments can address national-level challenges to thesector’s growth. Further, such analysis at a national levelserves to better inform local, destination, and regionalpolicies.
The TTCI is a comprehensive index that aims tomeasure the factors and policies that make it attractive todevelop the T&T sector in different countries. The Index isbased on three broad categories of variables that facili-tate or drive T&T competitiveness. These categories arepresented as three subindexes: (1) the T&T regulatoryframework subindex; (2) the T&T business environ-ment and infrastructure subindex; and (3) the T&Thuman, cultural, and natural resources subindex. Thefirst sub index captures those elements that are policyrelated and generally under the purview of the govern-ment; the second subindex captures elements of thebusiness environment and the “hard” infrastructure ofeach economy; and the third subindex captures the“softer” human, cultural, and natural elements of eachcountry’s resource endowments.
Each of these three subindexes is composed in turnby a number of pillars of T&T competitiveness, ofwhich there are 14 in all.
Figure 1 summarizes the structure of the overallIndex, showing how the 14 pillars are allocated withinthe three subindexes.2
Africa’s comparative T&T competitivenessTable 1 compares the performance of the 35 Africancountries in the 2009 and 2011 editions of the TTCI, as well as the averages for North Africa and sub-Saharan Africa. To put the analysis into an interna-tional context, the Index also includes a number of
90
2.3:
Ass
essi
ng A
fric
a’s
Trav
el &
Tou
rism
Com
petit
iven
ess
Figure 1: Composition of the three subindexes of the TTCI
Subindex A:T&T regulatory framework
Health and hygiene
Safety and security
Environmental sustainability
Policy rules and regulations
Prioritization of Travel & Tourism
Subindex B: T&T business environment
and infrastructure
ICT infrastructure
Tourism infrastructure
Ground transport infrastructure
Air transport infrastructure
Price competitiveness in the T&T industry
Subindex C: T&T human, cultural, and
natural resources
Human resources
Affinity for Travel & Tourism
Cultural resources
Climate change
Natural resources
Travel & Tourism Competitiveness Index
Source: World Economic Forum, 2011.Note: This figure shows a notional 15th pillar on climate change, depicted with a dotted line. Although this concept is not yet included in the calculation of the
TTCI, given its importance to the future of the T&T sector the World Economic Forum intends to integrate the climate change pillar into that Index in the futureas relevant data become available.
The Africa Competitiveness Report 2011 © 2011 World Economic Forum, the World Bank and the African Development Bank
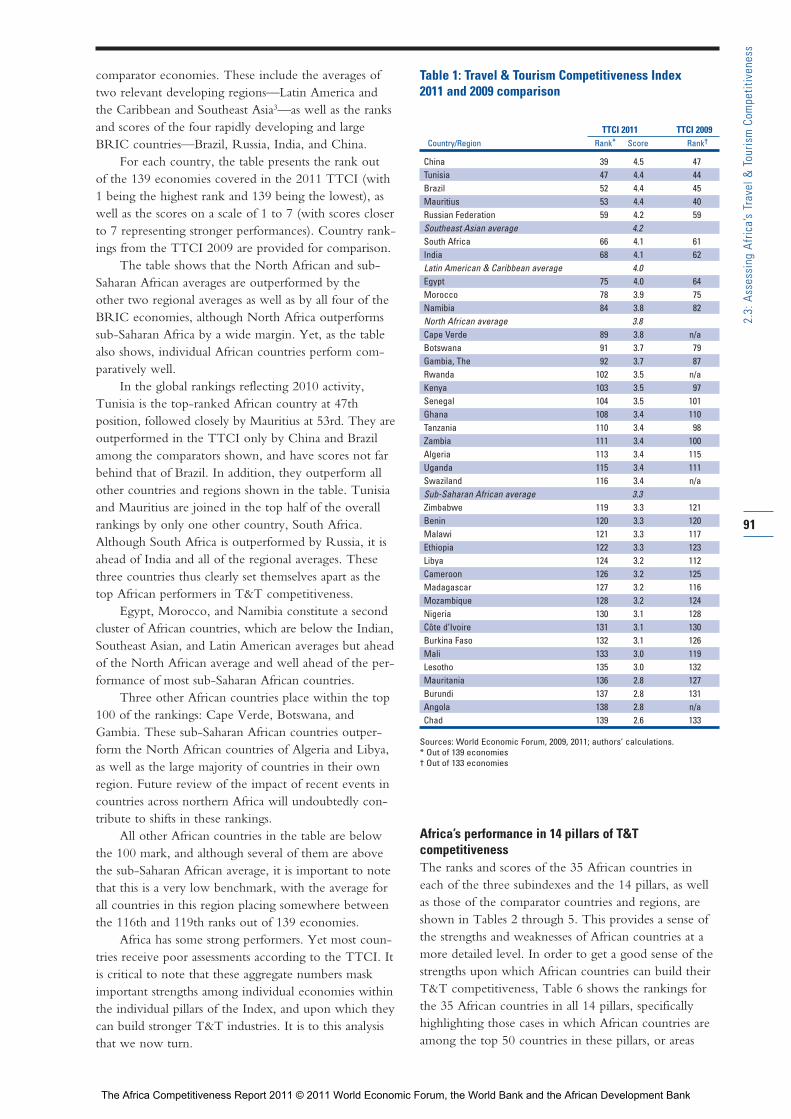
comparator economies. These include the averages oftwo relevant developing regions—Latin America andthe Caribbean and Southeast Asia3—as well as the ranksand scores of the four rapidly developing and largeBRIC countries—Brazil, Russia, India, and China.
For each country, the table presents the rank out of the 139 economies covered in the 2011 TTCI (with1 being the highest rank and 139 being the lowest), aswell as the scores on a scale of 1 to 7 (with scores closerto 7 representing stronger performances). Country rank-ings from the TTCI 2009 are provided for comparison.
The table shows that the North African and sub-Saharan African averages are outperformed by the other two regional averages as well as by all four of theBRIC economies, although North Africa outperformssub-Saharan Africa by a wide margin. Yet, as the tablealso shows, individual African countries perform com-paratively well.
In the global rankings reflecting 2010 activity,Tunisia is the top-ranked African country at 47th position, followed closely by Mauritius at 53rd. They areoutperformed in the TTCI only by China and Brazilamong the comparators shown, and have scores not farbehind that of Brazil. In addition, they outperform allother countries and regions shown in the table. Tunisiaand Mauritius are joined in the top half of the overallrankings by only one other country, South Africa.Although South Africa is outperformed by Russia, it isahead of India and all of the regional averages. Thesethree countries thus clearly set themselves apart as thetop African performers in T&T competitiveness.
Egypt, Morocco, and Namibia constitute a secondcluster of African countries, which are below the Indian,Southeast Asian, and Latin American averages but aheadof the North African average and well ahead of the per-formance of most sub-Saharan African countries.
Three other African countries place within the top100 of the rankings: Cape Verde, Botswana, andGambia. These sub-Saharan African countries outper-form the North African countries of Algeria and Libya,as well as the large majority of countries in their ownregion. Future review of the impact of recent events incountries across northern Africa will undoubtedly con-tribute to shifts in these rankings.
All other African countries in the table are belowthe 100 mark, and although several of them are abovethe sub-Saharan African average, it is important to notethat this is a very low benchmark, with the average forall countries in this region placing somewhere betweenthe 116th and 119th ranks out of 139 economies.
Africa has some strong performers. Yet most coun-tries receive poor assessments according to the TTCI. Itis critical to note that these aggregate numbers maskimportant strengths among individual economies withinthe individual pillars of the Index, and upon which theycan build stronger T&T industries. It is to this analysisthat we now turn.
Africa’s performance in 14 pillars of T&T competitivenessThe ranks and scores of the 35 African countries in each of the three subindexes and the 14 pillars, as well as those of the comparator countries and regions, areshown in Tables 2 through 5. This provides a sense ofthe strengths and weaknesses of African countries at amore detailed level. In order to get a good sense of thestrengths upon which African countries can build theirT&T competitiveness, Table 6 shows the rankings forthe 35 African countries in all 14 pillars, specificallyhighlighting those cases in which African countries areamong the top 50 countries in these pillars, or areas
91
2.3:
Ass
essi
ng A
fric
a’s
Trav
el &
Tou
rism
Com
petit
iven
ess
Table 1: Travel & Tourism Competitiveness Index 2011 and 2009 comparison
TTCI 2011 TTCI 2009Country/Region Rank* Score Rank†
China 39 4.5 47Tunisia 47 4.4 44Brazil 52 4.4 45Mauritius 53 4.4 40Russian Federation 59 4.2 59Southeast Asian average 4.2South Africa 66 4.1 61India 68 4.1 62Latin American & Caribbean average 4.0Egypt 75 4.0 64Morocco 78 3.9 75Namibia 84 3.8 82North African average 3.8Cape Verde 89 3.8 n/aBotswana 91 3.7 79Gambia, The 92 3.7 87Rwanda 102 3.5 n/aKenya 103 3.5 97Senegal 104 3.5 101Ghana 108 3.4 110Tanzania 110 3.4 98Zambia 111 3.4 100Algeria 113 3.4 115Uganda 115 3.4 111Swaziland 116 3.4 n/aSub-Saharan African average 3.3Zimbabwe 119 3.3 121Benin 120 3.3 120Malawi 121 3.3 117Ethiopia 122 3.3 123Libya 124 3.2 112Cameroon 126 3.2 125Madagascar 127 3.2 116Mozambique 128 3.2 124Nigeria 130 3.1 128Côte d’Ivoire 131 3.1 130Burkina Faso 132 3.1 126Mali 133 3.0 119Lesotho 135 3.0 132Mauritania 136 2.8 127Burundi 137 2.8 131Angola 138 2.8 n/aChad 139 2.6 133
Sources: World Economic Forum, 2009, 2011; authors’ calculations.* Out of 139 economies† Out of 133 economies
The Africa Competitiveness Report 2011 © 2011 World Economic Forum, the World Bank and the African Development Bank
where they perform relatively well on an global basis.The table also notes the global top performer for com-parison, in the bottom section of the table. Detailedprofiles for all 139 economies, showing their per -formances in all of the individual variables included in the analysis, can be found in The Travel & TourismCompetitiveness Report 2011, available online atwww.weforum.org/ttcr.
Policy rules and regulationsThis pillar captures the extent to which the policy envi-ronment is conducive to developing the T&T sector ineach country. Governments can have an importantimpact on the attractiveness of developing the T&T sector, depending on whether the policies that they create and perpetuate support or hinder the sector’sdevelopment. Sometimes well-intentioned policies can end up creating red tape or obstacles that have theopposite effect from that which was intended. This pil-lar accounts for the extent to which foreign ownershipand FDI are welcomed and facilitated by the country,how well property rights are protected, the time andcost required for setting up a business, the extent towhich visa requirements make it complicated for visitorsto enter the country, and the openness of the bilateralAir Service Agreements into which the government hasentered with other countries. This year a new variableis included in the TTCI that measures the commit-ments made within the international trade regime toopening tourism and travel services (under GATS).
As Table 3 shows, North Africa and sub-SaharanAfrica are outperformed by the averages from bothLatin America and the Caribbean and Southeast Asia, aswell as China. However, it is notable that both Africanregions outperform the BRICs’ average and indeed theperformances of Brazil, India, and Russia individually.This is thus an area where some African countries areperforming relatively well.
Indeed, looking at Table 6, we see that sevenAfrican countries are among the top 50 in this pillar.The best performer is Tunisia at 23rd place, followed by Mauritius and South Africa at 27th and 31st ranks,respectively. These are countries with business-enablingenvironments that facilitate well-protected propertyrights, ensure that the process of starting a business isnot very costly, and with visa requirements that are notvery onerous. With respect to the enabling environ-ment for attracting tourism, Box 1 looks at the impor-tance of streamlining visas in Africa to foster tourism.
Other relatively strong performers are Rwanda,Zambia, Morocco, and Egypt, ranked 40th, 44th, 48th,and 49th, respectively, showing that this is an areawhere individual countries throughout Africa do rela-tively well.
Yet most African countries are assessed as havingregulatory environments that are not sufficiently sup-portive of the development of the T&T sector. Indeed,
20 African countries are ranked at 100th or below onthis pillar, and 7 of the 10 lowest-ranked countries are in the Africa region. These countries would be wellserved by creating policy environments that are moresupportive of developing the T&T sector. Given thatpolicies can be changed by adopting proven practices,improvements in this area can lead changes in otherareas measured by the Index, such as building infra-structure and improving human resources.
Environmental sustainabilityThe importance of the natural environment for provid-ing an attractive location for tourism in Africa cannotbe overstated. It is clear that policies and factorsenhancing environmental sustainability are crucial forensuring that a country will continue to be an attractivedestination going into the future. This pillar measuresthe stringency of the government’s environmental regu-lations in each country as well as the extent to whichthey are actually enforced. Given the environmentalimpacts that tourism can sometimes bring about, thepillar also takes into account the extent to which gov-ernments prioritize the sustainable development of theT&T industry in their respective economies. In additionto policy inputs, this pillar includes some of the relatedenvironmental outputs, including carbon dioxide emis-sions and the country’s percentage of endangeredspecies.
As shown by Table 3, African countries performcomparatively well in this pillar. North African coun-tries, with an average score of 4.4 out of 7, outperformSoutheast Asia (4.2) and are on a par with the BRICaverage (4.4). Perhaps more strikingly, this is an areawhere the sub-Saharan African countries, with an aver-age of 4.6, outperform all regions shown in the table,including North Africa.
Turning to Table 6, we see that 14 African coun-tries are indeed among the top 50 in this pillar, andvery few of them are at the bottom of the rankings.Top-performing countries are Rwanda, Tunisia,Namibia, and Kenya, ranked 8th, 18th, 22nd, and 26th,respectively. These are countries that are making effortsto develop their T&T sectors in a sustainable mannerand that, for the most part, have stringent environmen-tal legislation to ensure that this happens.
Three of the weakest performers in this pillar arefrom North Africa (Egypt, Algeria, and Libya), lendingto the subregion’s lower average ranking. They arejoined in the lower part of the rankings by Angola andMauritania. These are countries that will need to stepup sustain ability efforts to buttress their T&T competi-tiveness going forward. In doing so, it is encouragingthey have a number of good examples in the region tofollow, such as Namibia, as presented in Box 2.
92
2.3:
Ass
essi
ng A
fric
a’s
Trav
el &
Tou
rism
Com
petit
iven
ess
The Africa Competitiveness Report 2011 © 2011 World Economic Forum, the World Bank and the African Development Bank
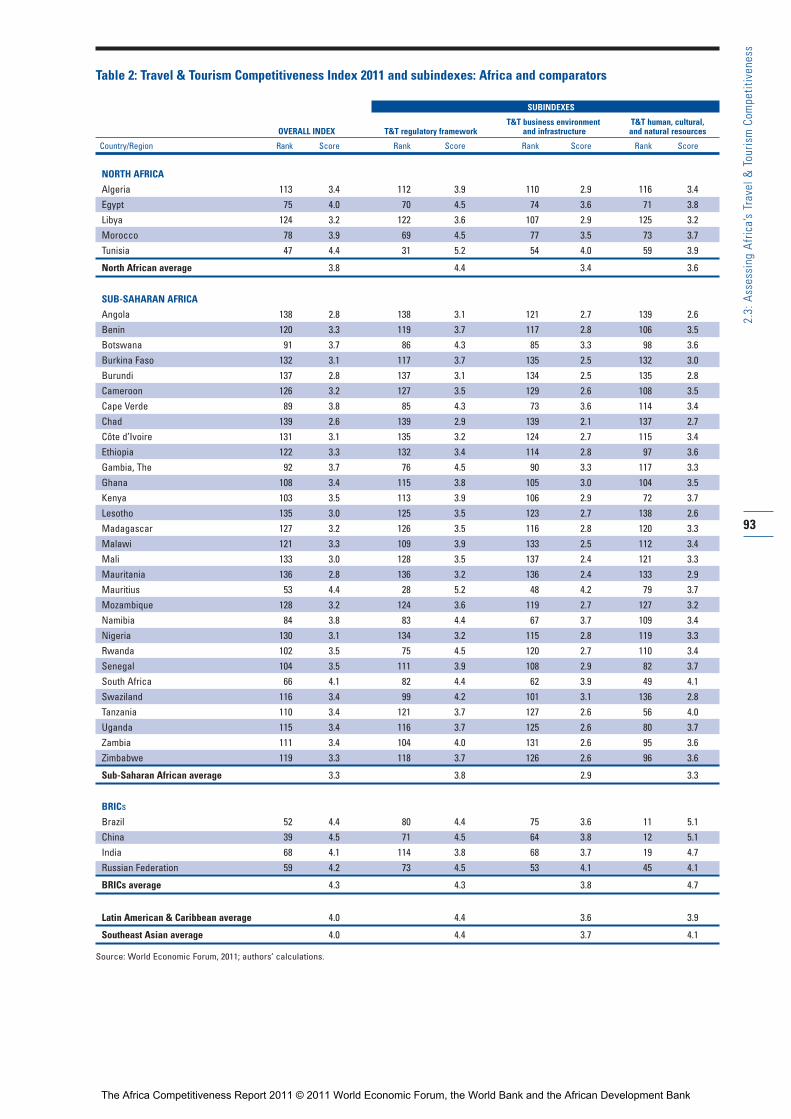
93
2.3:
Ass
essi
ng A
fric
a’s
Trav
el &
Tou
rism
Com
petit
iven
ess
Table 2: Travel & Tourism Competitiveness Index 2011 and subindexes: Africa and comparators
SUBINDEXES
T&T business environment T&T human, cultural, OVERALL INDEX T&T regulatory framework and infrastructure and natural resources
Country/Region Rank Score Rank Score Rank Score Rank Score
NORTH AFRICA
Algeria 113 3.4 112 3.9 110 2.9 116 3.4Egypt 75 4.0 70 4.5 74 3.6 71 3.8Libya 124 3.2 122 3.6 107 2.9 125 3.2Morocco 78 3.9 69 4.5 77 3.5 73 3.7Tunisia 47 4.4 31 5.2 54 4.0 59 3.9
North African average 3.8 4.4 3.4 3.6
SUB-SAHARAN AFRICA
Angola 138 2.8 138 3.1 121 2.7 139 2.6Benin 120 3.3 119 3.7 117 2.8 106 3.5Botswana 91 3.7 86 4.3 85 3.3 98 3.6Burkina Faso 132 3.1 117 3.7 135 2.5 132 3.0Burundi 137 2.8 137 3.1 134 2.5 135 2.8Cameroon 126 3.2 127 3.5 129 2.6 108 3.5Cape Verde 89 3.8 85 4.3 73 3.6 114 3.4Chad 139 2.6 139 2.9 139 2.1 137 2.7Côte d’Ivoire 131 3.1 135 3.2 124 2.7 115 3.4Ethiopia 122 3.3 132 3.4 114 2.8 97 3.6Gambia, The 92 3.7 76 4.5 90 3.3 117 3.3Ghana 108 3.4 115 3.8 105 3.0 104 3.5Kenya 103 3.5 113 3.9 106 2.9 72 3.7Lesotho 135 3.0 125 3.5 123 2.7 138 2.6Madagascar 127 3.2 126 3.5 116 2.8 120 3.3Malawi 121 3.3 109 3.9 133 2.5 112 3.4Mali 133 3.0 128 3.5 137 2.4 121 3.3Mauritania 136 2.8 136 3.2 136 2.4 133 2.9Mauritius 53 4.4 28 5.2 48 4.2 79 3.7Mozambique 128 3.2 124 3.6 119 2.7 127 3.2Namibia 84 3.8 83 4.4 67 3.7 109 3.4Nigeria 130 3.1 134 3.2 115 2.8 119 3.3Rwanda 102 3.5 75 4.5 120 2.7 110 3.4Senegal 104 3.5 111 3.9 108 2.9 82 3.7South Africa 66 4.1 82 4.4 62 3.9 49 4.1Swaziland 116 3.4 99 4.2 101 3.1 136 2.8Tanzania 110 3.4 121 3.7 127 2.6 56 4.0Uganda 115 3.4 116 3.7 125 2.6 80 3.7Zambia 111 3.4 104 4.0 131 2.6 95 3.6Zimbabwe 119 3.3 118 3.7 126 2.6 96 3.6
Sub-Saharan African average 3.3 3.8 2.9 3.3
BRICs Brazil 52 4.4 80 4.4 75 3.6 11 5.1China 39 4.5 71 4.5 64 3.8 12 5.1India 68 4.1 114 3.8 68 3.7 19 4.7Russian Federation 59 4.2 73 4.5 53 4.1 45 4.1
BRICs average 4.3 4.3 3.8 4.7
Latin American & Caribbean average 4.0 4.4 3.6 3.9
Southeast Asian average 4.0 4.4 3.7 4.1
Source: World Economic Forum, 2011; authors’ calculations.
The Africa Competitiveness Report 2011 © 2011 World Economic Forum, the World Bank and the African Development Bank
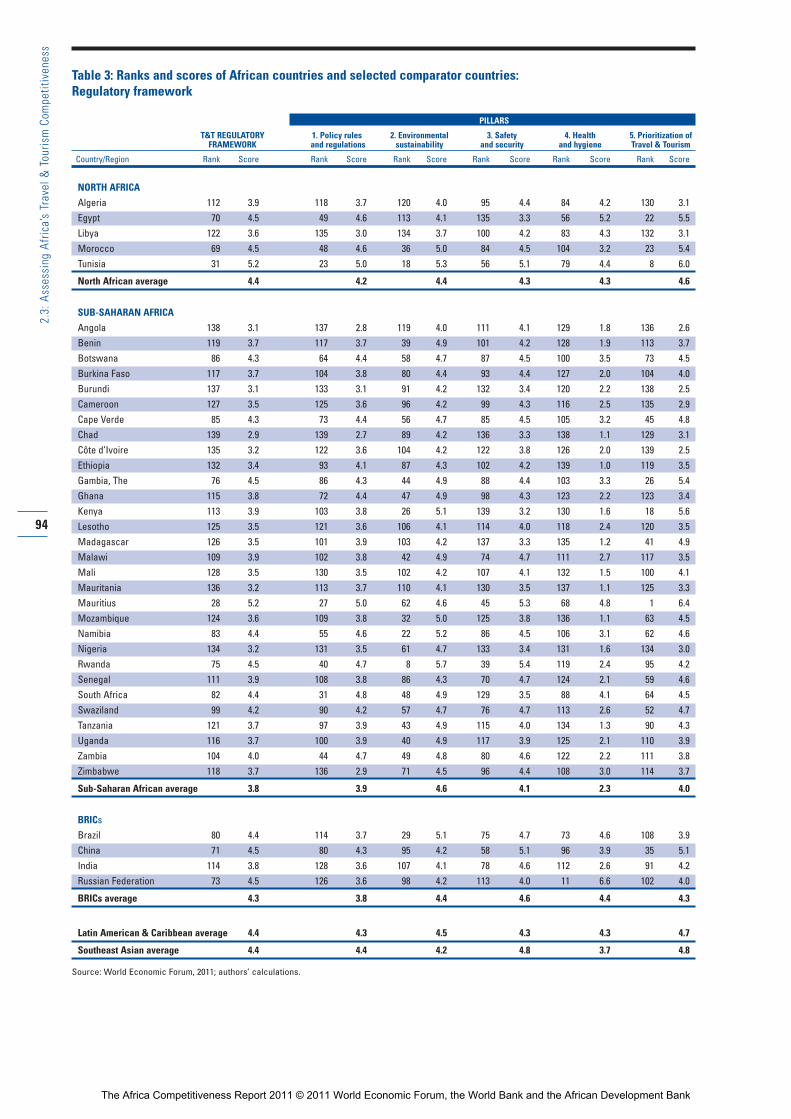
94
2.3:
Ass
essi
ng A
fric
a’s
Trav
el &
Tou
rism
Com
petit
iven
ess
Table 3: Ranks and scores of African countries and selected comparator countries: Regulatory framework
PILLARS
T&T REGULATORY 1. Policy rules 2. Environmental 3. Safety 4. Health 5. Prioritization ofFRAMEWORK and regulations sustainability and security and hygiene Travel & Tourism
Country/Region Rank Score Rank Score Rank Score Rank Score Rank Score Rank Score
NORTH AFRICA
Algeria 112 3.9 118 3.7 120 4.0 95 4.4 84 4.2 130 3.1Egypt 70 4.5 49 4.6 113 4.1 135 3.3 56 5.2 22 5.5Libya 122 3.6 135 3.0 134 3.7 100 4.2 83 4.3 132 3.1Morocco 69 4.5 48 4.6 36 5.0 84 4.5 104 3.2 23 5.4Tunisia 31 5.2 23 5.0 18 5.3 56 5.1 79 4.4 8 6.0
North African average 4.4 4.2 4.4 4.3 4.3 4.6
SUB-SAHARAN AFRICA
Angola 138 3.1 137 2.8 119 4.0 111 4.1 129 1.8 136 2.6Benin 119 3.7 117 3.7 39 4.9 101 4.2 128 1.9 113 3.7Botswana 86 4.3 64 4.4 58 4.7 87 4.5 100 3.5 73 4.5Burkina Faso 117 3.7 104 3.8 80 4.4 93 4.4 127 2.0 104 4.0Burundi 137 3.1 133 3.1 91 4.2 132 3.4 120 2.2 138 2.5Cameroon 127 3.5 125 3.6 96 4.2 99 4.3 116 2.5 135 2.9Cape Verde 85 4.3 73 4.4 56 4.7 85 4.5 105 3.2 45 4.8Chad 139 2.9 139 2.7 89 4.2 136 3.3 138 1.1 129 3.1Côte d’Ivoire 135 3.2 122 3.6 104 4.2 122 3.8 126 2.0 139 2.5Ethiopia 132 3.4 93 4.1 87 4.3 102 4.2 139 1.0 119 3.5Gambia, The 76 4.5 86 4.3 44 4.9 88 4.4 103 3.3 26 5.4Ghana 115 3.8 72 4.4 47 4.9 98 4.3 123 2.2 123 3.4Kenya 113 3.9 103 3.8 26 5.1 139 3.2 130 1.6 18 5.6Lesotho 125 3.5 121 3.6 106 4.1 114 4.0 118 2.4 120 3.5Madagascar 126 3.5 101 3.9 103 4.2 137 3.3 135 1.2 41 4.9Malawi 109 3.9 102 3.8 42 4.9 74 4.7 111 2.7 117 3.5Mali 128 3.5 130 3.5 102 4.2 107 4.1 132 1.5 100 4.1Mauritania 136 3.2 113 3.7 110 4.1 130 3.5 137 1.1 125 3.3Mauritius 28 5.2 27 5.0 62 4.6 45 5.3 68 4.8 1 6.4Mozambique 124 3.6 109 3.8 32 5.0 125 3.8 136 1.1 63 4.5Namibia 83 4.4 55 4.6 22 5.2 86 4.5 106 3.1 62 4.6Nigeria 134 3.2 131 3.5 61 4.7 133 3.4 131 1.6 134 3.0Rwanda 75 4.5 40 4.7 8 5.7 39 5.4 119 2.4 95 4.2Senegal 111 3.9 108 3.8 86 4.3 70 4.7 124 2.1 59 4.6South Africa 82 4.4 31 4.8 48 4.9 129 3.5 88 4.1 64 4.5Swaziland 99 4.2 90 4.2 57 4.7 76 4.7 113 2.6 52 4.7Tanzania 121 3.7 97 3.9 43 4.9 115 4.0 134 1.3 90 4.3Uganda 116 3.7 100 3.9 40 4.9 117 3.9 125 2.1 110 3.9Zambia 104 4.0 44 4.7 49 4.8 80 4.6 122 2.2 111 3.8Zimbabwe 118 3.7 136 2.9 71 4.5 96 4.4 108 3.0 114 3.7
Sub-Saharan African average 3.8 3.9 4.6 4.1 2.3 4.0
BRICsBrazil 80 4.4 114 3.7 29 5.1 75 4.7 73 4.6 108 3.9China 71 4.5 80 4.3 95 4.2 58 5.1 96 3.9 35 5.1India 114 3.8 128 3.6 107 4.1 78 4.6 112 2.6 91 4.2Russian Federation 73 4.5 126 3.6 98 4.2 113 4.0 11 6.6 102 4.0
BRICs average 4.3 3.8 4.4 4.6 4.4 4.3
Latin American & Caribbean average 4.4 4.3 4.5 4.3 4.3 4.7
Southeast Asian average 4.4 4.4 4.2 4.8 3.7 4.8
Source: World Economic Forum, 2011; authors’ calculations.
The Africa Competitiveness Report 2011 © 2011 World Economic Forum, the World Bank and the African Development Bank
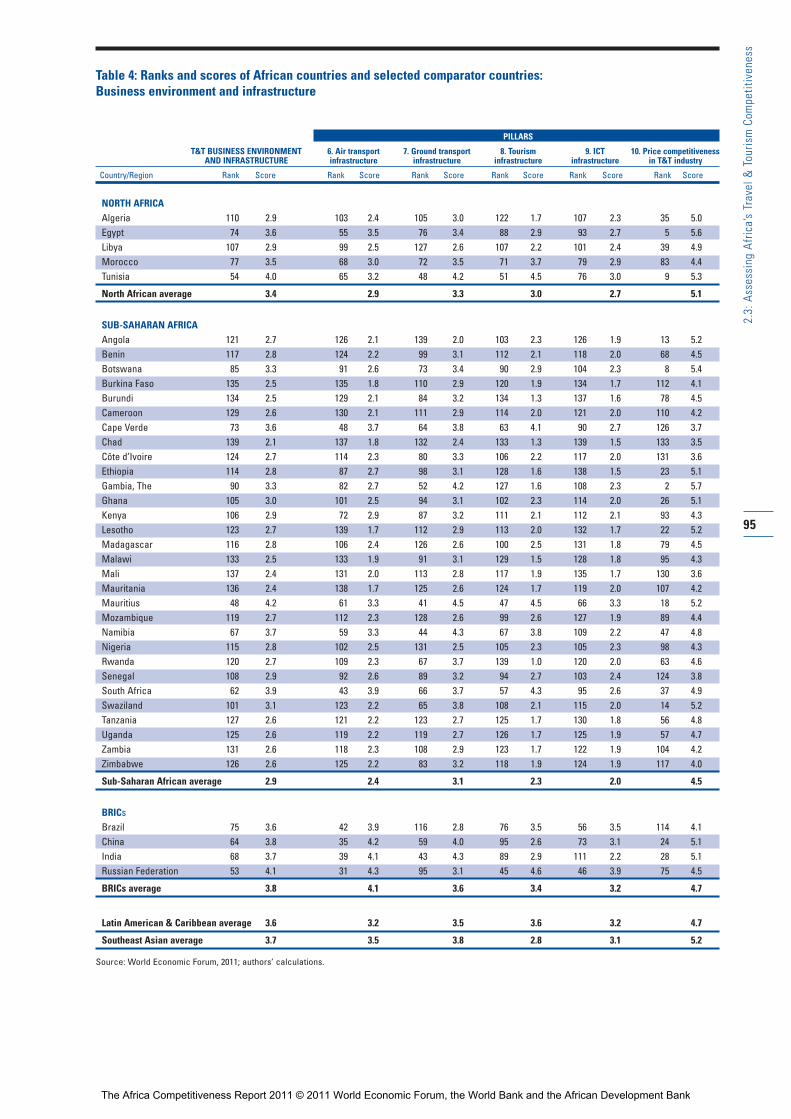
95
2.3:
Ass
essi
ng A
fric
a’s
Trav
el &
Tou
rism
Com
petit
iven
ess
Table 4: Ranks and scores of African countries and selected comparator countries: Business environment and infrastructure
PILLARS
T&T BUSINESS ENVIRONMENT 6. Air transport 7. Ground transport 8. Tourism 9. ICT 10. Price competitiveness AND INFRASTRUCTURE infrastructure infrastructure infrastructure infrastructure in T&T industry
Country/Region Rank Score Rank Score Rank Score Rank Score Rank Score Rank Score
NORTH AFRICAAlgeria 110 2.9 103 2.4 105 3.0 122 1.7 107 2.3 35 5.0Egypt 74 3.6 55 3.5 76 3.4 88 2.9 93 2.7 5 5.6Libya 107 2.9 99 2.5 127 2.6 107 2.2 101 2.4 39 4.9Morocco 77 3.5 68 3.0 72 3.5 71 3.7 79 2.9 83 4.4Tunisia 54 4.0 65 3.2 48 4.2 51 4.5 76 3.0 9 5.3
North African average 3.4 2.9 3.3 3.0 2.7 5.1
SUB-SAHARAN AFRICAAngola 121 2.7 126 2.1 139 2.0 103 2.3 126 1.9 13 5.2Benin 117 2.8 124 2.2 99 3.1 112 2.1 118 2.0 68 4.5Botswana 85 3.3 91 2.6 73 3.4 90 2.9 104 2.3 8 5.4Burkina Faso 135 2.5 135 1.8 110 2.9 120 1.9 134 1.7 112 4.1Burundi 134 2.5 129 2.1 84 3.2 134 1.3 137 1.6 78 4.5Cameroon 129 2.6 130 2.1 111 2.9 114 2.0 121 2.0 110 4.2Cape Verde 73 3.6 48 3.7 64 3.8 63 4.1 90 2.7 126 3.7Chad 139 2.1 137 1.8 132 2.4 133 1.3 139 1.5 133 3.5Côte d’Ivoire 124 2.7 114 2.3 80 3.3 106 2.2 117 2.0 131 3.6Ethiopia 114 2.8 87 2.7 98 3.1 128 1.6 138 1.5 23 5.1Gambia, The 90 3.3 82 2.7 52 4.2 127 1.6 108 2.3 2 5.7Ghana 105 3.0 101 2.5 94 3.1 102 2.3 114 2.0 26 5.1Kenya 106 2.9 72 2.9 87 3.2 111 2.1 112 2.1 93 4.3Lesotho 123 2.7 139 1.7 112 2.9 113 2.0 132 1.7 22 5.2Madagascar 116 2.8 106 2.4 126 2.6 100 2.5 131 1.8 79 4.5Malawi 133 2.5 133 1.9 91 3.1 129 1.5 128 1.8 95 4.3Mali 137 2.4 131 2.0 113 2.8 117 1.9 135 1.7 130 3.6Mauritania 136 2.4 138 1.7 125 2.6 124 1.7 119 2.0 107 4.2Mauritius 48 4.2 61 3.3 41 4.5 47 4.5 66 3.3 18 5.2Mozambique 119 2.7 112 2.3 128 2.6 99 2.6 127 1.9 89 4.4Namibia 67 3.7 59 3.3 44 4.3 67 3.8 109 2.2 47 4.8Nigeria 115 2.8 102 2.5 131 2.5 105 2.3 105 2.3 98 4.3Rwanda 120 2.7 109 2.3 67 3.7 139 1.0 120 2.0 63 4.6Senegal 108 2.9 92 2.6 89 3.2 94 2.7 103 2.4 124 3.8South Africa 62 3.9 43 3.9 66 3.7 57 4.3 95 2.6 37 4.9Swaziland 101 3.1 123 2.2 65 3.8 108 2.1 115 2.0 14 5.2Tanzania 127 2.6 121 2.2 123 2.7 125 1.7 130 1.8 56 4.8Uganda 125 2.6 119 2.2 119 2.7 126 1.7 125 1.9 57 4.7Zambia 131 2.6 118 2.3 108 2.9 123 1.7 122 1.9 104 4.2Zimbabwe 126 2.6 125 2.2 83 3.2 118 1.9 124 1.9 117 4.0
Sub-Saharan African average 2.9 2.4 3.1 2.3 2.0 4.5
BRICsBrazil 75 3.6 42 3.9 116 2.8 76 3.5 56 3.5 114 4.1China 64 3.8 35 4.2 59 4.0 95 2.6 73 3.1 24 5.1India 68 3.7 39 4.1 43 4.3 89 2.9 111 2.2 28 5.1Russian Federation 53 4.1 31 4.3 95 3.1 45 4.6 46 3.9 75 4.5
BRICs average 3.8 4.1 3.6 3.4 3.2 4.7
Latin American & Caribbean average 3.6 3.2 3.5 3.6 3.2 4.7
Southeast Asian average 3.7 3.5 3.8 2.8 3.1 5.2
Source: World Economic Forum, 2011; authors’ calculations.
The Africa Competitiveness Report 2011 © 2011 World Economic Forum, the World Bank and the African Development Bank
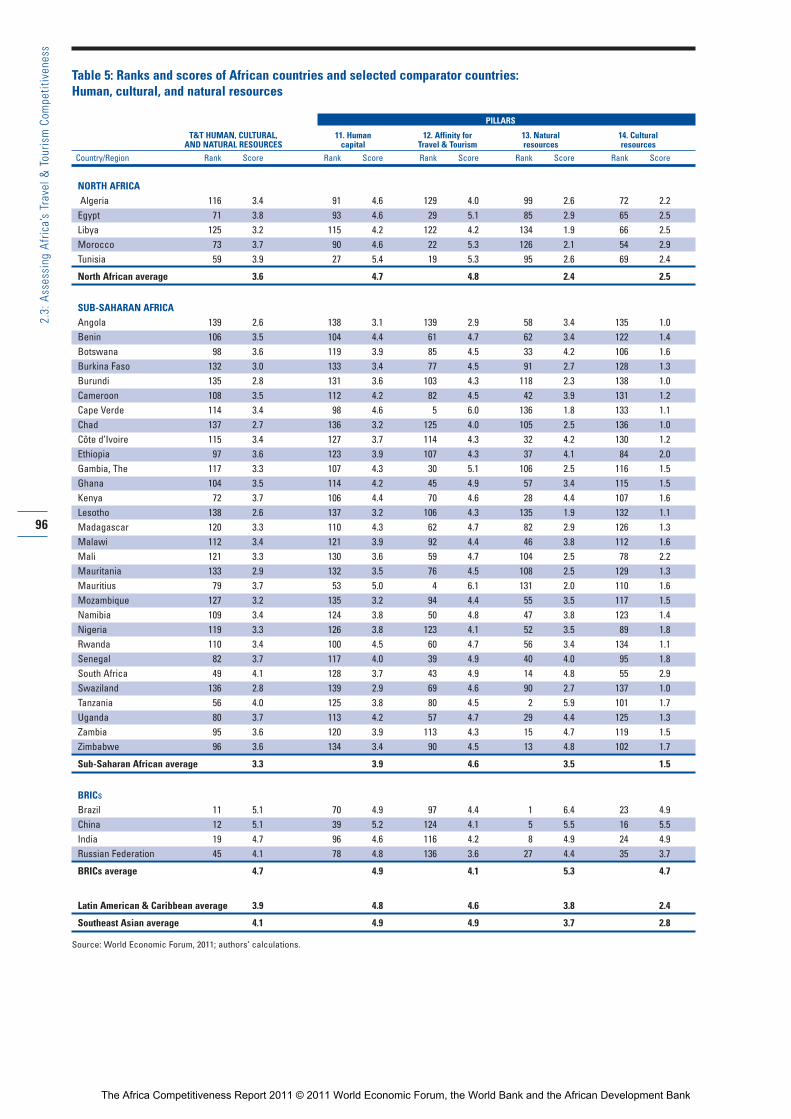
96
2.3:
Ass
essi
ng A
fric
a’s
Trav
el &
Tou
rism
Com
petit
iven
ess
Table 5: Ranks and scores of African countries and selected comparator countries: Human, cultural, and natural resources
PILLARS
T&T HUMAN, CULTURAL, 11. Human 12. Affinity for 13. Natural 14. CulturalAND NATURAL RESOURCES capital Travel & Tourism resources resources
Country/Region Rank Score Rank Score Rank Score Rank Score Rank Score
NORTH AFRICAAlgeria 116 3.4 91 4.6 129 4.0 99 2.6 72 2.2Egypt 71 3.8 93 4.6 29 5.1 85 2.9 65 2.5Libya 125 3.2 115 4.2 122 4.2 134 1.9 66 2.5Morocco 73 3.7 90 4.6 22 5.3 126 2.1 54 2.9Tunisia 59 3.9 27 5.4 19 5.3 95 2.6 69 2.4
North African average 3.6 4.7 4.8 2.4 2.5
SUB-SAHARAN AFRICAAngola 139 2.6 138 3.1 139 2.9 58 3.4 135 1.0Benin 106 3.5 104 4.4 61 4.7 62 3.4 122 1.4Botswana 98 3.6 119 3.9 85 4.5 33 4.2 106 1.6Burkina Faso 132 3.0 133 3.4 77 4.5 91 2.7 128 1.3Burundi 135 2.8 131 3.6 103 4.3 118 2.3 138 1.0Cameroon 108 3.5 112 4.2 82 4.5 42 3.9 131 1.2Cape Verde 114 3.4 98 4.6 5 6.0 136 1.8 133 1.1Chad 137 2.7 136 3.2 125 4.0 105 2.5 136 1.0Côte d’Ivoire 115 3.4 127 3.7 114 4.3 32 4.2 130 1.2Ethiopia 97 3.6 123 3.9 107 4.3 37 4.1 84 2.0Gambia, The 117 3.3 107 4.3 30 5.1 106 2.5 116 1.5Ghana 104 3.5 114 4.2 45 4.9 57 3.4 115 1.5Kenya 72 3.7 106 4.4 70 4.6 28 4.4 107 1.6Lesotho 138 2.6 137 3.2 106 4.3 135 1.9 132 1.1Madagascar 120 3.3 110 4.3 62 4.7 82 2.9 126 1.3Malawi 112 3.4 121 3.9 92 4.4 46 3.8 112 1.6Mali 121 3.3 130 3.6 59 4.7 104 2.5 78 2.2Mauritania 133 2.9 132 3.5 76 4.5 108 2.5 129 1.3Mauritius 79 3.7 53 5.0 4 6.1 131 2.0 110 1.6Mozambique 127 3.2 135 3.2 94 4.4 55 3.5 117 1.5Namibia 109 3.4 124 3.8 50 4.8 47 3.8 123 1.4Nigeria 119 3.3 126 3.8 123 4.1 52 3.5 89 1.8Rwanda 110 3.4 100 4.5 60 4.7 56 3.4 134 1.1Senegal 82 3.7 117 4.0 39 4.9 40 4.0 95 1.8South Africa 49 4.1 128 3.7 43 4.9 14 4.8 55 2.9Swaziland 136 2.8 139 2.9 69 4.6 90 2.7 137 1.0Tanzania 56 4.0 125 3.8 80 4.5 2 5.9 101 1.7Uganda 80 3.7 113 4.2 57 4.7 29 4.4 125 1.3Zambia 95 3.6 120 3.9 113 4.3 15 4.7 119 1.5Zimbabwe 96 3.6 134 3.4 90 4.5 13 4.8 102 1.7
Sub-Saharan African average 3.3 3.9 4.6 3.5 1.5
BRICsBrazil 11 5.1 70 4.9 97 4.4 1 6.4 23 4.9China 12 5.1 39 5.2 124 4.1 5 5.5 16 5.5India 19 4.7 96 4.6 116 4.2 8 4.9 24 4.9Russian Federation 45 4.1 78 4.8 136 3.6 27 4.4 35 3.7
BRICs average 4.7 4.9 4.1 5.3 4.7
Latin American & Caribbean average 3.9 4.8 4.6 3.8 2.4
Southeast Asian average 4.1 4.9 4.9 3.7 2.8
Source: World Economic Forum, 2011; authors’ calculations.
The Africa Competitiveness Report 2011 © 2011 World Economic Forum, the World Bank and the African Development Bank
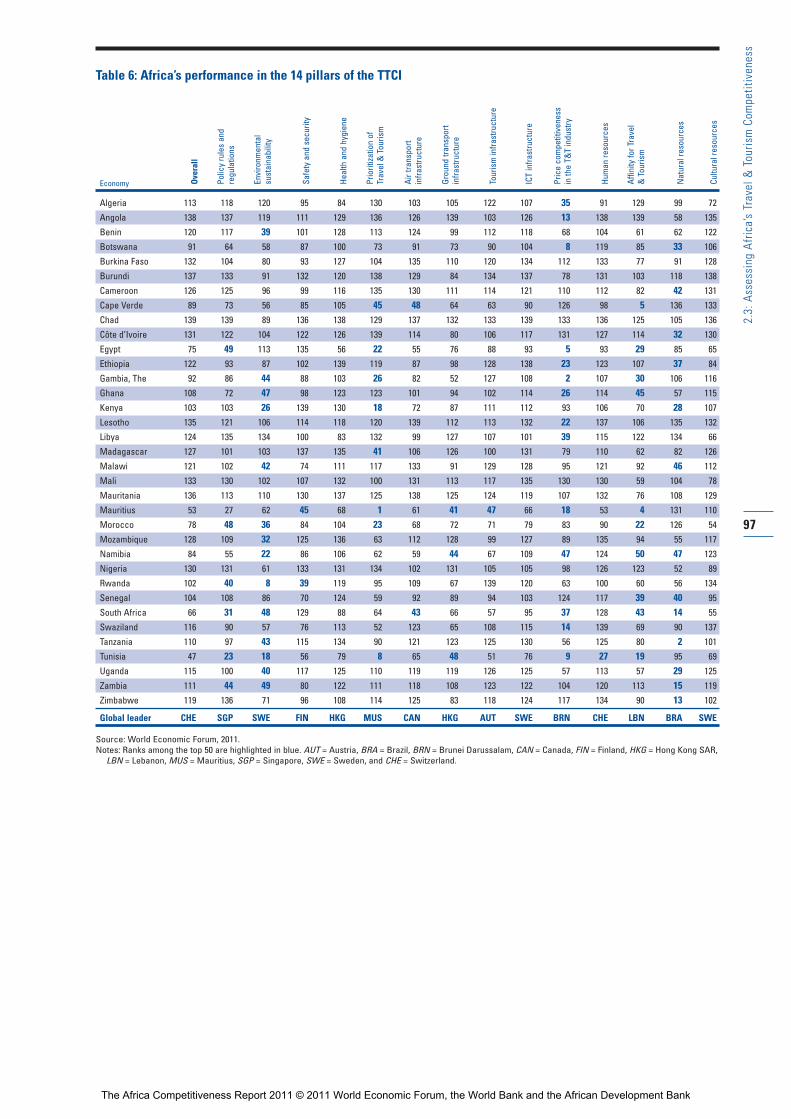
Table 6: Africa’s performance in the 14 pillars of the TTCI
Economy
Algeria 113 118 120 95 84 130 103 105 122 107 35 91 129 99 72
Angola 138 137 119 111 129 136 126 139 103 126 13 138 139 58 135
Benin 120 117 39 101 128 113 124 99 112 118 68 104 61 62 122
Botswana 91 64 58 87 100 73 91 73 90 104 8 119 85 33 106
Burkina Faso 132 104 80 93 127 104 135 110 120 134 112 133 77 91 128
Burundi 137 133 91 132 120 138 129 84 134 137 78 131 103 118 138
Cameroon 126 125 96 99 116 135 130 111 114 121 110 112 82 42 131
Cape Verde 89 73 56 85 105 45 48 64 63 90 126 98 5 136 133
Chad 139 139 89 136 138 129 137 132 133 139 133 136 125 105 136
Côte d’Ivoire 131 122 104 122 126 139 114 80 106 117 131 127 114 32 130
Egypt 75 49 113 135 56 22 55 76 88 93 5 93 29 85 65
Ethiopia 122 93 87 102 139 119 87 98 128 138 23 123 107 37 84
Gambia, The 92 86 44 88 103 26 82 52 127 108 2 107 30 106 116
Ghana 108 72 47 98 123 123 101 94 102 114 26 114 45 57 115
Kenya 103 103 26 139 130 18 72 87 111 112 93 106 70 28 107
Lesotho 135 121 106 114 118 120 139 112 113 132 22 137 106 135 132
Libya 124 135 134 100 83 132 99 127 107 101 39 115 122 134 66
Madagascar 127 101 103 137 135 41 106 126 100 131 79 110 62 82 126
Malawi 121 102 42 74 111 117 133 91 129 128 95 121 92 46 112
Mali 133 130 102 107 132 100 131 113 117 135 130 130 59 104 78
Mauritania 136 113 110 130 137 125 138 125 124 119 107 132 76 108 129
Mauritius 53 27 62 45 68 1 61 41 47 66 18 53 4 131 110
Morocco 78 48 36 84 104 23 68 72 71 79 83 90 22 126 54
Mozambique 128 109 32 125 136 63 112 128 99 127 89 135 94 55 117
Namibia 84 55 22 86 106 62 59 44 67 109 47 124 50 47 123
Nigeria 130 131 61 133 131 134 102 131 105 105 98 126 123 52 89
Rwanda 102 40 8 39 119 95 109 67 139 120 63 100 60 56 134
Senegal 104 108 86 70 124 59 92 89 94 103 124 117 39 40 95
South Africa 66 31 48 129 88 64 43 66 57 95 37 128 43 14 55
Swaziland 116 90 57 76 113 52 123 65 108 115 14 139 69 90 137
Tanzania 110 97 43 115 134 90 121 123 125 130 56 125 80 2 101
Tunisia 47 23 18 56 79 8 65 48 51 76 9 27 19 95 69
Uganda 115 100 40 117 125 110 119 119 126 125 57 113 57 29 125
Zambia 111 44 49 80 122 111 118 108 123 122 104 120 113 15 119
Zimbabwe 119 136 71 96 108 114 125 83 118 124 117 134 90 13 102
Global leader CHE SGP SWE FIN HKG MUS CAN HKG AUT SWE BRN CHE LBN BRA SWE
Source: World Economic Forum, 2011.Notes: Ranks among the top 50 are highlighted in blue. AUT = Austria, BRA = Brazil, BRN = Brunei Darussalam, CAN = Canada, FIN = Finland, HKG = Hong Kong SAR,
LBN = Lebanon, MUS = Mauritius, SGP = Singapore, SWE = Sweden, and CHE = Switzerland.
97
2.3:
Ass
essi
ng A
fric
a’s
Trav
el &
Tou
rism
Com
petit
iven
ess
Ove
rall
Polic
y rules an
d regu
latio
ns
Environm
ental
sustaina
bility
Safety and
sec
urity
Health and
hyg
iene
Prioritiza
tion of
Trav
el &
Tou
rism
Air trans
port
infra
structure
Grou
nd tran
sport
infra
structure
Tourism in
frastructure
ICT infra
structure
Price co
mpe
titiven
ess
in th
e T&
T indu
stry
Human
reso
urce
s
Affin
ity fo
r Trave
l & Tou
rism
Natural re
source
s
Cultu
ral res
ources
The Africa Competitiveness Report 2011 © 2011 World Economic Forum, the World Bank and the African Development Bank
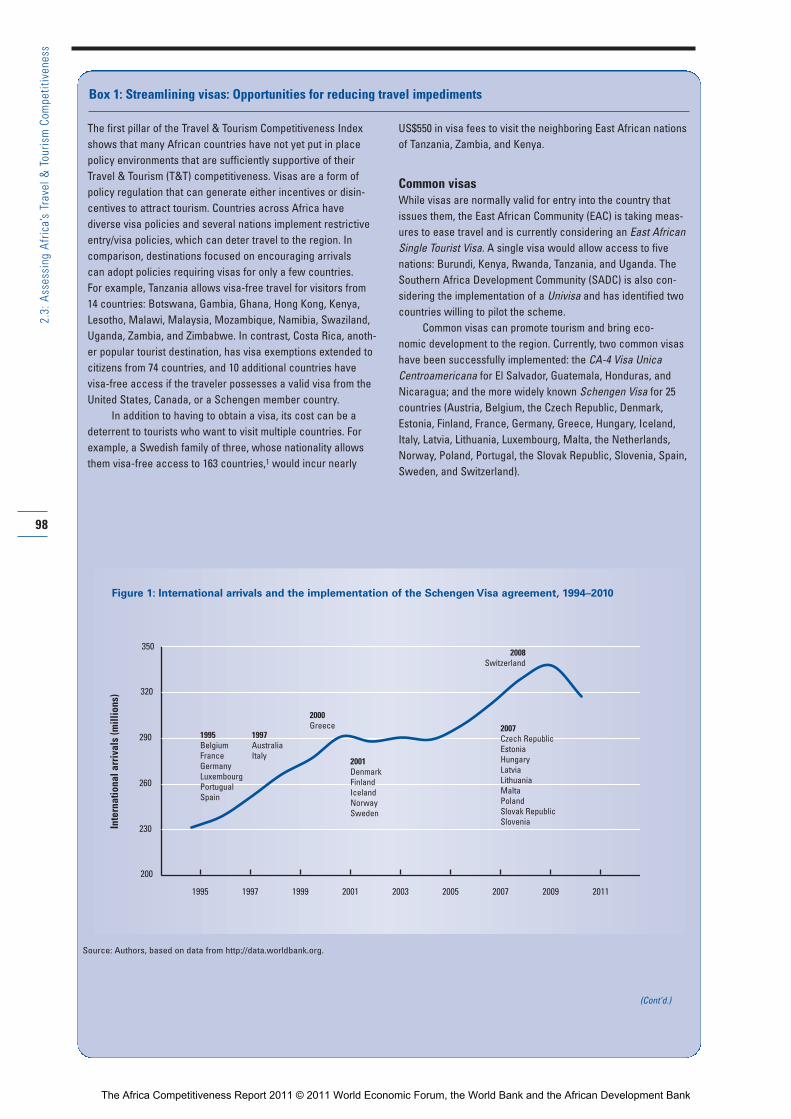
98
2.3:
Ass
essi
ng A
fric
a’s
Trav
el &
Tou
rism
Com
petit
iven
ess
The first pillar of the Travel & Tourism Competitiveness Indexshows that many African countries have not yet put in placepolicy environments that are sufficiently supportive of theirTravel & Tourism (T&T) competitiveness. Visas are a form of policy regulation that can generate either incentives or disin-centives to attract tourism. Countries across Africa havediverse visa policies and several nations implement restrictiveentry/visa policies, which can deter travel to the region. In comparison, destinations focused on encouraging arrivals can adopt policies requiring visas for only a few countries. For example, Tanzania allows visa-free travel for visitors from 14 countries: Botswana, Gambia, Ghana, Hong Kong, Kenya,Lesotho, Malawi, Malaysia, Mozambique, Namibia, Swaziland,Uganda, Zambia, and Zimbabwe. In contrast, Costa Rica, anoth-er popular tourist destination, has visa exemptions extended tocitizens from 74 countries, and 10 additional countries havevisa-free access if the traveler possesses a valid visa from theUnited States, Canada, or a Schengen member country.
In addition to having to obtain a visa, its cost can be adeterrent to tourists who want to visit multiple countries. Forexample, a Swedish family of three, whose nationality allowsthem visa-free access to 163 countries,1 would incur nearly
US$550 in visa fees to visit the neighboring East African nationsof Tanzania, Zambia, and Kenya.
Common visasWhile visas are normally valid for entry into the country thatissues them, the East African Community (EAC) is taking meas-ures to ease travel and is currently considering an East AfricanSingle Tourist Visa. A single visa would allow access to fivenations: Burundi, Kenya, Rwanda, Tanzania, and Uganda. TheSouthern Africa Development Community (SADC) is also con-sidering the implementation of a Univisa and has identified twocountries willing to pilot the scheme.
Common visas can promote tourism and bring eco -nomic development to the region. Currently, two common visashave been successfully implemented: the CA-4 Visa UnicaCentroamericana for El Salvador, Guatemala, Honduras, andNicaragua; and the more widely known Schengen Visa for 25countries (Austria, Belgium, the Czech Republic, Denmark,Estonia, Finland, France, Germany, Greece, Hungary, Iceland,Italy, Latvia, Lithuania, Luxembourg, Malta, the Netherlands,Norway, Poland, Portugal, the Slovak Republic, Slovenia, Spain,Sweden, and Switzerland).
Box 1: Streamlining visas: Opportunities for reducing travel impediments
200
230
260
290
320
350
2009 20112007200520032001199919971995
1995BelgiumFranceGermanyLuxembourgPortugualSpain
1997AustraliaItaly
2000Greece
2001DenmarkFinlandIcelandNorwaySweden
2007Czech RepublicEstoniaHungaryLatviaLithuaniaMaltaPolandSlovak RepublicSlovenia
2008Switzerland
Inte
rnat
iona
l arr
ival
s (m
illio
ns)
Figure 1: International arrivals and the implementation of the Schengen Visa agreement, 1994–2010
Source: Authors, based on data from http://data.worldbank.org.
(Cont’d.)
The Africa Competitiveness Report 2011 © 2011 World Economic Forum, the World Bank and the African Development Bank
Safety and securityThe importance of safety and security conditions is awell-understood determinant of the competitiveness ofa country’s T&T industry. Tourists are deterred fromtraveling to dangerous countries or regions, making itless attractive to develop the T&T sector in thoseplaces. This pillar takes into account security issues suchas the costliness of common crime, violence, and poten-tial terrorism, as well as the extent to which police serv-ices can be relied upon to provide protection fromcrime. The pillar also takes into account an importantmeasure of safety, namely the incidence of road trafficaccidents in the country.
Table 3 shows that safety and security is not an areaof strength among African countries. While NorthAfrica (4.4) outperforms Russia (4.0) and is on a parwith the Latin American and Caribbean region in thispillar, it is outperformed by all other regions and com-parators shown in the table. Sub-Saharan Africa (with ascore of 4.1) is outperformed by all regions and com-parators with the exception of Russia, not a countryknown for high levels of safety and security.
Table 6 reinforces the view that this is not an area of significant strength for the continent. Only twocountries, Rwanda (39th) and Mauritius (45th), are in the top 50 in this pillar, with only Tunisia (56th)
joining them within the top half of the overall rankings.While these countries have comparatively low crimeand dependable police forces, most of the other Africancountries show weaknesses across all areas measured.Indeed, 18 of the 35 African countries are ranked lowerthan 100 in this area, reinforcing the importance ofimproving safety and security in the region to furtherenhance the tourism industry’s development.
Health and hygieneLevels of health and hygiene provided by countries arealso essential for T&T competitiveness. For example,access within the country to improved drinking waterand sanitation is important for the comfort and health oftravelers. And in the event that tourists do become ill,the country’s health sector must be able to ensure theyare properly cared for, as measured by the availability ofphysicians and hospital beds.
In this area, we see that there is a significant differ-ence between the assessment of North African countrieson average (score of 4.3) and sub-Saharan Africa (2.3),despite the fact that the North African average is quitemiddling. North Africa is on a par with the Latin Americanand Caribbean average and outperforms the SoutheastAsian average, while sub-Saharan Africa is outperformedby all relevant comparators, and by a wide margin.
99
2.3:
Ass
essi
ng A
fric
a’s
Trav
el &
Tou
rism
Com
petit
iven
ess
The Schengen Visa is a result of an agreement signed bythe European Union (EU) in 1985 to facilitate the free movementof persons within the EU area. The agreement came into forcein 1995 and now includes non-EU countries. With the SchengenVisa system, international arrivals may enter any participatingcountry and travel freely within the Schengen zone. Internalborder controls for all travelers have disappeared, and travelwithin the Schengen zone is handled as domestic travel.
Based on available data from the United Nations WorldTourism Organization (UNWTO), since 1995 there has been anincrease in international tourist arrivals to the 25 Schengenmember countries (Figure 1). The trend slowed but continued to increase despite the events of 9/11 and the global economiccrisis.
In order to show the potential benefits that a common visacan bring to both the EAC and the SADC regions, we analyzedthe impact that the implementation of the Schengen agreementhas had on international tourist arrivals. When controlling forthe nation’s income per capita, total population, and trends over
time, our analysis finds a significant increase in the number ofinternational arrivals across countries that have implementedthe Schengen agreement. This is corroborated by a recentanalysis of Chinese tourists by The Economist,2 which finds thatonce Switzerland implemented the Schengen agreement in 2008the number of Chinese visitors instantly soared.
While the socioeconomic conditions and attractions differbetween Europe and Africa, the current plans to implement acommon visa scheme in East Africa could enable a significantincrease in tourist arrivals as has been the case for theSchengen member countries.
Notes
1 This information is based on the Henley Visa Restrictions Index.
This index is a global ranking of countries according to freedom
enjoyed by their citizens. In 2010, citizens of the United Kingdom
had visa-free access to 166 countries, followed by those from
Denmark with 164 and those from Sweden with 163.
2 The Economist 2010.
Box 1: Streamlining visas: Opportunities for reducing travel impediments (cont’d.)
The Africa Competitiveness Report 2011 © 2011 World Economic Forum, the World Bank and the African Development Bank
100
2.3:
Ass
essi
ng A
fric
a’s
Trav
el &
Tou
rism
Com
petit
iven
ess
Environmental sustainability is one of the pillars of strength forsub-Saharan Africa. Namibia’s ranking in this pillar (22nd)reflects the effectiveness of the government’s efforts to ensurethat the Travel & Tourism sector is being developed in a sustain-able way. An example of these efforts is the country’s wildlifeconservancy program.
The conservancy program uses land tenure and respon -sibility for wildlife as a mechanism to promote financial andeconomic growth.1 This program has led to the sustainable useof wildlife resources, stable land tenure for rural Namibians,and improved livelihoods. It has also provided the basis forcommunities to develop tourism enterprises within conservan-cies through joint ventures with the private sector or throughcommunity-based tourism operations.
Since 1996, legislation has made it possible for indige -nous populations living on communal lands to acquire commonproperty rights to manage and use their wildlife resources. Itssuccess has led to a new policy to develop conservanciesacross the country. Its implementation incorporates shareddecision making with farmers and defines rights, roles, andresponsibilities as well as extension and capacity building forconservancies.2
Many actors have been involved in the conservancyprocesses in Namibia, including:3
• The Ministry of Environment and Tourism (MET), whichcarried out the initial participatory socioecological sur-veys in 1990–02 that identified key issues and problemsconcerning wildlife and conservation from a communityperspective. The MET, in collaboration with nongovern-mental organizations (NGOs), has been instrumental intracking the impact of the conservancy program.
• The MET’s Integrated Community-based EcosystemManagement, a World Bank–funded project to promotecommunity-based ecotourism management that accruessocioeconomic benefits including strengthening conservancies.
• The MET’s Strengthening the Protected Area Network, a project funded by the United Nations DevelopmentProgram (UNDP), supporting concessions, as well as co-funding a tourism plan in the Kunene Region.
• The MET’s Bwabwata, Mudumu and Mamili Parks Project(co-financed by the Federal Republic of Germany throughthe KfW German development bank), preparing a tourismdevelopment plan for the Kavango and Caprivi Parks.
• The World Wildlife Foundation’s Living in a FiniteEnvironment (WWF-LIFE) project, providing assistance to comprehensive community-based natural resourcemanagement programs through the technical support,training, grants, and regional coordination and informationdissemination to government agencies, NGOs, and communities.
• The Namibian Association of Community Based NaturalResource Management Support Organizations (NACSO),which is an association comprising 15 NGOs and theUniversity of Namibia. NACSO provides assistance to ruralcommunities seeking to manage and utilize their naturalresources in a sustainable manner.
• The Namibia Community Based Tourism Assistance Trust(NACOBTA), a nonprofit membership organization that sup-ports communities in their efforts to develop and operatetourism enterprises profitably and sustainably.
Since the conservancy program started in 1995, privatebenefits to communities have increased annually from less thanN$600,000 in 1998 to N$41.9 million in 2008, with the primarygrowth coming from the tourism industry. Tourism joint-ventureconservancies now represent 856 tourist beds, 789 full-timejobs, and over 250 seasonal positions. In addition, the privatesector has invested more than N$145 million (US$19 million) intourism in communal conservancies since 1998.4 The conser-vancy process has also been successful in extending the pro-tected areas to a significant 19 percent of the country’s area(over 130,000 square kilometers).
The conservancy approach applied in Namibia can bereplicated in countries that have a communal land tenure modeland policy frameworks that allow the devolution of respon -sibility for the management and use of wildlife to residents. Theapproach has demonstrated that using wildlife this way cangenerate sustained benefits for both wildlife and livelihoods,especially through tourism.
Notes
1 Spenceley 2010a.
2 Jones 2008.
3 ASLF 2010; Jones and Weaver 2009.
4 MET Republic of Namibia undated.
Box 2: Namibia’s wildlife conservancy program
The Africa Competitiveness Report 2011 © 2011 World Economic Forum, the World Bank and the African Development Bank
Table 6 demonstrates this clearly at the countrylevel. No African countries are ranked in the top 50within this pillar, and only two countries—Egypt (56th)and Mauritius (68th)—are even among the top half. Infact, only six African countries are above the 100 markin this area, and twelve countries are below India, acountry with notoriously low standards in health andhygiene. This highlights the great importance ofimproving health and hygiene standards in Africa forthe benefit of the tourism industry, and simultaneouslyimproving the living standards of the region’s citizens.
Prioritization of the T&T sectorThe extent to which the government prioritizes theT&T sector also has an important impact on T&T competitiveness. By making clear that T&T is a sector of primary concern, and by reflecting this in its budgetpriorities, a government can channel needed funds toessential development projects. It also signals its inten-tions, which can have positive spillover effects such asattracting further private investment into the sector.Prioritization of the sector can be reflected in a varietyof other ways, such as government efforts to collect and make available T&T data on a timely basis andcommissioning high-quality destination-marketing campaigns.
Table 3 shows that North African countries onaverage outperform all of the BRICs bar China in this sphere, and are very close to the Latin Americanand Caribbean and Southeast Asian averages. The sub-Saharan African countries are, on average, on a par withBrazil and Russia, although they are outperformed by all other comparators.
Yet this is an area where the regional averages masksignificant differences within Africa. As shown by Table6, eight African countries are ranked among the top 50,including countries from both North Africa and sub-Saharan Africa. Indeed, two countries are ranked amongthe top 10, with Mauritius placed 1st and Tunisia 8th.They are joined in the top 25 by Kenya (18th), Egypt(22nd), and Morocco (23rd). These are countries wherethe governments have clearly understood the impor-tance of the tourism sector for their economies, ensur-ing effective destination-marketing campaigns, andmaking certain that data collection is a priority in orderto have an ongoing profile of the sector’s activity.
It is also notable that, despite the clear potential of the T&T industry for boosting Africa’s economicdevelopment, several countries fare poorly in this area.Of the ten bottom-ranked countries in this pillar, sevenare African countries, with Burundi and Côte d’Ivoireranked the lowest two of all 139 economies. Efforts toeducate the public and governments about the benefitsof tourism would be important for increasing awarenessin these countries. Tour operators’ businesses are direct-ly affected by the nation’s prioritization, as shown inBox 3.
Air transport infrastructureQuality air transport infrastructure provides ease of accessto and from countries, as well as movement to destina-tions within countries. This pillar measures both thequantity of air transport, as measured by the availableseat kilometers, the number of departures, airport densi-ty, and the number of operating airlines, as well as thequality of the air transport infrastructure both fordomestic and international flights.
Table 4 shows that, on average, this is not an areaof strength for either North Africa or sub-SaharanAfrica. Although the North African average score of 2.9is somewhat better than that of sub-Saharan Africa (2.4),it lags behind all other country and regional compara-tors, in some cases by a significant margin. The compar-ison is all the more stark with regard to the state of airtransport infrastructure in sub-Saharan Africa.
Table 6 shows clearly that few countries in Africahave well-developed air transport infrastructures. OnlySouth Africa and Cape Verde are among the top 50ranked countries in this pillar; they are ranked 43rd and48th, respectively. They are joined in the top half of therankings by Egypt (55th), Namibia (59th), Mauritius(61st), Tunisia (65th), and Morocco (68th). These arecountries that have managed to build reasonably well-functioning and developed air transport infrastructuresby international standards. Yet the table also shows thatmost African countries place much lower in the rank-ings, with severely underdeveloped infrastructures.
Given the poor showing of most other Africancountries in this area, and given also their significantdistance from many of their key tourist markets, invest-ment in air transport represents a valuable opportunitythroughout much of Africa. Box 4 explores the impor-tance of air transport for African tourism in some detail.
Ground transport infrastructureVital for the ease of movement within the country isthe extensiveness and quality of the country’s groundtransport infrastructure. This pillar takes into accountthe quality of roads, railroads, and ports, as well as theextent to which the national transport network as awhole offers efficient, accessible transportation to keybusiness centers and tourist attractions within the country.
This is an area where African countries outperformsome of the comparators shown in Table 4. NorthAfrica’s score of 3.3 for ground transport infrastructure,while behind that of most comparators, is ahead of Brazil(2.8) and Russia (3.1) among the BRICs. Similarly, sub-Saharan Africa’s score of 3.1 is on a par with that ofRussia, and ahead of Brazil.
Yet overall these are all very low scores and clearlymuch needs to be done in most African countries toimprove the ground transport infrastructure. Table 6shows that just three African countries are in the top 50of the rankings in this pillar: Mauritius, Namibia, and
101
2.3:
Ass
essi
ng A
fric
a’s
Trav
el &
Tou
rism
Com
petit
iven
ess
The Africa Competitiveness Report 2011 © 2011 World Economic Forum, the World Bank and the African Development Bank
102
2.3:
Ass
essi
ng A
fric
a’s
Trav
el &
Tou
rism
Com
petit
iven
ess
Sub-Saharan Africa’s tourism offerings are particularly fertilefor tour operators. This is because, unlike a simple beach resortholiday that can now be booked online, most Africa leisure itin-eraries involve multiple experiences in remote locations withcomplex logistics. Consider a safari, for example. Typically thisinvolves many different components such as guides, transport,internal flights, eating arrangements, and different types ofaccommodation that are difficult to arrange independently.Booking with an operator also helps allay visitors’ safety andsecurity concerns. A well-developed and organized tour opera-tions sector can provide the critical connections to strengthen afragmented tourism product offering across countries andregions. For tour operators to be effective, both the public andprivate sectors have a role to play. The experience of sub-Saharan Africa illustrates the challenges and potential.
Tour operators can clearly see the impact that the prioriti-zation of Travel & Tourism (T&T) by governments can have intheir ground operations. For example, arranging a trip toMauritius, the top-ranked country worldwide in the pillar meas-uring the prioritization of Travel & Tourism, is straightforwardbecause the government has made substantial efforts to pro-mote the tourism sector and ease the operations related toTravel & Tourism in the country. On the other hand, for otherAfrican nations where the sector is not seen as a priority, touroperators can face significant challenges. A recent study con-ducted for the World Bank analyzed the tour operator sectorand created a profile of the sector, documenting its challenges,highlighting potential, and defining the building blocks for suc-cess.1
ProfileCurrent estimates suggest there are between 2,500 and 3,000ground operators in sub-Saharan Africa. Destinations offeringmore complex products, such as safari and adventure, have alarger number of ground operators than those with simpler touritineraries. The countries with the most tour operators areSouth Africa, Kenya, Tanzania, Ethiopia, and Madagascar.
On an annual basis, tour operators are responsible for 10to 15 percent of tourist spending in sub-Saharan Africa. This isequivalent to between US$2 billion and US$3 billion. Because oftheir tendency to visit isolated, rural locations, tour operatorscan have a significant pro-poor economic impact. For example,tour operators are estimated to provide direct employment for30,000 to 45,000 people in the region annually. Employmentincludes jobs for drivers, guides, porters, mechanics, natural-ists, reservation agents, accountants, and managers.
ChallengesThere is some consensus on the key challenges facing the touroperations sector in sub-Saharan Africa. These are cost, secu-rity, access, business environment, service standards, and mar-ket image. The limited frequency and the high cost of flightsreduce the ability of ground operators to access mid-end andlow-end travelers. Poor roads constrain the development ofnew destinations and cause considerable wear and tear tovehicles. The high cost of vehicles and vehicle parts and the
lack of maintenance skills make it expensive to operate groundtransfers. High interest rates make it hard for operators to bor-row money to grow their businesses. Continual increases inpark fees and the high cost of utilities put a strain on businessoperations. Low service quality results in poor value for moneyin many sub-Saharan African destinations. Those surveyed alsostressed the need for more reliable ground operators and amore professional approach to destination marketing.
Building blocksSuccessful destinations for tours tend to have a stable govern-ment, airports serving key markets, an attractive investment cli-mate, modern communication and transportation infrastructure,a wide range of products, and a professional tourism board. Themost successful international operators were found to haveknowledgeable, well-paid staff, good customer feedback sys-tems, strong relationships with their ground operators, and ahigh percentage of repeat clients. Successful ground operatorshad good relationships with international operators, a deepunderstanding of the market, operations in a number of coun-tries, online booking capability, accommodation or transportownership, and business approaches that value conservationand sustainability. These are many of the aspects that wemeasure in the Travel & Tourism Competitiveness Index.
Guidelines for successTour operators enable diverse tourism product offerings rangingfrom niche experiences to popular, high-volume packages. Theirefforts contribute to economic impact directly and indirectly asthey attract new clientele and also continue to develop newofferings. To improve performance and economic impact, a vari-ety of guidelines can be followed by destination governmentsand ground operators.
Guidelines for destination governments
1. Make improvements to air connections and road infra-structure. Airline cost, frequency, and routing are keyissues for every part of the sub-Saharan African tourismindustry. Good, all-weather roads are also essential foreffective ground operators. Further liberalization of inter-nal, inter-regional, and international flights will improve theaccessibility of the region for tour operations.
2. Create a supportive ground operator–enabling environ-ment. The tour operations sector can flourish only in asupportive business environment. A ground operator–enabling environment facilitates small business develop-ment through an efficient and responsive banking sector,competitive utility prices, soft loans, and duty-free pur-chases of vehicles and other equipment not availablelocally.
Box 3: Tour operators: Tourism’s great connectors
(Cont’d.)
The Africa Competitiveness Report 2011 © 2011 World Economic Forum, the World Bank and the African Development Bank
103
2.3:
Ass
essi
ng A
fric
a’s
Trav
el &
Tou
rism
Com
petit
iven
ess
3. Streamline visa applications and processing. As inter-regional travel becomes increasingly popular, streamliningvisa requirements would be a significant benefit to touroperators. Developing regional visas and making visasreadily available at border control posts, as discussed inBox 1, would facilitate further development of regionaltours.
4. Develop effective marketing campaigns. Building marketawareness is crucial for the development of destinations.Few travelers will pay hard-earned money to visit a desti-nation for which they do not have a clear image.Destinations need to develop “trophy value” througheffective national marketing campaigns, source-marketawareness building, and positive image enhancement.
5. Offer ground operator business and service training.International operators rely on ground operators for thequality of their clients’ experience. Ground operators needto be reliable, responsive, understanding of tourists’ needsand expectations, and financially solvent. Destinations canleverage public-private partnerships to offer improvedground operator–focused training, both on and off the job.
Guidelines for ground operators
1. Build strong relationships with international operators.International operators stressed the need for improvedground operator professionalism, trust, and efficiency.Ground operators need to be good communicators, collectand listen to customer and operator feedback, andpromptly respond to international operator enquiries.
2. Improve professionalism and upgrade customer-servicetraining. Service quality was frequently mentioned by touroperators in the source markets. Many sub-SaharanAfrican destinations have the attractions and facilities towarrant high prices, but lack the service quality. The resultis that guests did not get the feeling of value for money
during their vacation. Service training is urgently neededacross sub-Saharan Africa.
3. Enhance product development and innovation. Tour oper-ators noted that a number of destinations neededimproved product development and that others werebehind in product innovation. Product development andinnovation are vital to tour operator competitiveness. Atour product that is constantly being renewed andimproved will attract repeat visitors, will continue to gen-erate word-of-mouth recommendations, and will be able tocompete with new and emerging neighboring destinations.
4. Improve sustainability outcomes. Nature and culture arecore components of the sub-Saharan African tour product.Tourism in the region is also an opportunity to facilitatepro-poor development, but this does not always occurwithout facilitation. A number of destinations are alreadyfacing severe environmental and social challenges as aresult of tourism development. Careful planning and man-agement are needed to ensure sustainable outcomes forall stakeholders and to avoid destroying the valuableassets the tourists are coming to see.
As the number and types of tourism offerings around theworld multiply, travelers look for tailored products that meettheir diverse needs, from transport to lodging to attractions. Inthis dynamic and competitive business marketplace, tour opera-tors are crucial connectors linking the many components of thetourism experience. As learned from sub-Saharan African touroperations, the collaboration of public- and private-sector play-ers is integral to achieving success.
Note
1 Twinning-Ward 2010.
Box 3: Tour operators: Tourism’s great connectors (cont’’d.)
Tunisia, which are ranked 41st, 44th, and 48th, respec-tively. These are countries with notably good roads andports by international standards. Several other Africancountries have developed some aspects of their groundtransport infrastructure, with several showing relativestrengths in particular modes.
On the whole, however, it is clear that this is anarea requiring attention not only for the developmentof the T&T industry, but also for the efficient move-ment of people and goods so important to the properfunctioning of market economies.
Tourism infrastructureAlso important for T&T competitiveness is the generallevel of tourism services and the quality of hard infra-structure, as distinct from the general transport infra-structure, in each country. This includes the accommo-dation infrastructure and the presence of major carrental companies, as well as a measure of the financialinfrastructure for tourists in the country (ability to usecredit cards, the availability of automated tellermachines, etc.).
The Africa Competitiveness Report 2011 © 2011 World Economic Forum, the World Bank and the African Development Bank
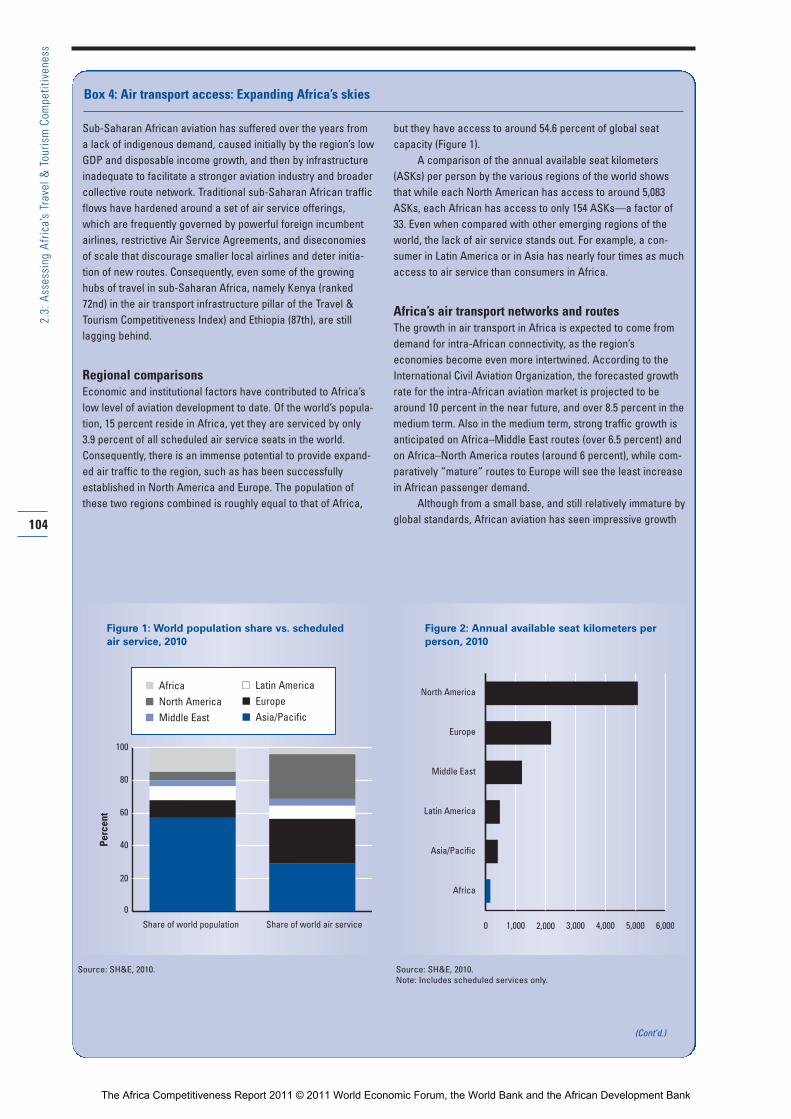
104
2.3:
Ass
essi
ng A
fric
a’s
Trav
el &
Tou
rism
Com
petit
iven
ess
Sub-Saharan African aviation has suffered over the years froma lack of indigenous demand, caused initially by the region’s lowGDP and disposable income growth, and then by infrastructureinadequate to facilitate a stronger aviation industry and broadercollective route network. Traditional sub-Saharan African trafficflows have hardened around a set of air service offerings,which are frequently governed by powerful foreign incumbentairlines, restrictive Air Service Agreements, and diseconomiesof scale that discourage smaller local airlines and deter initia-tion of new routes. Consequently, even some of the growinghubs of travel in sub-Saharan Africa, namely Kenya (ranked72nd) in the air transport infrastructure pillar of the Travel &Tourism Competitiveness Index) and Ethiopia (87th), are still lagging behind.
Regional comparisonsEconomic and institutional factors have contributed to Africa’slow level of aviation development to date. Of the world’s popula-tion, 15 percent reside in Africa, yet they are serviced by only3.9 percent of all scheduled air service seats in the world.Consequently, there is an immense potential to provide expand-ed air traffic to the region, such as has been successfullyestablished in North America and Europe. The population ofthese two regions combined is roughly equal to that of Africa,
but they have access to around 54.6 percent of global seatcapacity (Figure 1).
A comparison of the annual available seat kilometers(ASKs) per person by the various regions of the world showsthat while each North American has access to around 5,083ASKs, each African has access to only 154 ASKs—a factor of33. Even when compared with other emerging regions of theworld, the lack of air service stands out. For example, a con-sumer in Latin America or in Asia has nearly four times as muchaccess to air service than consumers in Africa.
Africa’s air transport networks and routesThe growth in air transport in Africa is expected to come fromdemand for intra-African connectivity, as the region’seconomies become even more intertwined. According to theInternational Civil Aviation Organization, the forecasted growthrate for the intra-African aviation market is projected to bearound 10 percent in the near future, and over 8.5 percent in themedium term. Also in the medium term, strong traffic growth isanticipated on Africa–Middle East routes (over 6.5 percent) andon Africa–North America routes (around 6 percent), while com-paratively “mature” routes to Europe will see the least increasein African passenger demand.
Although from a small base, and still relatively immature byglobal standards, African aviation has seen impressive growth
Box 4: Air transport access: Expanding Africa’s skies
0
20
40
60
80
100
Share of world population Share of world air service
Figure 1: World population share vs. scheduledair service, 2010
Source: SH&E, 2010.
0 1,000 2,000 3,000 4,000 5,000 6,000
North America
Europe
Middle East
Latin America
Asia/Pacific
Africa
Figure 2: Annual available seat kilometers perperson, 2010
Source: SH&E, 2010.Note: Includes scheduled services only.
(Cont’d.)
n African North American Middle East
n Latin American Europen Asia/Pacific
Perc
ent
The Africa Competitiveness Report 2011 © 2011 World Economic Forum, the World Bank and the African Development Bank
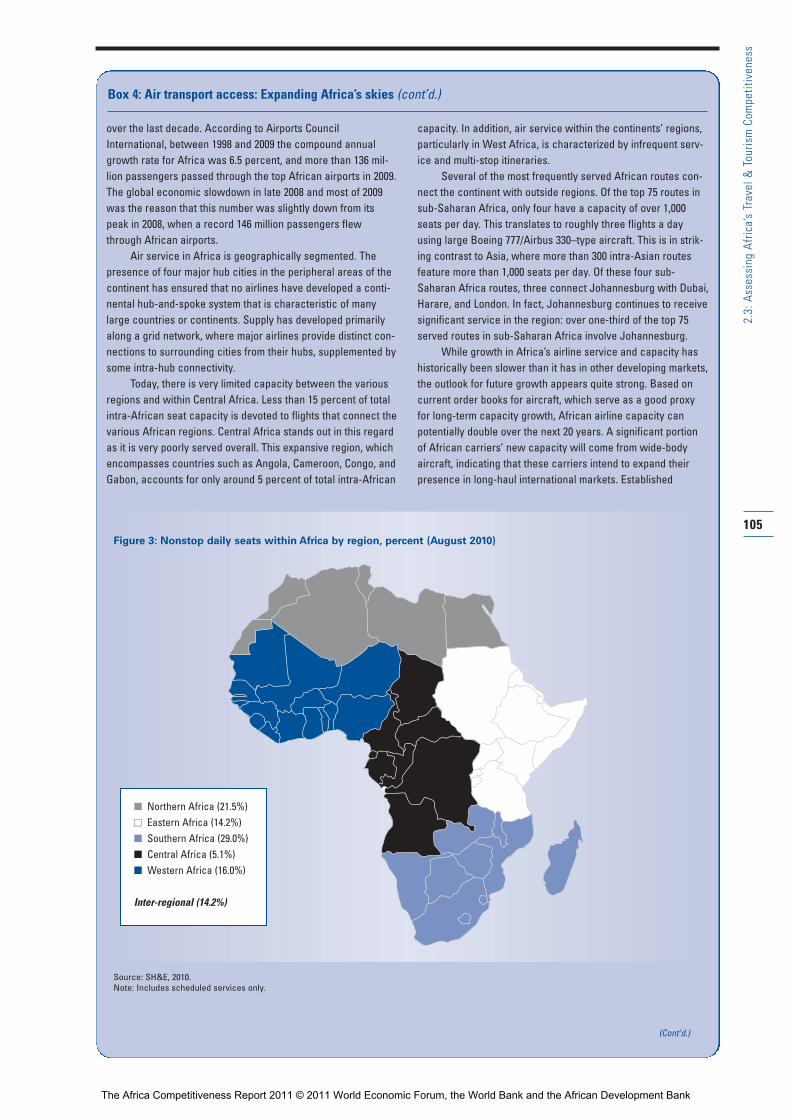
105
2.3:
Ass
essi
ng A
fric
a’s
Trav
el &
Tou
rism
Com
petit
iven
ess
over the last decade. According to Airports CouncilInternational, between 1998 and 2009 the compound annualgrowth rate for Africa was 6.5 percent, and more than 136 mil-lion passengers passed through the top African airports in 2009.The global economic slowdown in late 2008 and most of 2009was the reason that this number was slightly down from itspeak in 2008, when a record 146 million passengers flewthrough African airports.
Air service in Africa is geographically segmented. Thepresence of four major hub cities in the peripheral areas of thecontinent has ensured that no airlines have developed a conti-nental hub-and-spoke system that is characteristic of manylarge countries or continents. Supply has developed primarilyalong a grid network, where major airlines provide distinct con-nections to surrounding cities from their hubs, supplemented bysome intra-hub connectivity.
Today, there is very limited capacity between the variousregions and within Central Africa. Less than 15 percent of totalintra-African seat capacity is devoted to flights that connect thevarious African regions. Central Africa stands out in this regardas it is very poorly served overall. This expansive region, whichencompasses countries such as Angola, Cameroon, Congo, andGabon, accounts for only around 5 percent of total intra-African
capacity. In addition, air service within the continents’ regions,particularly in West Africa, is characterized by infrequent serv-ice and multi-stop itineraries.
Several of the most frequently served African routes con-nect the continent with outside regions. Of the top 75 routes insub-Saharan Africa, only four have a capacity of over 1,000seats per day. This translates to roughly three flights a dayusing large Boeing 777/Airbus 330–type aircraft. This is in strik-ing contrast to Asia, where more than 300 intra-Asian routesfeature more than 1,000 seats per day. Of these four sub-Saharan Africa routes, three connect Johannesburg with Dubai,Harare, and London. In fact, Johannesburg continues to receivesignificant service in the region: over one-third of the top 75served routes in sub-Saharan Africa involve Johannesburg.
While growth in Africa’s airline service and capacity hashistorically been slower than it has in other developing markets,the outlook for future growth appears quite strong. Based oncurrent order books for aircraft, which serve as a good proxyfor long-term capacity growth, African airline capacity canpotentially double over the next 20 years. A significant portionof African carriers’ new capacity will come from wide-body aircraft, indicating that these carriers intend to expand theirpresence in long-haul international markets. Established
Box 4: Air transport access: Expanding Africa’s skies (cont’d.)
Figure 3: Nonstop daily seats within Africa by region, percent (August 2010)
Source: SH&E, 2010.Note: Includes scheduled services only.
(Cont’d.)
n Northern Africa (21.5%)n Eastern Africa (14.2%)n Southern Africa (29.0%)n Central Africa (5.1%)n Western Africa (16.0%)
Inter-regional (14.2%)
The Africa Competitiveness Report 2011 © 2011 World Economic Forum, the World Bank and the African Development Bank
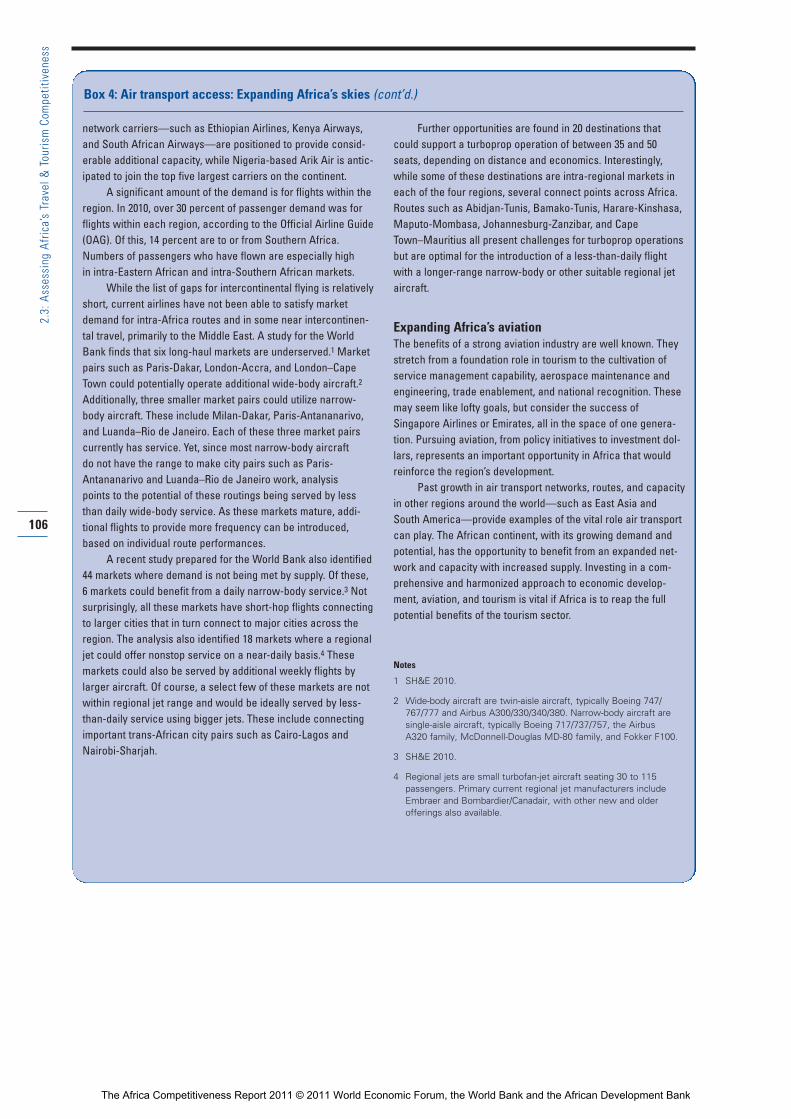
106
2.3:
Ass
essi
ng A
fric
a’s
Trav
el &
Tou
rism
Com
petit
iven
ess
network carriers—such as Ethiopian Airlines, Kenya Airways,and South African Airways—are positioned to provide consid-erable additional capacity, while Nigeria-based Arik Air is antic-ipated to join the top five largest carriers on the continent.
A significant amount of the demand is for flights within theregion. In 2010, over 30 percent of passenger demand was forflights within each region, according to the Official Airline Guide(OAG). Of this, 14 percent are to or from Southern Africa.Numbers of passengers who have flown are especially high in intra-Eastern African and intra-Southern African markets.
While the list of gaps for intercontinental flying is relativelyshort, current airlines have not been able to satisfy marketdemand for intra-Africa routes and in some near intercontinen-tal travel, primarily to the Middle East. A study for the WorldBank finds that six long-haul markets are underserved.1 Marketpairs such as Paris-Dakar, London-Accra, and London–CapeTown could potentially operate additional wide-body aircraft.2
Additionally, three smaller market pairs could utilize narrow-body aircraft. These include Milan-Dakar, Paris-Antananarivo,and Luanda–Rio de Janeiro. Each of these three market pairscurrently has service. Yet, since most narrow-body aircraft do not have the range to make city pairs such as Paris-Antananarivo and Luanda–Rio de Janeiro work, analysis points to the potential of these routings being served by lessthan daily wide-body service. As these markets mature, addi-tional flights to provide more frequency can be introduced,based on individual route performances.
A recent study prepared for the World Bank also identified44 markets where demand is not being met by supply. Of these,6 markets could benefit from a daily narrow-body service.3 Notsurprisingly, all these markets have short-hop flights connectingto larger cities that in turn connect to major cities across theregion. The analysis also identified 18 markets where a regionaljet could offer nonstop service on a near-daily basis.4 Thesemarkets could also be served by additional weekly flights bylarger aircraft. Of course, a select few of these markets are notwithin regional jet range and would be ideally served by less-than-daily service using bigger jets. These include connectingimportant trans-African city pairs such as Cairo-Lagos andNairobi-Sharjah.
Further opportunities are found in 20 destinations thatcould support a turboprop operation of between 35 and 50seats, depending on distance and economics. Interestingly,while some of these destinations are intra-regional markets ineach of the four regions, several connect points across Africa.Routes such as Abidjan-Tunis, Bamako-Tunis, Harare-Kinshasa,Maputo-Mombasa, Johannesburg-Zanzibar, and CapeTown–Mauritius all present challenges for turboprop operationsbut are optimal for the introduction of a less-than-daily flightwith a longer-range narrow-body or other suitable regional jetaircraft.
Expanding Africa’s aviationThe benefits of a strong aviation industry are well known. Theystretch from a foundation role in tourism to the cultivation ofservice management capability, aerospace maintenance andengineering, trade enablement, and national recognition. Thesemay seem like lofty goals, but consider the success ofSingapore Airlines or Emirates, all in the space of one genera-tion. Pursuing aviation, from policy initiatives to investment dol-lars, represents an important opportunity in Africa that wouldreinforce the region’s development.
Past growth in air transport networks, routes, and capacityin other regions around the world—such as East Asia andSouth America—provide examples of the vital role air transportcan play. The African continent, with its growing demand andpotential, has the opportunity to benefit from an expanded net-work and capacity with increased supply. Investing in a com-prehensive and harmonized approach to economic develop-ment, aviation, and tourism is vital if Africa is to reap the fullpotential benefits of the tourism sector.
Notes
1 SH&E 2010.
2 Wide-body aircraft are twin-aisle aircraft, typically Boeing 747/
767/777 and Airbus A300/330/340/380. Narrow-body aircraft are
single-aisle aircraft, typically Boeing 717/737/757, the Airbus
A320 family, McDonnell-Douglas MD-80 family, and Fokker F100.
3 SH&E 2010.
4 Regional jets are small turbofan-jet aircraft seating 30 to 115
passengers. Primary current regional jet manufacturers include
Embraer and Bombardier/Canadair, with other new and older
offerings also available.
Box 4: Air transport access: Expanding Africa’s skies (cont’d.)
The Africa Competitiveness Report 2011 © 2011 World Economic Forum, the World Bank and the African Development Bank
Table 4 shows that, on average, African countrieshave so far developed less tourism services infrastructurethan other key emerging tourism markets. NorthAfrica’s infrastructure, with a score of 3.0, is less devel-oped than that of all comparators shown in the tableexcept for China (2.6), India (2.9), and Southeast Asia(2.8). Sub-Saharan Africa’s low score of 2.3 lags behindthat of all comparators.
Indeed, as shown by Table 6, only Mauritius placesamong the top 50 economies in this pillar at 47th place,with many hotel rooms and well-developed rental carfacilities in particular. Only four other countries are inthe top half of the rankings, namely Tunisia (51st),South Africa (57th), Cape Verde (63rd), and Namibia(67th), with moderately developed tourism infrastruc-tures.
The table shows that a striking 25 out of the 35African countries covered by the TTCI are below the100 mark in this pillar. This provides a sense of theinvestments that will be required to bring the tourisminfrastructure in the region up to international standards.It can also be seen as a clear opportunity for those look-ing to develop the T&T sector in the region.
ICT infrastructureGiven the increasing importance of the online envi -ronment for the modern T&T industry—for planningitineraries and purchasing travel and accommodationsfor consumers and suppliers—the quality of the infor-mation and communication technologies (ICT) infra-structure in each economy is also critical. To capture this concept, this pillar measures ICT penetration rates(Internet, telephone lines, and broadband), which provide a sense of the society’s online activity. It alsoincludes a specific measure of the extent to which the Internet is used by businesses in carrying out transactions in the economy, to get a sense of the extent to which these tools are in fact being used for business (including T&T) transactions, and in day-to-day operations.
This is an area where African countries—despitemuch progress in recent years, notably in the uptake ofmobile technologies—still trail the rest of the world bya large margin. As shown by Table 5, both NorthAfrica and sub-Saharan Africa receive scores that areamong the lowest out of all pillars, at 2.7 and 2.0,respectively. Indeed, sub-Saharan Africa is outperformedby all comparators, and North Africa outperforms onlyIndia, which, given its large size and stage of develop-ment, faces significant challenges in increasing ICT pen-etration.
Table 6 shows that this is an area where not oneAfrican country places among the top 50. The highest-ranked country is Mauritius at 66th, the only country in the top half of the rankings, and it is 10 places aheadof the next-highest-ranked Tunisia at 76th. Only fourother African countries are ranked higher than 100,
namely Morocco (79th), Cape Verde (90th), Egypt(93rd), and South Africa (95th), and eight of the bottomten ranked countries are from Africa.
Given ICT’s importance for significant productivityenhancements for the T&T industry, as well as acrossthe entire economy, increasing penetration rates andusage across the continent should be a priority goingforward. The successful introduction of ICT innova-tions, such as M-Pesa in Kenya, suggests a responsiveenvironment for ICT enhancements.
Price competitiveness in the T&T industryPrice competitiveness is an additional important elementin assessing T&T competitiveness, with lower costsincreasing the attractiveness of some countries for manytravelers. To measure countries’ price competitiveness,this pillar takes into account factors such as the extentto which goods and services in the country are more orless expensive than elsewhere (purchasing power parity);airfare ticket taxes and airport charges (which can makeflight tickets much more expensive); fuel price levelscompared with those of other countries; and taxation inthe country (which can be passed on to travelers) aswell as the relative cost of hotel accommodations.
Table 4 shows that, as one might expect, Africancountries on average are better assessed in this categorythan in many others. Indeed, North Africa with itsaverage score of 5.1 is on a par or better assessed thanall comparators except for Southeast Asia, which doesslightly better with an average score of 5.2. Sub-SaharanAfrica’s score is lower than that of North Africa at 4.5,but is ahead of Brazil and on a par with Russia.
Table 6 shows how several African countries arehighly price competitive. Indeed, 14 of them are amongthe top 50 in this area, with Gambia, Egypt, Botswana,and Tunisia among the top 10 at 2nd, 5th, 8th, and 9thranks, respectively. These are countries that providegood value for money.
Also notable is the divide between the countrieswith strong price competitiveness and those that are infact among the most price uncompetitive in the world.Indeed, at the unfavorable end of the spectrum arecountries such as Mali, Côte d’Ivoire, and Chad, whichare among the most expensive for travelers despite hav-ing comparatively low or moderate overall price levels.These countries have notably excessive ticket taxes andairport charges, raising the overall cost of travel.
Human resourcesQuality human resources in the economy ensure thatthe industry has access to the collaborators it needs todevelop and grow. This pillar takes into account thehealth and education and training levels in each econo-my, and is made up of two specific subpillars. The education and training subpillar measures educationalattainment rates (primary and secondary), as well as the overall quality of the educational system in each
107
2.3:
Ass
essi
ng A
fric
a’s
Trav
el &
Tou
rism
Com
petit
iven
ess
The Africa Competitiveness Report 2011 © 2011 World Economic Forum, the World Bank and the African Development Bank
country, as assessed by the business community. Besidesthe formal educational system, the pillar also takes intoaccount private-sector involvement in upgrading humanresources, including the availability of specialized train-ing services and the extent of staff training by companiesin the country. The subpillar measuring the availability ofqualified labor further takes into account the extent towhich hiring and firing is impeded by regulations, andwhether labor regulations make it easy or difficult tohire foreign labor. The health of the workforce is alsoincluded here, as measured by the overall life expectan-cy of the country as well as the specific costliness ofHIV/AIDS to businesses.
Table 5 shows that North Africa, with a score of4.7, outperforms sub-Saharan Africa (with a score of3.9) by a significant margin. Yet both subregions areassessed less well than almost all comparators, the onlyexception being North Africa’s slightly better score than that of India (at 4.6).
Turning to Table 6 we see that only one country,Tunisia, is among the top 50 (ranked 27th), well aheadof the next-best-ranked Mauritius (53rd). The quality ofthese countries’ educational systems is better than thoseof most African countries, and companies offer compar-atively more on-the-job training. In addition, they boasthealthier workforces than in the rest of Africa, particu-larly than most of sub-Saharan Africa. Indeed, it is notablethat the third-best-ranked country is Morocco at a verylow 90th place, and the great majority of African coun-tries populate the bottom of the rankings. Indeed, all ofthe bottom 10 ranked countries in this pillar are fromAfrica.
The importance of addressing health and educationissues in Africa is not new. Yet these numbers remainstriking in their message. It is clear that improving thehuman resources available to work in the T&T sector(and indeed in all sectors) in Africa must be a prioritygoing forward.
Affinity for Travel & TourismThe TTCI also takes into account each country’s affini-ty for Travel & Tourism, which measures the extent towhich the country and society demonstrate their open-ness to tourism and foreign visitors. The general open-ness of the population to travel and to foreign visitorshas an important impact on T&T competitiveness. Inparticular, this pillar provides a measure of the nationalpopulation’s attitude toward foreign travelers; a measureof the extent to which business leaders are willing torecommend leisure travel in their countries to impor-tant business contacts; and a measure of tourism open-ness (tourism expenditures and receipts as a percentageof GDP), which provides a sense of the importance oftourism in the economy.
Table 5 shows that this is an area of strength forAfrican countries, with the North African average of 4.8 ahead of all comparators except for Southeast Asia.
Sub-Saharan Africa’s score of 4.6 is also ahead of mostcomparators and on a par with the Latin American andCaribbean average, although it too is behind theSoutheast Asian average.
Table 6 shows the extent to which this is a com-parative strength for several African countries. Ten ofthem are among the top 50 in this pillar, and two ofthem—Mauritius (4th) and Cape Verde (5th)—areamong the top 10. It is thus clear that an understandingof the importance of tourism and the openness to for-eign travelers is prevalent in much of Africa.
Indeed, only one African country is among thebottom 10 countries in this pillar, although it must benoted that this country, Angola, does hold the last spotof all countries (139th). However, the general picture is that Africans are for the most part quite open totourism, which bodes well for developing the othercritical areas going forward.
Natural resourcesIt is also clear that natural resources are an importantfactor underlying national T&T competitiveness.Countries that are able to offer travelers access to natural assets clearly have a competitive advantage. Thispillar includes a number of environmental attractivenessmeasures, including the number of UNESCO naturalWorld Heritage sites, a measure of the quality of thenatural environment, the richness of the fauna in thecountry as measured by the total known species of ani-mals, and the percentage of nationally protected areas.
This is an area where, as shown by Table 5, sub-Saharan Africa, with its score of 3.5, outperforms North Africa (2.4). And while it is true that both sub-Saharan Africa and North Africa are, on average, rankedlower in this area than the comparators in the table, it is important to note that these are somewhat rigorousbenchmarks, as the comparator countries and regionshave rich natural resources. Further, the overall averages,as we have seen in the discussion several times above,often mask significant differences among individualAfrican countries.
Table 6 shows that a remarkable 13 African coun-tries are among the top 50 in this pillar, with Tanzaniaranked a very high 2nd, behind only Brazil out of all139 economies assessed. Although some African coun-tries do not benefit from this natural richness, it is clearthat for many of them this constitutes a critical sellingpoint in attracting tourists and developing their tourismindustries. Many successful efforts already exist in foster-ing natural attributes; Box 5 considers one of Africa’smost well-known World Heritage natural sites, MountKilimanjaro.
Cultural resourcesFinally, cultural resources are also an important driver ofT&T competitiveness. This pillar takes into account thenumber of UNESCO cultural World Heritage sites,
108
2.3:
Ass
essi
ng A
fric
a’s
Trav
el &
Tou
rism
Com
petit
iven
ess
The Africa Competitiveness Report 2011 © 2011 World Economic Forum, the World Bank and the African Development Bank
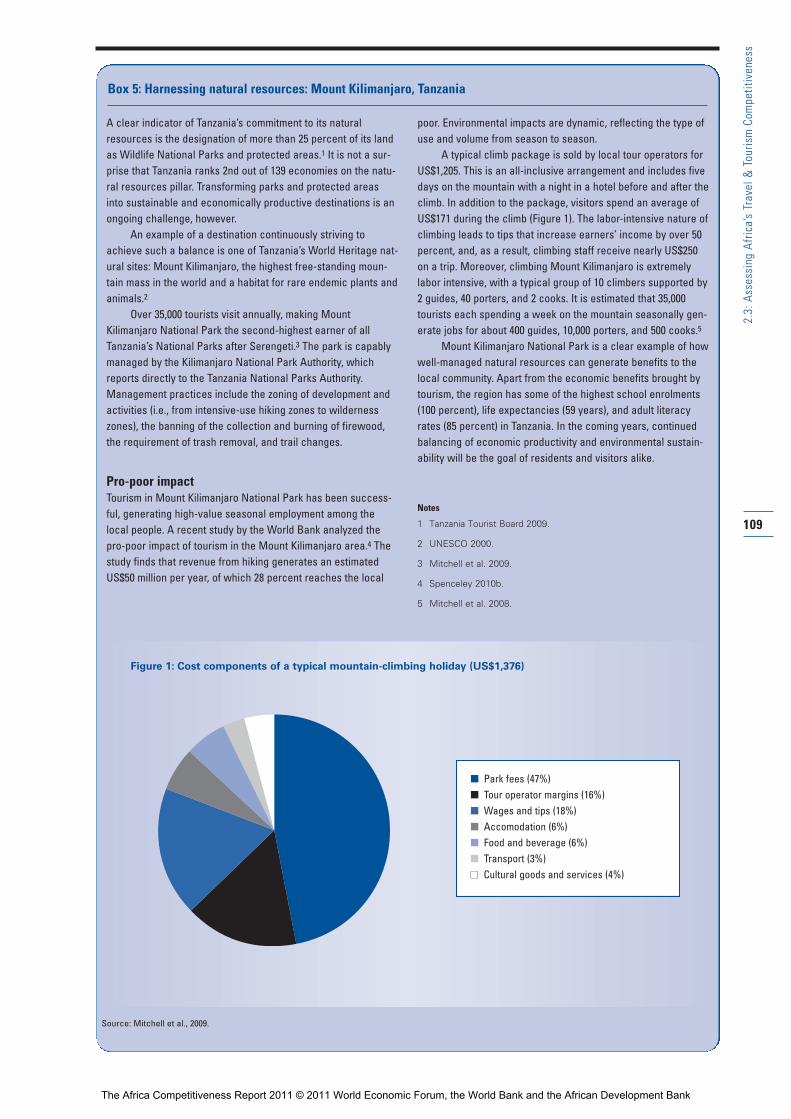
109
2.3:
Ass
essi
ng A
fric
a’s
Trav
el &
Tou
rism
Com
petit
iven
ess
A clear indicator of Tanzania’s commitment to its naturalresources is the designation of more than 25 percent of its landas Wildlife National Parks and protected areas.1 It is not a sur-prise that Tanzania ranks 2nd out of 139 economies on the natu-ral resources pillar. Transforming parks and protected areasinto sustainable and economically productive destinations is anongoing challenge, however.
An example of a destination continuously striving toachieve such a balance is one of Tanzania’s World Heritage nat-ural sites: Mount Kilimanjaro, the highest free-standing moun-tain mass in the world and a habitat for rare endemic plants andanimals.2
Over 35,000 tourists visit annually, making MountKilimanjaro National Park the second-highest earner of allTanzania’s National Parks after Serengeti.3 The park is capablymanaged by the Kilimanjaro National Park Authority, whichreports directly to the Tanzania National Parks Authority.Management practices include the zoning of development andactivities (i.e., from intensive-use hiking zones to wildernesszones), the banning of the collection and burning of firewood,the requirement of trash removal, and trail changes.
Pro-poor impactTourism in Mount Kilimanjaro National Park has been success-ful, generating high-value seasonal employment among thelocal people. A recent study by the World Bank analyzed thepro-poor impact of tourism in the Mount Kilimanjaro area.4 Thestudy finds that revenue from hiking generates an estimatedUS$50 million per year, of which 28 percent reaches the local
poor. Environmental impacts are dynamic, reflecting the type ofuse and volume from season to season.
A typical climb package is sold by local tour operators forUS$1,205. This is an all-inclusive arrangement and includes fivedays on the mountain with a night in a hotel before and after theclimb. In addition to the package, visitors spend an average ofUS$171 during the climb (Figure 1). The labor-intensive nature ofclimbing leads to tips that increase earners’ income by over 50percent, and, as a result, climbing staff receive nearly US$250on a trip. Moreover, climbing Mount Kilimanjaro is extremelylabor intensive, with a typical group of 10 climbers supported by2 guides, 40 porters, and 2 cooks. It is estimated that 35,000tourists each spending a week on the mountain seasonally gen-erate jobs for about 400 guides, 10,000 porters, and 500 cooks.5
Mount Kilimanjaro National Park is a clear example of howwell-managed natural resources can generate benefits to thelocal community. Apart from the economic benefits brought bytourism, the region has some of the highest school enrolments(100 percent), life expectancies (59 years), and adult literacyrates (85 percent) in Tanzania. In the coming years, continuedbalancing of economic productivity and environmental sustain-ability will be the goal of residents and visitors alike.
Notes
1 Tanzania Tourist Board 2009.
2 UNESCO 2000.
3 Mitchell et al. 2009.
4 Spenceley 2010b.
5 Mitchell et al. 2008.
Box 5: Harnessing natural resources: Mount Kilimanjaro, Tanzania
Figure 1: Cost components of a typical mountain-climbing holiday (US$1,376)
Source: Mitchell et al., 2009.
n Park fees (47%)n Tour operator margins (16%)n Wages and tips (18%)n Accomodation (6%)n Food and beverage (6%)n Transport (3%)n Cultural goods and services (4%)
The Africa Competitiveness Report 2011 © 2011 World Economic Forum, the World Bank and the African Development Bank
sports stadium seat capacity, and the number of interna-tional fairs and exhibitions in the country, as well as ameasure of creative industries exports, which providesan additional indication of cultural richness.
Unlike natural resources discussed above, based onthe measures used in the TTCI this is not presently anarea of comparative strength for African countries, par-ticularly those of sub-Saharan Africa. Table 5 showsthat, with an average score of 2.5, North Africa is out-performed by all comparators from outside of Africa,with the exception of the slightly lower score of LatinAmerica and the Caribbean (2.4). This is all the morestriking for sub-Saharan Africa, with its very low aver-age score of 1.5, well below all of the comparatorsshown in the table. Africa’s rich mix of cultures andcenturies of history are an undeniable resource forexpanded tourism. Yet this indicator points to Africancountries’ limited success to date in leveraging theseresources. The pillar focuses on developed culturalassets—rather than gauging raw cultural resources. It iswith this distinction in mind that the relatively lowrankings of African countries compared with the rank-ings of other countries can also be viewed as a com-pelling reminder of the potential for further developingAfrica’s cultural heritage resources into economicallyproductive tourism assets.
Table 6 shows that no African countries are in thetop 50 in this pillar, although five are in the top half ofthe rankings, namely Morocco (54th), South Africa(55th), Egypt (65th), Libya (66th), and Tunisia (69th). Itis notable that all but one of these countries is fromNorth Africa. Overall, it is clear that cultural resources,as broadly defined through this pillar, are not a strengthfor African countries, especially those of sub-SaharanAfrica. Efforts in this area could boost the region’s T&Tcompetitiveness. Box 6 highlights how Africa couldmake better use of its cultural assets, learning fromZanzibar.
ConclusionsThe development of the T&T sector offers significantopportunities for Africa to move up the value chain, fostering growth and development in the region. Thischapter has explored the many strengths Africa has tobuild upon, including price competitiveness, a strongaffinity for tourism, and rich natural resources supportedby environmental sustainability efforts. However, theanalysis also shows that a number of obstacles remain to improving the region’s competitiveness, which canbe tackled notably by improving safety and security,upgrading health and hygiene levels, developing variousforms of infrastructure, and fostering the region’s humancapital. To fully tap this potential, Africa can expand bygrowing its offerings in combination with capturing ahigher percentage of global market share. Given Africa’smany strengths, improvements in these areas will greatly
110
2.3:
Ass
essi
ng A
fric
a’s
Trav
el &
Tou
rism
Com
petit
iven
ess
Box 6: Cultural tourism in Zanzibar
In the midst of a region of poor performers in the culturalresources pillar, Zanzibar stands out with Stone Town, aWorld Heritage site; the Zanzibar International Film Festival;and the Sauti za Busara Music Festival. In Zanzibar, a rangeof stakeholders work together to promote tourism while pre-serving heritage.1 Stakeholders and their exemplary projectsinclude the following:
• The Revolutionary Government of Zanzibar is develop-ing policies to provide an enabling environment fortourism investment, including Zanzibar’s Strategy forGrowth and Poverty Reduction (MKUZA).
• The United Nations Educational, Scientific and CulturalOrganization is working alongside partners such as theAga Khan Trust for Culture and the RevolutionaryGovernment of Zanzibar on the rehabilitation of StoneTown and Forodhani Park.
• The Aga Khan Development Network is sponsoring anumber of initiatives, such as enabling young peopleto find employment in the tourism industry.
• A Tourism Cluster Competitiveness Program is financedby the World Bank and the British Department forInternational Development to create sustainable condi-tions for enterprise creation and growth.
• The Zanzibar Association of Tourism Investors is pro-moting responsible and sustainable tourism develop-ment in Zanzibar through their operations and advocacyactivities.
• The Zanzibar Enterprise and Sustainable Tourism initia-tive organized by Voluntary Services Overseas (VSO) isworking on a market-based approach to livelihooddevelopment as a means of poverty alleviation.
• The Netherlands Development Organization (SNV) isfacilitating inputs to the MKUZA update for the tourismand related sectors. Since 2010, the SNV has conveneda group called Development Partners in Tourism tocoordinate interventions in the sector.
• The United States Agency for InternationalDevelopment (USAID)’s Tanzania AgricultureProductivity Program links small-scale farmers to markets (hotels) and processing companies.
Note
1 Spenceley 2010c.
The Africa Competitiveness Report 2011 © 2011 World Economic Forum, the World Bank and the African Development Bank
enhance its ability to reap the enormous potential benefits of tourism.
Notes1 UNWTO 2010.
2 Each of the pillars is, in turn, made up of a number of individual
variables. The dataset includes both Survey data from the World
Economic Forum’s annual Executive Opinion Survey, and quantita-
tive data from publicly available sources, international organiza-
tions, and T&T institutions and experts—for example, International
Air Transport Association (IATA), the International Union for
Conservation of Nature (IUCN), the UNWTO, the World Travel and
Tourism Council (WTTC), the United Nations Conference on Trade
and Development (UNCTAD), and the United Nations Educational,
Scientific and Cultural Organization (UNESCO). The Survey is car-
ried out among chief executive officers (CEOs) and top business
leaders in all economies covered by our research; these are the
people making the investment decisions in their respective
economies. The Survey provides unique data on many qualitative
institutional and business environment issues as well as on spe-
cific issues related to the T&T industry and the quality of the natu-
ral environment.
3 The Southeast Asian average includes Brunei Darussalam,
Cambodia, Indonesia, Malaysia, the Philippines, Singapore,
Thailand, Timor-Leste, and Vietnam.
ReferencesASLF (African Safari Lodges Foundation). 2010. “NEWS FLASH:
Tourism Concessions Awarded to Communities.” March 15.
Available at http://www.asl-foundation.org/news.php?id=253.
Blanke, J. and T. Chiesa. 2011. “The Travel & Tourism Competitiveness
Index 2011: Assessing Industry Drivers in the Wake of the
Crisis.” The Travel & Tourism Competitiveness Report 2011.
Geneva: World Economic Forum. 3–33.
The Economist. 2010. “Chinese Tourists: A New Grand Tour.” The
Economist, December 16. Available at
http://www.economist.com/node/17722582.
Jones, B. 2008. “Co-Management and Concessions in Namibia:
Mechanisms for Promoting Community Involvement in Tourism.”
Presentation to the African Safari Lodges Program, Rosebank,
South Africa, May 19–21. Available at www.asl-
foundation.org/news.php?id=241&catid=.
Jones, B. and C. Weaver. 2009. “CBNRM in Namibia: Growth, Trends,
Lessons and Constraints.” Evolution and Innovation in Wildlife
Conservation, ed. H. Suich, B. Child, and A. Spenceley. London:
Earthscan.
MET (Ministry of Environment and Tourism), Republic of Namibia.
Undated. “Protected Areas.” Available at http://www.met.gov.na/
Pages/Protectedareas.aspx (accessed September 29, 2010).
Mitchell, J., J. Keane, and J. Laidlaw. 2008. “Tracing the Tourism Dollar
in Tanzania.” Overseas Development Institute (ODI) project funded
by the Netherlands Development Organisation (SNV). Available at
http://www.odi.org.uk/work/projects/details.asp?id=901&title=
tracing-tourism-dollar-northern-tanzania.
———. 2009. Making Success Work for the Poor: Package Tourism in
Northern Tanzania. Final Report, January 16. Arusha and London:
Netherlands Development Organisation (SNV) and Overseas
Development Institute (ODI). Available at
http://www.odi.org.uk/resources/download/3221.pdf.
OAG (Official Airline Guide). 2010. OAG Flight Guide. Available at
http://www.oagtravel.com/Products-Services/Print/OAG-Flight-
Guide.
SH&E. 2010. Competitive Africa: Tourism Industry Research Phase II:
Air Transport Sector Study. Unpublished report commissioned for
the World Bank by SH&E, an ICF International Company.
November. Washington DC: World Bank.
Spenceley, A. 2010a. “Wildlife Conservation in Namibia.” Review of
Tourism Best Practices in Sub-Saharan Africa. Unpublished report
commissioned by the World Bank. Washington DC: World Bank.
———. 2010b. “Kilimanjaro Case Study.” Review of Tourism Best
Practices in Sub-Saharan Africa. Unpublished report commis-
sioned by the World Bank. Washington DC: World Bank.
———. 2010c. “Cultural Tourism in Zanzibar.” Review of Tourism Best
Practices in Sub-Saharan Africa. Unpublished report commis-
sioned by the World Bank. Washington DC: World Bank
Tanzania Tourist Board. 2009. “The 2009 Tourism Statistical Bulletin.”
Dar es Salaam, Tanzania: Ministry of Natural Resources
and Tourism, Tourism Division. Available at
http://www.tanzaniatouristboard.com/news/Documents/
tour_stats09.pdf.
Twinning-Ward, L. 2010. Tour Operations Sector Review. Unpublished
report commissioned by the World Bank. Washington DC: World
Bank.
UNESCO (United Nations Educational, Scientific and Cultural
Organization). 2000. World Heritage Convention: Kilimanjaro
National Park. Periodic reporting. Available at http://whc.unesco.org/
en/list/403/documents/ (accessed October 19, 2010).
UNWTO (United Nations World Tourism Organization). 2010. UNWTO
Tourism Highlights, 2010 Edition. Available at http://www.unwto.org/
facts/eng/highlights.htm.
World Economic Forum. 2009. The Travel & Tourism Competitiveness
Report 2009. Geneva: World Economic Forum.
———. 2011. The Travel & Tourism Competitiveness Report 2011.
Geneva: World Economic Forum.
111
2.3:
Ass
essi
ng A
fric
a’s
Trav
el &
Tou
rism
Com
petit
iven
ess
The Africa Competitiveness Report 2011 © 2011 World Economic Forum, the World Bank and the African Development Bank

The Africa Competitiveness Report 2011 © 2011 World Economic Forum, the World Bank and the African Development Bank
Part 3 Competitiveness Profiles
The Africa Competitiveness Report 2011 © 2011 World Economic Forum, the World Bank and the African Development Bank

The Africa Competitiveness Report 2011 © 2011 World Economic Forum, the World Bank and the African Development Bank
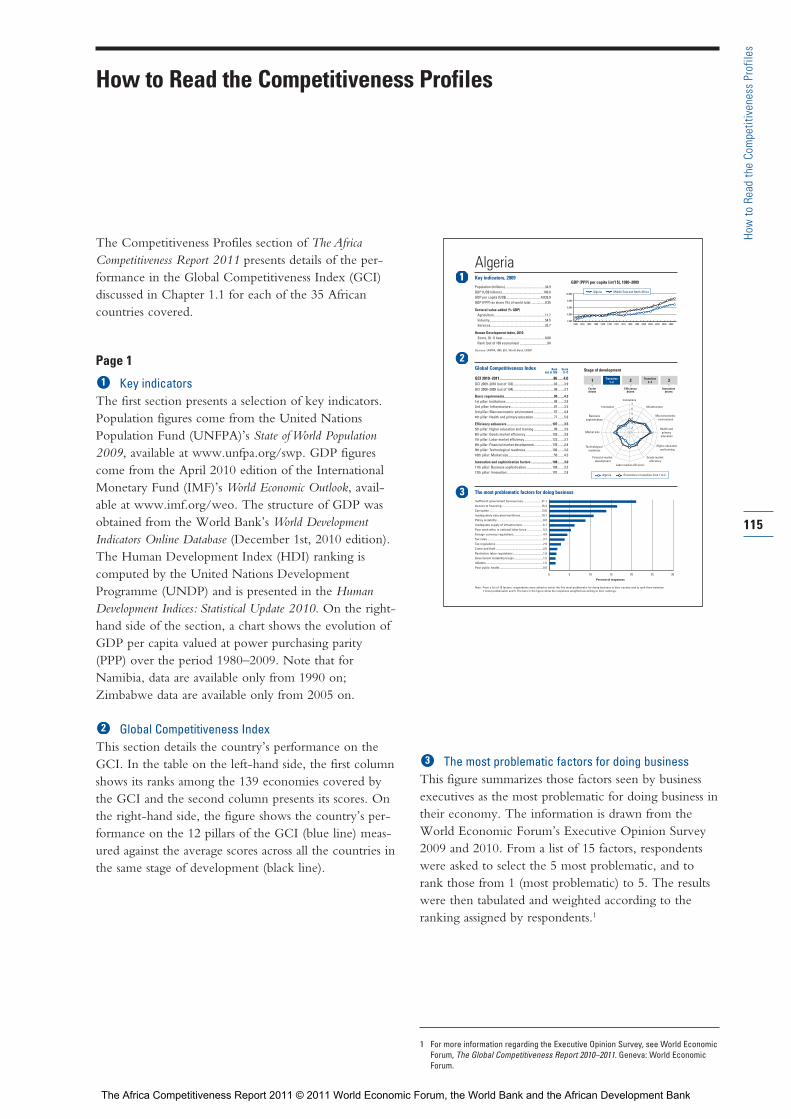
The Competitiveness Profiles section of The AfricaCompetitiveness Report 2011 presents details of the per-formance in the Global Competitiveness Index (GCI)discussed in Chapter 1.1 for each of the 35 Africancountries covered.
Page 1
Key indicatorsThe first section presents a selection of key indicators.Population figures come from the United NationsPopulation Fund (UNFPA)’s State of World Population2009, available at www.unfpa.org/swp. GDP figurescome from the April 2010 edition of the InternationalMonetary Fund (IMF)’s World Economic Outlook, avail-able at www.imf.org/weo. The structure of GDP wasobtained from the World Bank’s World DevelopmentIndicators Online Database (December 1st, 2010 edition).The Human Development Index (HDI) ranking iscomputed by the United Nations DevelopmentProgramme (UNDP) and is presented in the HumanDevelopment Indices: Statistical Update 2010. On the right-hand side of the section, a chart shows the evolution ofGDP per capita valued at power purchasing parity(PPP) over the period 1980–2009. Note that forNamibia, data are available only from 1990 on;Zimbabwe data are available only from 2005 on.
Global Competitiveness IndexThis section details the country’s performance on theGCI. In the table on the left-hand side, the first columnshows its ranks among the 139 economies covered bythe GCI and the second column presents its scores. Onthe right-hand side, the figure shows the country’s per-formance on the 12 pillars of the GCI (blue line) meas-ured against the average scores across all the countries inthe same stage of development (black line).
The most problematic factors for doing businessThis figure summarizes those factors seen by businessexecutives as the most problematic for doing business intheir economy. The information is drawn from theWorld Economic Forum’s Executive Opinion Survey2009 and 2010. From a list of 15 factors, respondentswere asked to select the 5 most problematic, and torank those from 1 (most problematic) to 5. The resultswere then tabulated and weighted according to theranking assigned by respondents.1
AlgeriaKey indicators, 2009
Population (millions).................................................34.9GDP (US$ billions)...................................................140.8GDP per capita (US$) ..........................................4,026.9GDP (PPP) as share (%) of world total .................0.35
Sectoral value-added (% GDP)Agriculture ..............................................................11.7Industry....................................................................54.5Services...................................................................33.7
Human Development Index, 2010Score, (0–1) best....................................................0.68Rank (out of 169 economies) ..................................84
Sources: UNFPA, IMF, EIU, World Bank, UNDP.
Global Competitiveness Index
GCI 2010–2011.........................................................86 ......4.0GCI 2009–2010 (out of 133)..................................................83 ........3.9GCI 2008–2009 (out of 134)..................................................99 ........3.7
Basic requirements.............................................................80 ........4.31st pillar: Institutions ...........................................................98 ........3.52nd pillar: Infrastructure.....................................................87 ........3.53rd pillar: Macroeconomic environment .........................57 ........4.84th pillar: Health and primary education .........................77 ........5.6
Efficiency enhancers........................................................107 ........3.55th pillar: Higher education and training .........................98 ........3.66th pillar: Goods market efficiency.................................126 ........3.67th pillar: Labor market efficiency ..................................123 ........3.78th pillar: Financial market development.......................135 ........2.89th pillar: Technological readiness.................................106 ........3.010th pillar: Market size........................................................50 ........4.3
Innovation and sophistication factors ..........................108 ........3.011th pillar: Business sophistication................................108 ........3.312th pillar: Innovation........................................................107 ........2.8
The most problematic factors for doing business
Inefficient government bureaucracy.........................21.1
Access to financing......................................................16.4
Corruption.......................................................................13.8
Inadequately educated workforce.............................10.7
Policy instability...............................................................8.8
Inadequate supply of infrastructure ............................6.1
Poor work ethic in national labor force ......................5.3
Foreign currency regulations........................................4.4
Tax rates ...........................................................................3.7
Tax regulations ................................................................2.9
Crime and theft ................................................................2.0
Restrictive labor regulations.........................................1.8
Government instability/coups .......................................1.5
Inflation .............................................................................1.5
Poor public health ...........................................................0.0
Rank Score(out of 139) (1–7)
GDP (PPP) per capita (int'l $), 1980–2009
0 5 10 15 20 25 30
Percent of responses
Note: From a list of 15 factors, respondents were asked to select the five most problematic for doing business in their country and to rank them between 1 (most problematic) and 5. The bars in the figure show the responses weighted according to their rankings.
1 Transition1–2 2 Transition
2 –3
Factordriven
Efficiencydriven
Innovationdriven
3
Stage of development
Algeria Economies in transition from 1 to 2
Institutions
Infrastructure
Macroeconomic environment
Health and primary
education
Higher education and training
Goods market efficiency
Labor market efficiency
Financial market development
Technological readiness
Market size
Business sophistication
Innovation
1
2
3
4
5
6
7
2,000
4,000
6,000
8,000
10,000
1980 1982 1984 1986 1988 1990 1992 1994 1996 1998 2000 2002 2004 2006 2008
Algeria Middle East and North Africa
Rank Score(out of 139) (1–7)
115
How to
Rea
d the Co
mpe
titiven
ess Profile
s
How to Read the Competitiveness Profiles
1 For more information regarding the Executive Opinion Survey, see World EconomicForum, The Global Competitiveness Report 2010–2011. Geneva: World EconomicForum.
The Africa Competitiveness Report 2011 © 2011 World Economic Forum, the World Bank and the African Development Bank
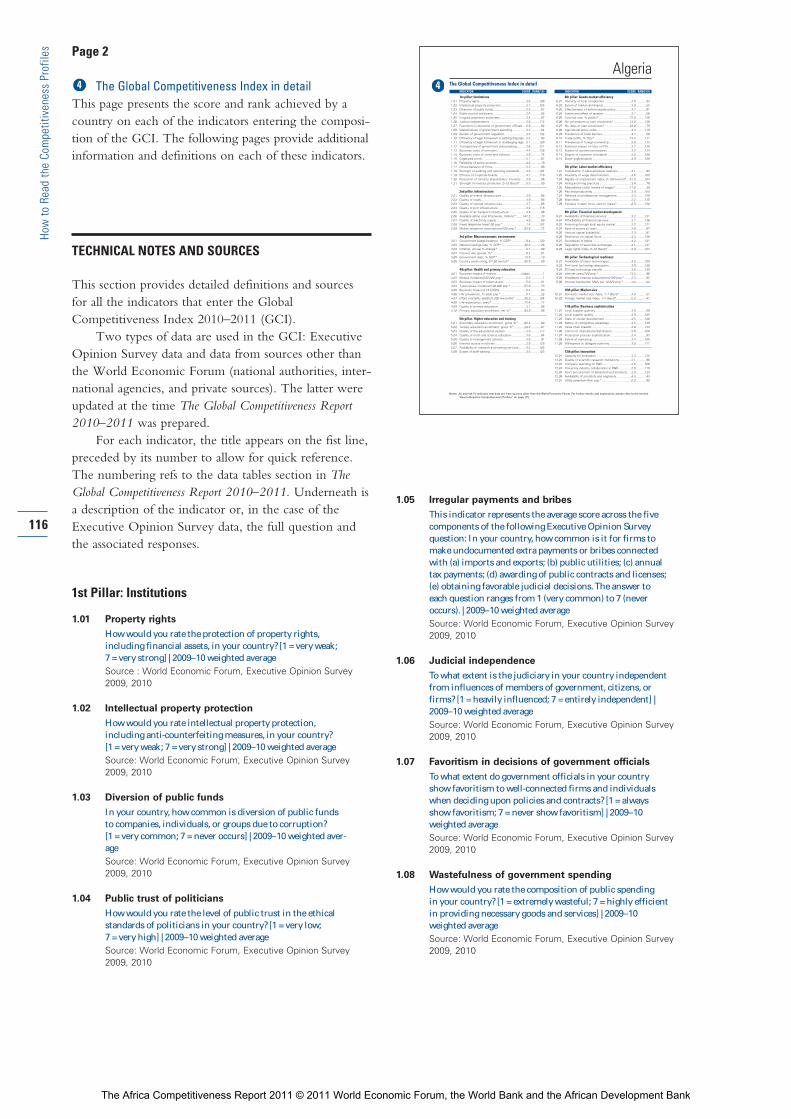
116
How to
Rea
d the Co
mpe
titiven
ess Profile
s Page 2
The Global Competitiveness Index in detailThis page presents the score and rank achieved by acountry on each of the indicators entering the composi-tion of the GCI. The following pages provide additionalinformation and definitions on each of these indicators.
TECHNICAL NOTES AND SOURCES
This section provides detailed definitions and sourcesfor all the indicators that enter the GlobalCompetitiveness Index 2010–2011 (GCI).
Two types of data are used in the GCI: ExecutiveOpinion Survey data and data from sources other thanthe World Economic Forum (national authorities, inter-national agencies, and private sources). The latter wereupdated at the time The Global Competitiveness Report2010–2011 was prepared.
For each indicator, the title appears on the fist line,preceded by its number to allow for quick reference.The numbering refs to the data tables section in TheGlobal Competitiveness Report 2010–2011. Underneath isa description of the indicator or, in the case of theExecutive Opinion Survey data, the full question andthe associated responses.
1st Pillar: Institutions
1.01 Property rightsHow would you rate the protection of property rights, including financial assets, in your country? [1 = very weak; 7 = very strong] | 2009–10 weighted averageSource : World Economic Forum, Executive Opinion Survey
2009, 2010
1.02 Intellectual property protectionHow would you rate intellectual property protection, including anti-counterfeiting measures, in your country? [1 = very weak; 7 = very strong] | 2009–10 weighted averageSource: World Economic Forum, Executive Opinion Survey
2009, 2010
1.03 Diversion of public fundsIn your country, how common is diversion of public funds to companies, individuals, or groups due to corruption? [1 = very common; 7 = never occurs] | 2009–10 weighted aver-ageSource: World Economic Forum, Executive Opinion Survey
2009, 2010
1.04 Public trust of politiciansHow would you rate the level of public trust in the ethical standards of politicians in your country? [1 = very low; 7 = very high] | 2009–10 weighted averageSource: World Economic Forum, Executive Opinion Survey
2009, 2010
1.05 Irregular payments and bribesThis indicator represents the average score across the five components of the following Executive Opinion Survey question: In your country, how common is it for firms to make undocumented extra payments or bribes connected with (a) imports and exports; (b) public utilities; (c) annual tax payments; (d) awarding of public contracts and licenses; (e) obtaining favorable judicial decisions. The answer to each question ranges from 1 (very common) to 7 (never occurs). | 2009–10 weighted averageSource: World Economic Forum, Executive Opinion Survey
2009, 2010
1.06 Judicial independenceTo what extent is the judiciary in your country independent from influences of members of government, citizens, or firms? [1 = heavily influenced; 7 = entirely independent] | 2009–10 weighted averageSource: World Economic Forum, Executive Opinion Survey
2009, 2010
1.07 Favoritism in decisions of government officialsTo what extent do government officials in your country show favoritism to well-connected firms and individuals when deciding upon policies and contracts? [1 = always show favoritism; 7 = never show favoritism] | 2009–10 weighted averageSource: World Economic Forum, Executive Opinion Survey
2009, 2010
1.08 Wastefulness of government spendingHow would you rate the composition of public spending in your country? [1 = extremely wasteful; 7 = highly efficient in providing necessary goods and services] | 2009–10 weighted averageSource: World Economic Forum, Executive Opinion Survey
2009, 2010
The Global Competitiveness Index in detailINDICATOR SCORE RANK/139
1st pillar: Institutions1.01 Property rights .......................................................3.6 ..........1061.02 Intellectual property protection..............................2.7 ..........1051.03 Diversion of public funds.......................................3.3 ............671.04 Public trust of politicians........................................2.4 ............851.05 Irregular payments and bribes...............................3.4 ............971.06 Judicial independence ...........................................2.8 ..........1121.07 Favoritism in decisions of government officials ....2.8 ............821.08 Wastefulness of government spending ................3.3 ............641.09 Burden of government regulation..........................2.3 ..........1321.10 Efficiency of legal framework in settling disputes...3.3 ............931.11 Efficiency of legal framework in challenging regs...3.1 ..........1001.12 Transparency of government policymaking...........3.6 ..........1211.13 Business costs of terrorism...................................4.4 ..........1281.14 Business costs of crime and violence...................4.8 ............741.15 Organized crime.....................................................5.1 ............871.16 Reliability of police services...................................4.0 ............791.17 Ethical behavior of firms........................................3.5 ............981.18 Strength of auditing and reporting standards........4.0 ..........1041.19 Efficacy of corporate boards..................................4.1 ..........1101.20 Protection of minority shareholders’ interests ......3.9 ............951.21 Strength of investor protection, 0–10 (best)*........5.3 ............59
2nd pillar: Infrastructure2.01 Quality of overall infrastructure .............................3.8 ............862.02 Quality of roads .....................................................3.9 ............662.03 Quality of railroad infrastructure ............................2.7 ............652.04 Quality of port infrastructure .................................3.2 ..........1152.05 Quality of air transport infrastructure ....................3.9 ............982.06 Available airline seat Kms/week, millions*........147.2 ............702.07 Quality of electricity supply ...................................4.8 ............692.08 Fixed telephone lines/100 pop.* ...........................7.4 ..........1022.09 Mobile telephone subscriptions/100 pop.* .........93.8 ............72
3rd pillar: Macroeconomic environment3.01 Government budget balance, % GDP* ................-8.4 ..........1203.02 National savings rate, % GDP* ...........................30.0 ............263.03 Inflation, annual % change* ..................................5.7 ............993.04 Interest rate spread, %*........................................6.2 ............813.05 Government debt, % GDP* ................................13.5 ............103.06 Country credit rating, 0–100 (worst)*..................55.9 ............59
4th pillar: Health and primary education4.01 Business impact of malaria ..............................n/appl. ..............14.02 Malaria incidence/100,000 pop.*...........................0.0 ..............14.03 Business impact of tuberculosis............................5.0 ............914.04 Tuberculosis incidence/100,000 pop.* ................57.9 ............734.05 Business impact of HIV/AIDS................................5.4 ............634.06 HIV prevalence, % adult pop.*..............................0.1 ............224.07 Infant mortality, deaths/1,000 live births* ...........36.0 ..........1044.08 Life expectancy, years*.......................................72.4 ............774.09 Quality of primary education..................................3.1 ............964.10 Primary education enrollment, net %*................94.9 ............58
5th pillar: Higher education and training5.01 Secondary education enrollment, gross %* .......83.2 ............805.02 Tertiary education enrollment, gross %* ............24.0 ............875.03 Quality of the educational system.........................2.9 ..........1175.04 Quality of math and science education .................3.6 ............845.05 Quality of management schools............................3.8 ............915.06 Internet access in schools .....................................2.5 ..........1255.07 Availability of research and training services.........3.4 ..........1055.08 Extent of staff training...........................................3.5 ..........103
INDICATOR SCORE RANK/139
6th pillar: Goods market efficiency6.01 Intensity of local competition ................................4.5 ............936.02 Extent of market dominance .................................3.9 ............556.03 Effectiveness of anti-monopoly policy...................3.7 ............916.04 Extent and effect of taxation .................................3.7 ............566.05 Total tax rate, % profits*.....................................72.0 ..........1286.06 No. procedures to start a business* ...................14.0 ..........1266.07 No. days to start a business*..............................24.0 ............796.08 Agricultural policy costs.........................................3.4 ..........1196.09 Prevalence of trade barriers...................................4.7 ............566.10 Trade tariffs, % duty*..........................................13.3 ..........1216.11 Prevalence of foreign ownership...........................3.8 ..........1236.12 Business impact of rules on FDI ...........................3.7 ..........1256.13 Burden of customs procedures.............................3.2 ..........1246.14 Degree of customer orientation ............................4.0 ..........1086.15 Buyer sophistication ..............................................2.9 ..........108
7th pillar: Labor market efficiency7.01 Cooperation in labor-employer relations................4.1 ............937.02 Flexibility of wage determination...........................4.5 ..........1057.03 Rigidity of employment index, 0–100 (worst)*....41.0 ..........1047.04 Hiring and firing practices......................................3.8 ............787.05 Redundancy costs, weeks of wages*.................17.0 ............297.06 Pay and productivity ..............................................3.4 ..........1057.07 Reliance on professional management .................3.3 ..........1297.08 Brain drain..............................................................2.2 ..........1257.09 Females in labor force, ratio to males* .................0.5 ..........120
8th pillar: Financial market development8.01 Availability of financial services .............................3.2 ..........1318.02 Affordability of financial services ...........................2.7 ..........1368.03 Financing through local equity market...................2.2 ..........1278.04 Ease of access to loans.........................................2.8 ............678.05 Venture capital availability......................................2.4 ............818.06 Restriction on capital flows ...................................2.3 ..........1368.07 Soundness of banks ..............................................4.2 ..........1218.08 Regulation of securities exchanges.......................2.1 ..........1378.09 Legal rights index, 0–10 (best)* ............................3.0 ..........103
9th pillar: Technological readiness9.01 Availability of latest technologies ..........................4.2 ..........1099.02 Firm-level technology absorption...........................3.9 ..........1289.03 FDI and technology transfer ..................................3.6 ..........1299.04 Internet users/100 pop.* .....................................13.5 ............969.05 Broadband Internet subscriptions/100 pop.*.........2.3 ............829.06 Internet bandwidth, Mb/s per 10,000 pop.*..........n/a ...........n/a
10th pillar: Market size10.01 Domestic market size index, 1–7 (best)* ..............4.0 ............5110.02 Foreign market size index, 1–7 (best)*..................5.0 ............41
11th pillar: Business sophistication 11.01 Local supplier quantity...........................................4.9 ............5911.02 Local supplier quality .............................................3.9 ..........10511.03 State of cluster development ................................2.5 ..........12611.04 Nature of competitive advantage ..........................2.5 ..........12911.05 Value chain breadth ...............................................2.8 ..........12311.06 Control of international distribution .......................3.6 ..........10911.07 Production process sophistication.........................3.4 ............8311.08 Extent of marketing ...............................................3.4 ..........10511.09 Willingness to delegate authority ..........................3.0 ..........111
12th pillar: Innovation12.01 Capacity for innovation ..........................................2.3 ..........12512.02 Quality of scientific research institutions ..............3.1 ............9612.03 Company spending on R&D ..................................2.6 ..........10612.04 University-industry collaboration in R&D ...............2.9 ..........11912.05 Gov’t procurement of advanced tech products.....2.9 ..........12312.06 Availability of scientists and engineers..................4.5 ............4312.07 Utility patents/million pop.* ...................................0.0 ............90
Algeria
Notes: An asterisk (*) indicates that data are from sources other than the World Economic Forum. For further details and explanation, please refer to the section“How to Read the Competitiveness Profiles” on page 115.
The Africa Competitiveness Report 2011 © 2011 World Economic Forum, the World Bank and the African Development Bank
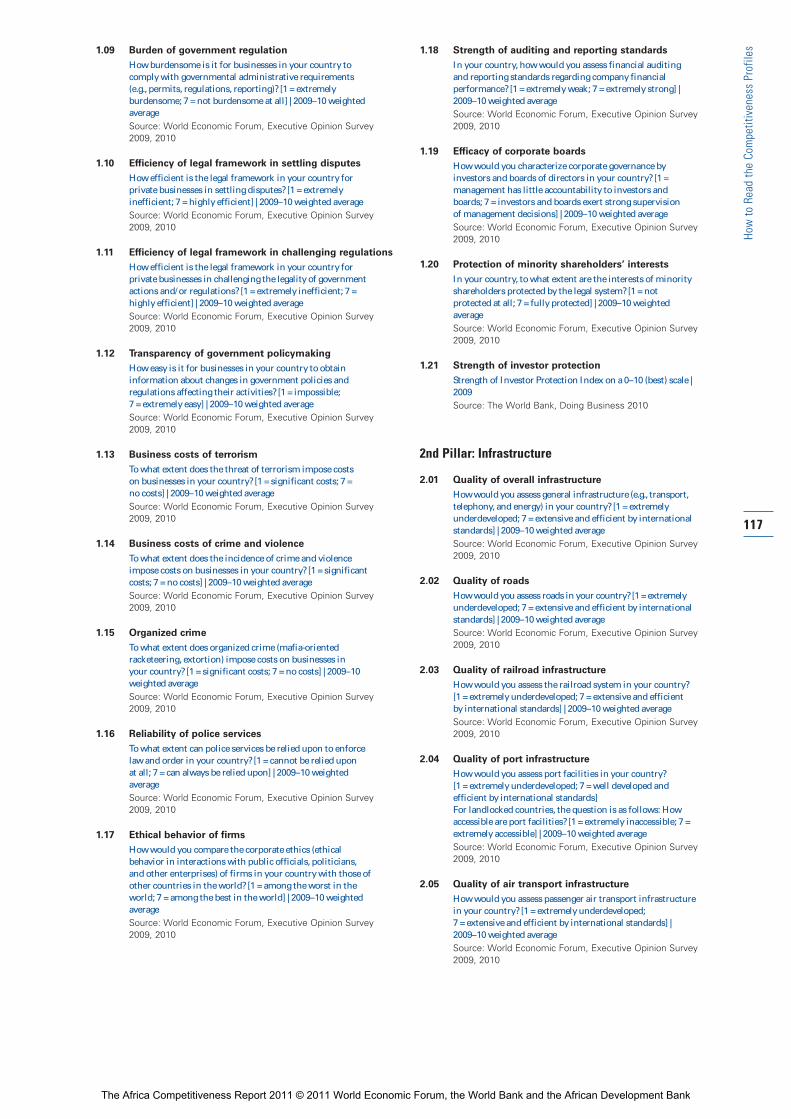
117
How to
Rea
d the Co
mpe
titiven
ess Profile
s1.09 Burden of government regulationHow burdensome is it for businesses in your country to comply with governmental administrative requirements (e.g., permits, regulations, reporting)? [1 = extremely burdensome; 7 = not burdensome at all] | 2009–10 weighted averageSource: World Economic Forum, Executive Opinion Survey
2009, 2010
1.10 Efficiency of legal framework in settling disputesHow efficient is the legal framework in your country for private businesses in settling disputes? [1 = extremely inefficient; 7 = highly efficient] | 2009–10 weighted averageSource: World Economic Forum, Executive Opinion Survey
2009, 2010
1.11 Efficiency of legal framework in challenging regulationsHow efficient is the legal framework in your country for private businesses in challenging the legality of governmentactions and/or regulations? [1 = extremely inefficient; 7 =highly efficient] | 2009–10 weighted averageSource: World Economic Forum, Executive Opinion Survey
2009, 2010
1.12 Transparency of government policymakingHow easy is it for businesses in your country to obtain information about changes in government policies and regulations affecting their activities? [1 = impossible; 7 = extremely easy] | 2009–10 weighted averageSource: World Economic Forum, Executive Opinion Survey
2009, 2010
1.13 Business costs of terrorismTo what extent does the threat of terrorism impose costs on businesses in your country? [1 = significant costs; 7 = no costs] | 2009–10 weighted averageSource: World Economic Forum, Executive Opinion Survey
2009, 2010
1.14 Business costs of crime and violenceTo what extent does the incidence of crime and violenceimpose costs on businesses in your country? [1 = significantcosts; 7 = no costs] | 2009–10 weighted averageSource: World Economic Forum, Executive Opinion Survey
2009, 2010
1.15 Organized crimeTo what extent does organized crime (mafia-oriented racketeering, extortion) impose costs on businesses in your country? [1 = significant costs; 7 = no costs] | 2009–10weighted averageSource: World Economic Forum, Executive Opinion Survey
2009, 2010
1.16 Reliability of police servicesTo what extent can police services be relied upon to enforcelaw and order in your country? [1 = cannot be relied upon at all; 7 = can always be relied upon] | 2009–10 weighted averageSource: World Economic Forum, Executive Opinion Survey
2009, 2010
1.17 Ethical behavior of firmsHow would you compare the corporate ethics (ethical behavior in interactions with public officials, politicians,and other enterprises) of firms in your country with those ofother countries in the world? [1 = among the worst in theworld; 7 = among the best in the world] | 2009–10 weightedaverageSource: World Economic Forum, Executive Opinion Survey
2009, 2010
1.18 Strength of auditing and reporting standardsIn your country, how would you assess financial auditingand reporting standards regarding company financial performance? [1 = extremely weak; 7 = extremely strong] |2009–10 weighted averageSource: World Economic Forum, Executive Opinion Survey
2009, 2010
1.19 Efficacy of corporate boardsHow would you characterize corporate governance byinvestors and boards of directors in your country? [1 = management has little accountability to investors andboards; 7 = investors and boards exert strong supervision of management decisions] | 2009–10 weighted averageSource: World Economic Forum, Executive Opinion Survey
2009, 2010
1.20 Protection of minority shareholders’ interestsIn your country, to what extent are the interests of minorityshareholders protected by the legal system? [1 = not protected at all; 7 = fully protected] | 2009–10 weighted averageSource: World Economic Forum, Executive Opinion Survey
2009, 2010
1.21 Strength of investor protectionStrength of Investor Protection Index on a 0–10 (best) scale |2009Source: The World Bank, Doing Business 2010
2nd Pillar: Infrastructure
2.01 Quality of overall infrastructureHow would you assess general infrastructure (e.g., transport,telephony, and energy) in your country? [1 = extremelyunderdeveloped; 7 = extensive and efficient by internationalstandards] | 2009–10 weighted averageSource: World Economic Forum, Executive Opinion Survey
2009, 2010
2.02 Quality of roadsHow would you assess roads in your country? [1 = extremelyunderdeveloped; 7 = extensive and efficient by internationalstandards] | 2009–10 weighted averageSource: World Economic Forum, Executive Opinion Survey
2009, 2010
2.03 Quality of railroad infrastructureHow would you assess the railroad system in your country?[1 = extremely underdeveloped; 7 = extensive and efficient by international standards] | 2009–10 weighted averageSource: World Economic Forum, Executive Opinion Survey
2009, 2010
2.04 Quality of port infrastructureHow would you assess port facilities in your country? [1 = extremely underdeveloped; 7 = well developed and efficient by international standards]For landlocked countries, the question is as follows: Howaccessible are port facilities? [1 = extremely inaccessible; 7 =extremely accessible] | 2009–10 weighted averageSource: World Economic Forum, Executive Opinion Survey
2009, 2010
2.05 Quality of air transport infrastructureHow would you assess passenger air transport infrastructurein your country? [1 = extremely underdeveloped; 7 = extensive and efficient by international standards] |2009–10 weighted averageSource: World Economic Forum, Executive Opinion Survey
2009, 2010
The Africa Competitiveness Report 2011 © 2011 World Economic Forum, the World Bank and the African Development Bank
118118
How to
Rea
d the Co
mpe
titiven
ess Profile
s 2.06 Available airline seat kilometersScheduled available airline seat kilometers per week originating in country (in millions) | January 2010 and July2010 averageSources: International Air Transport Association, SRS Analyser;
national sources
2.07 Quality of electricity supplyHow would you assess the quality of the electricity supply in your country (lack of interruptions and lack ofvoltage fluctuations)? [1 = insufficient and suffers frequentinterruptions; 7 = sufficient and reliable] | 2009–10 weightedaverageSource: World Economic Forum, Executive Opinion Survey
2009, 2010
2.08 Fixed telephone linesNumber of active fixed telephone lines per 100 population |2009Sources: International Telecommunication Union, World
Telecommunication/ICT Indicators 2010 (June 2010 edition);
national sources
2.09 Mobile telephone subscriptionsNumber of mobile cellular telephone subscriptions per 100 population | 2009Sources: International Telecommunication Union, World
Telecommunication/ICT Indicators 2010 (June 2010 edition);
national sources
3rd Pillar: Macroeconomic environment
3.01 Government budget balanceGovernment budget balance as a percentage of GDP | 2009Sources: African Development Bank; European Bank for
Reconstruction and Development; Inter-American Development
Bank; International Monetary Fund; Organisation for Economic
Co-operation and Development; Economist Intelligence Unit,
CountryData Database (July 2010); national sources
3.02 National savings rateNational savings rate as a percentage of GDP | 2009Sources: Economist Intelligence Unit, CountryData Database
(June/July 2010); International Monetary Fund; The World Bank
Group, World dataBank (July 2010); national sources
3.03 InflationAnnual percent change in consumer price index (year average) | 2009Sources: International Monetary Fund, World Economic Outlook
Database (April 2010); national sources
Notes: Economies are ranked in ascending order for
presentation purposes only. See Appendix of Chapter 1 for
details about the treatment of deflationary countries in the
Global Competitiveness Index.
3.04 Interest rate spreadAverage interest rate spread between typical lending anddeposit rates | 2009Sources: Economist Intelligence Unit, CountryData Database
(July 2010); International Monetary Fund, International Financial
Statistics (July 2010); national sources
3.05 Government debtGeneral government gross debt as a percentage of GDP | 2009Sources: African Development Bank; African Development
Bank and OECD Development Centre, Africa Economic Outlook
(retrieved July 6, 2010); European Bank for Reconstruction and
Development; International Monetary Fund; Economist
Intelligence Unit, CountryData Database (July 2010); national
sources
3.06 Country credit ratingExpert assessment of the probability of sovereign debtdefault on a 0–100 (lowest probability) scale | September2009Source: © Institutional Investor, 2010. No further
copying or transmission of this material is allowed without
the express permission of Institutional Investor
4th Pillar: Health and primary education
4.01 Business impact of malariaHow serious an impact do you consider malaria will have onyour company in the next five years (e.g., death, disability,medical and funeral expenses, productivity and absenteeism,recruitment and training expenses, revenues)? [1 = a seriousimpact; 7 = no impact at all] | 2009–10 weighted averageSource: World Economic Forum, Executive Opinion Survey
2009, 2010
4.02 Malaria incidenceNumber of malaria cases per 100,000 population | 2006Sources: World Health Organization, World Malaria Report
2008; national sources
Note: (NE) indicates that malaria is not endemic.
4.03 Business impact of tuberculosisHow serious an impact do you consider tuberculosis willhave on your company in the next five years (e.g., death, disability, medical and funeral expenses, productivity andabsenteeism, recruitment and training expenses, revenues)?[1 = a serious impact; 7 = no impact at all] | 2009–10 weightedaverageSource: World Economic Forum, Executive Opinion Survey
2009, 2010
4.04 Tuberculosis incidenceNumber of tuberculosis cases per 100,000 population | 2008Source: The World Bank, Data Catalog (retrieved July 27, 2010)
4.05 Business impact of HIV/AIDSHow serious an impact do you consider HIV/AIDS will have on your company in the next five years (e.g., death, dis-ability, medical and funeral expenses, productivity andabsenteeism, recruitment and training expenses, revenues)?[1 = a serious impact; 7 = no impact at all] | 2009–10 weighted averageSource: World Economic Forum, Executive Opinion Survey
2009, 2010
4.06 HIV prevalenceHIV prevalence as a percentage of adults aged 15–49 years |2007Sources: UNAIDS/World Health Organization, 2008 Report on
the Global AIDS Epidemic; United Nations Development
Programme, Human Development Report 2007/2008; national
sources
4.07 Infant mortalityInfant (children aged 0–12 months) mortality per 1,000 livebirths | 2008Sources: The World Bank, Data Catalog (retrieved June 23,
2010); national sources
4.08 Life expectancyLife expectancy at birth (years) | 2008Source: The World Bank, Data Catalog (retrieved July 27, 2010);
national source
The Africa Competitiveness Report 2011 © 2011 World Economic Forum, the World Bank and the African Development Bank
How to
Rea
d the Co
mpe
titiven
ess Profile
s4.09 Quality of primary educationHow would you assess the quality of primary schools in yourcountry? [1 = poor; 7 = excellent—among the best in theworld] | 2009–10 weighted averageSource: World Economic Forum, Executive Opinion Survey
2009, 2010
4.10 Primary education enrollment rateNet primary education enrollment rate | 2008Sources: UNESCO Institute for Statistics (retrieved July 16, 2010);
The World Bank, EdStats query (retrieved July 16, 2010);
national sources
5th Pillar: Higher education and training
5.01 Secondary education enrollment rateGross secondary education enrollment rate | 2008Sources: UNESCO Institute for Statistics (retrieved July 16, 2010);
national sources
5.02 Tertiary education enrollment rateGross tertiary education enrollment rate | 2008Sources: UNESCO Institute for Statistics (retrieved July 16, 2010);
national sources
5.03 Quality of the educational systemHow well does the educational system in your country meet the needs of a competitive economy? [1 = not well at all;7 = very well] | 2009–10 weighted averageSource: World Economic Forum, Executive Opinion Survey
2009, 2010
5.04 Quality of math and science educationHow would you assess the quality of math and science education in your country’s schools? [1 = poor; 7 = excellent— among the best in the world] | 2009–10 weighted averageSource: World Economic Forum, Executive Opinion Survey
2009, 2010
5.05 Quality of management schoolsHow would you assess the quality of management or business schools in your country? [1 = poor; 7 = excellent —among the best in the world] | 2009–10 weighted averageSource: World Economic Forum, Executive Opinion Survey
2009, 2010
5.06 Internet access in schoolsHow would you rate the level of access to the Internet inschools in your country? [1 = very limited; 7 = extensive] |2009–10 weighted averageSource: World Economic Forum, Executive Opinion Survey
2009, 2010
5.07 Local availability of specialized research and trainingservicesIn your country, to what extent are high-quality, specializedtraining services available? [1 = not available; 7 = widelyavailable] | 2009–10 weighted averageSource: World Economic Forum, Executive Opinion Survey
2009, 2010
5.08 Extent of staff trainingTo what extent do companies in your country invest in training and employee development? [1 = hardly at all; 7 = to a great extent] | 2009–10 weighted averageSource: World Economic Forum, Executive Opinion Survey
2009, 2010
6th Pillar: Goods market efficiency
6.01 Intensity of local competitionHow would you assess the intensity of competition in the local markets in your country? [1 = limited in mostindustries; 7 = intense in most industries] | 2009–10 weightedaverageSource: World Economic Forum, Executive Opinion Survey
2009, 2010
6.02 Extent of market dominanceHow would you characterize corporate activity in your country? [1 = dominated by a few business groups; 7 = spreadamong many firms] | 2009–10 weighted averageSource: World Economic Forum, Executive Opinion Survey
2009, 2010
6.03 Effectiveness of anti-monopoly policyTo what extent does anti-monopoly policy promote competition in your country? [1 = does not promote competition; 7 = effectively promotes competition] | 2009–10 weighted averageSource: World Economic Forum, Executive Opinion Survey
2009, 2010
6.04 Extent and effect of taxationWhat impact does the level of taxes in your country have on incentives to work or invest? [1 = significantly limits incentives to work or invest; 7 = has no impact onincentives to work or invest] | 2009–10 weighted averageSource: World Economic Forum, Executive Opinion Survey
2009, 2010
6.05 Total tax rateThis variable is a combination of profit tax (% of profits),labor tax and contribution (% of profits), and other taxes (% of profits) | 2009Source: The World Bank, Doing Business 2010
6.06 Number of procedures required to start a businessNumber of procedures required to start a business | 2009Source: The World Bank, Doing Business 2010
6.07 Time required to start a businessNumber of days required to start a business | 2009Source: The World Bank, Doing Business 2010
6.08 Agricultural policy costsHow would you assess the agricultural policy in your country? [1 = excessively burdensome for the economy; 7 = balances the interests of taxpayers, consumers, and producers] | 2009–10 weighted averageSource: World Economic Forum, Executive Opinion Survey
2009, 2010
6.09 Prevalence of trade barriersIn your country, to what extent do tariff and non-tariff barriers limit the ability of imported goods to compete inthe domestic market? [1 = strongly limit; 7 = do not limit] |2009–10 weighted averageSource: World Economic Forum, Executive Opinion Survey
2009, 2010
6.10 Trade tariffsTrade-weighted average tariff rate | 2009Source: International Trade Centre
6.11 Prevalence of foreign ownershipHow prevalent is foreign ownership of companies in yourcountry? [1 = very rare; 7 = highly prevalent] | 2009–10weighted averageSource: World Economic Forum, Executive Opinion Survey
2009, 2010
119
The Africa Competitiveness Report 2011 © 2011 World Economic Forum, the World Bank and the African Development Bank
120120
How to
Rea
d the Co
mpe
titiven
ess Profile
s 6.12 Business impact of rules on FDITo what extent do rules governing foreign direct investment(FDI ) encourage or discourage it? [1 = strongly discourageFDI ; 7 = strongly encourage FDI ] | 2009–10 weighted averageSource: World Economic Forum, Executive Opinion Survey
2009, 2010
6.13 Burden of customs proceduresHow would you rate the level of efficiency of customs procedures (related to the entry and exit of merchandise) in your country? [1 = extremely inefficient; 7 = extremelyefficient] | 2009–10 weighted averageSource: World Economic Forum, Executive Opinion Survey
2009, 2010
6.14 Degree of customer orientationHow well do companies in your country treat customers? [1 = generally treat their customers badly; 7 = are highlyresponsive to customers and customer retention] | 2009–10weighted averageSource: World Economic Forum, Executive Opinion Survey
2009, 2010
6.15 Buyer sophisticationIn your country, how do buyers make purchasing decisions?[1 = based solely on the lowest price; 7 = based on a sophisticated analysis of performance attributes] | 2009–10weighted averageSource: World Economic Forum, Executive Opinion Survey
2009, 2010
10.04 Imports as a percentage of GDPImports of goods and services as a percentage of grossdomestic product | 2009Sources: Economist Intelligence Unit, CountryData Database
(retrieved July 1, 2010); The World Bank, Data Catalog
(retrieved July 13, 2010); national sources
7th Pillar: Labor market efficiency
7.01 Cooperation in labor-employer relationsHow would you characterize labor-employer relations inyour country? [1 = generally confrontational; 7 = generallycooperative] | 2009–10 weighted averageSource: World Economic Forum, Executive Opinion Survey
2009, 2010
7.02 Flexibility of wage determinationHow are wages generally set in your country? [1 = by a centralized bargaining process; 7 = up to each individualcompany] | 2009–10 weighted averageSource: World Economic Forum, Executive Opinion Survey
2009, 2010
7.03 Rigidity of employmentRigidity of Employment Index on a 0–100 (worst) scale | 2009Source: The World Bank, Doing Business 2010
7.04 Hiring and firing practicesHow would you characterize the hiring and firing of workersin your country? [1 = impeded by regulations; 7 = flexiblydetermined by employers] | 2009–10 weighted averageSource: World Economic Forum, Executive Opinion Survey
2009, 2010
7.05 Redundancy costsRedundancy costs in weeks of salary | 2009Source: The World Bank, Doing Business 2010
7.06 Pay and productivityTo what extent is pay in your country related to productivity?[1 = not related to worker productivity; 7 = strongly related toworker productivity] | 2009–10 weighted averageSource: World Economic Forum, Executive Opinion Survey
2009, 2010
7.07 Reliance on professional managementIn your country, who holds senior management positions? [1 = usually relatives or friends without regard to merit; 7 = mostly professional managers chosen for merit and qualifications] | 2009–10 weighted averageSource: World Economic Forum, Executive Opinion Survey
2009, 2010
7.08 Brain drainDoes your country retain and attract talented people? [1 = no, the best and brightest normally leave to pursueopportunities in other countries; 7 = yes, there are manyopportunities for talented people within the country] |2009–10 weighted averageSource: World Economic Forum, Executive Opinion Survey
2009, 2010
7.09 Female participation in labor forceFemale-to-male participation ratio in the labor force | 2008Source: International Labour Organization, KIILM Net (retrieved
June 28, 2010)
8th Pillar: Financial market development
8.01 Availability of financial servicesTo what extent does competition among providers of financial services in your country ensure the provision of financial services at affordable prices? [1 = not at all; 7 = extremely well] | 2010Source: World Economic Forum, Executive Opinion Survey
2009, 2010
8.02 Affordability of financial servicesTo what extent does competition among providers of financial services in your country ensure the provision of financial services at affordable prices? [1 = not at all; 7 = extremely well] | 2010Source: World Economic Forum, Executive Opinion Survey
2009, 2010
8.03 Financing through local equity marketHow easy is it to raise money by issuing shares on the stockmarket in your country? [1 = very difficult; 7 = very easy] |2009–10 weighted averageSource: World Economic Forum, Executive Opinion Survey
2009, 2010
8.04 Ease of access to loansHow easy is it to obtain a bank loan in your country withonly a good business plan and no collateral? [1 = very difficult; 7 = very easy] | 2009–10 weighted averageSource: World Economic Forum, Executive Opinion Survey
2009, 2010
8.05 Venture capital availabilityIn your country, how easy is it for entrepreneurs with innovative but risky projects to find venture capital? [1 =very difficult; 7 = very easy] | 2009–10 weighted averageSource: World Economic Forum, Executive Opinion Survey
2009, 2010
8.06 Restriction on capital flowsHow restrictive are regulations in your country related to international capital flows? [1 = highly restrictive; 7 = not restrictive at all] | 2009–10 weighted averageSource: World Economic Forum, Executive Opinion Survey
2009, 2010
The Africa Competitiveness Report 2011 © 2011 World Economic Forum, the World Bank and the African Development Bank
121
How to
Rea
d the Co
mpe
titiven
ess Profile
s8.07 Soundness of banksHow would you assess the soundness of banks in yourcountry? [1 = insolvent and may require a governmentbailout; 7 = generally healthy with sound balance sheets] |2009–10 weighted averageSource: World Economic Forum, Executive Opinion Survey
2009, 2010
8.08 Regulation of securities exchangesHow would you assess the regulation and supervision of securities exchanges in your country? [1 = ineffective; 7 = effective] | 2009–10 weighted averageSource: World Economic Forum, Executive Opinion Survey
2009, 2010
8.09 Legal rights indexDegree of legal protection of borrowers and lenders’ rightson a 0–10 (best) scale | 2009Source: The World Bank, Doing Business 2010
9th Pillar: Technological readiness
9.01 Availability of latest technologiesTo what extent are the latest technologies available in yourcountry? [1 = not available; 7 = widely available] | 2009–10weighted averageSource: World Economic Forum, Executive Opinion Survey
2009, 2010
9.02 Firm-level technology absorptionTo what extent do businesses in your country absorb newtechnology? [1 = not at all; 7 = aggressively absorb] | 2009–10weighted averageSource: World Economic Forum, Executive Opinion Survey
2009, 2010
9.03 FDI and technology transferTo what extent does foreign direct investment (FDI ) bringnew technology into your country? [1 = not at all; 7 = FDI is a key source of new technology] | 2009–10 weighted averageSource: World Economic Forum, Executive Opinion Survey
2009, 2010
9.04 Internet usersNumber of estimated Internet users per 100 population |2009Sources: International Telecommunication Union, World
Telecommunication/ICT Indicators (June 2010 edition); The
World Bank, Data Catalog (retrieved July 19, 2010); national
sources
9.05 Broadband Internet subscriptionsNumber of fixed broadband Internet subscriptions per 100 population | 2009Source: International Telecommunication Union, World
Telecommunication/ICT Indicators (June 2010 edition)
9.06 Internet bandwidthInternational Internet bandwidth (Mb/s) per 10,000 population | 2007Sources: International Telecommunication Union, World
Telecommunication/ICT Indicators (June 2010 edition);
national sources
10th Pillar: Market size
10.01 Domestic market size indexSum of gross domestic product plus value of imports ofgoods and services, minus value of exports of goods andservices, normalized on a 1–7 (best) scale | 2009Source: Authors’ calculation. For more details please refer
to Appendix A in Chapter 1.1 of this Report
10.02 Foreign market size indexValue of exports of goods and services, normalized on a 1–7(best) scale | 2009Source: Authors’ calculation. For more details please refer
to Appendix A in Chapter 1.1 of this Report
11th Pillar: Business sophistication
11.01 Local supplier quantityHow numerous are local suppliers in your country? [1 = largely nonexistent; 7 = very numerous] | 2009–10weighted averageSource: World Economic Forum, Executive Opinion Survey
2009, 2010
11.02 Local supplier qualityHow would you assess the quality of local suppliers in yourcountry? [1 = very poor; 7 = very good] | 2009–10 weightedaverageSource: World Economic Forum, Executive Opinion Survey
2009, 2010
11.03 State of cluster developmentIn your country’s economy, how prevalent are well-developed and deep clusters? [1 = nonexistent; 7 = widespread in many fields] | 2009–10 weighted averageSource: World Economic Forum, Executive Opinion Survey
2009, 2010
11.04 Nature of competitive advantageWhat is the nature of competitive advantage of your country’s companies in international markets based upon? [1 = low-cost or natural resources; 7 = unique products andprocesses] | 2009–10 weighted averageSource: World Economic Forum, Executive Opinion Survey
2009, 2010
11.05 Value chain breadthIn your country, do exporting companies have a narrow orbroad presence in the value chain? [1 = narrow, primarilyinvolved in individual steps of the value chain (e.g., resourceextraction or production); 7 = broad, present across theentire value chain (i.e., do not only produce but also performproduct design, marketing sales, logistics, and after-salesservices)] | 2009–10 weighted averageSource: World Economic Forum, Executive Opinion Survey
2009, 2010
11.06 Control of international distributionTo what extent are international distribution and marketingfrom your country owned and controlled by domestic companies? [1 = not at all, they take place through foreigncompanies; 7 = extensively, they are primarily owned andcontrolled by domestic companies] | 2009–10 weighted averageSource: World Economic Forum, Executive Opinion Survey
2009, 2010
The Africa Competitiveness Report 2011 © 2011 World Economic Forum, the World Bank and the African Development Bank
122
How to
Rea
d the Co
mpe
titiven
ess Profile
s 11.07 Production process sophisticationIn your country, how sophisticated are production processes?[1 = not at all—labor-intensive methods or previous generations of process technology prevail; 7 = highly—theworld’s best and most efficient process technology prevails] | 2009–10 weighted averageSource: World Economic Forum, Executive Opinion Survey
2009, 2010
11.08 Extent of marketingIn your country, to what extent do companies use sophisticated marketing tools and techniques? [1 = very little; 7 = extensively] | 2009–10 weighted averageSource: World Economic Forum, Executive Opinion Survey
2009, 2010
11.09 Willingness to delegate authorityIn your country, how do you assess the willingness to delegate authority to subordinates? [1 = low—top management controls all important decisions; 7 = high—authority is mostly delegated to business unit heads andother lower-level managers] | 2009–10 weighted averageSource: World Economic Forum, Executive Opinion Survey
2009, 2010
12th Pillar: Innovation
12.01 Capacity for innovationIn your country, how do companies obtain technology? [1 = exclusively from licensing or imitating foreign companies;7 = by conducting formal research and pioneering their ownnew products and processes] | 2009–10 weighted averageSource: World Economic Forum, Executive Opinion Survey
2009, 2010
12.02 Quality of scientific research institutionsHow would you assess the quality of scientific research institutions in your country? [1 = very poor; 7 = the best intheir field internationally] | 2009–10 weighted averageSource: World Economic Forum, Executive Opinion Survey
2009, 2010
12.03 Company spending on R&DTo what extent do companies in your country spend onR&D? [1 = do not spend on R&D; 7 = spend heavily on R&D]| 2009–10 weighted averageSource: World Economic Forum, Executive Opinion Survey
2009, 2010
12.04 University-industry collaboration in R&DTo what extent do business and universities collaborate onresearch and development (R&D) in your country? [1 = donot collaborate at all; 7 = collaborate extensively] | 2009–10weighted averageSource: World Economic Forum, Executive Opinion Survey
2009, 2010
12.05 Government procurement of advanced technologyproductsDo government procurement decisions foster technologicalinnovation in your country? [1 = no, not at all; 7 = yes,extremely effectively] | 2009–10 weighted averageSource: World Economic Forum, Executive Opinion Survey
2009, 2010
12.06 Availability of scientists and engineersTo what extent are scientists and engineers available in your country? [1 = not at all; 7 = widely available] | 2009–10weighted averageSource: World Economic Forum, Executive Opinion Survey
2009, 2010
12.07 Utility patents per million populationNumber of utility patents (i.e., patents for invention) granted in 2009, per million population | 2009Source: The United States Patent and Trademark Office
The Africa Competitiveness Report 2011 © 2011 World Economic Forum, the World Bank and the African Development Bank
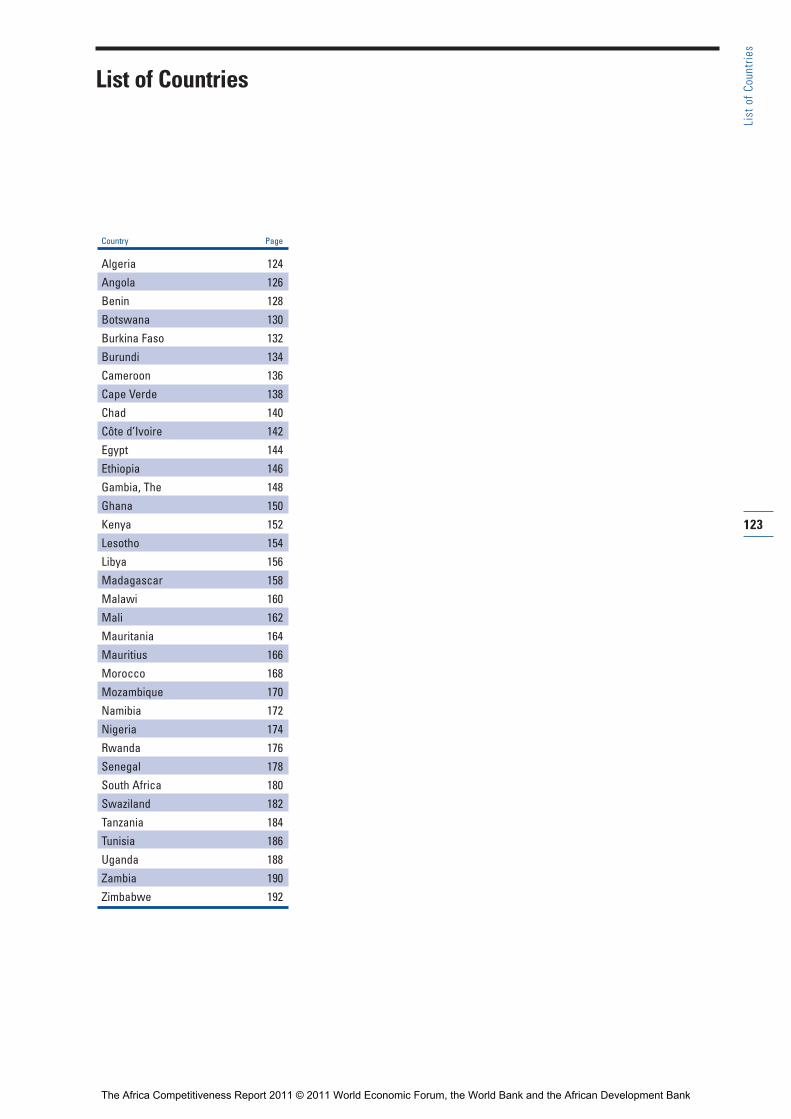
123
List of Co
untries
List of Countries
Country Page
Algeria 124
Angola 126
Benin 128
Botswana 130
Burkina Faso 132
Burundi 134
Cameroon 136
Cape Verde 138
Chad 140
Côte d’Ivoire 142
Egypt 144
Ethiopia 146
Gambia, The 148
Ghana 150
Kenya 152
Lesotho 154
Libya 156
Madagascar 158
Malawi 160
Mali 162
Mauritania 164
Mauritius 166
Morocco 168
Mozambique 170
Namibia 172
Nigeria 174
Rwanda 176
Senegal 178
South Africa 180
Swaziland 182
Tanzania 184
Tunisia 186
Uganda 188
Zambia 190
Zimbabwe 192
The Africa Competitiveness Report 2011 © 2011 World Economic Forum, the World Bank and the African Development Bank
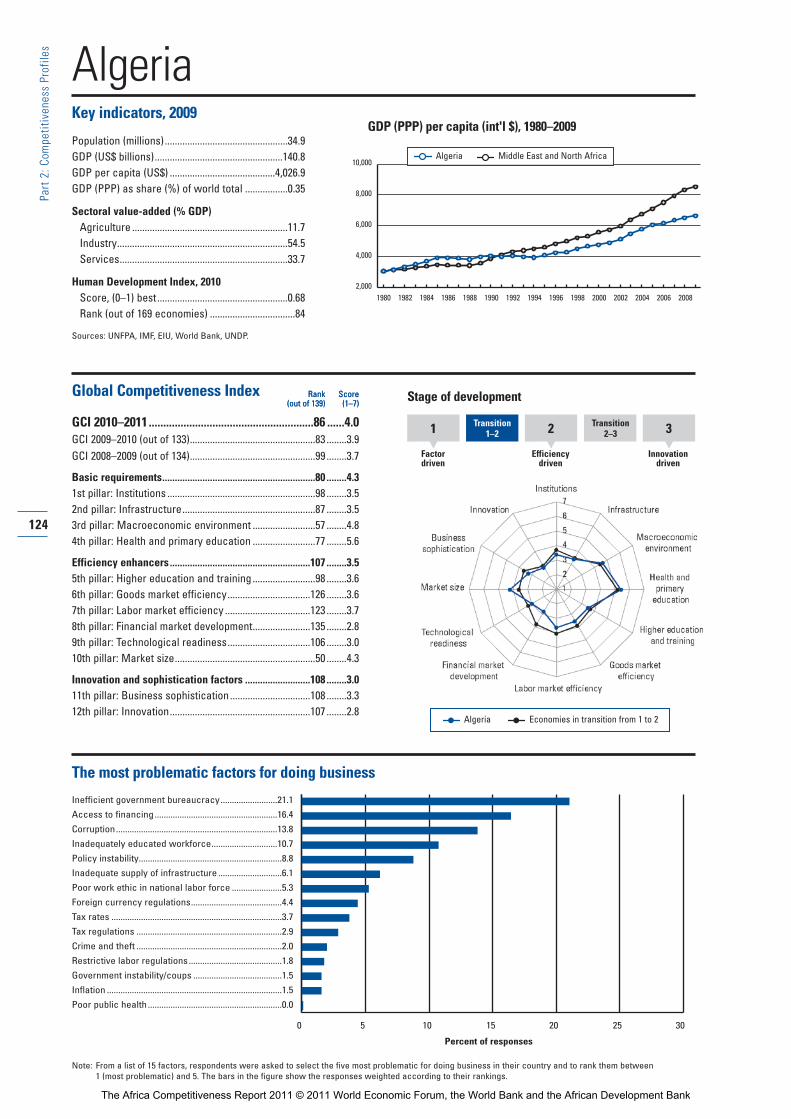
AlgeriaKey indicators, 2009
Population (millions).................................................34.9GDP (US$ billions)...................................................140.8GDP per capita (US$) ..........................................4,026.9GDP (PPP) as share (%) of world total .................0.35
Sectoral value-added (% GDP)Agriculture ..............................................................11.7Industry....................................................................54.5Services...................................................................33.7
Human Development Index, 2010Score, (0–1) best....................................................0.68Rank (out of 169 economies) ..................................84
Sources: UNFPA, IMF, EIU, World Bank, UNDP.
Global Competitiveness Index
GCI 2010–2011.........................................................86 ......4.0GCI 2009–2010 (out of 133)..................................................83 ........3.9GCI 2008–2009 (out of 134)..................................................99 ........3.7
Basic requirements.............................................................80 ........4.31st pillar: Institutions ...........................................................98 ........3.52nd pillar: Infrastructure.....................................................87 ........3.53rd pillar: Macroeconomic environment .........................57 ........4.84th pillar: Health and primary education .........................77 ........5.6
Efficiency enhancers........................................................107 ........3.55th pillar: Higher education and training .........................98 ........3.66th pillar: Goods market efficiency.................................126 ........3.67th pillar: Labor market efficiency ..................................123 ........3.78th pillar: Financial market development.......................135 ........2.89th pillar: Technological readiness.................................106 ........3.010th pillar: Market size........................................................50 ........4.3
Innovation and sophistication factors ..........................108 ........3.011th pillar: Business sophistication................................108 ........3.312th pillar: Innovation........................................................107 ........2.8
The most problematic factors for doing business
Inefficient government bureaucracy.........................21.1
Access to financing......................................................16.4
Corruption.......................................................................13.8
Inadequately educated workforce.............................10.7
Policy instability...............................................................8.8
Inadequate supply of infrastructure ............................6.1
Poor work ethic in national labor force ......................5.3
Foreign currency regulations........................................4.4
Tax rates ...........................................................................3.7
Tax regulations ................................................................2.9
Crime and theft ................................................................2.0
Restrictive labor regulations.........................................1.8
Government instability/coups .......................................1.5
Inflation .............................................................................1.5
Poor public health ...........................................................0.0
Rank Score(out of 139) (1–7)
124
Part 2:C
ompe
titiven
ess Profile
s
GDP (PPP) per capita (int'l $), 1980–2009
0 5 10 15 20 25 30
Percent of responses
Note: From a list of 15 factors, respondents were asked to select the five most problematic for doing business in their country and to rank them between 1 (most problematic) and 5. The bars in the figure show the responses weighted according to their rankings.
1 Transition1–2 2 Transition
2 –3
Factordriven
Efficiencydriven
Innovationdriven
3
Stage of development
Algeria Economies in transition from 1 to 2
2,000
4,000
6,000
8,000
10,000
1980 1982 1984 1986 1988 1990 1992 1994 1996 1998 2000 2002 2004 20082006
Algeria Middle East and North Africa
Rank Score(out of 139) (1–7)
The Africa Competitiveness Report 2011 © 2011 World Economic Forum, the World Bank and the African Development Bank

125
Part 2:C
ompe
titiven
ess Profile
s
The Global Competitiveness Index in detailINDICATOR SCORE RANK/139
1st pillar: Institutions1.01 Property rights .......................................................3.6 ..........106
1.02 Intellectual property protection..............................2.7 ..........105
1.03 Diversion of public funds.......................................3.3 ............67
1.04 Public trust of politicians........................................2.4 ............85
1.05 Irregular payments and bribes...............................3.4 ............97
1.06 Judicial independence ...........................................2.8 ..........112
1.07 Favoritism in decisions of government officials ....2.8 ............82
1.08 Wastefulness of government spending ................3.3 ............64
1.09 Burden of government regulation..........................2.3 ..........132
1.10 Efficiency of legal framework in settling disputes...3.3 ............93
1.11 Efficiency of legal framework in challenging regs...3.1 ..........100
1.12 Transparency of government policymaking...........3.6 ..........121
1.13 Business costs of terrorism...................................4.4 ..........128
1.14 Business costs of crime and violence...................4.8 ............74
1.15 Organized crime.....................................................5.1 ............87
1.16 Reliability of police services...................................4.0 ............79
1.17 Ethical behavior of firms........................................3.5 ............98
1.18 Strength of auditing and reporting standards........4.0 ..........104
1.19 Efficacy of corporate boards..................................4.1 ..........110
1.20 Protection of minority shareholders’ interests ......3.9 ............95
1.21 Strength of investor protection, 0–10 (best)*........5.3 ............59
2nd pillar: Infrastructure2.01 Quality of overall infrastructure .............................3.8 ............86
2.02 Quality of roads .....................................................3.9 ............66
2.03 Quality of railroad infrastructure ............................2.7 ............65
2.04 Quality of port infrastructure .................................3.2 ..........115
2.05 Quality of air transport infrastructure ....................3.9 ............98
2.06 Available airline seat Kms/week, millions*........147.2 ............70
2.07 Quality of electricity supply ...................................4.8 ............69
2.08 Fixed telephone lines/100 pop.* ...........................7.4 ..........102
2.09 Mobile telephone subscriptions/100 pop.* .........93.8 ............72
3rd pillar: Macroeconomic environment3.01 Government budget balance, % GDP* ................-8.4 ..........120
3.02 National savings rate, % GDP* ...........................30.0 ............26
3.03 Inflation, annual % change* ..................................5.7 ............99
3.04 Interest rate spread, %*........................................6.2 ............81
3.05 Government debt, % GDP* ................................13.5 ............10
3.06 Country credit rating, 0–100 (worst)*..................55.9 ............59
4th pillar: Health and primary education4.01 Business impact of malaria ..............................n/appl. ..............1
4.02 Malaria incidence/100,000 pop.*...........................0.0 ..............1
4.03 Business impact of tuberculosis............................5.0 ............91
4.04 Tuberculosis incidence/100,000 pop.* ................57.9 ............73
4.05 Business impact of HIV/AIDS................................5.4 ............63
4.06 HIV prevalence, % adult pop.*..............................0.1 ............22
4.07 Infant mortality, deaths/1,000 live births* ...........36.0 ..........104
4.08 Life expectancy, years*.......................................72.4 ............77
4.09 Quality of primary education..................................3.1 ............96
4.10 Primary education enrollment, net %*................94.9 ............58
5th pillar: Higher education and training5.01 Secondary education enrollment, gross %* .......83.2 ............80
5.02 Tertiary education enrollment, gross %* ............24.0 ............87
5.03 Quality of the educational system.........................2.9 ..........117
5.04 Quality of math and science education .................3.6 ............84
5.05 Quality of management schools............................3.8 ............91
5.06 Internet access in schools .....................................2.5 ..........125
5.07 Availability of research and training services.........3.4 ..........105
5.08 Extent of staff training ...........................................3.5 ..........103
INDICATOR SCORE RANK/139
6th pillar: Goods market efficiency6.01 Intensity of local competition ................................4.5 ............93
6.02 Extent of market dominance .................................3.9 ............55
6.03 Effectiveness of anti-monopoly policy...................3.7 ............91
6.04 Extent and effect of taxation .................................3.7 ............56
6.05 Total tax rate, % profits*.....................................72.0 ..........128
6.06 No. procedures to start a business* ...................14.0 ..........126
6.07 No. days to start a business*..............................24.0 ............79
6.08 Agricultural policy costs.........................................3.4 ..........119
6.09 Prevalence of trade barriers...................................4.7 ............56
6.10 Trade tariffs, % duty*..........................................13.3 ..........121
6.11 Prevalence of foreign ownership...........................3.8 ..........123
6.12 Business impact of rules on FDI ...........................3.7 ..........125
6.13 Burden of customs procedures.............................3.2 ..........124
6.14 Degree of customer orientation ............................4.0 ..........108
6.15 Buyer sophistication ..............................................2.9 ..........108
7th pillar: Labor market efficiency7.01 Cooperation in labor-employer relations................4.1 ............93
7.02 Flexibility of wage determination...........................4.5 ..........105
7.03 Rigidity of employment index, 0–100 (worst)*....41.0 ..........104
7.04 Hiring and firing practices......................................3.8 ............78
7.05 Redundancy costs, weeks of wages*.................17.0 ............29
7.06 Pay and productivity ..............................................3.4 ..........105
7.07 Reliance on professional management .................3.3 ..........129
7.08 Brain drain..............................................................2.2 ..........125
7.09 Females in labor force, ratio to males* .................0.5 ..........120
8th pillar: Financial market development8.01 Availability of financial services .............................3.2 ..........131
8.02 Affordability of financial services ...........................2.7 ..........136
8.03 Financing through local equity market...................2.2 ..........127
8.04 Ease of access to loans.........................................2.8 ............67
8.05 Venture capital availability......................................2.4 ............81
8.06 Restriction on capital flows ...................................2.3 ..........136
8.07 Soundness of banks ..............................................4.2 ..........121
8.08 Regulation of securities exchanges.......................2.1 ..........137
8.09 Legal rights index, 0–10 (best)* ............................3.0 ..........103
9th pillar: Technological readiness9.01 Availability of latest technologies ..........................4.2 ..........109
9.02 Firm-level technology absorption...........................3.9 ..........128
9.03 FDI and technology transfer ..................................3.6 ..........129
9.04 Internet users/100 pop.* .....................................13.5 ............96
9.05 Broadband Internet subscriptions/100 pop.*.........2.3 ............82
9.06 Internet bandwidth, Mb/s per 10,000 pop.*..........n/a ...........n/a
10th pillar: Market size10.01 Domestic market size index, 1–7 (best)* ..............4.0 ............51
10.02 Foreign market size index, 1–7 (best)*..................5.0 ............41
11th pillar: Business sophistication 11.01 Local supplier quantity...........................................4.9 ............59
11.02 Local supplier quality .............................................3.9 ..........105
11.03 State of cluster development ................................2.5 ..........126
11.04 Nature of competitive advantage ..........................2.5 ..........129
11.05 Value chain breadth ...............................................2.8 ..........123
11.06 Control of international distribution .......................3.6 ..........109
11.07 Production process sophistication.........................3.4 ............83
11.08 Extent of marketing ...............................................3.4 ..........105
11.09 Willingness to delegate authority ..........................3.0 ..........111
12th pillar: Innovation12.01 Capacity for innovation ..........................................2.3 ..........125
12.02 Quality of scientific research institutions ..............3.1 ............96
12.03 Company spending on R&D ..................................2.6 ..........106
12.04 University-industry collaboration in R&D ...............2.9 ..........119
12.05 Gov’t procurement of advanced tech products.....2.9 ..........123
12.06 Availability of scientists and engineers..................4.5 ............43
12.07 Utility patents/million pop.* ...................................0.0 ............90
Algeria
Notes: An asterisk (*) indicates that data are from sources other than the World Economic Forum. For further details and explanation, please refer to the section“How to Read the Competitiveness Profiles” on page 115.
The Africa Competitiveness Report 2011 © 2011 World Economic Forum, the World Bank and the African Development Bank
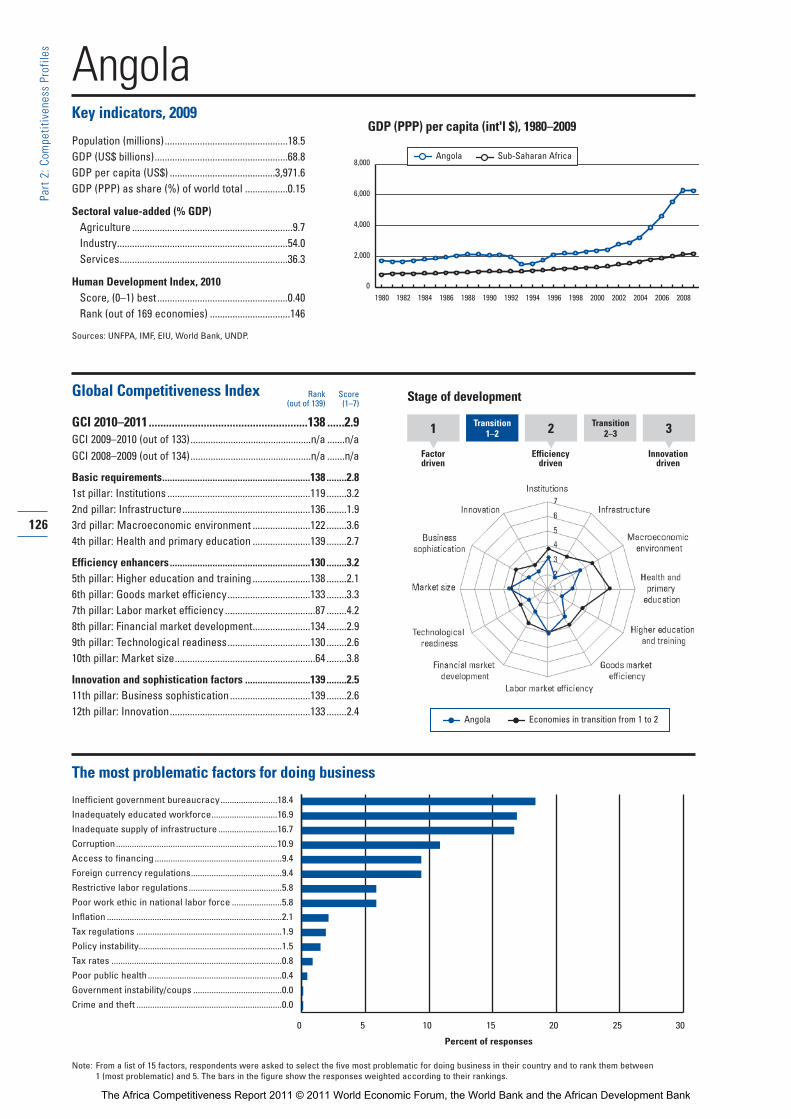
AngolaKey indicators, 2009
Population (millions).................................................18.5GDP (US$ billions).....................................................68.8GDP per capita (US$) ..........................................3,971.6GDP (PPP) as share (%) of world total .................0.15
Sectoral value-added (% GDP)Agriculture ................................................................9.7Industry....................................................................54.0Services...................................................................36.3
Human Development Index, 2010Score, (0–1) best....................................................0.40Rank (out of 169 economies) ................................146
Sources: UNFPA, IMF, EIU, World Bank, UNDP.
Global Competitiveness Index
GCI 2010–2011.......................................................138 ......2.9GCI 2009–2010 (out of 133)................................................n/a .......n/aGCI 2008–2009 (out of 134)................................................n/a .......n/a
Basic requirements...........................................................138 ........2.81st pillar: Institutions .........................................................119 ........3.22nd pillar: Infrastructure...................................................136 ........1.93rd pillar: Macroeconomic environment .......................122 ........3.64th pillar: Health and primary education .......................139 ........2.7
Efficiency enhancers........................................................130 ........3.25th pillar: Higher education and training .......................138 ........2.16th pillar: Goods market efficiency.................................133 ........3.37th pillar: Labor market efficiency ....................................87 ........4.28th pillar: Financial market development.......................134 ........2.99th pillar: Technological readiness.................................130 ........2.610th pillar: Market size........................................................64 ........3.8
Innovation and sophistication factors ..........................139 ........2.511th pillar: Business sophistication................................139 ........2.612th pillar: Innovation........................................................133 ........2.4
The most problematic factors for doing business
Inefficient government bureaucracy.........................18.4
Inadequately educated workforce.............................16.9
Inadequate supply of infrastructure ..........................16.7
Corruption.......................................................................10.9
Access to financing........................................................9.4
Foreign currency regulations........................................9.4
Restrictive labor regulations.........................................5.8
Poor work ethic in national labor force ......................5.8
Inflation .............................................................................2.1
Tax regulations ................................................................1.9
Policy instability...............................................................1.5
Tax rates ...........................................................................0.8
Poor public health ...........................................................0.4
Government instability/coups .......................................0.0
Crime and theft ................................................................0.0
126
Part 2:C
ompe
titiven
ess Profile
s
GDP (PPP) per capita (int'l $), 1980–2009
0 5 10 15 20 25 30
Percent of responses
Note: From a list of 15 factors, respondents were asked to select the five most problematic for doing business in their country and to rank them between 1 (most problematic) and 5. The bars in the figure show the responses weighted according to their rankings.
1 Transition1–2 2 Transition
2 –3
Factordriven
Efficiencydriven
Innovationdriven
3
Stage of development
Angola Economies in transition from 1 to 2
0
2,000
4,000
6,000
8,000
1980 1982 1984 1986 1988 1990 1992 1994 1996 1998 2000 2002 2004 20082006
Angola Sub-Saharan Africa
Rank Score(out of 139) (1–7)
The Africa Competitiveness Report 2011 © 2011 World Economic Forum, the World Bank and the African Development Bank

127
Part 2:C
ompe
titiven
ess Profile
s
The Global Competitiveness Index in detailINDICATOR SCORE RANK/139
1st pillar: Institutions1.01 Property rights .......................................................2.9 ..........130
1.02 Intellectual property protection..............................2.6 ..........120
1.03 Diversion of public funds.......................................2.3 ..........122
1.04 Public trust of politicians........................................3.0 ............66
1.05 Irregular payments and bribes...............................3.2 ..........110
1.06 Judicial independence ...........................................3.0 ..........102
1.07 Favoritism in decisions of government officials ....2.2 ..........132
1.08 Wastefulness of government spending ................2.4 ..........116
1.09 Burden of government regulation..........................2.0 ..........137
1.10 Efficiency of legal framework in settling disputes...2.9 ..........120
1.11 Efficiency of legal framework in challenging regs...3.2 ............90
1.12 Transparency of government policymaking...........3.5 ..........127
1.13 Business costs of terrorism...................................6.5 ............17
1.14 Business costs of crime and violence...................4.2 ............98
1.15 Organized crime.....................................................6.0 ............36
1.16 Reliability of police services...................................3.8 ............83
1.17 Ethical behavior of firms........................................2.7 ..........138
1.18 Strength of auditing and reporting standards........3.4 ..........132
1.19 Efficacy of corporate boards..................................3.6 ..........137
1.20 Protection of minority shareholders’ interests ......3.6 ..........115
1.21 Strength of investor protection, 0–10 (best)*........5.7 ............45
2nd pillar: Infrastructure2.01 Quality of overall infrastructure .............................2.2 ..........138
2.02 Quality of roads .....................................................2.8 ..........115
2.03 Quality of railroad infrastructure ............................1.4 ..........107
2.04 Quality of port infrastructure .................................2.1 ..........136
2.05 Quality of air transport infrastructure ....................3.0 ..........128
2.06 Available airline seat Kms/week, millions*..........93.4 ............80
2.07 Quality of electricity supply ...................................1.5 ..........135
2.08 Fixed telephone lines/100 pop.* ...........................1.6 ..........120
2.09 Mobile telephone subscriptions/100 pop.* .........43.8 ..........117
3rd pillar: Macroeconomic environment3.01 Government budget balance, % GDP* ................-7.7 ..........115
3.02 National savings rate, % GDP* ...........................13.8 ..........105
3.03 Inflation, annual % change* ................................14.0 ..........132
3.04 Interest rate spread, %*........................................8.1 ............99
3.05 Government debt, % GDP* ................................22.8 ............35
3.06 Country credit rating, 0–100 (worst)*..................36.4 ............90
4th pillar: Health and primary education4.01 Business impact of malaria....................................2.1 ..........139
4.02 Malaria incidence/100,000 pop.*..................21,470.7 ..........121
4.03 Business impact of tuberculosis............................3.9 ..........123
4.04 Tuberculosis incidence/100,000 pop.* ..............292.1 ..........119
4.05 Business impact of HIV/AIDS................................3.3 ..........126
4.06 HIV prevalence, % adult pop.*..............................2.1 ..........120
4.07 Infant mortality, deaths/1,000 live births* .........130.3 ..........139
4.08 Life expectancy, years*.......................................47.0 ..........135
4.09 Quality of primary education..................................1.5 ..........139
4.10 Primary education enrollment, net %*..................n/a ...........n/a
5th pillar: Higher education and training5.01 Secondary education enrollment, gross %* .......17.3 ..........139
5.02 Tertiary education enrollment, gross %* ..............2.8 ..........132
5.03 Quality of the educational system.........................2.0 ..........139
5.04 Quality of math and science education .................1.6 ..........139
5.05 Quality of management schools............................1.8 ..........139
5.06 Internet access in schools .....................................1.8 ..........137
5.07 Availability of research and training services.........2.7 ..........133
5.08 Extent of staff training ...........................................4.4 ............39
INDICATOR SCORE RANK/139
6th pillar: Goods market efficiency6.01 Intensity of local competition ................................3.9 ..........127
6.02 Extent of market dominance .................................2.8 ..........130
6.03 Effectiveness of anti-monopoly policy...................3.1 ..........128
6.04 Extent and effect of taxation .................................4.1 ............30
6.05 Total tax rate, % profits*.....................................53.2 ..........107
6.06 No. procedures to start a business* .....................8.0 ............73
6.07 No. days to start a business*..............................68.0 ..........129
6.08 Agricultural policy costs.........................................3.9 ............61
6.09 Prevalence of trade barriers...................................3.7 ..........123
6.10 Trade tariffs, % duty*............................................8.6 ............93
6.11 Prevalence of foreign ownership...........................4.6 ............83
6.12 Business impact of rules on FDI ...........................3.8 ..........120
6.13 Burden of customs procedures.............................2.8 ..........133
6.14 Degree of customer orientation ............................2.9 ..........139
6.15 Buyer sophistication ..............................................2.7 ..........119
7th pillar: Labor market efficiency7.01 Cooperation in labor-employer relations................4.2 ............78
7.02 Flexibility of wage determination...........................4.8 ............89
7.03 Rigidity of employment index, 0–100 (worst)*....66.0 ..........133
7.04 Hiring and firing practices......................................3.8 ............81
7.05 Redundancy costs, weeks of wages*.................58.0 ............93
7.06 Pay and productivity ..............................................3.9 ............68
7.07 Reliance on professional management .................3.2 ..........132
7.08 Brain drain..............................................................3.9 ............47
7.09 Females in labor force, ratio to males* .................0.9 ............43
8th pillar: Financial market development8.01 Availability of financial services .............................3.3 ..........129
8.02 Affordability of financial services ...........................2.9 ..........132
8.03 Financing through local equity market...................1.5 ..........139
8.04 Ease of access to loans.........................................2.2 ..........111
8.05 Venture capital availability......................................1.8 ..........129
8.06 Restriction on capital flows ...................................1.9 ..........138
8.07 Soundness of banks ..............................................4.6 ..........102
8.08 Regulation of securities exchanges.......................2.5 ..........133
8.09 Legal rights index, 0–10 (best)* ............................4.0 ............86
9th pillar: Technological readiness9.01 Availability of latest technologies ..........................3.4 ..........138
9.02 Firm-level technology absorption...........................3.7 ..........130
9.03 FDI and technology transfer ..................................4.7 ............72
9.04 Internet users/100 pop.* .......................................3.3 ..........125
9.05 Broadband Internet subscriptions/100 pop.*.........0.1 ..........114
9.06 Internet bandwidth, Mb/s per 10,000 pop.*..........0.2 ..........125
10th pillar: Market size10.01 Domestic market size index, 1–7 (best)* ..............3.4 ............72
10.02 Foreign market size index, 1–7 (best)*..................4.7 ............51
11th pillar: Business sophistication 11.01 Local supplier quantity...........................................2.5 ..........139
11.02 Local supplier quality .............................................2.7 ..........139
11.03 State of cluster development ................................2.2 ..........137
11.04 Nature of competitive advantage ..........................2.7 ..........115
11.05 Value chain breadth ...............................................1.7 ..........139
11.06 Control of international distribution .......................2.9 ..........137
11.07 Production process sophistication.........................3.1 ..........102
11.08 Extent of marketing ...............................................3.1 ..........121
11.09 Willingness to delegate authority ..........................2.7 ..........129
12th pillar: Innovation12.01 Capacity for innovation ..........................................1.7 ..........139
12.02 Quality of scientific research institutions ..............1.5 ..........139
12.03 Company spending on R&D ..................................2.7 ............89
12.04 University-industry collaboration in R&D ...............2.4 ..........136
12.05 Gov’t procurement of advanced tech products.....4.2 ............35
12.06 Availability of scientists and engineers..................2.9 ..........134
12.07 Utility patents/million pop.* ...................................0.0 ............90
Angola
Notes: An asterisk (*) indicates that data are from sources other than the World Economic Forum. For further details and explanation, please refer to the section“How to Read the Competitiveness Profiles” on page 115.
The Africa Competitiveness Report 2011 © 2011 World Economic Forum, the World Bank and the African Development Bank
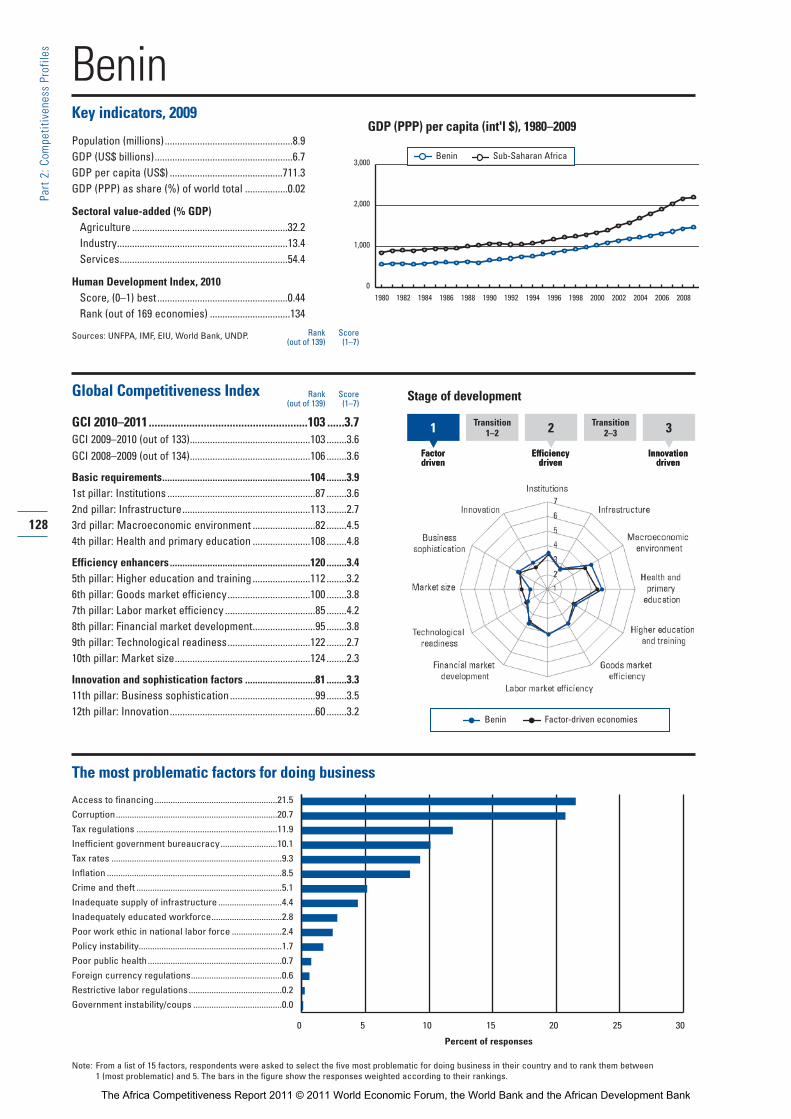
BeninKey indicators, 2009
Population (millions)...................................................8.9GDP (US$ billions).......................................................6.7GDP per capita (US$) .............................................711.3GDP (PPP) as share (%) of world total .................0.02
Sectoral value-added (% GDP)Agriculture ..............................................................32.2Industry....................................................................13.4Services...................................................................54.4
Human Development Index, 2010Score, (0–1) best....................................................0.44Rank (out of 169 economies) ................................134
Sources: UNFPA, IMF, EIU, World Bank, UNDP.
Global Competitiveness Index
GCI 2010–2011.......................................................103 ......3.7GCI 2009–2010 (out of 133)................................................103 ........3.6GCI 2008–2009 (out of 134)................................................106 ........3.6
Basic requirements...........................................................104 ........3.91st pillar: Institutions ...........................................................87 ........3.62nd pillar: Infrastructure...................................................113 ........2.73rd pillar: Macroeconomic environment .........................82 ........4.54th pillar: Health and primary education .......................108 ........4.8
Efficiency enhancers........................................................120 ........3.45th pillar: Higher education and training .......................112 ........3.26th pillar: Goods market efficiency.................................100 ........3.87th pillar: Labor market efficiency ....................................85 ........4.28th pillar: Financial market development.........................95 ........3.89th pillar: Technological readiness.................................122 ........2.710th pillar: Market size......................................................124 ........2.3
Innovation and sophistication factors ............................81 ........3.311th pillar: Business sophistication..................................99 ........3.512th pillar: Innovation..........................................................60 ........3.2
The most problematic factors for doing business
Access to financing......................................................21.5
Corruption.......................................................................20.7
Tax regulations ..............................................................11.9
Inefficient government bureaucracy.........................10.1
Tax rates ...........................................................................9.3
Inflation .............................................................................8.5
Crime and theft ................................................................5.1
Inadequate supply of infrastructure ............................4.4
Inadequately educated workforce...............................2.8
Poor work ethic in national labor force ......................2.4
Policy instability...............................................................1.7
Poor public health ...........................................................0.7
Foreign currency regulations........................................0.6
Restrictive labor regulations.........................................0.2
Government instability/coups .......................................0.0
Rank Score(out of 139) (1–7)
128
Part 2:C
ompe
titiven
ess Profile
s
GDP (PPP) per capita (int'l $), 1980–2009
0 5 10 15 20 25 30
Percent of responses
Note: From a list of 15 factors, respondents were asked to select the five most problematic for doing business in their country and to rank them between 1 (most problematic) and 5. The bars in the figure show the responses weighted according to their rankings.
Benin Factor-driven economies
0
1,000
2,000
3,000
1980 1982 1984 1986 1988 1990 1992 1994 1996 1998 2000 2002 2004 20082006
Benin Sub-Saharan Africa
Rank Score(out of 139) (1–7)
Transition1–2 2 Transition
2 –3
Factordriven
Efficiencydriven
Innovationdriven
31 Transition1–2 2 Transition
2 –3
Factordriven
Efficiencydriven
Innovationdriven
3
Stage of development
The Africa Competitiveness Report 2011 © 2011 World Economic Forum, the World Bank and the African Development Bank

129
Part 2:C
ompe
titiven
ess Profile
s
The Global Competitiveness Index in detailINDICATOR SCORE RANK/139
1st pillar: Institutions1.01 Property rights .......................................................4.7 ............55
1.02 Intellectual property protection..............................3.0 ............91
1.03 Diversion of public funds.......................................2.4 ..........117
1.04 Public trust of politicians........................................2.5 ............80
1.05 Irregular payments and bribes...............................2.8 ..........125
1.06 Judicial independence ...........................................3.3 ............90
1.07 Favoritism in decisions of government officials ....2.9 ............75
1.08 Wastefulness of government spending ................3.7 ............40
1.09 Burden of government regulation..........................3.7 ............34
1.10 Efficiency of legal framework in settling disputes...3.7 ............66
1.11 Efficiency of legal framework in challenging regs...3.4 ............75
1.12 Transparency of government policymaking...........4.6 ............44
1.13 Business costs of terrorism...................................5.5 ............78
1.14 Business costs of crime and violence...................4.2 ............99
1.15 Organized crime.....................................................3.8 ..........128
1.16 Reliability of police services...................................4.5 ............55
1.17 Ethical behavior of firms........................................3.5 ............96
1.18 Strength of auditing and reporting standards........3.5 ..........127
1.19 Efficacy of corporate boards..................................4.9 ............37
1.20 Protection of minority shareholders’ interests ......4.3 ............67
1.21 Strength of investor protection, 0–10 (best)*........3.3 ..........123
2nd pillar: Infrastructure2.01 Quality of overall infrastructure .............................2.9 ..........125
2.02 Quality of roads .....................................................2.9 ..........107
2.03 Quality of railroad infrastructure ............................1.9 ............88
2.04 Quality of port infrastructure .................................4.0 ............76
2.05 Quality of air transport infrastructure ....................3.9 ............96
2.06 Available airline seat Kms/week, millions*..........18.7 ..........118
2.07 Quality of electricity supply ...................................3.3 ..........108
2.08 Fixed telephone lines/100 pop.* ...........................1.4 ..........121
2.09 Mobile telephone subscriptions/100 pop.* .........56.3 ..........108
3rd pillar: Macroeconomic environment3.01 Government budget balance, % GDP* ................-3.6 ............59
3.02 National savings rate, % GDP* ...........................10.5 ..........121
3.03 Inflation, annual % change* ..................................2.2 ............53
3.04 Interest rate spread, %*........................................n/a ...........n/a
3.05 Government debt, % GDP* ................................14.5 ............12
3.06 Country credit rating, 0–100 (worst)*..................28.6 ..........112
4th pillar: Health and primary education4.01 Business impact of malaria....................................3.7 ..........120
4.02 Malaria incidence/100,000 pop.*..................36,976.0 ..........134
4.03 Business impact of tuberculosis............................4.3 ..........112
4.04 Tuberculosis incidence/100,000 pop.* ................91.8 ............85
4.05 Business impact of HIV/AIDS................................4.2 ..........111
4.06 HIV prevalence, % adult pop.*..............................1.2 ..........108
4.07 Infant mortality, deaths/1,000 live births* ...........76.3 ..........126
4.08 Life expectancy, years*.......................................61.4 ..........110
4.09 Quality of primary education..................................3.5 ............80
4.10 Primary education enrollment, net %*................92.8 ............77
5th pillar: Higher education and training5.01 Secondary education enrollment, gross %* .......36.3 ..........122
5.02 Tertiary education enrollment, gross %* ..............5.8 ..........118
5.03 Quality of the educational system.........................4.2 ............45
5.04 Quality of math and science education .................4.2 ............60
5.05 Quality of management schools............................4.5 ............50
5.06 Internet access in schools .....................................3.1 ..........101
5.07 Availability of research and training services.........3.9 ............82
5.08 Extent of staff training ...........................................3.5 ..........104
INDICATOR SCORE RANK/139
6th pillar: Goods market efficiency6.01 Intensity of local competition ................................4.8 ............74
6.02 Extent of market dominance .................................4.8 ............24
6.03 Effectiveness of anti-monopoly policy...................4.3 ............55
6.04 Extent and effect of taxation .................................3.2 ............91
6.05 Total tax rate, % profits*.....................................73.3 ..........129
6.06 No. procedures to start a business* .....................7.0 ............57
6.07 No. days to start a business*..............................31.0 ............95
6.08 Agricultural policy costs.........................................3.6 ............93
6.09 Prevalence of trade barriers...................................4.2 ..........102
6.10 Trade tariffs, % duty*............................................7.8 ............87
6.11 Prevalence of foreign ownership...........................4.5 ............90
6.12 Business impact of rules on FDI ...........................4.4 ............93
6.13 Burden of customs procedures.............................4.2 ............72
6.14 Degree of customer orientation ............................4.1 ..........106
6.15 Buyer sophistication ..............................................3.1 ............90
7th pillar: Labor market efficiency7.01 Cooperation in labor-employer relations................4.6 ............44
7.02 Flexibility of wage determination...........................5.3 ............58
7.03 Rigidity of employment index, 0–100 (worst)*....40.0 ..........100
7.04 Hiring and firing practices......................................4.5 ............35
7.05 Redundancy costs, weeks of wages*.................36.0 ............70
7.06 Pay and productivity ..............................................3.1 ..........114
7.07 Reliance on professional management .................4.0 ............89
7.08 Brain drain..............................................................3.3 ............69
7.09 Females in labor force, ratio to males* .................0.7 ............98
8th pillar: Financial market development8.01 Availability of financial services .............................4.3 ............84
8.02 Affordability of financial services ...........................4.1 ............77
8.03 Financing through local equity market...................3.7 ............62
8.04 Ease of access to loans.........................................2.9 ............57
8.05 Venture capital availability......................................2.6 ............62
8.06 Restriction on capital flows ...................................4.0 ............92
8.07 Soundness of banks ..............................................5.1 ............76
8.08 Regulation of securities exchanges.......................4.3 ............62
8.09 Legal rights index, 0–10 (best)* ............................3.0 ..........103
9th pillar: Technological readiness9.01 Availability of latest technologies ..........................4.2 ..........110
9.02 Firm-level technology absorption...........................4.1 ..........115
9.03 FDI and technology transfer ..................................4.1 ..........103
9.04 Internet users/100 pop.* .......................................2.2 ..........128
9.05 Broadband Internet subscriptions/100 pop.*.........0.0 ..........128
9.06 Internet bandwidth, Mb/s per 10,000 pop.*..........0.3 ..........118
10th pillar: Market size10.01 Domestic market size index, 1–7 (best)* ..............2.3 ..........121
10.02 Foreign market size index, 1–7 (best)*..................2.4 ..........130
11th pillar: Business sophistication 11.01 Local supplier quantity...........................................4.2 ..........106
11.02 Local supplier quality .............................................4.3 ............81
11.03 State of cluster development ................................2.4 ..........130
11.04 Nature of competitive advantage ..........................3.0 ............91
11.05 Value chain breadth ...............................................3.7 ............57
11.06 Control of international distribution .......................4.0 ............73
11.07 Production process sophistication.........................3.0 ..........110
11.08 Extent of marketing ...............................................3.1 ..........118
11.09 Willingness to delegate authority ..........................3.4 ............82
12th pillar: Innovation12.01 Capacity for innovation ..........................................3.1 ............60
12.02 Quality of scientific research institutions ..............3.3 ............85
12.03 Company spending on R&D ..................................3.4 ............42
12.04 University-industry collaboration in R&D ...............3.1 ..........106
12.05 Gov’t procurement of advanced tech products.....4.4 ............21
12.06 Availability of scientists and engineers..................4.2 ............59
12.07 Utility patents/million pop.* ...................................0.0 ............90
Benin
Notes: An asterisk (*) indicates that data are from sources other than the World Economic Forum. For further details and explanation, please refer to the section“How to Read the Competitiveness Profiles” on page 115.
The Africa Competitiveness Report 2011 © 2011 World Economic Forum, the World Bank and the African Development Bank

BotswanaKey indicators, 2009
Population (millions)...................................................2.0GDP (US$ billions).....................................................11.6GDP per capita (US$) ..........................................6,406.9GDP (PPP) as share (%) of world total .................0.04
Sectoral value-added (% GDP)Agriculture ................................................................3.1Industry....................................................................39.6Services...................................................................57.3
Human Development Index, 2010Score, (0–1) best....................................................0.63Rank (out of 169 economies) ..................................98
Sources: UNFPA, IMF, EIU, World Bank, UNDP.
Global Competitiveness Index
GCI 2010–2011.........................................................76 ......4.1GCI 2009–2010 (out of 133)..................................................66 ........4.1GCI 2008–2009 (out of 134)..................................................56 ........4.2
Basic requirements.............................................................76 ........4.41st pillar: Institutions ...........................................................32 ........4.82nd pillar: Infrastructure.....................................................84 ........3.53rd pillar: Macroeconomic environment .........................74 ........4.54th pillar: Health and primary education .......................114 ........4.6
Efficiency enhancers..........................................................85 ........3.85th pillar: Higher education and training .........................94 ........3.66th pillar: Goods market efficiency...................................58 ........4.27th pillar: Labor market efficiency ....................................61 ........4.58th pillar: Financial market development.........................47 ........4.59th pillar: Technological readiness...................................99 ........3.110th pillar: Market size......................................................102 ........2.9
Innovation and sophistication factors ............................93 ........3.211th pillar: Business sophistication................................104 ........3.412th pillar: Innovation..........................................................74 ........3.0
The most problematic factors for doing business
Poor work ethic in national labor force ....................17.4
Inadequately educated workforce.............................13.0
Inefficient government bureaucracy.........................12.9
Access to financing......................................................12.8
Inadequate supply of infrastructure ..........................10.7
Restrictive labor regulations.........................................8.8
Inflation .............................................................................6.2
Corruption.........................................................................4.4
Crime and theft ................................................................3.6
Poor public health ...........................................................2.3
Policy instability...............................................................2.1
Tax rates ...........................................................................2.1
Foreign currency regulations........................................1.5
Tax regulations ................................................................1.5
Government instability/coups .......................................0.8
130
Part 2:C
ompe
titiven
ess Profile
s
GDP (PPP) per capita (int'l $), 1980–2009
0 5 10 15 20 25 30
Percent of responses
Note: From a list of 15 factors, respondents were asked to select the five most problematic for doing business in their country and to rank them between 1 (most problematic) and 5. The bars in the figure show the responses weighted according to their rankings.
1 Transition1–2 2 Transition
2 –3
Factordriven
Efficiencydriven
Innovationdriven
3
Stage of development
Botswana Economies in transition from 1 to 2
0
4,000
8,000
12,000
16,000
1980 1982 1984 1986 1988 1990 1992 1994 1996 1998 2000 2002 2004 20082006
Botswana Sub-Saharan Africa
Rank Score(out of 139) (1–7)
The Africa Competitiveness Report 2011 © 2011 World Economic Forum, the World Bank and the African Development Bank

131
Part 2:C
ompe
titiven
ess Profile
s
The Global Competitiveness Index in detailINDICATOR SCORE RANK/139
1st pillar: Institutions1.01 Property rights .......................................................5.3 ............35
1.02 Intellectual property protection..............................4.1 ............45
1.03 Diversion of public funds.......................................4.8 ............33
1.04 Public trust of politicians........................................4.4 ............21
1.05 Irregular payments and bribes...............................5.1 ............38
1.06 Judicial independence ...........................................5.2 ............30
1.07 Favoritism in decisions of government officials ....4.2 ............22
1.08 Wastefulness of government spending ................4.7 ............15
1.09 Burden of government regulation..........................3.6 ............44
1.10 Efficiency of legal framework in settling disputes...4.6 ............32
1.11 Efficiency of legal framework in challenging regs...4.5 ............26
1.12 Transparency of government policymaking...........5.0 ............26
1.13 Business costs of terrorism...................................6.2 ............46
1.14 Business costs of crime and violence...................4.6 ............83
1.15 Organized crime.....................................................5.7 ............52
1.16 Reliability of police services...................................4.8 ............43
1.17 Ethical behavior of firms........................................5.0 ............36
1.18 Strength of auditing and reporting standards........5.0 ............51
1.19 Efficacy of corporate boards..................................4.6 ............65
1.20 Protection of minority shareholders’ interests ......4.8 ............37
1.21 Strength of investor protection, 0–10 (best)*........6.0 ............33
2nd pillar: Infrastructure2.01 Quality of overall infrastructure .............................4.7 ............54
2.02 Quality of roads .....................................................4.6 ............47
2.03 Quality of railroad infrastructure ............................3.5 ............44
2.04 Quality of port infrastructure .................................3.8 ............86
2.05 Quality of air transport infrastructure ....................4.0 ............94
2.06 Available airline seat Kms/week, millions*............3.5 ..........136
2.07 Quality of electricity supply ...................................4.1 ............88
2.08 Fixed telephone lines/100 pop.* ...........................7.4 ..........101
2.09 Mobile telephone subscriptions/100 pop.* .........96.1 ............65
3rd pillar: Macroeconomic environment3.01 Government budget balance, % GDP* ..............-11.1 ..........133
3.02 National savings rate, % GDP* ...........................28.5 ............33
3.03 Inflation, annual % change* ..................................8.1 ..........114
3.04 Interest rate spread, %*........................................6.3 ............83
3.05 Government debt, % GDP* ..................................6.8 ..............4
3.06 Country credit rating, 0–100 (worst)*..................64.7 ............47
4th pillar: Health and primary education4.01 Business impact of malaria....................................4.8 ..........107
4.02 Malaria incidence/100,000 pop.*.......................361.8 ..........100
4.03 Business impact of tuberculosis............................3.6 ..........131
4.04 Tuberculosis incidence/100,000 pop.* ..............712.4 ..........135
4.05 Business impact of HIV/AIDS................................2.9 ..........132
4.06 HIV prevalence, % adult pop.*............................23.9 ..........138
4.07 Infant mortality, deaths/1,000 live births* ...........26.0 ............90
4.08 Life expectancy, years*.......................................54.2 ..........122
4.09 Quality of primary education..................................4.1 ............57
4.10 Primary education enrollment, net %*................85.6 ..........111
5th pillar: Higher education and training5.01 Secondary education enrollment, gross %* .......80.2 ............88
5.02 Tertiary education enrollment, gross %* ..............7.6 ..........114
5.03 Quality of the educational system.........................4.1 ............48
5.04 Quality of math and science education .................3.7 ............79
5.05 Quality of management schools............................3.5 ..........113
5.06 Internet access in schools .....................................3.3 ............94
5.07 Availability of research and training services.........3.4 ..........108
5.08 Extent of staff training ...........................................4.2 ............54
INDICATOR SCORE RANK/139
6th pillar: Goods market efficiency6.01 Intensity of local competition ................................4.6 ............89
6.02 Extent of market dominance .................................3.4 ............83
6.03 Effectiveness of anti-monopoly policy...................3.8 ............83
6.04 Extent and effect of taxation .................................4.6 ............13
6.05 Total tax rate, % profits*.....................................17.1 ............11
6.06 No. procedures to start a business* ...................10.0 ............99
6.07 No. days to start a business*..............................61.0 ..........124
6.08 Agricultural policy costs.........................................4.3 ............36
6.09 Prevalence of trade barriers...................................4.8 ............53
6.10 Trade tariffs, % duty*............................................6.1 ............75
6.11 Prevalence of foreign ownership...........................5.4 ............29
6.12 Business impact of rules on FDI ...........................5.3 ............25
6.13 Burden of customs procedures.............................4.7 ............37
6.14 Degree of customer orientation ............................4.0 ..........112
6.15 Buyer sophistication ..............................................3.4 ............70
7th pillar: Labor market efficiency7.01 Cooperation in labor-employer relations................4.6 ............48
7.02 Flexibility of wage determination...........................4.7 ............94
7.03 Rigidity of employment index, 0–100 (worst)*....13.0 ............27
7.04 Hiring and firing practices......................................3.9 ............67
7.05 Redundancy costs, weeks of wages*.................90.0 ..........111
7.06 Pay and productivity ..............................................3.9 ............73
7.07 Reliance on professional management .................4.7 ............46
7.08 Brain drain..............................................................3.9 ............46
7.09 Females in labor force, ratio to males* .................0.8 ............73
8th pillar: Financial market development8.01 Availability of financial services .............................4.5 ............73
8.02 Affordability of financial services ...........................3.9 ............86
8.03 Financing through local equity market...................3.6 ............69
8.04 Ease of access to loans.........................................3.5 ............29
8.05 Venture capital availability......................................2.9 ............47
8.06 Restriction on capital flows ...................................5.2 ............27
8.07 Soundness of banks ..............................................5.6 ............39
8.08 Regulation of securities exchanges.......................4.4 ............60
8.09 Legal rights index, 0–10 (best)* ............................7.0 ............39
9th pillar: Technological readiness9.01 Availability of latest technologies ..........................4.8 ............78
9.02 Firm-level technology absorption...........................4.6 ............81
9.03 FDI and technology transfer ..................................4.6 ............81
9.04 Internet users/100 pop.* .......................................6.2 ..........114
9.05 Broadband Internet subscriptions/100 pop.*.........0.8 ............98
9.06 Internet bandwidth, Mb/s per 10,000 pop.*..........2.2 ............95
10th pillar: Market size10.01 Domestic market size index, 1–7 (best)* ..............2.7 ..........101
10.02 Foreign market size index, 1–7 (best)*..................3.4 ..........102
11th pillar: Business sophistication 11.01 Local supplier quantity...........................................4.1 ..........119
11.02 Local supplier quality .............................................3.9 ..........108
11.03 State of cluster development ................................2.9 ..........109
11.04 Nature of competitive advantage ..........................3.4 ............63
11.05 Value chain breadth ...............................................2.8 ..........125
11.06 Control of international distribution .......................3.6 ..........107
11.07 Production process sophistication.........................3.1 ............99
11.08 Extent of marketing ...............................................3.1 ..........117
11.09 Willingness to delegate authority ..........................3.4 ............84
12th pillar: Innovation12.01 Capacity for innovation ..........................................2.5 ..........103
12.02 Quality of scientific research institutions ..............3.3 ............82
12.03 Company spending on R&D ..................................3.0 ............70
12.04 University-industry collaboration in R&D ...............3.5 ............69
12.05 Gov’t procurement of advanced tech products.....3.9 ............52
12.06 Availability of scientists and engineers..................3.5 ..........105
12.07 Utility patents/million pop.* ...................................0.0 ............90
Botswana
Notes: An asterisk (*) indicates that data are from sources other than the World Economic Forum. For further details and explanation, please refer to the section“How to Read the Competitiveness Profiles” on page 115.
The Africa Competitiveness Report 2011 © 2011 World Economic Forum, the World Bank and the African Development Bank
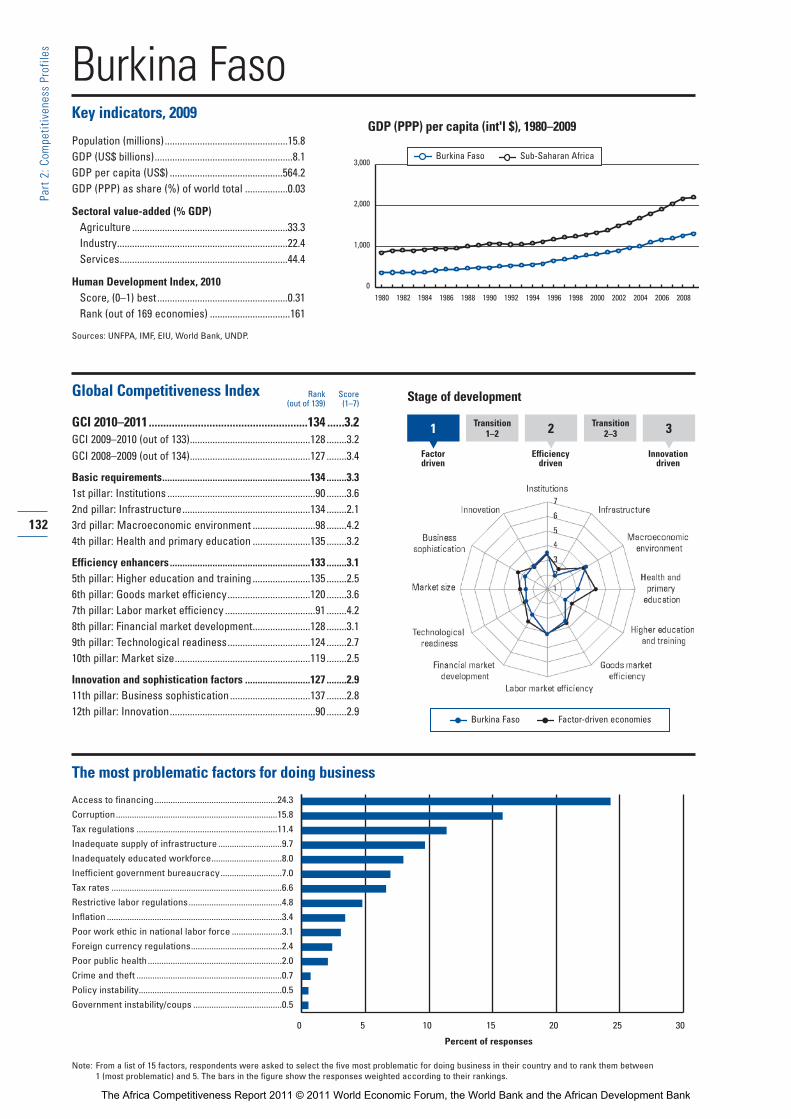
Burkina FasoKey indicators, 2009
Population (millions).................................................15.8GDP (US$ billions).......................................................8.1GDP per capita (US$) .............................................564.2GDP (PPP) as share (%) of world total .................0.03
Sectoral value-added (% GDP)Agriculture ..............................................................33.3Industry....................................................................22.4Services...................................................................44.4
Human Development Index, 2010Score, (0–1) best....................................................0.31Rank (out of 169 economies) ................................161
Sources: UNFPA, IMF, EIU, World Bank, UNDP.
Global Competitiveness Index
GCI 2010–2011.......................................................134 ......3.2GCI 2009–2010 (out of 133)................................................128 ........3.2GCI 2008–2009 (out of 134)................................................127 ........3.4
Basic requirements...........................................................134 ........3.31st pillar: Institutions ...........................................................90 ........3.62nd pillar: Infrastructure...................................................134 ........2.13rd pillar: Macroeconomic environment .........................98 ........4.24th pillar: Health and primary education .......................135 ........3.2
Efficiency enhancers........................................................133 ........3.15th pillar: Higher education and training .......................135 ........2.56th pillar: Goods market efficiency.................................120 ........3.67th pillar: Labor market efficiency ....................................91 ........4.28th pillar: Financial market development.......................128 ........3.19th pillar: Technological readiness.................................124 ........2.710th pillar: Market size......................................................119 ........2.5
Innovation and sophistication factors ..........................127 ........2.911th pillar: Business sophistication................................137 ........2.812th pillar: Innovation..........................................................90 ........2.9
The most problematic factors for doing business
Access to financing......................................................24.3
Corruption.......................................................................15.8
Tax regulations ..............................................................11.4
Inadequate supply of infrastructure ............................9.7
Inadequately educated workforce...............................8.0
Inefficient government bureaucracy...........................7.0
Tax rates ...........................................................................6.6
Restrictive labor regulations.........................................4.8
Inflation .............................................................................3.4
Poor work ethic in national labor force ......................3.1
Foreign currency regulations........................................2.4
Poor public health ...........................................................2.0
Crime and theft ................................................................0.7
Policy instability...............................................................0.5
Government instability/coups .......................................0.5
Rank Score(out of 139) (1–7)
132
Part 2:C
ompe
titiven
ess Profile
s
GDP (PPP) per capita (int'l $), 1980–2009
0 5 10 15 20 25 30
Percent of responses
Note: From a list of 15 factors, respondents were asked to select the five most problematic for doing business in their country and to rank them between 1 (most problematic) and 5. The bars in the figure show the responses weighted according to their rankings.
1 Transition1–2 2 Transition
2 –3
Factordriven
Efficiencydriven
Innovationdriven
3
Stage of development
Burkina Faso Factor-driven economies
0
1,000
2,000
3,000
1980 1982 1984 1986 1988 1990 1992 1994 1996 1998 2000 2002 2004 20082006
Burkina Faso Sub-Saharan Africa
The Africa Competitiveness Report 2011 © 2011 World Economic Forum, the World Bank and the African Development Bank
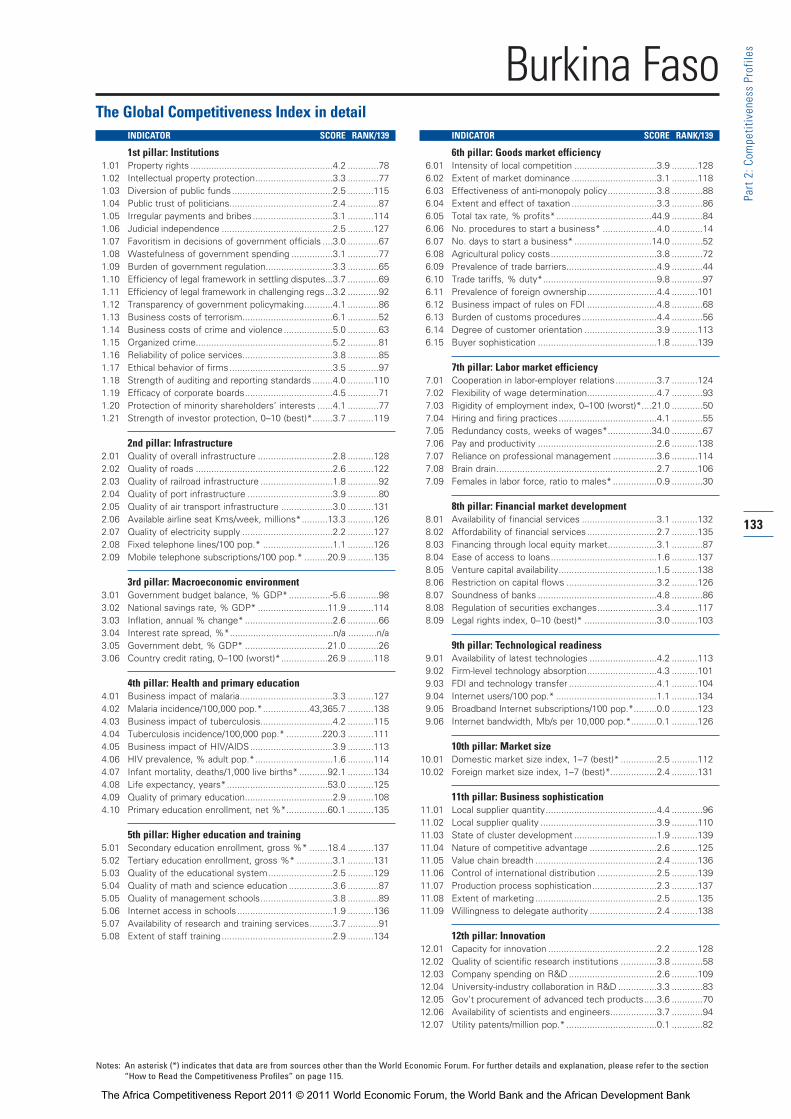
133
Part 2:C
ompe
titiven
ess Profile
s
The Global Competitiveness Index in detailINDICATOR SCORE RANK/139
1st pillar: Institutions1.01 Property rights .......................................................4.2 ............78
1.02 Intellectual property protection..............................3.3 ............77
1.03 Diversion of public funds.......................................2.5 ..........115
1.04 Public trust of politicians........................................2.4 ............87
1.05 Irregular payments and bribes...............................3.1 ..........114
1.06 Judicial independence ...........................................2.5 ..........127
1.07 Favoritism in decisions of government officials ....3.0 ............67
1.08 Wastefulness of government spending ................3.1 ............77
1.09 Burden of government regulation..........................3.3 ............65
1.10 Efficiency of legal framework in settling disputes...3.7 ............69
1.11 Efficiency of legal framework in challenging regs...3.2 ............92
1.12 Transparency of government policymaking...........4.1 ............86
1.13 Business costs of terrorism...................................6.1 ............52
1.14 Business costs of crime and violence...................5.0 ............63
1.15 Organized crime.....................................................5.2 ............81
1.16 Reliability of police services...................................3.8 ............85
1.17 Ethical behavior of firms........................................3.5 ............97
1.18 Strength of auditing and reporting standards........4.0 ..........110
1.19 Efficacy of corporate boards..................................4.5 ............71
1.20 Protection of minority shareholders’ interests ......4.1 ............77
1.21 Strength of investor protection, 0–10 (best)*........3.7 ..........119
2nd pillar: Infrastructure2.01 Quality of overall infrastructure .............................2.8 ..........128
2.02 Quality of roads .....................................................2.6 ..........122
2.03 Quality of railroad infrastructure ............................1.8 ............92
2.04 Quality of port infrastructure .................................3.9 ............80
2.05 Quality of air transport infrastructure ....................3.0 ..........131
2.06 Available airline seat Kms/week, millions*..........13.3 ..........126
2.07 Quality of electricity supply ...................................2.2 ..........127
2.08 Fixed telephone lines/100 pop.* ...........................1.1 ..........126
2.09 Mobile telephone subscriptions/100 pop.* .........20.9 ..........135
3rd pillar: Macroeconomic environment3.01 Government budget balance, % GDP* ................-5.6 ............98
3.02 National savings rate, % GDP* ...........................11.9 ..........114
3.03 Inflation, annual % change* ..................................2.6 ............66
3.04 Interest rate spread, %*........................................n/a ...........n/a
3.05 Government debt, % GDP* ................................21.0 ............26
3.06 Country credit rating, 0–100 (worst)*..................26.9 ..........118
4th pillar: Health and primary education4.01 Business impact of malaria....................................3.3 ..........127
4.02 Malaria incidence/100,000 pop.*..................43,365.7 ..........138
4.03 Business impact of tuberculosis............................4.2 ..........115
4.04 Tuberculosis incidence/100,000 pop.* ..............220.3 ..........111
4.05 Business impact of HIV/AIDS................................3.9 ..........113
4.06 HIV prevalence, % adult pop.*..............................1.6 ..........114
4.07 Infant mortality, deaths/1,000 live births* ...........92.1 ..........134
4.08 Life expectancy, years*.......................................53.0 ..........125
4.09 Quality of primary education..................................2.9 ..........108
4.10 Primary education enrollment, net %*................60.1 ..........135
5th pillar: Higher education and training5.01 Secondary education enrollment, gross %* .......18.4 ..........137
5.02 Tertiary education enrollment, gross %* ..............3.1 ..........131
5.03 Quality of the educational system.........................2.5 ..........129
5.04 Quality of math and science education .................3.6 ............87
5.05 Quality of management schools............................3.8 ............89
5.06 Internet access in schools .....................................1.9 ..........136
5.07 Availability of research and training services.........3.7 ............91
5.08 Extent of staff training ...........................................2.9 ..........134
INDICATOR SCORE RANK/139
6th pillar: Goods market efficiency6.01 Intensity of local competition ................................3.9 ..........128
6.02 Extent of market dominance .................................3.1 ..........118
6.03 Effectiveness of anti-monopoly policy...................3.8 ............88
6.04 Extent and effect of taxation .................................3.3 ............86
6.05 Total tax rate, % profits*.....................................44.9 ............84
6.06 No. procedures to start a business* .....................4.0 ............14
6.07 No. days to start a business*..............................14.0 ............52
6.08 Agricultural policy costs.........................................3.8 ............72
6.09 Prevalence of trade barriers...................................4.9 ............44
6.10 Trade tariffs, % duty*............................................9.8 ............97
6.11 Prevalence of foreign ownership...........................4.4 ..........101
6.12 Business impact of rules on FDI ...........................4.8 ............68
6.13 Burden of customs procedures.............................4.4 ............56
6.14 Degree of customer orientation ............................3.9 ..........113
6.15 Buyer sophistication ..............................................1.8 ..........139
7th pillar: Labor market efficiency7.01 Cooperation in labor-employer relations................3.7 ..........124
7.02 Flexibility of wage determination...........................4.7 ............93
7.03 Rigidity of employment index, 0–100 (worst)*....21.0 ............50
7.04 Hiring and firing practices......................................4.1 ............55
7.05 Redundancy costs, weeks of wages*.................34.0 ............67
7.06 Pay and productivity ..............................................2.6 ..........138
7.07 Reliance on professional management .................3.6 ..........114
7.08 Brain drain..............................................................2.7 ..........106
7.09 Females in labor force, ratio to males* .................0.9 ............30
8th pillar: Financial market development8.01 Availability of financial services .............................3.1 ..........132
8.02 Affordability of financial services ...........................2.7 ..........135
8.03 Financing through local equity market...................3.1 ............87
8.04 Ease of access to loans.........................................1.6 ..........137
8.05 Venture capital availability......................................1.5 ..........138
8.06 Restriction on capital flows ...................................3.2 ..........126
8.07 Soundness of banks ..............................................4.8 ............86
8.08 Regulation of securities exchanges.......................3.4 ..........117
8.09 Legal rights index, 0–10 (best)* ............................3.0 ..........103
9th pillar: Technological readiness9.01 Availability of latest technologies ..........................4.2 ..........113
9.02 Firm-level technology absorption...........................4.3 ..........101
9.03 FDI and technology transfer ..................................4.1 ..........104
9.04 Internet users/100 pop.* .......................................1.1 ..........134
9.05 Broadband Internet subscriptions/100 pop.*.........0.0 ..........123
9.06 Internet bandwidth, Mb/s per 10,000 pop.*..........0.1 ..........126
10th pillar: Market size10.01 Domestic market size index, 1–7 (best)* ..............2.5 ..........112
10.02 Foreign market size index, 1–7 (best)*..................2.4 ..........131
11th pillar: Business sophistication 11.01 Local supplier quantity...........................................4.4 ............96
11.02 Local supplier quality .............................................3.9 ..........110
11.03 State of cluster development ................................1.9 ..........139
11.04 Nature of competitive advantage ..........................2.6 ..........125
11.05 Value chain breadth ...............................................2.4 ..........136
11.06 Control of international distribution .......................2.5 ..........139
11.07 Production process sophistication.........................2.3 ..........137
11.08 Extent of marketing ...............................................2.5 ..........135
11.09 Willingness to delegate authority ..........................2.4 ..........138
12th pillar: Innovation12.01 Capacity for innovation ..........................................2.2 ..........128
12.02 Quality of scientific research institutions ..............3.8 ............58
12.03 Company spending on R&D ..................................2.6 ..........109
12.04 University-industry collaboration in R&D ...............3.3 ............83
12.05 Gov’t procurement of advanced tech products.....3.6 ............70
12.06 Availability of scientists and engineers..................3.7 ............94
12.07 Utility patents/million pop.* ...................................0.1 ............82
Burkina Faso
Notes: An asterisk (*) indicates that data are from sources other than the World Economic Forum. For further details and explanation, please refer to the section“How to Read the Competitiveness Profiles” on page 115.
The Africa Competitiveness Report 2011 © 2011 World Economic Forum, the World Bank and the African Development Bank

BurundiKey indicators, 2009
Population (millions)...................................................8.3GDP (US$ billions).......................................................1.3GDP per capita (US$) .............................................162.9GDP (PPP) as share (%) of world total .................0.01
Sectoral value-added (% GDP)Agriculture ..............................................................34.8Industry....................................................................20.0Services...................................................................45.1
Human Development Index, 2010Score, (0–1) best....................................................0.28Rank (out of 169 economies) ................................166
Sources: UNFPA, IMF, EIU, World Bank, UNDP.
Global Competitiveness Index
GCI 2010–2011.......................................................137 ......3.0GCI 2009–2010 (out of 133)................................................133 ........2.6GCI 2008–2009 (out of 134)................................................132 ........3.0
Basic requirements...........................................................135 ........3.21st pillar: Institutions .........................................................138 ........2.82nd pillar: Infrastructure...................................................132 ........2.23rd pillar: Macroeconomic environment .......................121 ........3.64th pillar: Health and primary education .......................120 ........4.4
Efficiency enhancers........................................................139 ........2.55th pillar: Higher education and training .......................139 ........2.06th pillar: Goods market efficiency.................................137 ........3.07th pillar: Labor market efficiency ....................................81 ........4.38th pillar: Financial market development.......................139 ........2.39th pillar: Technological readiness.................................137 ........2.310th pillar: Market size......................................................137 ........1.3
Innovation and sophistication factors ..........................138 ........2.611th pillar: Business sophistication................................138 ........2.812th pillar: Innovation........................................................134 ........2.3
The most problematic factors for doing business
Access to financing......................................................20.0
Corruption.......................................................................19.5
Policy instability.............................................................10.6
Tax regulations ..............................................................10.5
Tax rates ...........................................................................7.4
Inadequate supply of infrastructure ............................7.2
Inefficient government bureaucracy...........................5.8
Inflation .............................................................................5.0
Inadequately educated workforce...............................3.5
Crime and theft ................................................................2.8
Restrictive labor regulations.........................................2.5
Government instability/coups .......................................2.0
Foreign currency regulations........................................1.9
Poor work ethic in national labor force ......................1.1
Poor public health ...........................................................0.2
Rank Score(out of 139) (1–7)
134
Part 2:C
ompe
titiven
ess Profile
s
GDP (PPP) per capita (int'l $), 1980–2009
0 5 10 15 20 25 30
Percent of responses
Note: From a list of 15 factors, respondents were asked to select the five most problematic for doing business in their country and to rank them between 1 (most problematic) and 5. The bars in the figure show the responses weighted according to their rankings.
1 Transition1–2 2 Transition
2 –3
Factordriven
Efficiencydriven
Innovationdriven
3
Stage of development
Burundi Factor-driven economies
0
1,000
2,000
3,000
1980 1982 1984 1986 1988 1990 1992 1994 1996 1998 2000 2002 2004 20082006
Burundi Sub-Saharan Africa
The Africa Competitiveness Report 2011 © 2011 World Economic Forum, the World Bank and the African Development Bank

135
Part 2:C
ompe
titiven
ess Profile
s
The Global Competitiveness Index in detailINDICATOR SCORE RANK/139
1st pillar: Institutions1.01 Property rights .......................................................3.0 ..........127
1.02 Intellectual property protection..............................1.9 ..........138
1.03 Diversion of public funds.......................................1.8 ..........139
1.04 Public trust of politicians........................................1.9 ..........123
1.05 Irregular payments and bribes...............................2.6 ..........135
1.06 Judicial independence ...........................................1.9 ..........136
1.07 Favoritism in decisions of government officials ....2.5 ..........113
1.08 Wastefulness of government spending ................2.3 ..........125
1.09 Burden of government regulation..........................3.2 ............75
1.10 Efficiency of legal framework in settling disputes...2.9 ..........116
1.11 Efficiency of legal framework in challenging regs...2.6 ..........128
1.12 Transparency of government policymaking...........3.3 ..........134
1.13 Business costs of terrorism...................................4.3 ..........130
1.14 Business costs of crime and violence...................3.1 ..........129
1.15 Organized crime.....................................................3.9 ..........126
1.16 Reliability of police services...................................2.3 ..........135
1.17 Ethical behavior of firms........................................2.9 ..........132
1.18 Strength of auditing and reporting standards........2.9 ..........139
1.19 Efficacy of corporate boards..................................4.5 ............69
1.20 Protection of minority shareholders’ interests ......3.3 ..........129
1.21 Strength of investor protection, 0–10 (best)*........3.3 ..........123
2nd pillar: Infrastructure2.01 Quality of overall infrastructure .............................2.8 ..........126
2.02 Quality of roads .....................................................2.7 ..........120
2.03 Quality of railroad infrastructure ............................n/a ...........n/a
2.04 Quality of port infrastructure .................................3.0 ..........120
2.05 Quality of air transport infrastructure ....................3.3 ..........121
2.06 Available airline seat Kms/week, millions*............2.1 ..........137
2.07 Quality of electricity supply ...................................2.5 ..........123
2.08 Fixed telephone lines/100 pop.* ...........................0.4 ..........134
2.09 Mobile telephone subscriptions/100 pop.* .........10.1 ..........138
3rd pillar: Macroeconomic environment3.01 Government budget balance, % GDP* ................-4.0 ............69
3.02 National savings rate, % GDP* .............................8.5 ..........129
3.03 Inflation, annual % change* ................................11.3 ..........124
3.04 Interest rate spread, %*........................................8.9 ..........108
3.05 Government debt, % GDP* ................................28.3 ............43
3.06 Country credit rating, 0–100 (worst)*..................14.1 ..........136
4th pillar: Health and primary education4.01 Business impact of malaria....................................3.3 ..........125
4.02 Malaria incidence/100,000 pop.*..................27,784.8 ..........122
4.03 Business impact of tuberculosis............................4.1 ..........120
4.04 Tuberculosis incidence/100,000 pop.* ..............357.5 ..........126
4.05 Business impact of HIV/AIDS................................3.1 ..........129
4.06 HIV prevalence, % adult pop.*..............................2.0 ..........119
4.07 Infant mortality, deaths/1,000 live births* .........101.9 ..........136
4.08 Life expectancy, years*.......................................50.4 ..........129
4.09 Quality of primary education..................................2.3 ..........132
4.10 Primary education enrollment, net %*................99.4 ............12
5th pillar: Higher education and training5.01 Secondary education enrollment, gross %* .......17.9 ..........138
5.02 Tertiary education enrollment, gross %* ..............2.5 ..........133
5.03 Quality of the educational system.........................2.3 ..........134
5.04 Quality of math and science education .................3.1 ..........110
5.05 Quality of management schools............................2.9 ..........131
5.06 Internet access in schools .....................................1.6 ..........139
5.07 Availability of research and training services.........2.2 ..........138
5.08 Extent of staff training ...........................................2.9 ..........133
– INDICATOR SCORE RANK/139
6th pillar: Goods market efficiency6.01 Intensity of local competition ................................3.6 ..........135
6.02 Extent of market dominance .................................4.0 ............50
6.03 Effectiveness of anti-monopoly policy...................2.9 ..........134
6.04 Extent and effect of taxation .................................2.7 ..........127
6.05 Total tax rate, % profits*...................................278.6 ..........135
6.06 No. procedures to start a business* ...................11.0 ..........110
6.07 No. days to start a business*..............................32.0 ............98
6.08 Agricultural policy costs.........................................3.5 ..........111
6.09 Prevalence of trade barriers...................................3.6 ..........129
6.10 Trade tariffs, % duty*..........................................11.6 ..........112
6.11 Prevalence of foreign ownership...........................2.9 ..........138
6.12 Business impact of rules on FDI ...........................3.8 ..........117
6.13 Burden of customs procedures.............................3.0 ..........130
6.14 Degree of customer orientation ............................3.4 ..........135
6.15 Buyer sophistication ..............................................1.9 ..........138
7th pillar: Labor market efficiency7.01 Cooperation in labor-employer relations................3.6 ..........125
7.02 Flexibility of wage determination...........................5.7 ............16
7.03 Rigidity of employment index, 0–100 (worst)*....28.0 ............71
7.04 Hiring and firing practices......................................3.7 ............86
7.05 Redundancy costs, weeks of wages*.................26.0 ............48
7.06 Pay and productivity ..............................................3.0 ..........128
7.07 Reliance on professional management .................3.0 ..........136
7.08 Brain drain..............................................................2.1 ..........132
7.09 Females in labor force, ratio to males* .................1.0 ..............5
8th pillar: Financial market development8.01 Availability of financial services .............................2.9 ..........135
8.02 Affordability of financial services ...........................2.8 ..........134
8.03 Financing through local equity market...................1.5 ..........138
8.04 Ease of access to loans.........................................1.6 ..........135
8.05 Venture capital availability......................................1.5 ..........139
8.06 Restriction on capital flows ...................................2.7 ..........135
8.07 Soundness of banks ..............................................3.5 ..........134
8.08 Regulation of securities exchanges.......................1.9 ..........139
8.09 Legal rights index, 0–10 (best)* ............................2.0 ..........129
9th pillar: Technological readiness9.01 Availability of latest technologies ..........................3.5 ..........137
9.02 Firm-level technology absorption...........................3.6 ..........136
9.03 FDI and technology transfer ..................................3.7 ..........126
9.04 Internet users/100 pop.* .......................................0.8 ..........135
9.05 Broadband Internet subscriptions/100 pop.*.........0.0 ..........137
9.06 Internet bandwidth, Mb/s per 10,000 pop.*..........0.0 ..........137
10th pillar: Market size10.01 Domestic market size index, 1–7 (best)* ..............1.4 ..........137
10.02 Foreign market size index, 1–7 (best)*..................1.1 ..........138
11th pillar: Business sophistication 11.01 Local supplier quantity...........................................4.3 ..........102
11.02 Local supplier quality .............................................3.6 ..........128
11.03 State of cluster development ................................2.2 ..........138
11.04 Nature of competitive advantage ..........................2.6 ..........127
11.05 Value chain breadth ...............................................2.5 ..........133
11.06 Control of international distribution .......................2.9 ..........136
11.07 Production process sophistication.........................2.2 ..........139
11.08 Extent of marketing ...............................................2.3 ..........138
11.09 Willingness to delegate authority ..........................2.4 ..........136
12th pillar: Innovation12.01 Capacity for innovation ..........................................2.0 ..........137
12.02 Quality of scientific research institutions ..............2.5 ..........129
12.03 Company spending on R&D ..................................2.3 ..........134
12.04 University-industry collaboration in R&D ...............2.8 ..........127
12.05 Gov’t procurement of advanced tech products.....2.7 ..........128
12.06 Availability of scientists and engineers..................3.5 ..........106
12.07 Utility patents/million pop.* ...................................0.0 ............90
Burundi
Notes: An asterisk (*) indicates that data are from sources other than the World Economic Forum. For further details and explanation, please refer to the section“How to Read the Competitiveness Profiles” on page 115.
The Africa Competitiveness Report 2011 © 2011 World Economic Forum, the World Bank and the African Development Bank
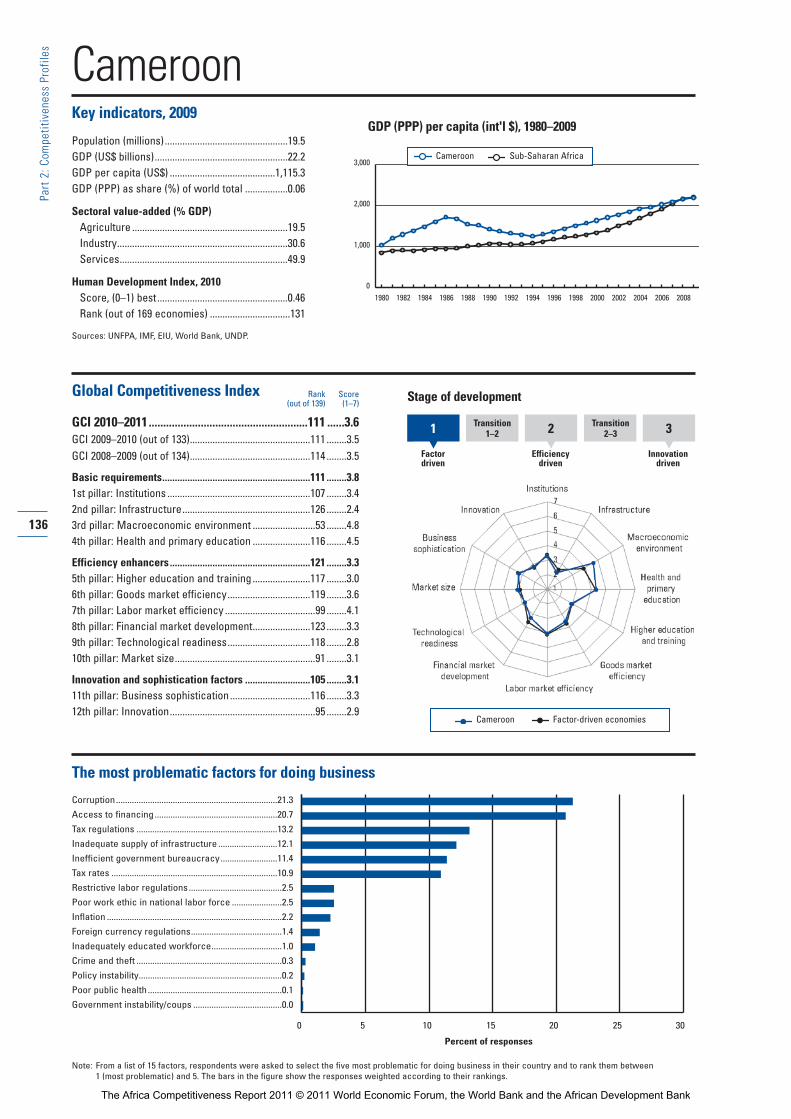
CameroonKey indicators, 2009
Population (millions).................................................19.5GDP (US$ billions).....................................................22.2GDP per capita (US$) ..........................................1,115.3GDP (PPP) as share (%) of world total .................0.06
Sectoral value-added (% GDP)Agriculture ..............................................................19.5Industry....................................................................30.6Services...................................................................49.9
Human Development Index, 2010Score, (0–1) best....................................................0.46Rank (out of 169 economies) ................................131
Sources: UNFPA, IMF, EIU, World Bank, UNDP.
Global Competitiveness Index
GCI 2010–2011.......................................................111 ......3.6GCI 2009–2010 (out of 133)................................................111 ........3.5GCI 2008–2009 (out of 134)................................................114 ........3.5
Basic requirements...........................................................111 ........3.81st pillar: Institutions .........................................................107 ........3.42nd pillar: Infrastructure...................................................126 ........2.43rd pillar: Macroeconomic environment .........................53 ........4.84th pillar: Health and primary education .......................116 ........4.5
Efficiency enhancers........................................................121 ........3.35th pillar: Higher education and training .......................117 ........3.06th pillar: Goods market efficiency.................................119 ........3.67th pillar: Labor market efficiency ....................................99 ........4.18th pillar: Financial market development.......................123 ........3.39th pillar: Technological readiness.................................118 ........2.810th pillar: Market size........................................................91 ........3.1
Innovation and sophistication factors ..........................105 ........3.111th pillar: Business sophistication................................116 ........3.312th pillar: Innovation..........................................................95 ........2.9
The most problematic factors for doing business
Corruption.......................................................................21.3
Access to financing......................................................20.7
Tax regulations ..............................................................13.2
Inadequate supply of infrastructure ..........................12.1
Inefficient government bureaucracy.........................11.4
Tax rates .........................................................................10.9
Restrictive labor regulations.........................................2.5
Poor work ethic in national labor force ......................2.5
Inflation .............................................................................2.2
Foreign currency regulations........................................1.4
Inadequately educated workforce...............................1.0
Crime and theft ................................................................0.3
Policy instability...............................................................0.2
Poor public health ...........................................................0.1
Government instability/coups .......................................0.0
Rank Score(out of 139) (1–7)
136
Part 2:C
ompe
titiven
ess Profile
s
GDP (PPP) per capita (int'l $), 1980–2009
0 5 10 15 20 25 30
Percent of responses
Note: From a list of 15 factors, respondents were asked to select the five most problematic for doing business in their country and to rank them between 1 (most problematic) and 5. The bars in the figure show the responses weighted according to their rankings.
1 Transition1–2 2 Transition
2 –3
Factordriven
Efficiencydriven
Innovationdriven
3
Stage of development
Cameroon Factor-driven economies
0
1,000
2,000
3,000
1980 1982 1984 1986 1988 1990 1992 1994 1996 1998 2000 2002 2004 20082006
Cameroon Sub-Saharan Africa
The Africa Competitiveness Report 2011 © 2011 World Economic Forum, the World Bank and the African Development Bank
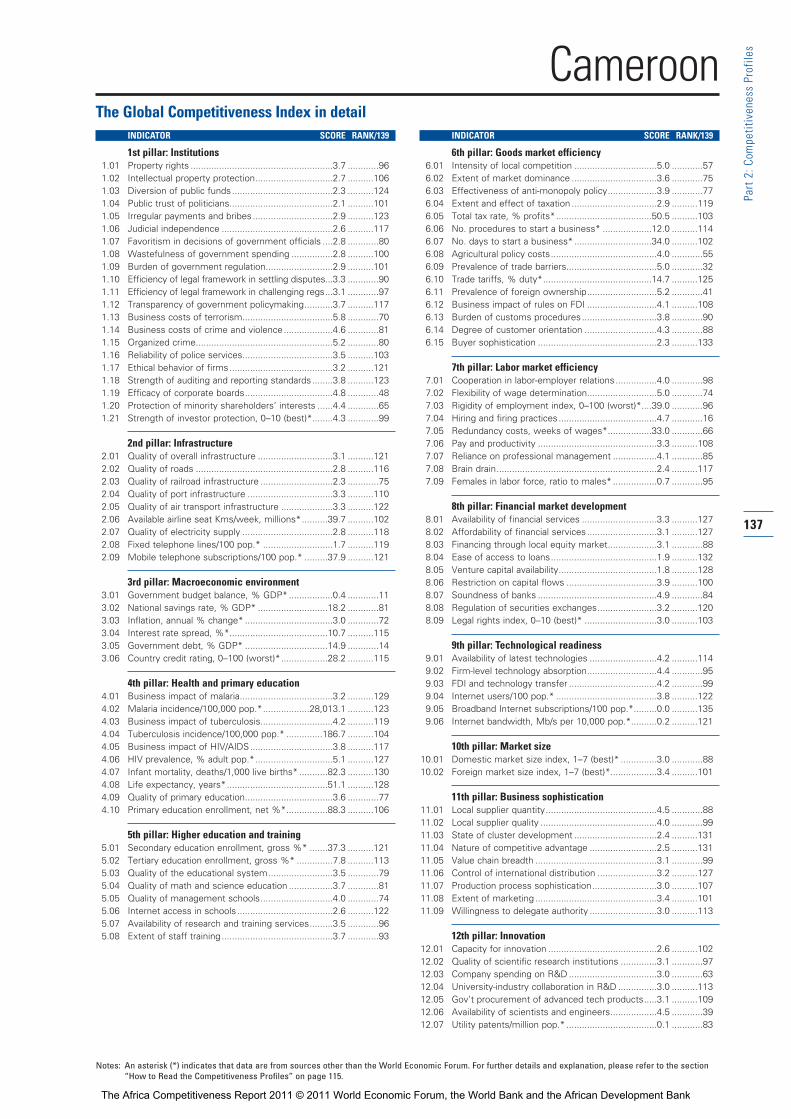
137
Part 2:C
ompe
titiven
ess Profile
s
The Global Competitiveness Index in detailINDICATOR SCORE RANK/139
1st pillar: Institutions1.01 Property rights .......................................................3.7 ............96
1.02 Intellectual property protection..............................2.7 ..........106
1.03 Diversion of public funds.......................................2.3 ..........124
1.04 Public trust of politicians........................................2.1 ..........101
1.05 Irregular payments and bribes...............................2.9 ..........123
1.06 Judicial independence ...........................................2.6 ..........117
1.07 Favoritism in decisions of government officials ....2.8 ............80
1.08 Wastefulness of government spending ................2.8 ..........100
1.09 Burden of government regulation..........................2.9 ..........101
1.10 Efficiency of legal framework in settling disputes...3.3 ............90
1.11 Efficiency of legal framework in challenging regs...3.1 ............97
1.12 Transparency of government policymaking...........3.7 ..........117
1.13 Business costs of terrorism...................................5.8 ............70
1.14 Business costs of crime and violence...................4.6 ............81
1.15 Organized crime.....................................................5.2 ............80
1.16 Reliability of police services...................................3.5 ..........103
1.17 Ethical behavior of firms........................................3.2 ..........121
1.18 Strength of auditing and reporting standards........3.8 ..........123
1.19 Efficacy of corporate boards..................................4.8 ............48
1.20 Protection of minority shareholders’ interests ......4.4 ............65
1.21 Strength of investor protection, 0–10 (best)*........4.3 ............99
2nd pillar: Infrastructure2.01 Quality of overall infrastructure .............................3.1 ..........121
2.02 Quality of roads .....................................................2.8 ..........116
2.03 Quality of railroad infrastructure ............................2.3 ............75
2.04 Quality of port infrastructure .................................3.3 ..........110
2.05 Quality of air transport infrastructure ....................3.3 ..........122
2.06 Available airline seat Kms/week, millions*..........39.7 ..........102
2.07 Quality of electricity supply ...................................2.8 ..........118
2.08 Fixed telephone lines/100 pop.* ...........................1.7 ..........119
2.09 Mobile telephone subscriptions/100 pop.* .........37.9 ..........121
3rd pillar: Macroeconomic environment3.01 Government budget balance, % GDP* .................0.4 ............11
3.02 National savings rate, % GDP* ...........................18.2 ............81
3.03 Inflation, annual % change* ..................................3.0 ............72
3.04 Interest rate spread, %*......................................10.7 ..........115
3.05 Government debt, % GDP* ................................14.9 ............14
3.06 Country credit rating, 0–100 (worst)*..................28.2 ..........115
4th pillar: Health and primary education4.01 Business impact of malaria....................................3.2 ..........129
4.02 Malaria incidence/100,000 pop.*..................28,013.1 ..........123
4.03 Business impact of tuberculosis............................4.2 ..........119
4.04 Tuberculosis incidence/100,000 pop.* ..............186.7 ..........104
4.05 Business impact of HIV/AIDS................................3.8 ..........117
4.06 HIV prevalence, % adult pop.*..............................5.1 ..........127
4.07 Infant mortality, deaths/1,000 live births* ...........82.3 ..........130
4.08 Life expectancy, years*.......................................51.1 ..........128
4.09 Quality of primary education..................................3.6 ............77
4.10 Primary education enrollment, net %*................88.3 ..........106
5th pillar: Higher education and training5.01 Secondary education enrollment, gross %* .......37.3 ..........121
5.02 Tertiary education enrollment, gross %* ..............7.8 ..........113
5.03 Quality of the educational system.........................3.5 ............79
5.04 Quality of math and science education .................3.7 ............81
5.05 Quality of management schools............................4.0 ............74
5.06 Internet access in schools .....................................2.6 ..........122
5.07 Availability of research and training services.........3.5 ............96
5.08 Extent of staff training ...........................................3.7 ............93
INDICATOR SCORE RANK/139
6th pillar: Goods market efficiency6.01 Intensity of local competition ................................5.0 ............57
6.02 Extent of market dominance .................................3.6 ............75
6.03 Effectiveness of anti-monopoly policy...................3.9 ............77
6.04 Extent and effect of taxation .................................2.9 ..........119
6.05 Total tax rate, % profits*.....................................50.5 ..........103
6.06 No. procedures to start a business* ...................12.0 ..........114
6.07 No. days to start a business*..............................34.0 ..........102
6.08 Agricultural policy costs.........................................4.0 ............55
6.09 Prevalence of trade barriers...................................5.0 ............32
6.10 Trade tariffs, % duty*..........................................14.7 ..........125
6.11 Prevalence of foreign ownership...........................5.2 ............41
6.12 Business impact of rules on FDI ...........................4.1 ..........108
6.13 Burden of customs procedures.............................3.8 ............90
6.14 Degree of customer orientation ............................4.3 ............88
6.15 Buyer sophistication ..............................................2.3 ..........133
7th pillar: Labor market efficiency7.01 Cooperation in labor-employer relations................4.0 ............98
7.02 Flexibility of wage determination...........................5.0 ............74
7.03 Rigidity of employment index, 0–100 (worst)*....39.0 ............96
7.04 Hiring and firing practices......................................4.7 ............16
7.05 Redundancy costs, weeks of wages*.................33.0 ............66
7.06 Pay and productivity ..............................................3.3 ..........108
7.07 Reliance on professional management .................4.1 ............85
7.08 Brain drain..............................................................2.4 ..........117
7.09 Females in labor force, ratio to males* .................0.7 ............95
8th pillar: Financial market development8.01 Availability of financial services .............................3.3 ..........127
8.02 Affordability of financial services ...........................3.1 ..........127
8.03 Financing through local equity market...................3.1 ............88
8.04 Ease of access to loans.........................................1.9 ..........132
8.05 Venture capital availability......................................1.8 ..........128
8.06 Restriction on capital flows ...................................3.9 ..........100
8.07 Soundness of banks ..............................................4.9 ............84
8.08 Regulation of securities exchanges.......................3.2 ..........120
8.09 Legal rights index, 0–10 (best)* ............................3.0 ..........103
9th pillar: Technological readiness9.01 Availability of latest technologies ..........................4.2 ..........114
9.02 Firm-level technology absorption...........................4.4 ............95
9.03 FDI and technology transfer ..................................4.2 ............99
9.04 Internet users/100 pop.* .......................................3.8 ..........122
9.05 Broadband Internet subscriptions/100 pop.*.........0.0 ..........135
9.06 Internet bandwidth, Mb/s per 10,000 pop.*..........0.2 ..........121
10th pillar: Market size10.01 Domestic market size index, 1–7 (best)* ..............3.0 ............88
10.02 Foreign market size index, 1–7 (best)*..................3.4 ..........101
11th pillar: Business sophistication 11.01 Local supplier quantity...........................................4.5 ............88
11.02 Local supplier quality .............................................4.0 ............99
11.03 State of cluster development ................................2.4 ..........131
11.04 Nature of competitive advantage ..........................2.5 ..........131
11.05 Value chain breadth ...............................................3.1 ............99
11.06 Control of international distribution .......................3.2 ..........127
11.07 Production process sophistication.........................3.0 ..........107
11.08 Extent of marketing ...............................................3.4 ..........101
11.09 Willingness to delegate authority ..........................3.0 ..........113
12th pillar: Innovation12.01 Capacity for innovation ..........................................2.6 ..........102
12.02 Quality of scientific research institutions ..............3.1 ............97
12.03 Company spending on R&D ..................................3.0 ............63
12.04 University-industry collaboration in R&D ...............3.0 ..........113
12.05 Gov’t procurement of advanced tech products.....3.1 ..........109
12.06 Availability of scientists and engineers..................4.5 ............39
12.07 Utility patents/million pop.* ...................................0.1 ............83
Cameroon
Notes: An asterisk (*) indicates that data are from sources other than the World Economic Forum. For further details and explanation, please refer to the section“How to Read the Competitiveness Profiles” on page 115.
The Africa Competitiveness Report 2011 © 2011 World Economic Forum, the World Bank and the African Development Bank
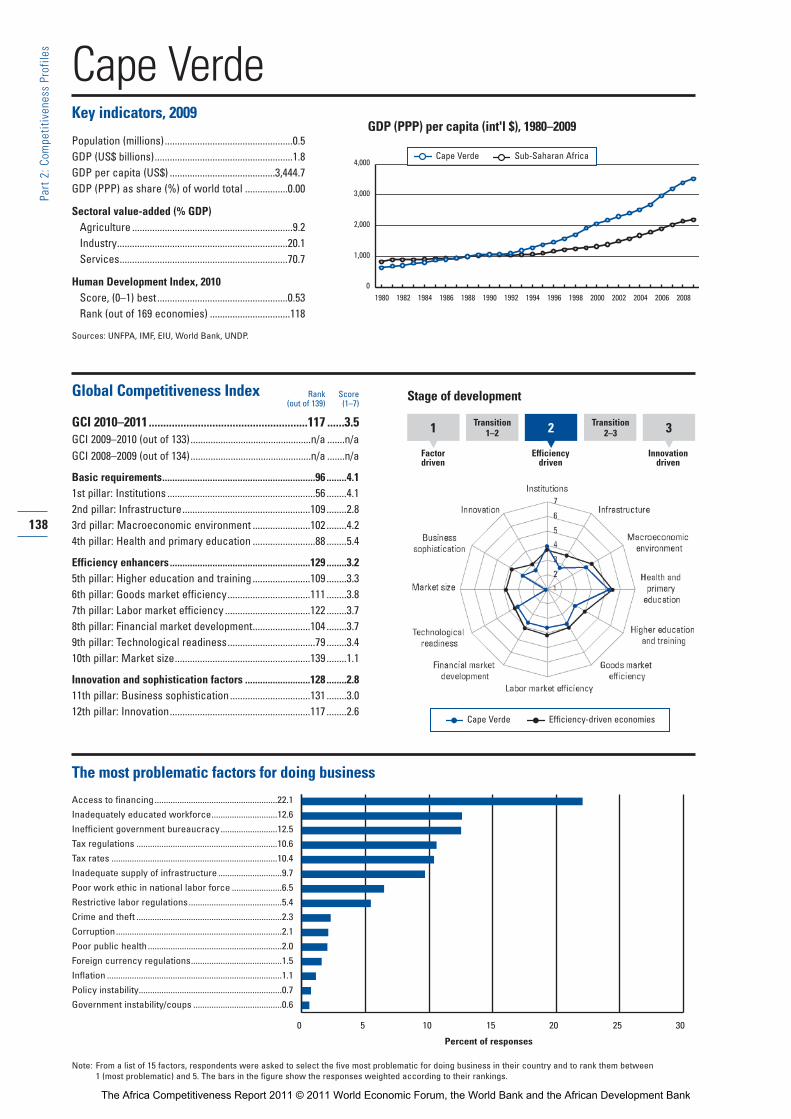
Cape VerdeKey indicators, 2009
Population (millions)...................................................0.5GDP (US$ billions).......................................................1.8GDP per capita (US$) ..........................................3,444.7GDP (PPP) as share (%) of world total .................0.00
Sectoral value-added (% GDP)Agriculture ................................................................9.2Industry....................................................................20.1Services...................................................................70.7
Human Development Index, 2010Score, (0–1) best....................................................0.53Rank (out of 169 economies) ................................118
Sources: UNFPA, IMF, EIU, World Bank, UNDP.
Global Competitiveness Index
GCI 2010–2011.......................................................117 ......3.5GCI 2009–2010 (out of 133)................................................n/a .......n/aGCI 2008–2009 (out of 134)................................................n/a .......n/a
Basic requirements.............................................................96 ........4.11st pillar: Institutions ...........................................................56 ........4.12nd pillar: Infrastructure...................................................109 ........2.83rd pillar: Macroeconomic environment .......................102 ........4.24th pillar: Health and primary education .........................88 ........5.4
Efficiency enhancers........................................................129 ........3.25th pillar: Higher education and training .......................109 ........3.36th pillar: Goods market efficiency.................................111 ........3.87th pillar: Labor market efficiency ..................................122 ........3.78th pillar: Financial market development.......................104 ........3.79th pillar: Technological readiness...................................79 ........3.410th pillar: Market size......................................................139 ........1.1
Innovation and sophistication factors ..........................128 ........2.811th pillar: Business sophistication................................131 ........3.012th pillar: Innovation........................................................117 ........2.6
The most problematic factors for doing business
Access to financing......................................................22.1
Inadequately educated workforce.............................12.6
Inefficient government bureaucracy.........................12.5
Tax regulations ..............................................................10.6
Tax rates .........................................................................10.4
Inadequate supply of infrastructure ............................9.7
Poor work ethic in national labor force ......................6.5
Restrictive labor regulations.........................................5.4
Crime and theft ................................................................2.3
Corruption.........................................................................2.1
Poor public health ...........................................................2.0
Foreign currency regulations........................................1.5
Inflation .............................................................................1.1
Policy instability...............................................................0.7
Government instability/coups .......................................0.6
Rank Score(out of 139) (1–7)
138
Part 2:C
ompe
titiven
ess Profile
s
GDP (PPP) per capita (int'l $), 1980–2009
0 5 10 15 20 25 30
Percent of responses
Note: From a list of 15 factors, respondents were asked to select the five most problematic for doing business in their country and to rank them between 1 (most problematic) and 5. The bars in the figure show the responses weighted according to their rankings.
1 Transition1–2 2 Transition
2 –3
Factordriven
Efficiencydriven
Innovationdriven
3
Stage of development
0
1,000
2,000
3,000
4,000
1980 1982 1984 1986 1988 1990 1992 1994 1996 1998 2000 2002 2004 20082006
Cape Verde Sub-Saharan Africa
Cape Verde Efficiency-driven economies
The Africa Competitiveness Report 2011 © 2011 World Economic Forum, the World Bank and the African Development Bank

139
Part 2:C
ompe
titiven
ess Profile
s
The Global Competitiveness Index in detailINDICATOR SCORE RANK/139
1st pillar: Institutions1.01 Property rights .......................................................3.7 ..........100
1.02 Intellectual property protection..............................2.5 ..........127
1.03 Diversion of public funds.......................................4.5 ............39
1.04 Public trust of politicians........................................4.2 ............24
1.05 Irregular payments and bribes...............................4.8 ............45
1.06 Judicial independence ...........................................4.1 ............58
1.07 Favoritism in decisions of government officials ....3.5 ............43
1.08 Wastefulness of government spending ................3.6 ............43
1.09 Burden of government regulation..........................3.3 ............67
1.10 Efficiency of legal framework in settling disputes...3.4 ............82
1.11 Efficiency of legal framework in challenging regs...3.2 ............88
1.12 Transparency of government policymaking...........4.6 ............50
1.13 Business costs of terrorism...................................5.7 ............72
1.14 Business costs of crime and violence...................4.3 ............96
1.15 Organized crime.....................................................4.8 ............93
1.16 Reliability of police services...................................4.3 ............63
1.17 Ethical behavior of firms........................................4.6 ............44
1.18 Strength of auditing and reporting standards........4.2 ............99
1.19 Efficacy of corporate boards..................................4.1 ..........116
1.20 Protection of minority shareholders’ interests ......4.1 ............75
1.21 Strength of investor protection, 0–10 (best)*........4.0 ..........109
2nd pillar: Infrastructure2.01 Quality of overall infrastructure .............................3.5 ............99
2.02 Quality of roads .....................................................3.9 ............68
2.03 Quality of railroad infrastructure ............................n/a ...........n/a
2.04 Quality of port infrastructure .................................3.5 ..........102
2.05 Quality of air transport infrastructure ....................4.3 ............82
2.06 Available airline seat Kms/week, millions*..........28.9 ..........107
2.07 Quality of electricity supply ...................................1.8 ..........131
2.08 Fixed telephone lines/100 pop.* .........................14.3 ............85
2.09 Mobile telephone subscriptions/100 pop.* .........77.5 ............91
3rd pillar: Macroeconomic environment3.01 Government budget balance, % GDP* ................-6.0 ..........103
3.02 National savings rate, % GDP* ...........................18.1 ............82
3.03 Inflation, annual % change* ..................................1.2 ............39
3.04 Interest rate spread, %*........................................7.0 ............89
3.05 Government debt, % GDP* ................................60.5 ..........104
3.06 Country credit rating, 0–100 (worst)*..................33.8 ............94
4th pillar: Health and primary education4.01 Business impact of malaria....................................5.1 ..........100
4.02 Malaria incidence/100,000 pop.*.........................11.8 ............82
4.03 Business impact of tuberculosis............................5.0 ............92
4.04 Tuberculosis incidence/100,000 pop.* ..............149.2 ............98
4.05 Business impact of HIV/AIDS................................5.0 ............85
4.06 HIV prevalence, % adult pop.*..............................0.8 ............97
4.07 Infant mortality, deaths/1,000 live births* ...........24.2 ............87
4.08 Life expectancy, years*.......................................71.0 ............90
4.09 Quality of primary education..................................3.9 ............69
4.10 Primary education enrollment, net %*................84.4 ..........114
5th pillar: Higher education and training5.01 Secondary education enrollment, gross %* .......67.7 ..........101
5.02 Tertiary education enrollment, gross %* ............11.9 ..........103
5.03 Quality of the educational system.........................3.8 ............65
5.04 Quality of math and science education .................3.4 ............97
5.05 Quality of management schools............................3.3 ..........121
5.06 Internet access in schools .....................................3.4 ............90
5.07 Availability of research and training services.........2.9 ..........129
5.08 Extent of staff training ...........................................3.3 ..........120
INDICATOR SCORE RANK/139
6th pillar: Goods market efficiency6.01 Intensity of local competition ................................4.0 ..........121
6.02 Extent of market dominance .................................3.4 ............84
6.03 Effectiveness of anti-monopoly policy...................3.9 ............74
6.04 Extent and effect of taxation .................................3.2 ............94
6.05 Total tax rate, % profits*.....................................49.7 ..........100
6.06 No. procedures to start a business* .....................9.0 ............88
6.07 No. days to start a business*..............................24.0 ............79
6.08 Agricultural policy costs.........................................3.8 ............66
6.09 Prevalence of trade barriers...................................3.7 ..........125
6.10 Trade tariffs, % duty*..........................................10.6 ..........103
6.11 Prevalence of foreign ownership...........................4.8 ............67
6.12 Business impact of rules on FDI ...........................4.7 ............72
6.13 Burden of customs procedures.............................3.1 ..........127
6.14 Degree of customer orientation ............................3.4 ..........136
6.15 Buyer sophistication ..............................................3.0 ..........100
7th pillar: Labor market efficiency7.01 Cooperation in labor-employer relations................4.1 ............92
7.02 Flexibility of wage determination...........................5.4 ............46
7.03 Rigidity of employment index, 0–100 (worst)*....46.0 ..........114
7.04 Hiring and firing practices......................................3.3 ..........109
7.05 Redundancy costs, weeks of wages*.................93.0 ..........119
7.06 Pay and productivity ..............................................3.1 ..........117
7.07 Reliance on professional management .................3.6 ..........109
7.08 Brain drain..............................................................3.2 ............75
7.09 Females in labor force, ratio to males* .................0.7 ..........102
8th pillar: Financial market development8.01 Availability of financial services .............................3.7 ..........113
8.02 Affordability of financial services ...........................3.7 ............98
8.03 Financing through local equity market...................3.8 ............55
8.04 Ease of access to loans.........................................2.3 ..........103
8.05 Venture capital availability......................................2.1 ..........115
8.06 Restriction on capital flows ...................................4.3 ............78
8.07 Soundness of banks ..............................................5.4 ............54
8.08 Regulation of securities exchanges.......................4.5 ............51
8.09 Legal rights index, 0–10 (best)* ............................2.0 ..........129
9th pillar: Technological readiness9.01 Availability of latest technologies ..........................5.0 ............72
9.02 Firm-level technology absorption...........................4.9 ............63
9.03 FDI and technology transfer ..................................4.7 ............69
9.04 Internet users/100 pop.* .....................................29.7 ............75
9.05 Broadband Internet subscriptions/100 pop.*.........1.4 ............90
9.06 Internet bandwidth, Mb/s per 10,000 pop.*..........3.1 ............88
10th pillar: Market size10.01 Domestic market size index, 1–7 (best)* ..............1.0 ..........139
10.02 Foreign market size index, 1–7 (best)*..................1.3 ..........137
11th pillar: Business sophistication 11.01 Local supplier quantity...........................................3.9 ..........128
11.02 Local supplier quality .............................................3.5 ..........130
11.03 State of cluster development ................................2.3 ..........134
11.04 Nature of competitive advantage ..........................3.4 ............62
11.05 Value chain breadth ...............................................2.2 ..........137
11.06 Control of international distribution .......................3.0 ..........134
11.07 Production process sophistication.........................2.9 ..........113
11.08 Extent of marketing ...............................................3.2 ..........113
11.09 Willingness to delegate authority ..........................2.7 ..........132
12th pillar: Innovation12.01 Capacity for innovation ..........................................2.0 ..........135
12.02 Quality of scientific research institutions ..............2.6 ..........121
12.03 Company spending on R&D ..................................2.1 ..........136
12.04 University-industry collaboration in R&D ...............3.3 ............89
12.05 Gov’t procurement of advanced tech products.....4.0 ............46
12.06 Availability of scientists and engineers..................3.5 ..........107
12.07 Utility patents/million pop.* ...................................0.0 ............90
Cape Verde
Notes: An asterisk (*) indicates that data are from sources other than the World Economic Forum. For further details and explanation, please refer to the section“How to Read the Competitiveness Profiles” on page 115.
The Africa Competitiveness Report 2011 © 2011 World Economic Forum, the World Bank and the African Development Bank
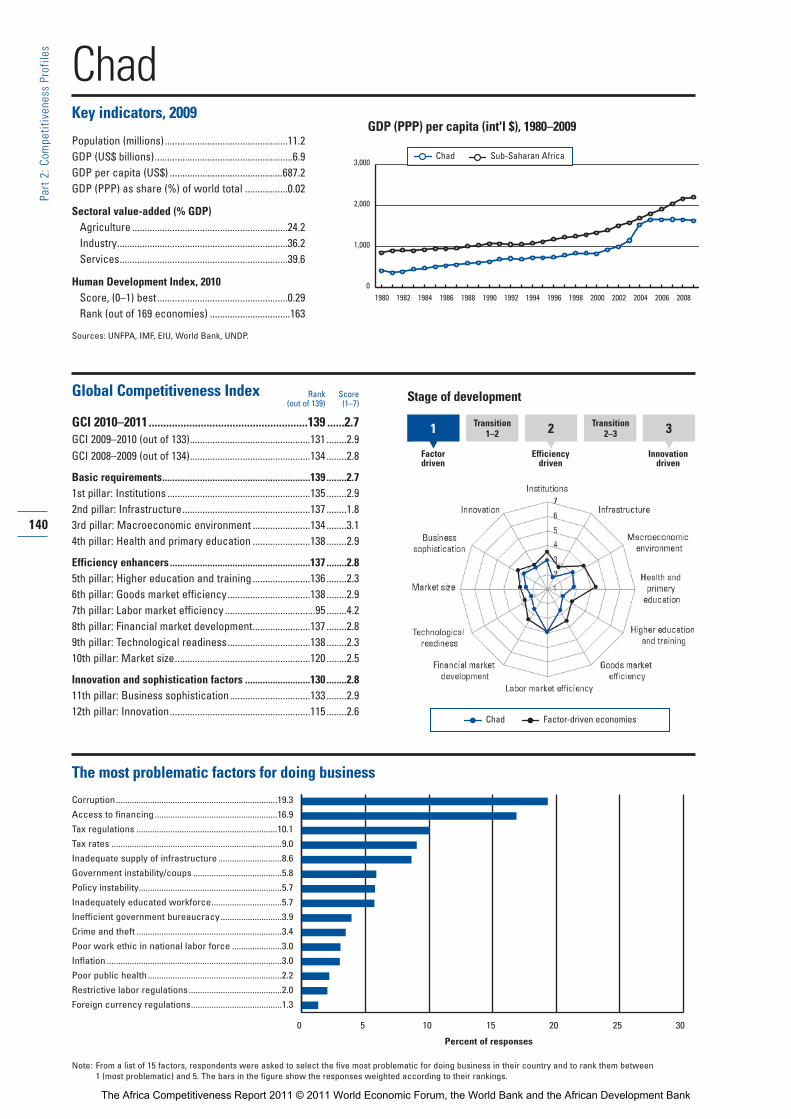
ChadKey indicators, 2009
Population (millions).................................................11.2GDP (US$ billions).......................................................6.9GDP per capita (US$) .............................................687.2GDP (PPP) as share (%) of world total .................0.02
Sectoral value-added (% GDP)Agriculture ..............................................................24.2Industry....................................................................36.2Services...................................................................39.6
Human Development Index, 2010Score, (0–1) best....................................................0.29Rank (out of 169 economies) ................................163
Sources: UNFPA, IMF, EIU, World Bank, UNDP.
Global Competitiveness Index
GCI 2010–2011.......................................................139 ......2.7GCI 2009–2010 (out of 133)................................................131 ........2.9GCI 2008–2009 (out of 134)................................................134 ........2.8
Basic requirements...........................................................139 ........2.71st pillar: Institutions .........................................................135 ........2.92nd pillar: Infrastructure...................................................137 ........1.83rd pillar: Macroeconomic environment .......................134 ........3.14th pillar: Health and primary education .......................138 ........2.9
Efficiency enhancers........................................................137 ........2.85th pillar: Higher education and training .......................136 ........2.36th pillar: Goods market efficiency.................................138 ........2.97th pillar: Labor market efficiency ....................................95 ........4.28th pillar: Financial market development.......................137 ........2.89th pillar: Technological readiness.................................138 ........2.310th pillar: Market size......................................................120 ........2.5
Innovation and sophistication factors ..........................130 ........2.811th pillar: Business sophistication................................133 ........2.912th pillar: Innovation........................................................115 ........2.6
The most problematic factors for doing business
Corruption.......................................................................19.3
Access to financing......................................................16.9
Tax regulations ..............................................................10.1
Tax rates ...........................................................................9.0
Inadequate supply of infrastructure ............................8.6
Government instability/coups .......................................5.8
Policy instability...............................................................5.7
Inadequately educated workforce...............................5.7
Inefficient government bureaucracy...........................3.9
Crime and theft ................................................................3.4
Poor work ethic in national labor force ......................3.0
Inflation .............................................................................3.0
Poor public health ...........................................................2.2
Restrictive labor regulations.........................................2.0
Foreign currency regulations........................................1.3
Rank Score(out of 139) (1–7)
140
Part 2:C
ompe
titiven
ess Profile
s
GDP (PPP) per capita (int'l $), 1980–2009
0 5 10 15 20 25 30
Percent of responses
Note: From a list of 15 factors, respondents were asked to select the five most problematic for doing business in their country and to rank them between 1 (most problematic) and 5. The bars in the figure show the responses weighted according to their rankings.
1 Transition1–2 2 Transition
2 –3
Factordriven
Efficiencydriven
Innovationdriven
3
Stage of development
Chad Factor-driven economies
0
1,000
2,000
3,000
1980 1982 1984 1986 1988 1990 1992 1994 1996 1998 2000 2002 2004 20082006
Chad Sub-Saharan Africa
The Africa Competitiveness Report 2011 © 2011 World Economic Forum, the World Bank and the African Development Bank

141
Part 2:C
ompe
titiven
ess Profile
s
The Global Competitiveness Index in detailINDICATOR SCORE RANK/139
1st pillar: Institutions1.01 Property rights .......................................................2.4 ..........136
1.02 Intellectual property protection..............................2.3 ..........131
1.03 Diversion of public funds.......................................2.0 ..........133
1.04 Public trust of politicians........................................1.9 ..........117
1.05 Irregular payments and bribes...............................2.5 ..........138
1.06 Judicial independence ...........................................2.7 ..........116
1.07 Favoritism in decisions of government officials ....2.7 ............97
1.08 Wastefulness of government spending ................2.5 ..........111
1.09 Burden of government regulation..........................2.9 ..........100
1.10 Efficiency of legal framework in settling disputes...2.9 ..........119
1.11 Efficiency of legal framework in challenging regs...3.0 ..........105
1.12 Transparency of government policymaking...........2.8 ..........138
1.13 Business costs of terrorism...................................4.8 ..........114
1.14 Business costs of crime and violence...................3.8 ..........114
1.15 Organized crime.....................................................3.8 ..........129
1.16 Reliability of police services...................................2.6 ..........131
1.17 Ethical behavior of firms........................................3.1 ..........128
1.18 Strength of auditing and reporting standards........3.4 ..........134
1.19 Efficacy of corporate boards..................................3.8 ..........132
1.20 Protection of minority shareholders’ interests ......3.7 ..........110
1.21 Strength of investor protection, 0–10 (best)*........4.0 ..........109
2nd pillar: Infrastructure2.01 Quality of overall infrastructure .............................2.5 ..........131
2.02 Quality of roads .....................................................2.4 ..........126
2.03 Quality of railroad infrastructure ............................n/a ...........n/a
2.04 Quality of port infrastructure .................................2.6 ..........133
2.05 Quality of air transport infrastructure ....................2.8 ..........136
2.06 Available airline seat Kms/week, millions*............7.7 ..........129
2.07 Quality of electricity supply ...................................1.5 ..........137
2.08 Fixed telephone lines/100 pop.* ...........................0.1 ..........139
2.09 Mobile telephone subscriptions/100 pop.* .........24.0 ..........133
3rd pillar: Macroeconomic environment3.01 Government budget balance, % GDP* ..............-10.8 ..........131
3.02 National savings rate, % GDP* .............................9.2 ..........125
3.03 Inflation, annual % change* ................................10.1 ..........120
3.04 Interest rate spread, %*......................................11.7 ..........119
3.05 Government debt, % GDP* ................................22.3 ............31
3.06 Country credit rating, 0–100 (worst)*..................12.8 ..........137
4th pillar: Health and primary education4.01 Business impact of malaria....................................2.6 ..........137
4.02 Malaria incidence/100,000 pop.*..................39,920.4 ..........137
4.03 Business impact of tuberculosis............................3.2 ..........134
4.04 Tuberculosis incidence/100,000 pop.* ..............291.0 ..........118
4.05 Business impact of HIV/AIDS................................2.7 ..........133
4.06 HIV prevalence, % adult pop.*..............................3.5 ..........125
4.07 Infant mortality, deaths/1,000 live births* .........124.0 ..........138
4.08 Life expectancy, years*.......................................48.7 ..........131
4.09 Quality of primary education..................................2.9 ..........112
4.10 Primary education enrollment, net %*................61.0 ..........134
5th pillar: Higher education and training5.01 Secondary education enrollment, gross %* .......19.0 ..........136
5.02 Tertiary education enrollment, gross %* ..............1.9 ..........135
5.03 Quality of the educational system.........................3.2 ............97
5.04 Quality of math and science education .................3.3 ..........103
5.05 Quality of management schools............................3.3 ..........120
5.06 Internet access in schools .....................................1.6 ..........138
5.07 Availability of research and training services.........2.9 ..........131
5.08 Extent of staff training ...........................................3.2 ..........125
INDICATOR SCORE RANK/139
6th pillar: Goods market efficiency6.01 Intensity of local competition ................................3.1 ..........139
6.02 Extent of market dominance .................................3.5 ............81
6.03 Effectiveness of anti-monopoly policy...................3.2 ..........121
6.04 Extent and effect of taxation .................................2.6 ..........129
6.05 Total tax rate, % profits*.....................................60.9 ..........117
6.06 No. procedures to start a business* ...................19.0 ..........136
6.07 No. days to start a business*..............................75.0 ..........130
6.08 Agricultural policy costs.........................................3.6 ............96
6.09 Prevalence of trade barriers...................................3.4 ..........136
6.10 Trade tariffs, % duty*..........................................14.7 ..........126
6.11 Prevalence of foreign ownership...........................3.1 ..........134
6.12 Business impact of rules on FDI ...........................3.3 ..........132
6.13 Burden of customs procedures.............................2.7 ..........137
6.14 Degree of customer orientation ............................3.4 ..........137
6.15 Buyer sophistication ..............................................2.0 ..........137
7th pillar: Labor market efficiency7.01 Cooperation in labor-employer relations................3.5 ..........133
7.02 Flexibility of wage determination...........................5.0 ............75
7.03 Rigidity of employment index, 0–100 (worst)*....33.0 ............82
7.04 Hiring and firing practices......................................3.9 ............72
7.05 Redundancy costs, weeks of wages*.................36.0 ............70
7.06 Pay and productivity ..............................................3.2 ..........113
7.07 Reliance on professional management .................2.6 ..........138
7.08 Brain drain..............................................................2.7 ..........105
7.09 Females in labor force, ratio to males* .................0.9 ............12
8th pillar: Financial market development8.01 Availability of financial services .............................2.5 ..........138
8.02 Affordability of financial services ...........................2.8 ..........133
8.03 Financing through local equity market...................2.4 ..........119
8.04 Ease of access to loans.........................................2.1 ..........115
8.05 Venture capital availability......................................2.3 ............92
8.06 Restriction on capital flows ...................................3.0 ..........130
8.07 Soundness of banks ..............................................3.6 ..........132
8.08 Regulation of securities exchanges.......................2.5 ..........134
8.09 Legal rights index, 0–10 (best)* ............................3.0 ..........103
9th pillar: Technological readiness9.01 Availability of latest technologies ..........................3.3 ..........139
9.02 Firm-level technology absorption...........................3.5 ..........138
9.03 FDI and technology transfer ..................................3.5 ..........132
9.04 Internet users/100 pop.* .......................................1.7 ..........131
9.05 Broadband Internet subscriptions/100 pop.*.........0.0 ..........138
9.06 Internet bandwidth, Mb/s per 10,000 pop.*..........0.0 ..........138
10th pillar: Market size10.01 Domestic market size index, 1–7 (best)* ..............2.2 ..........123
10.02 Foreign market size index, 1–7 (best)*..................3.3 ..........108
11th pillar: Business sophistication 11.01 Local supplier quantity...........................................4.3 ..........100
11.02 Local supplier quality .............................................3.3 ..........135
11.03 State of cluster development ................................2.7 ..........119
11.04 Nature of competitive advantage ..........................2.8 ..........103
11.05 Value chain breadth ...............................................2.8 ..........122
11.06 Control of international distribution .......................2.8 ..........138
11.07 Production process sophistication.........................2.6 ..........128
11.08 Extent of marketing ...............................................2.4 ..........136
11.09 Willingness to delegate authority ..........................2.8 ..........124
12th pillar: Innovation12.01 Capacity for innovation ..........................................2.4 ..........118
12.02 Quality of scientific research institutions ..............2.6 ..........124
12.03 Company spending on R&D ..................................3.0 ............66
12.04 University-industry collaboration in R&D ...............3.0 ..........116
12.05 Gov’t procurement of advanced tech products.....3.0 ..........114
12.06 Availability of scientists and engineers..................3.6 ............97
12.07 Utility patents/million pop.* ...................................0.0 ............90
Chad
Notes: An asterisk (*) indicates that data are from sources other than the World Economic Forum. For further details and explanation, please refer to the section“How to Read the Competitiveness Profiles” on page 115.
The Africa Competitiveness Report 2011 © 2011 World Economic Forum, the World Bank and the African Development Bank
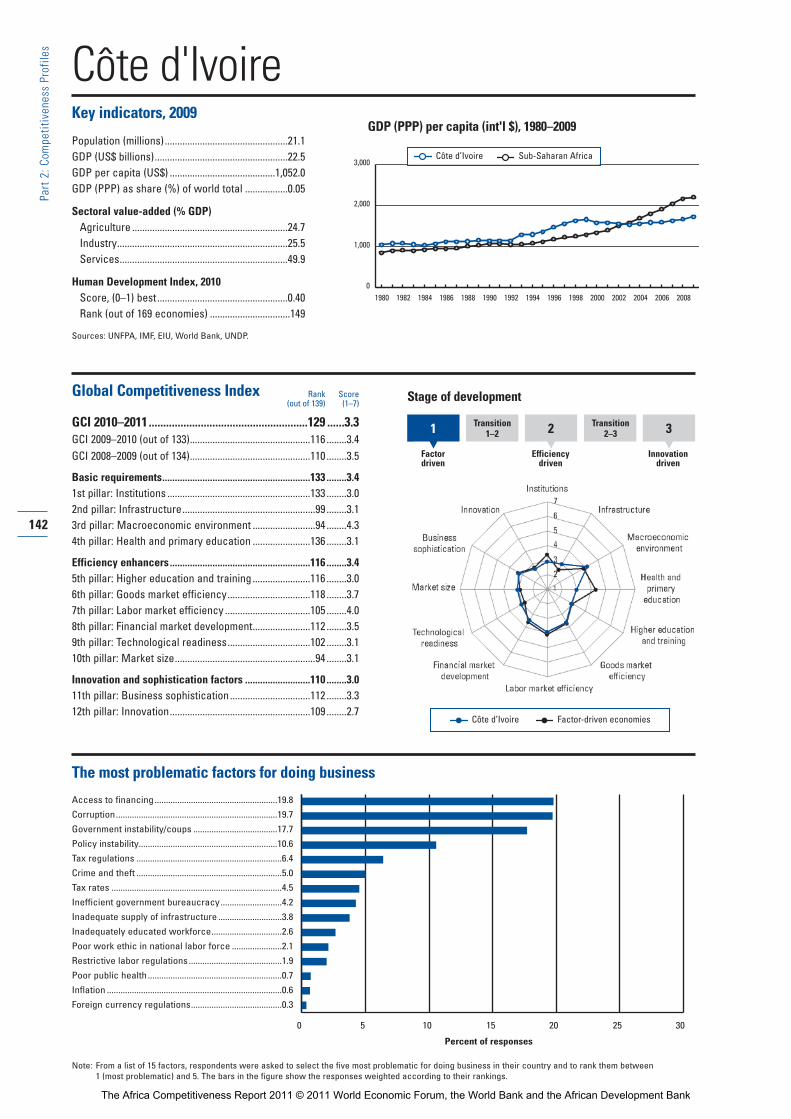
Côte d'IvoireKey indicators, 2009
Population (millions).................................................21.1GDP (US$ billions).....................................................22.5GDP per capita (US$) ..........................................1,052.0GDP (PPP) as share (%) of world total .................0.05
Sectoral value-added (% GDP)Agriculture ..............................................................24.7Industry....................................................................25.5Services...................................................................49.9
Human Development Index, 2010Score, (0–1) best....................................................0.40Rank (out of 169 economies) ................................149
Sources: UNFPA, IMF, EIU, World Bank, UNDP.
Global Competitiveness Index
GCI 2010–2011.......................................................129 ......3.3GCI 2009–2010 (out of 133)................................................116 ........3.4GCI 2008–2009 (out of 134)................................................110 ........3.5
Basic requirements...........................................................133 ........3.41st pillar: Institutions .........................................................133 ........3.02nd pillar: Infrastructure.....................................................99 ........3.13rd pillar: Macroeconomic environment .........................94 ........4.34th pillar: Health and primary education .......................136 ........3.1
Efficiency enhancers........................................................116 ........3.45th pillar: Higher education and training .......................116 ........3.06th pillar: Goods market efficiency.................................118 ........3.77th pillar: Labor market efficiency ..................................105 ........4.08th pillar: Financial market development.......................112 ........3.59th pillar: Technological readiness.................................102 ........3.110th pillar: Market size........................................................94 ........3.1
Innovation and sophistication factors ..........................110 ........3.011th pillar: Business sophistication................................112 ........3.312th pillar: Innovation........................................................109 ........2.7
The most problematic factors for doing business
Access to financing......................................................19.8
Corruption.......................................................................19.7
Government instability/coups .....................................17.7
Policy instability.............................................................10.6
Tax regulations ................................................................6.4
Crime and theft ................................................................5.0
Tax rates ...........................................................................4.5
Inefficient government bureaucracy...........................4.2
Inadequate supply of infrastructure ............................3.8
Inadequately educated workforce...............................2.6
Poor work ethic in national labor force ......................2.1
Restrictive labor regulations.........................................1.9
Poor public health ...........................................................0.7
Inflation .............................................................................0.6
Foreign currency regulations........................................0.3
Rank Score(out of 139) (1–7)
142
Part 2:C
ompe
titiven
ess Profile
s
GDP (PPP) per capita (int'l $), 1980–2009
0 5 10 15 20 25 30
Percent of responses
Note: From a list of 15 factors, respondents were asked to select the five most problematic for doing business in their country and to rank them between 1 (most problematic) and 5. The bars in the figure show the responses weighted according to their rankings.
1 Transition1–2 2 Transition
2 –3
Factordriven
Efficiencydriven
Innovationdriven
3
Stage of development
Côte d’Ivoire Factor-driven economies
0
1,000
2,000
3,000
1980 1982 1984 1986 1988 1990 1992 1994 1996 1998 2000 2002 2004 20082006
Côte d’Ivoire Sub-Saharan Africa
The Africa Competitiveness Report 2011 © 2011 World Economic Forum, the World Bank and the African Development Bank
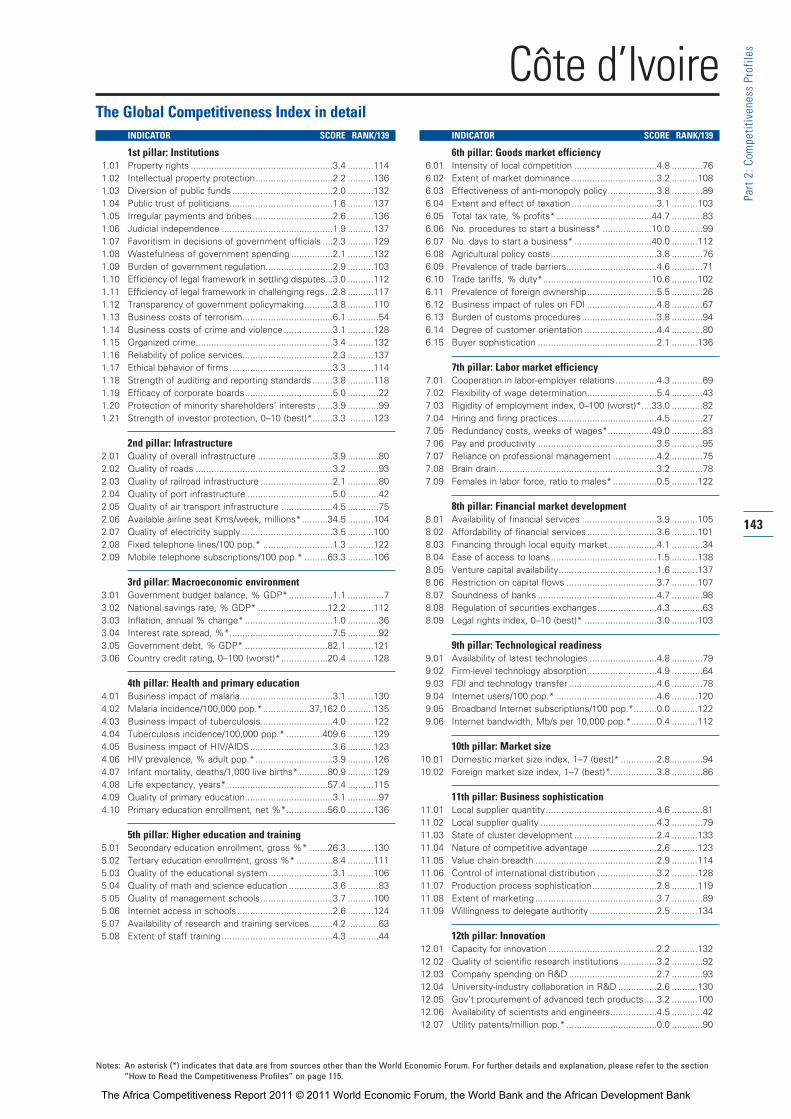
143
Part 2:C
ompe
titiven
ess Profile
s
The Global Competitiveness Index in detailINDICATOR SCORE RANK/139
1st pillar: Institutions1.01 Property rights .......................................................3.4 ..........114
1.02 Intellectual property protection..............................2.2 ..........136
1.03 Diversion of public funds.......................................2.0 ..........132
1.04 Public trust of politicians........................................1.6 ..........137
1.05 Irregular payments and bribes...............................2.6 ..........136
1.06 Judicial independence ...........................................1.9 ..........137
1.07 Favoritism in decisions of government officials ....2.3 ..........129
1.08 Wastefulness of government spending ................2.1 ..........132
1.09 Burden of government regulation..........................2.9 ..........103
1.10 Efficiency of legal framework in settling disputes...3.0 ..........112
1.11 Efficiency of legal framework in challenging regs...2.8 ..........117
1.12 Transparency of government policymaking...........3.8 ..........110
1.13 Business costs of terrorism...................................6.1 ............54
1.14 Business costs of crime and violence...................3.1 ..........128
1.15 Organized crime.....................................................3.4 ..........132
1.16 Reliability of police services...................................2.3 ..........137
1.17 Ethical behavior of firms........................................3.3 ..........114
1.18 Strength of auditing and reporting standards........3.8 ..........118
1.19 Efficacy of corporate boards..................................5.0 ............22
1.20 Protection of minority shareholders’ interests ......3.9 ............99
1.21 Strength of investor protection, 0–10 (best)*........3.3 ..........123
2nd pillar: Infrastructure2.01 Quality of overall infrastructure .............................3.9 ............80
2.02 Quality of roads .....................................................3.2 ............93
2.03 Quality of railroad infrastructure ............................2.1 ............80
2.04 Quality of port infrastructure .................................5.0 ............42
2.05 Quality of air transport infrastructure ....................4.5 ............75
2.06 Available airline seat Kms/week, millions*..........34.5 ..........104
2.07 Quality of electricity supply ...................................3.5 ..........100
2.08 Fixed telephone lines/100 pop.* ...........................1.3 ..........122
2.09 Mobile telephone subscriptions/100 pop.* .........63.3 ..........106
3rd pillar: Macroeconomic environment3.01 Government budget balance, % GDP* .................1.1 ..............7
3.02 National savings rate, % GDP* ...........................12.2 ..........112
3.03 Inflation, annual % change* ..................................1.0 ............36
3.04 Interest rate spread, %*........................................7.5 ............92
3.05 Government debt, % GDP* ................................82.1 ..........121
3.06 Country credit rating, 0–100 (worst)*..................20.4 ..........128
4th pillar: Health and primary education4.01 Business impact of malaria....................................3.1 ..........130
4.02 Malaria incidence/100,000 pop.*..................37,162.0 ..........135
4.03 Business impact of tuberculosis............................4.0 ..........122
4.04 Tuberculosis incidence/100,000 pop.* ..............409.6 ..........129
4.05 Business impact of HIV/AIDS................................3.6 ..........123
4.06 HIV prevalence, % adult pop.*..............................3.9 ..........126
4.07 Infant mortality, deaths/1,000 live births* ...........80.9 ..........129
4.08 Life expectancy, years*.......................................57.4 ..........115
4.09 Quality of primary education..................................3.1 ............97
4.10 Primary education enrollment, net %*................56.0 ..........136
5th pillar: Higher education and training5.01 Secondary education enrollment, gross %* .......26.3 ..........130
5.02 Tertiary education enrollment, gross %* ..............8.4 ..........111
5.03 Quality of the educational system.........................3.1 ..........106
5.04 Quality of math and science education .................3.6 ............83
5.05 Quality of management schools............................3.7 ..........100
5.06 Internet access in schools .....................................2.6 ..........124
5.07 Availability of research and training services.........4.2 ............63
5.08 Extent of staff training ...........................................4.3 ............44
INDICATOR SCORE RANK/139
6th pillar: Goods market efficiency6.01 Intensity of local competition ................................4.8 ............76
6.02 Extent of market dominance .................................3.2 ..........108
6.03 Effectiveness of anti-monopoly policy...................3.8 ............89
6.04 Extent and effect of taxation .................................3.1 ..........103
6.05 Total tax rate, % profits*.....................................44.7 ............83
6.06 No. procedures to start a business* ...................10.0 ............99
6.07 No. days to start a business*..............................40.0 ..........112
6.08 Agricultural policy costs.........................................3.8 ............76
6.09 Prevalence of trade barriers...................................4.6 ............71
6.10 Trade tariffs, % duty*..........................................10.6 ..........102
6.11 Prevalence of foreign ownership...........................5.5 ............26
6.12 Business impact of rules on FDI ...........................4.8 ............67
6.13 Burden of customs procedures.............................3.8 ............94
6.14 Degree of customer orientation ............................4.4 ............80
6.15 Buyer sophistication ..............................................2.1 ..........136
7th pillar: Labor market efficiency7.01 Cooperation in labor-employer relations................4.3 ............69
7.02 Flexibility of wage determination...........................5.4 ............43
7.03 Rigidity of employment index, 0–100 (worst)*....33.0 ............82
7.04 Hiring and firing practices......................................4.5 ............27
7.05 Redundancy costs, weeks of wages*.................49.0 ............83
7.06 Pay and productivity ..............................................3.5 ............95
7.07 Reliance on professional management .................4.2 ............75
7.08 Brain drain..............................................................3.2 ............78
7.09 Females in labor force, ratio to males* .................0.5 ..........122
8th pillar: Financial market development8.01 Availability of financial services .............................3.9 ..........105
8.02 Affordability of financial services ...........................3.6 ..........101
8.03 Financing through local equity market...................4.1 ............34
8.04 Ease of access to loans.........................................1.5 ..........138
8.05 Venture capital availability......................................1.6 ..........137
8.06 Restriction on capital flows ...................................3.7 ..........107
8.07 Soundness of banks ..............................................4.7 ............98
8.08 Regulation of securities exchanges.......................4.3 ............63
8.09 Legal rights index, 0–10 (best)* ............................3.0 ..........103
9th pillar: Technological readiness9.01 Availability of latest technologies ..........................4.8 ............79
9.02 Firm-level technology absorption...........................4.9 ............64
9.03 FDI and technology transfer ..................................4.6 ............78
9.04 Internet users/100 pop.* .......................................4.6 ..........120
9.05 Broadband Internet subscriptions/100 pop.*.........0.0 ..........122
9.06 Internet bandwidth, Mb/s per 10,000 pop.*..........0.4 ..........112
10th pillar: Market size10.01 Domestic market size index, 1–7 (best)* ..............2.8 ............94
10.02 Foreign market size index, 1–7 (best)*..................3.8 ............86
11th pillar: Business sophistication 11.01 Local supplier quantity...........................................4.6 ............81
11.02 Local supplier quality .............................................4.3 ............79
11.03 State of cluster development ................................2.4 ..........133
11.04 Nature of competitive advantage ..........................2.6 ..........123
11.05 Value chain breadth ...............................................2.9 ..........114
11.06 Control of international distribution .......................3.2 ..........128
11.07 Production process sophistication.........................2.8 ..........119
11.08 Extent of marketing ...............................................3.7 ............89
11.09 Willingness to delegate authority ..........................2.5 ..........134
12th pillar: Innovation12.01 Capacity for innovation ..........................................2.2 ..........132
12.02 Quality of scientific research institutions ..............3.2 ............92
12.03 Company spending on R&D ..................................2.7 ............93
12.04 University-industry collaboration in R&D ...............2.6 ..........130
12.05 Gov’t procurement of advanced tech products.....3.2 ..........100
12.06 Availability of scientists and engineers..................4.5 ............42
12.07 Utility patents/million pop.* ...................................0.0 ............90
Côte d’Ivoire
Notes: An asterisk (*) indicates that data are from sources other than the World Economic Forum. For further details and explanation, please refer to the section“How to Read the Competitiveness Profiles” on page 115.
The Africa Competitiveness Report 2011 © 2011 World Economic Forum, the World Bank and the African Development Bank
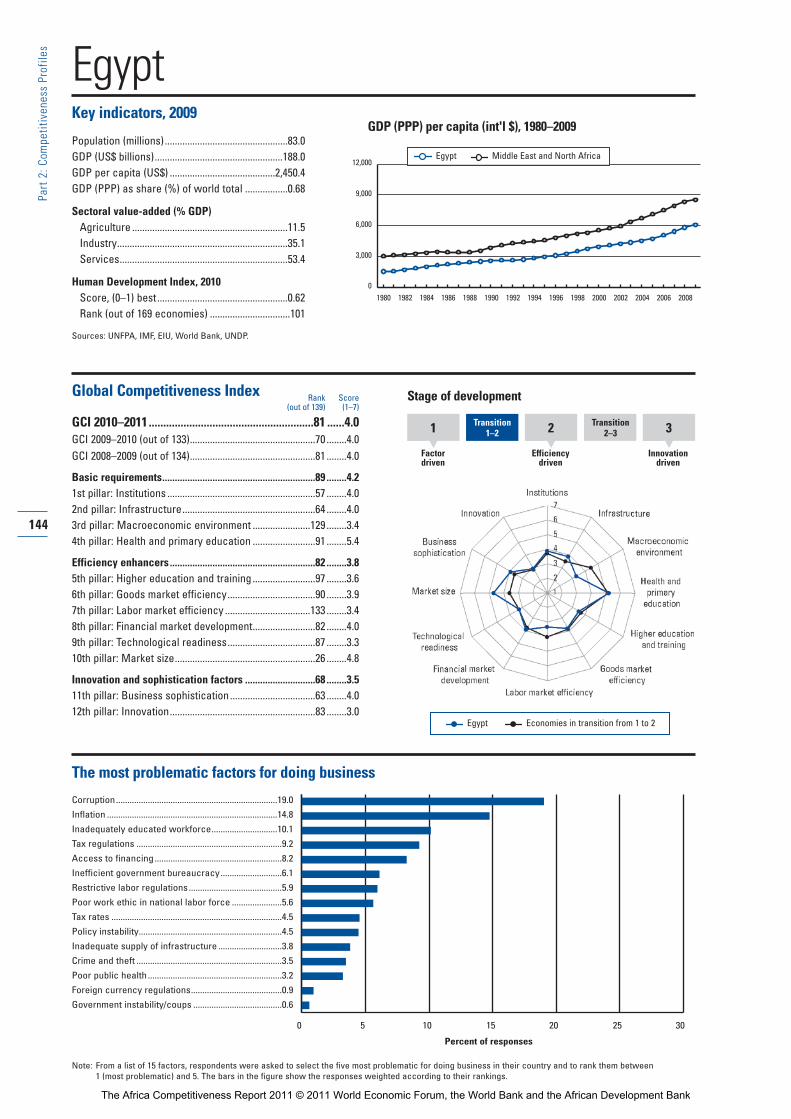
EgyptKey indicators, 2009
Population (millions).................................................83.0GDP (US$ billions)...................................................188.0GDP per capita (US$) ..........................................2,450.4GDP (PPP) as share (%) of world total .................0.68
Sectoral value-added (% GDP)Agriculture ..............................................................11.5Industry....................................................................35.1Services...................................................................53.4
Human Development Index, 2010Score, (0–1) best....................................................0.62Rank (out of 169 economies) ................................101
Sources: UNFPA, IMF, EIU, World Bank, UNDP.
Global Competitiveness Index
GCI 2010–2011.........................................................81 ......4.0GCI 2009–2010 (out of 133)..................................................70 ........4.0GCI 2008–2009 (out of 134)..................................................81 ........4.0
Basic requirements.............................................................89 ........4.21st pillar: Institutions ...........................................................57 ........4.02nd pillar: Infrastructure.....................................................64 ........4.03rd pillar: Macroeconomic environment .......................129 ........3.44th pillar: Health and primary education .........................91 ........5.4
Efficiency enhancers..........................................................82 ........3.85th pillar: Higher education and training .........................97 ........3.66th pillar: Goods market efficiency...................................90 ........3.97th pillar: Labor market efficiency ..................................133 ........3.48th pillar: Financial market development.........................82 ........4.09th pillar: Technological readiness...................................87 ........3.310th pillar: Market size........................................................26 ........4.8
Innovation and sophistication factors ............................68 ........3.511th pillar: Business sophistication..................................63 ........4.012th pillar: Innovation..........................................................83 ........3.0
The most problematic factors for doing business
Corruption.......................................................................19.0
Inflation ...........................................................................14.8
Inadequately educated workforce.............................10.1
Tax regulations ................................................................9.2
Access to financing........................................................8.2
Inefficient government bureaucracy...........................6.1
Restrictive labor regulations.........................................5.9
Poor work ethic in national labor force ......................5.6
Tax rates ...........................................................................4.5
Policy instability...............................................................4.5
Inadequate supply of infrastructure ............................3.8
Crime and theft ................................................................3.5
Poor public health ...........................................................3.2
Foreign currency regulations........................................0.9
Government instability/coups .......................................0.6
Rank Score(out of 139) (1–7)
144
Part 2:C
ompe
titiven
ess Profile
s
GDP (PPP) per capita (int'l $), 1980–2009
0 5 10 15 20 25 30
Percent of responses
Note: From a list of 15 factors, respondents were asked to select the five most problematic for doing business in their country and to rank them between 1 (most problematic) and 5. The bars in the figure show the responses weighted according to their rankings.
1 Transition1–2 2 Transition
2 –3
Factordriven
Efficiencydriven
Innovationdriven
3
Stage of development
Egypt Economies in transition from 1 to 2
0
3,000
6,000
9,000
12,000
1980 1982 1984 1986 1988 1990 1992 1994 1996 1998 2000 2002 2004 20082006
Egypt Middle East and North Africa
The Africa Competitiveness Report 2011 © 2011 World Economic Forum, the World Bank and the African Development Bank

145
Part 2:C
ompe
titiven
ess Profile
s
The Global Competitiveness Index in detailINDICATOR SCORE RANK/139
1st pillar: Institutions1.01 Property rights .......................................................4.6 ............56
1.02 Intellectual property protection..............................3.6 ............67
1.03 Diversion of public funds.......................................3.1 ............83
1.04 Public trust of politicians........................................3.6 ............40
1.05 Irregular payments and bribes...............................4.1 ............64
1.06 Judicial independence ...........................................3.9 ............63
1.07 Favoritism in decisions of government officials ....2.7 ............95
1.08 Wastefulness of government spending ................3.5 ............51
1.09 Burden of government regulation..........................3.1 ............79
1.10 Efficiency of legal framework in settling disputes...4.3 ............40
1.11 Efficiency of legal framework in challenging regs...3.5 ............69
1.12 Transparency of government policymaking...........4.3 ............68
1.13 Business costs of terrorism...................................4.1 ..........132
1.14 Business costs of crime and violence...................4.3 ............97
1.15 Organized crime.....................................................6.6 ............14
1.16 Reliability of police services...................................4.0 ............81
1.17 Ethical behavior of firms........................................4.1 ............59
1.18 Strength of auditing and reporting standards........4.8 ............58
1.19 Efficacy of corporate boards..................................4.4 ............82
1.20 Protection of minority shareholders’ interests ......4.6 ............46
1.21 Strength of investor protection, 0–10 (best)*........5.3 ............59
2nd pillar: Infrastructure2.01 Quality of overall infrastructure .............................4.3 ............68
2.02 Quality of roads .....................................................3.7 ............75
2.03 Quality of railroad infrastructure ............................3.4 ............46
2.04 Quality of port infrastructure .................................4.2 ............69
2.05 Quality of air transport infrastructure ....................5.5 ............39
2.06 Available airline seat Kms/week, millions*........658.6 ............33
2.07 Quality of electricity supply ...................................5.3 ............53
2.08 Fixed telephone lines/100 pop.* .........................12.4 ............87
2.09 Mobile telephone subscriptions/100 pop.* .........66.7 ..........102
3rd pillar: Macroeconomic environment3.01 Government budget balance, % GDP* ................-6.6 ..........107
3.02 National savings rate, % GDP* ...........................12.5 ..........108
3.03 Inflation, annual % change* ................................16.2 ..........135
3.04 Interest rate spread, %*........................................5.5 ............69
3.05 Government debt, % GDP* ................................80.1 ..........119
3.06 Country credit rating, 0–100 (worst)*..................51.4 ............69
4th pillar: Health and primary education4.01 Business impact of malaria ..............................n/appl. ..............1
4.02 Malaria incidence/100,000 pop.*...........................0.0 ..............1
4.03 Business impact of tuberculosis............................6.4 ............32
4.04 Tuberculosis incidence/100,000 pop.* ................20.3 ............44
4.05 Business impact of HIV/AIDS................................6.1 ............29
4.06 HIV prevalence, % adult pop.* ...........................<0.1 ..............1
4.07 Infant mortality, deaths/1,000 live births* ...........19.8 ............80
4.08 Life expectancy, years*.......................................70.1 ............94
4.09 Quality of primary education..................................2.5 ..........126
4.10 Primary education enrollment, net %*................93.6 ............73
5th pillar: Higher education and training5.01 Secondary education enrollment, gross %* .......79.3 ............90
5.02 Tertiary education enrollment, gross %* ............28.5 ............78
5.03 Quality of the educational system.........................2.5 ..........131
5.04 Quality of math and science education .................2.7 ..........125
5.05 Quality of management schools............................3.3 ..........122
5.06 Internet access in schools .....................................3.3 ............96
5.07 Availability of research and training services.........4.1 ............64
5.08 Extent of staff training ...........................................3.3 ..........112
INDICATOR SCORE RANK/139
6th pillar: Goods market efficiency6.01 Intensity of local competition ................................4.6 ............91
6.02 Extent of market dominance .................................3.3 ............95
6.03 Effectiveness of anti-monopoly policy...................3.5 ..........106
6.04 Extent and effect of taxation .................................3.5 ............75
6.05 Total tax rate, % profits*.....................................43.0 ............78
6.06 No. procedures to start a business* .....................6.0 ............34
6.07 No. days to start a business*................................7.0 ............21
6.08 Agricultural policy costs.........................................3.7 ............84
6.09 Prevalence of trade barriers...................................4.0 ..........114
6.10 Trade tariffs, % duty*..........................................13.8 ..........123
6.11 Prevalence of foreign ownership...........................4.5 ..........100
6.12 Business impact of rules on FDI ...........................4.6 ............75
6.13 Burden of customs procedures.............................4.5 ............50
6.14 Degree of customer orientation ............................4.7 ............63
6.15 Buyer sophistication ..............................................2.6 ..........126
7th pillar: Labor market efficiency7.01 Cooperation in labor-employer relations................4.0 ............99
7.02 Flexibility of wage determination...........................5.2 ............60
7.03 Rigidity of employment index, 0–100 (worst)*....27.0 ............67
7.04 Hiring and firing practices......................................3.9 ............76
7.05 Redundancy costs, weeks of wages*...............132.0 ..........128
7.06 Pay and productivity ..............................................3.9 ............76
7.07 Reliance on professional management .................4.1 ............86
7.08 Brain drain..............................................................2.5 ..........114
7.09 Females in labor force, ratio to males* .................0.4 ..........130
8th pillar: Financial market development8.01 Availability of financial services .............................4.8 ............60
8.02 Affordability of financial services ...........................4.2 ............69
8.03 Financing through local equity market...................4.2 ............29
8.04 Ease of access to loans.........................................3.0 ............49
8.05 Venture capital availability......................................3.0 ............41
8.06 Restriction on capital flows ...................................4.1 ............84
8.07 Soundness of banks ..............................................5.3 ............61
8.08 Regulation of securities exchanges.......................4.3 ............67
8.09 Legal rights index, 0–10 (best)* ............................3.0 ..........103
9th pillar: Technological readiness9.01 Availability of latest technologies ..........................4.6 ............91
9.02 Firm-level technology absorption...........................5.0 ............58
9.03 FDI and technology transfer ..................................4.9 ............53
9.04 Internet users/100 pop.* .....................................20.0 ............90
9.05 Broadband Internet subscriptions/100 pop.*.........1.3 ............91
9.06 Internet bandwidth, Mb/s per 10,000 pop.*........11.7 ............72
10th pillar: Market size10.01 Domestic market size index, 1–7 (best)* ..............4.6 ............27
10.02 Foreign market size index, 1–7 (best)*..................5.3 ............27
11th pillar: Business sophistication 11.01 Local supplier quantity...........................................5.1 ............36
11.02 Local supplier quality .............................................4.2 ............89
11.03 State of cluster development ................................3.5 ............66
11.04 Nature of competitive advantage ..........................4.0 ............35
11.05 Value chain breadth ...............................................3.6 ............67
11.06 Control of international distribution .......................3.7 ............94
11.07 Production process sophistication.........................4.1 ............46
11.08 Extent of marketing ...............................................3.9 ............79
11.09 Willingness to delegate authority ..........................3.7 ............57
12th pillar: Innovation12.01 Capacity for innovation ..........................................2.5 ..........109
12.02 Quality of scientific research institutions ..............2.9 ..........110
12.03 Company spending on R&D ..................................3.0 ............74
12.04 University-industry collaboration in R&D ...............2.8 ..........120
12.05 Gov’t procurement of advanced tech products.....3.4 ............86
12.06 Availability of scientists and engineers..................4.9 ............25
12.07 Utility patents/million pop.* ...................................0.0 ............84
Egypt
Notes: An asterisk (*) indicates that data are from sources other than the World Economic Forum. For further details and explanation, please refer to the section“How to Read the Competitiveness Profiles” on page 115.
The Africa Competitiveness Report 2011 © 2011 World Economic Forum, the World Bank and the African Development Bank
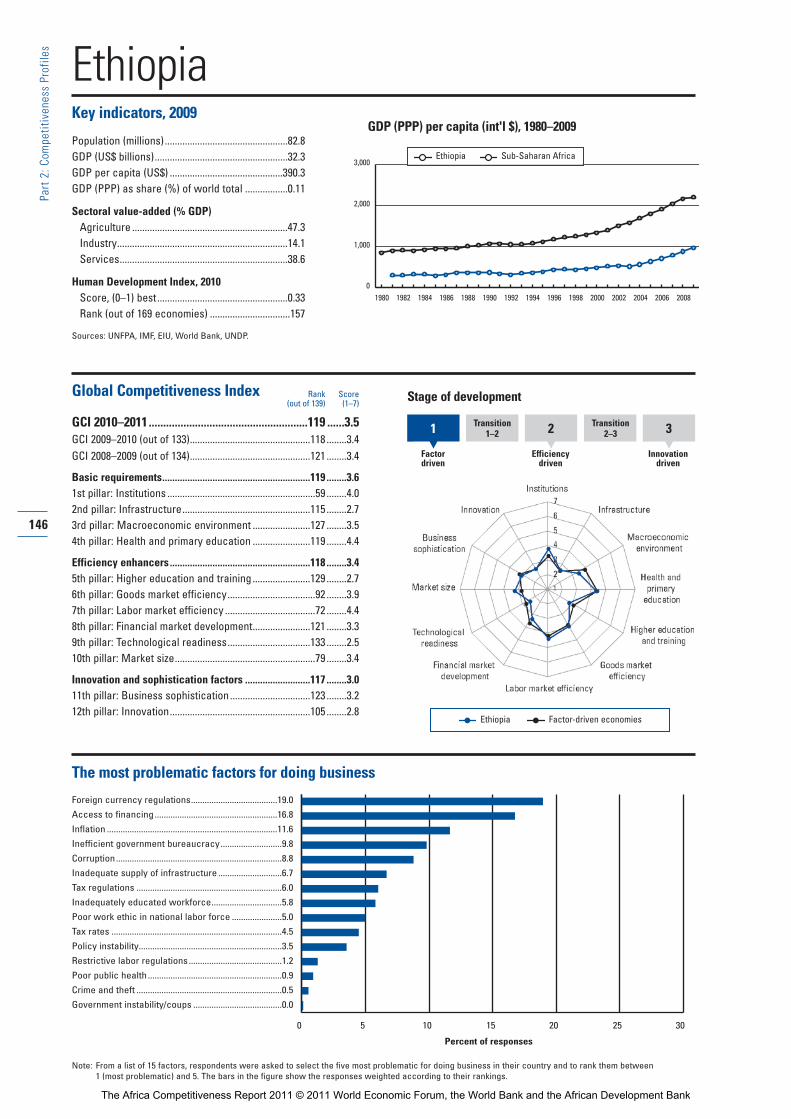
EthiopiaKey indicators, 2009
Population (millions).................................................82.8GDP (US$ billions).....................................................32.3GDP per capita (US$) .............................................390.3GDP (PPP) as share (%) of world total .................0.11
Sectoral value-added (% GDP)Agriculture ..............................................................47.3Industry....................................................................14.1Services...................................................................38.6
Human Development Index, 2010Score, (0–1) best....................................................0.33Rank (out of 169 economies) ................................157
Sources: UNFPA, IMF, EIU, World Bank, UNDP.
Global Competitiveness Index
GCI 2010–2011.......................................................119 ......3.5GCI 2009–2010 (out of 133)................................................118 ........3.4GCI 2008–2009 (out of 134)................................................121 ........3.4
Basic requirements...........................................................119 ........3.61st pillar: Institutions ...........................................................59 ........4.02nd pillar: Infrastructure...................................................115 ........2.73rd pillar: Macroeconomic environment .......................127 ........3.54th pillar: Health and primary education .......................119 ........4.4
Efficiency enhancers........................................................118 ........3.45th pillar: Higher education and training .......................129 ........2.76th pillar: Goods market efficiency...................................92 ........3.97th pillar: Labor market efficiency ....................................72 ........4.48th pillar: Financial market development.......................121 ........3.39th pillar: Technological readiness.................................133 ........2.510th pillar: Market size........................................................79 ........3.4
Innovation and sophistication factors ..........................117 ........3.011th pillar: Business sophistication................................123 ........3.212th pillar: Innovation........................................................105 ........2.8
The most problematic factors for doing business
Foreign currency regulations......................................19.0
Access to financing......................................................16.8
Inflation ...........................................................................11.6
Inefficient government bureaucracy...........................9.8
Corruption.........................................................................8.8
Inadequate supply of infrastructure ............................6.7
Tax regulations ................................................................6.0
Inadequately educated workforce...............................5.8
Poor work ethic in national labor force ......................5.0
Tax rates ...........................................................................4.5
Policy instability...............................................................3.5
Restrictive labor regulations.........................................1.2
Poor public health ...........................................................0.9
Crime and theft ................................................................0.5
Government instability/coups .......................................0.0
Rank Score(out of 139) (1–7)
146
Part 2:C
ompe
titiven
ess Profile
s
GDP (PPP) per capita (int'l $), 1980–2009
0 5 10 15 20 25 30
Percent of responses
Note: From a list of 15 factors, respondents were asked to select the five most problematic for doing business in their country and to rank them between 1 (most problematic) and 5. The bars in the figure show the responses weighted according to their rankings.
1 Transition1–2 2 Transition
2 –3
Factordriven
Efficiencydriven
Innovationdriven
3
Stage of development
Ethiopia Factor-driven economies
0
1,000
2,000
3,000
1980 1982 1984 1986 1988 1990 1992 1994 1996 1998 2000 2002 2004 20082006
Ethiopia Sub-Saharan Africa
The Africa Competitiveness Report 2011 © 2011 World Economic Forum, the World Bank and the African Development Bank

147
Part 2:C
ompe
titiven
ess Profile
s
The Global Competitiveness Index in detailINDICATOR SCORE RANK/139
1st pillar: Institutions1.01 Property rights .......................................................4.5 ............60
1.02 Intellectual property protection..............................3.4 ............71
1.03 Diversion of public funds.......................................3.9 ............54
1.04 Public trust of politicians........................................3.2 ............56
1.05 Irregular payments and bribes...............................3.6 ............88
1.06 Judicial independence ...........................................3.3 ............89
1.07 Favoritism in decisions of government officials ....3.3 ............51
1.08 Wastefulness of government spending ................4.1 ............31
1.09 Burden of government regulation..........................3.8 ............27
1.10 Efficiency of legal framework in settling disputes...3.7 ............67
1.11 Efficiency of legal framework in challenging regs...3.5 ............70
1.12 Transparency of government policymaking...........3.9 ..........100
1.13 Business costs of terrorism...................................5.2 ..........100
1.14 Business costs of crime and violence...................5.2 ............54
1.15 Organized crime.....................................................5.7 ............51
1.16 Reliability of police services...................................4.4 ............59
1.17 Ethical behavior of firms........................................3.9 ............65
1.18 Strength of auditing and reporting standards........4.3 ............90
1.19 Efficacy of corporate boards..................................4.4 ............80
1.20 Protection of minority shareholders’ interests ......4.9 ............28
1.21 Strength of investor protection, 0–10 (best)*........4.3 ............99
2nd pillar: Infrastructure2.01 Quality of overall infrastructure .............................3.8 ............87
2.02 Quality of roads .....................................................4.1 ............60
2.03 Quality of railroad infrastructure ............................1.5 ..........103
2.04 Quality of port infrastructure .................................4.4 ............60
2.05 Quality of air transport infrastructure ....................5.4 ............48
2.06 Available airline seat Kms/week, millions*........152.3 ............68
2.07 Quality of electricity supply ...................................2.7 ..........119
2.08 Fixed telephone lines/100 pop.* ...........................1.1 ..........125
2.09 Mobile telephone subscriptions/100 pop.* ...........4.9 ..........139
3rd pillar: Macroeconomic environment3.01 Government budget balance, % GDP* ................-3.7 ............60
3.02 National savings rate, % GDP* ...........................15.8 ............94
3.03 Inflation, annual % change* ................................36.4 ..........139
3.04 Interest rate spread, %*........................................5.0 ............59
3.05 Government debt, % GDP* ................................36.8 ............65
3.06 Country credit rating, 0–100 (worst)*..................19.7 ..........132
4th pillar: Health and primary education4.01 Business impact of malaria....................................4.1 ..........117
4.02 Malaria incidence/100,000 pop.*..................15,311.1 ..........118
4.03 Business impact of tuberculosis............................3.8 ..........125
4.04 Tuberculosis incidence/100,000 pop.* ..............368.4 ..........127
4.05 Business impact of HIV/AIDS................................3.4 ..........124
4.06 HIV prevalence, % adult pop.*..............................2.1 ..........120
4.07 Infant mortality, deaths/1,000 live births* ...........69.4 ..........121
4.08 Life expectancy, years*.......................................55.2 ..........121
4.09 Quality of primary education..................................3.3 ............91
4.10 Primary education enrollment, net %*................78.2 ..........123
5th pillar: Higher education and training5.01 Secondary education enrollment, gross %* .......33.4 ..........124
5.02 Tertiary education enrollment, gross %* ..............3.6 ..........129
5.03 Quality of the educational system.........................3.8 ............60
5.04 Quality of math and science education .................3.5 ............94
5.05 Quality of management schools............................3.6 ..........106
5.06 Internet access in schools .....................................2.4 ..........127
5.07 Availability of research and training services.........3.1 ..........122
5.08 Extent of staff training ...........................................3.2 ..........122
INDICATOR SCORE RANK/139
6th pillar: Goods market efficiency6.01 Intensity of local competition ................................4.2 ..........111
6.02 Extent of market dominance .................................3.5 ............82
6.03 Effectiveness of anti-monopoly policy...................3.6 ..........103
6.04 Extent and effect of taxation .................................3.7 ............62
6.05 Total tax rate, % profits*.....................................31.1 ............32
6.06 No. procedures to start a business* .....................5.0 ............23
6.07 No. days to start a business*................................9.0 ............30
6.08 Agricultural policy costs.........................................4.2 ............39
6.09 Prevalence of trade barriers...................................4.0 ..........108
6.10 Trade tariffs, % duty*..........................................12.7 ..........118
6.11 Prevalence of foreign ownership...........................3.6 ..........125
6.12 Business impact of rules on FDI ...........................4.6 ............79
6.13 Burden of customs procedures.............................3.6 ..........100
6.14 Degree of customer orientation ............................4.2 ..........100
6.15 Buyer sophistication ..............................................3.0 ..........102
7th pillar: Labor market efficiency7.01 Cooperation in labor-employer relations................4.0 ..........105
7.02 Flexibility of wage determination...........................5.4 ............48
7.03 Rigidity of employment index, 0–100 (worst)*....28.0 ............71
7.04 Hiring and firing practices......................................3.7 ............84
7.05 Redundancy costs, weeks of wages*.................40.0 ............77
7.06 Pay and productivity ..............................................3.7 ............90
7.07 Reliance on professional management .................3.6 ..........110
7.08 Brain drain..............................................................2.8 ............96
7.09 Females in labor force, ratio to males* .................0.9 ............26
8th pillar: Financial market development8.01 Availability of financial services .............................3.4 ..........124
8.02 Affordability of financial services ...........................3.3 ..........119
8.03 Financing through local equity market...................2.8 ..........100
8.04 Ease of access to loans.........................................2.1 ..........120
8.05 Venture capital availability......................................2.1 ..........114
8.06 Restriction on capital flows ...................................3.1 ..........129
8.07 Soundness of banks ..............................................4.7 ............91
8.08 Regulation of securities exchanges.......................3.1 ..........123
8.09 Legal rights index, 0–10 (best)* ............................4.0 ............86
9th pillar: Technological readiness9.01 Availability of latest technologies ..........................3.9 ..........129
9.02 Firm-level technology absorption...........................4.0 ..........124
9.03 FDI and technology transfer ..................................4.1 ..........107
9.04 Internet users/100 pop.* .......................................0.5 ..........136
9.05 Broadband Internet subscriptions/100 pop.*.........0.0 ..........136
9.06 Internet bandwidth, Mb/s per 10,000 pop.*..........0.0 ..........135
10th pillar: Market size10.01 Domestic market size index, 1–7 (best)* ..............3.5 ............68
10.02 Foreign market size index, 1–7 (best)*..................3.3 ..........107
11th pillar: Business sophistication 11.01 Local supplier quantity...........................................4.1 ..........118
11.02 Local supplier quality .............................................3.7 ..........123
11.03 State of cluster development ................................2.8 ..........114
11.04 Nature of competitive advantage ..........................2.5 ..........132
11.05 Value chain breadth ...............................................2.9 ..........115
11.06 Control of international distribution .......................3.9 ............77
11.07 Production process sophistication.........................2.5 ..........129
11.08 Extent of marketing ...............................................2.7 ..........132
11.09 Willingness to delegate authority ..........................3.2 ............98
12th pillar: Innovation12.01 Capacity for innovation ..........................................2.5 ..........106
12.02 Quality of scientific research institutions ..............3.0 ..........102
12.03 Company spending on R&D ..................................2.5 ..........123
12.04 University-industry collaboration in R&D ...............3.1 ..........101
12.05 Gov’t procurement of advanced tech products.....3.8 ............54
12.06 Availability of scientists and engineers..................3.0 ..........129
12.07 Utility patents/million pop.* ...................................0.0 ............90
Ethiopia
Notes: An asterisk (*) indicates that data are from sources other than the World Economic Forum. For further details and explanation, please refer to the section“How to Read the Competitiveness Profiles” on page 115.
The Africa Competitiveness Report 2011 © 2011 World Economic Forum, the World Bank and the African Development Bank
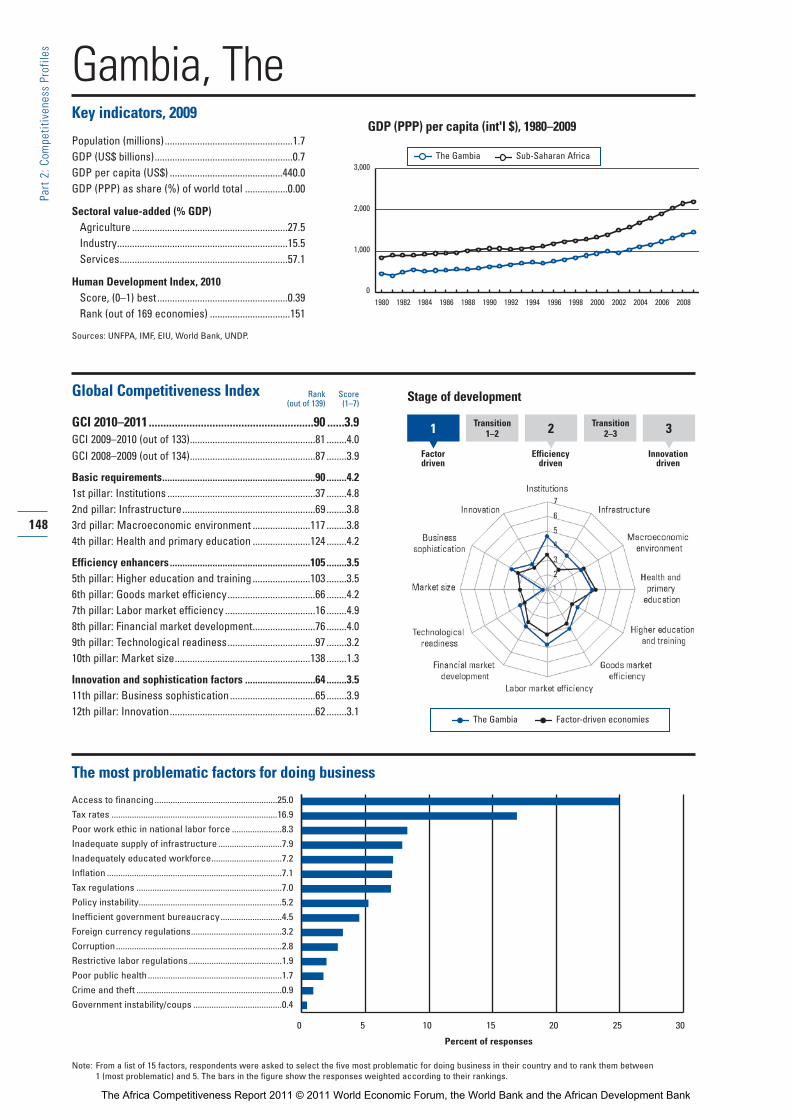
Gambia, TheKey indicators, 2009
Population (millions)...................................................1.7GDP (US$ billions).......................................................0.7GDP per capita (US$) .............................................440.0GDP (PPP) as share (%) of world total .................0.00
Sectoral value-added (% GDP)Agriculture ..............................................................27.5Industry....................................................................15.5Services...................................................................57.1
Human Development Index, 2010Score, (0–1) best....................................................0.39Rank (out of 169 economies) ................................151
Sources: UNFPA, IMF, EIU, World Bank, UNDP.
Global Competitiveness Index
GCI 2010–2011.........................................................90 ......3.9GCI 2009–2010 (out of 133)..................................................81 ........4.0GCI 2008–2009 (out of 134)..................................................87 ........3.9
Basic requirements.............................................................90 ........4.21st pillar: Institutions ...........................................................37 ........4.82nd pillar: Infrastructure.....................................................69 ........3.83rd pillar: Macroeconomic environment .......................117 ........3.84th pillar: Health and primary education .......................124 ........4.2
Efficiency enhancers........................................................105 ........3.55th pillar: Higher education and training .......................103 ........3.56th pillar: Goods market efficiency...................................66 ........4.27th pillar: Labor market efficiency ....................................16 ........4.98th pillar: Financial market development.........................76 ........4.09th pillar: Technological readiness...................................97 ........3.210th pillar: Market size......................................................138 ........1.3
Innovation and sophistication factors ............................64 ........3.511th pillar: Business sophistication..................................65 ........3.912th pillar: Innovation..........................................................62 ........3.1
The most problematic factors for doing business
Access to financing......................................................25.0
Tax rates .........................................................................16.9
Poor work ethic in national labor force ......................8.3
Inadequate supply of infrastructure ............................7.9
Inadequately educated workforce...............................7.2
Inflation .............................................................................7.1
Tax regulations ................................................................7.0
Policy instability...............................................................5.2
Inefficient government bureaucracy...........................4.5
Foreign currency regulations........................................3.2
Corruption.........................................................................2.8
Restrictive labor regulations.........................................1.9
Poor public health ...........................................................1.7
Crime and theft ................................................................0.9
Government instability/coups .......................................0.4
Rank Score(out of 139) (1–7)
148
Part 2:C
ompe
titiven
ess Profile
s
GDP (PPP) per capita (int'l $), 1980–2009
0 5 10 15 20 25 30
Percent of responses
Note: From a list of 15 factors, respondents were asked to select the five most problematic for doing business in their country and to rank them between 1 (most problematic) and 5. The bars in the figure show the responses weighted according to their rankings.
1 Transition1–2 2 Transition
2 –3
Factordriven
Efficiencydriven
Innovationdriven
3
Stage of development
The Gambia Factor-driven economies
0
1,000
2,000
3,000
1980 1982 1984 1986 1988 1990 1992 1994 1996 1998 2000 2002 2004 20082006
The Gambia Sub-Saharan Africa
The Africa Competitiveness Report 2011 © 2011 World Economic Forum, the World Bank and the African Development Bank

149
Part 2:C
ompe
titiven
ess Profile
s
The Global Competitiveness Index in detailINDICATOR SCORE RANK/139
1st pillar: Institutions1.01 Property rights .......................................................5.1 ............39
1.02 Intellectual property protection..............................4.6 ............35
1.03 Diversion of public funds.......................................4.5 ............40
1.04 Public trust of politicians........................................4.4 ............20
1.05 Irregular payments and bribes...............................4.5 ............54
1.06 Judicial independence ...........................................4.6 ............50
1.07 Favoritism in decisions of government officials ....4.6 ............18
1.08 Wastefulness of government spending ................5.0 ............10
1.09 Burden of government regulation..........................4.6 ..............5
1.10 Efficiency of legal framework in settling disputes...4.9 ............25
1.11 Efficiency of legal framework in challenging regs...4.2 ............36
1.12 Transparency of government policymaking...........4.9 ............30
1.13 Business costs of terrorism...................................5.7 ............71
1.14 Business costs of crime and violence...................5.3 ............51
1.15 Organized crime.....................................................5.8 ............47
1.16 Reliability of police services...................................5.1 ............38
1.17 Ethical behavior of firms........................................4.7 ............43
1.18 Strength of auditing and reporting standards........5.2 ............41
1.19 Efficacy of corporate boards..................................4.9 ............38
1.20 Protection of minority shareholders’ interests ......5.1 ............22
1.21 Strength of investor protection, 0–10 (best)*........2.7 ..........133
2nd pillar: Infrastructure2.01 Quality of overall infrastructure .............................4.7 ............52
2.02 Quality of roads .....................................................4.3 ............51
2.03 Quality of railroad infrastructure ............................n/a ...........n/a
2.04 Quality of port infrastructure .................................5.1 ............40
2.05 Quality of air transport infrastructure ....................4.8 ............61
2.06 Available airline seat Kms/week, millions*............8.0 ..........128
2.07 Quality of electricity supply ...................................4.8 ............67
2.08 Fixed telephone lines/100 pop.* ...........................2.9 ..........112
2.09 Mobile telephone subscriptions/100 pop.* .........84.0 ............85
3rd pillar: Macroeconomic environment3.01 Government budget balance, % GDP* ................-4.4 ............76
3.02 National savings rate, % GDP* ...........................11.9 ..........114
3.03 Inflation, annual % change* ..................................4.6 ............90
3.04 Interest rate spread, %*......................................14.6 ..........126
3.05 Government debt, % GDP* ................................33.3 ............56
3.06 Country credit rating, 0–100 (worst)*..................18.4 ..........134
4th pillar: Health and primary education4.01 Business impact of malaria....................................4.1 ..........116
4.02 Malaria incidence/100,000 pop.*..................28,224.5 ..........124
4.03 Business impact of tuberculosis............................4.7 ..........101
4.04 Tuberculosis incidence/100,000 pop.* ..............263.4 ..........115
4.05 Business impact of HIV/AIDS................................4.9 ............90
4.06 HIV prevalence, % adult pop.*..............................0.9 ..........103
4.07 Infant mortality, deaths/1,000 live births* ...........79.9 ..........127
4.08 Life expectancy, years*.......................................55.9 ..........118
4.09 Quality of primary education..................................4.4 ............46
4.10 Primary education enrollment, net %*................68.7 ..........130
5th pillar: Higher education and training5.01 Secondary education enrollment, gross %* .......50.8 ..........114
5.02 Tertiary education enrollment, gross %* ..............1.2 ..........138
5.03 Quality of the educational system.........................4.5 ............33
5.04 Quality of math and science education .................3.6 ............86
5.05 Quality of management schools............................4.5 ............53
5.06 Internet access in schools .....................................3.7 ............78
5.07 Availability of research and training services.........4.0 ............72
5.08 Extent of staff training ...........................................4.4 ............32
INDICATOR SCORE RANK/139
6th pillar: Goods market efficiency6.01 Intensity of local competition ................................4.6 ............90
6.02 Extent of market dominance .................................4.4 ............35
6.03 Effectiveness of anti-monopoly policy...................4.5 ............42
6.04 Extent and effect of taxation .................................3.7 ............60
6.05 Total tax rate, % profits*...................................292.4 ..........136
6.06 No. procedures to start a business* .....................8.0 ............73
6.07 No. days to start a business*..............................27.0 ............86
6.08 Agricultural policy costs.........................................5.2 ..............3
6.09 Prevalence of trade barriers...................................4.8 ............50
6.10 Trade tariffs, % duty*..........................................15.8 ..........129
6.11 Prevalence of foreign ownership...........................5.4 ............31
6.12 Business impact of rules on FDI ...........................5.3 ............24
6.13 Burden of customs procedures.............................5.4 ............10
6.14 Degree of customer orientation ............................5.0 ............45
6.15 Buyer sophistication ..............................................3.1 ............89
7th pillar: Labor market efficiency7.01 Cooperation in labor-employer relations................5.0 ............27
7.02 Flexibility of wage determination...........................5.4 ............42
7.03 Rigidity of employment index, 0–100 (worst)*....27.0 ............67
7.04 Hiring and firing practices......................................4.5 ............28
7.05 Redundancy costs, weeks of wages*.................26.0 ............48
7.06 Pay and productivity ..............................................4.3 ............36
7.07 Reliance on professional management .................5.2 ............27
7.08 Brain drain..............................................................4.0 ............45
7.09 Females in labor force, ratio to males* .................0.9 ............45
8th pillar: Financial market development8.01 Availability of financial services .............................4.6 ............72
8.02 Affordability of financial services ...........................4.4 ............61
8.03 Financing through local equity market...................3.1 ............91
8.04 Ease of access to loans.........................................2.9 ............60
8.05 Venture capital availability......................................2.5 ............73
8.06 Restriction on capital flows ...................................4.5 ............65
8.07 Soundness of banks ..............................................5.1 ............75
8.08 Regulation of securities exchanges.......................4.0 ............80
8.09 Legal rights index, 0–10 (best)* ............................5.0 ............75
9th pillar: Technological readiness9.01 Availability of latest technologies ..........................4.9 ............76
9.02 Firm-level technology absorption...........................4.8 ............69
9.03 FDI and technology transfer ..................................4.7 ............66
9.04 Internet users/100 pop.* .......................................7.6 ..........108
9.05 Broadband Internet subscriptions/100 pop.*.........0.0 ..........132
9.06 Internet bandwidth, Mb/s per 10,000 pop.*..........0.4 ..........113
10th pillar: Market size10.01 Domestic market size index, 1–7 (best)* ..............1.1 ..........138
10.02 Foreign market size index, 1–7 (best)*..................1.8 ..........136
11th pillar: Business sophistication 11.01 Local supplier quantity...........................................4.8 ............65
11.02 Local supplier quality .............................................4.7 ............58
11.03 State of cluster development ................................3.4 ............74
11.04 Nature of competitive advantage ..........................3.6 ............55
11.05 Value chain breadth ...............................................3.6 ............66
11.06 Control of international distribution .......................4.1 ............63
11.07 Production process sophistication.........................3.0 ..........108
11.08 Extent of marketing ...............................................3.5 ............95
11.09 Willingness to delegate authority ..........................4.1 ............35
12th pillar: Innovation12.01 Capacity for innovation ..........................................3.0 ............63
12.02 Quality of scientific research institutions ..............3.4 ............78
12.03 Company spending on R&D ..................................2.8 ............86
12.04 University-industry collaboration in R&D ...............3.6 ............63
12.05 Gov’t procurement of advanced tech products.....4.3 ............23
12.06 Availability of scientists and engineers..................3.0 ..........128
12.07 Utility patents/million pop.* ...................................0.0 ............90
Gambia, The
Notes: An asterisk (*) indicates that data are from sources other than the World Economic Forum. For further details and explanation, please refer to the section“How to Read the Competitiveness Profiles” on page 115.
The Africa Competitiveness Report 2011 © 2011 World Economic Forum, the World Bank and the African Development Bank
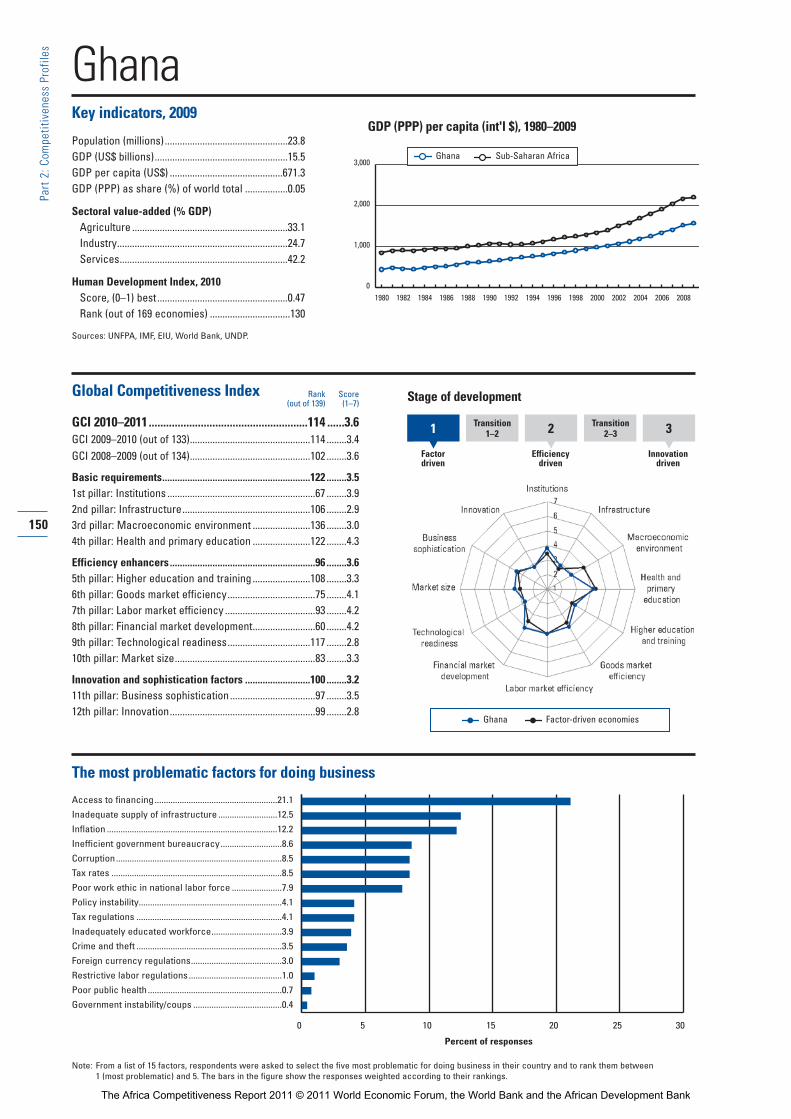
GhanaKey indicators, 2009
Population (millions).................................................23.8GDP (US$ billions).....................................................15.5GDP per capita (US$) .............................................671.3GDP (PPP) as share (%) of world total .................0.05
Sectoral value-added (% GDP)Agriculture ..............................................................33.1Industry....................................................................24.7Services...................................................................42.2
Human Development Index, 2010Score, (0–1) best....................................................0.47Rank (out of 169 economies) ................................130
Sources: UNFPA, IMF, EIU, World Bank, UNDP.
Global Competitiveness Index
GCI 2010–2011.......................................................114 ......3.6GCI 2009–2010 (out of 133)................................................114 ........3.4GCI 2008–2009 (out of 134)................................................102 ........3.6
Basic requirements...........................................................122 ........3.51st pillar: Institutions ...........................................................67 ........3.92nd pillar: Infrastructure...................................................106 ........2.93rd pillar: Macroeconomic environment .......................136 ........3.04th pillar: Health and primary education .......................122 ........4.3
Efficiency enhancers..........................................................96 ........3.65th pillar: Higher education and training .......................108 ........3.36th pillar: Goods market efficiency...................................75 ........4.17th pillar: Labor market efficiency ....................................93 ........4.28th pillar: Financial market development.........................60 ........4.29th pillar: Technological readiness.................................117 ........2.810th pillar: Market size........................................................83 ........3.3
Innovation and sophistication factors ..........................100 ........3.211th pillar: Business sophistication..................................97 ........3.512th pillar: Innovation..........................................................99 ........2.8
The most problematic factors for doing business
Access to financing......................................................21.1
Inadequate supply of infrastructure ..........................12.5
Inflation ...........................................................................12.2
Inefficient government bureaucracy...........................8.6
Corruption.........................................................................8.5
Tax rates ...........................................................................8.5
Poor work ethic in national labor force ......................7.9
Policy instability...............................................................4.1
Tax regulations ................................................................4.1
Inadequately educated workforce...............................3.9
Crime and theft ................................................................3.5
Foreign currency regulations........................................3.0
Restrictive labor regulations.........................................1.0
Poor public health ...........................................................0.7
Government instability/coups .......................................0.4
Rank Score(out of 139) (1–7)
150
Part 2:C
ompe
titiven
ess Profile
s
GDP (PPP) per capita (int'l $), 1980–2009
0 5 10 15 20 25 30
Percent of responses
Note: From a list of 15 factors, respondents were asked to select the five most problematic for doing business in their country and to rank them between 1 (most problematic) and 5. The bars in the figure show the responses weighted according to their rankings.
1 Transition1–2 2 Transition
2 –3
Factordriven
Efficiencydriven
Innovationdriven
3
Stage of development
Ghana Factor-driven economies
0
1,000
2,000
3,000
1980 1982 1984 1986 1988 1990 1992 1994 1996 1998 2000 2002 2004 20082006
Ghana Sub-Saharan Africa
The Africa Competitiveness Report 2011 © 2011 World Economic Forum, the World Bank and the African Development Bank
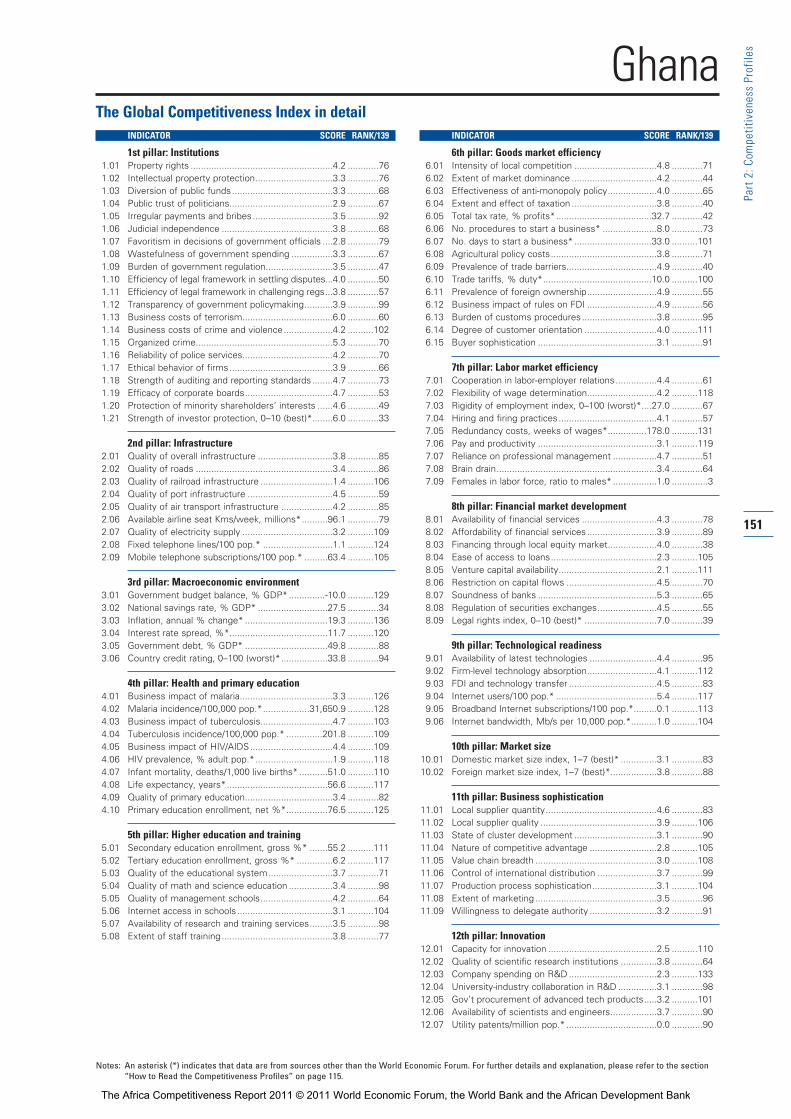
151
Part 2:C
ompe
titiven
ess Profile
s
The Global Competitiveness Index in detailINDICATOR SCORE RANK/139
1st pillar: Institutions1.01 Property rights .......................................................4.2 ............76
1.02 Intellectual property protection..............................3.3 ............76
1.03 Diversion of public funds.......................................3.3 ............68
1.04 Public trust of politicians........................................2.9 ............67
1.05 Irregular payments and bribes...............................3.5 ............92
1.06 Judicial independence ...........................................3.8 ............68
1.07 Favoritism in decisions of government officials ....2.8 ............79
1.08 Wastefulness of government spending ................3.3 ............67
1.09 Burden of government regulation..........................3.5 ............47
1.10 Efficiency of legal framework in settling disputes...4.0 ............50
1.11 Efficiency of legal framework in challenging regs...3.8 ............57
1.12 Transparency of government policymaking...........3.9 ............99
1.13 Business costs of terrorism...................................6.0 ............60
1.14 Business costs of crime and violence...................4.2 ..........102
1.15 Organized crime.....................................................5.3 ............70
1.16 Reliability of police services...................................4.2 ............70
1.17 Ethical behavior of firms........................................3.9 ............66
1.18 Strength of auditing and reporting standards........4.7 ............73
1.19 Efficacy of corporate boards..................................4.7 ............53
1.20 Protection of minority shareholders’ interests ......4.6 ............49
1.21 Strength of investor protection, 0–10 (best)*........6.0 ............33
2nd pillar: Infrastructure2.01 Quality of overall infrastructure .............................3.8 ............85
2.02 Quality of roads .....................................................3.4 ............86
2.03 Quality of railroad infrastructure ............................1.4 ..........106
2.04 Quality of port infrastructure .................................4.5 ............59
2.05 Quality of air transport infrastructure ....................4.2 ............85
2.06 Available airline seat Kms/week, millions*..........96.1 ............79
2.07 Quality of electricity supply ...................................3.2 ..........109
2.08 Fixed telephone lines/100 pop.* ...........................1.1 ..........124
2.09 Mobile telephone subscriptions/100 pop.* .........63.4 ..........105
3rd pillar: Macroeconomic environment3.01 Government budget balance, % GDP* ..............-10.0 ..........129
3.02 National savings rate, % GDP* ...........................27.5 ............34
3.03 Inflation, annual % change* ................................19.3 ..........136
3.04 Interest rate spread, %*......................................11.7 ..........120
3.05 Government debt, % GDP* ................................49.8 ............88
3.06 Country credit rating, 0–100 (worst)*..................33.8 ............94
4th pillar: Health and primary education4.01 Business impact of malaria....................................3.3 ..........126
4.02 Malaria incidence/100,000 pop.*..................31,650.9 ..........128
4.03 Business impact of tuberculosis............................4.7 ..........103
4.04 Tuberculosis incidence/100,000 pop.* ..............201.8 ..........109
4.05 Business impact of HIV/AIDS................................4.4 ..........109
4.06 HIV prevalence, % adult pop.*..............................1.9 ..........118
4.07 Infant mortality, deaths/1,000 live births* ...........51.0 ..........110
4.08 Life expectancy, years*.......................................56.6 ..........117
4.09 Quality of primary education..................................3.4 ............82
4.10 Primary education enrollment, net %*................76.5 ..........125
5th pillar: Higher education and training5.01 Secondary education enrollment, gross %* .......55.2 ..........111
5.02 Tertiary education enrollment, gross %* ..............6.2 ..........117
5.03 Quality of the educational system.........................3.7 ............71
5.04 Quality of math and science education .................3.4 ............98
5.05 Quality of management schools............................4.2 ............64
5.06 Internet access in schools .....................................3.1 ..........104
5.07 Availability of research and training services.........3.5 ............98
5.08 Extent of staff training ...........................................3.8 ............77
INDICATOR SCORE RANK/139
6th pillar: Goods market efficiency6.01 Intensity of local competition ................................4.8 ............71
6.02 Extent of market dominance .................................4.2 ............44
6.03 Effectiveness of anti-monopoly policy...................4.0 ............65
6.04 Extent and effect of taxation .................................3.8 ............40
6.05 Total tax rate, % profits*.....................................32.7 ............42
6.06 No. procedures to start a business* .....................8.0 ............73
6.07 No. days to start a business*..............................33.0 ..........101
6.08 Agricultural policy costs.........................................3.8 ............71
6.09 Prevalence of trade barriers...................................4.9 ............40
6.10 Trade tariffs, % duty*..........................................10.0 ..........100
6.11 Prevalence of foreign ownership...........................4.9 ............55
6.12 Business impact of rules on FDI ...........................4.9 ............56
6.13 Burden of customs procedures.............................3.8 ............95
6.14 Degree of customer orientation ............................4.0 ..........111
6.15 Buyer sophistication ..............................................3.1 ............91
7th pillar: Labor market efficiency7.01 Cooperation in labor-employer relations................4.4 ............61
7.02 Flexibility of wage determination...........................4.2 ..........118
7.03 Rigidity of employment index, 0–100 (worst)*....27.0 ............67
7.04 Hiring and firing practices......................................4.1 ............57
7.05 Redundancy costs, weeks of wages*...............178.0 ..........131
7.06 Pay and productivity ..............................................3.1 ..........119
7.07 Reliance on professional management .................4.7 ............51
7.08 Brain drain..............................................................3.4 ............64
7.09 Females in labor force, ratio to males* .................1.0 ..............3
8th pillar: Financial market development8.01 Availability of financial services .............................4.3 ............78
8.02 Affordability of financial services ...........................3.9 ............89
8.03 Financing through local equity market...................4.0 ............38
8.04 Ease of access to loans.........................................2.3 ..........105
8.05 Venture capital availability......................................2.1 ..........111
8.06 Restriction on capital flows ...................................4.5 ............70
8.07 Soundness of banks ..............................................5.3 ............65
8.08 Regulation of securities exchanges.......................4.5 ............55
8.09 Legal rights index, 0–10 (best)* ............................7.0 ............39
9th pillar: Technological readiness9.01 Availability of latest technologies ..........................4.4 ............95
9.02 Firm-level technology absorption...........................4.1 ..........112
9.03 FDI and technology transfer ..................................4.5 ............83
9.04 Internet users/100 pop.* .......................................5.4 ..........117
9.05 Broadband Internet subscriptions/100 pop.*.........0.1 ..........113
9.06 Internet bandwidth, Mb/s per 10,000 pop.*..........1.0 ..........104
10th pillar: Market size10.01 Domestic market size index, 1–7 (best)* ..............3.1 ............83
10.02 Foreign market size index, 1–7 (best)*..................3.8 ............88
11th pillar: Business sophistication 11.01 Local supplier quantity...........................................4.6 ............83
11.02 Local supplier quality .............................................3.9 ..........106
11.03 State of cluster development ................................3.1 ............90
11.04 Nature of competitive advantage ..........................2.8 ..........105
11.05 Value chain breadth ...............................................3.0 ..........108
11.06 Control of international distribution .......................3.7 ............99
11.07 Production process sophistication.........................3.1 ..........104
11.08 Extent of marketing ...............................................3.5 ............96
11.09 Willingness to delegate authority ..........................3.2 ............91
12th pillar: Innovation12.01 Capacity for innovation ..........................................2.5 ..........110
12.02 Quality of scientific research institutions ..............3.8 ............64
12.03 Company spending on R&D ..................................2.3 ..........133
12.04 University-industry collaboration in R&D ...............3.1 ............98
12.05 Gov’t procurement of advanced tech products.....3.2 ..........101
12.06 Availability of scientists and engineers..................3.7 ............90
12.07 Utility patents/million pop.* ...................................0.0 ............90
Ghana
Notes: An asterisk (*) indicates that data are from sources other than the World Economic Forum. For further details and explanation, please refer to the section“How to Read the Competitiveness Profiles” on page 115.
The Africa Competitiveness Report 2011 © 2011 World Economic Forum, the World Bank and the African Development Bank
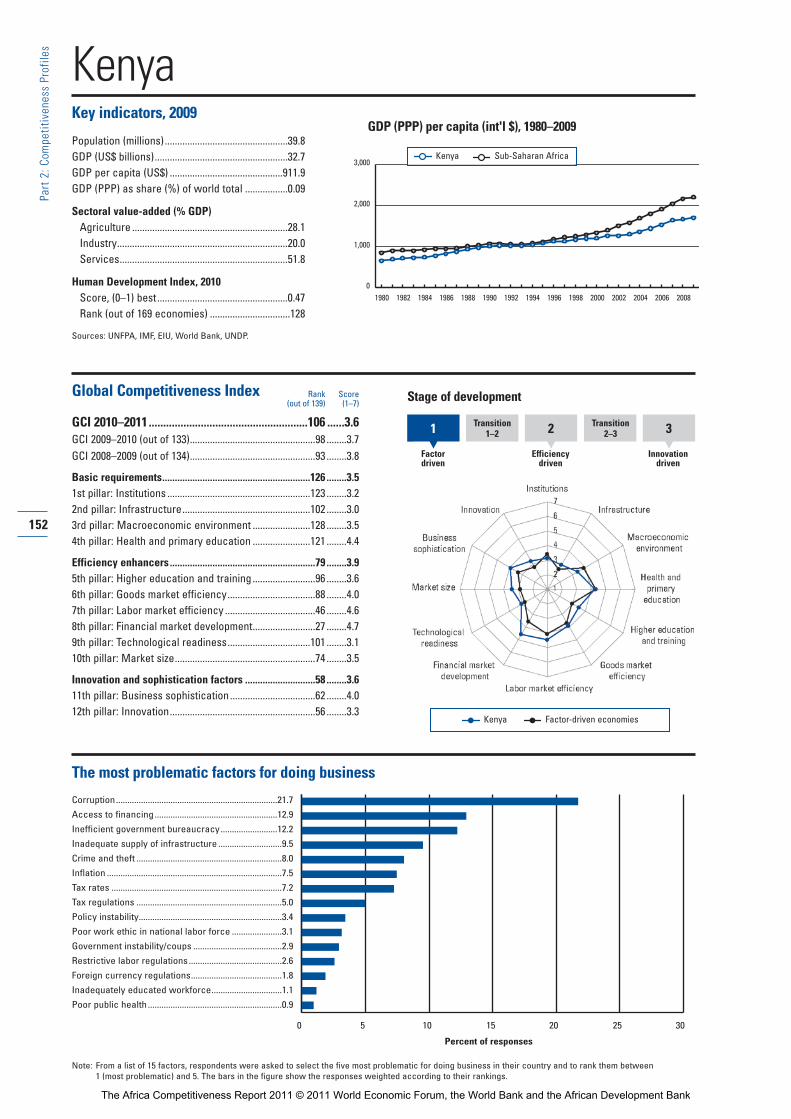
KenyaKey indicators, 2009
Population (millions).................................................39.8GDP (US$ billions).....................................................32.7GDP per capita (US$) .............................................911.9GDP (PPP) as share (%) of world total .................0.09
Sectoral value-added (% GDP)Agriculture ..............................................................28.1Industry....................................................................20.0Services...................................................................51.8
Human Development Index, 2010Score, (0–1) best....................................................0.47Rank (out of 169 economies) ................................128
Sources: UNFPA, IMF, EIU, World Bank, UNDP.
Global Competitiveness Index
GCI 2010–2011.......................................................106 ......3.6GCI 2009–2010 (out of 133)..................................................98 ........3.7GCI 2008–2009 (out of 134)..................................................93 ........3.8
Basic requirements...........................................................126 ........3.51st pillar: Institutions .........................................................123 ........3.22nd pillar: Infrastructure...................................................102 ........3.03rd pillar: Macroeconomic environment .......................128 ........3.54th pillar: Health and primary education .......................121 ........4.4
Efficiency enhancers..........................................................79 ........3.95th pillar: Higher education and training .........................96 ........3.66th pillar: Goods market efficiency...................................88 ........4.07th pillar: Labor market efficiency ....................................46 ........4.68th pillar: Financial market development.........................27 ........4.79th pillar: Technological readiness.................................101 ........3.110th pillar: Market size........................................................74 ........3.5
Innovation and sophistication factors ............................58 ........3.611th pillar: Business sophistication..................................62 ........4.012th pillar: Innovation..........................................................56 ........3.3
The most problematic factors for doing business
Corruption.......................................................................21.7
Access to financing......................................................12.9
Inefficient government bureaucracy.........................12.2
Inadequate supply of infrastructure ............................9.5
Crime and theft ................................................................8.0
Inflation .............................................................................7.5
Tax rates ...........................................................................7.2
Tax regulations ................................................................5.0
Policy instability...............................................................3.4
Poor work ethic in national labor force ......................3.1
Government instability/coups .......................................2.9
Restrictive labor regulations.........................................2.6
Foreign currency regulations........................................1.8
Inadequately educated workforce...............................1.1
Poor public health ...........................................................0.9
Rank Score(out of 139) (1–7)
152
Part 2:C
ompe
titiven
ess Profile
s
GDP (PPP) per capita (int'l $), 1980–2009
0 5 10 15 20 25 30
Percent of responses
Note: From a list of 15 factors, respondents were asked to select the five most problematic for doing business in their country and to rank them between 1 (most problematic) and 5. The bars in the figure show the responses weighted according to their rankings.
1 Transition1–2 2 Transition
2 –3
Factordriven
Efficiencydriven
Innovationdriven
3
Stage of development
Kenya Factor-driven economies
0
1,000
2,000
3,000
1980 1982 1984 1986 1988 1990 1992 1994 1996 1998 2000 2002 2004 20082006
Kenya Sub-Saharan Africa
The Africa Competitiveness Report 2011 © 2011 World Economic Forum, the World Bank and the African Development Bank

153
Part 2:C
ompe
titiven
ess Profile
s
The Global Competitiveness Index in detailINDICATOR SCORE RANK/139
1st pillar: Institutions1.01 Property rights .......................................................3.7 ..........103
1.02 Intellectual property protection..............................2.9 ............94
1.03 Diversion of public funds.......................................2.2 ..........127
1.04 Public trust of politicians........................................1.7 ..........129
1.05 Irregular payments and bribes...............................2.6 ..........134
1.06 Judicial independence ...........................................2.6 ..........121
1.07 Favoritism in decisions of government officials ....2.4 ..........121
1.08 Wastefulness of government spending ................2.7 ..........103
1.09 Burden of government regulation..........................2.8 ..........106
1.10 Efficiency of legal framework in settling disputes...3.1 ..........100
1.11 Efficiency of legal framework in challenging regs...3.0 ..........108
1.12 Transparency of government policymaking...........3.8 ..........109
1.13 Business costs of terrorism...................................4.1 ..........133
1.14 Business costs of crime and violence...................3.3 ..........124
1.15 Organized crime.....................................................4.0 ..........123
1.16 Reliability of police services...................................3.1 ..........117
1.17 Ethical behavior of firms........................................3.3 ..........117
1.18 Strength of auditing and reporting standards........4.7 ............66
1.19 Efficacy of corporate boards..................................4.3 ............92
1.20 Protection of minority shareholders’ interests ......3.9 ..........100
1.21 Strength of investor protection, 0–10 (best)*........5.0 ............77
2nd pillar: Infrastructure2.01 Quality of overall infrastructure .............................3.8 ............88
2.02 Quality of roads .....................................................3.6 ............77
2.03 Quality of railroad infrastructure ............................2.3 ............74
2.04 Quality of port infrastructure .................................3.8 ............85
2.05 Quality of air transport infrastructure ....................5.0 ............57
2.06 Available airline seat Kms/week, millions*........257.5 ............54
2.07 Quality of electricity supply ...................................3.4 ..........103
2.08 Fixed telephone lines/100 pop.* ...........................1.7 ..........118
2.09 Mobile telephone subscriptions/100 pop.* .........48.7 ..........114
3rd pillar: Macroeconomic environment3.01 Government budget balance, % GDP* ................-5.4 ............91
3.02 National savings rate, % GDP* ...........................15.2 ..........100
3.03 Inflation, annual % change* ................................11.8 ..........126
3.04 Interest rate spread, %*........................................8.8 ..........107
3.05 Government debt, % GDP* ................................66.7 ..........107
3.06 Country credit rating, 0–100 (worst)*..................28.6 ..........112
4th pillar: Health and primary education4.01 Business impact of malaria....................................3.9 ..........119
4.02 Malaria incidence/100,000 pop.*..................31,027.8 ..........126
4.03 Business impact of tuberculosis............................3.8 ..........126
4.04 Tuberculosis incidence/100,000 pop.* ..............327.6 ..........125
4.05 Business impact of HIV/AIDS................................3.3 ..........127
4.06 HIV prevalence, % adult pop.*..............................7.1 ..........130
4.07 Infant mortality, deaths/1,000 live births* ...........80.5 ..........128
4.08 Life expectancy, years*.......................................54.2 ..........123
4.09 Quality of primary education..................................4.0 ............61
4.10 Primary education enrollment, net %*................81.5 ..........118
5th pillar: Higher education and training5.01 Secondary education enrollment, gross %* .......58.3 ..........107
5.02 Tertiary education enrollment, gross %* ..............4.1 ..........123
5.03 Quality of the educational system.........................4.5 ............32
5.04 Quality of math and science education .................4.2 ............63
5.05 Quality of management schools............................4.5 ............51
5.06 Internet access in schools .....................................3.4 ............91
5.07 Availability of research and training services.........4.3 ............56
5.08 Extent of staff training ...........................................3.9 ............70
INDICATOR SCORE RANK/139
6th pillar: Goods market efficiency6.01 Intensity of local competition ................................5.1 ............55
6.02 Extent of market dominance .................................4.0 ............49
6.03 Effectiveness of anti-monopoly policy...................4.3 ............54
6.04 Extent and effect of taxation .................................2.8 ..........122
6.05 Total tax rate, % profits*.....................................49.7 ..........100
6.06 No. procedures to start a business* ...................12.0 ..........114
6.07 No. days to start a business*..............................34.0 ..........102
6.08 Agricultural policy costs.........................................3.7 ............80
6.09 Prevalence of trade barriers...................................4.3 ............87
6.10 Trade tariffs, % duty*............................................7.7 ............85
6.11 Prevalence of foreign ownership...........................4.7 ............69
6.12 Business impact of rules on FDI ...........................4.5 ............84
6.13 Burden of customs procedures.............................3.3 ..........120
6.14 Degree of customer orientation ............................4.9 ............48
6.15 Buyer sophistication ..............................................3.2 ............88
7th pillar: Labor market efficiency7.01 Cooperation in labor-employer relations................4.2 ............83
7.02 Flexibility of wage determination...........................5.0 ............81
7.03 Rigidity of employment index, 0–100 (worst)*....17.0 ............37
7.04 Hiring and firing practices......................................4.9 ............12
7.05 Redundancy costs, weeks of wages*.................47.0 ............81
7.06 Pay and productivity ..............................................4.0 ............67
7.07 Reliance on professional management .................4.2 ............79
7.08 Brain drain..............................................................3.6 ............56
7.09 Females in labor force, ratio to males* .................0.9 ............39
8th pillar: Financial market development8.01 Availability of financial services .............................5.0 ............53
8.02 Affordability of financial services ...........................4.3 ............67
8.03 Financing through local equity market...................4.4 ............21
8.04 Ease of access to loans.........................................3.7 ............21
8.05 Venture capital availability......................................3.1 ............35
8.06 Restriction on capital flows ...................................4.2 ............82
8.07 Soundness of banks ..............................................5.1 ............74
8.08 Regulation of securities exchanges.......................3.7 ............98
8.09 Legal rights index, 0–10 (best)* ..........................10.0 ..............1
9th pillar: Technological readiness9.01 Availability of latest technologies ..........................4.7 ............82
9.02 Firm-level technology absorption...........................4.9 ............67
9.03 FDI and technology transfer ..................................4.6 ............77
9.04 Internet users/100 pop.* .....................................10.0 ..........103
9.05 Broadband Internet subscriptions/100 pop.*.........0.0 ..........127
9.06 Internet bandwidth, Mb/s per 10,000 pop.*..........4.8 ............85
10th pillar: Market size10.01 Domestic market size index, 1–7 (best)* ..............3.4 ............74
10.02 Foreign market size index, 1–7 (best)*..................3.9 ............83
11th pillar: Business sophistication 11.01 Local supplier quantity...........................................4.9 ............57
11.02 Local supplier quality .............................................4.4 ............69
11.03 State of cluster development ................................4.0 ............43
11.04 Nature of competitive advantage ..........................3.3 ............65
11.05 Value chain breadth ...............................................3.6 ............63
11.06 Control of international distribution .......................4.2 ............53
11.07 Production process sophistication.........................3.7 ............66
11.08 Extent of marketing ...............................................4.0 ............73
11.09 Willingness to delegate authority ..........................3.6 ............63
12th pillar: Innovation12.01 Capacity for innovation ..........................................3.2 ............52
12.02 Quality of scientific research institutions ..............3.9 ............54
12.03 Company spending on R&D ..................................3.6 ............34
12.04 University-industry collaboration in R&D ...............3.8 ............55
12.05 Gov’t procurement of advanced tech products.....3.5 ............81
12.06 Availability of scientists and engineers..................4.0 ............70
12.07 Utility patents/million pop.* ...................................0.2 ............75
Kenya
Notes: An asterisk (*) indicates that data are from sources other than the World Economic Forum. For further details and explanation, please refer to the section“How to Read the Competitiveness Profiles” on page 115.
The Africa Competitiveness Report 2011 © 2011 World Economic Forum, the World Bank and the African Development Bank
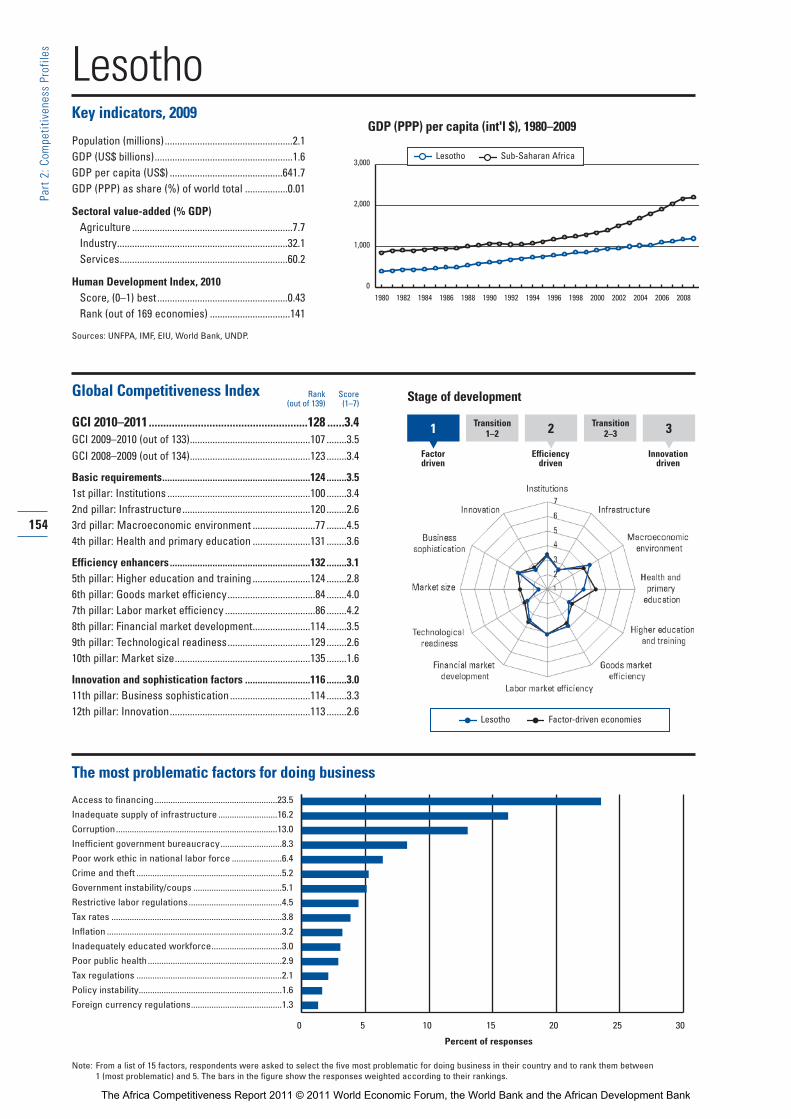
LesothoKey indicators, 2009
Population (millions)...................................................2.1GDP (US$ billions).......................................................1.6GDP per capita (US$) .............................................641.7GDP (PPP) as share (%) of world total .................0.01
Sectoral value-added (% GDP)Agriculture ................................................................7.7Industry....................................................................32.1Services...................................................................60.2
Human Development Index, 2010Score, (0–1) best....................................................0.43Rank (out of 169 economies) ................................141
Sources: UNFPA, IMF, EIU, World Bank, UNDP.
Global Competitiveness Index
GCI 2010–2011.......................................................128 ......3.4GCI 2009–2010 (out of 133)................................................107 ........3.5GCI 2008–2009 (out of 134)................................................123 ........3.4
Basic requirements...........................................................124 ........3.51st pillar: Institutions .........................................................100 ........3.42nd pillar: Infrastructure...................................................120 ........2.63rd pillar: Macroeconomic environment .........................77 ........4.54th pillar: Health and primary education .......................131 ........3.6
Efficiency enhancers........................................................132 ........3.15th pillar: Higher education and training .......................124 ........2.86th pillar: Goods market efficiency...................................84 ........4.07th pillar: Labor market efficiency ....................................86 ........4.28th pillar: Financial market development.......................114 ........3.59th pillar: Technological readiness.................................129 ........2.610th pillar: Market size......................................................135 ........1.6
Innovation and sophistication factors ..........................116 ........3.011th pillar: Business sophistication................................114 ........3.312th pillar: Innovation........................................................113 ........2.6
The most problematic factors for doing business
Access to financing......................................................23.5
Inadequate supply of infrastructure ..........................16.2
Corruption.......................................................................13.0
Inefficient government bureaucracy...........................8.3
Poor work ethic in national labor force ......................6.4
Crime and theft ................................................................5.2
Government instability/coups .......................................5.1
Restrictive labor regulations.........................................4.5
Tax rates ...........................................................................3.8
Inflation .............................................................................3.2
Inadequately educated workforce...............................3.0
Poor public health ...........................................................2.9
Tax regulations ................................................................2.1
Policy instability...............................................................1.6
Foreign currency regulations........................................1.3
Rank Score(out of 139) (1–7)
154
Part 2:C
ompe
titiven
ess Profile
s
GDP (PPP) per capita (int'l $), 1980–2009
0 5 10 15 20 25 30
Percent of responses
Note: From a list of 15 factors, respondents were asked to select the five most problematic for doing business in their country and to rank them between 1 (most problematic) and 5. The bars in the figure show the responses weighted according to their rankings.
1 Transition1–2 2 Transition
2 –3
Factordriven
Efficiencydriven
Innovationdriven
3
Stage of development
Lesotho Factor-driven economies
0
1,000
2,000
3,000
1980 1982 1984 1986 1988 1990 1992 1994 1996 1998 2000 2002 2004 20082006
Lesotho Sub-Saharan Africa
The Africa Competitiveness Report 2011 © 2011 World Economic Forum, the World Bank and the African Development Bank

155
Part 2:C
ompe
titiven
ess Profile
s
The Global Competitiveness Index in detailINDICATOR SCORE RANK/139
1st pillar: Institutions1.01 Property rights .......................................................3.7 ..........101
1.02 Intellectual property protection..............................3.0 ............92
1.03 Diversion of public funds.......................................3.2 ............73
1.04 Public trust of politicians........................................2.8 ............71
1.05 Irregular payments and bribes...............................3.4 ............98
1.06 Judicial independence ...........................................3.2 ............91
1.07 Favoritism in decisions of government officials ....2.7 ............90
1.08 Wastefulness of government spending ................3.1 ............78
1.09 Burden of government regulation..........................3.4 ............62
1.10 Efficiency of legal framework in settling disputes...3.0 ..........110
1.11 Efficiency of legal framework in challenging regs...2.7 ..........124
1.12 Transparency of government policymaking...........3.6 ..........122
1.13 Business costs of terrorism...................................5.3 ............90
1.14 Business costs of crime and violence...................3.9 ..........111
1.15 Organized crime.....................................................4.9 ............91
1.16 Reliability of police services...................................3.5 ..........102
1.17 Ethical behavior of firms........................................3.2 ..........119
1.18 Strength of auditing and reporting standards........3.9 ..........114
1.19 Efficacy of corporate boards..................................4.5 ............70
1.20 Protection of minority shareholders’ interests ......3.6 ..........114
1.21 Strength of investor protection, 0–10 (best)*........3.7 ..........119
2nd pillar: Infrastructure2.01 Quality of overall infrastructure .............................3.4 ..........104
2.02 Quality of roads .....................................................2.9 ..........109
2.03 Quality of railroad infrastructure ............................n/a ...........n/a
2.04 Quality of port infrastructure .................................3.1 ..........118
2.05 Quality of air transport infrastructure ....................2.3 ..........139
2.06 Available airline seat Kms/week, millions*............0.3 ..........139
2.07 Quality of electricity supply ...................................3.6 ............99
2.08 Fixed telephone lines/100 pop.* ...........................1.9 ..........117
2.09 Mobile telephone subscriptions/100 pop.* .........32.0 ..........125
3rd pillar: Macroeconomic environment3.01 Government budget balance, % GDP* ................-4.1 ............75
3.02 National savings rate, % GDP* ...........................33.0 ............15
3.03 Inflation, annual % change* ..................................7.7 ..........112
3.04 Interest rate spread, %*........................................8.1 ..........100
3.05 Government debt, % GDP* ................................41.4 ............72
3.06 Country credit rating, 0–100 (worst)*..................35.3 ............92
4th pillar: Health and primary education4.01 Business impact of malaria ..............................n/appl. ..............1
4.02 Malaria incidence/100,000 pop.* .........................(NE) ..............1
4.03 Business impact of tuberculosis............................3.0 ..........137
4.04 Tuberculosis incidence/100,000 pop.* ..............635.4 ..........134
4.05 Business impact of HIV/AIDS................................2.5 ..........137
4.06 HIV prevalence, % adult pop.*............................23.2 ..........137
4.07 Infant mortality, deaths/1,000 live births* ...........63.1 ..........116
4.08 Life expectancy, years*.......................................45.0 ..........138
4.09 Quality of primary education..................................3.2 ............95
4.10 Primary education enrollment, net %*................72.7 ..........128
5th pillar: Higher education and training5.01 Secondary education enrollment, gross %* .......39.9 ..........120
5.02 Tertiary education enrollment, gross %* ..............3.6 ..........128
5.03 Quality of the educational system.........................3.6 ............77
5.04 Quality of math and science education .................3.4 ..........100
5.05 Quality of management schools............................3.5 ..........111
5.06 Internet access in schools .....................................2.1 ..........132
5.07 Availability of research and training services.........3.2 ..........117
5.08 Extent of staff training ...........................................3.8 ............83
INDICATOR SCORE RANK/139
6th pillar: Goods market efficiency6.01 Intensity of local competition ................................4.2 ..........110
6.02 Extent of market dominance .................................3.3 ..........103
6.03 Effectiveness of anti-monopoly policy...................3.6 ............99
6.04 Extent and effect of taxation .................................3.4 ............80
6.05 Total tax rate, % profits*.....................................18.5 ............12
6.06 No. procedures to start a business* .....................7.0 ............57
6.07 No. days to start a business*..............................40.0 ..........112
6.08 Agricultural policy costs.........................................3.2 ..........128
6.09 Prevalence of trade barriers...................................3.9 ..........115
6.10 Trade tariffs, % duty*............................................6.1 ............74
6.11 Prevalence of foreign ownership...........................4.8 ............61
6.12 Business impact of rules on FDI ...........................4.6 ............80
6.13 Burden of customs procedures.............................3.8 ............92
6.14 Degree of customer orientation ............................4.3 ............85
6.15 Buyer sophistication ..............................................2.7 ..........122
7th pillar: Labor market efficiency7.01 Cooperation in labor-employer relations................4.0 ..........102
7.02 Flexibility of wage determination...........................4.5 ..........109
7.03 Rigidity of employment index, 0–100 (worst)*....14.0 ............33
7.04 Hiring and firing practices......................................3.9 ............68
7.05 Redundancy costs, weeks of wages*.................44.0 ............78
7.06 Pay and productivity ..............................................3.1 ..........123
7.07 Reliance on professional management .................3.9 ............92
7.08 Brain drain..............................................................2.0 ..........133
7.09 Females in labor force, ratio to males* .................0.9 ............21
8th pillar: Financial market development8.01 Availability of financial services .............................3.0 ..........134
8.02 Affordability of financial services ...........................3.1 ..........130
8.03 Financing through local equity market...................2.1 ..........130
8.04 Ease of access to loans.........................................2.3 ..........101
8.05 Venture capital availability......................................2.1 ..........116
8.06 Restriction on capital flows ...................................3.7 ..........108
8.07 Soundness of banks ..............................................4.5 ..........108
8.08 Regulation of securities exchanges.......................2.9 ..........125
8.09 Legal rights index, 0–10 (best)* ............................7.0 ............39
9th pillar: Technological readiness9.01 Availability of latest technologies ..........................4.1 ..........125
9.02 Firm-level technology absorption...........................4.1 ..........114
9.03 FDI and technology transfer ..................................3.8 ..........122
9.04 Internet users/100 pop.* .......................................3.7 ..........123
9.05 Broadband Internet subscriptions/100 pop.*.........0.0 ..........130
9.06 Internet bandwidth, Mb/s per 10,000 pop.*..........0.0 ..........131
10th pillar: Market size10.01 Domestic market size index, 1–7 (best)* ..............1.4 ..........136
10.02 Foreign market size index, 1–7 (best)*..................2.1 ..........133
11th pillar: Business sophistication 11.01 Local supplier quantity...........................................3.6 ..........135
11.02 Local supplier quality .............................................3.4 ..........133
11.03 State of cluster development ................................3.4 ............72
11.04 Nature of competitive advantage ..........................3.2 ............75
11.05 Value chain breadth ...............................................3.1 ............95
11.06 Control of international distribution .......................3.1 ..........129
11.07 Production process sophistication.........................2.6 ..........127
11.08 Extent of marketing ...............................................3.0 ..........125
11.09 Willingness to delegate authority ..........................3.5 ............74
12th pillar: Innovation12.01 Capacity for innovation ..........................................2.2 ..........133
12.02 Quality of scientific research institutions ..............2.7 ..........118
12.03 Company spending on R&D ..................................3.1 ............59
12.04 University-industry collaboration in R&D ...............3.1 ..........107
12.05 Gov’t procurement of advanced tech products.....3.2 ............99
12.06 Availability of scientists and engineers..................3.1 ..........127
12.07 Utility patents/million pop.* ...................................0.0 ............90
Lesotho
Notes: An asterisk (*) indicates that data are from sources other than the World Economic Forum. For further details and explanation, please refer to the section“How to Read the Competitiveness Profiles” on page 115.
The Africa Competitiveness Report 2011 © 2011 World Economic Forum, the World Bank and the African Development Bank
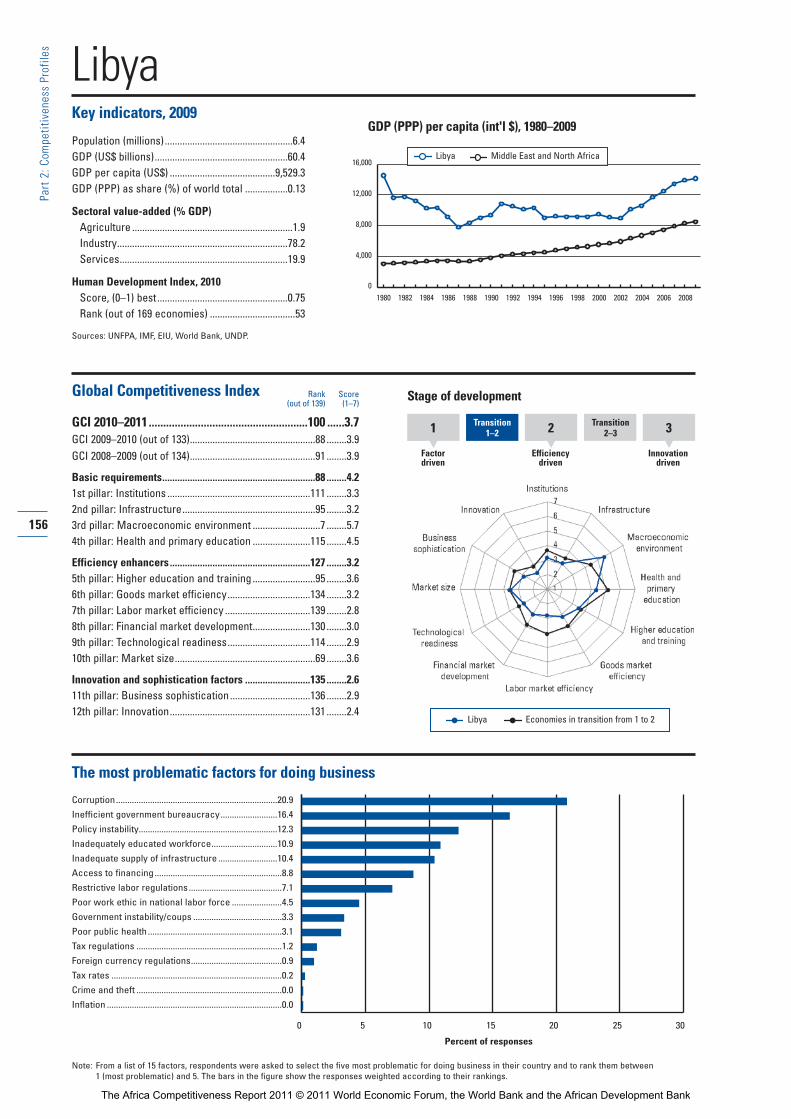
LibyaKey indicators, 2009
Population (millions)...................................................6.4GDP (US$ billions).....................................................60.4GDP per capita (US$) ..........................................9,529.3GDP (PPP) as share (%) of world total .................0.13
Sectoral value-added (% GDP)Agriculture ................................................................1.9Industry....................................................................78.2Services...................................................................19.9
Human Development Index, 2010Score, (0–1) best....................................................0.75Rank (out of 169 economies) ..................................53
Sources: UNFPA, IMF, EIU, World Bank, UNDP.
Global Competitiveness Index
GCI 2010–2011.......................................................100 ......3.7GCI 2009–2010 (out of 133)..................................................88 ........3.9GCI 2008–2009 (out of 134)..................................................91 ........3.9
Basic requirements.............................................................88 ........4.21st pillar: Institutions .........................................................111 ........3.32nd pillar: Infrastructure.....................................................95 ........3.23rd pillar: Macroeconomic environment ...........................7 ........5.74th pillar: Health and primary education .......................115 ........4.5
Efficiency enhancers........................................................127 ........3.25th pillar: Higher education and training .........................95 ........3.66th pillar: Goods market efficiency.................................134 ........3.27th pillar: Labor market efficiency ..................................139 ........2.88th pillar: Financial market development.......................130 ........3.09th pillar: Technological readiness.................................114 ........2.910th pillar: Market size........................................................69 ........3.6
Innovation and sophistication factors ..........................135 ........2.611th pillar: Business sophistication................................136 ........2.912th pillar: Innovation........................................................131 ........2.4
The most problematic factors for doing business
Corruption.......................................................................20.9
Inefficient government bureaucracy.........................16.4
Policy instability.............................................................12.3
Inadequately educated workforce.............................10.9
Inadequate supply of infrastructure ..........................10.4
Access to financing........................................................8.8
Restrictive labor regulations.........................................7.1
Poor work ethic in national labor force ......................4.5
Government instability/coups .......................................3.3
Poor public health ...........................................................3.1
Tax regulations ................................................................1.2
Foreign currency regulations........................................0.9
Tax rates ...........................................................................0.2
Crime and theft ................................................................0.0
Inflation .............................................................................0.0
156
Part 2:C
ompe
titiven
ess Profile
s
GDP (PPP) per capita (int'l $), 1980–2009
0 5 10 15 20 25 30
Percent of responses
Note: From a list of 15 factors, respondents were asked to select the five most problematic for doing business in their country and to rank them between 1 (most problematic) and 5. The bars in the figure show the responses weighted according to their rankings.
1 Transition1–2 2 Transition
2 –3
Factordriven
Efficiencydriven
Innovationdriven
3
Stage of development
Libya Economies in transition from 1 to 2
0
4,000
8,000
12,000
16,000
1980 1982 1984 1986 1988 1990 1992 1994 1996 1998 2000 2002 2004 20082006
Libya Middle East and North Africa
Rank Score(out of 139) (1–7)
The Africa Competitiveness Report 2011 © 2011 World Economic Forum, the World Bank and the African Development Bank
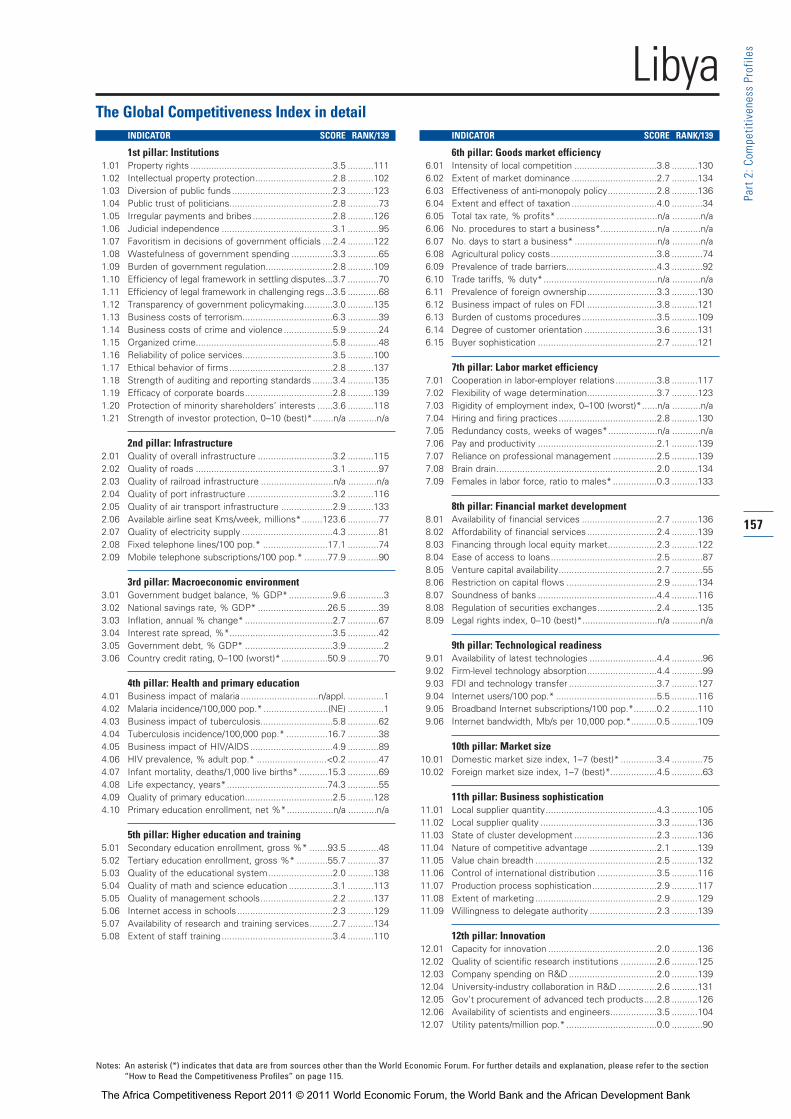
157
Part 2:C
ompe
titiven
ess Profile
s
The Global Competitiveness Index in detailINDICATOR SCORE RANK/139
1st pillar: Institutions1.01 Property rights .......................................................3.5 ..........111
1.02 Intellectual property protection..............................2.8 ..........102
1.03 Diversion of public funds.......................................2.3 ..........123
1.04 Public trust of politicians........................................2.8 ............73
1.05 Irregular payments and bribes...............................2.8 ..........126
1.06 Judicial independence ...........................................3.1 ............95
1.07 Favoritism in decisions of government officials ....2.4 ..........122
1.08 Wastefulness of government spending ................3.3 ............65
1.09 Burden of government regulation..........................2.8 ..........109
1.10 Efficiency of legal framework in settling disputes...3.7 ............70
1.11 Efficiency of legal framework in challenging regs...3.5 ............68
1.12 Transparency of government policymaking...........3.0 ..........135
1.13 Business costs of terrorism...................................6.3 ............39
1.14 Business costs of crime and violence...................5.9 ............24
1.15 Organized crime.....................................................5.8 ............48
1.16 Reliability of police services...................................3.5 ..........100
1.17 Ethical behavior of firms........................................2.8 ..........137
1.18 Strength of auditing and reporting standards........3.4 ..........135
1.19 Efficacy of corporate boards..................................2.8 ..........139
1.20 Protection of minority shareholders’ interests ......3.6 ..........118
1.21 Strength of investor protection, 0–10 (best)*........n/a ...........n/a
2nd pillar: Infrastructure2.01 Quality of overall infrastructure .............................3.2 ..........115
2.02 Quality of roads .....................................................3.1 ............97
2.03 Quality of railroad infrastructure ............................n/a ...........n/a
2.04 Quality of port infrastructure .................................3.2 ..........116
2.05 Quality of air transport infrastructure ....................2.9 ..........133
2.06 Available airline seat Kms/week, millions*........123.6 ............77
2.07 Quality of electricity supply ...................................4.3 ............81
2.08 Fixed telephone lines/100 pop.* .........................17.1 ............74
2.09 Mobile telephone subscriptions/100 pop.* .........77.9 ............90
3rd pillar: Macroeconomic environment3.01 Government budget balance, % GDP* .................9.6 ..............3
3.02 National savings rate, % GDP* ...........................26.5 ............39
3.03 Inflation, annual % change* ..................................2.7 ............67
3.04 Interest rate spread, %*........................................3.5 ............42
3.05 Government debt, % GDP* ..................................3.9 ..............2
3.06 Country credit rating, 0–100 (worst)*..................50.9 ............70
4th pillar: Health and primary education4.01 Business impact of malaria ..............................n/appl. ..............1
4.02 Malaria incidence/100,000 pop.* .........................(NE) ..............1
4.03 Business impact of tuberculosis............................5.8 ............62
4.04 Tuberculosis incidence/100,000 pop.* ................16.7 ............38
4.05 Business impact of HIV/AIDS................................4.9 ............89
4.06 HIV prevalence, % adult pop.* ...........................<0.2 ............47
4.07 Infant mortality, deaths/1,000 live births* ...........15.3 ............69
4.08 Life expectancy, years*.......................................74.3 ............55
4.09 Quality of primary education..................................2.5 ..........128
4.10 Primary education enrollment, net %*..................n/a ...........n/a
5th pillar: Higher education and training5.01 Secondary education enrollment, gross %* .......93.5 ............48
5.02 Tertiary education enrollment, gross %* ............55.7 ............37
5.03 Quality of the educational system.........................2.0 ..........138
5.04 Quality of math and science education .................3.1 ..........113
5.05 Quality of management schools............................2.2 ..........137
5.06 Internet access in schools .....................................2.3 ..........129
5.07 Availability of research and training services.........2.7 ..........134
5.08 Extent of staff training ...........................................3.4 ..........110
INDICATOR SCORE RANK/139
6th pillar: Goods market efficiency6.01 Intensity of local competition ................................3.8 ..........130
6.02 Extent of market dominance .................................2.7 ..........134
6.03 Effectiveness of anti-monopoly policy...................2.8 ..........136
6.04 Extent and effect of taxation .................................4.0 ............34
6.05 Total tax rate, % profits* .......................................n/a ...........n/a
6.06 No. procedures to start a business*......................n/a ...........n/a
6.07 No. days to start a business* ................................n/a ...........n/a
6.08 Agricultural policy costs.........................................3.8 ............74
6.09 Prevalence of trade barriers...................................4.3 ............92
6.10 Trade tariffs, % duty*............................................n/a ...........n/a
6.11 Prevalence of foreign ownership...........................3.3 ..........130
6.12 Business impact of rules on FDI ...........................3.8 ..........121
6.13 Burden of customs procedures.............................3.5 ..........109
6.14 Degree of customer orientation ............................3.6 ..........131
6.15 Buyer sophistication ..............................................2.7 ..........121
7th pillar: Labor market efficiency7.01 Cooperation in labor-employer relations................3.8 ..........117
7.02 Flexibility of wage determination...........................3.7 ..........123
7.03 Rigidity of employment index, 0–100 (worst)*......n/a ...........n/a
7.04 Hiring and firing practices......................................2.8 ..........130
7.05 Redundancy costs, weeks of wages*...................n/a ...........n/a
7.06 Pay and productivity ..............................................2.1 ..........139
7.07 Reliance on professional management .................2.5 ..........139
7.08 Brain drain..............................................................2.0 ..........134
7.09 Females in labor force, ratio to males* .................0.3 ..........133
8th pillar: Financial market development8.01 Availability of financial services .............................2.7 ..........136
8.02 Affordability of financial services ...........................2.4 ..........139
8.03 Financing through local equity market...................2.3 ..........122
8.04 Ease of access to loans.........................................2.5 ............87
8.05 Venture capital availability......................................2.7 ............55
8.06 Restriction on capital flows ...................................2.9 ..........134
8.07 Soundness of banks ..............................................4.4 ..........116
8.08 Regulation of securities exchanges.......................2.4 ..........135
8.09 Legal rights index, 0–10 (best)*.............................n/a ...........n/a
9th pillar: Technological readiness9.01 Availability of latest technologies ..........................4.4 ............96
9.02 Firm-level technology absorption...........................4.4 ............99
9.03 FDI and technology transfer ..................................3.7 ..........127
9.04 Internet users/100 pop.* .......................................5.5 ..........116
9.05 Broadband Internet subscriptions/100 pop.*.........0.2 ..........110
9.06 Internet bandwidth, Mb/s per 10,000 pop.*..........0.5 ..........109
10th pillar: Market size10.01 Domestic market size index, 1–7 (best)* ..............3.4 ............75
10.02 Foreign market size index, 1–7 (best)*..................4.5 ............63
11th pillar: Business sophistication 11.01 Local supplier quantity...........................................4.3 ..........105
11.02 Local supplier quality .............................................3.3 ..........136
11.03 State of cluster development ................................2.3 ..........136
11.04 Nature of competitive advantage ..........................2.1 ..........139
11.05 Value chain breadth ...............................................2.5 ..........132
11.06 Control of international distribution .......................3.5 ..........116
11.07 Production process sophistication.........................2.9 ..........117
11.08 Extent of marketing ...............................................2.9 ..........129
11.09 Willingness to delegate authority ..........................2.3 ..........139
12th pillar: Innovation12.01 Capacity for innovation ..........................................2.0 ..........136
12.02 Quality of scientific research institutions ..............2.6 ..........125
12.03 Company spending on R&D ..................................2.0 ..........139
12.04 University-industry collaboration in R&D ...............2.6 ..........131
12.05 Gov’t procurement of advanced tech products.....2.8 ..........126
12.06 Availability of scientists and engineers..................3.5 ..........104
12.07 Utility patents/million pop.* ...................................0.0 ............90
Libya
Notes: An asterisk (*) indicates that data are from sources other than the World Economic Forum. For further details and explanation, please refer to the section“How to Read the Competitiveness Profiles” on page 115.
The Africa Competitiveness Report 2011 © 2011 World Economic Forum, the World Bank and the African Development Bank
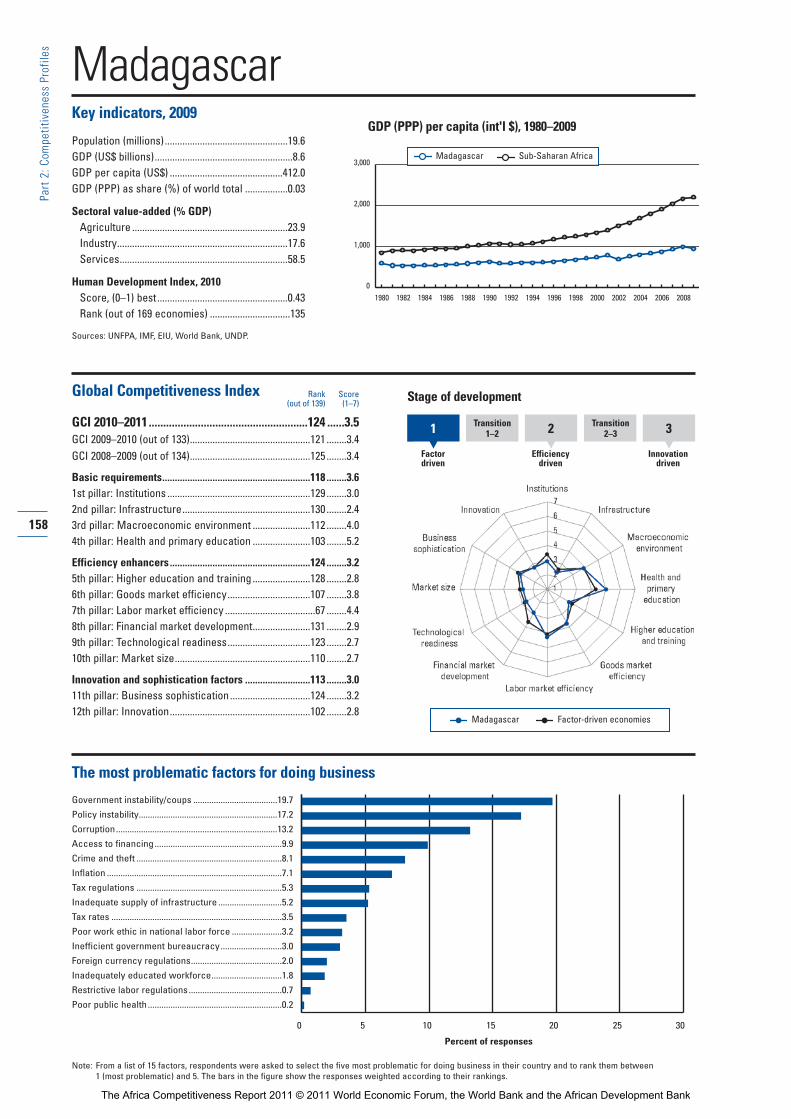
MadagascarKey indicators, 2009
Population (millions).................................................19.6GDP (US$ billions).......................................................8.6GDP per capita (US$) .............................................412.0GDP (PPP) as share (%) of world total .................0.03
Sectoral value-added (% GDP)Agriculture ..............................................................23.9Industry....................................................................17.6Services...................................................................58.5
Human Development Index, 2010Score, (0–1) best....................................................0.43Rank (out of 169 economies) ................................135
Sources: UNFPA, IMF, EIU, World Bank, UNDP.
Global Competitiveness Index
GCI 2010–2011.......................................................124 ......3.5GCI 2009–2010 (out of 133)................................................121 ........3.4GCI 2008–2009 (out of 134)................................................125 ........3.4
Basic requirements...........................................................118 ........3.61st pillar: Institutions .........................................................129 ........3.02nd pillar: Infrastructure...................................................130 ........2.43rd pillar: Macroeconomic environment .......................112 ........4.04th pillar: Health and primary education .......................103 ........5.2
Efficiency enhancers........................................................124 ........3.25th pillar: Higher education and training .......................128 ........2.86th pillar: Goods market efficiency.................................107 ........3.87th pillar: Labor market efficiency ....................................67 ........4.48th pillar: Financial market development.......................131 ........2.99th pillar: Technological readiness.................................123 ........2.710th pillar: Market size......................................................110 ........2.7
Innovation and sophistication factors ..........................113 ........3.011th pillar: Business sophistication................................124 ........3.212th pillar: Innovation........................................................102 ........2.8
The most problematic factors for doing business
Government instability/coups .....................................19.7
Policy instability.............................................................17.2
Corruption.......................................................................13.2
Access to financing........................................................9.9
Crime and theft ................................................................8.1
Inflation .............................................................................7.1
Tax regulations ................................................................5.3
Inadequate supply of infrastructure ............................5.2
Tax rates ...........................................................................3.5
Poor work ethic in national labor force ......................3.2
Inefficient government bureaucracy...........................3.0
Foreign currency regulations........................................2.0
Inadequately educated workforce...............................1.8
Restrictive labor regulations.........................................0.7
Poor public health ...........................................................0.2
Rank Score(out of 139) (1–7)
158
Part 2:C
ompe
titiven
ess Profile
s
GDP (PPP) per capita (int'l $), 1980–2009
0 5 10 15 20 25 30
Percent of responses
Note: From a list of 15 factors, respondents were asked to select the five most problematic for doing business in their country and to rank them between 1 (most problematic) and 5. The bars in the figure show the responses weighted according to their rankings.
1 Transition1–2 2 Transition
2 –3
Factordriven
Efficiencydriven
Innovationdriven
3
Stage of development
Madagascar Factor-driven economies
0
1,000
2,000
3,000
1980 1982 1984 1986 1988 1990 1992 1994 1996 1998 2000 2002 2004 20082006
Madagascar Sub-Saharan Africa
The Africa Competitiveness Report 2011 © 2011 World Economic Forum, the World Bank and the African Development Bank

159
Part 2:C
ompe
titiven
ess Profile
s
The Global Competitiveness Index in detailINDICATOR SCORE RANK/139
1st pillar: Institutions1.01 Property rights .......................................................3.0 ..........126
1.02 Intellectual property protection..............................2.2 ..........134
1.03 Diversion of public funds.......................................2.6 ..........111
1.04 Public trust of politicians........................................1.6 ..........135
1.05 Irregular payments and bribes...............................3.1 ..........113
1.06 Judicial independence ...........................................2.5 ..........126
1.07 Favoritism in decisions of government officials ....2.6 ..........100
1.08 Wastefulness of government spending ................2.5 ..........109
1.09 Burden of government regulation..........................3.0 ............93
1.10 Efficiency of legal framework in settling disputes...2.8 ..........121
1.11 Efficiency of legal framework in challenging regs...3.0 ..........106
1.12 Transparency of government policymaking...........3.5 ..........128
1.13 Business costs of terrorism...................................4.7 ..........122
1.14 Business costs of crime and violence...................3.4 ..........122
1.15 Organized crime.....................................................4.3 ..........110
1.16 Reliability of police services...................................2.7 ..........127
1.17 Ethical behavior of firms........................................3.1 ..........126
1.18 Strength of auditing and reporting standards........3.3 ..........136
1.19 Efficacy of corporate boards..................................4.2 ............97
1.20 Protection of minority shareholders’ interests ......3.5 ..........120
1.21 Strength of investor protection, 0–10 (best)*........5.7 ............45
2nd pillar: Infrastructure2.01 Quality of overall infrastructure .............................3.2 ..........112
2.02 Quality of roads .....................................................2.9 ..........106
2.03 Quality of railroad infrastructure ............................1.7 ............96
2.04 Quality of port infrastructure .................................3.4 ..........108
2.05 Quality of air transport infrastructure ....................3.8 ..........106
2.06 Available airline seat Kms/week, millions*..........37.6 ..........103
2.07 Quality of electricity supply ...................................2.6 ..........121
2.08 Fixed telephone lines/100 pop.* ...........................0.9 ..........128
2.09 Mobile telephone subscriptions/100 pop.* .........30.6 ..........127
3rd pillar: Macroeconomic environment3.01 Government budget balance, % GDP* ................-2.3 ............36
3.02 National savings rate, % GDP* ...........................33.1 ............14
3.03 Inflation, annual % change* ..................................9.0 ..........117
3.04 Interest rate spread, %*......................................33.2 ..........135
3.05 Government debt, % GDP* ................................24.2 ............39
3.06 Country credit rating, 0–100 (worst)*..................23.9 ..........124
4th pillar: Health and primary education4.01 Business impact of malaria....................................3.5 ..........121
4.02 Malaria incidence/100,000 pop.*....................3,355.9 ..........115
4.03 Business impact of tuberculosis............................4.5 ..........105
4.04 Tuberculosis incidence/100,000 pop.* ..............255.9 ..........114
4.05 Business impact of HIV/AIDS................................4.7 ............97
4.06 HIV prevalence, % adult pop.*..............................0.1 ............22
4.07 Infant mortality, deaths/1,000 live births* ...........68.1 ..........119
4.08 Life expectancy, years*.......................................60.3 ..........114
4.09 Quality of primary education..................................3.0 ..........107
4.10 Primary education enrollment, net %*................98.5 ............23
5th pillar: Higher education and training5.01 Secondary education enrollment, gross %* .......30.1 ..........128
5.02 Tertiary education enrollment, gross %* ..............3.4 ..........130
5.03 Quality of the educational system.........................3.3 ............92
5.04 Quality of math and science education .................3.6 ............85
5.05 Quality of management schools............................4.0 ............77
5.06 Internet access in schools .....................................2.7 ..........118
5.07 Availability of research and training services.........3.3 ..........110
5.08 Extent of staff training ...........................................3.3 ..........114
INDICATOR SCORE RANK/139
6th pillar: Goods market efficiency6.01 Intensity of local competition ................................4.3 ..........103
6.02 Extent of market dominance .................................3.2 ..........111
6.03 Effectiveness of anti-monopoly policy...................3.2 ..........122
6.04 Extent and effect of taxation .................................3.1 ..........105
6.05 Total tax rate, % profits*.....................................39.2 ............64
6.06 No. procedures to start a business* .....................2.0 ..............3
6.07 No. days to start a business*................................7.0 ............21
6.08 Agricultural policy costs.........................................3.7 ............87
6.09 Prevalence of trade barriers...................................4.4 ............80
6.10 Trade tariffs, % duty*............................................9.0 ............94
6.11 Prevalence of foreign ownership...........................4.0 ..........115
6.12 Business impact of rules on FDI ...........................3.9 ..........111
6.13 Burden of customs procedures.............................3.9 ............88
6.14 Degree of customer orientation ............................4.4 ............83
6.15 Buyer sophistication ..............................................2.3 ..........134
7th pillar: Labor market efficiency7.01 Cooperation in labor-employer relations................4.2 ............76
7.02 Flexibility of wage determination...........................5.1 ............68
7.03 Rigidity of employment index, 0–100 (worst)*....56.0 ..........127
7.04 Hiring and firing practices......................................4.5 ............30
7.05 Redundancy costs, weeks of wages*.................30.0 ............58
7.06 Pay and productivity ..............................................3.8 ............84
7.07 Reliance on professional management .................4.1 ............83
7.08 Brain drain..............................................................2.8 ............95
7.09 Females in labor force, ratio to males* .................0.9 ............10
8th pillar: Financial market development8.01 Availability of financial services .............................3.6 ..........117
8.02 Affordability of financial services ...........................2.9 ..........131
8.03 Financing through local equity market...................1.8 ..........136
8.04 Ease of access to loans.........................................2.9 ............58
8.05 Venture capital availability......................................2.5 ............70
8.06 Restriction on capital flows ...................................3.0 ..........131
8.07 Soundness of banks ..............................................4.8 ............89
8.08 Regulation of securities exchanges.......................2.2 ..........136
8.09 Legal rights index, 0–10 (best)* ............................2.0 ..........129
9th pillar: Technological readiness9.01 Availability of latest technologies ..........................4.3 ..........105
9.02 Firm-level technology absorption...........................4.2 ..........107
9.03 FDI and technology transfer ..................................4.2 ............97
9.04 Internet users/100 pop.* .......................................1.6 ..........132
9.05 Broadband Internet subscriptions/100 pop.*.........0.0 ..........126
9.06 Internet bandwidth, Mb/s per 10,000 pop.*..........0.1 ..........127
10th pillar: Market size10.01 Domestic market size index, 1–7 (best)* ..............2.6 ..........105
10.02 Foreign market size index, 1–7 (best)*..................2.9 ..........121
11th pillar: Business sophistication 11.01 Local supplier quantity...........................................4.6 ............78
11.02 Local supplier quality .............................................3.9 ..........111
11.03 State of cluster development ................................2.6 ..........125
11.04 Nature of competitive advantage ..........................2.6 ..........121
11.05 Value chain breadth ...............................................2.9 ..........113
11.06 Control of international distribution .......................3.1 ..........131
11.07 Production process sophistication.........................2.5 ..........131
11.08 Extent of marketing ...............................................2.8 ..........130
11.09 Willingness to delegate authority ..........................2.9 ..........118
12th pillar: Innovation12.01 Capacity for innovation ..........................................2.6 ............98
12.02 Quality of scientific research institutions ..............2.8 ..........115
12.03 Company spending on R&D ..................................2.6 ..........115
12.04 University-industry collaboration in R&D ...............3.1 ..........100
12.05 Gov’t procurement of advanced tech products.....3.5 ............79
12.06 Availability of scientists and engineers..................4.4 ............52
12.07 Utility patents/million pop.* ...................................0.0 ............90
Madagascar
Notes: An asterisk (*) indicates that data are from sources other than the World Economic Forum. For further details and explanation, please refer to the section“How to Read the Competitiveness Profiles” on page 115.
The Africa Competitiveness Report 2011 © 2011 World Economic Forum, the World Bank and the African Development Bank
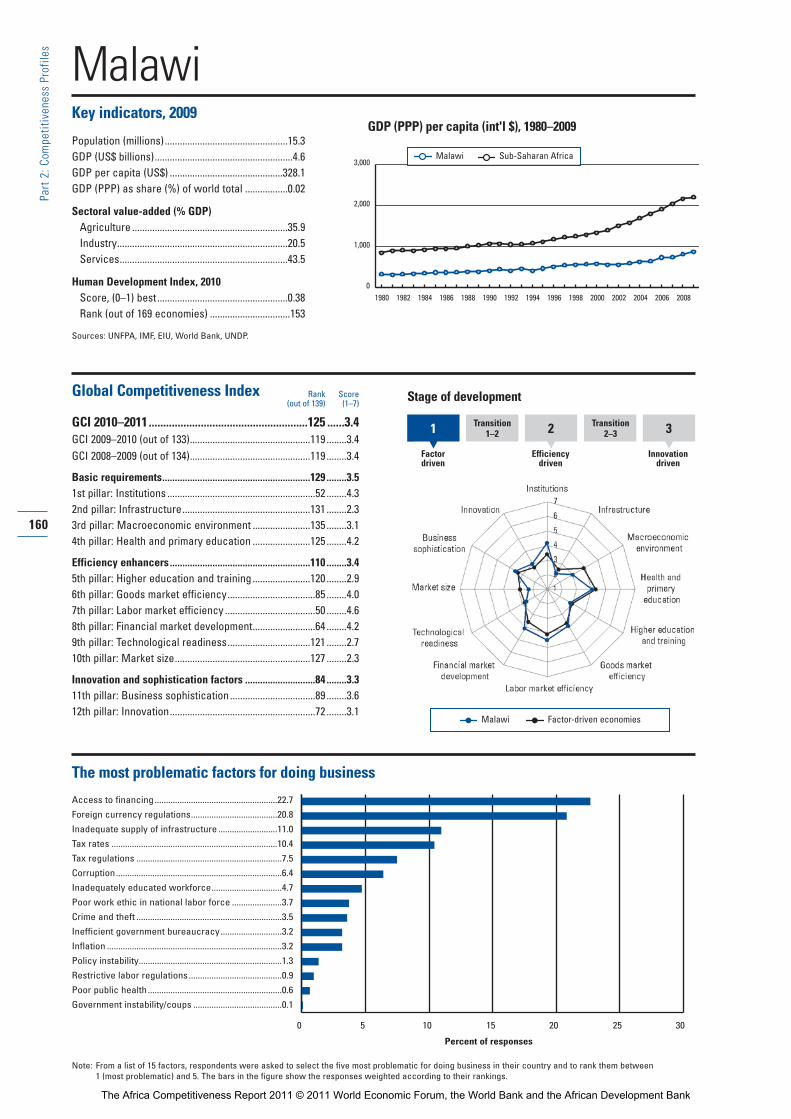
MalawiKey indicators, 2009
Population (millions).................................................15.3GDP (US$ billions).......................................................4.6GDP per capita (US$) .............................................328.1GDP (PPP) as share (%) of world total .................0.02
Sectoral value-added (% GDP)Agriculture ..............................................................35.9Industry....................................................................20.5Services...................................................................43.5
Human Development Index, 2010Score, (0–1) best....................................................0.38Rank (out of 169 economies) ................................153
Sources: UNFPA, IMF, EIU, World Bank, UNDP.
Global Competitiveness Index
GCI 2010–2011.......................................................125 ......3.4GCI 2009–2010 (out of 133)................................................119 ........3.4GCI 2008–2009 (out of 134)................................................119 ........3.4
Basic requirements...........................................................129 ........3.51st pillar: Institutions ...........................................................52 ........4.32nd pillar: Infrastructure...................................................131 ........2.33rd pillar: Macroeconomic environment .......................135 ........3.14th pillar: Health and primary education .......................125 ........4.2
Efficiency enhancers........................................................110 ........3.45th pillar: Higher education and training .......................120 ........2.96th pillar: Goods market efficiency...................................85 ........4.07th pillar: Labor market efficiency ....................................50 ........4.68th pillar: Financial market development.........................64 ........4.29th pillar: Technological readiness.................................121 ........2.710th pillar: Market size......................................................127 ........2.3
Innovation and sophistication factors ............................84 ........3.311th pillar: Business sophistication..................................89 ........3.612th pillar: Innovation..........................................................72 ........3.1
The most problematic factors for doing business
Access to financing......................................................22.7
Foreign currency regulations......................................20.8
Inadequate supply of infrastructure ..........................11.0
Tax rates .........................................................................10.4
Tax regulations ................................................................7.5
Corruption.........................................................................6.4
Inadequately educated workforce...............................4.7
Poor work ethic in national labor force ......................3.7
Crime and theft ................................................................3.5
Inefficient government bureaucracy...........................3.2
Inflation .............................................................................3.2
Policy instability...............................................................1.3
Restrictive labor regulations.........................................0.9
Poor public health ...........................................................0.6
Government instability/coups .......................................0.1
Rank Score(out of 139) (1–7)
160
Part 2:C
ompe
titiven
ess Profile
s
GDP (PPP) per capita (int'l $), 1980–2009
0 5 10 15 20 25 30
Percent of responses
Note: From a list of 15 factors, respondents were asked to select the five most problematic for doing business in their country and to rank them between 1 (most problematic) and 5. The bars in the figure show the responses weighted according to their rankings.
1 Transition1–2 2 Transition
2 –3
Factordriven
Efficiencydriven
Innovationdriven
3
Stage of development
Malawi Factor-driven economies
0
1,000
2,000
3,000
1980 1982 1984 1986 1988 1990 1992 1994 1996 1998 2000 2002 2004 20082006
Malawi Sub-Saharan Africa
The Africa Competitiveness Report 2011 © 2011 World Economic Forum, the World Bank and the African Development Bank

161
Part 2:C
ompe
titiven
ess Profile
s
The Global Competitiveness Index in detailINDICATOR SCORE RANK/139
1st pillar: Institutions1.01 Property rights .......................................................4.2 ............77
1.02 Intellectual property protection..............................3.8 ............56
1.03 Diversion of public funds.......................................3.9 ............53
1.04 Public trust of politicians........................................3.1 ............61
1.05 Irregular payments and bribes...............................4.2 ............59
1.06 Judicial independence ...........................................4.6 ............47
1.07 Favoritism in decisions of government officials ....3.3 ............53
1.08 Wastefulness of government spending ................4.0 ............34
1.09 Burden of government regulation..........................3.7 ............37
1.10 Efficiency of legal framework in settling disputes...3.9 ............56
1.11 Efficiency of legal framework in challenging regs...3.9 ............52
1.12 Transparency of government policymaking...........4.5 ............57
1.13 Business costs of terrorism...................................6.2 ............45
1.14 Business costs of crime and violence...................4.5 ............91
1.15 Organized crime.....................................................5.9 ............44
1.16 Reliability of police services...................................4.6 ............52
1.17 Ethical behavior of firms........................................4.3 ............53
1.18 Strength of auditing and reporting standards........5.1 ............50
1.19 Efficacy of corporate boards..................................4.7 ............57
1.20 Protection of minority shareholders’ interests ......4.4 ............61
1.21 Strength of investor protection, 0–10 (best)*........5.3 ............59
2nd pillar: Infrastructure2.01 Quality of overall infrastructure .............................3.4 ..........106
2.02 Quality of roads .....................................................3.6 ............76
2.03 Quality of railroad infrastructure ............................2.2 ............78
2.04 Quality of port infrastructure .................................3.6 ............99
2.05 Quality of air transport infrastructure ....................3.3 ..........119
2.06 Available airline seat Kms/week, millions*............7.3 ..........131
2.07 Quality of electricity supply ...................................2.0 ..........129
2.08 Fixed telephone lines/100 pop.* ...........................1.1 ..........123
2.09 Mobile telephone subscriptions/100 pop.* .........15.7 ..........136
3rd pillar: Macroeconomic environment3.01 Government budget balance, % GDP* ................-5.4 ............91
3.02 National savings rate, % GDP* .............................0.6 ..........136
3.03 Inflation, annual % change* ..................................8.4 ..........116
3.04 Interest rate spread, %*......................................21.8 ..........133
3.05 Government debt, % GDP* ................................39.5 ............69
3.06 Country credit rating, 0–100 (worst)*..................21.4 ..........127
4th pillar: Health and primary education4.01 Business impact of malaria....................................2.8 ..........133
4.02 Malaria incidence/100,000 pop.*..................33,363.4 ..........129
4.03 Business impact of tuberculosis............................3.3 ..........133
4.04 Tuberculosis incidence/100,000 pop.* ..............324.5 ..........124
4.05 Business impact of HIV/AIDS................................2.7 ..........135
4.06 HIV prevalence, % adult pop.*............................11.9 ..........131
4.07 Infant mortality, deaths/1,000 live births* ...........64.7 ..........117
4.08 Life expectancy, years*.......................................53.1 ..........124
4.09 Quality of primary education..................................3.0 ..........104
4.10 Primary education enrollment, net %*................90.6 ............86
5th pillar: Higher education and training5.01 Secondary education enrollment, gross %* .......29.4 ..........129
5.02 Tertiary education enrollment, gross %* ..............0.5 ..........139
5.03 Quality of the educational system.........................4.0 ............49
5.04 Quality of math and science education .................3.7 ............80
5.05 Quality of management schools............................3.7 ............96
5.06 Internet access in schools .....................................2.5 ..........126
5.07 Availability of research and training services.........3.7 ............92
5.08 Extent of staff training ...........................................4.0 ............67
INDICATOR SCORE RANK/139
6th pillar: Goods market efficiency6.01 Intensity of local competition ................................4.7 ............83
6.02 Extent of market dominance .................................3.3 ..........100
6.03 Effectiveness of anti-monopoly policy...................4.2 ............57
6.04 Extent and effect of taxation .................................3.2 ............96
6.05 Total tax rate, % profits*.....................................25.8 ............21
6.06 No. procedures to start a business* ...................10.0 ............99
6.07 No. days to start a business*..............................39.0 ..........110
6.08 Agricultural policy costs.........................................4.4 ............30
6.09 Prevalence of trade barriers...................................3.8 ..........120
6.10 Trade tariffs, % duty*..........................................12.9 ..........119
6.11 Prevalence of foreign ownership...........................4.8 ............64
6.12 Business impact of rules on FDI ...........................4.5 ............87
6.13 Burden of customs procedures.............................3.9 ............86
6.14 Degree of customer orientation ............................4.8 ............61
6.15 Buyer sophistication ..............................................2.6 ..........124
7th pillar: Labor market efficiency7.01 Cooperation in labor-employer relations................4.4 ............63
7.02 Flexibility of wage determination...........................5.8 ............11
7.03 Rigidity of employment index, 0–100 (worst)*....21.0 ............50
7.04 Hiring and firing practices......................................4.5 ............32
7.05 Redundancy costs, weeks of wages*.................84.0 ..........104
7.06 Pay and productivity ..............................................3.7 ............87
7.07 Reliance on professional management .................4.7 ............45
7.08 Brain drain..............................................................3.2 ............71
7.09 Females in labor force, ratio to males* .................1.0 ..............8
8th pillar: Financial market development8.01 Availability of financial services .............................4.0 ............99
8.02 Affordability of financial services ...........................3.5 ..........107
8.03 Financing through local equity market...................3.9 ............41
8.04 Ease of access to loans.........................................2.2 ..........114
8.05 Venture capital availability......................................1.8 ..........132
8.06 Restriction on capital flows ...................................3.7 ..........110
8.07 Soundness of banks ..............................................5.7 ............29
8.08 Regulation of securities exchanges.......................4.2 ............70
8.09 Legal rights index, 0–10 (best)* ............................8.0 ............20
9th pillar: Technological readiness9.01 Availability of latest technologies ..........................4.3 ..........108
9.02 Firm-level technology absorption...........................4.3 ..........103
9.03 FDI and technology transfer ..................................4.3 ............91
9.04 Internet users/100 pop.* .......................................4.7 ..........119
9.05 Broadband Internet subscriptions/100 pop.*.........0.0 ..........125
9.06 Internet bandwidth, Mb/s per 10,000 pop.*..........0.0 ..........133
10th pillar: Market size10.01 Domestic market size index, 1–7 (best)* ..............2.3 ..........119
10.02 Foreign market size index, 1–7 (best)*..................2.2 ..........132
11th pillar: Business sophistication 11.01 Local supplier quantity...........................................4.6 ............84
11.02 Local supplier quality .............................................4.1 ............93
11.03 State of cluster development ................................3.7 ............57
11.04 Nature of competitive advantage ..........................2.8 ..........104
11.05 Value chain breadth ...............................................3.2 ............89
11.06 Control of international distribution .......................3.8 ............87
11.07 Production process sophistication.........................2.8 ..........123
11.08 Extent of marketing ...............................................3.0 ..........124
11.09 Willingness to delegate authority ..........................3.7 ............55
12th pillar: Innovation12.01 Capacity for innovation ..........................................2.7 ............84
12.02 Quality of scientific research institutions ..............3.4 ............76
12.03 Company spending on R&D ..................................3.0 ............76
12.04 University-industry collaboration in R&D ...............3.4 ............79
12.05 Gov’t procurement of advanced tech products.....3.7 ............68
12.06 Availability of scientists and engineers..................3.9 ............83
12.07 Utility patents/million pop.* ...................................0.0 ............90
Malawi
Notes: An asterisk (*) indicates that data are from sources other than the World Economic Forum. For further details and explanation, please refer to the section“How to Read the Competitiveness Profiles” on page 115.
The Africa Competitiveness Report 2011 © 2011 World Economic Forum, the World Bank and the African Development Bank
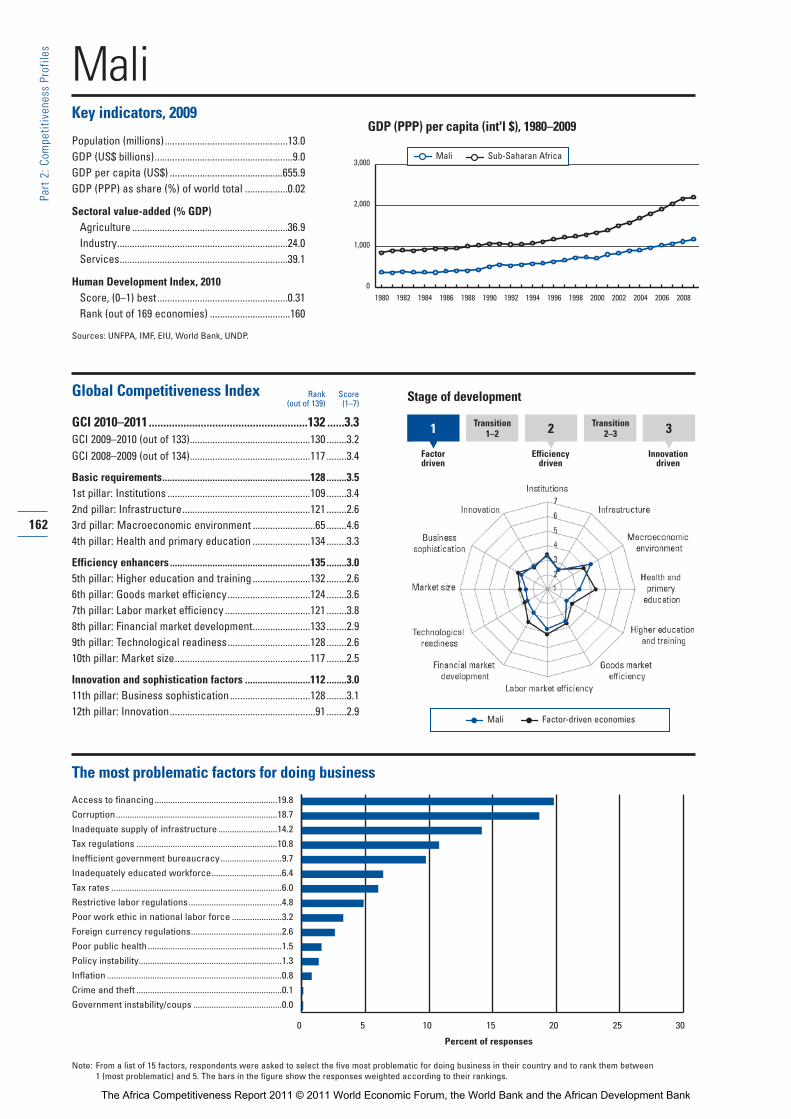
MaliKey indicators, 2009
Population (millions).................................................13.0GDP (US$ billions).......................................................9.0GDP per capita (US$) .............................................655.9GDP (PPP) as share (%) of world total .................0.02
Sectoral value-added (% GDP)Agriculture ..............................................................36.9Industry....................................................................24.0Services...................................................................39.1
Human Development Index, 2010Score, (0–1) best....................................................0.31Rank (out of 169 economies) ................................160
Sources: UNFPA, IMF, EIU, World Bank, UNDP.
Global Competitiveness Index
GCI 2010–2011.......................................................132 ......3.3GCI 2009–2010 (out of 133)................................................130 ........3.2GCI 2008–2009 (out of 134)................................................117 ........3.4
Basic requirements...........................................................128 ........3.51st pillar: Institutions .........................................................109 ........3.42nd pillar: Infrastructure...................................................121 ........2.63rd pillar: Macroeconomic environment .........................65 ........4.64th pillar: Health and primary education .......................134 ........3.3
Efficiency enhancers........................................................135 ........3.05th pillar: Higher education and training .......................132 ........2.66th pillar: Goods market efficiency.................................124 ........3.67th pillar: Labor market efficiency ..................................121 ........3.88th pillar: Financial market development.......................133 ........2.99th pillar: Technological readiness.................................128 ........2.610th pillar: Market size......................................................117 ........2.5
Innovation and sophistication factors ..........................112 ........3.011th pillar: Business sophistication................................128 ........3.112th pillar: Innovation..........................................................91 ........2.9
The most problematic factors for doing business
Access to financing......................................................19.8
Corruption.......................................................................18.7
Inadequate supply of infrastructure ..........................14.2
Tax regulations ..............................................................10.8
Inefficient government bureaucracy...........................9.7
Inadequately educated workforce...............................6.4
Tax rates ...........................................................................6.0
Restrictive labor regulations.........................................4.8
Poor work ethic in national labor force ......................3.2
Foreign currency regulations........................................2.6
Poor public health ...........................................................1.5
Policy instability...............................................................1.3
Inflation .............................................................................0.8
Crime and theft ................................................................0.1
Government instability/coups .......................................0.0
Rank Score(out of 139) (1–7)
162
Part 2:C
ompe
titiven
ess Profile
s
GDP (PPP) per capita (int'l $), 1980–2009
0 5 10 15 20 25 30
Percent of responses
Note: From a list of 15 factors, respondents were asked to select the five most problematic for doing business in their country and to rank them between 1 (most problematic) and 5. The bars in the figure show the responses weighted according to their rankings.
1 Transition1–2 2 Transition
2 –3
Factordriven
Efficiencydriven
Innovationdriven
3
Stage of development
Mali Factor-driven economies
0
1,000
2,000
3,000
1980 1982 1984 1986 1988 1990 1992 1994 1996 1998 2000 2002 2004 20082006
Mali Sub-Saharan Africa
The Africa Competitiveness Report 2011 © 2011 World Economic Forum, the World Bank and the African Development Bank

163
Part 2:C
ompe
titiven
ess Profile
s
The Global Competitiveness Index in detailINDICATOR SCORE RANK/139
1st pillar: Institutions1.01 Property rights .......................................................3.5 ..........109
1.02 Intellectual property protection..............................2.7 ..........108
1.03 Diversion of public funds.......................................2.6 ..........108
1.04 Public trust of politicians........................................2.2 ............95
1.05 Irregular payments and bribes...............................2.5 ..........139
1.06 Judicial independence ...........................................2.8 ..........110
1.07 Favoritism in decisions of government officials ....2.5 ..........114
1.08 Wastefulness of government spending ................2.9 ............94
1.09 Burden of government regulation..........................3.4 ............54
1.10 Efficiency of legal framework in settling disputes...3.4 ............80
1.11 Efficiency of legal framework in challenging regs...3.6 ............67
1.12 Transparency of government policymaking...........4.2 ............78
1.13 Business costs of terrorism...................................5.4 ............83
1.14 Business costs of crime and violence...................5.1 ............58
1.15 Organized crime.....................................................5.2 ............78
1.16 Reliability of police services...................................3.3 ..........110
1.17 Ethical behavior of firms........................................3.3 ..........111
1.18 Strength of auditing and reporting standards........3.6 ..........126
1.19 Efficacy of corporate boards..................................4.0 ..........124
1.20 Protection of minority shareholders’ interests ......3.8 ..........101
1.21 Strength of investor protection, 0–10 (best)*........3.7 ..........119
2nd pillar: Infrastructure2.01 Quality of overall infrastructure .............................3.4 ..........107
2.02 Quality of roads .....................................................2.9 ..........103
2.03 Quality of railroad infrastructure ............................2.0 ............85
2.04 Quality of port infrastructure .................................3.7 ............91
2.05 Quality of air transport infrastructure ....................3.2 ..........123
2.06 Available airline seat Kms/week, millions*..........26.6 ..........108
2.07 Quality of electricity supply ...................................3.3 ..........104
2.08 Fixed telephone lines/100 pop.* ...........................0.6 ..........132
2.09 Mobile telephone subscriptions/100 pop.* .........28.8 ..........128
3rd pillar: Macroeconomic environment3.01 Government budget balance, % GDP* ................-4.7 ............83
3.02 National savings rate, % GDP* ...........................20.2 ............67
3.03 Inflation, annual % change* ..................................2.2 ............56
3.04 Interest rate spread, %*........................................6.0 ............78
3.05 Government debt, % GDP* ................................22.4 ............32
3.06 Country credit rating, 0–100 (worst)*..................26.5 ..........119
4th pillar: Health and primary education4.01 Business impact of malaria....................................2.7 ..........134
4.02 Malaria incidence/100,000 pop.*..................36,074.1 ..........133
4.03 Business impact of tuberculosis............................4.2 ..........117
4.04 Tuberculosis incidence/100,000 pop.* ..............321.7 ..........122
4.05 Business impact of HIV/AIDS................................3.7 ..........121
4.06 HIV prevalence, % adult pop.*..............................1.5 ..........112
4.07 Infant mortality, deaths/1,000 live births* .........102.5 ..........137
4.08 Life expectancy, years*.......................................48.4 ..........132
4.09 Quality of primary education..................................2.1 ..........136
4.10 Primary education enrollment, net %*................71.5 ..........129
5th pillar: Higher education and training5.01 Secondary education enrollment, gross %* .......34.8 ..........123
5.02 Tertiary education enrollment, gross %* ..............5.4 ..........120
5.03 Quality of the educational system.........................2.7 ..........125
5.04 Quality of math and science education .................2.4 ..........134
5.05 Quality of management schools............................3.1 ..........126
5.06 Internet access in schools .....................................2.8 ..........117
5.07 Availability of research and training services.........3.3 ..........113
5.08 Extent of staff training ...........................................3.0 ..........131
INDICATOR SCORE RANK/139
6th pillar: Goods market efficiency6.01 Intensity of local competition ................................4.8 ............73
6.02 Extent of market dominance .................................3.5 ............76
6.03 Effectiveness of anti-monopoly policy...................3.4 ..........112
6.04 Extent and effect of taxation .................................2.9 ..........116
6.05 Total tax rate, % profits*.....................................52.1 ..........106
6.06 No. procedures to start a business* .....................7.0 ............57
6.07 No. days to start a business*..............................15.0 ............56
6.08 Agricultural policy costs.........................................3.7 ............78
6.09 Prevalence of trade barriers...................................4.0 ..........110
6.10 Trade tariffs, % duty*............................................9.8 ............96
6.11 Prevalence of foreign ownership...........................3.4 ..........129
6.12 Business impact of rules on FDI ...........................3.9 ..........112
6.13 Burden of customs procedures.............................4.1 ............79
6.14 Degree of customer orientation ............................4.0 ..........109
6.15 Buyer sophistication ..............................................2.2 ..........135
7th pillar: Labor market efficiency7.01 Cooperation in labor-employer relations................3.9 ..........111
7.02 Flexibility of wage determination...........................4.6 ..........102
7.03 Rigidity of employment index, 0–100 (worst)*....31.0 ............78
7.04 Hiring and firing practices......................................4.1 ............58
7.05 Redundancy costs, weeks of wages*.................31.0 ............61
7.06 Pay and productivity ..............................................2.9 ..........131
7.07 Reliance on professional management .................3.3 ..........131
7.08 Brain drain..............................................................2.4 ..........120
7.09 Females in labor force, ratio to males* .................0.6 ..........112
8th pillar: Financial market development8.01 Availability of financial services .............................3.7 ..........112
8.02 Affordability of financial services ...........................3.2 ..........123
8.03 Financing through local equity market...................2.5 ..........113
8.04 Ease of access to loans.........................................1.9 ..........131
8.05 Venture capital availability......................................1.7 ..........135
8.06 Restriction on capital flows ...................................3.3 ..........122
8.07 Soundness of banks ..............................................3.9 ..........128
8.08 Regulation of securities exchanges.......................2.6 ..........130
8.09 Legal rights index, 0–10 (best)* ............................3.0 ..........103
9th pillar: Technological readiness9.01 Availability of latest technologies ..........................4.1 ..........124
9.02 Firm-level technology absorption...........................4.3 ..........100
9.03 FDI and technology transfer ..................................3.9 ..........119
9.04 Internet users/100 pop.* .......................................1.9 ..........130
9.05 Broadband Internet subscriptions/100 pop.*.........0.1 ..........117
9.06 Internet bandwidth, Mb/s per 10,000 pop.*..........0.5 ..........108
10th pillar: Market size10.01 Domestic market size index, 1–7 (best)* ..............2.4 ..........117
10.02 Foreign market size index, 1–7 (best)*..................2.9 ..........118
11th pillar: Business sophistication 11.01 Local supplier quantity...........................................4.3 ..........104
11.02 Local supplier quality .............................................3.7 ..........120
11.03 State of cluster development ................................3.0 ............97
11.04 Nature of competitive advantage ..........................2.5 ..........128
11.05 Value chain breadth ...............................................2.9 ..........120
11.06 Control of international distribution .......................3.4 ..........122
11.07 Production process sophistication.........................2.4 ..........133
11.08 Extent of marketing ...............................................2.7 ..........133
11.09 Willingness to delegate authority ..........................2.8 ..........125
12th pillar: Innovation12.01 Capacity for innovation ..........................................2.5 ..........111
12.02 Quality of scientific research institutions ..............3.5 ............72
12.03 Company spending on R&D ..................................2.9 ............78
12.04 University-industry collaboration in R&D ...............3.2 ............90
12.05 Gov’t procurement of advanced tech products.....3.8 ............58
12.06 Availability of scientists and engineers..................3.6 ..........100
12.07 Utility patents/million pop.* ...................................0.0 ............90
Mali
Notes: An asterisk (*) indicates that data are from sources other than the World Economic Forum. For further details and explanation, please refer to the section“How to Read the Competitiveness Profiles” on page 115.
The Africa Competitiveness Report 2011 © 2011 World Economic Forum, the World Bank and the African Development Bank
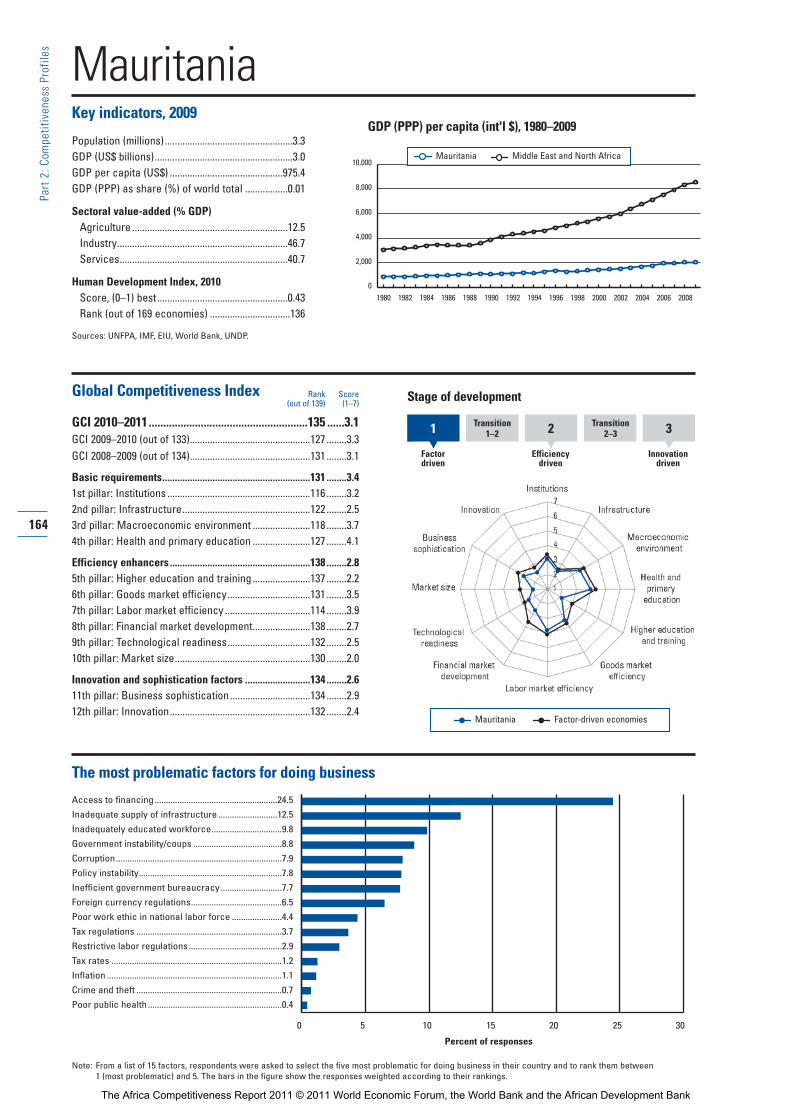
MauritaniaKey indicators, 2009
Population (millions)...................................................3.3GDP (US$ billions).......................................................3.0GDP per capita (US$) .............................................975.4GDP (PPP) as share (%) of world total .................0.01
Sectoral value-added (% GDP)Agriculture ..............................................................12.5Industry....................................................................46.7Services...................................................................40.7
Human Development Index, 2010Score, (0–1) best....................................................0.43Rank (out of 169 economies) ................................136
Sources: UNFPA, IMF, EIU, World Bank, UNDP.
Global Competitiveness Index
GCI 2010–2011.......................................................135 ......3.1GCI 2009–2010 (out of 133)................................................127 ........3.3GCI 2008–2009 (out of 134)................................................131 ........3.1
Basic requirements...........................................................131 ........3.41st pillar: Institutions .........................................................116 ........3.22nd pillar: Infrastructure...................................................122 ........2.53rd pillar: Macroeconomic environment .......................118 ........3.74th pillar: Health and primary education .......................127 ........4.1
Efficiency enhancers........................................................138 ........2.85th pillar: Higher education and training .......................137 ........2.26th pillar: Goods market efficiency.................................131 ........3.57th pillar: Labor market efficiency ..................................114 ........3.98th pillar: Financial market development.......................138 ........2.79th pillar: Technological readiness.................................132 ........2.510th pillar: Market size......................................................130 ........2.0
Innovation and sophistication factors ..........................134 ........2.611th pillar: Business sophistication................................134 ........2.912th pillar: Innovation........................................................132 ........2.4
The most problematic factors for doing business
Access to financing......................................................24.5
Inadequate supply of infrastructure ..........................12.5
Inadequately educated workforce...............................9.8
Government instability/coups .......................................8.8
Corruption.........................................................................7.9
Policy instability...............................................................7.8
Inefficient government bureaucracy...........................7.7
Foreign currency regulations........................................6.5
Poor work ethic in national labor force ......................4.4
Tax regulations ................................................................3.7
Restrictive labor regulations.........................................2.9
Tax rates ...........................................................................1.2
Inflation .............................................................................1.1
Crime and theft ................................................................0.7
Poor public health ...........................................................0.4
Rank Score(out of 139) (1–7)
164
Part 2:C
ompe
titiven
ess Profile
s
GDP (PPP) per capita (int'l $), 1980–2009
0 5 10 15 20 25 30
Percent of responses
Note: From a list of 15 factors, respondents were asked to select the five most problematic for doing business in their country and to rank them between 1 (most problematic) and 5. The bars in the figure show the responses weighted according to their rankings.
1 Transition1–2 2 Transition
2 –3
Factordriven
Efficiencydriven
Innovationdriven
3
Stage of development
Mauritania Factor-driven economies
0
2,000
4,000
6,000
8,000
10,000
1980 1982 1984 1986 1988 1990 1992 1994 1996 1998 2000 2002 2004 20082006
Mauritania Middle East and North Africa
The Africa Competitiveness Report 2011 © 2011 World Economic Forum, the World Bank and the African Development Bank
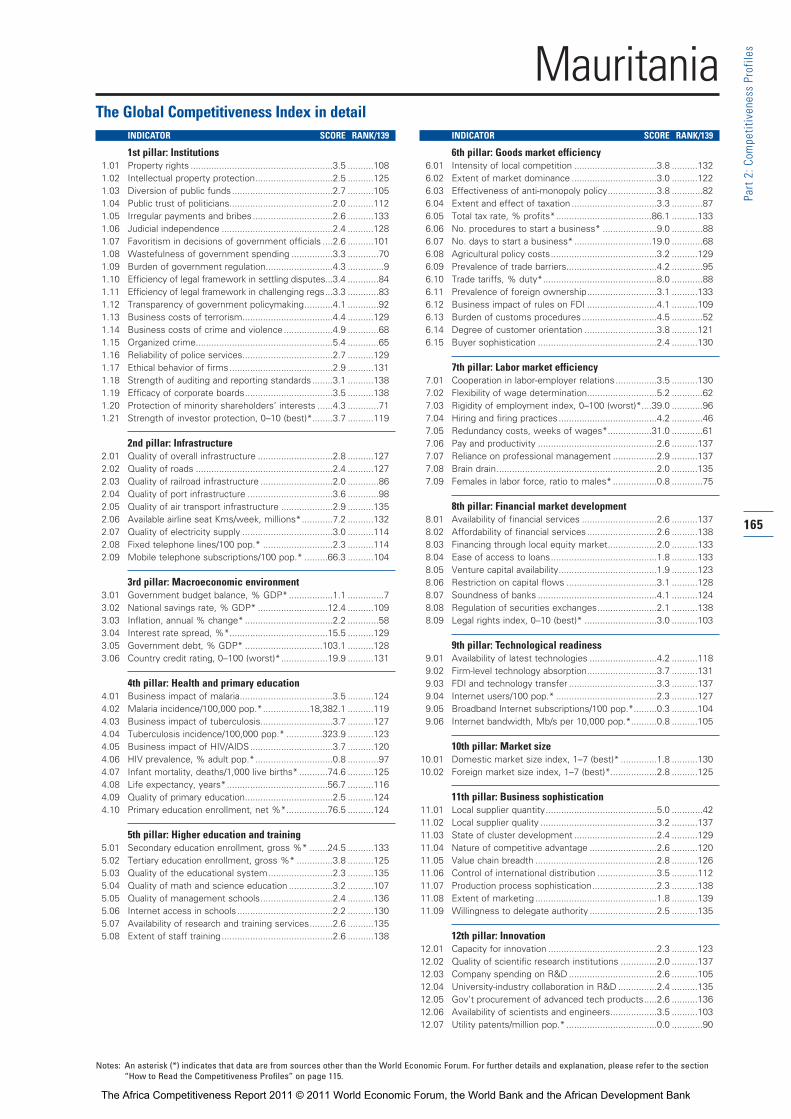
165
Part 2:C
ompe
titiven
ess Profile
s
The Global Competitiveness Index in detailINDICATOR SCORE RANK/139
1st pillar: Institutions1.01 Property rights .......................................................3.5 ..........108
1.02 Intellectual property protection..............................2.5 ..........125
1.03 Diversion of public funds.......................................2.7 ..........105
1.04 Public trust of politicians........................................2.0 ..........112
1.05 Irregular payments and bribes...............................2.6 ..........133
1.06 Judicial independence ...........................................2.4 ..........128
1.07 Favoritism in decisions of government officials ....2.6 ..........101
1.08 Wastefulness of government spending ................3.3 ............70
1.09 Burden of government regulation..........................4.3 ..............9
1.10 Efficiency of legal framework in settling disputes...3.4 ............84
1.11 Efficiency of legal framework in challenging regs...3.3 ............83
1.12 Transparency of government policymaking...........4.1 ............92
1.13 Business costs of terrorism...................................4.4 ..........129
1.14 Business costs of crime and violence...................4.9 ............68
1.15 Organized crime.....................................................5.4 ............65
1.16 Reliability of police services...................................2.7 ..........129
1.17 Ethical behavior of firms........................................2.9 ..........131
1.18 Strength of auditing and reporting standards........3.1 ..........138
1.19 Efficacy of corporate boards..................................3.5 ..........138
1.20 Protection of minority shareholders’ interests ......4.3 ............71
1.21 Strength of investor protection, 0–10 (best)*........3.7 ..........119
2nd pillar: Infrastructure2.01 Quality of overall infrastructure .............................2.8 ..........127
2.02 Quality of roads .....................................................2.4 ..........127
2.03 Quality of railroad infrastructure ............................2.0 ............86
2.04 Quality of port infrastructure .................................3.6 ............98
2.05 Quality of air transport infrastructure ....................2.9 ..........135
2.06 Available airline seat Kms/week, millions*............7.2 ..........132
2.07 Quality of electricity supply ...................................3.0 ..........114
2.08 Fixed telephone lines/100 pop.* ...........................2.3 ..........114
2.09 Mobile telephone subscriptions/100 pop.* .........66.3 ..........104
3rd pillar: Macroeconomic environment3.01 Government budget balance, % GDP* .................1.1 ..............7
3.02 National savings rate, % GDP* ...........................12.4 ..........109
3.03 Inflation, annual % change* ..................................2.2 ............58
3.04 Interest rate spread, %*......................................15.5 ..........129
3.05 Government debt, % GDP* ..............................103.1 ..........128
3.06 Country credit rating, 0–100 (worst)*..................19.9 ..........131
4th pillar: Health and primary education4.01 Business impact of malaria....................................3.5 ..........124
4.02 Malaria incidence/100,000 pop.*..................18,382.1 ..........119
4.03 Business impact of tuberculosis............................3.7 ..........127
4.04 Tuberculosis incidence/100,000 pop.* ..............323.9 ..........123
4.05 Business impact of HIV/AIDS................................3.7 ..........120
4.06 HIV prevalence, % adult pop.*..............................0.8 ............97
4.07 Infant mortality, deaths/1,000 live births* ...........74.6 ..........125
4.08 Life expectancy, years*.......................................56.7 ..........116
4.09 Quality of primary education..................................2.5 ..........124
4.10 Primary education enrollment, net %*................76.5 ..........124
5th pillar: Higher education and training5.01 Secondary education enrollment, gross %* .......24.5 ..........133
5.02 Tertiary education enrollment, gross %* ..............3.8 ..........125
5.03 Quality of the educational system.........................2.3 ..........135
5.04 Quality of math and science education .................3.2 ..........107
5.05 Quality of management schools............................2.4 ..........136
5.06 Internet access in schools .....................................2.2 ..........130
5.07 Availability of research and training services.........2.6 ..........135
5.08 Extent of staff training ...........................................2.6 ..........138
INDICATOR SCORE RANK/139
6th pillar: Goods market efficiency6.01 Intensity of local competition ................................3.8 ..........132
6.02 Extent of market dominance .................................3.0 ..........122
6.03 Effectiveness of anti-monopoly policy...................3.8 ............82
6.04 Extent and effect of taxation .................................3.3 ............87
6.05 Total tax rate, % profits*.....................................86.1 ..........133
6.06 No. procedures to start a business* .....................9.0 ............88
6.07 No. days to start a business*..............................19.0 ............68
6.08 Agricultural policy costs.........................................3.2 ..........129
6.09 Prevalence of trade barriers...................................4.2 ............95
6.10 Trade tariffs, % duty*............................................8.0 ............88
6.11 Prevalence of foreign ownership...........................3.1 ..........133
6.12 Business impact of rules on FDI ...........................4.1 ..........109
6.13 Burden of customs procedures.............................4.5 ............52
6.14 Degree of customer orientation ............................3.8 ..........121
6.15 Buyer sophistication ..............................................2.4 ..........130
7th pillar: Labor market efficiency7.01 Cooperation in labor-employer relations................3.5 ..........130
7.02 Flexibility of wage determination...........................5.2 ............62
7.03 Rigidity of employment index, 0–100 (worst)*....39.0 ............96
7.04 Hiring and firing practices......................................4.2 ............46
7.05 Redundancy costs, weeks of wages*.................31.0 ............61
7.06 Pay and productivity ..............................................2.6 ..........137
7.07 Reliance on professional management .................2.9 ..........137
7.08 Brain drain..............................................................2.0 ..........135
7.09 Females in labor force, ratio to males* .................0.8 ............75
8th pillar: Financial market development8.01 Availability of financial services .............................2.6 ..........137
8.02 Affordability of financial services ...........................2.6 ..........138
8.03 Financing through local equity market...................2.0 ..........133
8.04 Ease of access to loans.........................................1.8 ..........133
8.05 Venture capital availability......................................1.9 ..........123
8.06 Restriction on capital flows ...................................3.1 ..........128
8.07 Soundness of banks ..............................................4.1 ..........124
8.08 Regulation of securities exchanges.......................2.1 ..........138
8.09 Legal rights index, 0–10 (best)* ............................3.0 ..........103
9th pillar: Technological readiness9.01 Availability of latest technologies ..........................4.2 ..........118
9.02 Firm-level technology absorption...........................3.7 ..........131
9.03 FDI and technology transfer ..................................3.3 ..........137
9.04 Internet users/100 pop.* .......................................2.3 ..........127
9.05 Broadband Internet subscriptions/100 pop.*.........0.3 ..........104
9.06 Internet bandwidth, Mb/s per 10,000 pop.*..........0.8 ..........105
10th pillar: Market size10.01 Domestic market size index, 1–7 (best)* ..............1.8 ..........130
10.02 Foreign market size index, 1–7 (best)*..................2.8 ..........125
11th pillar: Business sophistication 11.01 Local supplier quantity...........................................5.0 ............42
11.02 Local supplier quality .............................................3.2 ..........137
11.03 State of cluster development ................................2.4 ..........129
11.04 Nature of competitive advantage ..........................2.6 ..........120
11.05 Value chain breadth ...............................................2.8 ..........126
11.06 Control of international distribution .......................3.5 ..........112
11.07 Production process sophistication.........................2.3 ..........138
11.08 Extent of marketing ...............................................1.8 ..........139
11.09 Willingness to delegate authority ..........................2.5 ..........135
12th pillar: Innovation12.01 Capacity for innovation ..........................................2.3 ..........123
12.02 Quality of scientific research institutions ..............2.0 ..........137
12.03 Company spending on R&D ..................................2.6 ..........105
12.04 University-industry collaboration in R&D ...............2.4 ..........135
12.05 Gov’t procurement of advanced tech products.....2.6 ..........136
12.06 Availability of scientists and engineers..................3.5 ..........103
12.07 Utility patents/million pop.* ...................................0.0 ............90
Mauritania
Notes: An asterisk (*) indicates that data are from sources other than the World Economic Forum. For further details and explanation, please refer to the section“How to Read the Competitiveness Profiles” on page 115.
The Africa Competitiveness Report 2011 © 2011 World Economic Forum, the World Bank and the African Development Bank
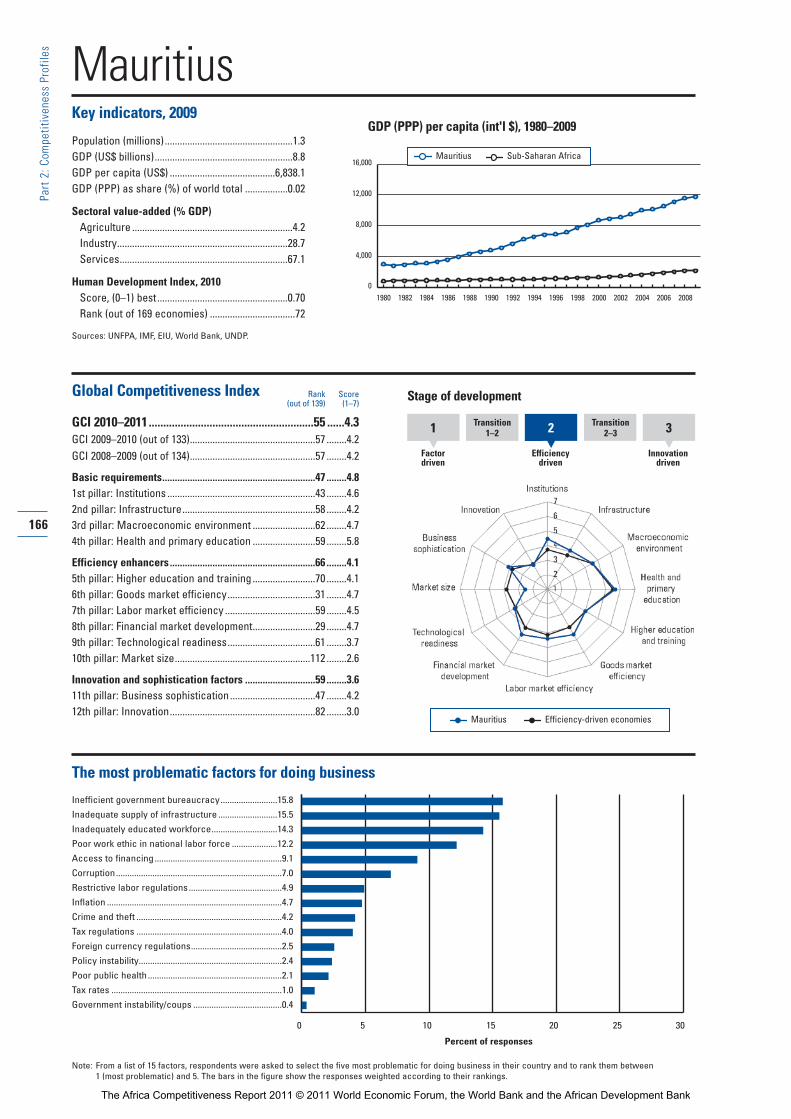
MauritiusKey indicators, 2009
Population (millions)...................................................1.3GDP (US$ billions).......................................................8.8GDP per capita (US$) ..........................................6,838.1GDP (PPP) as share (%) of world total .................0.02
Sectoral value-added (% GDP)Agriculture ................................................................4.2Industry....................................................................28.7Services...................................................................67.1
Human Development Index, 2010Score, (0–1) best....................................................0.70Rank (out of 169 economies) ..................................72
Sources: UNFPA, IMF, EIU, World Bank, UNDP.
Global Competitiveness Index
GCI 2010–2011.........................................................55 ......4.3GCI 2009–2010 (out of 133)..................................................57 ........4.2GCI 2008–2009 (out of 134)..................................................57 ........4.2
Basic requirements.............................................................47 ........4.81st pillar: Institutions ...........................................................43 ........4.62nd pillar: Infrastructure.....................................................58 ........4.23rd pillar: Macroeconomic environment .........................62 ........4.74th pillar: Health and primary education .........................59 ........5.8
Efficiency enhancers..........................................................66 ........4.15th pillar: Higher education and training .........................70 ........4.16th pillar: Goods market efficiency...................................31 ........4.77th pillar: Labor market efficiency ....................................59 ........4.58th pillar: Financial market development.........................29 ........4.79th pillar: Technological readiness...................................61 ........3.710th pillar: Market size......................................................112 ........2.6
Innovation and sophistication factors ............................59 ........3.611th pillar: Business sophistication..................................47 ........4.212th pillar: Innovation..........................................................82 ........3.0
The most problematic factors for doing business
Inefficient government bureaucracy.........................15.8
Inadequate supply of infrastructure ..........................15.5
Inadequately educated workforce.............................14.3
Poor work ethic in national labor force ....................12.2
Access to financing........................................................9.1
Corruption.........................................................................7.0
Restrictive labor regulations.........................................4.9
Inflation .............................................................................4.7
Crime and theft ................................................................4.2
Tax regulations ................................................................4.0
Foreign currency regulations........................................2.5
Policy instability...............................................................2.4
Poor public health ...........................................................2.1
Tax rates ...........................................................................1.0
Government instability/coups .......................................0.4
Rank Score(out of 139) (1–7)
166
Part 2:C
ompe
titiven
ess Profile
s
GDP (PPP) per capita (int'l $), 1980–2009
0 5 10 15 20 25 30
Percent of responses
Note: From a list of 15 factors, respondents were asked to select the five most problematic for doing business in their country and to rank them between 1 (most problematic) and 5. The bars in the figure show the responses weighted according to their rankings.
1 Transition1–2 2 Transition
2 –3
Factordriven
Efficiencydriven
Innovationdriven
3
Stage of development
0
4,000
8,000
12,000
16,000
1980 1982 1984 1986 1988 1990 1992 1994 1996 1998 2000 2002 2004 20082006
Mauritius Sub-Saharan Africa
Mauritius Efficiency-driven economies
The Africa Competitiveness Report 2011 © 2011 World Economic Forum, the World Bank and the African Development Bank
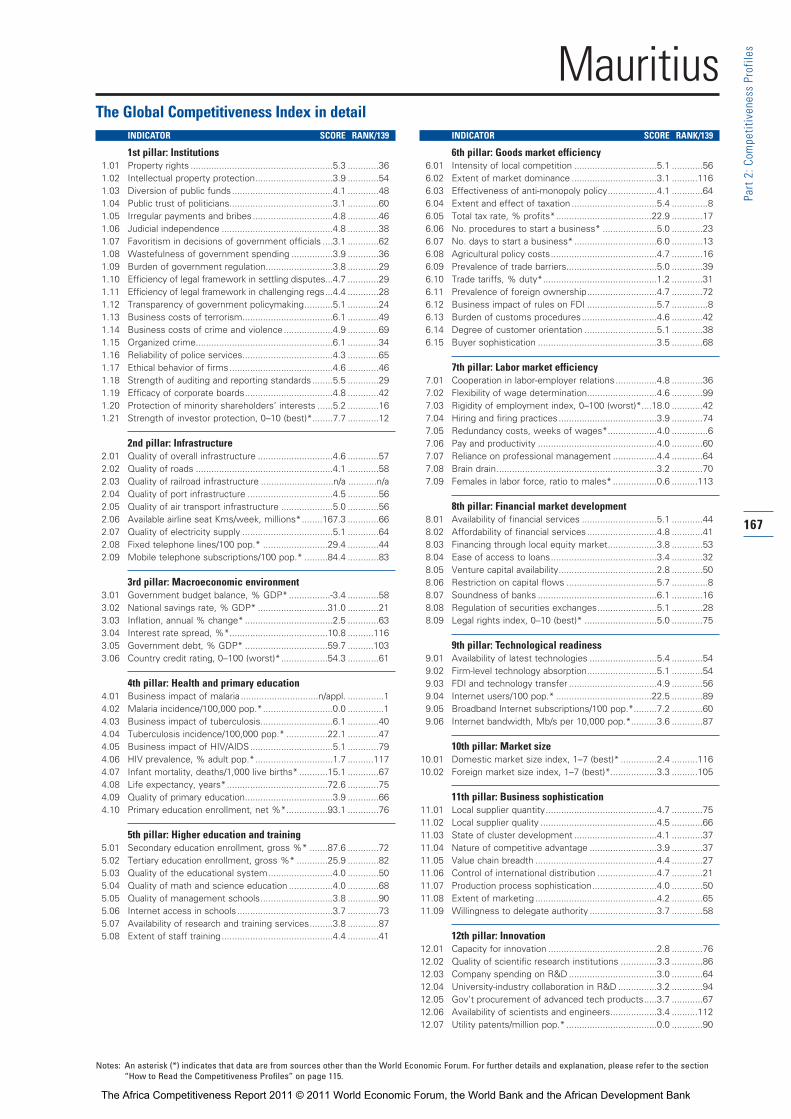
167
Part 2:C
ompe
titiven
ess Profile
s
The Global Competitiveness Index in detailINDICATOR SCORE RANK/139
1st pillar: Institutions1.01 Property rights .......................................................5.3 ............36
1.02 Intellectual property protection..............................3.9 ............54
1.03 Diversion of public funds.......................................4.1 ............48
1.04 Public trust of politicians........................................3.1 ............60
1.05 Irregular payments and bribes...............................4.8 ............46
1.06 Judicial independence ...........................................4.8 ............38
1.07 Favoritism in decisions of government officials ....3.1 ............62
1.08 Wastefulness of government spending ................3.9 ............36
1.09 Burden of government regulation..........................3.8 ............29
1.10 Efficiency of legal framework in settling disputes...4.7 ............29
1.11 Efficiency of legal framework in challenging regs...4.4 ............28
1.12 Transparency of government policymaking...........5.1 ............24
1.13 Business costs of terrorism...................................6.1 ............49
1.14 Business costs of crime and violence...................4.9 ............69
1.15 Organized crime.....................................................6.1 ............34
1.16 Reliability of police services...................................4.3 ............65
1.17 Ethical behavior of firms........................................4.6 ............46
1.18 Strength of auditing and reporting standards........5.5 ............29
1.19 Efficacy of corporate boards..................................4.8 ............42
1.20 Protection of minority shareholders’ interests ......5.2 ............16
1.21 Strength of investor protection, 0–10 (best)*........7.7 ............12
2nd pillar: Infrastructure2.01 Quality of overall infrastructure .............................4.6 ............57
2.02 Quality of roads .....................................................4.1 ............58
2.03 Quality of railroad infrastructure ............................n/a ...........n/a
2.04 Quality of port infrastructure .................................4.5 ............56
2.05 Quality of air transport infrastructure ....................5.0 ............56
2.06 Available airline seat Kms/week, millions*........167.3 ............66
2.07 Quality of electricity supply ...................................5.1 ............64
2.08 Fixed telephone lines/100 pop.* .........................29.4 ............44
2.09 Mobile telephone subscriptions/100 pop.* .........84.4 ............83
3rd pillar: Macroeconomic environment3.01 Government budget balance, % GDP* ................-3.4 ............58
3.02 National savings rate, % GDP* ...........................31.0 ............21
3.03 Inflation, annual % change* ..................................2.5 ............63
3.04 Interest rate spread, %*......................................10.8 ..........116
3.05 Government debt, % GDP* ................................59.7 ..........103
3.06 Country credit rating, 0–100 (worst)*..................54.3 ............61
4th pillar: Health and primary education4.01 Business impact of malaria ..............................n/appl. ..............1
4.02 Malaria incidence/100,000 pop.*...........................0.0 ..............1
4.03 Business impact of tuberculosis............................6.1 ............40
4.04 Tuberculosis incidence/100,000 pop.* ................22.1 ............47
4.05 Business impact of HIV/AIDS................................5.1 ............79
4.06 HIV prevalence, % adult pop.*..............................1.7 ..........117
4.07 Infant mortality, deaths/1,000 live births* ...........15.1 ............67
4.08 Life expectancy, years*.......................................72.6 ............75
4.09 Quality of primary education..................................3.9 ............66
4.10 Primary education enrollment, net %*................93.1 ............76
5th pillar: Higher education and training5.01 Secondary education enrollment, gross %* .......87.6 ............72
5.02 Tertiary education enrollment, gross %* ............25.9 ............82
5.03 Quality of the educational system.........................4.0 ............50
5.04 Quality of math and science education .................4.0 ............68
5.05 Quality of management schools............................3.8 ............90
5.06 Internet access in schools .....................................3.7 ............73
5.07 Availability of research and training services.........3.8 ............87
5.08 Extent of staff training ...........................................4.4 ............41
INDICATOR SCORE RANK/139
6th pillar: Goods market efficiency6.01 Intensity of local competition ................................5.1 ............56
6.02 Extent of market dominance .................................3.1 ..........116
6.03 Effectiveness of anti-monopoly policy...................4.1 ............64
6.04 Extent and effect of taxation .................................5.4 ..............8
6.05 Total tax rate, % profits*.....................................22.9 ............17
6.06 No. procedures to start a business* .....................5.0 ............23
6.07 No. days to start a business*................................6.0 ............13
6.08 Agricultural policy costs.........................................4.7 ............16
6.09 Prevalence of trade barriers...................................5.0 ............39
6.10 Trade tariffs, % duty*............................................1.2 ............31
6.11 Prevalence of foreign ownership...........................4.7 ............72
6.12 Business impact of rules on FDI ...........................5.7 ..............8
6.13 Burden of customs procedures.............................4.6 ............42
6.14 Degree of customer orientation ............................5.1 ............38
6.15 Buyer sophistication ..............................................3.5 ............68
7th pillar: Labor market efficiency7.01 Cooperation in labor-employer relations................4.8 ............36
7.02 Flexibility of wage determination...........................4.6 ............99
7.03 Rigidity of employment index, 0–100 (worst)*....18.0 ............42
7.04 Hiring and firing practices......................................3.9 ............74
7.05 Redundancy costs, weeks of wages*...................4.0 ..............6
7.06 Pay and productivity ..............................................4.0 ............60
7.07 Reliance on professional management .................4.4 ............64
7.08 Brain drain..............................................................3.2 ............70
7.09 Females in labor force, ratio to males* .................0.6 ..........113
8th pillar: Financial market development8.01 Availability of financial services .............................5.1 ............44
8.02 Affordability of financial services ...........................4.8 ............41
8.03 Financing through local equity market...................3.8 ............53
8.04 Ease of access to loans.........................................3.4 ............32
8.05 Venture capital availability......................................2.8 ............50
8.06 Restriction on capital flows ...................................5.7 ..............8
8.07 Soundness of banks ..............................................6.1 ............16
8.08 Regulation of securities exchanges.......................5.1 ............28
8.09 Legal rights index, 0–10 (best)* ............................5.0 ............75
9th pillar: Technological readiness9.01 Availability of latest technologies ..........................5.4 ............54
9.02 Firm-level technology absorption...........................5.1 ............54
9.03 FDI and technology transfer ..................................4.9 ............56
9.04 Internet users/100 pop.* .....................................22.5 ............89
9.05 Broadband Internet subscriptions/100 pop.*.........7.2 ............60
9.06 Internet bandwidth, Mb/s per 10,000 pop.*..........3.6 ............87
10th pillar: Market size10.01 Domestic market size index, 1–7 (best)* ..............2.4 ..........116
10.02 Foreign market size index, 1–7 (best)*..................3.3 ..........105
11th pillar: Business sophistication 11.01 Local supplier quantity...........................................4.7 ............75
11.02 Local supplier quality .............................................4.5 ............66
11.03 State of cluster development ................................4.1 ............37
11.04 Nature of competitive advantage ..........................3.9 ............37
11.05 Value chain breadth ...............................................4.4 ............27
11.06 Control of international distribution .......................4.7 ............21
11.07 Production process sophistication.........................4.0 ............50
11.08 Extent of marketing ...............................................4.2 ............65
11.09 Willingness to delegate authority ..........................3.7 ............58
12th pillar: Innovation12.01 Capacity for innovation ..........................................2.8 ............76
12.02 Quality of scientific research institutions ..............3.3 ............86
12.03 Company spending on R&D ..................................3.0 ............64
12.04 University-industry collaboration in R&D ...............3.2 ............94
12.05 Gov’t procurement of advanced tech products.....3.7 ............67
12.06 Availability of scientists and engineers..................3.4 ..........112
12.07 Utility patents/million pop.* ...................................0.0 ............90
Mauritius
Notes: An asterisk (*) indicates that data are from sources other than the World Economic Forum. For further details and explanation, please refer to the section“How to Read the Competitiveness Profiles” on page 115.
The Africa Competitiveness Report 2011 © 2011 World Economic Forum, the World Bank and the African Development Bank
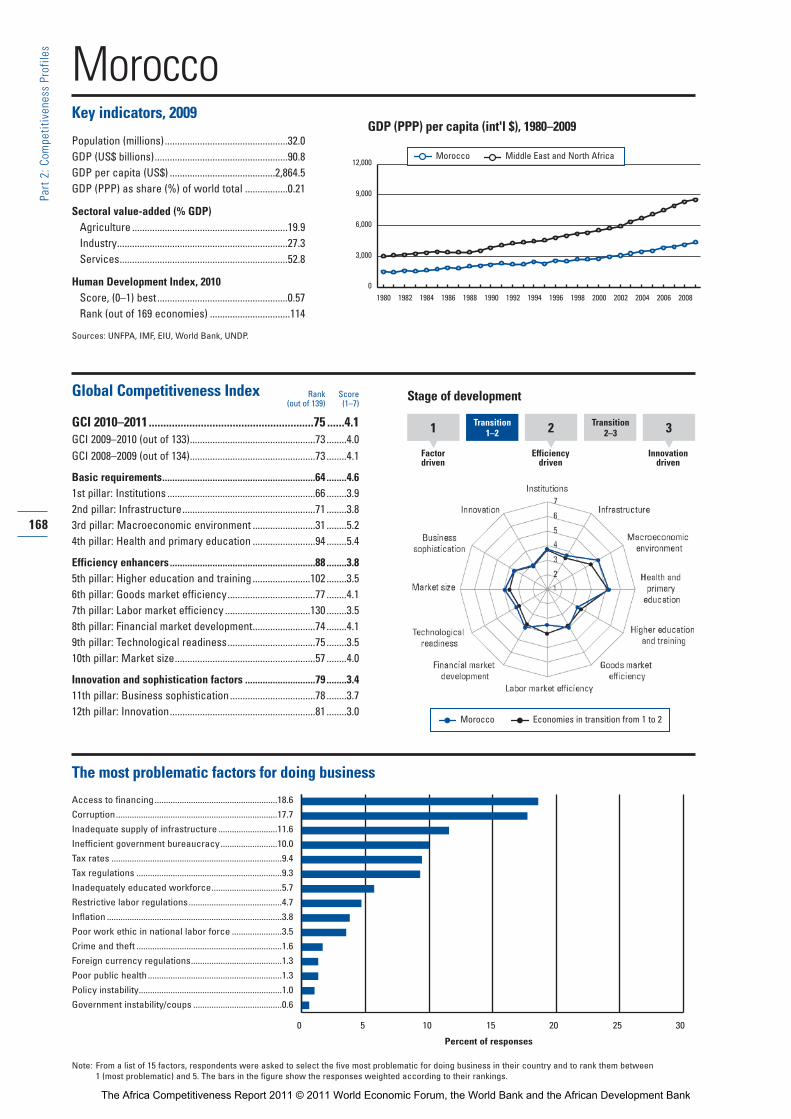
MoroccoKey indicators, 2009
Population (millions).................................................32.0GDP (US$ billions).....................................................90.8GDP per capita (US$) ..........................................2,864.5GDP (PPP) as share (%) of world total .................0.21
Sectoral value-added (% GDP)Agriculture ..............................................................19.9Industry....................................................................27.3Services...................................................................52.8
Human Development Index, 2010Score, (0–1) best....................................................0.57Rank (out of 169 economies) ................................114
Sources: UNFPA, IMF, EIU, World Bank, UNDP.
Global Competitiveness Index
GCI 2010–2011.........................................................75 ......4.1GCI 2009–2010 (out of 133)..................................................73 ........4.0GCI 2008–2009 (out of 134)..................................................73 ........4.1
Basic requirements.............................................................64 ........4.61st pillar: Institutions ...........................................................66 ........3.92nd pillar: Infrastructure.....................................................71 ........3.83rd pillar: Macroeconomic environment .........................31 ........5.24th pillar: Health and primary education .........................94 ........5.4
Efficiency enhancers..........................................................88 ........3.85th pillar: Higher education and training .......................102 ........3.56th pillar: Goods market efficiency...................................77 ........4.17th pillar: Labor market efficiency ..................................130 ........3.58th pillar: Financial market development.........................74 ........4.19th pillar: Technological readiness...................................75 ........3.510th pillar: Market size........................................................57 ........4.0
Innovation and sophistication factors ............................79 ........3.411th pillar: Business sophistication..................................78 ........3.712th pillar: Innovation..........................................................81 ........3.0
The most problematic factors for doing business
Access to financing......................................................18.6
Corruption.......................................................................17.7
Inadequate supply of infrastructure ..........................11.6
Inefficient government bureaucracy.........................10.0
Tax rates ...........................................................................9.4
Tax regulations ................................................................9.3
Inadequately educated workforce...............................5.7
Restrictive labor regulations.........................................4.7
Inflation .............................................................................3.8
Poor work ethic in national labor force ......................3.5
Crime and theft ................................................................1.6
Foreign currency regulations........................................1.3
Poor public health ...........................................................1.3
Policy instability...............................................................1.0
Government instability/coups .......................................0.6
Rank Score(out of 139) (1–7)
168
Part 2:C
ompe
titiven
ess Profile
s
GDP (PPP) per capita (int'l $), 1980–2009
0 5 10 15 20 25 30
Percent of responses
Note: From a list of 15 factors, respondents were asked to select the five most problematic for doing business in their country and to rank them between 1 (most problematic) and 5. The bars in the figure show the responses weighted according to their rankings.
1 Transition1–2 2 Transition
2 –3
Factordriven
Efficiencydriven
Innovationdriven
3
Stage of development
Morocco Economies in transition from 1 to 2
0
3,000
6,000
9,000
12,000
1980 1982 1984 1986 1988 1990 1992 1994 1996 1998 2000 2002 2004 20082006
Morocco Middle East and North Africa
The Africa Competitiveness Report 2011 © 2011 World Economic Forum, the World Bank and the African Development Bank
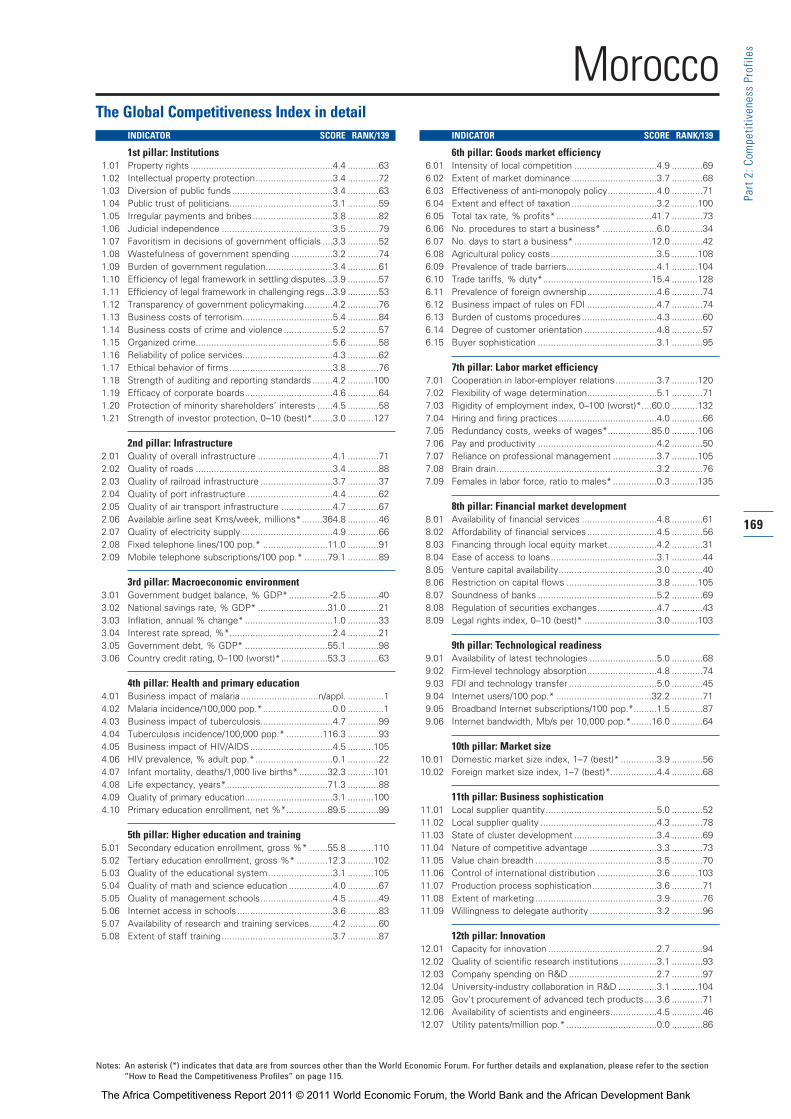
169
Part 2:C
ompe
titiven
ess Profile
s
The Global Competitiveness Index in detailINDICATOR SCORE RANK/139
1st pillar: Institutions1.01 Property rights .......................................................4.4 ............63
1.02 Intellectual property protection..............................3.4 ............72
1.03 Diversion of public funds.......................................3.4 ............63
1.04 Public trust of politicians........................................3.1 ............59
1.05 Irregular payments and bribes...............................3.8 ............82
1.06 Judicial independence ...........................................3.5 ............79
1.07 Favoritism in decisions of government officials ....3.3 ............52
1.08 Wastefulness of government spending ................3.2 ............74
1.09 Burden of government regulation..........................3.4 ............61
1.10 Efficiency of legal framework in settling disputes...3.9 ............57
1.11 Efficiency of legal framework in challenging regs...3.9 ............53
1.12 Transparency of government policymaking...........4.2 ............76
1.13 Business costs of terrorism...................................5.4 ............84
1.14 Business costs of crime and violence...................5.2 ............57
1.15 Organized crime.....................................................5.6 ............58
1.16 Reliability of police services...................................4.3 ............62
1.17 Ethical behavior of firms........................................3.8 ............76
1.18 Strength of auditing and reporting standards........4.2 ..........100
1.19 Efficacy of corporate boards..................................4.6 ............64
1.20 Protection of minority shareholders’ interests ......4.5 ............58
1.21 Strength of investor protection, 0–10 (best)*........3.0 ..........127
2nd pillar: Infrastructure2.01 Quality of overall infrastructure .............................4.1 ............71
2.02 Quality of roads .....................................................3.4 ............88
2.03 Quality of railroad infrastructure ............................3.7 ............37
2.04 Quality of port infrastructure .................................4.4 ............62
2.05 Quality of air transport infrastructure ....................4.7 ............67
2.06 Available airline seat Kms/week, millions*........364.8 ............46
2.07 Quality of electricity supply ...................................4.9 ............66
2.08 Fixed telephone lines/100 pop.* .........................11.0 ............91
2.09 Mobile telephone subscriptions/100 pop.* .........79.1 ............89
3rd pillar: Macroeconomic environment3.01 Government budget balance, % GDP* ................-2.5 ............40
3.02 National savings rate, % GDP* ...........................31.0 ............21
3.03 Inflation, annual % change* ..................................1.0 ............33
3.04 Interest rate spread, %*........................................2.4 ............21
3.05 Government debt, % GDP* ................................55.1 ............98
3.06 Country credit rating, 0–100 (worst)*..................53.3 ............63
4th pillar: Health and primary education4.01 Business impact of malaria ..............................n/appl. ..............1
4.02 Malaria incidence/100,000 pop.*...........................0.0 ..............1
4.03 Business impact of tuberculosis............................4.7 ............99
4.04 Tuberculosis incidence/100,000 pop.* ..............116.3 ............93
4.05 Business impact of HIV/AIDS................................4.5 ..........105
4.06 HIV prevalence, % adult pop.*..............................0.1 ............22
4.07 Infant mortality, deaths/1,000 live births* ...........32.3 ..........101
4.08 Life expectancy, years*.......................................71.3 ............88
4.09 Quality of primary education..................................3.1 ..........100
4.10 Primary education enrollment, net %*................89.5 ............99
5th pillar: Higher education and training5.01 Secondary education enrollment, gross %* .......55.8 ..........110
5.02 Tertiary education enrollment, gross %* ............12.3 ..........102
5.03 Quality of the educational system.........................3.1 ..........105
5.04 Quality of math and science education .................4.0 ............67
5.05 Quality of management schools............................4.5 ............49
5.06 Internet access in schools .....................................3.6 ............83
5.07 Availability of research and training services.........4.2 ............60
5.08 Extent of staff training ...........................................3.7 ............87
INDICATOR SCORE RANK/139
6th pillar: Goods market efficiency6.01 Intensity of local competition ................................4.9 ............69
6.02 Extent of market dominance .................................3.7 ............68
6.03 Effectiveness of anti-monopoly policy...................4.0 ............71
6.04 Extent and effect of taxation .................................3.2 ..........100
6.05 Total tax rate, % profits*.....................................41.7 ............73
6.06 No. procedures to start a business* .....................6.0 ............34
6.07 No. days to start a business*..............................12.0 ............42
6.08 Agricultural policy costs.........................................3.5 ..........108
6.09 Prevalence of trade barriers...................................4.1 ..........104
6.10 Trade tariffs, % duty*..........................................15.4 ..........128
6.11 Prevalence of foreign ownership...........................4.6 ............74
6.12 Business impact of rules on FDI ...........................4.7 ............74
6.13 Burden of customs procedures.............................4.3 ............60
6.14 Degree of customer orientation ............................4.8 ............57
6.15 Buyer sophistication ..............................................3.1 ............95
7th pillar: Labor market efficiency7.01 Cooperation in labor-employer relations................3.7 ..........120
7.02 Flexibility of wage determination...........................5.1 ............71
7.03 Rigidity of employment index, 0–100 (worst)*....60.0 ..........132
7.04 Hiring and firing practices......................................4.0 ............66
7.05 Redundancy costs, weeks of wages*.................85.0 ..........106
7.06 Pay and productivity ..............................................4.2 ............50
7.07 Reliance on professional management .................3.7 ..........105
7.08 Brain drain..............................................................3.2 ............76
7.09 Females in labor force, ratio to males* .................0.3 ..........135
8th pillar: Financial market development8.01 Availability of financial services .............................4.8 ............61
8.02 Affordability of financial services ...........................4.5 ............56
8.03 Financing through local equity market...................4.2 ............31
8.04 Ease of access to loans.........................................3.1 ............44
8.05 Venture capital availability......................................3.0 ............40
8.06 Restriction on capital flows ...................................3.8 ..........105
8.07 Soundness of banks ..............................................5.2 ............69
8.08 Regulation of securities exchanges.......................4.7 ............43
8.09 Legal rights index, 0–10 (best)* ............................3.0 ..........103
9th pillar: Technological readiness9.01 Availability of latest technologies ..........................5.0 ............68
9.02 Firm-level technology absorption...........................4.8 ............74
9.03 FDI and technology transfer ..................................5.0 ............45
9.04 Internet users/100 pop.* .....................................32.2 ............71
9.05 Broadband Internet subscriptions/100 pop.*.........1.5 ............87
9.06 Internet bandwidth, Mb/s per 10,000 pop.*........16.0 ............64
10th pillar: Market size10.01 Domestic market size index, 1–7 (best)* ..............3.9 ............56
10.02 Foreign market size index, 1–7 (best)*..................4.4 ............68
11th pillar: Business sophistication 11.01 Local supplier quantity...........................................5.0 ............52
11.02 Local supplier quality .............................................4.3 ............78
11.03 State of cluster development ................................3.4 ............69
11.04 Nature of competitive advantage ..........................3.3 ............73
11.05 Value chain breadth ...............................................3.5 ............70
11.06 Control of international distribution .......................3.6 ..........103
11.07 Production process sophistication.........................3.6 ............71
11.08 Extent of marketing ...............................................3.9 ............76
11.09 Willingness to delegate authority ..........................3.2 ............96
12th pillar: Innovation12.01 Capacity for innovation ..........................................2.7 ............94
12.02 Quality of scientific research institutions ..............3.1 ............93
12.03 Company spending on R&D ..................................2.7 ............97
12.04 University-industry collaboration in R&D ...............3.1 ..........104
12.05 Gov’t procurement of advanced tech products.....3.6 ............71
12.06 Availability of scientists and engineers..................4.5 ............46
12.07 Utility patents/million pop.* ...................................0.0 ............86
Morocco
Notes: An asterisk (*) indicates that data are from sources other than the World Economic Forum. For further details and explanation, please refer to the section“How to Read the Competitiveness Profiles” on page 115.
The Africa Competitiveness Report 2011 © 2011 World Economic Forum, the World Bank and the African Development Bank
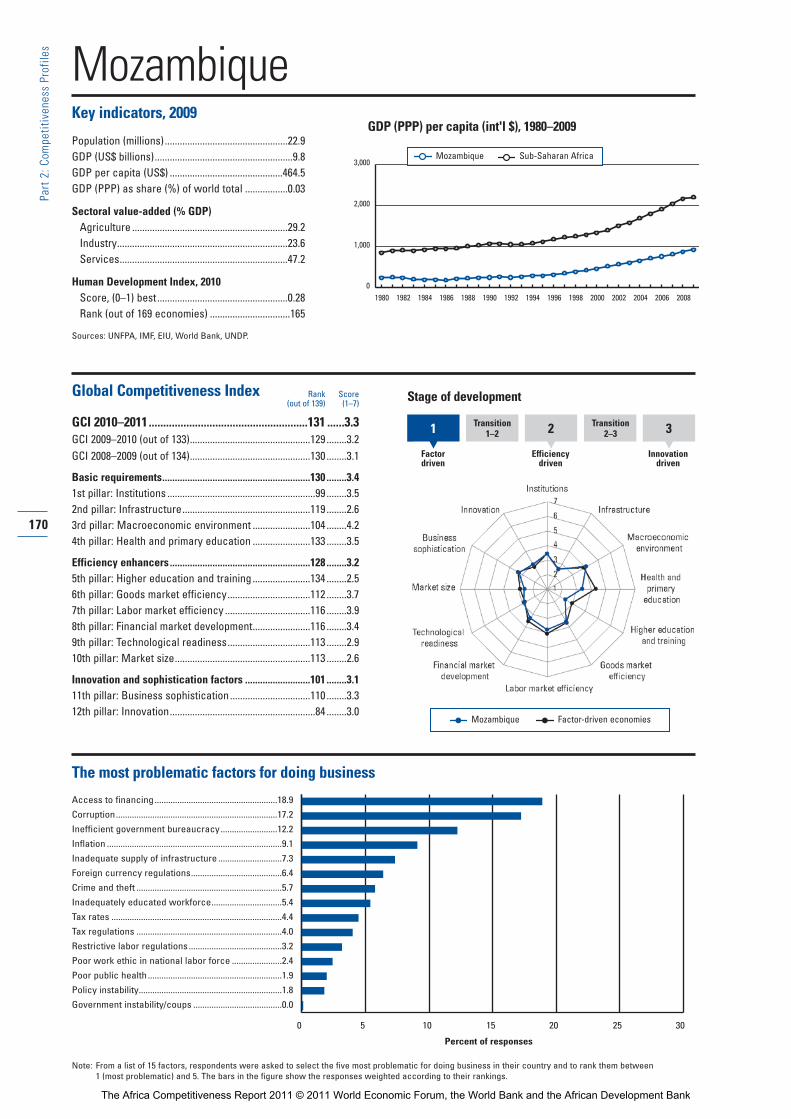
MozambiqueKey indicators, 2009
Population (millions).................................................22.9GDP (US$ billions).......................................................9.8GDP per capita (US$) .............................................464.5GDP (PPP) as share (%) of world total .................0.03
Sectoral value-added (% GDP)Agriculture ..............................................................29.2Industry....................................................................23.6Services...................................................................47.2
Human Development Index, 2010Score, (0–1) best....................................................0.28Rank (out of 169 economies) ................................165
Sources: UNFPA, IMF, EIU, World Bank, UNDP.
Global Competitiveness Index
GCI 2010–2011.......................................................131 ......3.3GCI 2009–2010 (out of 133)................................................129 ........3.2GCI 2008–2009 (out of 134)................................................130 ........3.1
Basic requirements...........................................................130 ........3.41st pillar: Institutions ...........................................................99 ........3.52nd pillar: Infrastructure...................................................119 ........2.63rd pillar: Macroeconomic environment .......................104 ........4.24th pillar: Health and primary education .......................133 ........3.5
Efficiency enhancers........................................................128 ........3.25th pillar: Higher education and training .......................134 ........2.56th pillar: Goods market efficiency.................................112 ........3.77th pillar: Labor market efficiency ..................................116 ........3.98th pillar: Financial market development.......................116 ........3.49th pillar: Technological readiness.................................113 ........2.910th pillar: Market size......................................................113 ........2.6
Innovation and sophistication factors ..........................101 ........3.111th pillar: Business sophistication................................110 ........3.312th pillar: Innovation..........................................................84 ........3.0
The most problematic factors for doing business
Access to financing......................................................18.9
Corruption.......................................................................17.2
Inefficient government bureaucracy.........................12.2
Inflation .............................................................................9.1
Inadequate supply of infrastructure ............................7.3
Foreign currency regulations........................................6.4
Crime and theft ................................................................5.7
Inadequately educated workforce...............................5.4
Tax rates ...........................................................................4.4
Tax regulations ................................................................4.0
Restrictive labor regulations.........................................3.2
Poor work ethic in national labor force ......................2.4
Poor public health ...........................................................1.9
Policy instability...............................................................1.8
Government instability/coups .......................................0.0
Rank Score(out of 139) (1–7)
170
Part 2:C
ompe
titiven
ess Profile
s
GDP (PPP) per capita (int'l $), 1980–2009
0 5 10 15 20 25 30
Percent of responses
Note: From a list of 15 factors, respondents were asked to select the five most problematic for doing business in their country and to rank them between 1 (most problematic) and 5. The bars in the figure show the responses weighted according to their rankings.
1 Transition1–2 2 Transition
2 –3
Factordriven
Efficiencydriven
Innovationdriven
3
Stage of development
Mozambique Factor-driven economies
0
1,000
2,000
3,000
1980 1982 1984 1986 1988 1990 1992 1994 1996 1998 2000 2002 2004 20082006
Mozambique Sub-Saharan Africa
The Africa Competitiveness Report 2011 © 2011 World Economic Forum, the World Bank and the African Development Bank

171
Part 2:C
ompe
titiven
ess Profile
s
The Global Competitiveness Index in detailINDICATOR SCORE RANK/139
1st pillar: Institutions1.01 Property rights .......................................................3.3 ..........117
1.02 Intellectual property protection..............................2.5 ..........124
1.03 Diversion of public funds.......................................2.5 ..........114
1.04 Public trust of politicians........................................3.0 ............64
1.05 Irregular payments and bribes...............................3.7 ............84
1.06 Judicial independence ...........................................2.9 ..........105
1.07 Favoritism in decisions of government officials ....3.0 ............70
1.08 Wastefulness of government spending ................3.1 ............80
1.09 Burden of government regulation..........................3.4 ............57
1.10 Efficiency of legal framework in settling disputes...3.5 ............76
1.11 Efficiency of legal framework in challenging regs...3.4 ............78
1.12 Transparency of government policymaking...........4.3 ............66
1.13 Business costs of terrorism...................................5.2 ............97
1.14 Business costs of crime and violence...................4.0 ..........106
1.15 Organized crime.....................................................4.0 ..........122
1.16 Reliability of police services...................................3.7 ............90
1.17 Ethical behavior of firms........................................3.3 ..........108
1.18 Strength of auditing and reporting standards........4.1 ..........103
1.19 Efficacy of corporate boards..................................4.0 ..........125
1.20 Protection of minority shareholders’ interests ......3.9 ............92
1.21 Strength of investor protection, 0–10 (best)*........6.0 ............33
2nd pillar: Infrastructure2.01 Quality of overall infrastructure .............................3.3 ..........110
2.02 Quality of roads .....................................................2.4 ..........129
2.03 Quality of railroad infrastructure ............................2.4 ............73
2.04 Quality of port infrastructure .................................3.5 ..........104
2.05 Quality of air transport infrastructure ....................4.1 ............92
2.06 Available airline seat Kms/week, millions*..........23.2 ..........112
2.07 Quality of electricity supply ...................................3.3 ..........105
2.08 Fixed telephone lines/100 pop.* ...........................0.4 ..........136
2.09 Mobile telephone subscriptions/100 pop.* .........26.1 ..........130
3rd pillar: Macroeconomic environment3.01 Government budget balance, % GDP* ................-5.7 ............99
3.02 National savings rate, % GDP* .............................8.7 ..........127
3.03 Inflation, annual % change* ..................................3.3 ............74
3.04 Interest rate spread, %*........................................6.2 ............80
3.05 Government debt, % GDP* ................................38.1 ............67
3.06 Country credit rating, 0–100 (worst)*..................27.4 ..........116
4th pillar: Health and primary education4.01 Business impact of malaria....................................3.2 ..........128
4.02 Malaria incidence/100,000 pop.*..................35,441.2 ..........131
4.03 Business impact of tuberculosis............................3.6 ..........130
4.04 Tuberculosis incidence/100,000 pop.* ..............420.2 ..........130
4.05 Business impact of HIV/AIDS................................3.1 ..........130
4.06 HIV prevalence, % adult pop.*............................12.5 ..........132
4.07 Infant mortality, deaths/1,000 live births* ...........90.4 ..........132
4.08 Life expectancy, years*.......................................47.9 ..........134
4.09 Quality of primary education..................................2.4 ..........130
4.10 Primary education enrollment, net %*................79.9 ..........121
5th pillar: Higher education and training5.01 Secondary education enrollment, gross %* .......20.6 ..........135
5.02 Tertiary education enrollment, gross %* ..............1.5 ..........137
5.03 Quality of the educational system.........................3.5 ............81
5.04 Quality of math and science education .................2.9 ..........118
5.05 Quality of management schools............................3.3 ..........117
5.06 Internet access in schools .....................................2.6 ..........120
5.07 Availability of research and training services.........3.0 ..........126
5.08 Extent of staff training ...........................................3.4 ..........111
INDICATOR SCORE RANK/139
6th pillar: Goods market efficiency6.01 Intensity of local competition ................................4.0 ..........120
6.02 Extent of market dominance .................................3.1 ..........114
6.03 Effectiveness of anti-monopoly policy...................3.6 ..........100
6.04 Extent and effect of taxation .................................3.3 ............88
6.05 Total tax rate, % profits*.....................................34.3 ............48
6.06 No. procedures to start a business* ...................10.0 ............99
6.07 No. days to start a business*..............................26.0 ............84
6.08 Agricultural policy costs.........................................3.5 ..........109
6.09 Prevalence of trade barriers...................................3.9 ..........117
6.10 Trade tariffs, % duty*............................................7.5 ............84
6.11 Prevalence of foreign ownership...........................4.7 ............71
6.12 Business impact of rules on FDI ...........................4.7 ............69
6.13 Burden of customs procedures.............................3.7 ............97
6.14 Degree of customer orientation ............................4.0 ..........110
6.15 Buyer sophistication ..............................................2.9 ..........111
7th pillar: Labor market efficiency7.01 Cooperation in labor-employer relations................3.8 ..........114
7.02 Flexibility of wage determination...........................4.1 ..........120
7.03 Rigidity of employment index, 0–100 (worst)*....40.0 ..........100
7.04 Hiring and firing practices......................................3.3 ..........110
7.05 Redundancy costs, weeks of wages*...............134.0 ..........129
7.06 Pay and productivity ..............................................3.0 ..........126
7.07 Reliance on professional management .................3.6 ..........111
7.08 Brain drain..............................................................3.4 ............63
7.09 Females in labor force, ratio to males* .................1.2 ..............1
8th pillar: Financial market development8.01 Availability of financial services .............................4.2 ............92
8.02 Affordability of financial services ...........................3.8 ............93
8.03 Financing through local equity market...................3.0 ............93
8.04 Ease of access to loans.........................................2.0 ..........123
8.05 Venture capital availability......................................2.1 ..........110
8.06 Restriction on capital flows ...................................3.4 ..........121
8.07 Soundness of banks ..............................................5.2 ............71
8.08 Regulation of securities exchanges.......................3.7 ..........101
8.09 Legal rights index, 0–10 (best)* ............................2.0 ..........129
9th pillar: Technological readiness9.01 Availability of latest technologies ..........................4.3 ..........104
9.02 Firm-level technology absorption...........................4.4 ............97
9.03 FDI and technology transfer ..................................5.2 ............18
9.04 Internet users/100 pop.* .......................................2.7 ..........126
9.05 Broadband Internet subscriptions/100 pop.*.........0.1 ..........119
9.06 Internet bandwidth, Mb/s per 10,000 pop.*..........0.6 ..........107
10th pillar: Market size10.01 Domestic market size index, 1–7 (best)* ..............2.5 ..........109
10.02 Foreign market size index, 1–7 (best)*..................2.9 ..........119
11th pillar: Business sophistication 11.01 Local supplier quantity...........................................4.1 ..........120
11.02 Local supplier quality .............................................3.6 ..........127
11.03 State of cluster development ................................2.9 ..........100
11.04 Nature of competitive advantage ..........................2.8 ..........107
11.05 Value chain breadth ...............................................3.1 ............96
11.06 Control of international distribution .......................3.6 ..........106
11.07 Production process sophistication.........................3.0 ..........112
11.08 Extent of marketing ...............................................3.6 ............92
11.09 Willingness to delegate authority ..........................2.9 ..........120
12th pillar: Innovation12.01 Capacity for innovation ..........................................2.5 ..........108
12.02 Quality of scientific research institutions ..............3.3 ............84
12.03 Company spending on R&D ..................................2.8 ............81
12.04 University-industry collaboration in R&D ...............4.0 ............48
12.05 Gov’t procurement of advanced tech products.....4.1 ............42
12.06 Availability of scientists and engineers..................3.2 ..........119
12.07 Utility patents/million pop.* ...................................0.0 ............90
Mozambique
Notes: An asterisk (*) indicates that data are from sources other than the World Economic Forum. For further details and explanation, please refer to the section“How to Read the Competitiveness Profiles” on page 115.
The Africa Competitiveness Report 2011 © 2011 World Economic Forum, the World Bank and the African Development Bank
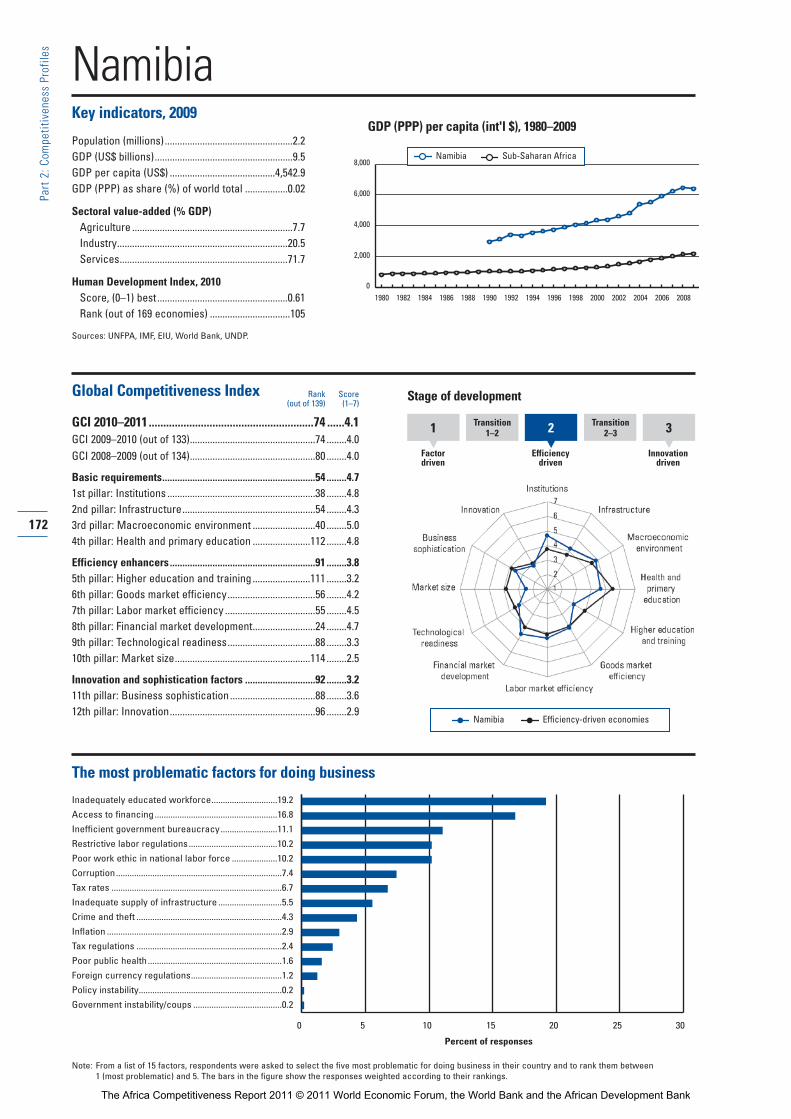
NamibiaKey indicators, 2009
Population (millions)...................................................2.2GDP (US$ billions).......................................................9.5GDP per capita (US$) ..........................................4,542.9GDP (PPP) as share (%) of world total .................0.02
Sectoral value-added (% GDP)Agriculture ................................................................7.7Industry....................................................................20.5Services...................................................................71.7
Human Development Index, 2010Score, (0–1) best....................................................0.61Rank (out of 169 economies) ................................105
Sources: UNFPA, IMF, EIU, World Bank, UNDP.
Global Competitiveness Index
GCI 2010–2011.........................................................74 ......4.1GCI 2009–2010 (out of 133)..................................................74 ........4.0GCI 2008–2009 (out of 134)..................................................80 ........4.0
Basic requirements.............................................................54 ........4.71st pillar: Institutions ...........................................................38 ........4.82nd pillar: Infrastructure.....................................................54 ........4.33rd pillar: Macroeconomic environment .........................40 ........5.04th pillar: Health and primary education .......................112 ........4.8
Efficiency enhancers..........................................................91 ........3.85th pillar: Higher education and training .......................111 ........3.26th pillar: Goods market efficiency...................................56 ........4.27th pillar: Labor market efficiency ....................................55 ........4.58th pillar: Financial market development.........................24 ........4.79th pillar: Technological readiness...................................88 ........3.310th pillar: Market size......................................................114 ........2.5
Innovation and sophistication factors ............................92 ........3.211th pillar: Business sophistication..................................88 ........3.612th pillar: Innovation..........................................................96 ........2.9
The most problematic factors for doing business
Inadequately educated workforce.............................19.2
Access to financing......................................................16.8
Inefficient government bureaucracy.........................11.1
Restrictive labor regulations.......................................10.2
Poor work ethic in national labor force ....................10.2
Corruption.........................................................................7.4
Tax rates ...........................................................................6.7
Inadequate supply of infrastructure ............................5.5
Crime and theft ................................................................4.3
Inflation .............................................................................2.9
Tax regulations ................................................................2.4
Poor public health ...........................................................1.6
Foreign currency regulations........................................1.2
Policy instability...............................................................0.2
Government instability/coups .......................................0.2
Rank Score(out of 139) (1–7)
172
Part 2:C
ompe
titiven
ess Profile
s
GDP (PPP) per capita (int'l $), 1980–2009
0 5 10 15 20 25 30
Percent of responses
Note: From a list of 15 factors, respondents were asked to select the five most problematic for doing business in their country and to rank them between 1 (most problematic) and 5. The bars in the figure show the responses weighted according to their rankings.
1 Transition1–2 2 Transition
2 –3
Factordriven
Efficiencydriven
Innovationdriven
3
Stage of development
0
2,000
4,000
6,000
8,000
1980 1982 1984 1986 1988 1990 1992 1994 1996 1998 2000 2002 2004 20082006
Namibia Sub-Saharan Africa
Namibia Efficiency-driven economies
The Africa Competitiveness Report 2011 © 2011 World Economic Forum, the World Bank and the African Development Bank

173
Part 2:C
ompe
titiven
ess Profile
s
The Global Competitiveness Index in detailINDICATOR SCORE RANK/139
1st pillar: Institutions1.01 Property rights .......................................................5.6 ............20
1.02 Intellectual property protection..............................4.8 ............31
1.03 Diversion of public funds.......................................4.2 ............44
1.04 Public trust of politicians........................................4.0 ............30
1.05 Irregular payments and bribes...............................4.8 ............44
1.06 Judicial independence ...........................................5.5 ............23
1.07 Favoritism in decisions of government officials ....3.5 ............45
1.08 Wastefulness of government spending ................4.2 ............27
1.09 Burden of government regulation..........................3.6 ............38
1.10 Efficiency of legal framework in settling disputes...4.9 ............24
1.11 Efficiency of legal framework in challenging regs...4.9 ............15
1.12 Transparency of government policymaking...........4.8 ............39
1.13 Business costs of terrorism...................................6.3 ............37
1.14 Business costs of crime and violence...................4.0 ..........107
1.15 Organized crime.....................................................5.3 ............75
1.16 Reliability of police services...................................4.5 ............54
1.17 Ethical behavior of firms........................................4.6 ............45
1.18 Strength of auditing and reporting standards........5.9 ............11
1.19 Efficacy of corporate boards..................................5.0 ............21
1.20 Protection of minority shareholders’ interests ......5.2 ............14
1.21 Strength of investor protection, 0–10 (best)*........5.3 ............59
2nd pillar: Infrastructure2.01 Quality of overall infrastructure .............................5.6 ............25
2.02 Quality of roads .....................................................5.8 ............15
2.03 Quality of railroad infrastructure ............................4.1 ............30
2.04 Quality of port infrastructure .................................5.6 ............16
2.05 Quality of air transport infrastructure ....................5.1 ............55
2.06 Available airline seat Kms/week, millions*..........30.5 ..........106
2.07 Quality of electricity supply ...................................5.7 ............41
2.08 Fixed telephone lines/100 pop.* ...........................6.5 ..........104
2.09 Mobile telephone subscriptions/100 pop.* .........56.1 ..........109
3rd pillar: Macroeconomic environment3.01 Government budget balance, % GDP* ................-2.0 ............31
3.02 National savings rate, % GDP* ...........................29.7 ............29
3.03 Inflation, annual % change* ..................................9.1 ..........118
3.04 Interest rate spread, %*........................................4.9 ............56
3.05 Government debt, % GDP* ................................15.1 ............15
3.06 Country credit rating, 0–100 (worst)*..................51.8 ............68
4th pillar: Health and primary education4.01 Business impact of malaria....................................4.2 ..........115
4.02 Malaria incidence/100,000 pop.*....................1,698.5 ..........112
4.03 Business impact of tuberculosis............................4.0 ..........121
4.04 Tuberculosis incidence/100,000 pop.* ..............746.9 ..........136
4.05 Business impact of HIV/AIDS................................3.2 ..........128
4.06 HIV prevalence, % adult pop.*............................15.3 ..........134
4.07 Infant mortality, deaths/1,000 live births* ...........31.4 ............99
4.08 Life expectancy, years*.......................................61.0 ..........112
4.09 Quality of primary education..................................3.3 ............87
4.10 Primary education enrollment, net %*................89.0 ..........101
5th pillar: Higher education and training5.01 Secondary education enrollment, gross %* .......65.8 ..........103
5.02 Tertiary education enrollment, gross %* ..............8.9 ..........110
5.03 Quality of the educational system.........................3.0 ..........112
5.04 Quality of math and science education .................2.8 ..........120
5.05 Quality of management schools............................3.1 ..........127
5.06 Internet access in schools .....................................3.1 ..........103
5.07 Availability of research and training services.........3.2 ..........116
5.08 Extent of staff training ...........................................4.0 ............66
INDICATOR SCORE RANK/139
6th pillar: Goods market efficiency6.01 Intensity of local competition ................................4.6 ............88
6.02 Extent of market dominance .................................3.4 ............86
6.03 Effectiveness of anti-monopoly policy...................4.2 ............60
6.04 Extent and effect of taxation .................................4.0 ............33
6.05 Total tax rate, % profits*.......................................9.6 ..............2
6.06 No. procedures to start a business* ...................10.0 ............99
6.07 No. days to start a business*..............................66.0 ..........128
6.08 Agricultural policy costs.........................................4.6 ............17
6.09 Prevalence of trade barriers...................................4.5 ............75
6.10 Trade tariffs, % duty*............................................6.1 ............77
6.11 Prevalence of foreign ownership...........................5.3 ............32
6.12 Business impact of rules on FDI ...........................5.1 ............42
6.13 Burden of customs procedures.............................4.2 ............65
6.14 Degree of customer orientation ............................3.9 ..........115
6.15 Buyer sophistication ..............................................3.5 ............61
7th pillar: Labor market efficiency7.01 Cooperation in labor-employer relations................3.9 ..........108
7.02 Flexibility of wage determination...........................5.0 ............83
7.03 Rigidity of employment index, 0–100 (worst)*....13.0 ............27
7.04 Hiring and firing practices......................................2.9 ..........124
7.05 Redundancy costs, weeks of wages*.................24.0 ............44
7.06 Pay and productivity ..............................................3.3 ..........107
7.07 Reliance on professional management .................4.9 ............39
7.08 Brain drain..............................................................3.6 ............54
7.09 Females in labor force, ratio to males* .................0.8 ............53
8th pillar: Financial market development8.01 Availability of financial services .............................5.2 ............36
8.02 Affordability of financial services ...........................4.0 ............79
8.03 Financing through local equity market...................3.8 ............57
8.04 Ease of access to loans.........................................3.1 ............48
8.05 Venture capital availability......................................2.6 ............65
8.06 Restriction on capital flows ...................................4.0 ............90
8.07 Soundness of banks ..............................................6.2 ............15
8.08 Regulation of securities exchanges.......................5.0 ............30
8.09 Legal rights index, 0–10 (best)* ............................8.0 ............20
9th pillar: Technological readiness9.01 Availability of latest technologies ..........................5.5 ............44
9.02 Firm-level technology absorption...........................5.2 ............45
9.03 FDI and technology transfer ..................................5.0 ............47
9.04 Internet users/100 pop.* .......................................5.9 ..........115
9.05 Broadband Internet subscriptions/100 pop.*.........0.0 ..........129
9.06 Internet bandwidth, Mb/s per 10,000 pop.*..........0.3 ..........120
10th pillar: Market size10.01 Domestic market size index, 1–7 (best)* ..............2.3 ..........118
10.02 Foreign market size index, 1–7 (best)*..................3.2 ..........111
11th pillar: Business sophistication 11.01 Local supplier quantity...........................................4.0 ..........127
11.02 Local supplier quality .............................................4.4 ............72
11.03 State of cluster development ................................3.3 ............81
11.04 Nature of competitive advantage ..........................3.2 ............79
11.05 Value chain breadth ...............................................2.6 ..........131
11.06 Control of international distribution .......................3.4 ..........119
11.07 Production process sophistication.........................3.4 ............82
11.08 Extent of marketing ...............................................3.8 ............87
11.09 Willingness to delegate authority ..........................3.7 ............56
12th pillar: Innovation12.01 Capacity for innovation ..........................................2.4 ..........113
12.02 Quality of scientific research institutions ..............3.4 ............80
12.03 Company spending on R&D ..................................2.7 ............92
12.04 University-industry collaboration in R&D ...............3.4 ............80
12.05 Gov’t procurement of advanced tech products.....3.4 ............85
12.06 Availability of scientists and engineers..................2.9 ..........135
12.07 Utility patents/million pop.* ...................................0.0 ............90
Namibia
Notes: An asterisk (*) indicates that data are from sources other than the World Economic Forum. For further details and explanation, please refer to the section“How to Read the Competitiveness Profiles” on page 115.
The Africa Competitiveness Report 2011 © 2011 World Economic Forum, the World Bank and the African Development Bank
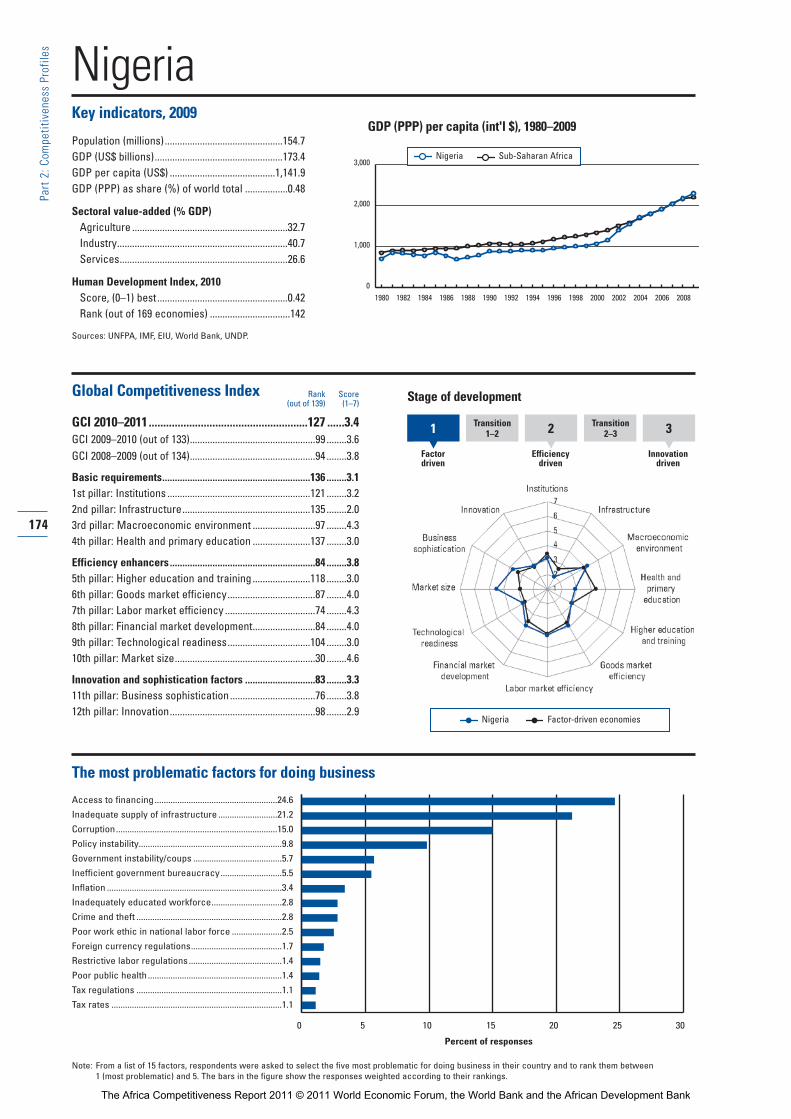
NigeriaKey indicators, 2009
Population (millions)...............................................154.7GDP (US$ billions)...................................................173.4GDP per capita (US$) ..........................................1,141.9GDP (PPP) as share (%) of world total .................0.48
Sectoral value-added (% GDP)Agriculture ..............................................................32.7Industry....................................................................40.7Services...................................................................26.6
Human Development Index, 2010Score, (0–1) best....................................................0.42Rank (out of 169 economies) ................................142
Sources: UNFPA, IMF, EIU, World Bank, UNDP.
Global Competitiveness Index
GCI 2010–2011.......................................................127 ......3.4GCI 2009–2010 (out of 133)..................................................99 ........3.6GCI 2008–2009 (out of 134)..................................................94 ........3.8
Basic requirements...........................................................136 ........3.11st pillar: Institutions .........................................................121 ........3.22nd pillar: Infrastructure...................................................135 ........2.03rd pillar: Macroeconomic environment .........................97 ........4.34th pillar: Health and primary education .......................137 ........3.0
Efficiency enhancers..........................................................84 ........3.85th pillar: Higher education and training .......................118 ........3.06th pillar: Goods market efficiency...................................87 ........4.07th pillar: Labor market efficiency ....................................74 ........4.38th pillar: Financial market development.........................84 ........4.09th pillar: Technological readiness.................................104 ........3.010th pillar: Market size........................................................30 ........4.6
Innovation and sophistication factors ............................83 ........3.311th pillar: Business sophistication..................................76 ........3.812th pillar: Innovation..........................................................98 ........2.9
The most problematic factors for doing business
Access to financing......................................................24.6
Inadequate supply of infrastructure ..........................21.2
Corruption.......................................................................15.0
Policy instability...............................................................9.8
Government instability/coups .......................................5.7
Inefficient government bureaucracy...........................5.5
Inflation .............................................................................3.4
Inadequately educated workforce...............................2.8
Crime and theft ................................................................2.8
Poor work ethic in national labor force ......................2.5
Foreign currency regulations........................................1.7
Restrictive labor regulations.........................................1.4
Poor public health ...........................................................1.4
Tax regulations ................................................................1.1
Tax rates ...........................................................................1.1
Rank Score(out of 139) (1–7)
174
Part 2:C
ompe
titiven
ess Profile
s
GDP (PPP) per capita (int'l $), 1980–2009
0 5 10 15 20 25 30
Percent of responses
Note: From a list of 15 factors, respondents were asked to select the five most problematic for doing business in their country and to rank them between 1 (most problematic) and 5. The bars in the figure show the responses weighted according to their rankings.
1 Transition1–2 2 Transition
2 –3
Factordriven
Efficiencydriven
Innovationdriven
3
Stage of development
Nigeria Factor-driven economies
0
1,000
2,000
3,000
1980 1982 1984 1986 1988 1990 1992 1994 1996 1998 2000 2002 2004 20082006
Nigeria Sub-Saharan Africa
The Africa Competitiveness Report 2011 © 2011 World Economic Forum, the World Bank and the African Development Bank

175
Part 2:C
ompe
titiven
ess Profile
s
The Global Competitiveness Index in detailINDICATOR SCORE RANK/139
1st pillar: Institutions1.01 Property rights .......................................................3.3 ..........118
1.02 Intellectual property protection..............................2.9 ............95
1.03 Diversion of public funds.......................................2.2 ..........126
1.04 Public trust of politicians........................................1.8 ..........125
1.05 Irregular payments and bribes...............................2.9 ..........121
1.06 Judicial independence ...........................................3.5 ............80
1.07 Favoritism in decisions of government officials ....2.4 ..........124
1.08 Wastefulness of government spending ................2.0 ..........135
1.09 Burden of government regulation..........................3.1 ............86
1.10 Efficiency of legal framework in settling disputes...3.7 ............68
1.11 Efficiency of legal framework in challenging regs...3.3 ............80
1.12 Transparency of government policymaking...........3.6 ..........126
1.13 Business costs of terrorism...................................4.7 ..........121
1.14 Business costs of crime and violence...................3.5 ..........120
1.15 Organized crime.....................................................4.2 ..........119
1.16 Reliability of police services...................................2.8 ..........125
1.17 Ethical behavior of firms........................................3.1 ..........125
1.18 Strength of auditing and reporting standards........3.4 ..........130
1.19 Efficacy of corporate boards..................................4.1 ..........107
1.20 Protection of minority shareholders’ interests ......3.6 ..........117
1.21 Strength of investor protection, 0–10 (best)*........5.7 ............45
2nd pillar: Infrastructure2.01 Quality of overall infrastructure .............................2.4 ..........134
2.02 Quality of roads .....................................................2.4 ..........128
2.03 Quality of railroad infrastructure ............................1.5 ..........104
2.04 Quality of port infrastructure .................................3.0 ..........121
2.05 Quality of air transport infrastructure ....................3.9 ..........101
2.06 Available airline seat Kms/week, millions*........276.6 ............53
2.07 Quality of electricity supply ...................................1.3 ..........138
2.08 Fixed telephone lines/100 pop.* ...........................0.9 ..........129
2.09 Mobile telephone subscriptions/100 pop.* .........47.2 ..........115
3rd pillar: Macroeconomic environment3.01 Government budget balance, % GDP* ................-5.2 ............90
3.02 National savings rate, % GDP* ...........................22.1 ............56
3.03 Inflation, annual % change* ................................12.4 ..........129
3.04 Interest rate spread, %*........................................5.8 ............74
3.05 Government debt, % GDP* ................................14.3 ............11
3.06 Country credit rating, 0–100 (worst)*..................36.1 ............91
4th pillar: Health and primary education4.01 Business impact of malaria....................................2.6 ..........135
4.02 Malaria incidence/100,000 pop.*..................39,736.4 ..........136
4.03 Business impact of tuberculosis............................3.9 ..........124
4.04 Tuberculosis incidence/100,000 pop.* ..............302.7 ..........120
4.05 Business impact of HIV/AIDS................................3.7 ..........118
4.06 HIV prevalence, % adult pop.*..............................3.1 ..........124
4.07 Infant mortality, deaths/1,000 live births* ...........95.8 ..........135
4.08 Life expectancy, years*.......................................47.9 ..........133
4.09 Quality of primary education..................................2.6 ..........122
4.10 Primary education enrollment, net %*................61.4 ..........133
5th pillar: Higher education and training5.01 Secondary education enrollment, gross %* .......30.5 ..........127
5.02 Tertiary education enrollment, gross %* ............10.1 ..........107
5.03 Quality of the educational system.........................3.8 ............63
5.04 Quality of math and science education .................2.9 ..........119
5.05 Quality of management schools............................3.7 ............99
5.06 Internet access in schools .....................................3.2 ............99
5.07 Availability of research and training services.........3.7 ............90
5.08 Extent of staff training ...........................................3.9 ............74
INDICATOR SCORE RANK/139
6th pillar: Goods market efficiency6.01 Intensity of local competition ................................5.0 ............62
6.02 Extent of market dominance .................................3.8 ............61
6.03 Effectiveness of anti-monopoly policy...................4.0 ............68
6.04 Extent and effect of taxation .................................3.7 ............50
6.05 Total tax rate, % profits*.....................................32.2 ............39
6.06 No. procedures to start a business* .....................8.0 ............73
6.07 No. days to start a business*..............................31.0 ............95
6.08 Agricultural policy costs.........................................3.2 ..........127
6.09 Prevalence of trade barriers...................................3.6 ..........127
6.10 Trade tariffs, % duty*..........................................11.2 ..........108
6.11 Prevalence of foreign ownership...........................4.5 ............88
6.12 Business impact of rules on FDI ...........................4.5 ............86
6.13 Burden of customs procedures.............................3.1 ..........126
6.14 Degree of customer orientation ............................4.3 ............86
6.15 Buyer sophistication ..............................................3.3 ............80
7th pillar: Labor market efficiency7.01 Cooperation in labor-employer relations................3.9 ..........112
7.02 Flexibility of wage determination...........................5.4 ............41
7.03 Rigidity of employment index, 0–100 (worst)*......7.0 ............10
7.04 Hiring and firing practices......................................5.2 ..............8
7.05 Redundancy costs, weeks of wages*.................50.0 ............84
7.06 Pay and productivity ..............................................3.9 ............78
7.07 Reliance on professional management .................4.3 ............70
7.08 Brain drain..............................................................3.2 ............77
7.09 Females in labor force, ratio to males* .................0.6 ..........115
8th pillar: Financial market development8.01 Availability of financial services .............................4.2 ............90
8.02 Affordability of financial services ...........................3.9 ............84
8.03 Financing through local equity market...................4.0 ............40
8.04 Ease of access to loans.........................................2.0 ..........126
8.05 Venture capital availability......................................2.0 ..........120
8.06 Restriction on capital flows ...................................4.0 ............89
8.07 Soundness of banks ..............................................4.1 ..........122
8.08 Regulation of securities exchanges.......................4.0 ............82
8.09 Legal rights index, 0–10 (best)* ............................8.0 ............20
9th pillar: Technological readiness9.01 Availability of latest technologies ..........................4.2 ..........115
9.02 Firm-level technology absorption...........................4.7 ............77
9.03 FDI and technology transfer ..................................4.4 ............89
9.04 Internet users/100 pop.* .....................................28.4 ............78
9.05 Broadband Internet subscriptions/100 pop.*.........0.1 ..........121
9.06 Internet bandwidth, Mb/s per 10,000 pop.*..........0.0 ..........132
10th pillar: Market size10.01 Domestic market size index, 1–7 (best)* ..............4.5 ............29
10.02 Foreign market size index, 1–7 (best)*..................5.1 ............40
11th pillar: Business sophistication 11.01 Local supplier quantity...........................................5.2 ............30
11.02 Local supplier quality .............................................4.0 ..........101
11.03 State of cluster development ................................3.8 ............48
11.04 Nature of competitive advantage ..........................3.3 ............66
11.05 Value chain breadth ...............................................3.1 ............98
11.06 Control of international distribution .......................4.0 ............71
11.07 Production process sophistication.........................3.1 ............98
11.08 Extent of marketing ...............................................3.4 ..........103
11.09 Willingness to delegate authority ..........................4.0 ............42
12th pillar: Innovation12.01 Capacity for innovation ..........................................2.9 ............73
12.02 Quality of scientific research institutions ..............2.8 ..........113
12.03 Company spending on R&D ..................................3.2 ............53
12.04 University-industry collaboration in R&D ...............3.1 ..........102
12.05 Gov’t procurement of advanced tech products.....3.2 ..........107
12.06 Availability of scientists and engineers..................3.9 ............79
12.07 Utility patents/million pop.* ...................................0.0 ............90
Nigeria
Notes: An asterisk (*) indicates that data are from sources other than the World Economic Forum. For further details and explanation, please refer to the section“How to Read the Competitiveness Profiles” on page 115.
The Africa Competitiveness Report 2011 © 2011 World Economic Forum, the World Bank and the African Development Bank
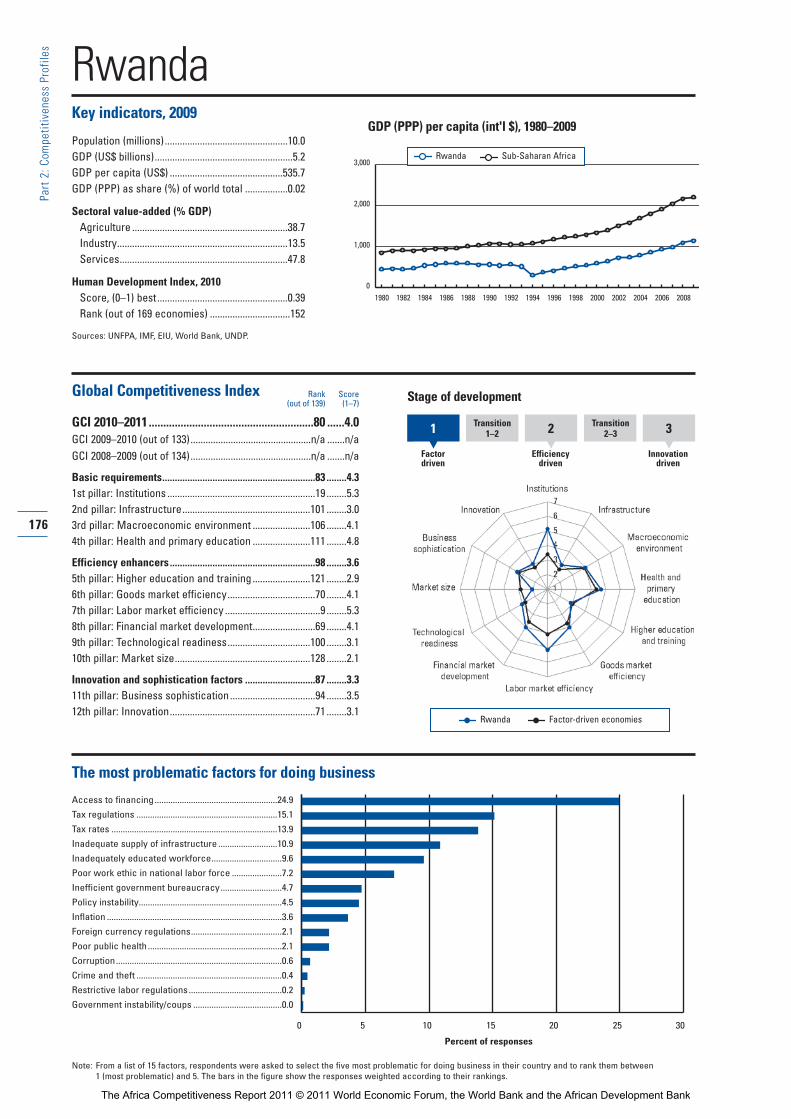
RwandaKey indicators, 2009
Population (millions).................................................10.0GDP (US$ billions).......................................................5.2GDP per capita (US$) .............................................535.7GDP (PPP) as share (%) of world total .................0.02
Sectoral value-added (% GDP)Agriculture ..............................................................38.7Industry....................................................................13.5Services...................................................................47.8
Human Development Index, 2010Score, (0–1) best....................................................0.39Rank (out of 169 economies) ................................152
Sources: UNFPA, IMF, EIU, World Bank, UNDP.
Global Competitiveness Index
GCI 2010–2011.........................................................80 ......4.0GCI 2009–2010 (out of 133)................................................n/a .......n/aGCI 2008–2009 (out of 134)................................................n/a .......n/a
Basic requirements.............................................................83 ........4.31st pillar: Institutions ...........................................................19 ........5.32nd pillar: Infrastructure...................................................101 ........3.03rd pillar: Macroeconomic environment .......................106 ........4.14th pillar: Health and primary education .......................111 ........4.8
Efficiency enhancers..........................................................98 ........3.65th pillar: Higher education and training .......................121 ........2.96th pillar: Goods market efficiency...................................70 ........4.17th pillar: Labor market efficiency ......................................9 ........5.38th pillar: Financial market development.........................69 ........4.19th pillar: Technological readiness.................................100 ........3.110th pillar: Market size......................................................128 ........2.1
Innovation and sophistication factors ............................87 ........3.311th pillar: Business sophistication..................................94 ........3.512th pillar: Innovation..........................................................71 ........3.1
The most problematic factors for doing business
Access to financing......................................................24.9
Tax regulations ..............................................................15.1
Tax rates .........................................................................13.9
Inadequate supply of infrastructure ..........................10.9
Inadequately educated workforce...............................9.6
Poor work ethic in national labor force ......................7.2
Inefficient government bureaucracy...........................4.7
Policy instability...............................................................4.5
Inflation .............................................................................3.6
Foreign currency regulations........................................2.1
Poor public health ...........................................................2.1
Corruption.........................................................................0.6
Crime and theft ................................................................0.4
Restrictive labor regulations.........................................0.2
Government instability/coups .......................................0.0
Rank Score(out of 139) (1–7)
176
Part 2:C
ompe
titiven
ess Profile
s
GDP (PPP) per capita (int'l $), 1980–2009
0 5 10 15 20 25 30
Percent of responses
Note: From a list of 15 factors, respondents were asked to select the five most problematic for doing business in their country and to rank them between 1 (most problematic) and 5. The bars in the figure show the responses weighted according to their rankings.
1 Transition1–2 2 Transition
2 –3
Factordriven
Efficiencydriven
Innovationdriven
3
Stage of development
Rwanda Factor-driven economies
0
1,000
2,000
3,000
1980 1982 1984 1986 1988 1990 1992 1994 1996 1998 2000 2002 2004 20082006
Rwanda Sub-Saharan Africa
The Africa Competitiveness Report 2011 © 2011 World Economic Forum, the World Bank and the African Development Bank
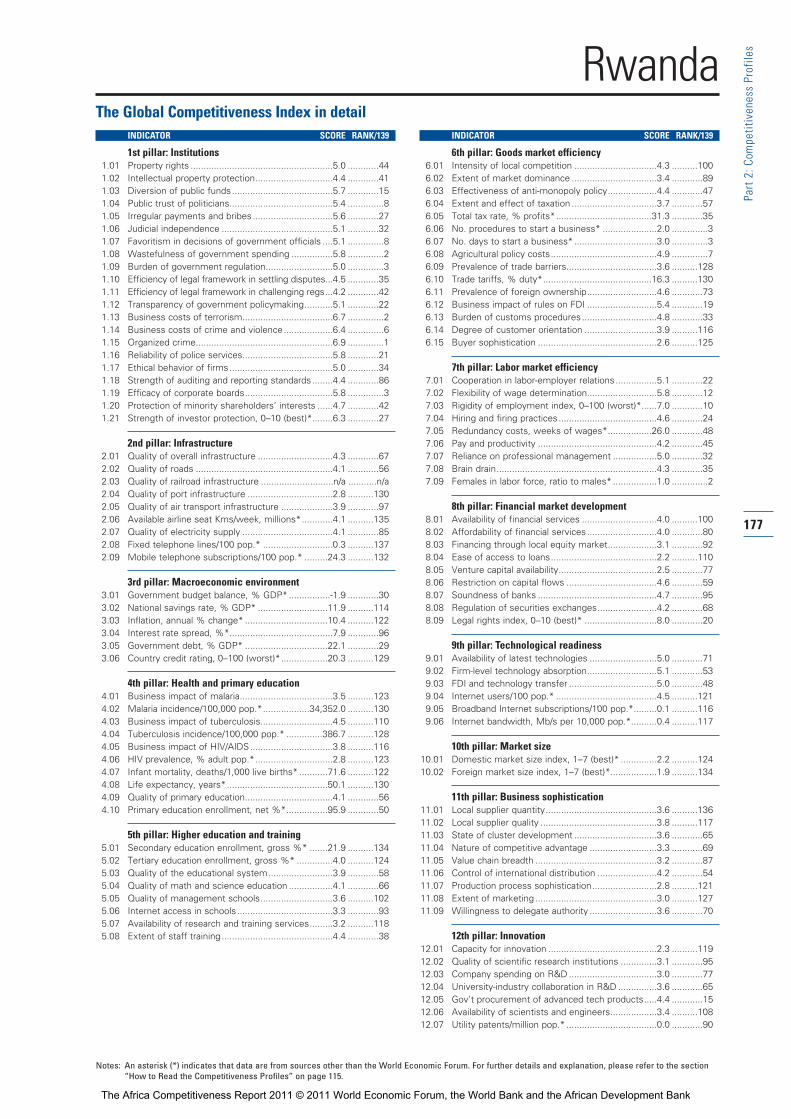
177
Part 2:C
ompe
titiven
ess Profile
s
The Global Competitiveness Index in detailINDICATOR SCORE RANK/139
1st pillar: Institutions1.01 Property rights .......................................................5.0 ............44
1.02 Intellectual property protection..............................4.4 ............41
1.03 Diversion of public funds.......................................5.7 ............15
1.04 Public trust of politicians........................................5.4 ..............8
1.05 Irregular payments and bribes...............................5.6 ............27
1.06 Judicial independence ...........................................5.1 ............32
1.07 Favoritism in decisions of government officials ....5.1 ..............8
1.08 Wastefulness of government spending ................5.8 ..............2
1.09 Burden of government regulation..........................5.0 ..............3
1.10 Efficiency of legal framework in settling disputes...4.5 ............35
1.11 Efficiency of legal framework in challenging regs...4.2 ............42
1.12 Transparency of government policymaking...........5.1 ............22
1.13 Business costs of terrorism...................................6.7 ..............2
1.14 Business costs of crime and violence...................6.4 ..............6
1.15 Organized crime.....................................................6.9 ..............1
1.16 Reliability of police services...................................5.8 ............21
1.17 Ethical behavior of firms........................................5.0 ............34
1.18 Strength of auditing and reporting standards........4.4 ............86
1.19 Efficacy of corporate boards..................................5.8 ..............3
1.20 Protection of minority shareholders’ interests ......4.7 ............42
1.21 Strength of investor protection, 0–10 (best)*........6.3 ............27
2nd pillar: Infrastructure2.01 Quality of overall infrastructure .............................4.3 ............67
2.02 Quality of roads .....................................................4.1 ............56
2.03 Quality of railroad infrastructure ............................n/a ...........n/a
2.04 Quality of port infrastructure .................................2.8 ..........130
2.05 Quality of air transport infrastructure ....................3.9 ............97
2.06 Available airline seat Kms/week, millions*............4.1 ..........135
2.07 Quality of electricity supply ...................................4.1 ............85
2.08 Fixed telephone lines/100 pop.* ...........................0.3 ..........137
2.09 Mobile telephone subscriptions/100 pop.* .........24.3 ..........132
3rd pillar: Macroeconomic environment3.01 Government budget balance, % GDP* ................-1.9 ............30
3.02 National savings rate, % GDP* ...........................11.9 ..........114
3.03 Inflation, annual % change* ................................10.4 ..........122
3.04 Interest rate spread, %*........................................7.9 ............96
3.05 Government debt, % GDP* ................................22.1 ............29
3.06 Country credit rating, 0–100 (worst)*..................20.3 ..........129
4th pillar: Health and primary education4.01 Business impact of malaria....................................3.5 ..........123
4.02 Malaria incidence/100,000 pop.*..................34,352.0 ..........130
4.03 Business impact of tuberculosis............................4.5 ..........110
4.04 Tuberculosis incidence/100,000 pop.* ..............386.7 ..........128
4.05 Business impact of HIV/AIDS................................3.8 ..........116
4.06 HIV prevalence, % adult pop.*..............................2.8 ..........123
4.07 Infant mortality, deaths/1,000 live births* ...........71.6 ..........122
4.08 Life expectancy, years*.......................................50.1 ..........130
4.09 Quality of primary education..................................4.1 ............56
4.10 Primary education enrollment, net %*................95.9 ............50
5th pillar: Higher education and training5.01 Secondary education enrollment, gross %* .......21.9 ..........134
5.02 Tertiary education enrollment, gross %* ..............4.0 ..........124
5.03 Quality of the educational system.........................3.9 ............58
5.04 Quality of math and science education .................4.1 ............66
5.05 Quality of management schools............................3.6 ..........102
5.06 Internet access in schools .....................................3.3 ............93
5.07 Availability of research and training services.........3.2 ..........118
5.08 Extent of staff training ...........................................4.4 ............38
INDICATOR SCORE RANK/139
6th pillar: Goods market efficiency6.01 Intensity of local competition ................................4.3 ..........100
6.02 Extent of market dominance .................................3.4 ............89
6.03 Effectiveness of anti-monopoly policy...................4.4 ............47
6.04 Extent and effect of taxation .................................3.7 ............57
6.05 Total tax rate, % profits*.....................................31.3 ............35
6.06 No. procedures to start a business* .....................2.0 ..............3
6.07 No. days to start a business*................................3.0 ..............3
6.08 Agricultural policy costs.........................................4.9 ..............7
6.09 Prevalence of trade barriers...................................3.6 ..........128
6.10 Trade tariffs, % duty*..........................................16.3 ..........130
6.11 Prevalence of foreign ownership...........................4.6 ............73
6.12 Business impact of rules on FDI ...........................5.4 ............19
6.13 Burden of customs procedures.............................4.8 ............33
6.14 Degree of customer orientation ............................3.9 ..........116
6.15 Buyer sophistication ..............................................2.6 ..........125
7th pillar: Labor market efficiency7.01 Cooperation in labor-employer relations................5.1 ............22
7.02 Flexibility of wage determination...........................5.8 ............12
7.03 Rigidity of employment index, 0–100 (worst)*......7.0 ............10
7.04 Hiring and firing practices......................................4.6 ............24
7.05 Redundancy costs, weeks of wages*.................26.0 ............48
7.06 Pay and productivity ..............................................4.2 ............45
7.07 Reliance on professional management .................5.0 ............32
7.08 Brain drain..............................................................4.3 ............35
7.09 Females in labor force, ratio to males* .................1.0 ..............2
8th pillar: Financial market development8.01 Availability of financial services .............................4.0 ..........100
8.02 Affordability of financial services ...........................4.0 ............80
8.03 Financing through local equity market...................3.1 ............92
8.04 Ease of access to loans.........................................2.2 ..........110
8.05 Venture capital availability......................................2.5 ............77
8.06 Restriction on capital flows ...................................4.6 ............59
8.07 Soundness of banks ..............................................4.7 ............95
8.08 Regulation of securities exchanges.......................4.2 ............68
8.09 Legal rights index, 0–10 (best)* ............................8.0 ............20
9th pillar: Technological readiness9.01 Availability of latest technologies ..........................5.0 ............71
9.02 Firm-level technology absorption...........................5.1 ............53
9.03 FDI and technology transfer ..................................5.0 ............48
9.04 Internet users/100 pop.* .......................................4.5 ..........121
9.05 Broadband Internet subscriptions/100 pop.*.........0.1 ..........116
9.06 Internet bandwidth, Mb/s per 10,000 pop.*..........0.4 ..........117
10th pillar: Market size10.01 Domestic market size index, 1–7 (best)* ..............2.2 ..........124
10.02 Foreign market size index, 1–7 (best)*..................1.9 ..........134
11th pillar: Business sophistication 11.01 Local supplier quantity...........................................3.6 ..........136
11.02 Local supplier quality .............................................3.8 ..........117
11.03 State of cluster development ................................3.6 ............65
11.04 Nature of competitive advantage ..........................3.3 ............69
11.05 Value chain breadth ...............................................3.2 ............87
11.06 Control of international distribution .......................4.2 ............54
11.07 Production process sophistication.........................2.8 ..........121
11.08 Extent of marketing ...............................................3.0 ..........127
11.09 Willingness to delegate authority ..........................3.6 ............70
12th pillar: Innovation12.01 Capacity for innovation ..........................................2.3 ..........119
12.02 Quality of scientific research institutions ..............3.1 ............95
12.03 Company spending on R&D ..................................3.0 ............77
12.04 University-industry collaboration in R&D ...............3.6 ............65
12.05 Gov’t procurement of advanced tech products.....4.4 ............15
12.06 Availability of scientists and engineers..................3.4 ..........108
12.07 Utility patents/million pop.* ...................................0.0 ............90
Rwanda
Notes: An asterisk (*) indicates that data are from sources other than the World Economic Forum. For further details and explanation, please refer to the section“How to Read the Competitiveness Profiles” on page 115.
The Africa Competitiveness Report 2011 © 2011 World Economic Forum, the World Bank and the African Development Bank
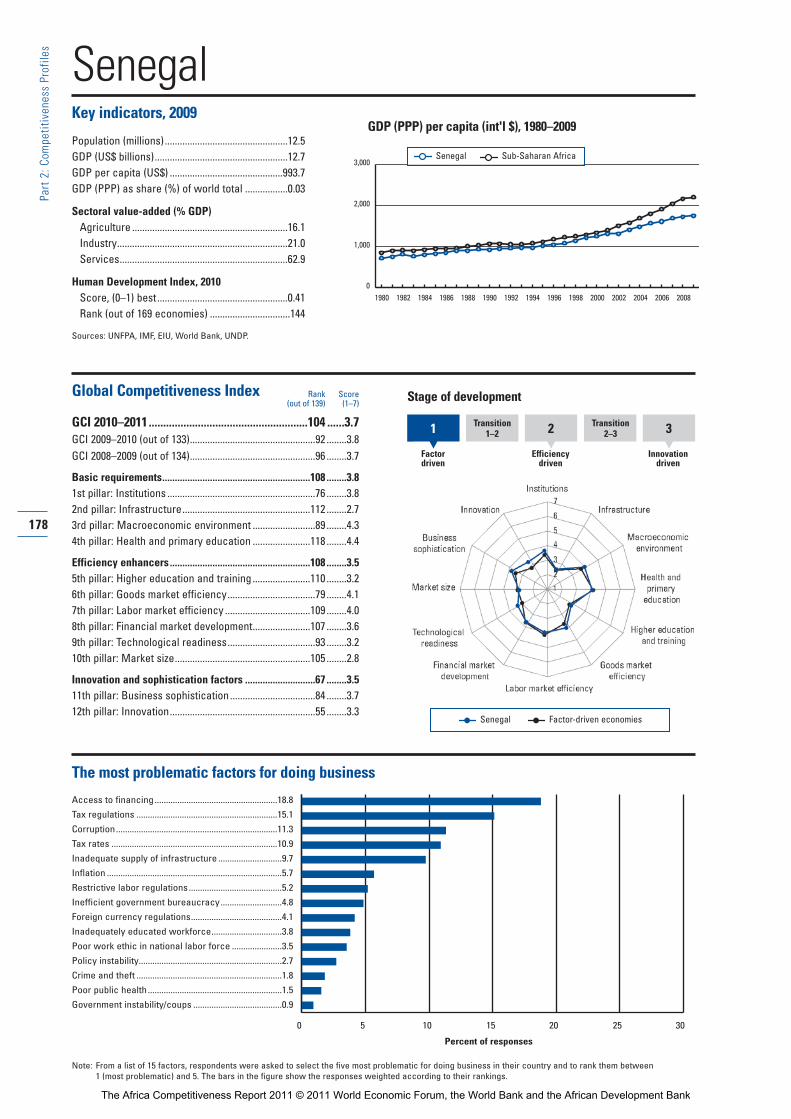
SenegalKey indicators, 2009
Population (millions).................................................12.5GDP (US$ billions).....................................................12.7GDP per capita (US$) .............................................993.7GDP (PPP) as share (%) of world total .................0.03
Sectoral value-added (% GDP)Agriculture ..............................................................16.1Industry....................................................................21.0Services...................................................................62.9
Human Development Index, 2010Score, (0–1) best....................................................0.41Rank (out of 169 economies) ................................144
Sources: UNFPA, IMF, EIU, World Bank, UNDP.
Global Competitiveness Index
GCI 2010–2011.......................................................104 ......3.7GCI 2009–2010 (out of 133)..................................................92 ........3.8GCI 2008–2009 (out of 134)..................................................96 ........3.7
Basic requirements...........................................................108 ........3.81st pillar: Institutions ...........................................................76 ........3.82nd pillar: Infrastructure...................................................112 ........2.73rd pillar: Macroeconomic environment .........................89 ........4.34th pillar: Health and primary education .......................118 ........4.4
Efficiency enhancers........................................................108 ........3.55th pillar: Higher education and training .......................110 ........3.26th pillar: Goods market efficiency...................................79 ........4.17th pillar: Labor market efficiency ..................................109 ........4.08th pillar: Financial market development.......................107 ........3.69th pillar: Technological readiness...................................93 ........3.210th pillar: Market size......................................................105 ........2.8
Innovation and sophistication factors ............................67 ........3.511th pillar: Business sophistication..................................84 ........3.712th pillar: Innovation..........................................................55 ........3.3
The most problematic factors for doing business
Access to financing......................................................18.8
Tax regulations ..............................................................15.1
Corruption.......................................................................11.3
Tax rates .........................................................................10.9
Inadequate supply of infrastructure ............................9.7
Inflation .............................................................................5.7
Restrictive labor regulations.........................................5.2
Inefficient government bureaucracy...........................4.8
Foreign currency regulations........................................4.1
Inadequately educated workforce...............................3.8
Poor work ethic in national labor force ......................3.5
Policy instability...............................................................2.7
Crime and theft ................................................................1.8
Poor public health ...........................................................1.5
Government instability/coups .......................................0.9
Rank Score(out of 139) (1–7)
178
Part 2:C
ompe
titiven
ess Profile
s
GDP (PPP) per capita (int'l $), 1980–2009
0 5 10 15 20 25 30
Percent of responses
Note: From a list of 15 factors, respondents were asked to select the five most problematic for doing business in their country and to rank them between 1 (most problematic) and 5. The bars in the figure show the responses weighted according to their rankings.
1 Transition1–2 2 Transition
2 –3
Factordriven
Efficiencydriven
Innovationdriven
3
Stage of development
Senegal Factor-driven economies
0
1,000
2,000
3,000
1980 1982 1984 1986 1988 1990 1992 1994 1996 1998 2000 2002 2004 20082006
Senegal Sub-Saharan Africa
The Africa Competitiveness Report 2011 © 2011 World Economic Forum, the World Bank and the African Development Bank
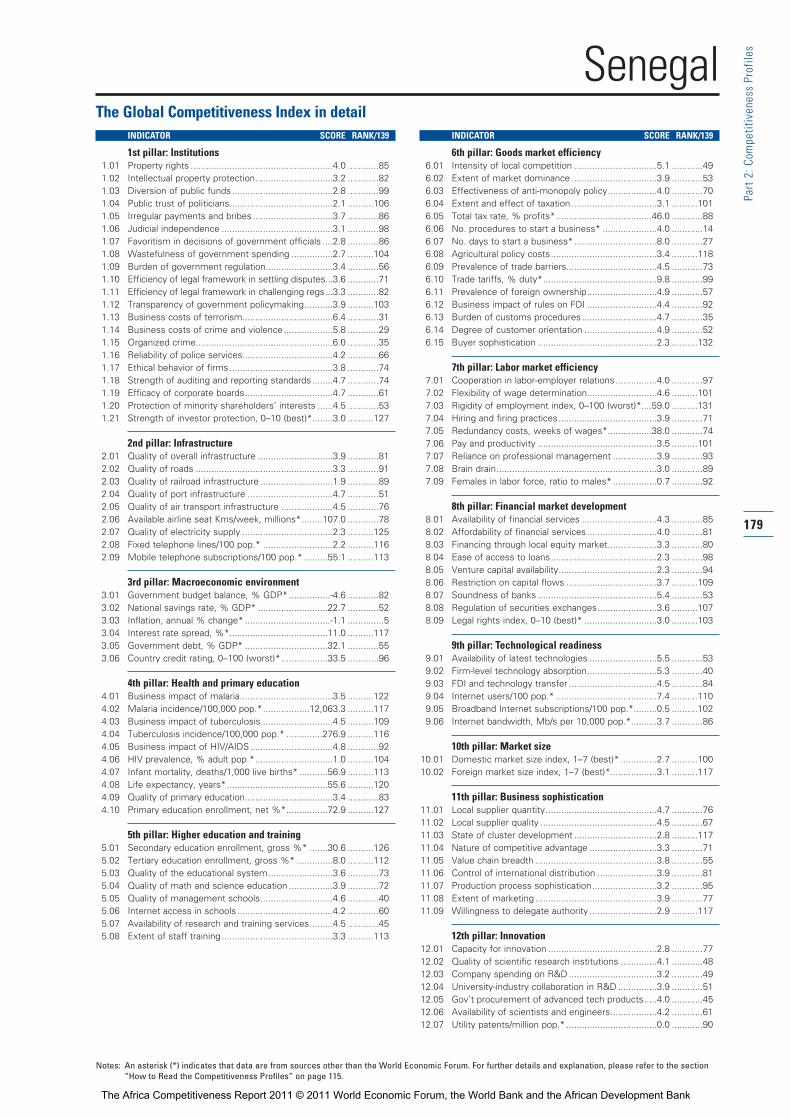
179
Part 2:C
ompe
titiven
ess Profile
s
The Global Competitiveness Index in detailINDICATOR SCORE RANK/139
1st pillar: Institutions1.01 Property rights .......................................................4.0 ............85
1.02 Intellectual property protection..............................3.2 ............82
1.03 Diversion of public funds.......................................2.8 ............99
1.04 Public trust of politicians........................................2.1 ..........106
1.05 Irregular payments and bribes...............................3.7 ............86
1.06 Judicial independence ...........................................3.1 ............98
1.07 Favoritism in decisions of government officials ....2.8 ............86
1.08 Wastefulness of government spending ................2.7 ..........104
1.09 Burden of government regulation..........................3.4 ............56
1.10 Efficiency of legal framework in settling disputes...3.6 ............71
1.11 Efficiency of legal framework in challenging regs...3.3 ............82
1.12 Transparency of government policymaking...........3.9 ..........103
1.13 Business costs of terrorism...................................6.4 ............31
1.14 Business costs of crime and violence...................5.8 ............29
1.15 Organized crime.....................................................6.0 ............35
1.16 Reliability of police services...................................4.2 ............66
1.17 Ethical behavior of firms........................................3.8 ............74
1.18 Strength of auditing and reporting standards........4.7 ............74
1.19 Efficacy of corporate boards..................................4.7 ............61
1.20 Protection of minority shareholders’ interests ......4.5 ............53
1.21 Strength of investor protection, 0–10 (best)*........3.0 ..........127
2nd pillar: Infrastructure2.01 Quality of overall infrastructure .............................3.9 ............81
2.02 Quality of roads .....................................................3.3 ............91
2.03 Quality of railroad infrastructure ............................1.9 ............89
2.04 Quality of port infrastructure .................................4.7 ............51
2.05 Quality of air transport infrastructure ....................4.5 ............76
2.06 Available airline seat Kms/week, millions*........107.0 ............78
2.07 Quality of electricity supply ...................................2.3 ..........125
2.08 Fixed telephone lines/100 pop.* ...........................2.2 ..........116
2.09 Mobile telephone subscriptions/100 pop.* .........55.1 ..........113
3rd pillar: Macroeconomic environment3.01 Government budget balance, % GDP* ................-4.6 ............82
3.02 National savings rate, % GDP* ...........................22.7 ............52
3.03 Inflation, annual % change* .................................-1.1 ..............5
3.04 Interest rate spread, %*......................................11.0 ..........117
3.05 Government debt, % GDP* ................................32.1 ............55
3.06 Country credit rating, 0–100 (worst)*..................33.5 ............96
4th pillar: Health and primary education4.01 Business impact of malaria....................................3.5 ..........122
4.02 Malaria incidence/100,000 pop.*..................12,063.3 ..........117
4.03 Business impact of tuberculosis............................4.5 ..........109
4.04 Tuberculosis incidence/100,000 pop.* ..............276.9 ..........116
4.05 Business impact of HIV/AIDS................................4.8 ............92
4.06 HIV prevalence, % adult pop.*..............................1.0 ..........104
4.07 Infant mortality, deaths/1,000 live births* ...........56.9 ..........113
4.08 Life expectancy, years*.......................................55.6 ..........120
4.09 Quality of primary education..................................3.4 ............83
4.10 Primary education enrollment, net %*................72.9 ..........127
5th pillar: Higher education and training5.01 Secondary education enrollment, gross %* .......30.6 ..........126
5.02 Tertiary education enrollment, gross %* ..............8.0 ..........112
5.03 Quality of the educational system.........................3.6 ............73
5.04 Quality of math and science education .................3.9 ............72
5.05 Quality of management schools............................4.6 ............40
5.06 Internet access in schools .....................................4.2 ............60
5.07 Availability of research and training services.........4.5 ............45
5.08 Extent of staff training ...........................................3.3 ..........113
INDICATOR SCORE RANK/139
6th pillar: Goods market efficiency6.01 Intensity of local competition ................................5.1 ............49
6.02 Extent of market dominance .................................3.9 ............53
6.03 Effectiveness of anti-monopoly policy...................4.0 ............70
6.04 Extent and effect of taxation .................................3.1 ..........101
6.05 Total tax rate, % profits*.....................................46.0 ............88
6.06 No. procedures to start a business* .....................4.0 ............14
6.07 No. days to start a business*................................8.0 ............27
6.08 Agricultural policy costs.........................................3.4 ..........118
6.09 Prevalence of trade barriers...................................4.5 ............73
6.10 Trade tariffs, % duty*............................................9.8 ............99
6.11 Prevalence of foreign ownership...........................4.9 ............57
6.12 Business impact of rules on FDI ...........................4.4 ............92
6.13 Burden of customs procedures.............................4.7 ............35
6.14 Degree of customer orientation ............................4.9 ............52
6.15 Buyer sophistication ..............................................2.3 ..........132
7th pillar: Labor market efficiency7.01 Cooperation in labor-employer relations................4.0 ............97
7.02 Flexibility of wage determination...........................4.6 ..........101
7.03 Rigidity of employment index, 0–100 (worst)*....59.0 ..........131
7.04 Hiring and firing practices......................................3.9 ............71
7.05 Redundancy costs, weeks of wages*.................38.0 ............74
7.06 Pay and productivity ..............................................3.5 ..........101
7.07 Reliance on professional management .................3.9 ............93
7.08 Brain drain..............................................................3.0 ............89
7.09 Females in labor force, ratio to males* .................0.7 ............92
8th pillar: Financial market development8.01 Availability of financial services .............................4.3 ............85
8.02 Affordability of financial services ...........................4.0 ............81
8.03 Financing through local equity market...................3.3 ............80
8.04 Ease of access to loans.........................................2.3 ............98
8.05 Venture capital availability......................................2.3 ............94
8.06 Restriction on capital flows ...................................3.7 ..........109
8.07 Soundness of banks ..............................................5.4 ............53
8.08 Regulation of securities exchanges.......................3.6 ..........107
8.09 Legal rights index, 0–10 (best)* ............................3.0 ..........103
9th pillar: Technological readiness9.01 Availability of latest technologies ..........................5.5 ............53
9.02 Firm-level technology absorption...........................5.3 ............40
9.03 FDI and technology transfer ..................................4.5 ............84
9.04 Internet users/100 pop.* .......................................7.4 ..........110
9.05 Broadband Internet subscriptions/100 pop.*.........0.5 ..........102
9.06 Internet bandwidth, Mb/s per 10,000 pop.*..........3.7 ............86
10th pillar: Market size10.01 Domestic market size index, 1–7 (best)* ..............2.7 ..........100
10.02 Foreign market size index, 1–7 (best)*..................3.1 ..........117
11th pillar: Business sophistication 11.01 Local supplier quantity...........................................4.7 ............76
11.02 Local supplier quality .............................................4.5 ............67
11.03 State of cluster development ................................2.8 ..........117
11.04 Nature of competitive advantage ..........................3.3 ............71
11.05 Value chain breadth ...............................................3.8 ............55
11.06 Control of international distribution .......................3.9 ............81
11.07 Production process sophistication.........................3.2 ............95
11.08 Extent of marketing ...............................................3.9 ............77
11.09 Willingness to delegate authority ..........................2.9 ..........117
12th pillar: Innovation12.01 Capacity for innovation ..........................................2.8 ............77
12.02 Quality of scientific research institutions ..............4.1 ............48
12.03 Company spending on R&D ..................................3.2 ............49
12.04 University-industry collaboration in R&D ...............3.9 ............51
12.05 Gov’t procurement of advanced tech products.....4.0 ............45
12.06 Availability of scientists and engineers..................4.2 ............61
12.07 Utility patents/million pop.* ...................................0.0 ............90
Senegal
Notes: An asterisk (*) indicates that data are from sources other than the World Economic Forum. For further details and explanation, please refer to the section“How to Read the Competitiveness Profiles” on page 115.
The Africa Competitiveness Report 2011 © 2011 World Economic Forum, the World Bank and the African Development Bank

South AfricaKey indicators, 2009
Population (millions).................................................50.1GDP (US$ billions)...................................................287.2GDP per capita (US$) ..........................................5,823.6GDP (PPP) as share (%) of world total .................0.70
Sectoral value-added (% GDP)Agriculture ................................................................3.0Industry....................................................................31.1Services...................................................................65.8
Human Development Index, 2010Score, (0–1) best....................................................0.60Rank (out of 169 economies) ................................110
Sources: UNFPA, IMF, EIU, World Bank, UNDP.
Global Competitiveness Index
GCI 2010–2011.........................................................54 ......4.3GCI 2009–2010 (out of 133)..................................................45 ........4.3GCI 2008–2009 (out of 134)..................................................45 ........4.4
Basic requirements.............................................................79 ........4.41st pillar: Institutions ...........................................................47 ........4.42nd pillar: Infrastructure.....................................................63 ........4.03rd pillar: Macroeconomic environment .........................43 ........5.04th pillar: Health and primary education .......................129 ........4.1
Efficiency enhancers..........................................................42 ........4.45th pillar: Higher education and training .........................75 ........4.06th pillar: Goods market efficiency...................................40 ........4.57th pillar: Labor market efficiency ....................................97 ........4.18th pillar: Financial market development...........................9 ........5.39th pillar: Technological readiness...................................76 ........3.510th pillar: Market size........................................................25 ........4.8
Innovation and sophistication factors ............................43 ........3.911th pillar: Business sophistication..................................38 ........4.412th pillar: Innovation..........................................................44 ........3.5
The most problematic factors for doing business
Inefficient government bureaucracy.........................18.5
Inadequately educated workforce.............................16.2
Crime and theft ..............................................................14.9
Restrictive labor regulations.......................................13.4
Corruption.........................................................................9.8
Inadequate supply of infrastructure ............................7.8
Poor work ethic in national labor force ......................4.4
Access to financing........................................................4.1
Policy instability...............................................................2.9
Poor public health ...........................................................2.5
Foreign currency regulations........................................2.1
Inflation .............................................................................1.3
Tax rates ...........................................................................1.2
Tax regulations ................................................................0.6
Government instability/coups .......................................0.2
180
Part 2:C
ompe
titiven
ess Profile
s
GDP (PPP) per capita (int'l $), 1980–2009
0 5 10 15 20 25 30
Percent of responses
Note: From a list of 15 factors, respondents were asked to select the five most problematic for doing business in their country and to rank them between 1 (most problematic) and 5. The bars in the figure show the responses weighted according to their rankings.
1 Transition1–2 2 Transition
2 –3
Factordriven
Efficiencydriven
Innovationdriven
3
Stage of development
0
3,000
6,000
9,000
12,000
1980 1982 1984 1986 1988 1990 1992 1994 1996 1998 2000 2002 2004 20082006
South Africa Sub-Saharan Africa
South Africa Efficiency-driven economies
Rank Score(out of 139) (1–7)
The Africa Competitiveness Report 2011 © 2011 World Economic Forum, the World Bank and the African Development Bank
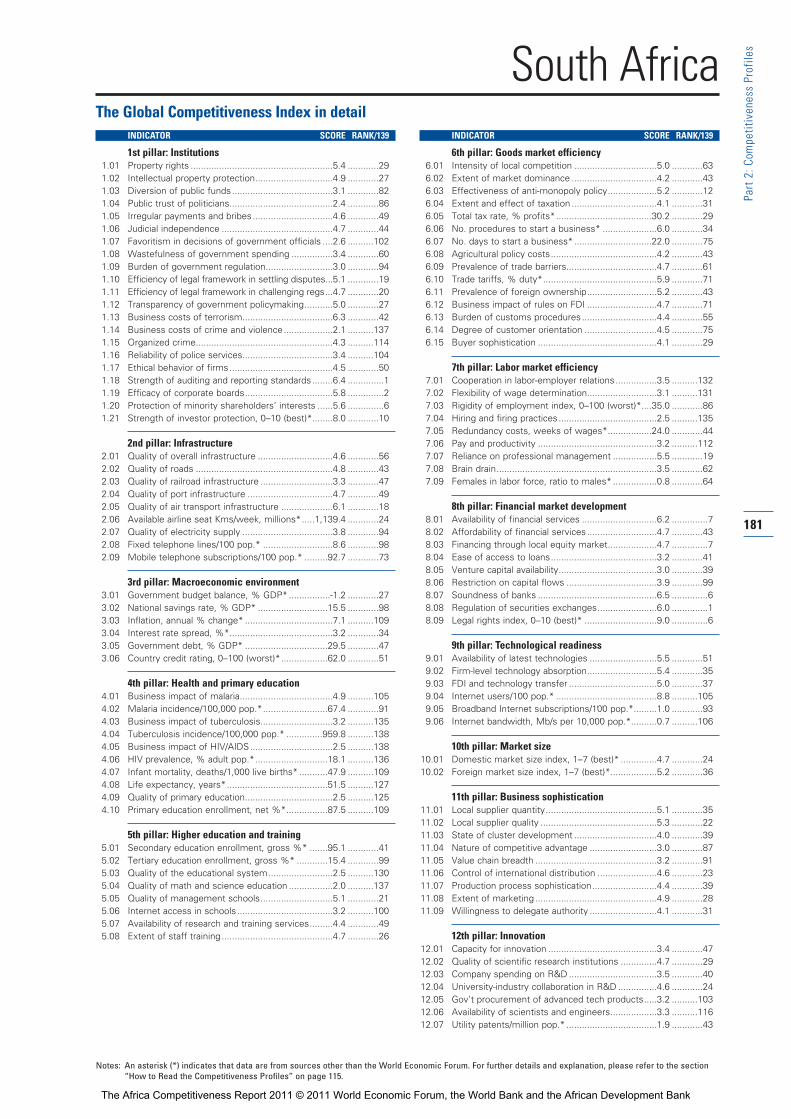
181
Part 2:C
ompe
titiven
ess Profile
s
The Global Competitiveness Index in detailINDICATOR SCORE RANK/139
1st pillar: Institutions1.01 Property rights .......................................................5.4 ............29
1.02 Intellectual property protection..............................4.9 ............27
1.03 Diversion of public funds.......................................3.1 ............82
1.04 Public trust of politicians........................................2.4 ............86
1.05 Irregular payments and bribes...............................4.6 ............49
1.06 Judicial independence ...........................................4.7 ............44
1.07 Favoritism in decisions of government officials ....2.6 ..........102
1.08 Wastefulness of government spending ................3.4 ............60
1.09 Burden of government regulation..........................3.0 ............94
1.10 Efficiency of legal framework in settling disputes...5.1 ............19
1.11 Efficiency of legal framework in challenging regs...4.7 ............20
1.12 Transparency of government policymaking...........5.0 ............27
1.13 Business costs of terrorism...................................6.3 ............42
1.14 Business costs of crime and violence...................2.1 ..........137
1.15 Organized crime.....................................................4.3 ..........114
1.16 Reliability of police services...................................3.4 ..........104
1.17 Ethical behavior of firms........................................4.5 ............50
1.18 Strength of auditing and reporting standards........6.4 ..............1
1.19 Efficacy of corporate boards..................................5.8 ..............2
1.20 Protection of minority shareholders’ interests ......5.6 ..............6
1.21 Strength of investor protection, 0–10 (best)*........8.0 ............10
2nd pillar: Infrastructure2.01 Quality of overall infrastructure .............................4.6 ............56
2.02 Quality of roads .....................................................4.8 ............43
2.03 Quality of railroad infrastructure ............................3.3 ............47
2.04 Quality of port infrastructure .................................4.7 ............49
2.05 Quality of air transport infrastructure ....................6.1 ............18
2.06 Available airline seat Kms/week, millions*.....1,139.4 ............24
2.07 Quality of electricity supply ...................................3.8 ............94
2.08 Fixed telephone lines/100 pop.* ...........................8.6 ............98
2.09 Mobile telephone subscriptions/100 pop.* .........92.7 ............73
3rd pillar: Macroeconomic environment3.01 Government budget balance, % GDP* ................-1.2 ............27
3.02 National savings rate, % GDP* ...........................15.5 ............98
3.03 Inflation, annual % change* ..................................7.1 ..........109
3.04 Interest rate spread, %*........................................3.2 ............34
3.05 Government debt, % GDP* ................................29.5 ............47
3.06 Country credit rating, 0–100 (worst)*..................62.0 ............51
4th pillar: Health and primary education4.01 Business impact of malaria....................................4.9 ..........105
4.02 Malaria incidence/100,000 pop.*.........................67.4 ............91
4.03 Business impact of tuberculosis............................3.2 ..........135
4.04 Tuberculosis incidence/100,000 pop.* ..............959.8 ..........138
4.05 Business impact of HIV/AIDS................................2.5 ..........138
4.06 HIV prevalence, % adult pop.*............................18.1 ..........136
4.07 Infant mortality, deaths/1,000 live births* ...........47.9 ..........109
4.08 Life expectancy, years*.......................................51.5 ..........127
4.09 Quality of primary education..................................2.5 ..........125
4.10 Primary education enrollment, net %*................87.5 ..........109
5th pillar: Higher education and training5.01 Secondary education enrollment, gross %* .......95.1 ............41
5.02 Tertiary education enrollment, gross %* ............15.4 ............99
5.03 Quality of the educational system.........................2.5 ..........130
5.04 Quality of math and science education .................2.0 ..........137
5.05 Quality of management schools............................5.1 ............21
5.06 Internet access in schools .....................................3.2 ..........100
5.07 Availability of research and training services.........4.4 ............49
5.08 Extent of staff training ...........................................4.7 ............26
INDICATOR SCORE RANK/139
6th pillar: Goods market efficiency6.01 Intensity of local competition ................................5.0 ............63
6.02 Extent of market dominance .................................4.2 ............43
6.03 Effectiveness of anti-monopoly policy...................5.2 ............12
6.04 Extent and effect of taxation .................................4.1 ............31
6.05 Total tax rate, % profits*.....................................30.2 ............29
6.06 No. procedures to start a business* .....................6.0 ............34
6.07 No. days to start a business*..............................22.0 ............75
6.08 Agricultural policy costs.........................................4.2 ............43
6.09 Prevalence of trade barriers...................................4.7 ............61
6.10 Trade tariffs, % duty*............................................5.9 ............71
6.11 Prevalence of foreign ownership...........................5.2 ............43
6.12 Business impact of rules on FDI ...........................4.7 ............71
6.13 Burden of customs procedures.............................4.4 ............55
6.14 Degree of customer orientation ............................4.5 ............75
6.15 Buyer sophistication ..............................................4.1 ............29
7th pillar: Labor market efficiency7.01 Cooperation in labor-employer relations................3.5 ..........132
7.02 Flexibility of wage determination...........................3.1 ..........131
7.03 Rigidity of employment index, 0–100 (worst)*....35.0 ............86
7.04 Hiring and firing practices......................................2.5 ..........135
7.05 Redundancy costs, weeks of wages*.................24.0 ............44
7.06 Pay and productivity ..............................................3.2 ..........112
7.07 Reliance on professional management .................5.5 ............19
7.08 Brain drain..............................................................3.5 ............62
7.09 Females in labor force, ratio to males* .................0.8 ............64
8th pillar: Financial market development8.01 Availability of financial services .............................6.2 ..............7
8.02 Affordability of financial services ...........................4.7 ............43
8.03 Financing through local equity market...................4.7 ..............7
8.04 Ease of access to loans.........................................3.2 ............41
8.05 Venture capital availability......................................3.0 ............39
8.06 Restriction on capital flows ...................................3.9 ............99
8.07 Soundness of banks ..............................................6.5 ..............6
8.08 Regulation of securities exchanges.......................6.0 ..............1
8.09 Legal rights index, 0–10 (best)* ............................9.0 ..............6
9th pillar: Technological readiness9.01 Availability of latest technologies ..........................5.5 ............51
9.02 Firm-level technology absorption...........................5.4 ............35
9.03 FDI and technology transfer ..................................5.0 ............37
9.04 Internet users/100 pop.* .......................................8.8 ..........105
9.05 Broadband Internet subscriptions/100 pop.*.........1.0 ............93
9.06 Internet bandwidth, Mb/s per 10,000 pop.*..........0.7 ..........106
10th pillar: Market size10.01 Domestic market size index, 1–7 (best)* ..............4.7 ............24
10.02 Foreign market size index, 1–7 (best)*..................5.2 ............36
11th pillar: Business sophistication 11.01 Local supplier quantity...........................................5.1 ............35
11.02 Local supplier quality .............................................5.3 ............22
11.03 State of cluster development ................................4.0 ............39
11.04 Nature of competitive advantage ..........................3.0 ............87
11.05 Value chain breadth ...............................................3.2 ............91
11.06 Control of international distribution .......................4.6 ............23
11.07 Production process sophistication.........................4.4 ............39
11.08 Extent of marketing ...............................................4.9 ............28
11.09 Willingness to delegate authority ..........................4.1 ............31
12th pillar: Innovation12.01 Capacity for innovation ..........................................3.4 ............47
12.02 Quality of scientific research institutions ..............4.7 ............29
12.03 Company spending on R&D ..................................3.5 ............40
12.04 University-industry collaboration in R&D ...............4.6 ............24
12.05 Gov’t procurement of advanced tech products.....3.2 ..........103
12.06 Availability of scientists and engineers..................3.3 ..........116
12.07 Utility patents/million pop.* ...................................1.9 ............43
South Africa
Notes: An asterisk (*) indicates that data are from sources other than the World Economic Forum. For further details and explanation, please refer to the section“How to Read the Competitiveness Profiles” on page 115.
The Africa Competitiveness Report 2011 © 2011 World Economic Forum, the World Bank and the African Development Bank
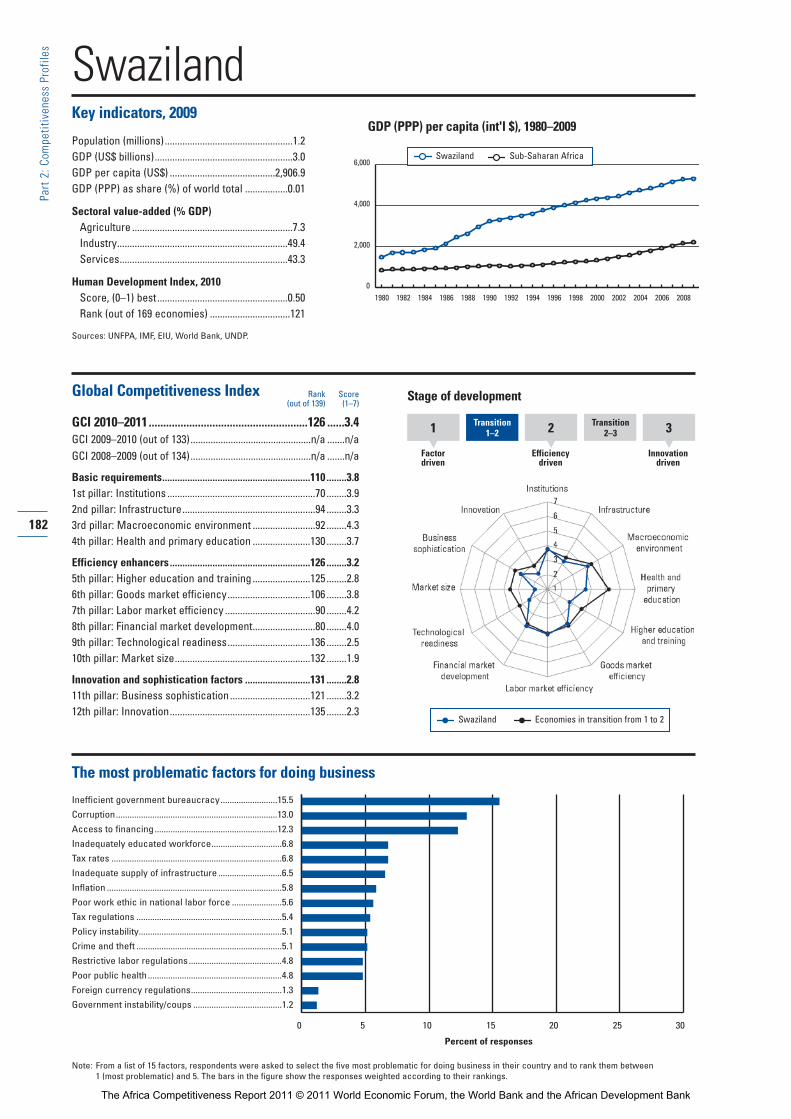
SwazilandKey indicators, 2009
Population (millions)...................................................1.2GDP (US$ billions).......................................................3.0GDP per capita (US$) ..........................................2,906.9GDP (PPP) as share (%) of world total .................0.01
Sectoral value-added (% GDP)Agriculture ................................................................7.3Industry....................................................................49.4Services...................................................................43.3
Human Development Index, 2010Score, (0–1) best....................................................0.50Rank (out of 169 economies) ................................121
Sources: UNFPA, IMF, EIU, World Bank, UNDP.
Global Competitiveness Index
GCI 2010–2011.......................................................126 ......3.4GCI 2009–2010 (out of 133)................................................n/a .......n/aGCI 2008–2009 (out of 134)................................................n/a .......n/a
Basic requirements...........................................................110 ........3.81st pillar: Institutions ...........................................................70 ........3.92nd pillar: Infrastructure.....................................................94 ........3.33rd pillar: Macroeconomic environment .........................92 ........4.34th pillar: Health and primary education .......................130 ........3.7
Efficiency enhancers........................................................126 ........3.25th pillar: Higher education and training .......................125 ........2.86th pillar: Goods market efficiency.................................106 ........3.87th pillar: Labor market efficiency ....................................90 ........4.28th pillar: Financial market development.........................80 ........4.09th pillar: Technological readiness.................................136 ........2.510th pillar: Market size......................................................132 ........1.9
Innovation and sophistication factors ..........................131 ........2.811th pillar: Business sophistication................................121 ........3.212th pillar: Innovation........................................................135 ........2.3
The most problematic factors for doing business
Inefficient government bureaucracy.........................15.5
Corruption.......................................................................13.0
Access to financing......................................................12.3
Inadequately educated workforce...............................6.8
Tax rates ...........................................................................6.8
Inadequate supply of infrastructure ............................6.5
Inflation .............................................................................5.8
Poor work ethic in national labor force ......................5.6
Tax regulations ................................................................5.4
Policy instability...............................................................5.1
Crime and theft ................................................................5.1
Restrictive labor regulations.........................................4.8
Poor public health ...........................................................4.8
Foreign currency regulations........................................1.3
Government instability/coups .......................................1.2
182
Part 2:C
ompe
titiven
ess Profile
s
GDP (PPP) per capita (int'l $), 1980–2009
0 5 10 15 20 25 30
Percent of responses
Note: From a list of 15 factors, respondents were asked to select the five most problematic for doing business in their country and to rank them between 1 (most problematic) and 5. The bars in the figure show the responses weighted according to their rankings.
1 Transition1–2 2 Transition
2 –3
Factordriven
Efficiencydriven
Innovationdriven
3
Stage of development
Swaziland Economies in transition from 1 to 2
0
2,000
4,000
6,000
1980 1982 1984 1986 1988 1990 1992 1994 1996 1998 2000 2002 2004 20082006
Swaziland Sub-Saharan Africa
Rank Score(out of 139) (1–7)
The Africa Competitiveness Report 2011 © 2011 World Economic Forum, the World Bank and the African Development Bank
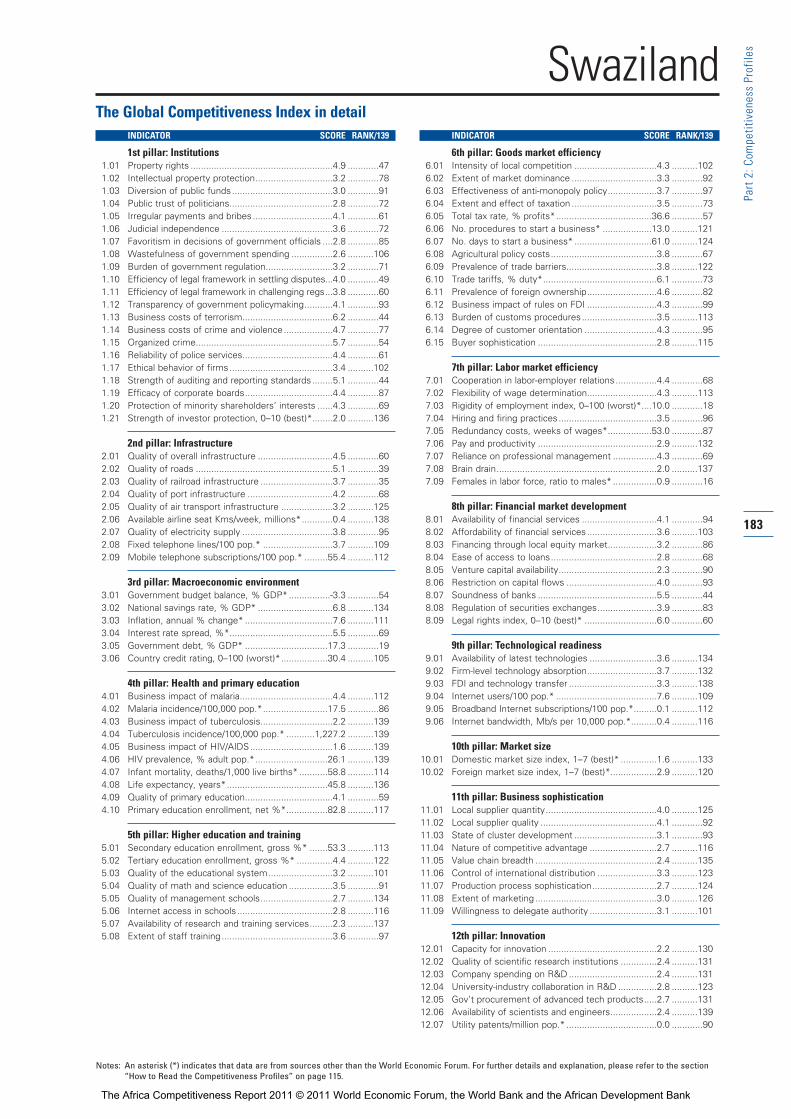
183
Part 2:C
ompe
titiven
ess Profile
s
The Global Competitiveness Index in detailINDICATOR SCORE RANK/139
1st pillar: Institutions1.01 Property rights .......................................................4.9 ............47
1.02 Intellectual property protection..............................3.2 ............78
1.03 Diversion of public funds.......................................3.0 ............91
1.04 Public trust of politicians........................................2.8 ............72
1.05 Irregular payments and bribes...............................4.1 ............61
1.06 Judicial independence ...........................................3.6 ............72
1.07 Favoritism in decisions of government officials ....2.8 ............85
1.08 Wastefulness of government spending ................2.6 ..........106
1.09 Burden of government regulation..........................3.2 ............71
1.10 Efficiency of legal framework in settling disputes...4.0 ............49
1.11 Efficiency of legal framework in challenging regs...3.8 ............60
1.12 Transparency of government policymaking...........4.1 ............93
1.13 Business costs of terrorism...................................6.2 ............44
1.14 Business costs of crime and violence...................4.7 ............77
1.15 Organized crime.....................................................5.7 ............54
1.16 Reliability of police services...................................4.4 ............61
1.17 Ethical behavior of firms........................................3.4 ..........102
1.18 Strength of auditing and reporting standards........5.1 ............44
1.19 Efficacy of corporate boards..................................4.4 ............87
1.20 Protection of minority shareholders’ interests ......4.3 ............69
1.21 Strength of investor protection, 0–10 (best)*........2.0 ..........136
2nd pillar: Infrastructure2.01 Quality of overall infrastructure .............................4.5 ............60
2.02 Quality of roads .....................................................5.1 ............39
2.03 Quality of railroad infrastructure ............................3.7 ............35
2.04 Quality of port infrastructure .................................4.2 ............68
2.05 Quality of air transport infrastructure ....................3.2 ..........125
2.06 Available airline seat Kms/week, millions*............0.4 ..........138
2.07 Quality of electricity supply ...................................3.8 ............95
2.08 Fixed telephone lines/100 pop.* ...........................3.7 ..........109
2.09 Mobile telephone subscriptions/100 pop.* .........55.4 ..........112
3rd pillar: Macroeconomic environment3.01 Government budget balance, % GDP* ................-3.3 ............54
3.02 National savings rate, % GDP* .............................6.8 ..........134
3.03 Inflation, annual % change* ..................................7.6 ..........111
3.04 Interest rate spread, %*........................................5.5 ............69
3.05 Government debt, % GDP* ................................17.3 ............19
3.06 Country credit rating, 0–100 (worst)*..................30.4 ..........105
4th pillar: Health and primary education4.01 Business impact of malaria....................................4.4 ..........112
4.02 Malaria incidence/100,000 pop.*.........................17.5 ............86
4.03 Business impact of tuberculosis............................2.2 ..........139
4.04 Tuberculosis incidence/100,000 pop.* ...........1,227.2 ..........139
4.05 Business impact of HIV/AIDS................................1.6 ..........139
4.06 HIV prevalence, % adult pop.*............................26.1 ..........139
4.07 Infant mortality, deaths/1,000 live births* ...........58.8 ..........114
4.08 Life expectancy, years*.......................................45.8 ..........136
4.09 Quality of primary education..................................4.1 ............59
4.10 Primary education enrollment, net %*................82.8 ..........117
5th pillar: Higher education and training5.01 Secondary education enrollment, gross %* .......53.3 ..........113
5.02 Tertiary education enrollment, gross %* ..............4.4 ..........122
5.03 Quality of the educational system.........................3.2 ..........101
5.04 Quality of math and science education .................3.5 ............91
5.05 Quality of management schools............................2.7 ..........134
5.06 Internet access in schools .....................................2.8 ..........116
5.07 Availability of research and training services.........2.3 ..........137
5.08 Extent of staff training ...........................................3.6 ............97
INDICATOR SCORE RANK/139
6th pillar: Goods market efficiency6.01 Intensity of local competition ................................4.3 ..........102
6.02 Extent of market dominance .................................3.3 ............92
6.03 Effectiveness of anti-monopoly policy...................3.7 ............97
6.04 Extent and effect of taxation .................................3.5 ............73
6.05 Total tax rate, % profits*.....................................36.6 ............57
6.06 No. procedures to start a business* ...................13.0 ..........121
6.07 No. days to start a business*..............................61.0 ..........124
6.08 Agricultural policy costs.........................................3.8 ............67
6.09 Prevalence of trade barriers...................................3.8 ..........122
6.10 Trade tariffs, % duty*............................................6.1 ............73
6.11 Prevalence of foreign ownership...........................4.6 ............82
6.12 Business impact of rules on FDI ...........................4.3 ............99
6.13 Burden of customs procedures.............................3.5 ..........113
6.14 Degree of customer orientation ............................4.3 ............95
6.15 Buyer sophistication ..............................................2.8 ..........115
7th pillar: Labor market efficiency7.01 Cooperation in labor-employer relations................4.4 ............68
7.02 Flexibility of wage determination...........................4.3 ..........113
7.03 Rigidity of employment index, 0–100 (worst)*....10.0 ............18
7.04 Hiring and firing practices......................................3.5 ............96
7.05 Redundancy costs, weeks of wages*.................53.0 ............87
7.06 Pay and productivity ..............................................2.9 ..........132
7.07 Reliance on professional management .................4.3 ............69
7.08 Brain drain..............................................................2.0 ..........137
7.09 Females in labor force, ratio to males* .................0.9 ............16
8th pillar: Financial market development8.01 Availability of financial services .............................4.1 ............94
8.02 Affordability of financial services ...........................3.6 ..........103
8.03 Financing through local equity market...................3.2 ............86
8.04 Ease of access to loans.........................................2.8 ............68
8.05 Venture capital availability......................................2.3 ............90
8.06 Restriction on capital flows ...................................4.0 ............93
8.07 Soundness of banks ..............................................5.5 ............44
8.08 Regulation of securities exchanges.......................3.9 ............83
8.09 Legal rights index, 0–10 (best)* ............................6.0 ............60
9th pillar: Technological readiness9.01 Availability of latest technologies ..........................3.6 ..........134
9.02 Firm-level technology absorption...........................3.7 ..........132
9.03 FDI and technology transfer ..................................3.3 ..........138
9.04 Internet users/100 pop.* .......................................7.6 ..........109
9.05 Broadband Internet subscriptions/100 pop.*.........0.1 ..........112
9.06 Internet bandwidth, Mb/s per 10,000 pop.*..........0.4 ..........116
10th pillar: Market size10.01 Domestic market size index, 1–7 (best)* ..............1.6 ..........133
10.02 Foreign market size index, 1–7 (best)*..................2.9 ..........120
11th pillar: Business sophistication 11.01 Local supplier quantity...........................................4.0 ..........125
11.02 Local supplier quality .............................................4.1 ............92
11.03 State of cluster development ................................3.1 ............93
11.04 Nature of competitive advantage ..........................2.7 ..........116
11.05 Value chain breadth ...............................................2.4 ..........135
11.06 Control of international distribution .......................3.3 ..........123
11.07 Production process sophistication.........................2.7 ..........124
11.08 Extent of marketing ...............................................3.0 ..........126
11.09 Willingness to delegate authority ..........................3.1 ..........101
12th pillar: Innovation12.01 Capacity for innovation ..........................................2.2 ..........130
12.02 Quality of scientific research institutions ..............2.4 ..........131
12.03 Company spending on R&D ..................................2.4 ..........131
12.04 University-industry collaboration in R&D ...............2.8 ..........123
12.05 Gov’t procurement of advanced tech products.....2.7 ..........131
12.06 Availability of scientists and engineers..................2.4 ..........139
12.07 Utility patents/million pop.* ...................................0.0 ............90
Swaziland
Notes: An asterisk (*) indicates that data are from sources other than the World Economic Forum. For further details and explanation, please refer to the section“How to Read the Competitiveness Profiles” on page 115.
The Africa Competitiveness Report 2011 © 2011 World Economic Forum, the World Bank and the African Development Bank

TanzaniaKey indicators, 2009
Population (millions).................................................43.7GDP (US$ billions).....................................................22.3GDP per capita (US$) .............................................550.5GDP (PPP) as share (%) of world total .................0.08
Sectoral value-added (% GDP)Agriculture ..............................................................45.3Industry....................................................................17.4Services...................................................................37.3
Human Development Index, 2010Score, (0–1) best....................................................0.40Rank (out of 169 economies) ................................148
Sources: UNFPA, IMF, EIU, World Bank, UNDP.
Global Competitiveness Index
GCI 2010–2011.......................................................113 ......3.6GCI 2009–2010 (out of 133)................................................100 ........3.6GCI 2008–2009 (out of 134)................................................113 ........3.5
Basic requirements...........................................................116 ........3.71st pillar: Institutions ...........................................................83 ........3.72nd pillar: Infrastructure...................................................128 ........2.43rd pillar: Macroeconomic environment .......................115 ........3.94th pillar: Health and primary education .......................113 ........4.7
Efficiency enhancers........................................................114 ........3.45th pillar: Higher education and training .......................133 ........2.56th pillar: Goods market efficiency.................................108 ........3.87th pillar: Labor market efficiency ....................................77 ........4.38th pillar: Financial market development.........................90 ........4.09th pillar: Technological readiness.................................131 ........2.610th pillar: Market size........................................................81 ........3.4
Innovation and sophistication factors ............................94 ........3.211th pillar: Business sophistication..................................98 ........3.512th pillar: Innovation..........................................................86 ........2.9
The most problematic factors for doing business
Corruption.......................................................................17.4
Access to financing......................................................15.1
Inadequate supply of infrastructure ..........................13.3
Tax rates ...........................................................................9.0
Tax regulations ................................................................7.9
Crime and theft ................................................................6.3
Inefficient government bureaucracy...........................6.2
Inflation .............................................................................6.0
Poor work ethic in national labor force ......................4.0
Inadequately educated workforce...............................3.9
Restrictive labor regulations.........................................3.6
Foreign currency regulations........................................3.2
Poor public health ...........................................................2.6
Policy instability...............................................................1.2
Government instability/coups .......................................0.2
Rank Score(out of 139) (1–7)
184
Part 2:C
ompe
titiven
ess Profile
s
GDP (PPP) per capita (int'l $), 1980–2009
0 5 10 15 20 25 30
Percent of responses
Note: From a list of 15 factors, respondents were asked to select the five most problematic for doing business in their country and to rank them between 1 (most problematic) and 5. The bars in the figure show the responses weighted according to their rankings.
1 Transition1–2 2 Transition
2 –3
Factordriven
Efficiencydriven
Innovationdriven
3
Stage of development
Tanzania Factor-driven economies
0
1,000
2,000
3,000
1980 1982 1984 1986 1988 1990 1992 1994 1996 1998 2000 2002 2004 20082006
Tanzania Sub-Saharan Africa
The Africa Competitiveness Report 2011 © 2011 World Economic Forum, the World Bank and the African Development Bank

185
Part 2:C
ompe
titiven
ess Profile
s
The Global Competitiveness Index in detailINDICATOR SCORE RANK/139
1st pillar: Institutions1.01 Property rights .......................................................3.7 ..........104
1.02 Intellectual property protection..............................3.3 ............74
1.03 Diversion of public funds.......................................3.1 ............85
1.04 Public trust of politicians........................................3.1 ............62
1.05 Irregular payments and bribes...............................3.1 ..........112
1.06 Judicial independence ...........................................3.5 ............77
1.07 Favoritism in decisions of government officials ....3.4 ............50
1.08 Wastefulness of government spending ................3.3 ............63
1.09 Burden of government regulation..........................3.3 ............66
1.10 Efficiency of legal framework in settling disputes...3.7 ............65
1.11 Efficiency of legal framework in challenging regs...3.5 ............72
1.12 Transparency of government policymaking...........4.1 ............85
1.13 Business costs of terrorism...................................5.4 ............85
1.14 Business costs of crime and violence...................4.7 ............76
1.15 Organized crime.....................................................5.3 ............69
1.16 Reliability of police services...................................3.8 ............84
1.17 Ethical behavior of firms........................................3.6 ............89
1.18 Strength of auditing and reporting standards........4.3 ............94
1.19 Efficacy of corporate boards..................................4.2 ..........100
1.20 Protection of minority shareholders’ interests ......4.0 ............91
1.21 Strength of investor protection, 0–10 (best)*........5.0 ............77
2nd pillar: Infrastructure2.01 Quality of overall infrastructure .............................3.0 ..........124
2.02 Quality of roads .....................................................2.9 ..........104
2.03 Quality of railroad infrastructure ............................2.4 ............72
2.04 Quality of port infrastructure .................................3.0 ..........119
2.05 Quality of air transport infrastructure ....................3.4 ..........118
2.06 Available airline seat Kms/week, millions*..........56.9 ............93
2.07 Quality of electricity supply ...................................2.5 ..........122
2.08 Fixed telephone lines/100 pop.* ...........................0.4 ..........133
2.09 Mobile telephone subscriptions/100 pop.* .........39.9 ..........120
3rd pillar: Macroeconomic environment3.01 Government budget balance, % GDP* ................-4.7 ............83
3.02 National savings rate, % GDP* ...........................10.5 ..........121
3.03 Inflation, annual % change* ................................12.1 ..........128
3.04 Interest rate spread, %*........................................7.1 ............90
3.05 Government debt, % GDP* ................................21.4 ............28
3.06 Country credit rating, 0–100 (worst)*..................29.5 ..........106
4th pillar: Health and primary education4.01 Business impact of malaria....................................3.0 ..........131
4.02 Malaria incidence/100,000 pop.*..................29,245.4 ..........125
4.03 Business impact of tuberculosis............................3.6 ..........129
4.04 Tuberculosis incidence/100,000 pop.* ..............189.8 ..........106
4.05 Business impact of HIV/AIDS................................3.4 ..........125
4.06 HIV prevalence, % adult pop.*..............................6.2 ..........129
4.07 Infant mortality, deaths/1,000 live births* ...........66.8 ..........118
4.08 Life expectancy, years*.......................................55.6 ..........119
4.09 Quality of primary education..................................2.7 ..........115
4.10 Primary education enrollment, net %*................99.3 ............13
5th pillar: Higher education and training5.01 Secondary education enrollment, gross %* .......26.1 ..........131
5.02 Tertiary education enrollment, gross %* ..............1.5 ..........136
5.03 Quality of the educational system.........................3.2 ............99
5.04 Quality of math and science education .................2.7 ..........127
5.05 Quality of management schools............................3.0 ..........128
5.06 Internet access in schools .....................................2.6 ..........123
5.07 Availability of research and training services.........3.4 ..........107
5.08 Extent of staff training ...........................................3.4 ..........106
INDICATOR SCORE RANK/139
6th pillar: Goods market efficiency6.01 Intensity of local competition ................................4.3 ..........104
6.02 Extent of market dominance .................................3.6 ............73
6.03 Effectiveness of anti-monopoly policy...................4.0 ............67
6.04 Extent and effect of taxation .................................3.6 ............65
6.05 Total tax rate, % profits*.....................................45.2 ............87
6.06 No. procedures to start a business* ...................12.0 ..........114
6.07 No. days to start a business*..............................29.0 ............91
6.08 Agricultural policy costs.........................................3.5 ..........110
6.09 Prevalence of trade barriers...................................4.2 ............97
6.10 Trade tariffs, % duty*............................................8.1 ............89
6.11 Prevalence of foreign ownership...........................4.5 ............95
6.12 Business impact of rules on FDI ...........................4.5 ............89
6.13 Burden of customs procedures.............................3.4 ..........116
6.14 Degree of customer orientation ............................4.3 ............94
6.15 Buyer sophistication ..............................................2.9 ..........112
7th pillar: Labor market efficiency7.01 Cooperation in labor-employer relations................4.0 ..........100
7.02 Flexibility of wage determination...........................4.1 ..........121
7.03 Rigidity of employment index, 0–100 (worst)*....54.0 ..........125
7.04 Hiring and firing practices......................................3.7 ............88
7.05 Redundancy costs, weeks of wages*.................18.0 ............38
7.06 Pay and productivity ..............................................3.0 ..........127
7.07 Reliance on professional management .................4.1 ............84
7.08 Brain drain..............................................................3.1 ............83
7.09 Females in labor force, ratio to males* .................1.0 ..............6
8th pillar: Financial market development8.01 Availability of financial services .............................3.6 ..........120
8.02 Affordability of financial services ...........................3.4 ..........115
8.03 Financing through local equity market...................3.4 ............75
8.04 Ease of access to loans.........................................2.8 ............64
8.05 Venture capital availability......................................2.6 ............64
8.06 Restriction on capital flows ...................................3.9 ............95
8.07 Soundness of banks ..............................................4.3 ..........119
8.08 Regulation of securities exchanges.......................3.8 ............93
8.09 Legal rights index, 0–10 (best)* ............................8.0 ............20
9th pillar: Technological readiness9.01 Availability of latest technologies ..........................3.8 ..........132
9.02 Firm-level technology absorption...........................4.0 ..........123
9.03 FDI and technology transfer ..................................4.3 ............95
9.04 Internet users/100 pop.* .......................................1.5 ..........133
9.05 Broadband Internet subscriptions/100 pop.*.........0.0 ..........133
9.06 Internet bandwidth, Mb/s per 10,000 pop.*..........0.0 ..........136
10th pillar: Market size10.01 Domestic market size index, 1–7 (best)* ..............3.2 ............78
10.02 Foreign market size index, 1–7 (best)*..................3.8 ............89
11th pillar: Business sophistication 11.01 Local supplier quantity...........................................4.2 ..........109
11.02 Local supplier quality .............................................3.8 ..........115
11.03 State of cluster development ................................3.5 ............68
11.04 Nature of competitive advantage ..........................3.0 ............93
11.05 Value chain breadth ...............................................3.0 ..........105
11.06 Control of international distribution .......................3.7 ............93
11.07 Production process sophistication.........................3.0 ..........111
11.08 Extent of marketing ...............................................3.4 ..........104
11.09 Willingness to delegate authority ..........................3.6 ............71
12th pillar: Innovation12.01 Capacity for innovation ..........................................2.8 ............78
12.02 Quality of scientific research institutions ..............3.3 ............87
12.03 Company spending on R&D ..................................3.0 ............71
12.04 University-industry collaboration in R&D ...............3.4 ............77
12.05 Gov’t procurement of advanced tech products.....3.6 ............74
12.06 Availability of scientists and engineers..................3.4 ..........113
12.07 Utility patents/million pop.* ...................................0.0 ............90
Tanzania
Notes: An asterisk (*) indicates that data are from sources other than the World Economic Forum. For further details and explanation, please refer to the section“How to Read the Competitiveness Profiles” on page 115.
The Africa Competitiveness Report 2011 © 2011 World Economic Forum, the World Bank and the African Development Bank
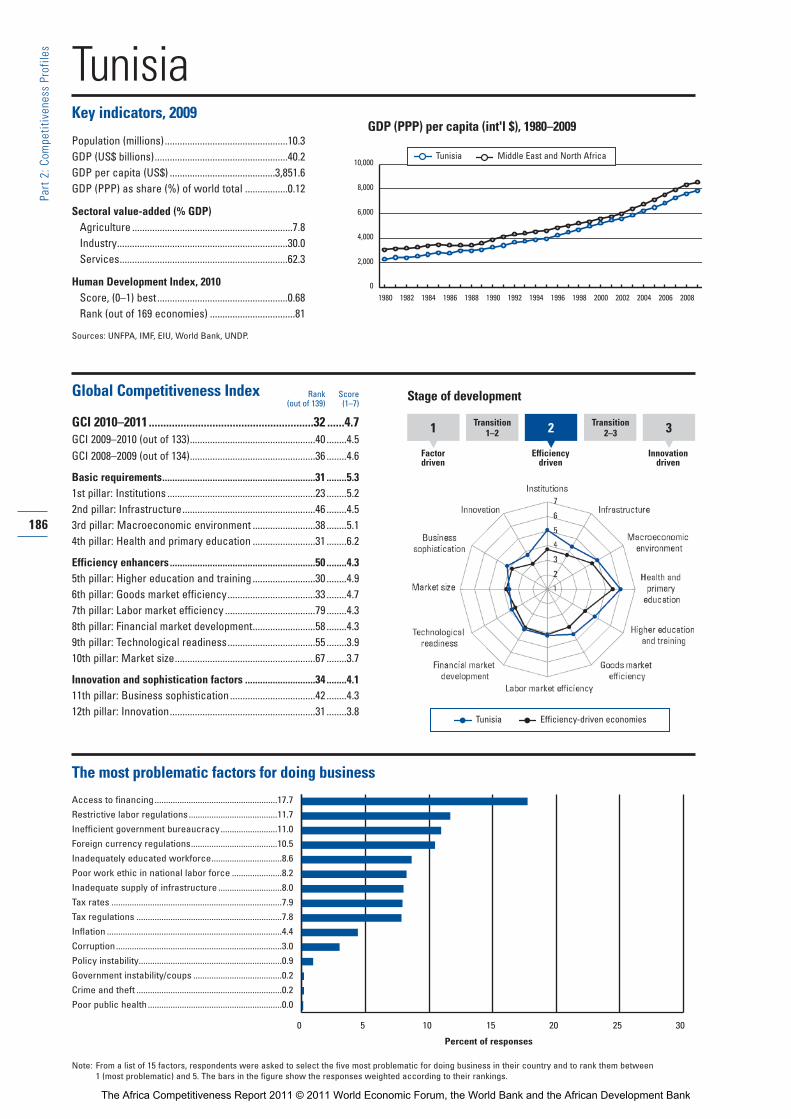
TunisiaKey indicators, 2009
Population (millions).................................................10.3GDP (US$ billions).....................................................40.2GDP per capita (US$) ..........................................3,851.6GDP (PPP) as share (%) of world total .................0.12
Sectoral value-added (% GDP)Agriculture ................................................................7.8Industry....................................................................30.0Services...................................................................62.3
Human Development Index, 2010Score, (0–1) best....................................................0.68Rank (out of 169 economies) ..................................81
Sources: UNFPA, IMF, EIU, World Bank, UNDP.
Global Competitiveness Index
GCI 2010–2011.........................................................32 ......4.7GCI 2009–2010 (out of 133)..................................................40 ........4.5GCI 2008–2009 (out of 134)..................................................36 ........4.6
Basic requirements.............................................................31 ........5.31st pillar: Institutions ...........................................................23 ........5.22nd pillar: Infrastructure.....................................................46 ........4.53rd pillar: Macroeconomic environment .........................38 ........5.14th pillar: Health and primary education .........................31 ........6.2
Efficiency enhancers..........................................................50 ........4.35th pillar: Higher education and training .........................30 ........4.96th pillar: Goods market efficiency...................................33 ........4.77th pillar: Labor market efficiency ....................................79 ........4.38th pillar: Financial market development.........................58 ........4.39th pillar: Technological readiness...................................55 ........3.910th pillar: Market size........................................................67 ........3.7
Innovation and sophistication factors ............................34 ........4.111th pillar: Business sophistication..................................42 ........4.312th pillar: Innovation..........................................................31 ........3.8
The most problematic factors for doing business
Access to financing......................................................17.7
Restrictive labor regulations.......................................11.7
Inefficient government bureaucracy.........................11.0
Foreign currency regulations......................................10.5
Inadequately educated workforce...............................8.6
Poor work ethic in national labor force ......................8.2
Inadequate supply of infrastructure ............................8.0
Tax rates ...........................................................................7.9
Tax regulations ................................................................7.8
Inflation .............................................................................4.4
Corruption.........................................................................3.0
Policy instability...............................................................0.9
Government instability/coups .......................................0.2
Crime and theft ................................................................0.2
Poor public health ...........................................................0.0
186
Part 2:C
ompe
titiven
ess Profile
s
GDP (PPP) per capita (int'l $), 1980–2009
0 5 10 15 20 25 30
Percent of responses
Note: From a list of 15 factors, respondents were asked to select the five most problematic for doing business in their country and to rank them between 1 (most problematic) and 5. The bars in the figure show the responses weighted according to their rankings.
1 Transition1–2 2 Transition
2 –3
Factordriven
Efficiencydriven
Innovationdriven
3
Stage of development
0
2,000
4,000
6,000
8,000
10,000
1980 1982 1984 1986 1988 1990 1992 1994 1996 1998 2000 2002 2004 20082006
Tunisia Middle East and North Africa
Tunisia Efficiency-driven economies
Rank Score(out of 139) (1–7)
The Africa Competitiveness Report 2011 © 2011 World Economic Forum, the World Bank and the African Development Bank
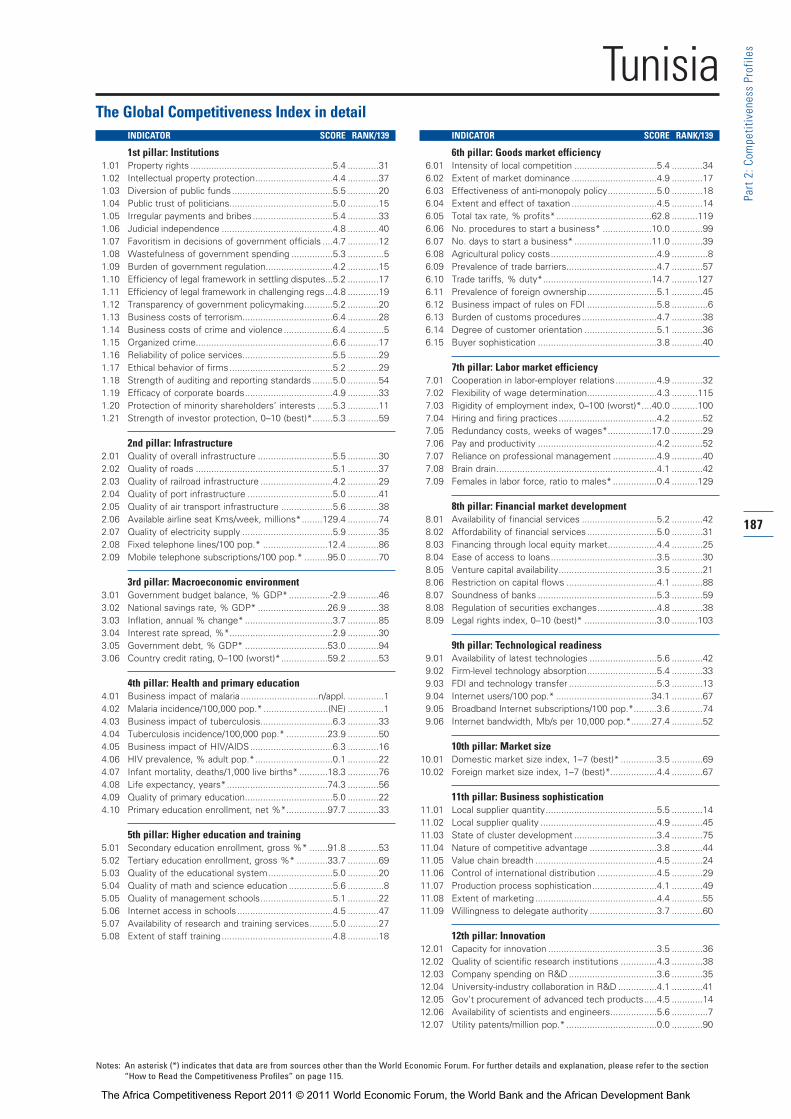
187
Part 2:C
ompe
titiven
ess Profile
s
The Global Competitiveness Index in detailINDICATOR SCORE RANK/139
1st pillar: Institutions1.01 Property rights .......................................................5.4 ............31
1.02 Intellectual property protection..............................4.4 ............37
1.03 Diversion of public funds.......................................5.5 ............20
1.04 Public trust of politicians........................................5.0 ............15
1.05 Irregular payments and bribes...............................5.4 ............33
1.06 Judicial independence ...........................................4.8 ............40
1.07 Favoritism in decisions of government officials ....4.7 ............12
1.08 Wastefulness of government spending ................5.3 ..............5
1.09 Burden of government regulation..........................4.2 ............15
1.10 Efficiency of legal framework in settling disputes...5.2 ............17
1.11 Efficiency of legal framework in challenging regs...4.8 ............19
1.12 Transparency of government policymaking...........5.2 ............20
1.13 Business costs of terrorism...................................6.4 ............28
1.14 Business costs of crime and violence...................6.4 ..............5
1.15 Organized crime.....................................................6.6 ............17
1.16 Reliability of police services...................................5.5 ............29
1.17 Ethical behavior of firms........................................5.2 ............29
1.18 Strength of auditing and reporting standards........5.0 ............54
1.19 Efficacy of corporate boards..................................4.9 ............33
1.20 Protection of minority shareholders’ interests ......5.3 ............11
1.21 Strength of investor protection, 0–10 (best)*........5.3 ............59
2nd pillar: Infrastructure2.01 Quality of overall infrastructure .............................5.5 ............30
2.02 Quality of roads .....................................................5.1 ............37
2.03 Quality of railroad infrastructure ............................4.2 ............29
2.04 Quality of port infrastructure .................................5.0 ............41
2.05 Quality of air transport infrastructure ....................5.6 ............38
2.06 Available airline seat Kms/week, millions*........129.4 ............74
2.07 Quality of electricity supply ...................................5.9 ............35
2.08 Fixed telephone lines/100 pop.* .........................12.4 ............86
2.09 Mobile telephone subscriptions/100 pop.* .........95.0 ............70
3rd pillar: Macroeconomic environment3.01 Government budget balance, % GDP* ................-2.9 ............46
3.02 National savings rate, % GDP* ...........................26.9 ............38
3.03 Inflation, annual % change* ..................................3.7 ............85
3.04 Interest rate spread, %*........................................2.9 ............30
3.05 Government debt, % GDP* ................................53.0 ............94
3.06 Country credit rating, 0–100 (worst)*..................59.2 ............53
4th pillar: Health and primary education4.01 Business impact of malaria ..............................n/appl. ..............1
4.02 Malaria incidence/100,000 pop.* .........................(NE) ..............1
4.03 Business impact of tuberculosis............................6.3 ............33
4.04 Tuberculosis incidence/100,000 pop.* ................23.9 ............50
4.05 Business impact of HIV/AIDS................................6.3 ............16
4.06 HIV prevalence, % adult pop.*..............................0.1 ............22
4.07 Infant mortality, deaths/1,000 live births* ...........18.3 ............76
4.08 Life expectancy, years*.......................................74.3 ............56
4.09 Quality of primary education..................................5.0 ............22
4.10 Primary education enrollment, net %*................97.7 ............33
5th pillar: Higher education and training5.01 Secondary education enrollment, gross %* .......91.8 ............53
5.02 Tertiary education enrollment, gross %* ............33.7 ............69
5.03 Quality of the educational system.........................5.0 ............20
5.04 Quality of math and science education .................5.6 ..............8
5.05 Quality of management schools............................5.1 ............22
5.06 Internet access in schools .....................................4.5 ............47
5.07 Availability of research and training services.........5.0 ............27
5.08 Extent of staff training ...........................................4.8 ............18
INDICATOR SCORE RANK/139
6th pillar: Goods market efficiency6.01 Intensity of local competition ................................5.4 ............34
6.02 Extent of market dominance .................................4.9 ............17
6.03 Effectiveness of anti-monopoly policy...................5.0 ............18
6.04 Extent and effect of taxation .................................4.5 ............14
6.05 Total tax rate, % profits*.....................................62.8 ..........119
6.06 No. procedures to start a business* ...................10.0 ............99
6.07 No. days to start a business*..............................11.0 ............39
6.08 Agricultural policy costs.........................................4.9 ..............8
6.09 Prevalence of trade barriers...................................4.7 ............57
6.10 Trade tariffs, % duty*..........................................14.7 ..........127
6.11 Prevalence of foreign ownership...........................5.1 ............45
6.12 Business impact of rules on FDI ...........................5.8 ..............6
6.13 Burden of customs procedures.............................4.7 ............38
6.14 Degree of customer orientation ............................5.1 ............36
6.15 Buyer sophistication ..............................................3.8 ............40
7th pillar: Labor market efficiency7.01 Cooperation in labor-employer relations................4.9 ............32
7.02 Flexibility of wage determination...........................4.3 ..........115
7.03 Rigidity of employment index, 0–100 (worst)*....40.0 ..........100
7.04 Hiring and firing practices......................................4.2 ............52
7.05 Redundancy costs, weeks of wages*.................17.0 ............29
7.06 Pay and productivity ..............................................4.2 ............52
7.07 Reliance on professional management .................4.9 ............40
7.08 Brain drain..............................................................4.1 ............42
7.09 Females in labor force, ratio to males* .................0.4 ..........129
8th pillar: Financial market development8.01 Availability of financial services .............................5.2 ............42
8.02 Affordability of financial services ...........................5.0 ............31
8.03 Financing through local equity market...................4.4 ............25
8.04 Ease of access to loans.........................................3.5 ............30
8.05 Venture capital availability......................................3.5 ............21
8.06 Restriction on capital flows ...................................4.1 ............88
8.07 Soundness of banks ..............................................5.3 ............59
8.08 Regulation of securities exchanges.......................4.8 ............38
8.09 Legal rights index, 0–10 (best)* ............................3.0 ..........103
9th pillar: Technological readiness9.01 Availability of latest technologies ..........................5.6 ............42
9.02 Firm-level technology absorption...........................5.4 ............33
9.03 FDI and technology transfer ..................................5.3 ............13
9.04 Internet users/100 pop.* .....................................34.1 ............67
9.05 Broadband Internet subscriptions/100 pop.*.........3.6 ............74
9.06 Internet bandwidth, Mb/s per 10,000 pop.*........27.4 ............52
10th pillar: Market size10.01 Domestic market size index, 1–7 (best)* ..............3.5 ............69
10.02 Foreign market size index, 1–7 (best)*..................4.4 ............67
11th pillar: Business sophistication 11.01 Local supplier quantity...........................................5.5 ............14
11.02 Local supplier quality .............................................4.9 ............45
11.03 State of cluster development ................................3.4 ............75
11.04 Nature of competitive advantage ..........................3.8 ............44
11.05 Value chain breadth ...............................................4.5 ............24
11.06 Control of international distribution .......................4.5 ............29
11.07 Production process sophistication.........................4.1 ............49
11.08 Extent of marketing ...............................................4.4 ............55
11.09 Willingness to delegate authority ..........................3.7 ............60
12th pillar: Innovation12.01 Capacity for innovation ..........................................3.5 ............36
12.02 Quality of scientific research institutions ..............4.3 ............38
12.03 Company spending on R&D ..................................3.6 ............35
12.04 University-industry collaboration in R&D ...............4.1 ............41
12.05 Gov’t procurement of advanced tech products.....4.5 ............14
12.06 Availability of scientists and engineers..................5.6 ..............7
12.07 Utility patents/million pop.* ...................................0.0 ............90
Tunisia
Notes: An asterisk (*) indicates that data are from sources other than the World Economic Forum. For further details and explanation, please refer to the section“How to Read the Competitiveness Profiles” on page 115.
The Africa Competitiveness Report 2011 © 2011 World Economic Forum, the World Bank and the African Development Bank

UgandaKey indicators, 2009
Population (millions).................................................32.7GDP (US$ billions).....................................................15.7GDP per capita (US$) .............................................474.0GDP (PPP) as share (%) of world total .................0.06
Sectoral value-added (% GDP)Agriculture ..............................................................37.7Industry....................................................................29.9Services...................................................................32.5
Human Development Index, 2010Score, (0–1) best....................................................0.42Rank (out of 169 economies) ................................143
Sources: UNFPA, IMF, EIU, World Bank, UNDP.
Global Competitiveness Index
GCI 2010–2011.......................................................118 ......3.5GCI 2009–2010 (out of 133)................................................108 ........3.5GCI 2008–2009 (out of 134)................................................128 ........3.3
Basic requirements...........................................................123 ........3.51st pillar: Institutions .........................................................104 ........3.42nd pillar: Infrastructure...................................................127 ........2.43rd pillar: Macroeconomic environment .......................114 ........3.94th pillar: Health and primary education .......................117 ........4.4
Efficiency enhancers........................................................102 ........3.65th pillar: Higher education and training .......................127 ........2.86th pillar: Goods market efficiency.................................117 ........3.77th pillar: Labor market efficiency ....................................27 ........4.88th pillar: Financial market development.........................72 ........4.19th pillar: Technological readiness.................................112 ........2.910th pillar: Market size........................................................92 ........3.1
Innovation and sophistication factors ..........................111 ........3.011th pillar: Business sophistication................................120 ........3.212th pillar: Innovation........................................................104 ........2.8
The most problematic factors for doing business
Corruption.......................................................................21.9
Access to financing......................................................15.3
Inadequate supply of infrastructure ..........................13.0
Tax rates ...........................................................................8.9
Poor work ethic in national labor force ......................7.1
Inefficient government bureaucracy...........................6.7
Inflation .............................................................................6.3
Inadequately educated workforce...............................5.0
Tax regulations ................................................................4.4
Crime and theft ................................................................3.1
Poor public health ...........................................................2.7
Policy instability...............................................................2.4
Foreign currency regulations........................................2.0
Restrictive labor regulations.........................................0.8
Government instability/coups .......................................0.5
Rank Score(out of 139) (1–7)
188
Part 2:C
ompe
titiven
ess Profile
s
GDP (PPP) per capita (int'l $), 1980–2009
0 5 10 15 20 25 30
Percent of responses
Note: From a list of 15 factors, respondents were asked to select the five most problematic for doing business in their country and to rank them between 1 (most problematic) and 5. The bars in the figure show the responses weighted according to their rankings.
1 Transition1–2 2 Transition
2 –3
Factordriven
Efficiencydriven
Innovationdriven
3
Stage of development
Uganda Factor-driven economies
0
1,000
2,000
3,000
1980 1982 1984 1986 1988 1990 1992 1994 1996 1998 2000 2002 2004 20082006
Uganda Sub-Saharan Africa
The Africa Competitiveness Report 2011 © 2011 World Economic Forum, the World Bank and the African Development Bank

189
Part 2:C
ompe
titiven
ess Profile
s
The Global Competitiveness Index in detailINDICATOR SCORE RANK/139
1st pillar: Institutions1.01 Property rights .......................................................3.8 ............94
1.02 Intellectual property protection..............................2.8 ..........100
1.03 Diversion of public funds.......................................2.0 ..........136
1.04 Public trust of politicians........................................2.2 ............92
1.05 Irregular payments and bribes...............................2.9 ..........122
1.06 Judicial independence ...........................................3.4 ............84
1.07 Favoritism in decisions of government officials ....2.4 ..........120
1.08 Wastefulness of government spending ................2.5 ..........112
1.09 Burden of government regulation..........................3.9 ............24
1.10 Efficiency of legal framework in settling disputes...3.7 ............63
1.11 Efficiency of legal framework in challenging regs...3.7 ............63
1.12 Transparency of government policymaking...........4.3 ............69
1.13 Business costs of terrorism...................................4.2 ..........131
1.14 Business costs of crime and violence...................3.8 ..........113
1.15 Organized crime.....................................................4.7 ..........100
1.16 Reliability of police services...................................4.0 ............77
1.17 Ethical behavior of firms........................................3.4 ..........104
1.18 Strength of auditing and reporting standards........4.0 ..........105
1.19 Efficacy of corporate boards..................................4.7 ............52
1.20 Protection of minority shareholders’ interests ......4.0 ............86
1.21 Strength of investor protection, 0–10 (best)*........4.0 ..........109
2nd pillar: Infrastructure2.01 Quality of overall infrastructure .............................3.4 ..........105
2.02 Quality of roads .....................................................2.7 ..........119
2.03 Quality of railroad infrastructure ............................1.2 ..........111
2.04 Quality of port infrastructure .................................3.5 ..........101
2.05 Quality of air transport infrastructure ....................3.9 ..........100
2.06 Available airline seat Kms/week, millions*..........40.8 ............99
2.07 Quality of electricity supply ...................................2.8 ..........117
2.08 Fixed telephone lines/100 pop.* ...........................0.7 ..........130
2.09 Mobile telephone subscriptions/100 pop.* .........28.7 ..........129
3rd pillar: Macroeconomic environment3.01 Government budget balance, % GDP* ................-2.6 ............41
3.02 National savings rate, % GDP* ...........................19.5 ............72
3.03 Inflation, annual % change* ................................14.2 ..........133
3.04 Interest rate spread, %*......................................12.0 ..........121
3.05 Government debt, % GDP* ................................19.7 ............24
3.06 Country credit rating, 0–100 (worst)*..................31.9 ..........100
4th pillar: Health and primary education4.01 Business impact of malaria....................................2.6 ..........136
4.02 Malaria incidence/100,000 pop.*..................35,543.2 ..........132
4.03 Business impact of tuberculosis............................3.6 ..........128
4.04 Tuberculosis incidence/100,000 pop.* ..............310.7 ..........121
4.05 Business impact of HIV/AIDS................................2.7 ..........134
4.06 HIV prevalence, % adult pop.*..............................5.4 ..........128
4.07 Infant mortality, deaths/1,000 live births* ...........84.5 ..........131
4.08 Life expectancy, years*.......................................52.7 ..........126
4.09 Quality of primary education..................................3.0 ..........102
4.10 Primary education enrollment, net %*................97.1 ............38
5th pillar: Higher education and training5.01 Secondary education enrollment, gross %* .......25.3 ..........132
5.02 Tertiary education enrollment, gross %* ..............3.7 ..........127
5.03 Quality of the educational system.........................3.6 ............72
5.04 Quality of math and science education .................3.3 ..........102
5.05 Quality of management schools............................3.9 ............84
5.06 Internet access in schools .....................................2.8 ..........115
5.07 Availability of research and training services.........3.4 ..........101
5.08 Extent of staff training ...........................................3.6 ..........100
INDICATOR SCORE RANK/139
6th pillar: Goods market efficiency6.01 Intensity of local competition ................................4.9 ............67
6.02 Extent of market dominance .................................3.0 ..........125
6.03 Effectiveness of anti-monopoly policy...................3.8 ............80
6.04 Extent and effect of taxation .................................3.3 ............85
6.05 Total tax rate, % profits*.....................................35.7 ............53
6.06 No. procedures to start a business* ...................18.0 ..........134
6.07 No. days to start a business*..............................25.0 ............82
6.08 Agricultural policy costs.........................................3.8 ............75
6.09 Prevalence of trade barriers...................................4.6 ............72
6.10 Trade tariffs, % duty*..........................................12.2 ..........115
6.11 Prevalence of foreign ownership...........................5.3 ............35
6.12 Business impact of rules on FDI ...........................5.3 ............27
6.13 Burden of customs procedures.............................4.1 ............77
6.14 Degree of customer orientation ............................4.3 ............90
6.15 Buyer sophistication ..............................................2.4 ..........129
7th pillar: Labor market efficiency7.01 Cooperation in labor-employer relations................4.4 ............60
7.02 Flexibility of wage determination...........................6.1 ..............4
7.03 Rigidity of employment index, 0–100 (worst)*......0.0 ..............1
7.04 Hiring and firing practices......................................5.2 ..............7
7.05 Redundancy costs, weeks of wages*.................13.0 ............21
7.06 Pay and productivity ..............................................3.0 ..........130
7.07 Reliance on professional management .................3.9 ............95
7.08 Brain drain..............................................................2.7 ..........100
7.09 Females in labor force, ratio to males* .................0.9 ............18
8th pillar: Financial market development8.01 Availability of financial services .............................4.3 ............80
8.02 Affordability of financial services ...........................3.8 ............90
8.03 Financing through local equity market...................3.4 ............77
8.04 Ease of access to loans.........................................2.3 ............99
8.05 Venture capital availability......................................1.9 ..........122
8.06 Restriction on capital flows ...................................4.8 ............45
8.07 Soundness of banks ..............................................5.2 ............68
8.08 Regulation of securities exchanges.......................3.9 ............84
8.09 Legal rights index, 0–10 (best)* ............................7.0 ............39
9th pillar: Technological readiness9.01 Availability of latest technologies ..........................4.4 ............93
9.02 Firm-level technology absorption...........................4.3 ..........104
9.03 FDI and technology transfer ..................................5.0 ............39
9.04 Internet users/100 pop.* .......................................9.8 ..........104
9.05 Broadband Internet subscriptions/100 pop.*.........0.0 ..........131
9.06 Internet bandwidth, Mb/s per 10,000 pop.*..........0.4 ..........115
10th pillar: Market size10.01 Domestic market size index, 1–7 (best)* ..............3.0 ............87
10.02 Foreign market size index, 1–7 (best)*..................3.4 ..........103
11th pillar: Business sophistication 11.01 Local supplier quantity...........................................5.0 ............49
11.02 Local supplier quality .............................................4.1 ............90
11.03 State of cluster development ................................2.8 ..........118
11.04 Nature of competitive advantage ..........................2.8 ..........108
11.05 Value chain breadth ...............................................2.9 ..........119
11.06 Control of international distribution .......................3.2 ..........126
11.07 Production process sophistication.........................2.4 ..........134
11.08 Extent of marketing ...............................................2.7 ..........131
11.09 Willingness to delegate authority ..........................2.9 ..........119
12th pillar: Innovation12.01 Capacity for innovation ..........................................2.2 ..........129
12.02 Quality of scientific research institutions ..............3.0 ............99
12.03 Company spending on R&D ..................................2.7 ............95
12.04 University-industry collaboration in R&D ...............3.4 ............78
12.05 Gov’t procurement of advanced tech products.....3.4 ............91
12.06 Availability of scientists and engineers..................3.6 ..........102
12.07 Utility patents/million pop.* ...................................0.0 ............90
Uganda
Notes: An asterisk (*) indicates that data are from sources other than the World Economic Forum. For further details and explanation, please refer to the section“How to Read the Competitiveness Profiles” on page 115.
The Africa Competitiveness Report 2011 © 2011 World Economic Forum, the World Bank and the African Development Bank
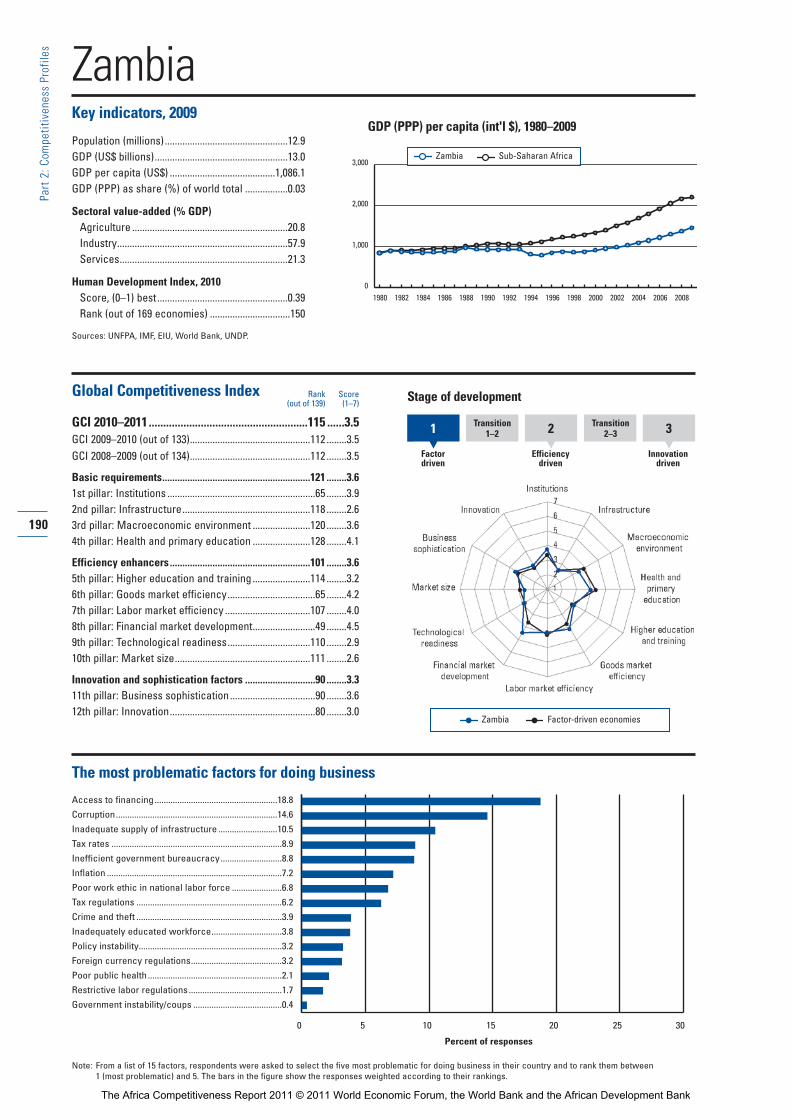
ZambiaKey indicators, 2009
Population (millions).................................................12.9GDP (US$ billions).....................................................13.0GDP per capita (US$) ..........................................1,086.1GDP (PPP) as share (%) of world total .................0.03
Sectoral value-added (% GDP)Agriculture ..............................................................20.8Industry....................................................................57.9Services...................................................................21.3
Human Development Index, 2010Score, (0–1) best....................................................0.39Rank (out of 169 economies) ................................150
Sources: UNFPA, IMF, EIU, World Bank, UNDP.
Global Competitiveness Index
GCI 2010–2011.......................................................115 ......3.5GCI 2009–2010 (out of 133)................................................112 ........3.5GCI 2008–2009 (out of 134)................................................112 ........3.5
Basic requirements...........................................................121 ........3.61st pillar: Institutions ...........................................................65 ........3.92nd pillar: Infrastructure...................................................118 ........2.63rd pillar: Macroeconomic environment .......................120 ........3.64th pillar: Health and primary education .......................128 ........4.1
Efficiency enhancers........................................................101 ........3.65th pillar: Higher education and training .......................114 ........3.26th pillar: Goods market efficiency...................................65 ........4.27th pillar: Labor market efficiency ..................................107 ........4.08th pillar: Financial market development.........................49 ........4.59th pillar: Technological readiness.................................110 ........2.910th pillar: Market size......................................................111 ........2.6
Innovation and sophistication factors ............................90 ........3.311th pillar: Business sophistication..................................90 ........3.612th pillar: Innovation..........................................................80 ........3.0
The most problematic factors for doing business
Access to financing......................................................18.8
Corruption.......................................................................14.6
Inadequate supply of infrastructure ..........................10.5
Tax rates ...........................................................................8.9
Inefficient government bureaucracy...........................8.8
Inflation .............................................................................7.2
Poor work ethic in national labor force ......................6.8
Tax regulations ................................................................6.2
Crime and theft ................................................................3.9
Inadequately educated workforce...............................3.8
Policy instability...............................................................3.2
Foreign currency regulations........................................3.2
Poor public health ...........................................................2.1
Restrictive labor regulations.........................................1.7
Government instability/coups .......................................0.4
Rank Score(out of 139) (1–7)
190
Part 2:C
ompe
titiven
ess Profile
s
GDP (PPP) per capita (int'l $), 1980–2009
0 5 10 15 20 25 30
Percent of responses
Note: From a list of 15 factors, respondents were asked to select the five most problematic for doing business in their country and to rank them between 1 (most problematic) and 5. The bars in the figure show the responses weighted according to their rankings.
1 Transition1–2 2 Transition
2 –3
Factordriven
Efficiencydriven
Innovationdriven
3
Stage of development
Zambia Factor-driven economies
0
1,000
2,000
3,000
1980 1982 1984 1986 1988 1990 1992 1994 1996 1998 2000 2002 2004 20082006
Zambia Sub-Saharan Africa
The Africa Competitiveness Report 2011 © 2011 World Economic Forum, the World Bank and the African Development Bank

191
Part 2:C
ompe
titiven
ess Profile
s
The Global Competitiveness Index in detailINDICATOR SCORE RANK/139
1st pillar: Institutions1.01 Property rights .......................................................4.1 ............80
1.02 Intellectual property protection..............................3.6 ............65
1.03 Diversion of public funds.......................................3.0 ............89
1.04 Public trust of politicians........................................2.4 ............84
1.05 Irregular payments and bribes...............................3.8 ............81
1.06 Judicial independence ...........................................3.8 ............69
1.07 Favoritism in decisions of government officials ....3.2 ............59
1.08 Wastefulness of government spending ................3.0 ............88
1.09 Burden of government regulation..........................3.8 ............28
1.10 Efficiency of legal framework in settling disputes...3.9 ............54
1.11 Efficiency of legal framework in challenging regs...3.6 ............66
1.12 Transparency of government policymaking...........4.6 ............47
1.13 Business costs of terrorism...................................6.1 ............55
1.14 Business costs of crime and violence...................4.5 ............87
1.15 Organized crime.....................................................5.4 ............64
1.16 Reliability of police services...................................4.2 ............71
1.17 Ethical behavior of firms........................................3.8 ............72
1.18 Strength of auditing and reporting standards........4.7 ............72
1.19 Efficacy of corporate boards..................................4.9 ............39
1.20 Protection of minority shareholders’ interests ......4.4 ............62
1.21 Strength of investor protection, 0–10 (best)*........5.3 ............59
2nd pillar: Infrastructure2.01 Quality of overall infrastructure .............................3.4 ..........103
2.02 Quality of roads .....................................................2.8 ..........110
2.03 Quality of railroad infrastructure ............................2.0 ............84
2.04 Quality of port infrastructure .................................3.6 ............95
2.05 Quality of air transport infrastructure ....................3.6 ..........111
2.06 Available airline seat Kms/week, millions*..........25.5 ..........109
2.07 Quality of electricity supply ...................................3.3 ..........106
2.08 Fixed telephone lines/100 pop.* ...........................0.7 ..........131
2.09 Mobile telephone subscriptions/100 pop.* .........34.1 ..........124
3rd pillar: Macroeconomic environment3.01 Government budget balance, % GDP* ................-4.4 ............76
3.02 National savings rate, % GDP* ...........................21.3 ............62
3.03 Inflation, annual % change* ................................13.4 ..........131
3.04 Interest rate spread, %*......................................15.0 ..........127
3.05 Government debt, % GDP* ................................22.8 ............35
3.06 Country credit rating, 0–100 (worst)*..................29.0 ..........110
4th pillar: Health and primary education4.01 Business impact of malaria....................................2.9 ..........132
4.02 Malaria incidence/100,000 pop.*..................31,251.3 ..........127
4.03 Business impact of tuberculosis............................3.1 ..........136
4.04 Tuberculosis incidence/100,000 pop.* ..............468.4 ..........131
4.05 Business impact of HIV/AIDS................................2.7 ..........136
4.06 HIV prevalence, % adult pop.*............................15.2 ..........133
4.07 Infant mortality, deaths/1,000 live births* ...........92.0 ..........133
4.08 Life expectancy, years*.......................................45.4 ..........137
4.09 Quality of primary education..................................3.2 ............92
4.10 Primary education enrollment, net %*................95.2 ............56
5th pillar: Higher education and training5.01 Secondary education enrollment, gross %* .......45.6 ..........115
5.02 Tertiary education enrollment, gross %* ..............2.3 ..........134
5.03 Quality of the educational system.........................4.0 ............52
5.04 Quality of math and science education .................3.8 ............77
5.05 Quality of management schools............................4.0 ............78
5.06 Internet access in schools .....................................2.8 ..........113
5.07 Availability of research and training services.........3.8 ............86
5.08 Extent of staff training ...........................................3.8 ............81
INDICATOR SCORE RANK/139
6th pillar: Goods market efficiency6.01 Intensity of local competition ................................4.6 ............85
6.02 Extent of market dominance .................................3.5 ............77
6.03 Effectiveness of anti-monopoly policy...................4.3 ............53
6.04 Extent and effect of taxation .................................3.5 ............79
6.05 Total tax rate, % profits*.....................................16.1 ..............9
6.06 No. procedures to start a business* .....................6.0 ............34
6.07 No. days to start a business*..............................18.0 ............65
6.08 Agricultural policy costs.........................................4.0 ............54
6.09 Prevalence of trade barriers...................................4.8 ............48
6.10 Trade tariffs, % duty*..........................................11.0 ..........106
6.11 Prevalence of foreign ownership...........................5.7 ............18
6.12 Business impact of rules on FDI ...........................5.2 ............30
6.13 Burden of customs procedures.............................4.2 ............71
6.14 Degree of customer orientation ............................4.4 ............78
6.15 Buyer sophistication ..............................................2.9 ..........107
7th pillar: Labor market efficiency7.01 Cooperation in labor-employer relations................4.3 ............71
7.02 Flexibility of wage determination...........................4.7 ............91
7.03 Rigidity of employment index, 0–100 (worst)*....21.0 ............50
7.04 Hiring and firing practices......................................4.4 ............36
7.05 Redundancy costs, weeks of wages*...............178.0 ..........131
7.06 Pay and productivity ..............................................3.4 ..........102
7.07 Reliance on professional management .................4.7 ............48
7.08 Brain drain..............................................................3.1 ............81
7.09 Females in labor force, ratio to males* .................0.8 ............82
8th pillar: Financial market development8.01 Availability of financial services .............................4.7 ............69
8.02 Affordability of financial services ...........................4.1 ............74
8.03 Financing through local equity market...................3.8 ............54
8.04 Ease of access to loans.........................................2.3 ..........106
8.05 Venture capital availability......................................2.0 ..........118
8.06 Restriction on capital flows ...................................4.6 ............60
8.07 Soundness of banks ..............................................5.3 ............56
8.08 Regulation of securities exchanges.......................4.4 ............56
8.09 Legal rights index, 0–10 (best)* ............................9.0 ..............6
9th pillar: Technological readiness9.01 Availability of latest technologies ..........................4.6 ............89
9.02 Firm-level technology absorption...........................4.5 ............86
9.03 FDI and technology transfer ..................................4.7 ............71
9.04 Internet users/100 pop.* .......................................6.3 ..........113
9.05 Broadband Internet subscriptions/100 pop.*.........0.1 ..........118
9.06 Internet bandwidth, Mb/s per 10,000 pop.*..........0.1 ..........129
10th pillar: Market size10.01 Domestic market size index, 1–7 (best)* ..............2.4 ..........114
10.02 Foreign market size index, 1–7 (best)*..................3.3 ..........110
11th pillar: Business sophistication 11.01 Local supplier quantity...........................................4.6 ............82
11.02 Local supplier quality .............................................4.0 ............98
11.03 State of cluster development ................................3.4 ............70
11.04 Nature of competitive advantage ..........................3.1 ............86
11.05 Value chain breadth ...............................................3.0 ..........107
11.06 Control of international distribution .......................3.5 ..........114
11.07 Production process sophistication.........................3.0 ..........106
11.08 Extent of marketing ...............................................3.2 ..........111
11.09 Willingness to delegate authority ..........................3.6 ............66
12th pillar: Innovation12.01 Capacity for innovation ..........................................2.5 ..........104
12.02 Quality of scientific research institutions ..............3.5 ............74
12.03 Company spending on R&D ..................................2.8 ............87
12.04 University-industry collaboration in R&D ...............3.5 ............67
12.05 Gov’t procurement of advanced tech products.....3.6 ............72
12.06 Availability of scientists and engineers..................3.8 ............88
12.07 Utility patents/million pop.* ...................................0.0 ............90
Zambia
Notes: An asterisk (*) indicates that data are from sources other than the World Economic Forum. For further details and explanation, please refer to the section“How to Read the Competitiveness Profiles” on page 115.
The Africa Competitiveness Report 2011 © 2011 World Economic Forum, the World Bank and the African Development Bank
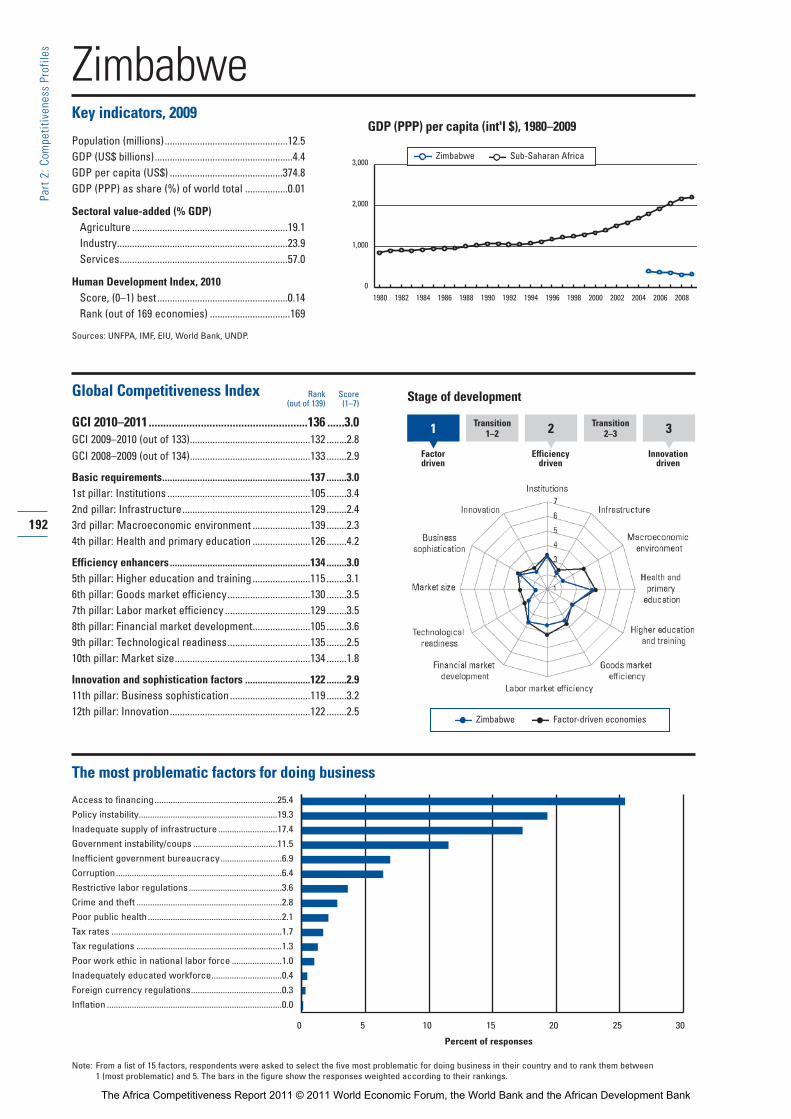
ZimbabweKey indicators, 2009
Population (millions).................................................12.5GDP (US$ billions).......................................................4.4GDP per capita (US$) .............................................374.8GDP (PPP) as share (%) of world total .................0.01
Sectoral value-added (% GDP)Agriculture ..............................................................19.1Industry....................................................................23.9Services...................................................................57.0
Human Development Index, 2010Score, (0–1) best....................................................0.14Rank (out of 169 economies) ................................169
Sources: UNFPA, IMF, EIU, World Bank, UNDP.
Global Competitiveness Index
GCI 2010–2011.......................................................136 ......3.0GCI 2009–2010 (out of 133)................................................132 ........2.8GCI 2008–2009 (out of 134)................................................133 ........2.9
Basic requirements...........................................................137 ........3.01st pillar: Institutions .........................................................105 ........3.42nd pillar: Infrastructure...................................................129 ........2.43rd pillar: Macroeconomic environment .......................139 ........2.34th pillar: Health and primary education .......................126 ........4.2
Efficiency enhancers........................................................134 ........3.05th pillar: Higher education and training .......................115 ........3.16th pillar: Goods market efficiency.................................130 ........3.57th pillar: Labor market efficiency ..................................129 ........3.58th pillar: Financial market development.......................105 ........3.69th pillar: Technological readiness.................................135 ........2.510th pillar: Market size......................................................134 ........1.8
Innovation and sophistication factors ..........................122 ........2.911th pillar: Business sophistication................................119 ........3.212th pillar: Innovation........................................................122 ........2.5
The most problematic factors for doing business
Access to financing......................................................25.4
Policy instability.............................................................19.3
Inadequate supply of infrastructure ..........................17.4
Government instability/coups .....................................11.5
Inefficient government bureaucracy...........................6.9
Corruption.........................................................................6.4
Restrictive labor regulations.........................................3.6
Crime and theft ................................................................2.8
Poor public health ...........................................................2.1
Tax rates ...........................................................................1.7
Tax regulations ................................................................1.3
Poor work ethic in national labor force ......................1.0
Inadequately educated workforce...............................0.4
Foreign currency regulations........................................0.3
Inflation .............................................................................0.0
Rank Score(out of 139) (1–7)
192
Part 2:C
ompe
titiven
ess Profile
s
GDP (PPP) per capita (int'l $), 1980–2009
0 5 10 15 20 25 30
Percent of responses
Note: From a list of 15 factors, respondents were asked to select the five most problematic for doing business in their country and to rank them between 1 (most problematic) and 5. The bars in the figure show the responses weighted according to their rankings.
1 Transition1–2 2 Transition
2 –3
Factordriven
Efficiencydriven
Innovationdriven
3
Stage of development
Zimbabwe Factor-driven economies
0
1,000
2,000
3,000
1980 1982 1984 1986 1988 1990 1992 1994 1996 1998 2000 2002 2004 20082006
Zimbabwe Sub-Saharan Africa
The Africa Competitiveness Report 2011 © 2011 World Economic Forum, the World Bank and the African Development Bank

193
Part 2:C
ompe
titiven
ess Profile
s
The Global Competitiveness Index in detailINDICATOR SCORE RANK/139
1st pillar: Institutions1.01 Property rights .......................................................2.2 ..........138
1.02 Intellectual property protection..............................3.1 ............88
1.03 Diversion of public funds.......................................2.7 ..........104
1.04 Public trust of politicians........................................2.0 ..........114
1.05 Irregular payments and bribes...............................3.9 ............77
1.06 Judicial independence ...........................................2.3 ..........131
1.07 Favoritism in decisions of government officials ....2.6 ..........110
1.08 Wastefulness of government spending ................2.5 ..........115
1.09 Burden of government regulation..........................3.1 ............80
1.10 Efficiency of legal framework in settling disputes...3.4 ............88
1.11 Efficiency of legal framework in challenging regs...2.4 ..........130
1.12 Transparency of government policymaking...........4.3 ............65
1.13 Business costs of terrorism...................................6.6 ..............9
1.14 Business costs of crime and violence...................4.9 ............71
1.15 Organized crime.....................................................6.1 ............33
1.16 Reliability of police services...................................2.8 ..........126
1.17 Ethical behavior of firms........................................3.6 ............88
1.18 Strength of auditing and reporting standards........5.1 ............49
1.19 Efficacy of corporate boards..................................4.8 ............50
1.20 Protection of minority shareholders’ interests ......4.6 ............51
1.21 Strength of investor protection, 0–10 (best)*........4.3 ............99
2nd pillar: Infrastructure2.01 Quality of overall infrastructure .............................3.2 ..........116
2.02 Quality of roads .....................................................3.2 ............94
2.03 Quality of railroad infrastructure ............................2.8 ............61
2.04 Quality of port infrastructure .................................4.4 ............61
2.05 Quality of air transport infrastructure ....................3.9 ............99
2.06 Available airline seat Kms/week, millions*..........22.7 ..........114
2.07 Quality of electricity supply ...................................1.8 ..........130
2.08 Fixed telephone lines/100 pop.* ...........................3.1 ..........111
2.09 Mobile telephone subscriptions/100 pop.* .........23.9 ..........134
3rd pillar: Macroeconomic environment3.01 Government budget balance, % GDP* ................-3.3 ............54
3.02 National savings rate, % GDP* .............................1.0 ..........135
3.03 Inflation, annual % change* .................................-7.7 ..............1
3.04 Interest rate spread, %*......................................75.0 ..........137
3.05 Government debt, % GDP* ..............................162.5 ..........136
3.06 Country credit rating, 0–100 (worst)*....................6.7 ..........138
4th pillar: Health and primary education4.01 Business impact of malaria....................................4.4 ..........114
4.02 Malaria incidence/100,000 pop.*..................20,367.9 ..........120
4.03 Business impact of tuberculosis............................3.5 ..........132
4.04 Tuberculosis incidence/100,000 pop.* ..............761.8 ..........137
4.05 Business impact of HIV/AIDS................................2.9 ..........131
4.06 HIV prevalence, % adult pop.*............................15.3 ..........134
4.07 Infant mortality, deaths/1,000 live births* ...........61.5 ..........115
4.08 Life expectancy, years*.......................................44.2 ..........139
4.09 Quality of primary education..................................3.3 ............85
4.10 Primary education enrollment, net %*................89.9 ............94
5th pillar: Higher education and training5.01 Secondary education enrollment, gross %* .......41.0 ..........118
5.02 Tertiary education enrollment, gross %* ..............3.8 ..........126
5.03 Quality of the educational system.........................4.2 ............46
5.04 Quality of math and science education .................3.8 ............76
5.05 Quality of management schools............................4.1 ............72
5.06 Internet access in schools .....................................2.3 ..........128
5.07 Availability of research and training services.........3.3 ..........109
5.08 Extent of staff training ...........................................3.9 ............71
INDICATOR SCORE RANK/139
6th pillar: Goods market efficiency6.01 Intensity of local competition ................................4.1 ..........119
6.02 Extent of market dominance .................................3.7 ............64
6.03 Effectiveness of anti-monopoly policy...................3.8 ............86
6.04 Extent and effect of taxation .................................3.2 ............93
6.05 Total tax rate, % profits*.....................................39.4 ............66
6.06 No. procedures to start a business* ...................10.0 ............99
6.07 No. days to start a business*..............................96.0 ..........133
6.08 Agricultural policy costs.........................................2.2 ..........139
6.09 Prevalence of trade barriers...................................4.4 ............79
6.10 Trade tariffs, % duty*..........................................19.9 ..........134
6.11 Prevalence of foreign ownership...........................4.2 ..........108
6.12 Business impact of rules on FDI ...........................2.8 ..........136
6.13 Burden of customs procedures.............................3.6 ............99
6.14 Degree of customer orientation ............................3.7 ..........124
6.15 Buyer sophistication ..............................................3.0 ..........103
7th pillar: Labor market efficiency7.01 Cooperation in labor-employer relations................4.2 ............79
7.02 Flexibility of wage determination...........................2.8 ..........137
7.03 Rigidity of employment index, 0–100 (worst)*....33.0 ............82
7.04 Hiring and firing practices......................................3.0 ..........122
7.05 Redundancy costs, weeks of wages*...............446.0 ..........134
7.06 Pay and productivity ..............................................3.1 ..........120
7.07 Reliance on professional management .................5.3 ............23
7.08 Brain drain..............................................................2.4 ..........121
7.09 Females in labor force, ratio to males* .................0.8 ............77
8th pillar: Financial market development8.01 Availability of financial services .............................3.6 ..........115
8.02 Affordability of financial services ...........................3.7 ............97
8.03 Financing through local equity market...................3.9 ............44
8.04 Ease of access to loans.........................................2.0 ..........127
8.05 Venture capital availability......................................1.7 ..........134
8.06 Restriction on capital flows ...................................3.6 ..........113
8.07 Soundness of banks ..............................................3.4 ..........135
8.08 Regulation of securities exchanges.......................3.9 ............85
8.09 Legal rights index, 0–10 (best)* ............................7.0 ............39
9th pillar: Technological readiness9.01 Availability of latest technologies ..........................3.6 ..........133
9.02 Firm-level technology absorption...........................4.0 ..........126
9.03 FDI and technology transfer ..................................3.3 ..........136
9.04 Internet users/100 pop.* .....................................11.4 ............99
9.05 Broadband Internet subscriptions/100 pop.*.........0.1 ..........111
9.06 Internet bandwidth, Mb/s per 10,000 pop.*..........0.2 ..........123
10th pillar: Market size10.01 Domestic market size index, 1–7 (best)* ..............1.5 ..........134
10.02 Foreign market size index, 1–7 (best)*..................2.7 ..........126
11th pillar: Business sophistication 11.01 Local supplier quantity...........................................4.0 ..........123
11.02 Local supplier quality .............................................3.7 ..........119
11.03 State of cluster development ................................2.7 ..........120
11.04 Nature of competitive advantage ..........................2.3 ..........136
11.05 Value chain breadth ...............................................2.4 ..........134
11.06 Control of international distribution .......................3.7 ............98
11.07 Production process sophistication.........................2.5 ..........132
11.08 Extent of marketing ...............................................3.2 ..........115
11.09 Willingness to delegate authority ..........................3.6 ............69
12th pillar: Innovation12.01 Capacity for innovation ..........................................2.3 ..........122
12.02 Quality of scientific research institutions ..............2.9 ..........107
12.03 Company spending on R&D ..................................2.5 ..........117
12.04 University-industry collaboration in R&D ...............3.1 ..........105
12.05 Gov’t procurement of advanced tech products.....2.8 ..........124
12.06 Availability of scientists and engineers..................2.9 ..........131
12.07 Utility patents/million pop.* ...................................0.3 ............66
Zimbabwe
Notes: An asterisk (*) indicates that data are from sources other than the World Economic Forum. For further details and explanation, please refer to the section“How to Read the Competitiveness Profiles” on page 115.
The Africa Competitiveness Report 2011 © 2011 World Economic Forum, the World Bank and the African Development Bank

The Africa Competitiveness Report 2011 © 2011 World Economic Forum, the World Bank and the African Development Bank
195
Abou
t th
e Au
thor
s
Jennifer BlankeJennifer Blanke is Director, Lead Economist, and Head of
the Centre for Global Competitiveness and Performance
at the World Economic Forum. Since joining the team in
2002, she has written and lectured extensively on issues
related to national competitiveness and has edited a num-
ber of competitiveness reports, with a particular regional
focus on Western Europe and sub-Saharan Africa. From
1998 to 2002, she was Senior Programme Manager
responsible for developing the business, management,
and technology section of the World Economic Forum’s
Annual Meeting in Davos. Before joining the Forum,
Dr Blanke worked for a number of years as a manage-
ment consultant for Eurogroup, Mazars Group in Paris,
France, where she specialized in banking and financial
market organization. Dr Blanke obtained a BA from
Hamilton College, a Master of International Affairs from
Columbia University, and an MA and a PhD in International
Economics from the Graduate Institute of International
Studies (Geneva).
Zuzana BrixiovaZuzana Brixiova is a Principal Research Economist at
the Development Research Department of the African
Development Bank, where she currently researches the
longer-term impact of the global financial crisis on Africa
and the role of growth-supporting macroeconomic poli-
cies in the post-crisis global economy. She has authored
or co-authored several studies and policy briefs in this
area, some of which provided analytical background
for discussions of the Committee of Ten (C-10). Before
joining the African Development Bank, she worked in
the Country Studies branch of the OECD’s Economics
Department, where she was the lead author of the first
OECD Economic Survey of Estonia. As a Fulbright Scholar
at the Addis Ababa University in 2007–08, she conducted
research on entrepreneurship in Ethiopia and taught
graduate courses on advanced macroeconomics. She
has an extensive operational experience from the IMF in
countries in Africa, Central Asia, and emerging Europe,
including as the IMF resident representative for Lithuania
and Belarus. She holds a PhD in Economics from the
University of Minnesota.
Ciara BrowneCiara Browne is Associate Director of the Centre for
Global Competitiveness and Performance at the World
Economic Forum, where her responsibilities include
coordinating the Executive Opinion Survey process and
managing the network of over 150 Partner Institutes
worldwide, as well as providing input into The Global
Competitiveness Report and several of the Forum’s other
benchmarking studies. She also works closely with the
Forum’s media team in articulating the findings of the
various competitiveness reports to the media and the
public. Before joining the Forum, she served for several
years with the International Organization for Migration,
where she worked for a mass claims processing program.
She has a BA (Hons) from the University of Manchester.
Uri DadushUri Dadush is Senior Associate and Director of Carnegie’s
International Economics Program. His work currently
focuses on trends in the global economy and the global
financial crisis. A French citizen, Dr Dadush previously
served as the World Bank’s Director of International Trade
for six years and before that as Director of Economic
Policy for three years. He has also served concurrently
as the Director of the Bank’s World Economy Group
over the last eleven years, leading the preparation of the
Bank’s flagship reports on the international economy
over that period. Prior to joining the World Bank, he was
President and CEO of the Economist Intelligence Unit and
Business International, part of the Economist Group. Dr
Dadush received BA and MA degrees in Economics from
Hebrew University and a PhD in Business Economics
from Harvard University, where he specialized in
International Trade.
Andres F. GarciaAndres F. Garcia is an Economist in the Africa Financial
and Private Sector Development Group. He joined the
World Bank as part of the Young Professionals Program
in 2009. His work at the Bank is mainly focused on
strengthening the linkages along the tourism and agri -
business value chains in Africa. Before joining the World
Bank, Dr Garcia was an Assistant Research Professor
in Development Economics at the University of
Copenhagen, working on issues related to poverty
reduction and economic structure in Mozambique and
Vietnam. He has published in the Journal of Agricultural
Economics, authored a book chapter on “Agricultural
Price Distortions and Stabilization,” and worked together
with the Honduran Ministry of Tourism to create the
manual How to Implement Ecotourism Projects. He has
a PhD in Agricultural Economics and an MS in Hospitality
and Tourism Management from Purdue University, and
a BS in Socioeconomic Development and Environment
from the Pan-American School of Agriculture.
About the Authors
The Africa Competitiveness Report 2011 © 2011 World Economic Forum, the World Bank and the African Development Bank
Tugba GurcanlarTugba Gurcanlar is a Trade Consultant at the World
Bank’s Finance and Private Sector Development Unit for
the Africa Region. Her current focus is on developing
business clusters and enhancing the competitiveness of
African firms in the global markets. Previously Ms
Gurcanlar worked in the International Trade and
International Finance Units of the World Bank on trade
corridors, investment decisions of the global buyers,
trade facilitation, export competitiveness, and south-
south banking and investments. Prior to her work at the
World Bank, she also focused on European trade and
finance at the UN Economic Commission for Europe,
the Turkish Prime Ministry, the General Secretariat for
European Union Affairs, and the Economic Development
Foundation. A Turkish national, Ms Gurcanlar holds an
MPP in Global Economic Policy from Duke University.
Kwabena Gyimah-BrempongKwabena Gyimah-Brempong is Professor of Economics
at the University of South Florida at Tampa, where he
has been Department Chair since 2004. Dr Gyimah-
Brempong has also held professorial positions at New
College of Florida and Wright State University, Dayton,
Ohio. He was an Economics Program Director at the
National Science Foundation from 2002 to 2004 and a
Senior Research Economist at Elliot Berg Associates
in Alexandria, Virginia, between 1986 and 1987. He is
a past Secretary/Treasurer and President of the African
Finance and Economics Association (AFEA) as well
as a past President of National Economics Association.
He consults regularly for the African Development Bank,
the United Nations’ Economic Commission for Africa,
the African Capacity Building Foundation, and the National
Science Foundation, among others. His research focuses
on the economics of crime, efficiency in public produc-
tion, and the economic development of Africa. He
has published several articles in refereed journals
including the American Economic Review, the Review
of Economics and Statistics, the Journal of Business
and Economics Statistics, the Journal of Development
Economics, Economic Development and Cultural Change,
the Economics of Education Review, Information
Economics and Policy, and the Journal of African
Economies. He serves on the editorial boards of the
Southern Economic Journal and the Journal of African
Development. Dr Gyimah-Brempong has also contributed
chapters to several books. He holds a BA (Honors) in
Economics from the University of Cape Coast, Ghana,
and a PhD in Economics from Wayne State University.
Mary Hallward-DriemeierMary Hallward-Driemeier is a Lead Economist in the Office
of the Chief Economist of the Financial and Private Sector
Development Network of the World Bank. Since joining
the World Bank as a Young Professional in 1997, she has
published articles on entrepreneurship, firm productivity,
the impact of the investment climate on firm perform-
ance, the impact of financial crises, and determinants of
foreign direct investment. She was the Deputy Director
for the World Development Report 2005: A Better
Investment Climate for Everyone. She helped establish
the World Bank’s Enterprise Surveys Program, which
now covers over 100,000 enterprises in 100 countries.
She is also a founding member of the Microeconomics
of Growth Network. She is currently the Task Team
Leader for the regional flagship report Expanding
Economic Opportunities for Women in Africa. She
received her MSc in Development Economics from
Oxford University and her PhD in Economics from the
Massachusetts Institute of Technology.
Giuseppe IarossiGiuseppe Iarossi is Senior Economist in the Regional
Program for Enterprise Development of the Africa
Finance and Private Sector Development Group of the
World Bank. He joined the Bank in 1994 in the Research
Department and worked on determinants of long-term
growth with particular emphasis on ethnicity in Africa.
Since 1997, he has been a core team member of the
Investment Climate team, contributing to the establish-
ment of the Enterprise Surveys Program throughout the
World Bank. He has managed surveys in Africa, Latin
America, South Asia, and East Asia and has written
numerous Investment Climate Assessments and research
papers on firm productivity and the impact of the busi-
ness environment on firm performance. He has managed
the production on the World Bank side for a number of
publications, including the flagship reports The Africa
Competitiveness Report 2007, 2009, and 2011, published
jointly with the World Economic Forum and the African
Development Bank. His interests include survey method-
ology and the effects of survey design on data accuracy.
He is the author of The Power of Survey Design: A
User’s Guide for Managing Surveys, Interpreting Results,
and Influencing Respondents. He holds a Master in
Economics from the University of Maryland at College
Park and a Master in International Affairs from the Johns
Hopkins University, School of Advanced International
Studies. He received an MBA from the University of
Siena and a CPA certification from the University of
Naples. He has taught Survey Methodology at the
School of Advanced International Studies of the Johns
Hopkins University and has led short courses on Survey
Methodology and Survey Data Analysis in many countries
around the world.
196
Abou
t th
e Au
thor
s
The Africa Competitiveness Report 2011 © 2011 World Economic Forum, the World Bank and the African Development Bank
Hannah MesserliHannah Messerli is dedicated to utilizing tourism as an
economic development tool for emerging economies.
Currently a Senior Private Sector Development Specialist
in Tourism for the Africa Region of the World Bank,
Dr Messerli supports government initiatives to develop
private-sector capacity in tourism across a region of
47 countries. With more than 15 years of experience
in the public and private sectors focusing on tourism
planning and development, she has worked in Asia,
Africa, Europe, and the Americas. As an analyst and
tourism product development specialist, she has
focused on cultural heritage and nature-based tourism
in emerging economies. Her professional background
includes serving as a faculty member at New York
University and operations consulting with hotel and
tourism companies globally. Hannah has completed
Masters in Hotel Administration at Cornell University
and in Tourism Planning at the George Washington
University. Her doctorate in Tourism Planning and
Development was also completed at Cornell University.
Peter OndiegePeter Ondiege is Chief Research Economist at the
Development Research Department (EDRE) of the
African Development Bank (AfDB). He coordinates the
production for the AfDB of the Investment Climate
Assessments and the African Competitiveness Reports
jointly undertaken with the World Bank and World
Economic Forum. Prior to joining EDRE in July 2006,
He was in the Planning and Budgeting Department of
the AfDB where he served as the Annual Report
Coordinator, coordinating and playing lead roles in the
preparation of the Bank Group Annual Reports of 2004 to
2007. Prior to joining the Bank in 2004, he was a Director
of the Housing and Building Research Institute and an
Associate Professor at the University of Nairobi, Kenya;
he also held a position at the Ministry of Planning and
National Development, Kenya. He has conducted and led
a number of study teams mainly in the areas of macroeco-
nomic and sectoral reforms and enterprise development,
especially in the small- and medium-sized enterprises
(SMEs) sector. He has published widely in the field of
Urban and Regional Economics and in the private sector,
focusing on SME development. He has also served as
a consultant to a number of regional and international
organizations and agencies. He holds a Master and a PhD
in Economics from the University of Tsukuba, Japan.
197
Abou
t th
e Au
thor
s
The Africa Competitiveness Report 2011 © 2011 World Economic Forum, the World Bank and the African Development Bank

The Africa Competitiveness Report 2011 © 2011 World Economic Forum, the World Bank and the African Development Bank
ISBN-13: 978-92-95044-97-5
The publication of this year’s Africa Competitiveness Report comes out as the world
emerges from its most significant financial and economic crisis in generations. While
many advanced economies are still struggling to get their economies back on a solid
footing, Africa has, for the most part, weathered the storm remarkably well.
However, although impressive growth rates and increasing levels of FDI supported
an economic resurgence in Africa over the past decade, much remains to be done to
ensure that it continues to grow rapidly into the future. Indeed, one of the reasons
that Africa was less affected by the crisis than other regions was its limited integration
into the global economy. Although this sheltered African economies over the shorter
term, it holds them back in their development over the longer term. In this context,
the goal of this Report is to highlight the areas most urgently requiring policy action
and investment to ensure that Africa’s growth will be sustainable into the future.
This is the third report on the region’s business environment that leverages the
knowledge and expertise of the African Development Bank, the World Bank, and
the World Economic Forum. It presents a joint vision of the policy challenges that
countries on the continent should address to establish a foundation for sustainable
growth and prosperity. This year the Africa Commission and the Danish Government
have also provided their support to this Report.
Much has been done in recent years to improve the business and economic
environment in Africa. Continued policy and institutional reform remain central to
ensuring that African countries remain on a higher growth trajectory. This year’s
Report places a particular focus on better harnessing the continent’s resources by
upgrading skills, encouraging female entrepreneurship, and making the most of its
natural and cultural resources.
Also included are detailed competitiveness profiles for several African countries,
providing a comprehensive summary of their competitive strengths and weaknesses.
The Africa Competitiveness Report 2011 is an invaluable tool for policymakers, business
strategists, and other key stakeholders, as well as essential reading for all those with
an interest in the region.


![Wef gcr report_2011-12[1]](https://static.cupdf.com/doc/110x72/554db905b4c905bd488b46f7/wef-gcr-report2011-121.jpg)