Unequal Opportunity
=
Unequal Results
"It's a very bad development. It's creating two societies. And it's based very much, I think, on
educational differences. The unemployment rate we've been talking about. If you're a college
graduate, unemployment is 5 percent. If you're a high school graduate, it's 10 percent or more. It's
a very big difference. It leads to an unequal society, and a society which doesn't have the cohesion
that we'd like to see." -- Ben Bernanke, December, 6, 2010
Unequal Opportunity =Unequal Results
2 | P a g e
This report was prepared by Marina Marcou-O’Malley, Public Policy and Education Fund Policy
Analyst. PPEF would like to thank Sumaya Saati, consultant, for the data preparation and
analysis.
Unequal Opportunity =Unequal Results
3 | P a g e
There are two education systems in this state. Not public-private. One for the rich
and one for the poor and they are both public systems. --Andrew Cuomo, October 18, 2010
Summary of Findings
There are 461,074 students in the 532 schools that are on the state’s Schools in Need of
Improvement (SINI) list. There are 397,946 students in schools that the state classifies as
Low Need —these are the highest income school districts in the state.
The highest income districts spend $1,712 more per pupil than the Schools in Need of
Improvement. It would require $788 million in additional funding for the SINI schools to
spend as much per pupil as the high income districts. There is a $788 million funding gap
between SINI schools and high income schools despite the fact that there is much greater
student need in the SINI schools.
Higher income schools spend $37,664 more a year in the average classroom than SINI
schools do statewide.
Less than 57% of students in SINI schools graduate on time, as opposed to more than 92% in
Low Needs schools.
In SINI schools, 68% of students are in poverty, whereas, only 6% of students in Low Needs
Districts are in poverty.
In SINI schools, 69% of students are African American and Hispanic compared to 9.73% in
Low Needs schools.
When it comes to college readiness, students in SINI schools are even further behind with
21% of graduates receiving an Advanced Regents Diploma compared with 61% in low need
(higher income) schools.
New York’s statewide Campaign for Fiscal Equity investment was working to close the
achievement and funding gap before the state froze and then cut this funding.
The typical person in the work force with a Bachelor’s Degree makes $53,976. The typical
person with only a High School Diploma makes $32,552. The median income difference
between a Bachelors Degree and a High School diploma is $21,424 a year.
Unequal Opportunity =Unequal Results
4 | P a g e
What’s the Plan to Get All New York Students
Ready for College or Careers? Governor Andrew Cuomo is right: New York State has a dramatic contrast in the quality of
education available in different school districts. Nowhere are these lines of contrast clearer than
in the Schools In Need of Improvement (SINI). While the majority of our students are in schools
with high rates of student success, too many students in SINI schools are not succeeding. Across
the state 92% of students in the highest income districts graduate on time (these districts are
classified by the State Education Department as Low Need Districts) and 81% in average need
schools, while only 57% graduate on time in SINI schools. Every year, the New York State
Education Department publishes a list of SINI schools as an accountability measure to make the
public aware. But putting out a list is not enough, where is the plan to improve these schools?
Governor Cuomo has warned that he plans to make large cuts to education. This is on top of
$1.4 billion cuts last year—the largest cuts in the history of the New York State. Will large cuts
two years in a row improve our schools or undermine schools that are succeeding and increase
educational inequity?
Where do New York State’s Schools Rank?
Conclusions & Policy Implications
There is tremendous inequity in New York’s education system.
Additional large education cuts will have the most devastating impact on African
American students, Hispanic students and poor students of all races. As New York’s
highest court has ruled—the students in needy schools start out the furthest behind.
New York State’s Low Need (or higher income) schools generally provide a high
quality education and include some of the best schools in the country. New York
schools have 25% of the Intel Scholarship finalists in the nation’s most prestigious
science competition.
Despite the failure to adequately address educational inequities, New York State
schools are “a perennial top-ranking state,” ranking 8th
out of 50 states in K-12
achievement and 2nd
in overall policy and performance.
Large cuts will undermine our best schools and set back those students in schools that
are struggling. The consequences of education cuts are self-evident: more teachers leaving the
classroom, fewer guidance counselors, reduction in AP courses, elimination of music,
art or sports, less one-on-one attention, which all have an educational cost for students.
Public opinion polls consistently show that New Yorkers continue to place a high value
on educational opportunities for all students. The Siena Poll released on December 13
2010, found that 74% of New Yorkers oppose cuts to education funding, A Quinnipiac
Poll released December 9, 2010 found that 78% oppose cuts to public schools.
Unequal Opportunity =Unequal Results
5 | P a g e
The Governor asserts that New York State is the first in education spending, but 34th
in
achievement. These numbers are in contrast to a new comprehensive comparison of all 50 states
published by Education Week, the nation’s leading education periodical. The Quality Counts
20111 report ranks New York 8
th among the 50 states in K-12 achievement and 2
nd in overall
policy and performance. New York ranks third in spending per pupil once poverty, student need,
and regional costs are taken into consideration. According to the report’s publishers, New York
"is actually a perennial top-ranking state."2 The study looks at the National Assessment of
Educational Progress Mathematics and English Language Arts tests, which are the only national
assessments and are considered to be the most rigorous. The investment we make in education
gives New York students a better chance of success than students in other states. New York
placed 12th
on the Quality Counts Chance-for-Success Index that examines the link between
educational opportunity and likelihood of success later in life.3
Painting a picture of New York’s education system as failing is not accurate. More than 88% of
the public schools 4 in the state meet state proficiency standards. New York houses some of the
greatest schools in the nation. We have consistently had the highest number of Intel Scholar
Finalists. The Intel Science Talent Search (Intel STS) is the nation’s most prestigious science
research competition for high school seniors. In 2010 New York schools produced 25% of the
finalists.5 Will cuts in education reduce the number of successful schools and highly successful
students?
1 www.edweek.org/go/qc11
2http://www.wnyc.org/articles/wnyc-news/2011/jan/11/education-data-shows-new-yorks-number-2-or-34-
according-cuomo/ 3 http://www.edweek.org/ew/qc/2007/17csi.h26.html
The index combines information from 13 indicators that span childhood through adulthood to capture three broad
life stages: the early-childhood years, participation and performance in formal education, and educational attainment
and workforce outcomes during adulthood. The Index includes indicators such as family income, parent education
and employment, enrollment in prekindergarten and kindergarten, 4th grade reading and math proficiency, high
school graduation, educational attainment, annual income and steady employment. 4 http://www.p12.nysed.gov/irs/pressRelease/20101104/home.html
5 http://apps.societyforscience.org/sts/69sts/finalists.asp
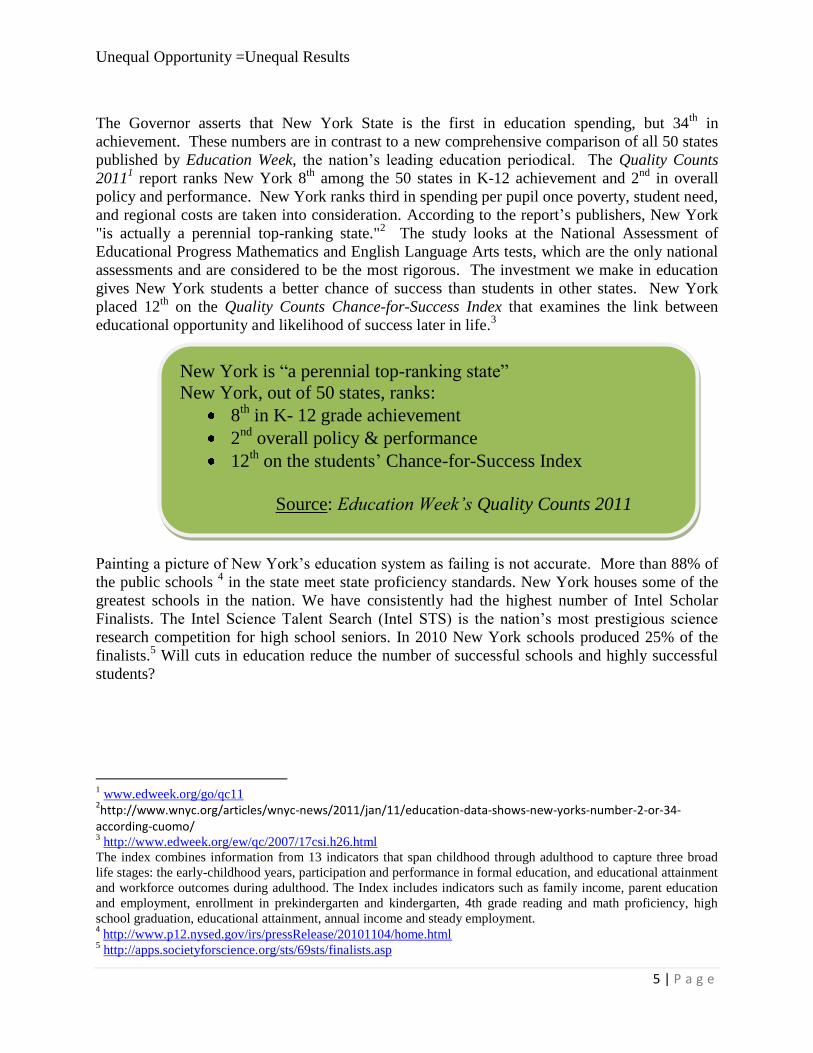
New York is “a perennial top-ranking state”
New York, out of 50 states, ranks:
8th
in K- 12 grade achievement
2nd
overall policy & performance
12th on the students’ Chance-for-Success Index
Source: Education Week’s Quality Counts 2011
Unequal Opportunity =Unequal Results
6 | P a g e
Educational Inequity: New York’s Achilles Heal
From 1993 to 2006 the Campaign for Fiscal Equity lawsuit was in the courts. CFE exposed the
great education civil rights divide based on poverty and race that exists in New York State. The
New York State Court of Appeals, the state’s highest court, found that New York State had
failed to meet its obligation to provide a “sound basic education” or a “meaningful high school
education” to students in schools with high rates of poverty. With tremendous public support
from throughout the state and after 13 years of appeals and delays during which an entire
generation in some communities was left in under-resourced schools, New York State finally
began meeting its obligations in 2007. Until then, New York ranked first among the 50 states
with the widest gap between spending per student in the wealthiest and poorest schools.6
In 2007, New York State made a commitment to finally close the gap in educational opportunity
by investing in reform in our neediest schools. For two years the state met its obligations and
made progress in closing the gap in educational opportunity. The statewide CFE investments
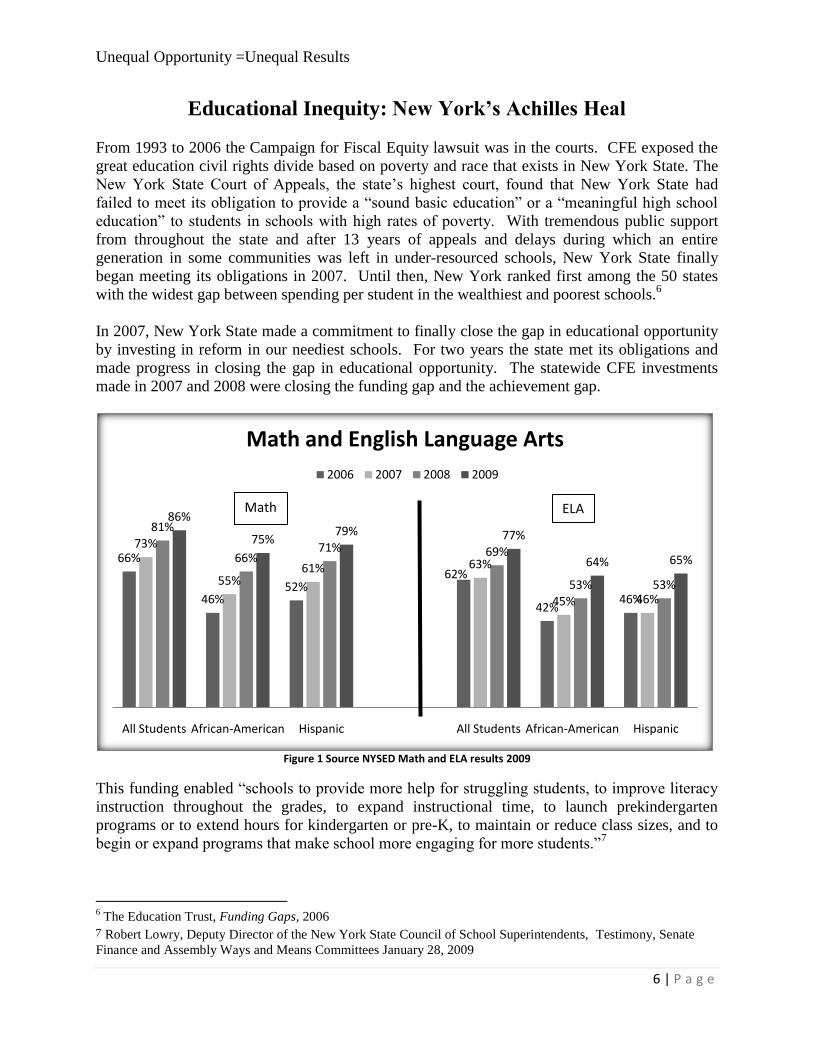
made in 2007 and 2008 were closing the funding gap and the achievement gap.
Figure 1 Source NYSED Math and ELA results 2009
This funding enabled “schools to provide more help for struggling students, to improve literacy
instruction throughout the grades, to expand instructional time, to launch prekindergarten
programs or to extend hours for kindergarten or pre-K, to maintain or reduce class sizes, and to
begin or expand programs that make school more engaging for more students.”7
6 The Education Trust, Funding Gaps, 2006
7 Robert Lowry, Deputy Director of the New York State Council of School Superintendents, Testimony, Senate
Finance and Assembly Ways and Means Committees January 28, 2009
66%
46%52%
62%
42%46%
73%
55%61% 63%
45% 46%
81%
66%71% 69%
53% 53%
86%
75%79% 77%
64% 65%
All Students African-American Hispanic All Students African-American Hispanic
Math and English Language Arts
2006 2007 2008 2009
Math ELA
Unequal Opportunity =Unequal Results
7 | P a g e
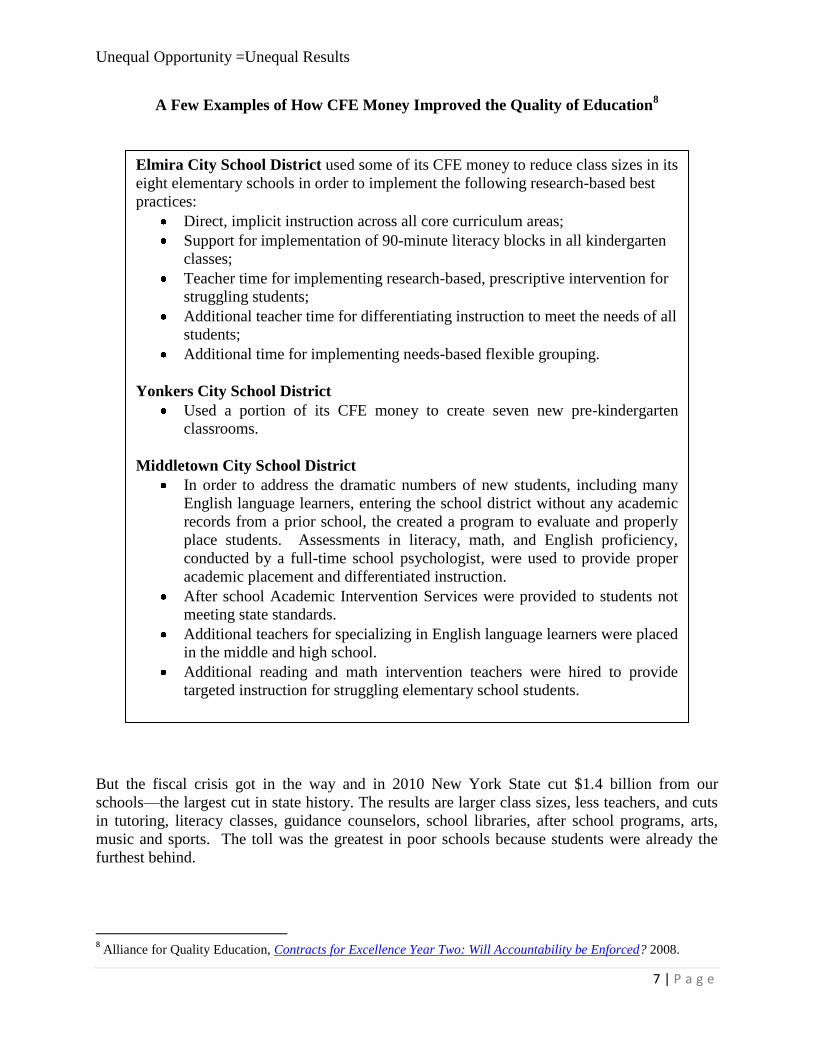
A Few Examples of How CFE Money Improved the Quality of Education8
But the fiscal crisis got in the way and in 2010 New York State cut $1.4 billion from our
schools—the largest cut in state history. The results are larger class sizes, less teachers, and cuts
in tutoring, literacy classes, guidance counselors, school libraries, after school programs, arts,
music and sports. The toll was the greatest in poor schools because students were already the
furthest behind.
8 Alliance for Quality Education, Contracts for Excellence Year Two: Will Accountability be Enforced? 2008.
Elmira City School District used some of its CFE money to reduce class sizes in its
eight elementary schools in order to implement the following research-based best
practices:
Direct, implicit instruction across all core curriculum areas;
Support for implementation of 90-minute literacy blocks in all kindergarten
classes;
Teacher time for implementing research-based, prescriptive intervention for
struggling students;
Additional teacher time for differentiating instruction to meet the needs of all
students;
Additional time for implementing needs-based flexible grouping.
Yonkers City School District
Used a portion of its CFE money to create seven new pre-kindergarten
classrooms.
Middletown City School District
In order to address the dramatic numbers of new students, including many
English language learners, entering the school district without any academic
records from a prior school, the created a program to evaluate and properly
place students. Assessments in literacy, math, and English proficiency,
conducted by a full-time school psychologist, were used to provide proper
academic placement and differentiated instruction.
After school Academic Intervention Services were provided to students not
meeting state standards.
Additional teachers for specializing in English language learners were placed
in the middle and high school.
Additional reading and math intervention teachers were hired to provide
targeted instruction for struggling elementary school students.
Unequal Opportunity =Unequal Results
8 | P a g e
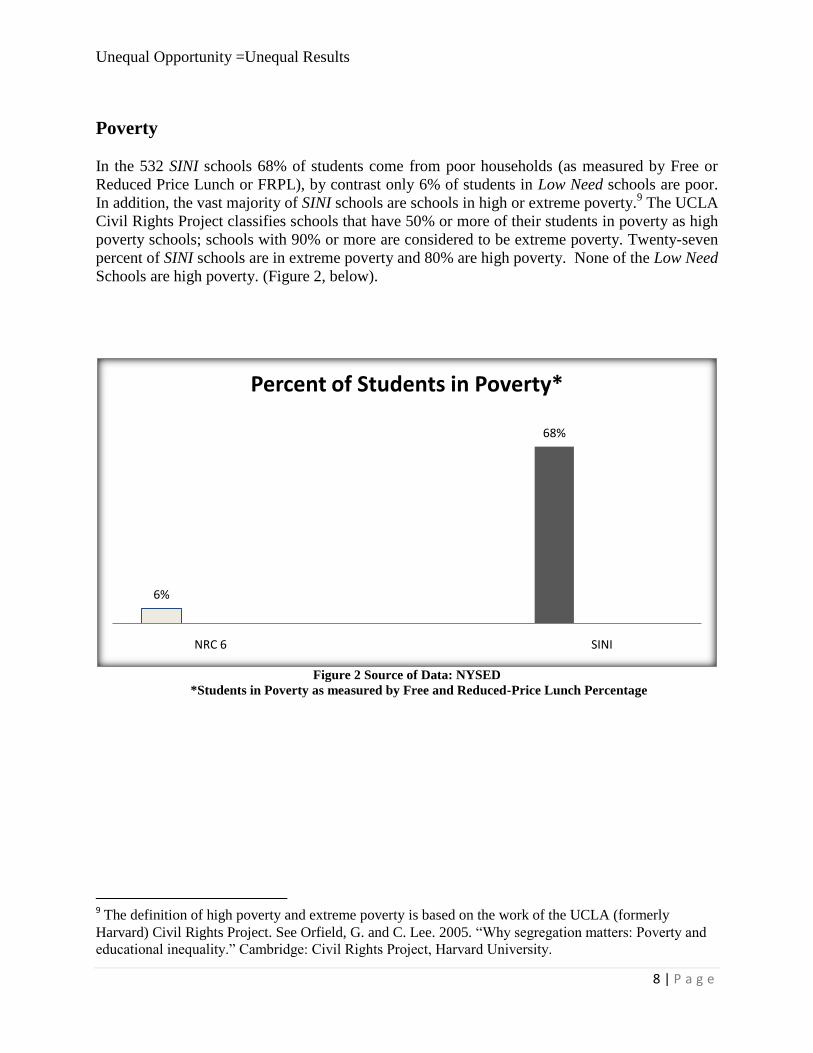
Poverty In the 532 SINI schools 68% of students come from poor households (as measured by Free or
Reduced Price Lunch or FRPL), by contrast only 6% of students in Low Need schools are poor.
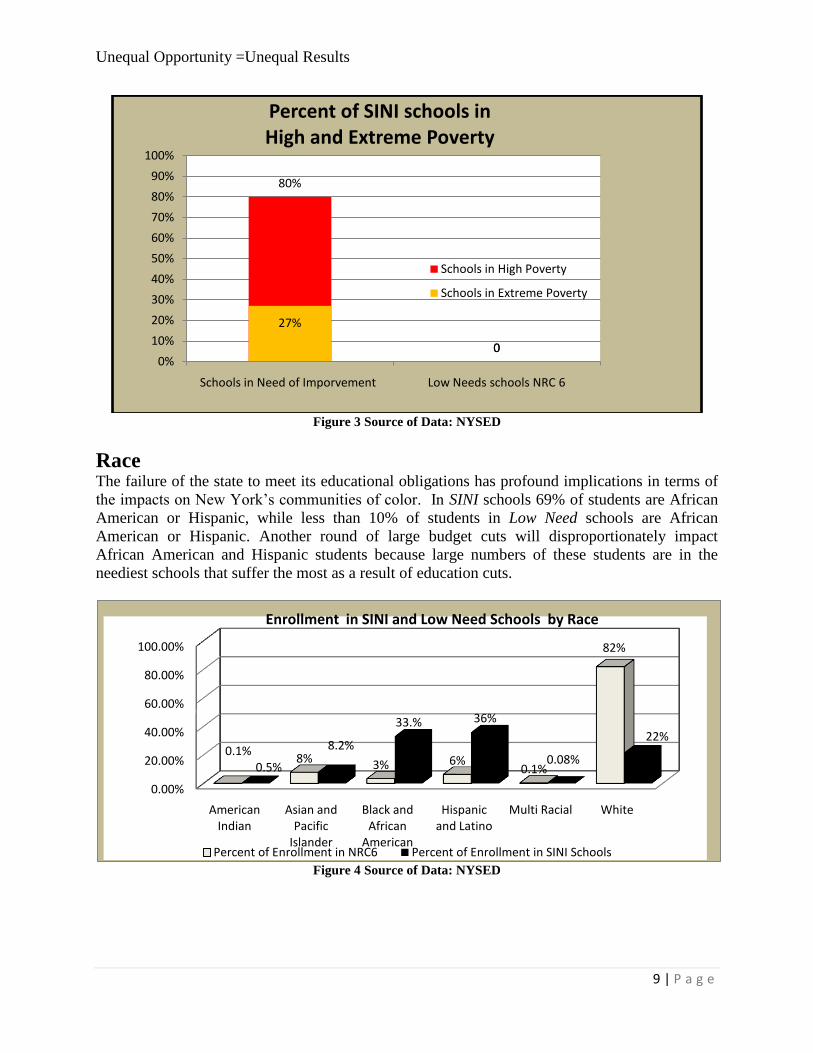
In addition, the vast majority of SINI schools are schools in high or extreme poverty.9 The UCLA
Civil Rights Project classifies schools that have 50% or more of their students in poverty as high
poverty schools; schools with 90% or more are considered to be extreme poverty. Twenty-seven
percent of SINI schools are in extreme poverty and 80% are high poverty. None of the Low Need
Schools are high poverty. (Figure 2, below).
Figure 2 Source of Data: NYSED
*Students in Poverty as measured by Free and Reduced-Price Lunch Percentage
9 The definition of high poverty and extreme poverty is based on the work of the UCLA (formerly
Harvard) Civil Rights Project. See Orfield, G. and C. Lee. 2005. “Why segregation matters: Poverty and
educational inequality.” Cambridge: Civil Rights Project, Harvard University.
6%
68%
NRC 6 SINI
Percent of Students in Poverty*
Unequal Opportunity =Unequal Results
9 | P a g e
Figure 3 Source of Data: NYSED
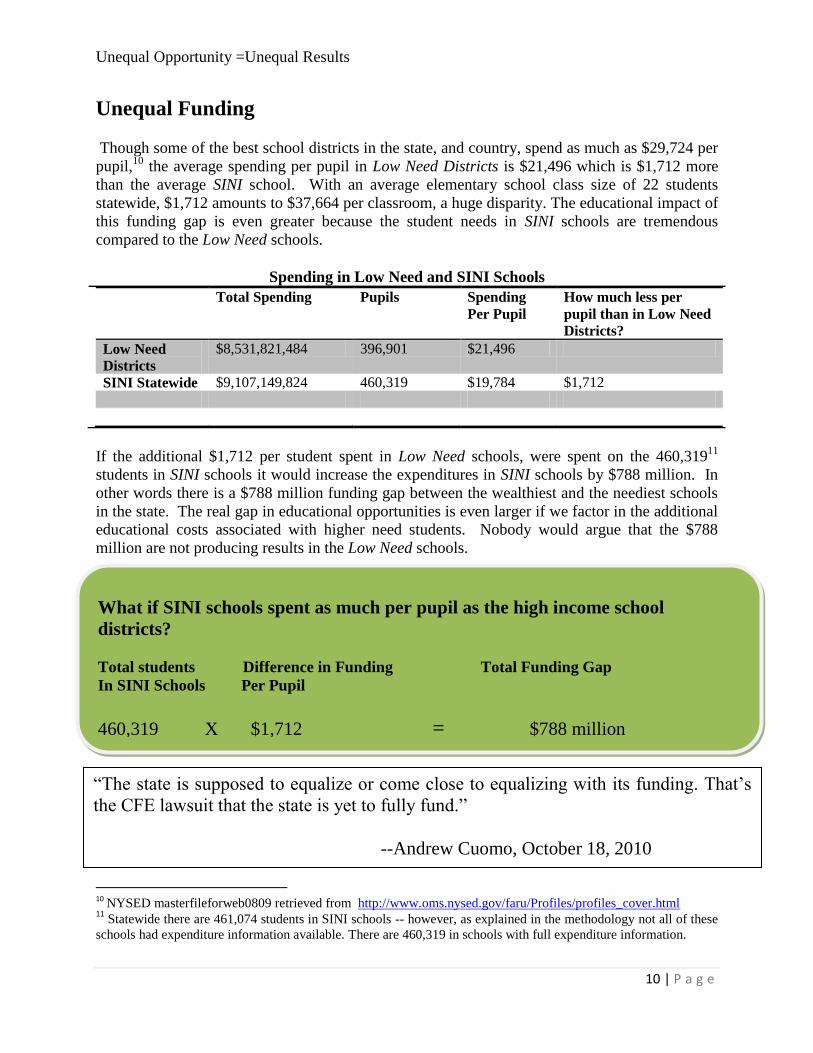
Race The failure of the state to meet its educational obligations has profound implications in terms of
the impacts on New York’s communities of color. In SINI schools 69% of students are African
American or Hispanic, while less than 10% of students in Low Need schools are African
American or Hispanic. Another round of large budget cuts will disproportionately impact
African American and Hispanic students because large numbers of these students are in the
neediest schools that suffer the most as a result of education cuts.
Figure 4 Source of Data: NYSED
80%
0
27%
00%
10%
20%
30%
40%
50%
60%
70%
80%
90%
100%
Schools in Need of Imporvement Low Needs schools NRC 6
Percent of SINI schools in High and Extreme Poverty
Schools in High Poverty
Schools in Extreme Poverty
0.00%
20.00%
40.00%
60.00%
80.00%
100.00%
American Indian
Asian and Pacific
Islander
Black and African
American
Hispanic and Latino
Multi Racial White
0.1%8% 3% 6%
0.1%
82%
0.5%
8.2%
33.% 36%
0.08%
22%
Enrollment in SINI and Low Need Schools by Race
Percent of Enrollment in NRC6 Percent of Enrollment in SINI Schools
Unequal Opportunity =Unequal Results
10 | P a g e
Unequal Funding
Though some of the best school districts in the state, and country, spend as much as $29,724 per
pupil,10
the average spending per pupil in Low Need Districts is $21,496 which is $1,712 more
than the average SINI school. With an average elementary school class size of 22 students
statewide, $1,712 amounts to $37,664 per classroom, a huge disparity. The educational impact of
this funding gap is even greater because the student needs in SINI schools are tremendous
compared to the Low Need schools.
Spending in Low Need and SINI Schools
Total Spending Pupils Spending
Per Pupil
How much less per
pupil than in Low Need
Districts?
Low Need
Districts
$8,531,821,484 396,901 $21,496
SINI Statewide $9,107,149,824 460,319 $19,784 $1,712
If the additional $1,712 per student spent in Low Need schools, were spent on the 460,31911
students in SINI schools it would increase the expenditures in SINI schools by $788 million. In
other words there is a $788 million funding gap between the wealthiest and the neediest schools
in the state. The real gap in educational opportunities is even larger if we factor in the additional
educational costs associated with higher need students. Nobody would argue that the $788
million are not producing results in the Low Need schools.
10
NYSED masterfileforweb0809 retrieved from http://www.oms.nysed.gov/faru/Profiles/profiles_cover.html 11
Statewide there are 461,074 students in SINI schools -- however, as explained in the methodology not all of these
schools had expenditure information available. There are 460,319 in schools with full expenditure information.
“The state is supposed to equalize or come close to equalizing with its funding. That’s
the CFE lawsuit that the state is yet to fully fund.”
--Andrew Cuomo, October 18, 2010
What if SINI schools spent as much per pupil as the high income school
districts?
Total students Difference in Funding Total Funding Gap
In SINI Schools Per Pupil
460,319 X $1,712 = $788 million
Unequal Opportunity =Unequal Results
11 | P a g e
The SINI schools, and other high need schools have not only faced cuts, as have all public
schools in the state, New York State has failed to meets its obligations under the CFE settlement
which was designed to raise the quality of education in high needs schools. In 2007 New York
State enacted a four-year commitment to increase foundation aid, the basic classroom operating
aid, by $5.5 billion by 2011. By this year New York State was to complete its phase-in of the
foundation formula, however, after two years of implementation there was one year of a freeze in
funding followed by a $1.4 billion cut.
Student Outcomes
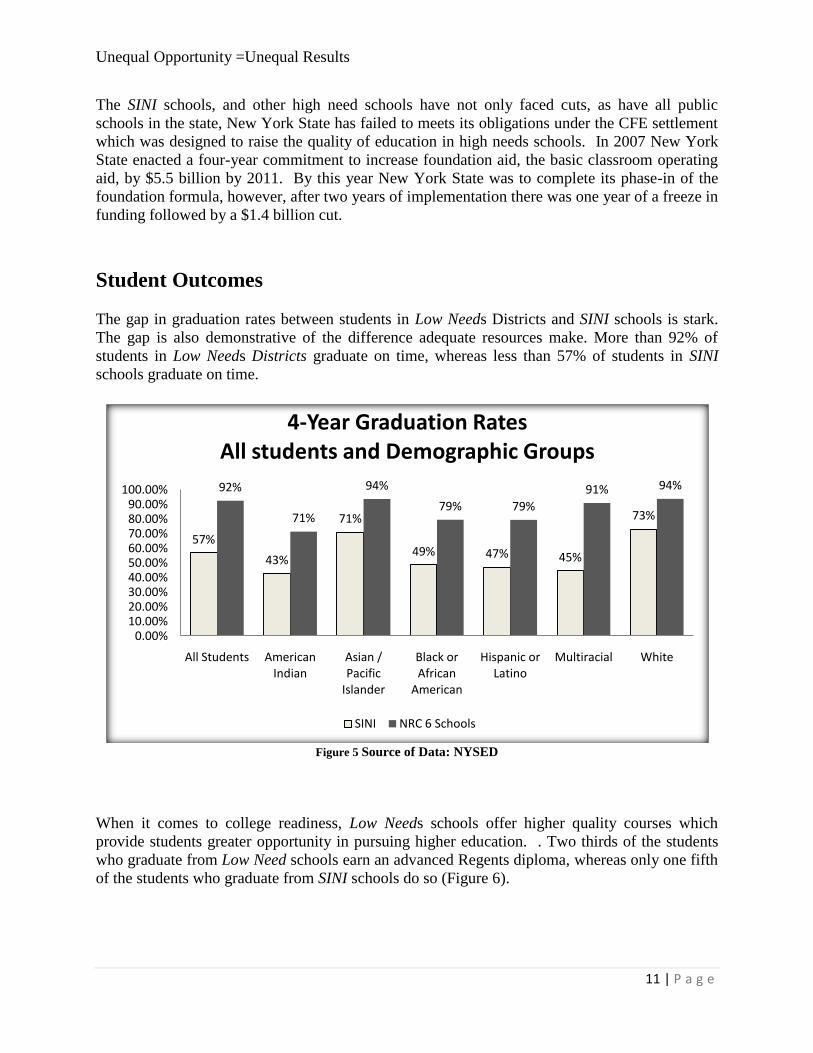
The gap in graduation rates between students in Low Needs Districts and SINI schools is stark.
The gap is also demonstrative of the difference adequate resources make. More than 92% of
students in Low Needs Districts graduate on time, whereas less than 57% of students in SINI
schools graduate on time.
Figure 5 Source of Data: NYSED
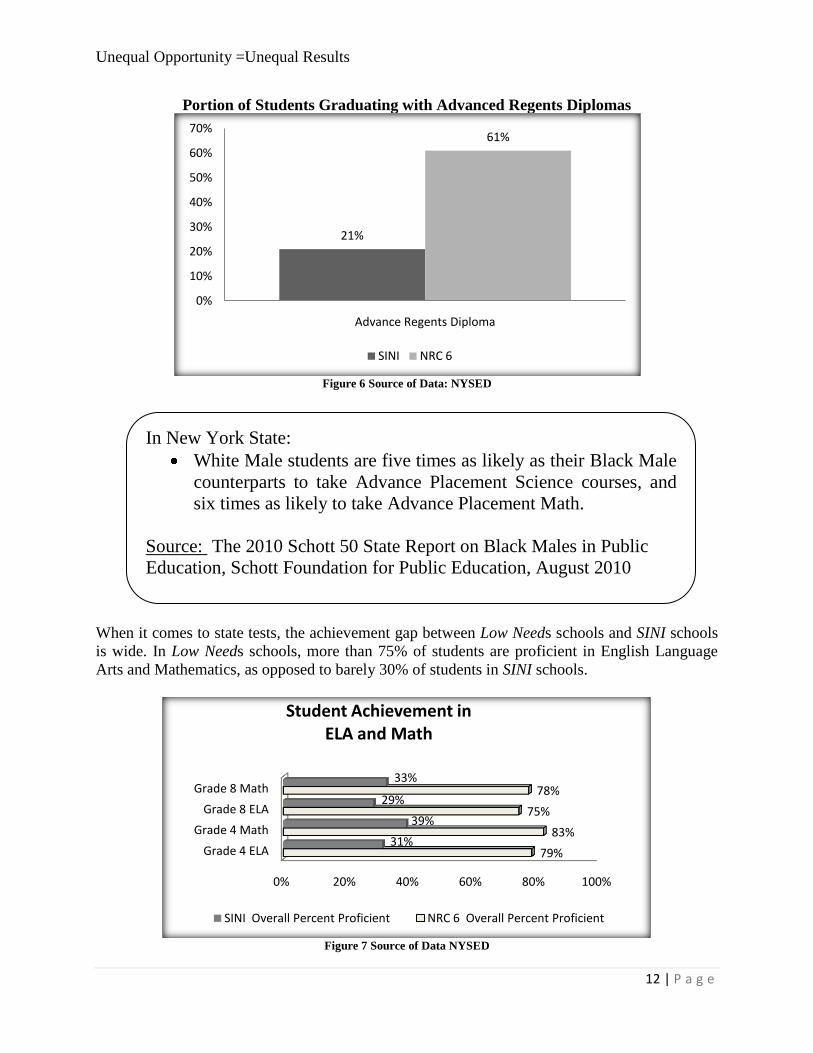
When it comes to college readiness, Low Needs schools offer higher quality courses which
provide students greater opportunity in pursuing higher education. . Two thirds of the students
who graduate from Low Need schools earn an advanced Regents diploma, whereas only one fifth
of the students who graduate from SINI schools do so (Figure 6).
57%
43%
71%
49% 47% 45%
73%
92%
71%
94%
79% 79%
91% 94%
0.00%10.00%20.00%30.00%40.00%50.00%60.00%70.00%80.00%90.00%
100.00%
All Students American Indian
Asian / Pacific
Islander
Black or African
American
Hispanic or Latino
Multiracial White
4-Year Graduation RatesAll students and Demographic Groups
SINI NRC 6 Schools
Unequal Opportunity =Unequal Results
12 | P a g e
Portion of Students Graduating with Advanced Regents Diplomas
Figure 6 Source of Data: NYSED
When it comes to state tests, the achievement gap between Low Needs schools and SINI schools
is wide. In Low Needs schools, more than 75% of students are proficient in English Language
Arts and Mathematics, as opposed to barely 30% of students in SINI schools.
Figure 7 Source of Data NYSED
21%
61%
0%
10%
20%
30%
40%
50%
60%
70%
Advance Regents Diploma
SINI NRC 6
0% 20% 40% 60% 80% 100%
Grade 4 ELA
Grade 4 Math
Grade 8 ELA
Grade 8 Math
79%
83%
75%
78%
31%
39%
29%
33%
Student Achievement in ELA and Math
SINI Overall Percent Proficient NRC 6 Overall Percent Proficient
In New York State:
White Male students are five times as likely as their Black Male
counterparts to take Advance Placement Science courses, and
six times as likely to take Advance Placement Math.
Source: The 2010 Schott 50 State Report on Black Males in Public
Education, Schott Foundation for Public Education, August 2010
Unequal Opportunity =Unequal Results
13 | P a g e
Long Term Consequences of Cuts in Educational Opportunity
The impacts of educational opportunities are not only measured in terms of test scores and
graduation rates. New York’s inequitable investments in public education and the inequitable
outcomes that result produce permanent inequities in our state and have long term economic
consequences for all of us.
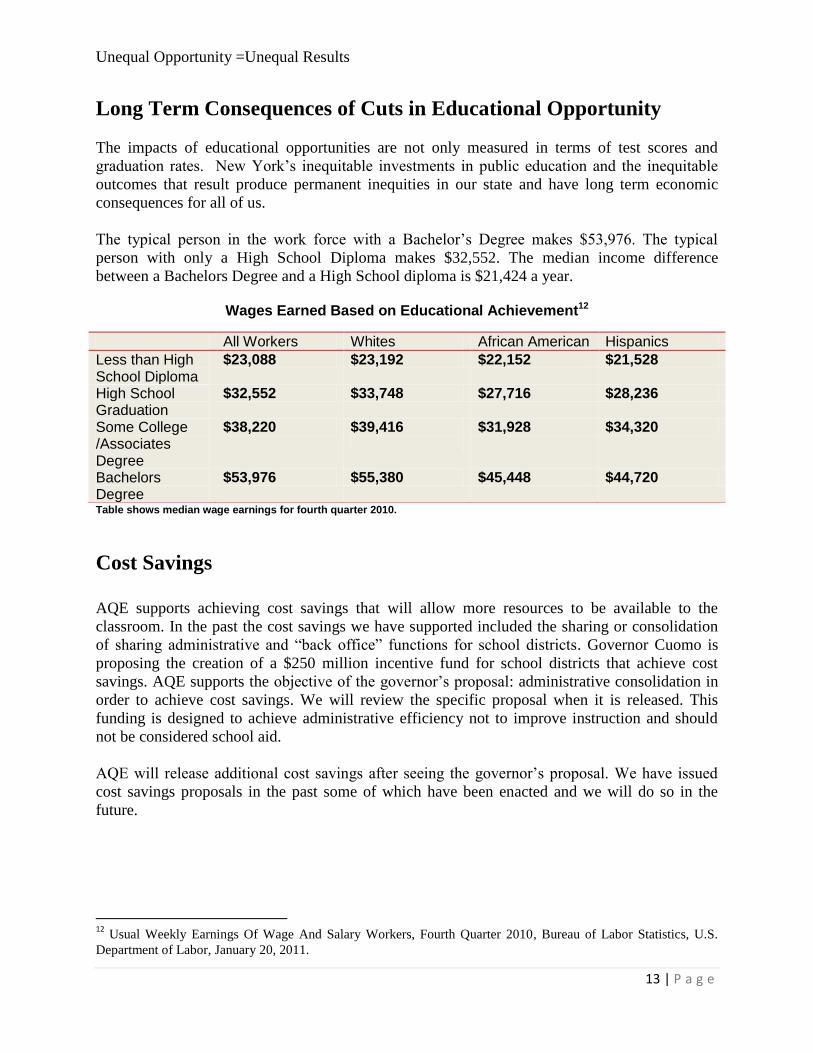
The typical person in the work force with a Bachelor’s Degree makes $53,976. The typical
person with only a High School Diploma makes $32,552. The median income difference
between a Bachelors Degree and a High School diploma is $21,424 a year.
Wages Earned Based on Educational Achievement12
Table shows median wage earnings for fourth quarter 2010.
Cost Savings
AQE supports achieving cost savings that will allow more resources to be available to the
classroom. In the past the cost savings we have supported included the sharing or consolidation
of sharing administrative and “back office” functions for school districts. Governor Cuomo is
proposing the creation of a $250 million incentive fund for school districts that achieve cost
savings. AQE supports the objective of the governor’s proposal: administrative consolidation in
order to achieve cost savings. We will review the specific proposal when it is released. This
funding is designed to achieve administrative efficiency not to improve instruction and should
not be considered school aid.
AQE will release additional cost savings after seeing the governor’s proposal. We have issued
cost savings proposals in the past some of which have been enacted and we will do so in the
future.
12
Usual Weekly Earnings Of Wage And Salary Workers, Fourth Quarter 2010, Bureau of Labor Statistics, U.S.
Department of Labor, January 20, 2011.
All Workers Whites African American Hispanics
Less than High School Diploma
$23,088 $23,192 $22,152 $21,528
High School Graduation
$32,552 $33,748 $27,716 $28,236
Some College /Associates Degree
$38,220 $39,416
$31,928 $34,320
Bachelors Degree
$53,976 $55,380 $45,448 $44,720
Unequal Opportunity =Unequal Results
14 | P a g e
School Improvement & Competitive Grants
The Governor will be proposing $250 million for school improvement. Invested properly $250
million can make an important contribution to improving educational opportunity, encouraging
effective innovation, reducing inequity and closing the funding and achievement gaps. The
governor’s objective is to award these grants in a way that prioritizes student performance. The
only details available so far are that the grants would be awarded on a competitive basis. Some
factors that should be considered in formulating the details of such a proposal:
There is no evidence that competitive grants improve student performance, this is an
experimental concept without a base of support in educational research.
Successfully competing for grants requires school districts to invest in highly-skilled
grant writers, an administrative expense many poor districts cannot afford. For this
reason, it is anticipated that needier schools and districts could be disadvantaged in such a
competition.
School improvement funding should prioritize investment in the highest need schools and
districts, rather than forcing districts to compete, which creates a system where some
students are winners and others are losers in their access to educational opportunity,
school improvement funding should prioritize investment in the highest need schools and
districts.
The CFE investments implemented in 2007 and 2008 showed progress in student
achievement. These investments should be evaluated and new investments should be
targeted to replicate the most successful practices.
The State Education Department should provide leadership to school districts regarding
best practices for school improvement and should guide local school districts in
developing and implementing effective plans for use of these funds to meet the specific
needs of their students.
In order to maximize improvement in educational outcomes these funds should be
targeted to research supported educational reforms that have been demonstrated to
improve student achievement.
This inception of this new funding stream should not result in an equivalent reduction in
school aid.
Research-Based Proven Educational Reforms
Research shows what is necessary for all schools and students to succeed. Adequate resources
and investment in best practices yield excellent results. The Alliance for Quality Education
proposes investment in the following proven-to-work areas:
1. Quality Teaching: Research has shown that effective teaching is developed over time,
with the appropriate supports such as mentoring programs, induction programs, an
opportunity for effective teachers to staff every school building and lead other teachers,
are all components of how to have quality teaching in every school regardless of location.
2. Extended and Expanded Learning Time: An increasingly large amount of research
shows that students benefit at many levels when they spend more time in school engaging
Unequal Opportunity =Unequal Results
15 | P a g e
in learning activities that provide additional help or enrichment opportunities. Extended
and Expanded Learning time is:
o Time for students to “go deep” in core academic subjects, including time for project-
based learning and hands-on activities;
o Time for students who need it to get specific, intensive remediation on subjects where
they’re struggling;
o Enrichment programs in dance, music, art, and drama;
o Outside partnerships, where students can work with local agencies, universities or
service-providers on a range of projects including college and career prep classes,
mentoring or tutoring, and more;
o Time for teachers to work and plan together to strengthen instruction.
3. Challenging Curriculum: Access to a challenging curriculum and the resources
necessary to be ready for college or a career: Students who have access to a school
culture that focuses on college and career—even in the early years, supports to teachers
so they continue to develop and provide students with the highest quality instruction, a
continuum of growth based on the alignment of curriculum and instruction at all levels, to
supports that provide ongoing motivation, and meaningful parent engagement, do better
than others who do not have access.
4. Community Schools: Research has consistently shown that community schools
contribute to increased student academic performance, lower drop-out rates, higher
attendance rates, fewer behavior problems and greater parent engagement than in schools
not organized as community schools.
5. Parent and Family Engagement: Putting and keeping parents at the decision making
table, not only enables the creation of education policy that is more receptive of students’
needs, but also is proven to sustain school improvement.
6. Access to High Quality Early Childhood Education Programs: Students who attend
high quality early childhood programs have consistently performed better at school,
graduated on time, went to college and graduated, have higher paying jobs, lead healthier
lives, and are more likely to be happier in their lives. Research study after research study
has illustrated and proven the benefits of high quality early childhood education. It is
time that we provide it for all students.
Unequal Opportunity =Unequal Results
16 | P a g e
APPENDIX
Methodology
Description of Data
The data used for this project is primarily derived from New York State Education Department's
2009 School Report Card database. The most recent year is the 2008-09 New York State School
Report Card Database from the NYSED Information and Reporting Services website available
at: http://www.p12.nysed.gov/irs/reportcard/. The data includes the school and district name,
unique codes, county, and Need Resource Category. The SRC database contained the following
for the 2009 school year: number and percentage of students in free and reduced priced lunch
programs, number and percent of students with Limited English Proficiency, number and
percentage of students who are American Indian, Black, Hispanic, Asian, White and Multiracial.
Available information also included student enrollment in each grade and the need resource
category -- "1" - NYC, "2" - Big 4, "3" - High Needs Urban/Suburban, "4" - High Needs Rural,
"5" - Average Needs Districts, and "6" - Low-Needs districts. AQE's focus of the report was a
subset of 532 schools on the state's Accountability list -- for this, we used the 2010-11
Accountability Information released from SED
http://www.p12.nysed.gov/irs/accountability/designations/home.html. The list of these schools
includes information such as what accountability level the school is at, and what subjects
triggered the accountability status. In the original data set, information for four schools on the
accountability list did not provide information on enrollment and demographics (Peace and
Diversity Academy of NYC, College Prep Business, College Prep Music, and College Prep Math
and Science of Long Island -- the College Prep schools did not have information on outcomes.
Performance Outcomes
The indicators of performance selected were statewide test results for: 4th and 8th grade ELA
and Math exams taken in 2010 -- this reflects the most updated information and New York's
alignment with new standards -- the data was from
http://www.p12.nysed.gov/irs/pressRelease/20100728/
For each grade level we included the number of students tested, and the percentage of students
performing at each grade level (1-4) to show proficiency rates. (A few schools did not have any
information for performance indicators, either because they did not have students tested in 4 or
8th grades, or did not graduate students -- including Woodside School in Peekskill, Haverstraw
Middle School in Haverstraw-Stony Point, and the College Prep schools mentioned above.)
For schools that are high schools or graduate students, we provided information available from
NYSED's 2009 School Report Card Access database. We have included information from the
2005 cohort and the 2009 graduating class to get the best view of on-time graduation rates for
different student demographic groups in these schools.
The 2009 Graduating Class information includes, for all students, the number of high school
graduates, the number and percentage of students attaining a Regents Diploma, Advanced
Regents Diploma, IEP Diploma. The 2009 Graduating Class is an end of the year audit of which
students graduate. The 2005 Cohort information reflects the student count at the beginning of
the high school career. Information available from SRC includes the number of students in the
cohort, the number and percent of graduates with diplomas, IEP Diplomas, GED transfers,
Unequal Opportunity =Unequal Results
17 | P a g e
students still enrolled, and students who drop out. This information is available aggregated for all
students and for demographic groups -- American Indian, Asian, Black, Latino, Multiracial,
White, Economically Disadvantaged, and Limited English Proficient.
Because SED does not disclose personally identifying information for students in groups where
there are less than 5, we have excluded these student counts as well. This gave us a more
accurate estimate of student performance, although a smaller sample size.
We lined the information with the school and all related outcome data in rows to facilitate sorting
and arranging data.
Low Need School Districts
New York State has 133 school districts that fall under the NRC 6 category. A significant
number of these school districts are feeder districts or do not graduate high school students --
additionally, two school districts' high schools do not separate diplomas (Bryham Hills and
Bronxville) so they were removed from the count as well. We compared information from the
2005 cohort and the 2009 graduating class to estimate the on-time graduation rates for different
student demographic groups. We did this by calculating the graduating class of 2009 and
multiplying that by the 2005 Cohort outcomes by race for the NRC 6 and the 532 schools
separately to compare overall outcomes. SED protects students confidentiality and does not
release personally identifying information for sub-groups smaller than 5. Therefore, we removed
these students from the overall count to better calculate the types of diplomas and on-time
diploma attainment rates.
Expenditure Calculations
The Expenditure data was derived from the NYSED Fiscal Analysis and Research Unit (FARU)
department, using the most up-to-date expenditure information (2008-09) available online at:
http://www.oms.nysed.gov/faru/Profiles/profiles_cover.html
The expenditure figure is the 2008-09 total expenditure per pupil in the school district in which
the particular school is located. Figures for spending per pupil were not available at the school
level. This expenditure data set is from SED, and is not adjusted for poverty or any student need
level.
Each school district that had one of the 532 schools on the Accountability list was counted only
once to determine the average expenditures. There are 86 school districts that have schools on
the accountability list -- however, a number of these school districts did not have information
about the expenditures (Little Flower, George Junior Republic, Mount Pleasant-Cottage,
Greenburg Eleven, and Abbott School District), therefore the total expenditures and pupil counts
in these districts were excluded from the average expenditure calculations. We calculated the
average spending per pupil in the NRC 6 districts by calculating the total spending by total
number of pupils. Then we calculated the average spending in districts with the 532 schools by
calculating the total expenditures and dividing by the total pupil count in the schools (where each
district was counted one time.) Where expenditures were not available, we did not include the
student count -- this led to a student count of 460,319 rather than the actual count of 461,074. We
Unequal Opportunity =Unequal Results
18 | P a g e
calculated the total average, New York City's average, and then removed NYC to get the Rest of
State total.