TOTAL LIPIDS, LIPID CLASSES, AND FATTY ACIDS OF NEWLY SETTLED RED KING
CRAB (PARALITHODES CAMTSCHATICUS): COMPARISON
OF HATCHERY-CULTURED AND WILD CRABS
LOUISE A. COPEMAN,1* ALLAN W. STONER,
2MICHELE L. OTTMAR,
2
BENJAMIN DALY,3CHRISTOPHER C. PARRISH,
4AND GINNY L. ECKERT
5
1Cooperative Institute for Marine Resources Studies, Oregon State University, Hatfield Marine ScienceCenter, 2030 S.E. Marine Science Drive, Newport OR, USA 97365; 2Fisheries Behavioral EcologyProgram, Alaska Fisheries Science Center, National Marine Fisheries Service, National Oceanic andAtmospheric Administration, 2030 S.E. Marine Science Drive, Newport OR, USA 97365; 3School ofFisheries and Ocean Sciences, University of Alaska Fairbanks, 201 Railway Avenue, Seward AK, USA99664; 4Ocean Sciences Centre,Memorial University of Newfoundland, Logy Bay NL, Canada A1C 5S7;5Juneau Center, School for Fisheries and Ocean Sciences, University of Alaska Fairbanks, 17101 PointLena Loop Road, 11305 Glacier Hwy, Juneau AK, USA 99801
ABSTRACT Little is known about the nutrition or lipid metabolism of cold-water crabs, particularly in the North Pacific.
We undertook a 2-part study to understand more completely the energetics and nutritional requirements of juvenile red king
crab (RKC; Paralithodes camtschaticus). First, we investigated changes in proximate composition, total lipids (TLs), lipid
classes, and fatty acids (FAs) throughout a molt cycle (C4–C5). Trends in lipid parameters were described by a 3-part piecewise
linear regression with 3 distinct stages: (1) a postmolt phase (;0–7 days), (2) an intramolt stage (;7–24 days), and (3) a premolt
stage (;24–33 days). Significant intramolt differences in TLs indicated that caution should be taken when comparing crabs of
unknown molt stage in future aquaculture and ecological experiments. However, little variability was found in the
proportional FA composition of crabs, indicating that the intramolt stage has little effect on the interpretation of FA
biomarkers. During a second investigation, we examined differences in lipid classes and FAs from cultured and wild RKC.
We found significantly higher proportions of the essential fatty acids (EFAs) 20:5n-3 (EPA) and 20:4n-6 (AA) in wild
crabs compared with cultured animals at the same stage. Furthermore, higher proportions of bacterial markers and lower
proportions of zooplankton FA markers were found in wild than in hatchery-reared crabs. Here, we provide the first baseline
data for future dietary studies on juvenile cold-water crabs. We suggest that an initial EFA ratio for DHA:EPA:AA of 5:8:1
could be used as a starting point for controlled dietary studies on the effect of EFAs on juvenile growth, molt success, and
survival.
KEY WORDS: lipids, fatty acids, nutrition, molt, red king crab, Paralithodes camtschaticus
INTRODUCTION
Lipids are important biochemical components of marine
food webs because they are carbon rich and provide a concen-trated source of energy (Parrish 1988). Marine lipids are nowexamined routinely as biomarkers in ecological studies, as
essential nutrients in aquaculture growth trials, and as tools tounderstand large-scale oceanographic processes (Budge et al.2006, Litzow et al. 2006). Marine lipids are also vital nutrientsfor human health, and declines in seafood stocks (FAO 2010)
are currently threatening food security for human populationson a global scale (Parrish et al. 2008).
Lipids and fatty acids are important to the survival and
condition of numerous cultured cold-water marine fish andinvertebrates (Couteau et al. 1996, Sargent et al. 1999).Specifically, lipids are a source of energy in juvenile and larval
crustaceans (Kattner et al. 2003), and are crucial to elevatedgrowth and molting success (Wen et al. 2006). The major lipidclasses that affect condition in crustaceans are triacylglycerols
(TAGs), sterols (STs), and phospholipids (Ouellet & Taggart1992). Specifically, the ratios of different lipid classes withinlarvae (TAG/ST) have been used previously to indicate
condition in a number of finfish and crustaceans (Fraser1989, Harding & Fraser 1999, Copeman et al. 2002, Copemanet al. 2008).
Certain dietary lipids are essential to larval crustaceans forgrowth, development, and survival. Dietary essential lipidscannot be synthesized in adequate amounts de novo within ananimal from dietary precursors and are rarely found in ade-
quate levels in commercially available feeds (Figueiredo et al.2009). In particular, polyunsaturated fatty acids (PUFAs) havebeen investigated extensively in marine larval nutrition (Sargent
et al. 1999), and highly unsaturated long-chain PUFAs such asdocosahexaenoic acid (DHA; 22:6n-3), eicosapentaenoic acid(EPA; 20:5n-3), and arachidonic acid (AA; 20:4n-6) are essential
for many crustaceans (Merican & Shim 1996, Suprayudi et al.2004, Zmora et al. 2005, Limbourn&Nichols 2009,Mercier et al.2009).
In Alaska, red king crab (RKC; Paralithodes camtschaticus)
stock collapses during the 1980s resulted in the closure of mostRKC fisheries (Zheng & Kruse 2000), which remain closeddespite decades of fishing moratoriums (Alaska Department
of Fish and Game 2010). Stock enhancement has the potentialto be an effective population recovery tool for depleted RKCstocks, and is currently underway for other crab and lobster
species in the United States and worldwide (Stevens 2006,Hamasaki & Kitada 2008). Members of the Alaska King Crab
*Corresponding author. E-mail: [email protected]
DOI: 10.2983/035.031.0119
Journal of Shellfish Research, Vol. 31, No. 1, 153–165, 2012.
153
Research and Rehabilitation and Biology (or AKCRRAB)Program have been conducting large-scale king crab aquacul-
ture for the past 5 y to evaluate the potential to enhance wildstocks by releasing juveniles into the wild (Daly 2010). Thedevelopment of large-scale hatchery production technology hasallowed formass production of juvenile RKCs (Daly et al. 2009,
Swingle et al. unpublished), which consists of 3 steps: (1)larval rearing (zoeae 1–4), (2) postlarval rearing (glaucothoe),and (3) juvenile rearing. However, despite recent production
success, the transition from nonfeeding glaucothoe to the first-feeding C1 juvenile stage is still a major source of mortality inhatchery production (Daly et al. 2009).
After molting (postmolt stage), crabs are pale and softbodied, but within a few hours their cuticle hardens anddarkens. During molt (ecdysis), crabs experience growth bysequential steps, because growth is otherwise constrained by
their rigid exoskeleton (Sanchez-Paz et al. 2006). The processof molting from larvae to glaucothoe to sequential juvenilestages is likely a stressful period, as crabs undergo significant
morphological and physiological changes (O’Halloran &O’Dor 1988). The nutritional requirements to complete a moltcycle successfully are significant (Lautier & Lagarrigue 1987),
yet they have not been documented for juvenile RKC. In-adequate endogenous energy reserves in nonfeeding moltingcrabs are hypothesized to be a major source of ‘‘molt death’’ in
small juvenile crabs (Holme et al. 2007). However, very little iscurrently known about how lipid storage fluctuates withina molt cycle for RKC juveniles. As with other shrimp and crabspecies, we predict that juvenile RKCs will show 3 phases of
lipid accumulation during each molt cycle. First, we predictthat RKCs will have no increase in lipids during the nonfeedingperiod just subsequent to molt (postmolt phase); second, RKCs
will accumulate lipids rapidly during themajor feeding period inthe center of their growth cycle (intramolt phase); and last,RKC will show a decrease in lipids during a nonfeeding period
just preceding molt (premolt phase) (Ouellet & Taggart 1992,Zhou et al. 1998).
Inadequate dietary essential fatty acids (EFAs) may explainhigh levels of molt mortality observed in the hatchery at
the larval and juvenile stages (Leroux per. comm.). ‘‘NatureKnows Best’’ has often been used as a starting point in thedevelopment of hatchery nutritional protocols for new culture
species (Sargent 1995, Sargent et al. 1999); however, no explicitcomparison has been conducted to investigate the differencesin lipids between hatchery-cultured and wild-source RKCs.
Hatchery-reared crabs likely have different proportions ofEFAs than wild juveniles. Understanding these insufficiencies/differences could help crab culturists improve enrichment
protocols for live-food organisms currently used to cultureRKC (Calcagno et al. 2005, Epelbaum & Kovatcheva 2005,Stevens 2006).
The purpose of this study is to improve our understanding of
nutritional requirements of juvenile RKC. Here we investigate(1) variation in weight, lipid classes, and fatty acids in hatchery-reared crabs throughout an entire molt cycle (C4–C5); and (2)
differences in lipid classes and fatty acids between hatchery-reared and wild-caught juvenile crabs for 5 different molt sizes.These data are pertinent to both fisheries ecology and aquacul-
ture, because they will support the interpretation of wild-collectedcrab condition indices as well as the development of diets forhatchery-reared juvenile crabs.
METHODS
Experiment 1: Intramolt Lipid Cycle of RKC Juveniles (C4–C5)
Source of RKCs and Crab Culture
RKCs were supplied by the Alutiiq Pride Shellfish Hatcheryin Seward, AK, as described previously in Daly et al. (2009).
Briefly, female broodstock were collected in Bristol Bay, AK,during fall 2008, and were maintained at the hatchery onchopped herring and squid until their larvae were released in
May 2009. Larvae from 12 females were mixed and reared in1,200-L cylindrical tanks until the first juvenile instar (C1) wasachieved (as in Daly et al. (2009)). Newly settled crabs were feddaily with Artemia nauplii enriched with DC (disinfecting con-
tinuously) DHA Selco enrichment media.Stage C1 crabs were shipped to the Hatfield Marine Science
Center (Newport, OR) onMay 27, 2009. On arrival, crabs were
sorted by size to achieve a C1 size class that had bright-red colorand high activity levels, indicative of good health (Eckert, pers.comm.). Individuals meeting these criteria were placed in
a batch culture tank set at ;4.5�C. A total of 40 C1 crabs washeld in a rectangular polyethylene tank (42 cmwide, 63 cm long,30 cm deep) supplied with a continuous flow (35 mL/sec) of
sand-filtered (50-mm particle size) seawater. The tank contained5 L structural habitat, including loose bundles of BioFill filtermaterial (PVC ribbon; Aquatic Eco-Systems, Orlando, FL) andblack polypropylene gill netting. The structure provided refuge
for molting crabs, which are vulnerable to cannibalism (Stoneret al. 2010a). Crabs were monitored for growth and survivalduring their first 2 molts as part of a companion experiment
examining the effects of temperature on molting, growth, andlipid composition in juvenile RKCs (Stoner et al. 2010b).
After juvenile RKCs hadmolted to the C3 size class, 36 crabs
were transferred to a second type of culture system thatconsisted of individual culture cells made from stiff mesh tubingcut to 17.5 cm high (for further details, see Stoner et al. (2010b)).Initially, individual RKCs were placed in cells held at 4.5�C,and the temperature was gradually increased to 8.0�C duringa 48-h period. The use of individual cells allowed us to monitorthe molting schedule of individual crabs. We first monitored the
day at which crabs molted from C3 to C4. Then, crabs weresampled at predetermined days throughout the entire C4 stageso that representative samples were collected throughout the
entire 33 days between C4 and C5. Three crabs died during theexperiment, leaving 16 crabs for lipid analysis and 17 crabs fordry weight and ash weight analysis.
Morphometrics
All 33 live crabs were measured for carapace width (CW;in millimeters) and wet weight (WWT; in milligrams). CW was
measured from digital photographs using a dissecting micro-scope equipped with a calibrated digital camera and Image Prosoftware. We measured CW, as defined by Epelbaum et al.
(2006), without lateral spines. WWT measurements on allindividual crabs were made to the nearest 1.0 mg, whereas dryweight (DWT) measurements on 17 individual crabs were madeto the nearest 1.0 mg using a microbalance (Sartorius R16OP).
Crabs were first rinsed in 3% ammonium formate solution toremove excess salt before being transferred to a 5.0-cm2
preweighed aluminum foils and placed in an oven set at 70�Cfor 48 h. Foils were removed from the oven and then stored in
COPEMAN ET AL.154
a desiccator and reweighed within 1 h. Ash weights weremeasured similarly after drying in a muffle furnace for 12 h at
450�C. DWTs were calculated by subtracting the weight ofthe preweighed foils, whereas organic weights were calculatedby subtracting the ash weight from the previously calculatedDWTs.
Lipid Classes
Sixteen crabs ranging from C4 (day 0 postmolt) to C5 (day
0 postmolt) and from;40–60 mgWWT each were sampled forlipid class analyses. Lipids were extracted in chloroform/methanol according to Parrish (1987) using a modified Folch
procedure (Folch et al. 1957). Lipid classes were determinedusing thin-layer chromatography with flame ionization detec-tion with a MARK VI Iatroscan (Iatron Laboratories, Tokyo,Japan) as described by Parrish (1987). Extracts were spotted on
silica gel-coated Chromarods and a 3-stage development systemwas used to separate lipid classes. The first separations con-sisted of 25-min and 20-min developments in 98.95:1:0.05
hexane:diethyl ether:formic acid. The second separation con-sisted of a 40-min development in 79:20:1 hexane:diethyl ether:formic acid. The last separation consisted of 15-min develop-
ments in 100% acetone followed by 10-min developments in5:4:1 chloroform:methanol:water. Data peaks were integratedusing Peak Simple software (version 3.67; SRI Inc.), and the
signal (detected inmillivolts) was quantified using lipid standards(Sigma, St. Louis, MO). Lipid classes were expressed both inrelative (milligrams per gram WWT) and absolute (micro-grams per animal) amounts.
Fatty Acids
Total lipids extracts were then analyzed for fatty acid
composition. Fatty acid methyl esters (FAMEs) were preparedby transesterification with 14% boron trifluoride (BF3) inmethanol at 85�C for 90 min (Budge 1999, Morrison & Smith
1964). The average Iatroscan–determined derivatization effi-ciency for marine samples is ;85%. FAMEs were analyzed onan HP 6890 gas chromatograph with flame ionization detec-tion equipped with a 7683 autosampler and a ZB wax + gas
chromatography column (Phenomenex). The column was 30 min length, with an internal diameter of 0.32 mm and a 0.25-mmfilm. The oven temperature began at 65�C for 0.5 min and then
the temperature was increased to 195�C (40�C/min), held for 15minmore, then increased again (2�C/min) to a final temperatureof 220�C. Final temperature was held for 3.25 min. The carrier
gas was hydrogen, flowing at a rate of 2 mL/min. Injectortemperature started at 150�C and increased (200�C/min) toa final temperature of 250�C. The detector temperature was
constant at 260�C. Peaks were identified using retention timesbased on standards purchased from Supelco (37-componentFAME, BAME, PUFA 1, PUFA 3). Chromatograms wereintegrated using Galaxie Chromatography Data System (ver-
sion 1.9.3.2; Varian).
Statistics
We used SigmaStat 10 to fit nonlinear piecewise regressionfunctions to describe the relationship between RKC molt stage(36 days, independent variable) and dependent weight and lipid
measures. This regression allows multiline fit equations to bedefined over different independent variable (x) intervals. Weexpected to see 3 intervals: (1) a nonfeeding postmolt period, (2)
a feeding intramolt period, and (3) a nonfeeding premolt asdescribed previously in RKC (Zhou et al. 1998) and shrimp
(Ouellet & Taggart 1992). The equations used in the piecewise,3-segment regressions are
Interval 1 lipid or weight parameter; yð Þ¼ y1 T1 � tð Þ + y2 t � t1ð Þðf g= T1 � t1ð Þ; t1 < t < T1
Interval 2 lipid or weight parameter;yð Þ¼ y2 T2 � tð Þ + y3 t � T1ð Þðf g= T2 � T1ð Þ; T1 < t < T2
Interval 3 lipid or weight parameter; yð Þ¼ y3 t3 � tð Þ + y4 t � T2ð Þðf g= t3 � T2ð Þ; T2 < t < t3
where t1 is day 0, t is days, t3 is day at the end of the experiment(33), T1 is the calculated time at the end of the first segment
(nonfeeding postmolt period), T2 is the calculated time at theend of the second segment (feeding intramolt period), y1 is lipidor weight parameter at t1,(time 0), y2 is lipid or weight parameter
at T1,(calculated), y3 is lipid or weight parameter at T2,(calculated) ,and y4 is lipid or weight parameter at t3,(end of the experiment day 33).
We report the r2 values (proportion of variability in a data
set that is accounted for by the statistical model) as well asthe significant break points in the relationship (T1, T2, t values,P < 0.05).
Experiment 2: Comparison of Lipid Classes and Fatty Acids of Hatchery
and Wild Juvenile RKCs
Hatchery-Cultured Crabs
Twenty ovigerous females were captured with baited pots inBristol Bay, AK, during November 2009 and brought to theAlutiiq Pride Shellfish Hatchery in Seward, AK (see experiment
1 for husbandry of broodstock and larvae).Recently settled juvenile (C1) crabs were collected from
larval rearing tanks, mixed randomly, and mass reared in two2,000-L cylindrical nursery tanks for 67 days. The tanks were
flow-through at approximately 10 L/min. Average culturetemperature was 9�C and ranged from 8–12�C. Artificialseaweed was added to the nursery tanks to reduce agonistic
interactions among conspecifics. A rich food variety was used inan attempt to provide crabs with all possible essential nutrients.Crabs were fed commercially available feeds including Cyclop-
eeze (Argent Chemical Laboratories, WA), Otohime B1 and B2fish feed (Reed Mericulture, CA), frozen and enriched Artemianauplii, and Zeigler (Zeigler Bros., Inc., PA) shrimp feed, whichhave been used to culture juvenile RKCs successfully (Daly
et al. 2009). Cyclop-eeze is a frozen whole-adult copepod (;800mm in length) that is high in carotenoids and omega-3 highlyunsaturated fatty acids. Otohime B is a high-protein shrimp diet
consisting of 200–360-mm micropellets (B1) and 360–620-mmmicropellets (B2). Newly hatched San Francisco Bay strainArtemia nauplii (;400 mm in length) have high levels of lipids
and C18 unsaturated fatty acids (Tizol-Correa et al. 2006). TheSan Francisco Bay strain Artemia nauplii were enriched withDC DHA Selco enrichment media for 24 h to enhance their
nutritional quality. The enriched Artemia nauplii (;750 mm)were frozen, which caused them to sink to be available for crabconsumption. Zeigler PL Redi-Reserve commercial shrimp feed
IMPORTANCE OF LIPIDS DURING EARLY DEVELOPMENT OF RED KING CRAB 155
consists of 400–600-mm particles and is commonly used incrustacean aquaculture because of its high levels of highly
unsaturated fatty acids (Meade & Watts 1995). One feed typewas administered daily. Crabs were fed approximately 2%bodyweight (DWT) daily.
Specimens for lipid analyses were collected arbitrarily from
culture tanks and were held in clear water for 24 h to depurate.They were size sorted according to molt stage into C1, C2, C3,and age-1 juvenile stages. The number of animals per sample
was greater for smaller molt stages than larger molt stages—C1(5 animals), C2 (4 animals), C3 (3 animals), and age 1 (1animal)—so that each lipid sample had amass greater than 5mg
WWT. This ensured that adequate material was available forboth lipid class and fatty acid analyses. Crabs were frozenimmediately at –20�C, and were shipped on dry ice to Newport,OR, to be extracted within 3 mo of the original sample date.
Wild Crab Collections
Recently settled RKCs were captured from Auke Bay(58�22#N, 134�40#W), a small embayment in southeast Alaska
located approximately 20 km north of Juneau, during summer2010 using larval settlement collectors. The artificial collectorshave an outer skin of tubular plastic netting stuffed withconditioned gill net and have been used successfully to collect
passively young-of-year RKCs in Alaska (Blau & Byersdorfer1994). The collectors were deployed in May 2010 by diversalong a 6-m depth contour. Collectors were attached to a 30-m
ground line anchored at both ends. Along the ground line, thecollectors were spaced 2 m apart. The collectors were retrievedin July 2010, and crabs were held in the laboratory for 24 h to
depurate. They were then size sorted according to molt stage,C2–C4 as well as age-1 crabs based on known growth curves
(Stoner et al. 2010b). No wild C1 crabs were recovered from theartificial collectors. Crabs were then frozen at –20�C and later
shipped to Newport, OR, on dry ice. Measurements of size,weight, lipid classes, and fatty acids are identical to thosedescribed earlier for experiment 1.
Statistical Comparison of Wild and Cultured Crabs
Cultured and wild crabs from molt stages 2, 3, and 10 werecompared using 2-wayANOVA to examine the effect of sources(cultured or wild) and molt stage on RKC lipid content
(SYSTAT 12 for Windows). However, there was, in general,a significant interaction between molt stage and culture type(F2,24 ¼ 12.9, P < 0.001). Therefore, we used standard 2-samplet-tests to compare select lipid components between wild and
cultured animals within a given molt stage. To avoid Type 1error, our P values were Bonferroni corrected based on thenumber of lipid comparisons (n) made within each molt stage.
Significance was set at a ¼ 0.05/n, which resulted in a ¼ 0.005for lipid class analyses and a ¼ 0.006 for fatty acid analyses.
Principal component analysis (PCA) was used to simplify
multivariate fatty acid and lipid class data by transformingcorrelated variables into a set of uncorrelated principal com-ponents (Minitab, version 15 (Meglen 1992)). This techniquewas used using 9 highly discriminatory fatty acid variables from
wild and cultured juvenile RKCs, at 5 developmental stages.The first 2 principal components (PC1 and PC2) accounted for87% of the variance among samples, which allowed a display of
the major trends within the data set without significant loss ofthe total original variation. PCA fatty acid loading coefficientsare defined as the correlation coefficients between the original
fatty acid variable and the PCA axis. PCA scores are defined asthe position of the sample along the new PCA axis (Meglen
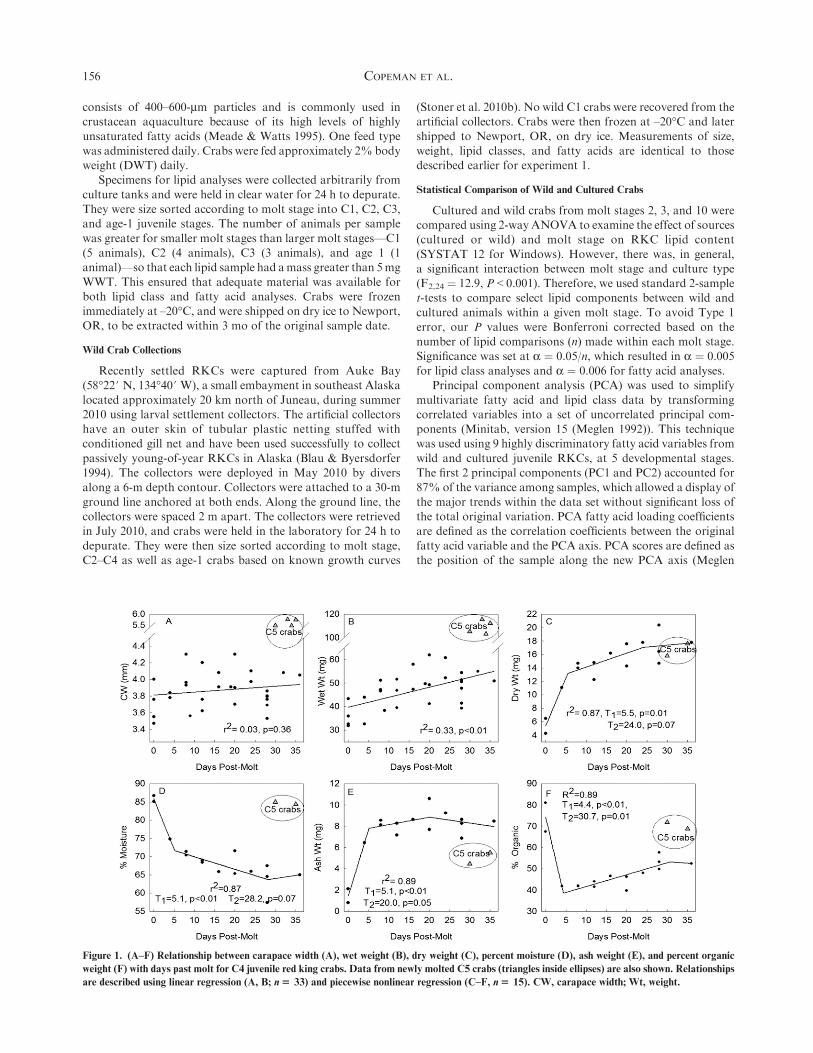
Figure 1. (A–F) Relationship between carapace width (A), wet weight (B), dry weight (C), percent moisture (D), ash weight (E), and percent organic
weight (F) with days past molt for C4 juvenile red king crabs. Data from newly molted C5 crabs (triangles inside ellipses) are also shown. Relationships
are described using linear regression (A, B; n$ 33) and piecewise nonlinear regression (C–F, n$ 15). CW, carapace width; Wt, weight.
COPEMAN ET AL.156
1992). Fatty acids were chosen based on biological significanceand the degree of variance explained by a given fatty acid.
RESULTS
Experiment 1: Intramolt Lipid Cycle of RKC Juveniles (C4–C5)
CW andWWT did not vary significantly (r2 ¼ 0.03 and r2 ¼0.33, respectively) with days past C4 molt (Fig. 1A, B). There
was a dramatic increase in both CW andWWT from the C4–C5molt stage. Average CWwas 3.9 ± 0.2 mm in C4 crabs and 5.6 ±0.2 mm in C5 crabs, whereas the average WWT was 46.6 ± 8.1
mg in C4s and 108.9 ± 5.8 mg in C5s. Average DWT wasdescribed by a 3-part piecewise regression (r2 ¼ 0.87) withsignificant breaks in the relationship atT1¼ 5.5 day andT2¼ 24days. DWT increased rapidly during the first 5 days, from a low
of;5 mg at day 0 to;13 mg at day 5. During the middle of themolt cycle, DWT continued to increase, but at a slower rate,increasing from ;13 mg at day 5 to ;17 mg at day 24. During
premolt, days 24–32, there was little change in the DWT of theRKCs (Fig. 1C). The percentage moisture in RKCs showed anopposite trend to DWT; however, it was also well described by
a 3-part piecewise regression (r2 ¼ 0.87) with significant breaksin the relationship at T1 ¼ 5.1 days and T2 ¼ 28.2 days. RKCjuveniles showed a high level of water content just after molting,
with ;85% moisture that decreased rapidly until day 5, whenRKCs had ;72% water (Fig. 1D). From day 5–day 28, thelevels of moisture continued to decrease, but more gradually, toa low of ;64% at day 28. Ash weight mimicked the trends for
DWT (r2 ¼ 0.89, T1 ¼ 5.1 days, T2 ¼ 20 days), whereas percentorganic matter showed the opposite trend. There was a signif-icant decrease from 75% of the dry mass as organic material at
day 0 to ;37% at day 4 (r2 ¼ 0.89, T1 ¼ 4.4 days, T2 ¼ 30.7days). The values for 2 newly molted C5s are shown to agreewell with values for newly molted C4 RKCs for both percentage
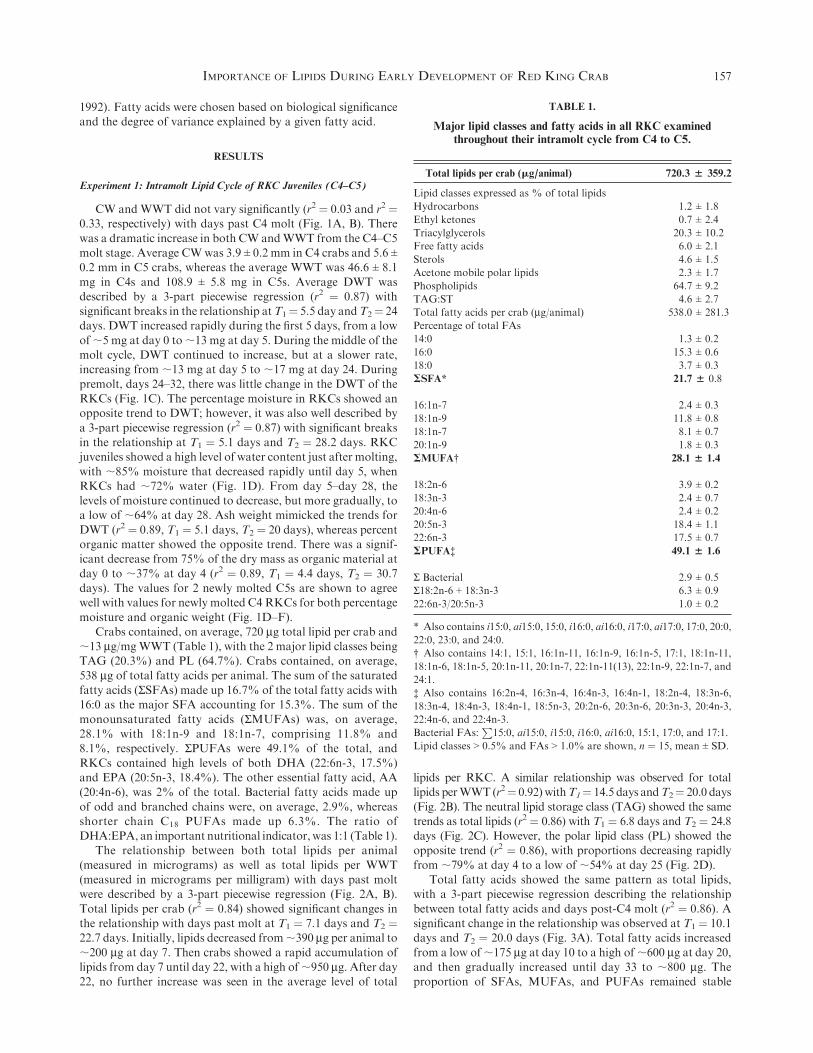
moisture and organic weight (Fig. 1D–F).Crabs contained, on average, 720 mg total lipid per crab and
;13 mg/mgWWT (Table 1), with the 2 major lipid classes beingTAG (20.3%) and PL (64.7%). Crabs contained, on average,
538 mg of total fatty acids per animal. The sum of the saturatedfatty acids (SSFAs) made up 16.7% of the total fatty acids with16:0 as the major SFA accounting for 15.3%. The sum of the
monounsaturated fatty acids (SMUFAs) was, on average,28.1% with 18:1n-9 and 18:1n-7, comprising 11.8% and8.1%, respectively. SPUFAs were 49.1% of the total, and
RKCs contained high levels of both DHA (22:6n-3, 17.5%)and EPA (20:5n-3, 18.4%). The other essential fatty acid, AA(20:4n-6), was 2% of the total. Bacterial fatty acids made up
of odd and branched chains were, on average, 2.9%, whereasshorter chain C18 PUFAs made up 6.3%. The ratio ofDHA:EPA, an important nutritional indicator, was 1:1 (Table 1).
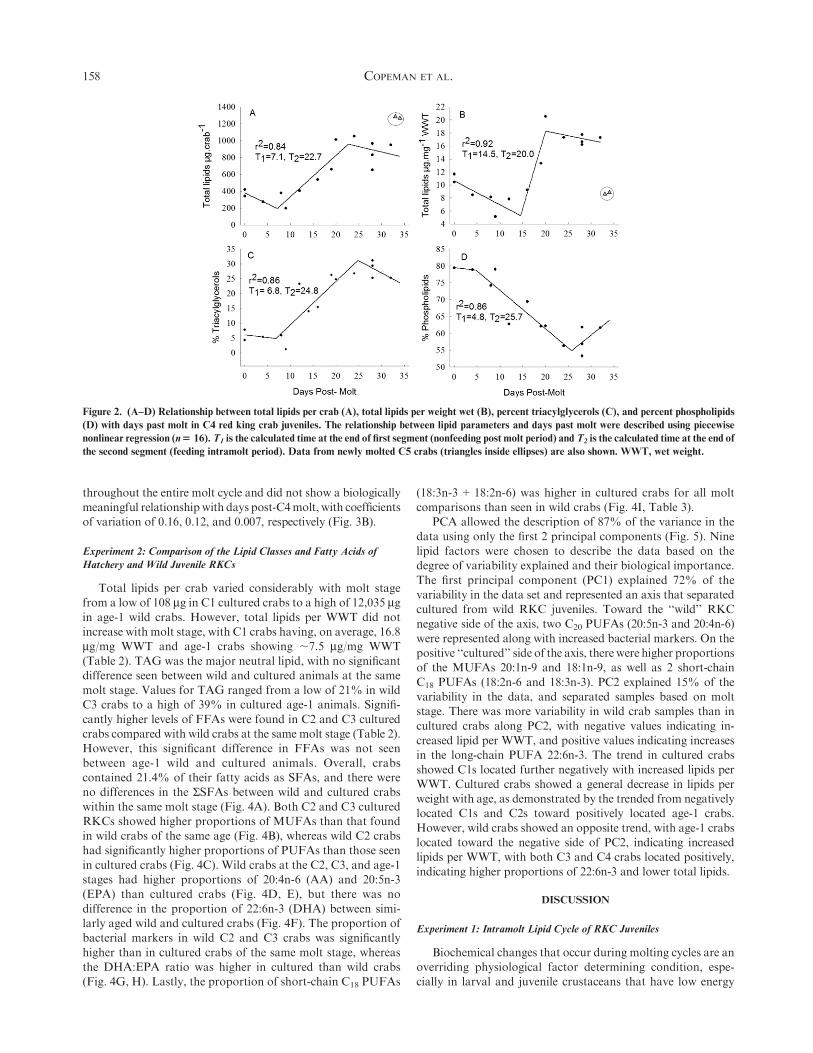
The relationship between both total lipids per animal
(measured in micrograms) as well as total lipids per WWT(measured in micrograms per milligram) with days past moltwere described by a 3-part piecewise regression (Fig. 2A, B).
Total lipids per crab (r2 ¼ 0.84) showed significant changes inthe relationship with days past molt at T1 ¼ 7.1 days and T2 ¼22.7 days. Initially, lipids decreased from;390 mg per animal to
;200 mg at day 7. Then crabs showed a rapid accumulation oflipids from day 7 until day 22, with a high of;950 mg. After day22, no further increase was seen in the average level of total
lipids per RKC. A similar relationship was observed for totallipids perWWT(r2¼ 0.92)withT1¼ 14.5 days andT2¼ 20.0 days
(Fig. 2B). The neutral lipid storage class (TAG) showed the sametrends as total lipids (r2 ¼ 0.86) with T1 ¼ 6.8 days and T2 ¼ 24.8days (Fig. 2C). However, the polar lipid class (PL) showed theopposite trend (r2 ¼ 0.86), with proportions decreasing rapidly
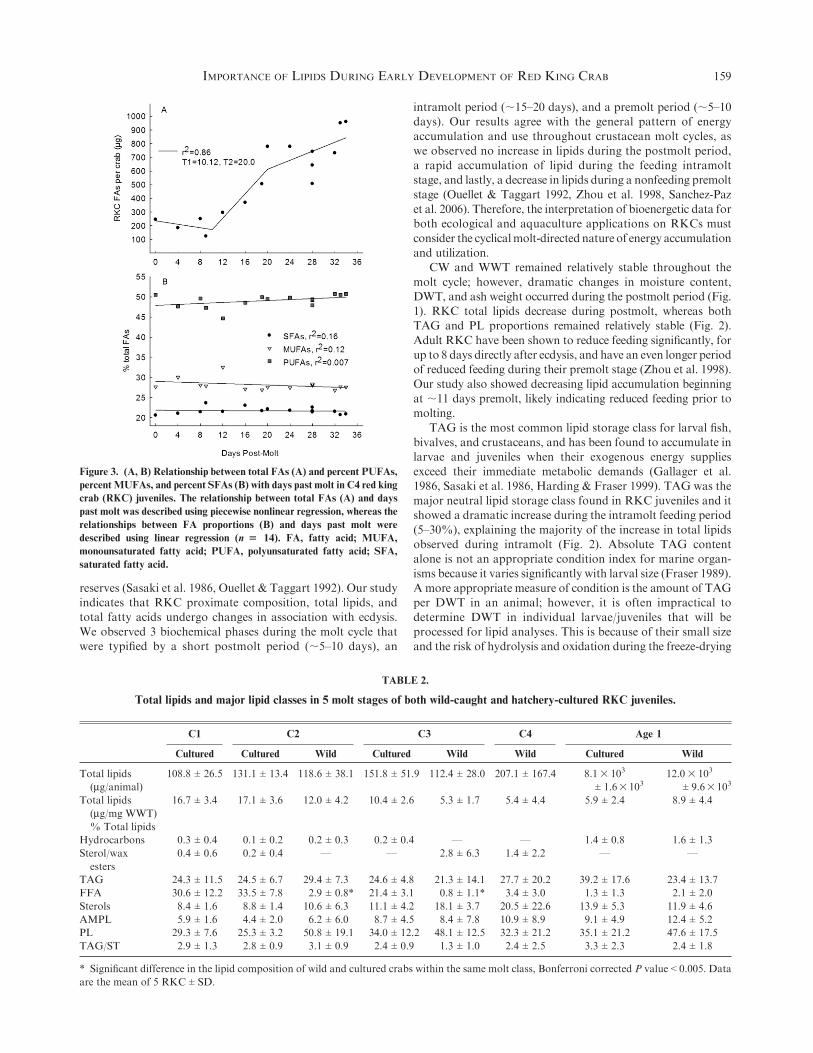
from ;79% at day 4 to a low of ;54% at day 25 (Fig. 2D).Total fatty acids showed the same pattern as total lipids,
with a 3-part piecewise regression describing the relationship
between total fatty acids and days post-C4 molt (r2 ¼ 0.86). Asignificant change in the relationship was observed at T1 ¼ 10.1days and T2 ¼ 20.0 days (Fig. 3A). Total fatty acids increased
from a low of;175 mg at day 10 to a high of;600 mg at day 20,and then gradually increased until day 33 to ;800 mg. Theproportion of SFAs, MUFAs, and PUFAs remained stable
TABLE 1.
Major lipid classes and fatty acids in all RKC examinedthroughout their intramolt cycle from C4 to C5.
Total lipids per crab (mg/animal) 720.3 % 359.2
Lipid classes expressed as % of total lipids
Hydrocarbons 1.2 ± 1.8
Ethyl ketones 0.7 ± 2.4
Triacylglycerols 20.3 ± 10.2
Free fatty acids 6.0 ± 2.1
Sterols 4.6 ± 1.5
Acetone mobile polar lipids 2.3 ± 1.7
Phospholipids 64.7 ± 9.2
TAG:ST 4.6 ± 2.7
Total fatty acids per crab (mg/animal) 538.0 ± 281.3
Percentage of total FAs
14:0 1.3 ± 0.2
16:0 15.3 ± 0.6
18:0 3.7 ± 0.3
SSFA* 21.7 % 0.8
16:1n-7 2.4 ± 0.3
18:1n-9 11.8 ± 0.8
18:1n-7 8.1 ± 0.7
20:1n-9 1.8 ± 0.3
SMUFA† 28.1 % 1.4
18:2n-6 3.9 ± 0.2
18:3n-3 2.4 ± 0.7
20:4n-6 2.4 ± 0.2
20:5n-3 18.4 ± 1.1
22:6n-3 17.5 ± 0.7
SPUFA‡ 49.1 % 1.6
S Bacterial 2.9 ± 0.5
S18:2n-6 + 18:3n-3 6.3 ± 0.9
22:6n-3/20:5n-3 1.0 ± 0.2
* Also contains i15:0, ai15:0, 15:0, i16:0, ai16:0, i17:0, ai17:0, 17:0, 20:0,
22:0, 23:0, and 24:0.
† Also contains 14:1, 15:1, 16:1n-11, 16:1n-9, 16:1n-5, 17:1, 18:1n-11,
18:1n-6, 18:1n-5, 20:1n-11, 20:1n-7, 22:1n-11(13), 22:1n-9, 22:1n-7, and
24:1.
‡ Also contains 16:2n-4, 16:3n-4, 16:4n-3, 16:4n-1, 18:2n-4, 18:3n-6,
18:3n-4, 18:4n-3, 18:4n-1, 18:5n-3, 20:2n-6, 20:3n-6, 20:3n-3, 20:4n-3,
22:4n-6, and 22:4n-3.
Bacterial FAs:P
15:0, ai15:0, i15:0, i16:0, ai16:0, 15:1, 17:0, and 17:1.
Lipid classes > 0.5% and FAs > 1.0% are shown, n ¼ 15, mean ± SD.
IMPORTANCE OF LIPIDS DURING EARLY DEVELOPMENT OF RED KING CRAB 157
throughout the entire molt cycle and did not show a biologicallymeaningful relationshipwith days post-C4molt, with coefficientsof variation of 0.16, 0.12, and 0.007, respectively (Fig. 3B).
Experiment 2: Comparison of the Lipid Classes and Fatty Acids of
Hatchery and Wild Juvenile RKCs
Total lipids per crab varied considerably with molt stagefrom a low of 108 mg in C1 cultured crabs to a high of 12,035 mgin age-1 wild crabs. However, total lipids per WWT did notincrease with molt stage, with C1 crabs having, on average, 16.8mg/mg WWT and age-1 crabs showing ;7.5 mg/mg WWT
(Table 2). TAG was the major neutral lipid, with no significantdifference seen between wild and cultured animals at the samemolt stage. Values for TAG ranged from a low of 21% in wildC3 crabs to a high of 39% in cultured age-1 animals. Signifi-
cantly higher levels of FFAs were found in C2 and C3 culturedcrabs compared with wild crabs at the same molt stage (Table 2).However, this significant difference in FFAs was not seen
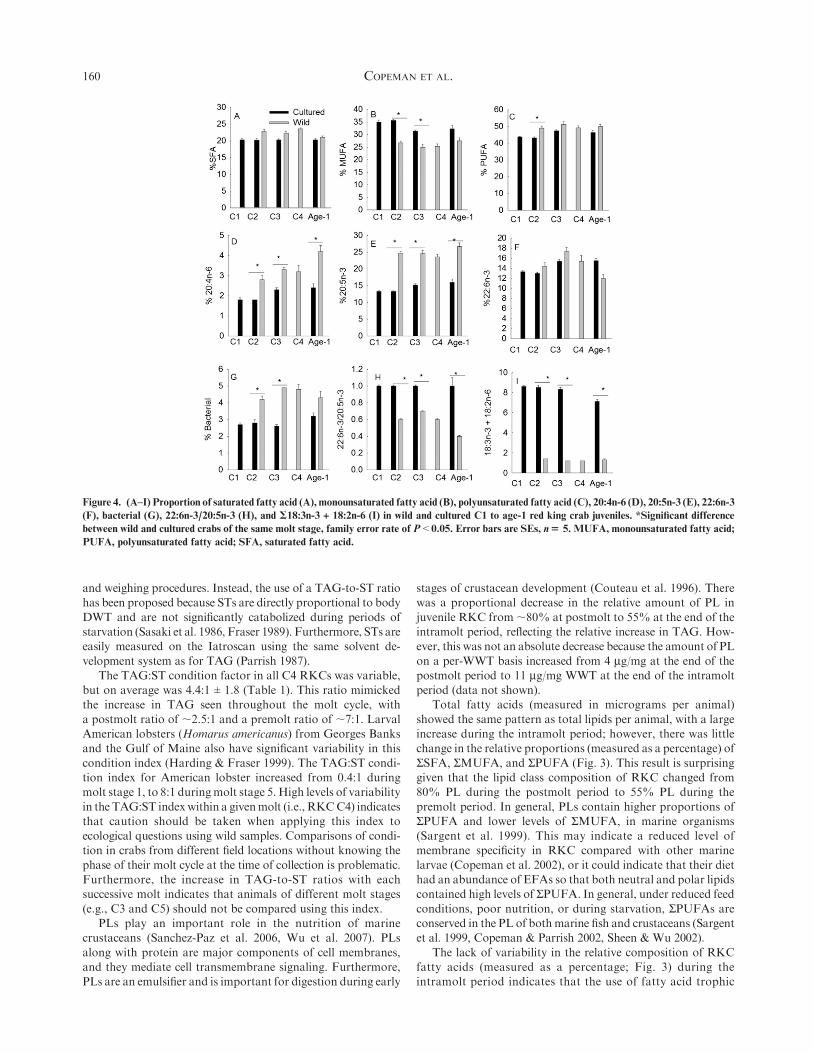
between age-1 wild and cultured animals. Overall, crabscontained 21.4% of their fatty acids as SFAs, and there wereno differences in the SSFAs between wild and cultured crabs
within the same molt stage (Fig. 4A). Both C2 and C3 culturedRKCs showed higher proportions of MUFAs than that foundin wild crabs of the same age (Fig. 4B), whereas wild C2 crabshad significantly higher proportions of PUFAs than those seen
in cultured crabs (Fig. 4C). Wild crabs at the C2, C3, and age-1stages had higher proportions of 20:4n-6 (AA) and 20:5n-3(EPA) than cultured crabs (Fig. 4D, E), but there was no
difference in the proportion of 22:6n-3 (DHA) between simi-larly aged wild and cultured crabs (Fig. 4F). The proportion ofbacterial markers in wild C2 and C3 crabs was significantly
higher than in cultured crabs of the same molt stage, whereasthe DHA:EPA ratio was higher in cultured than wild crabs(Fig. 4G, H). Lastly, the proportion of short-chain C18 PUFAs
(18:3n-3 + 18:2n-6) was higher in cultured crabs for all moltcomparisons than seen in wild crabs (Fig. 4I, Table 3).
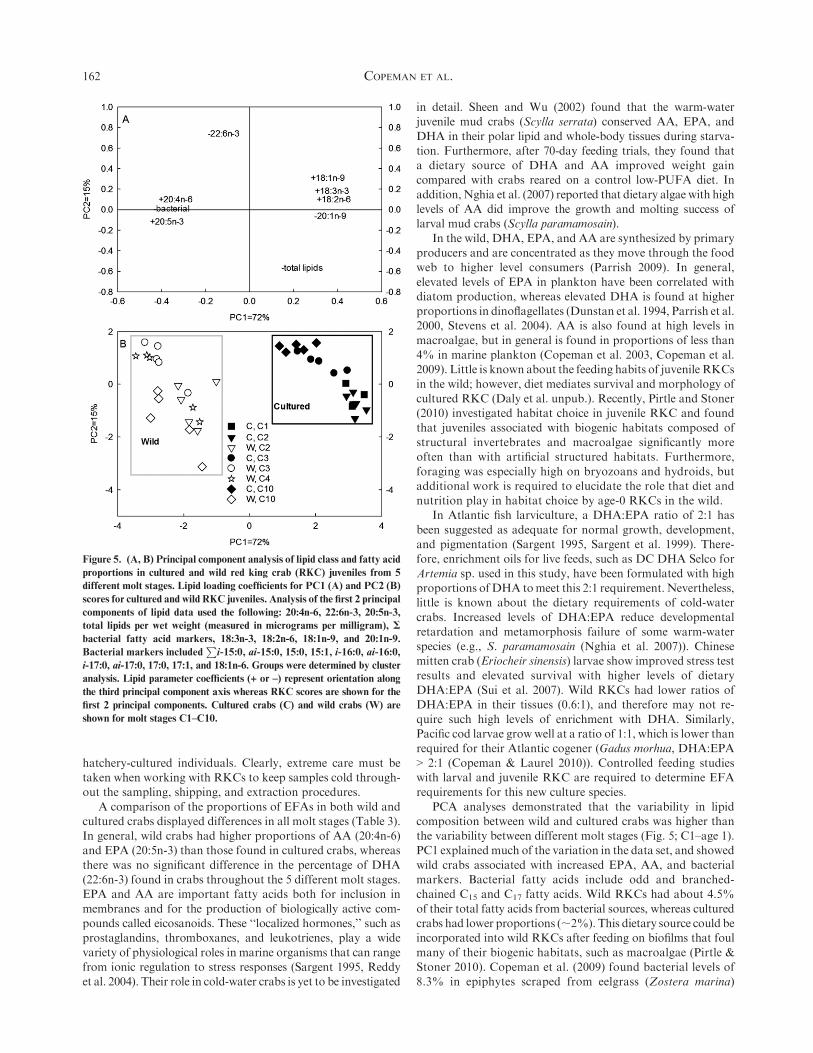
PCA allowed the description of 87% of the variance in the
data using only the first 2 principal components (Fig. 5). Ninelipid factors were chosen to describe the data based on thedegree of variability explained and their biological importance.
The first principal component (PC1) explained 72% of thevariability in the data set and represented an axis that separatedcultured from wild RKC juveniles. Toward the ‘‘wild’’ RKCnegative side of the axis, two C20 PUFAs (20:5n-3 and 20:4n-6)
were represented along with increased bacterial markers. On thepositive ‘‘cultured’’ side of the axis, therewere higher proportionsof the MUFAs 20:1n-9 and 18:1n-9, as well as 2 short-chain
C18 PUFAs (18:2n-6 and 18:3n-3). PC2 explained 15% of thevariability in the data, and separated samples based on moltstage. There was more variability in wild crab samples than in
cultured crabs along PC2, with negative values indicating in-creased lipid per WWT, and positive values indicating increasesin the long-chain PUFA 22:6n-3. The trend in cultured crabs
showed C1s located further negatively with increased lipids perWWT. Cultured crabs showed a general decrease in lipids perweight with age, as demonstrated by the trended from negativelylocated C1s and C2s toward positively located age-1 crabs.
However, wild crabs showed an opposite trend, with age-1 crabslocated toward the negative side of PC2, indicating increasedlipids per WWT, with both C3 and C4 crabs located positively,
indicating higher proportions of 22:6n-3 and lower total lipids.
DISCUSSION
Experiment 1: Intramolt Lipid Cycle of RKC Juveniles
Biochemical changes that occur during molting cycles are anoverriding physiological factor determining condition, espe-cially in larval and juvenile crustaceans that have low energy
Figure 2. (A–D) Relationship between total lipids per crab (A), total lipids per weight wet (B), percent triacylglycerols (C), and percent phospholipids
(D) with days past molt in C4 red king crab juveniles. The relationship between lipid parameters and days past molt were described using piecewise
nonlinear regression (n$ 16).T1 is the calculated time at the end of first segment (nonfeeding post molt period) andT2 is the calculated time at the end of
the second segment (feeding intramolt period). Data from newly molted C5 crabs (triangles inside ellipses) are also shown. WWT, wet weight.
COPEMAN ET AL.158
reserves (Sasaki et al. 1986, Ouellet & Taggart 1992). Our studyindicates that RKC proximate composition, total lipids, andtotal fatty acids undergo changes in association with ecdysis.
We observed 3 biochemical phases during the molt cycle thatwere typified by a short postmolt period (;5–10 days), an
intramolt period (;15–20 days), and a premolt period (;5–10days). Our results agree with the general pattern of energy
accumulation and use throughout crustacean molt cycles, aswe observed no increase in lipids during the postmolt period,a rapid accumulation of lipid during the feeding intramoltstage, and lastly, a decrease in lipids during a nonfeeding premolt
stage (Ouellet & Taggart 1992, Zhou et al. 1998, Sanchez-Pazet al. 2006). Therefore, the interpretation of bioenergetic data forboth ecological and aquaculture applications on RKCs must
consider the cyclicalmolt-directed nature of energy accumulationand utilization.
CW and WWT remained relatively stable throughout the
molt cycle; however, dramatic changes in moisture content,DWT, and ash weight occurred during the postmolt period (Fig.1). RKC total lipids decrease during postmolt, whereas bothTAG and PL proportions remained relatively stable (Fig. 2).
Adult RKC have been shown to reduce feeding significantly, forup to 8 days directly after ecdysis, and have an even longer periodof reduced feeding during their premolt stage (Zhou et al. 1998).
Our study also showed decreasing lipid accumulation beginningat ;11 days premolt, likely indicating reduced feeding prior tomolting.
TAG is the most common lipid storage class for larval fish,bivalves, and crustaceans, and has been found to accumulate inlarvae and juveniles when their exogenous energy supplies
exceed their immediate metabolic demands (Gallager et al.1986, Sasaki et al. 1986, Harding & Fraser 1999). TAG was themajor neutral lipid storage class found in RKC juveniles and itshowed a dramatic increase during the intramolt feeding period
(5–30%), explaining the majority of the increase in total lipidsobserved during intramolt (Fig. 2). Absolute TAG contentalone is not an appropriate condition index for marine organ-
isms because it varies significantly with larval size (Fraser 1989).A more appropriate measure of condition is the amount of TAGper DWT in an animal; however, it is often impractical to
determine DWT in individual larvae/juveniles that will beprocessed for lipid analyses. This is because of their small sizeand the risk of hydrolysis and oxidation during the freeze-drying
Figure 3. (A, B) Relationship between total FAs (A) and percent PUFAs,
percentMUFAs, and percent SFAs (B) with days past molt in C4 red king
crab (RKC) juveniles. The relationship between total FAs (A) and days
past molt was described using piecewise nonlinear regression, whereas the
relationships between FA proportions (B) and days past molt were
described using linear regression (n $ 14). FA, fatty acid; MUFA,
monounsaturated fatty acid; PUFA, polyunsaturated fatty acid; SFA,
saturated fatty acid.
TABLE 2.
Total lipids and major lipid classes in 5 molt stages of both wild-caught and hatchery-cultured RKC juveniles.
C1 C2 C3 C4 Age 1
Cultured Cultured Wild Cultured Wild Wild Cultured Wild
Total lipids
(mg/animal)
108.8 ± 26.5 131.1 ± 13.4 118.6 ± 38.1 151.8 ± 51.9 112.4 ± 28.0 207.1 ± 167.4 8.13 103
± 1.6310312.03 103
± 9.63103
Total lipids
(mg/mg WWT)
16.7 ± 3.4 17.1 ± 3.6 12.0 ± 4.2 10.4 ± 2.6 5.3 ± 1.7 5.4 ± 4.4 5.9 ± 2.4 8.9 ± 4.4
% Total lipids
Hydrocarbons 0.3 ± 0.4 0.1 ± 0.2 0.2 ± 0.3 0.2 ± 0.4 — — 1.4 ± 0.8 1.6 ± 1.3
Sterol/wax
esters
0.4 ± 0.6 0.2 ± 0.4 — — 2.8 ± 6.3 1.4 ± 2.2 — —
TAG 24.3 ± 11.5 24.5 ± 6.7 29.4 ± 7.3 24.6 ± 4.8 21.3 ± 14.1 27.7 ± 20.2 39.2 ± 17.6 23.4 ± 13.7
FFA 30.6 ± 12.2 33.5 ± 7.8 2.9 ± 0.8* 21.4 ± 3.1 0.8 ± 1.1* 3.4 ± 3.0 1.3 ± 1.3 2.1 ± 2.0
Sterols 8.4 ± 1.6 8.8 ± 1.4 10.6 ± 6.3 11.1 ± 4.2 18.1 ± 3.7 20.5 ± 22.6 13.9 ± 5.3 11.9 ± 4.6
AMPL 5.9 ± 1.6 4.4 ± 2.0 6.2 ± 6.0 8.7 ± 4.5 8.4 ± 7.8 10.9 ± 8.9 9.1 ± 4.9 12.4 ± 5.2
PL 29.3 ± 7.6 25.3 ± 3.2 50.8 ± 19.1 34.0 ± 12.2 48.1 ± 12.5 32.3 ± 21.2 35.1 ± 21.2 47.6 ± 17.5
TAG/ST 2.9 ± 1.3 2.8 ± 0.9 3.1 ± 0.9 2.4 ± 0.9 1.3 ± 1.0 2.4 ± 2.5 3.3 ± 2.3 2.4 ± 1.8
* Significant difference in the lipid composition of wild and cultured crabs within the same molt class, Bonferroni corrected P value < 0.005. Data
are the mean of 5 RKC ± SD.
IMPORTANCE OF LIPIDS DURING EARLY DEVELOPMENT OF RED KING CRAB 159
and weighing procedures. Instead, the use of a TAG-to-ST ratiohas been proposed because STs are directly proportional to body
DWT and are not significantly catabolized during periods ofstarvation (Sasaki et al. 1986, Fraser 1989). Furthermore, STs areeasily measured on the Iatroscan using the same solvent de-
velopment system as for TAG (Parrish 1987).The TAG:ST condition factor in all C4 RKCs was variable,
but on average was 4.4:1 ± 1.8 (Table 1). This ratio mimickedthe increase in TAG seen throughout the molt cycle, with
a postmolt ratio of ;2.5:1 and a premolt ratio of ;7:1. LarvalAmerican lobsters (Homarus americanus) from Georges Banksand the Gulf of Maine also have significant variability in this
condition index (Harding & Fraser 1999). The TAG:ST condi-tion index for American lobster increased from 0.4:1 duringmolt stage 1, to 8:1 duringmolt stage 5. High levels of variability
in the TAG:ST indexwithin a givenmolt (i.e., RKCC4) indicatesthat caution should be taken when applying this index toecological questions using wild samples. Comparisons of condi-tion in crabs from different field locations without knowing the
phase of their molt cycle at the time of collection is problematic.Furthermore, the increase in TAG-to-ST ratios with eachsuccessive molt indicates that animals of different molt stages
(e.g., C3 and C5) should not be compared using this index.PLs play an important role in the nutrition of marine
crustaceans (Sanchez-Paz et al. 2006, Wu et al. 2007). PLs
along with protein are major components of cell membranes,and they mediate cell transmembrane signaling. Furthermore,PLs are an emulsifier and is important for digestion during early
stages of crustacean development (Couteau et al. 1996). Therewas a proportional decrease in the relative amount of PL in
juvenile RKC from;80% at postmolt to 55% at the end of theintramolt period, reflecting the relative increase in TAG. How-ever, this was not an absolute decrease because the amount of PL
on a per-WWT basis increased from 4 mg/mg at the end of thepostmolt period to 11 mg/mg WWT at the end of the intramoltperiod (data not shown).
Total fatty acids (measured in micrograms per animal)
showed the same pattern as total lipids per animal, with a largeincrease during the intramolt period; however, there was littlechange in the relative proportions (measured as a percentage) of
SSFA, SMUFA, and SPUFA (Fig. 3). This result is surprisinggiven that the lipid class composition of RKC changed from80% PL during the postmolt period to 55% PL during the
premolt period. In general, PLs contain higher proportions ofSPUFA and lower levels of SMUFA, in marine organisms(Sargent et al. 1999). This may indicate a reduced level ofmembrane specificity in RKC compared with other marine
larvae (Copeman et al. 2002), or it could indicate that their diethad an abundance of EFAs so that both neutral and polar lipidscontained high levels of SPUFA. In general, under reduced feed
conditions, poor nutrition, or during starvation, SPUFAs areconserved in the PL of bothmarine fish and crustaceans (Sargentet al. 1999, Copeman & Parrish 2002, Sheen & Wu 2002).
The lack of variability in the relative composition of RKCfatty acids (measured as a percentage; Fig. 3) during theintramolt period indicates that the use of fatty acid trophic
Figure 4. (A–I) Proportion of saturated fatty acid (A), monounsaturated fatty acid (B), polyunsaturated fatty acid (C), 20:4n-6 (D), 20:5n-3 (E), 22:6n-3
(F), bacterial (G), 22:6n-3/20:5n-3 (H), and S18:3n-3 + 18:2n-6 (I) in wild and cultured C1 to age-1 red king crab juveniles. *Significant difference
between wild and cultured crabs of the same molt stage, family error rate of P < 0.05. Error bars are SEs, n$ 5. MUFA, monounsaturated fatty acid;
PUFA, polyunsaturated fatty acid; SFA, saturated fatty acid.
COPEMAN ET AL.160
markers in ecological studies will not be significantly affectedby the intramolt stage. In general, our reported levels ofSPUFA, SMUFA, and SSFA in RKC larvae are in agree-
ment with those from previous studies (Stoner et al. 2010b).
Experiment 2: A Comparison of Lipids in Hatchery and
Wild Juvenile RKCs
Hatchery-cultured and wild RKCs of the same molt stage
differed in lipid composition likely as a result of both dietaryand husbandry practices. The amount of lipid per WWTreported here (;5–17 mg/mg) for hatchery and wild RKC is inagreement with previous studies. Alaskan cultured RKC and
blue king crab (Paralithodes platypus) larvae have been pre-viously reported to contain 9 mg lipid/mgWWT and 19 mg lipid/mg WWT, respectively (Leroux per. comm.). Cultured spider
crabs contain;40 mg/mg lipid/DWT, which is comparable with20 mg/mg WWT, assuming 50% moisture (Andres et al. 2011).Previously, wild-caught cold-water Arctic lyre crabs and hermit
crabs were shown to contain comparable amounts of 3.2 mglipid/mgWWTand14.3mg lipid/mgWWT, respectively (Copeman& Parrish 2003).
The lipid class composition of wild and cultured RKCs wasgenerally similar (Table 2), which indicates that the mixture ofenriched live food and gel food were meeting the basic
nutritional requirements of juvenile crabs. High FFA levels(21–31%, Table 2) in cultured age-0 RKCs at stages C1–C3were unexpected. In experiment 1, we found that the average
level of FFA in RKC juveniles from 2009 was only 6%, whereasStoner et al. (2010b) reported FFA levels ranging from 1.9–5.9%in RKCs reared by the same Alaskan hatchery. In addition,
Copeman and Parrish (2003) measured FFA in 15 differentspecies of cold-water benthic invertebrates and found levels thatranged from 0.6–20% of total fatty acids. It was originallythought that FFA levels less than 25% were acceptable for
phytoplankton and zooplankton samples (Parrish 1988), butmore recently, Berge et al. (1995) demonstrated that most of theFFA in diatom samples (Skeletonema costatum) was the result
of lipolysis of PL during routine sampling procedures. OurRKC samples with elevated FFA also had reduced proportionsof PL, indicating that some of the FFA here likely resulted from
lipolysis of PL during sampling or shipping from a remotelocation in Alaska. Most interestingly, age-1 crabs that werehandled in the same manner did not show elevated levels in
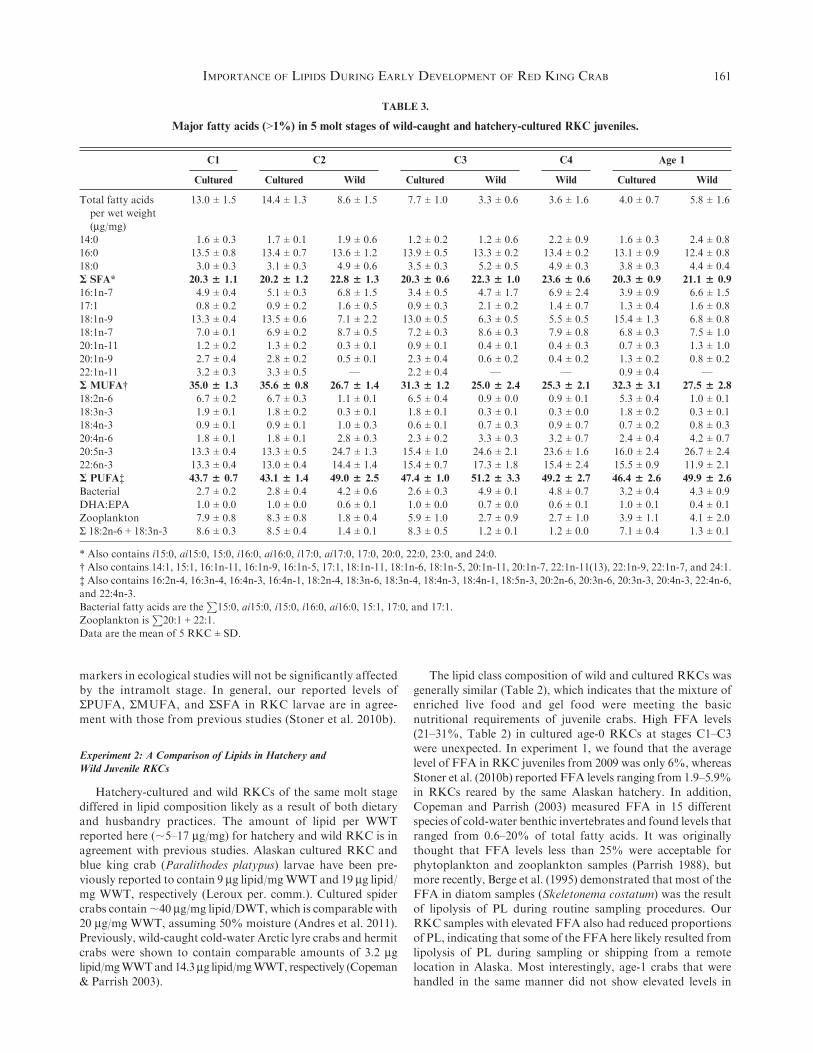
TABLE 3.
Major fatty acids (>1%) in 5 molt stages of wild-caught and hatchery-cultured RKC juveniles.
C1 C2 C3 C4 Age 1
Cultured Cultured Wild Cultured Wild Wild Cultured Wild
Total fatty acids
per wet weight
(mg/mg)
13.0 ± 1.5 14.4 ± 1.3 8.6 ± 1.5 7.7 ± 1.0 3.3 ± 0.6 3.6 ± 1.6 4.0 ± 0.7 5.8 ± 1.6
14:0 1.6 ± 0.3 1.7 ± 0.1 1.9 ± 0.6 1.2 ± 0.2 1.2 ± 0.6 2.2 ± 0.9 1.6 ± 0.3 2.4 ± 0.8
16:0 13.5 ± 0.8 13.4 ± 0.7 13.6 ± 1.2 13.9 ± 0.5 13.3 ± 0.2 13.4 ± 0.2 13.1 ± 0.9 12.4 ± 0.8
18:0 3.0 ± 0.3 3.1 ± 0.3 4.9 ± 0.6 3.5 ± 0.3 5.2 ± 0.5 4.9 ± 0.3 3.8 ± 0.3 4.4 ± 0.4
S SFA* 20.3 % 1.1 20.2 % 1.2 22.8 % 1.3 20.3 % 0.6 22.3 % 1.0 23.6 % 0.6 20.3 % 0.9 21.1 % 0.9
16:1n-7 4.9 ± 0.4 5.1 ± 0.3 6.8 ± 1.5 3.4 ± 0.5 4.7 ± 1.7 6.9 ± 2.4 3.9 ± 0.9 6.6 ± 1.5
17:1 0.8 ± 0.2 0.9 ± 0.2 1.6 ± 0.5 0.9 ± 0.3 2.1 ± 0.2 1.4 ± 0.7 1.3 ± 0.4 1.6 ± 0.8
18:1n-9 13.3 ± 0.4 13.5 ± 0.6 7.1 ± 2.2 13.0 ± 0.5 6.3 ± 0.5 5.5 ± 0.5 15.4 ± 1.3 6.8 ± 0.8
18:1n-7 7.0 ± 0.1 6.9 ± 0.2 8.7 ± 0.5 7.2 ± 0.3 8.6 ± 0.3 7.9 ± 0.8 6.8 ± 0.3 7.5 ± 1.0
20:1n-11 1.2 ± 0.2 1.3 ± 0.2 0.3 ± 0.1 0.9 ± 0.1 0.4 ± 0.1 0.4 ± 0.3 0.7 ± 0.3 1.3 ± 1.0
20:1n-9 2.7 ± 0.4 2.8 ± 0.2 0.5 ± 0.1 2.3 ± 0.4 0.6 ± 0.2 0.4 ± 0.2 1.3 ± 0.2 0.8 ± 0.2
22:1n-11 3.2 ± 0.3 3.3 ± 0.5 — 2.2 ± 0.4 — — 0.9 ± 0.4 —
S MUFA† 35.0 % 1.3 35.6 % 0.8 26.7 % 1.4 31.3 % 1.2 25.0 % 2.4 25.3 % 2.1 32.3 % 3.1 27.5 % 2.8
18:2n-6 6.7 ± 0.2 6.7 ± 0.3 1.1 ± 0.1 6.5 ± 0.4 0.9 ± 0.0 0.9 ± 0.1 5.3 ± 0.4 1.0 ± 0.1
18:3n-3 1.9 ± 0.1 1.8 ± 0.2 0.3 ± 0.1 1.8 ± 0.1 0.3 ± 0.1 0.3 ± 0.0 1.8 ± 0.2 0.3 ± 0.1
18:4n-3 0.9 ± 0.1 0.9 ± 0.1 1.0 ± 0.3 0.6 ± 0.1 0.7 ± 0.3 0.9 ± 0.7 0.7 ± 0.2 0.8 ± 0.3
20:4n-6 1.8 ± 0.1 1.8 ± 0.1 2.8 ± 0.3 2.3 ± 0.2 3.3 ± 0.3 3.2 ± 0.7 2.4 ± 0.4 4.2 ± 0.7
20:5n-3 13.3 ± 0.4 13.3 ± 0.5 24.7 ± 1.3 15.4 ± 1.0 24.6 ± 2.1 23.6 ± 1.6 16.0 ± 2.4 26.7 ± 2.4
22:6n-3 13.3 ± 0.4 13.0 ± 0.4 14.4 ± 1.4 15.4 ± 0.7 17.3 ± 1.8 15.4 ± 2.4 15.5 ± 0.9 11.9 ± 2.1
S PUFA‡ 43.7 % 0.7 43.1 % 1.4 49.0 % 2.5 47.4 % 1.0 51.2 % 3.3 49.2 % 2.7 46.4 % 2.6 49.9 % 2.6
Bacterial 2.7 ± 0.2 2.8 ± 0.4 4.2 ± 0.6 2.6 ± 0.3 4.9 ± 0.1 4.8 ± 0.7 3.2 ± 0.4 4.3 ± 0.9
DHA:EPA 1.0 ± 0.0 1.0 ± 0.0 0.6 ± 0.1 1.0 ± 0.0 0.7 ± 0.0 0.6 ± 0.1 1.0 ± 0.1 0.4 ± 0.1
Zooplankton 7.9 ± 0.8 8.3 ± 0.8 1.8 ± 0.4 5.9 ± 1.0 2.7 ± 0.9 2.7 ± 1.0 3.9 ± 1.1 4.1 ± 2.0
S 18:2n-6 + 18:3n-3 8.6 ± 0.3 8.5 ± 0.4 1.4 ± 0.1 8.3 ± 0.5 1.2 ± 0.1 1.2 ± 0.0 7.1 ± 0.4 1.3 ± 0.1
* Also contains i15:0, ai15:0, 15:0, i16:0, ai16:0, i17:0, ai17:0, 17:0, 20:0, 22:0, 23:0, and 24:0.
† Also contains 14:1, 15:1, 16:1n-11, 16:1n-9, 16:1n-5, 17:1, 18:1n-11, 18:1n-6, 18:1n-5, 20:1n-11, 20:1n-7, 22:1n-11(13), 22:1n-9, 22:1n-7, and 24:1.
‡ Also contains 16:2n-4, 16:3n-4, 16:4n-3, 16:4n-1, 18:2n-4, 18:3n-6, 18:3n-4, 18:4n-3, 18:4n-1, 18:5n-3, 20:2n-6, 20:3n-6, 20:3n-3, 20:4n-3, 22:4n-6,
and 22:4n-3.
Bacterial fatty acids are theP
15:0, ai15:0, i15:0, i16:0, ai16:0, 15:1, 17:0, and 17:1.
Zooplankton isP
20:1 + 22:1.
Data are the mean of 5 RKC ± SD.
IMPORTANCE OF LIPIDS DURING EARLY DEVELOPMENT OF RED KING CRAB 161
hatchery-cultured individuals. Clearly, extreme care must betaken when working with RKCs to keep samples cold through-out the sampling, shipping, and extraction procedures.
A comparison of the proportions of EFAs in both wild andcultured crabs displayed differences in all molt stages (Table 3).In general, wild crabs had higher proportions of AA (20:4n-6)and EPA (20:5n-3) than those found in cultured crabs, whereas
there was no significant difference in the percentage of DHA(22:6n-3) found in crabs throughout the 5 different molt stages.EPA and AA are important fatty acids both for inclusion in
membranes and for the production of biologically active com-pounds called eicosanoids. These ‘‘localized hormones,’’ such asprostaglandins, thromboxanes, and leukotrienes, play a wide
variety of physiological roles in marine organisms that can rangefrom ionic regulation to stress responses (Sargent 1995, Reddyet al. 2004). Their role in cold-water crabs is yet to be investigated
in detail. Sheen and Wu (2002) found that the warm-waterjuvenile mud crabs (Scylla serrata) conserved AA, EPA, and
DHA in their polar lipid and whole-body tissues during starva-tion. Furthermore, after 70-day feeding trials, they found thata dietary source of DHA and AA improved weight gaincompared with crabs reared on a control low-PUFA diet. In
addition,Nghia et al. (2007) reported that dietary algae with highlevels of AA did improve the growth and molting success oflarval mud crabs (Scylla paramamosain).
In the wild, DHA, EPA, and AA are synthesized by primaryproducers and are concentrated as they move through the foodweb to higher level consumers (Parrish 2009). In general,
elevated levels of EPA in plankton have been correlated withdiatom production, whereas elevated DHA is found at higherproportions in dinoflagellates (Dunstan et al. 1994, Parrish et al.2000, Stevens et al. 2004). AA is also found at high levels in
macroalgae, but in general is found in proportions of less than4% in marine plankton (Copeman et al. 2003, Copeman et al.2009). Little is known about the feeding habits of juvenile RKCs
in the wild; however, diet mediates survival and morphology ofcultured RKC (Daly et al. unpub.). Recently, Pirtle and Stoner(2010) investigated habitat choice in juvenile RKC and found
that juveniles associated with biogenic habitats composed ofstructural invertebrates and macroalgae significantly moreoften than with artificial structured habitats. Furthermore,
foraging was especially high on bryozoans and hydroids, butadditional work is required to elucidate the role that diet andnutrition play in habitat choice by age-0 RKCs in the wild.
In Atlantic fish larviculture, a DHA:EPA ratio of 2:1 has
been suggested as adequate for normal growth, development,and pigmentation (Sargent 1995, Sargent et al. 1999). There-fore, enrichment oils for live feeds, such as DC DHA Selco for
Artemia sp. used in this study, have been formulated with highproportions of DHA tomeet this 2:1 requirement. Nevertheless,little is known about the dietary requirements of cold-water
crabs. Increased levels of DHA:EPA reduce developmentalretardation and metamorphosis failure of some warm-waterspecies (e.g., S. paramamosain (Nghia et al. 2007)). Chinesemitten crab (Eriocheir sinensis) larvae show improved stress test
results and elevated survival with higher levels of dietaryDHA:EPA (Sui et al. 2007). Wild RKCs had lower ratios ofDHA:EPA in their tissues (0.6:1), and therefore may not re-
quire such high levels of enrichment with DHA. Similarly,Pacific cod larvae growwell at a ratio of 1:1, which is lower thanrequired for their Atlantic cogener (Gadus morhua, DHA:EPA
> 2:1 (Copeman & Laurel 2010)). Controlled feeding studieswith larval and juvenile RKC are required to determine EFArequirements for this new culture species.
PCA analyses demonstrated that the variability in lipidcomposition between wild and cultured crabs was higher thanthe variability between different molt stages (Fig. 5; C1–age 1).PC1 explainedmuch of the variation in the data set, and showed
wild crabs associated with increased EPA, AA, and bacterialmarkers. Bacterial fatty acids include odd and branched-chained C15 and C17 fatty acids. Wild RKCs had about 4.5%
of their total fatty acids from bacterial sources, whereas culturedcrabs had lower proportions (;2%). This dietary source could beincorporated into wild RKCs after feeding on biofilms that foul
many of their biogenic habitats, such as macroalgae (Pirtle &Stoner 2010). Copeman et al. (2009) found bacterial levels of8.3% in epiphytes scraped from eelgrass (Zostera marina)
Figure 5. (A, B) Principal component analysis of lipid class and fatty acid
proportions in cultured and wild red king crab (RKC) juveniles from 5
different molt stages. Lipid loading coefficients for PC1 (A) and PC2 (B)
scores for cultured and wild RKC juveniles. Analysis of the first 2 principal
components of lipid data used the following: 20:4n-6, 22:6n-3, 20:5n-3,
total lipids per wet weight (measured in micrograms per milligram), S
bacterial fatty acid markers, 18:3n-3, 18:2n-6, 18:1n-9, and 20:1n-9.
Bacterial markers includedP
i-15:0, ai-15:0, 15:0, 15:1, i-16:0, ai-16:0,
i-17:0, ai-17:0, 17:0, 17:1, and 18:1n-6. Groups were determined by cluster
analysis. Lipid parameter coefficients (+ or –) represent orientation along
the third principal component axis whereas RKC scores are shown for the
first 2 principal components. Cultured crabs (C) and wild crabs (W) are
shown for molt stages C1–C10.
COPEMAN ET AL.162
blades, whereas Kharlamenko et al. (2001) reported ;6% inepiphytes from cold-water eelgrass habitats. Furthermore, ele-
vated proportions of zooplankton fatty acids (;6.5%, S22:1 +S20:1) in cultured crabs compared with wild animals (;2.7) werealso noted. Cultured crabs consumed both enrichedArtemia andCyclop-eeze, both of which have elevated levels of these long-
chain MUFA zooplankton markers (Nair et al. 2007). Con-versely, based on the fatty acid profiles of wild RKC juveniles,they likely consume very little zooplankton in the field after
settlement onto benthic habitats.
CONCLUSIONS
This study has implications for both crab ecology and forsuitable crab feed development. Juvenile RKCs showed vari-ability throughout their intramolt cycle, which agreed with the3-phase feeding pattern observed in adult RKCs and in other
crustaceans. Ecological and aquaculture studies of RKC mustconsider the cyclical nature of energy accumulation and utili-zation associated with molting patterns. Care should be taken
when comparing condition or proximate composition in crabsof unknown molt stage. Because of the high variability in crablipids, large sample sizes are required to detect differences in
condition between crabs from different locations or habitattypes. No difference in the relative proportions of fatty acids incrabs throughout their molt cycle suggests that fatty acid bio-
markers will not be significantly affected by the intramolt stage.Wild and cultured crabs showed differences in their lipid
composition, with wild crabs characterized by higher pro-portions of EPA and AA. Additional studies are required to
determine the effect of these different ratios of fatty acids on
growth, molt success, and behavior of juvenile crabs. Our dataprovide a starting point for future nutritional work, with the
essential DHA:EPA:AA ratio in wild crabs being 5:8:1. Futurestudies should aim at developing feeds with similar essentialfatty acid ratios.
ACKNOWLEDGMENTS
Sample processing costs and salary for L. C. were provided bya joint NOAA aquaculture and a Cooperative Institute for
Marine Resource Studies, Oregon State University grant (no.NA17RJ1362). We are thankful to Miranda Westphal, JaspriSylvan, and Melissa Rhodes-Reese at the University of Alaska
for the collection and shipment of wild RKCs. We also thankJim Swingle and Jeff Hetrick of the Alutiiq Pride ShellfishHatchery for hatchery logistical support, and Jeff Stephan andLu Dochterman for helping with broodstock acquisition. Our
lipid data were analyzed in partnership with the Core ResearchEquipment and Instrument Training (CREAIT) Network ofMemorial University, Newfoundland, Canada. Partnership
funding for lipid analyses was provided through a NaturalSciences and Engineering Research Council of Canada(NSERC) Discovery Grant to C. P. We thank Jeanette Wells
and Tara Hooper for chromatography of lipid classes and fattyacids on lipid extracts. Thanks also to Scott Haines and PaulIseri for providing husbandry assistance in the Newport
laboratory during the juvenile intramolt study. Reference totrade names does not imply endorsement by the NationalMarine Fisheries Service, NOAA. The findings and conclusionsin the paper are those of the authors and do not necessarily
represent the view of the National Marine Fisheries Service.
LITERATURE CITED
Alaska Department of Fish and Game. 2010. Alaska commercial
shellfish fisheries catches & exvessel values. http://www.cf.adfg.
state.ak.us/geninfo/shellfsh/09value.php</biburl>. Accessed May
23, 2010.
Andres, M., G. Rotllant, M. Sastre & A. Estevez. 2011. Replacement of
live prey by formulated diets in larval rearing of spider crab Maja
brachydactyla. Aquaculture 313:50–56.
Berge, J. P., J. P. Gouygou, J. P. Dubacq & P. Durand. 1995.
Reassessment of lipid-composition of the diatom Skeletonema
costatum. Phytochemistry 39:1017–1021.
Blau, S. F. & S. C. Byersdorfer. 1994. Sausage-shaped artificial collector
developed in Alaska to study young-of-year red king crabs. Bull.
Mar. Sci. 55:878–886.
Budge, S. M. 1999. Fatty acid biomarkers in a cold water marine
environment. PhD diss. Memorial University of Newfoundland.
197 pp.
Budge, S. M., S. J. Iverson & H. N. Koopman. 2006. Studying trophic
ecology in marine ecosystems using fatty acids: a primer on analysis
and interpretation. Mar. Mamm. Sci. 22:759–801.
Calcagno, J. A., G. A. Lovrich, S. Thatje, U. Nettelmann & K. Anger.
2005. First year growth in the lithodids Lithodes santolla and
Paralomis granulosa reared at different temperatures. J. Sea Res.
54:221–230.
Copeman, L. A. & B. J. Laurel. 2010. Experimental evidence of fatty
acid limited growth and survival in Pacific cod (Gadus macro-
cephalus) larvae. Mar. Ecol. Prog. Ser. 412:259–272.
Copeman, L. A. & C. C. Parrish. 2002. Lipid composition of malpig-
mented and normally pigmented newly settled yellowtail flounder,
Limanda ferruginea (Storer). Aquacult. Res. 33:1209–1219.
Copeman, L. A., C. C. Parrish, J. A. Brown &M. Harel. 2002. Effects
of DHA, EPA and AA on the early growth, survival, lipid
composition and pigmentation of yellowtail flounder (Limanda
ferruginea): a live food enrichment experiment. Aquaculture
210:185–204.
Copeman, L. A., C. C. Parrish. 2003. Marine lipids in a cold coastal
ecosystem. Marine Biology 143(6):1213–1229.
Copeman, L. A., C. C. Parrish, R. S. Gregory & J. Wells. 2008.
Decreased lipid storage in juvenile Atlantic cod (Gadus morhua)
during settlement in cold-water eelgrass habitat. Mar. Biol.
154:823–832.
Copeman, L. A., C. C. Parrish, R. S. Gregory, R. E. Jamieson, J.Well &
M. J. Whiticar. 2009. Fatty acid biomarkers in coldwater eelgrass
meadows: elevated terrestrial input to the foodweb of age-0 Atlantic
cod Gadus morhua. Mar. Ecol. Prog. Ser. 386:237–251.
Couteau, P., M. R. Camara& P. Sorgeloos. 1996. The effect of different
levels and sources of dietary phosphatidylcholine on the growth,
survival, stress resistance and fatty acid composition of postlarval
Penaeus vannamei. Aquaculture 147:261–273.
Daly, B. 2010. King crab rehabilitation in Alaska. In: G. Bishop, editor.
Oncorhynchus. Newsletter of the Alaska Chapter, American Fish-
eries Society, Summer 2010 (Vol. 30, No. 3) 1–4.
Daly, B., J. S. Swingle & G. L. Eckert. 2009. Effects of diet, stocking
density, and substrate on survival and growth of hatchery-cultured
red king crab (Paralithodes camtschaticus) juveniles in Alaska, USA.
Aquaculture 293:68–73.
Daly, B., J. S. Swingle & G. L. Eckert. 2011. Evaluation of astaxanthin
and calcium as dietary supplements for hatchery-cultured red king
crab (Paralithodes camtschaticus) juveniles. Aquaculture.
IMPORTANCE OF LIPIDS DURING EARLY DEVELOPMENT OF RED KING CRAB 163
Dunstan, G. A., J. V. Volkman, S. M. Barrett, J. Leroi & S. W. Jeffrey.
1994. Essential polyunsaturated fatty acids from 14 species of
diatom (Bacillariophyceae). Phytochemistry 35:155–161.
Epelbaum, A. B., R. R. Borisov & N. P. Kovatcheva. 2006. Early
development of the red king crab Paralithodes camtschaticus from
the Barents Sea reared under laboratory conditions: morphology
and behaviour. J. Mar. Biol. Assoc. UK 86:317–333.
Epelbaum, A. B. & N. P. Kovatcheva. 2005. Daily food intakes and
optimal food concentrations for red king crab (Paralithodes camt-
schaticus) larvae fed Artemia nauplii under laboratory conditions.
Aquacult. Nutr. 11:455–461.
FAO. 2010. The state of world fisheries and aquaculture 2010. Rome:
Food and Agriculture Organization of the United Nations. Rome:
FAO. 218 pp.
Figueiredo, J., R. van Woesik, J. Lin & L. Narciso. 2009. Artemia
franciscana enrichment model: how to keep them small, rich and
alive? Aquaculture 294:212–220.
Folch, J., M. Lees & S. G. Sloane. 1957. A simple method for the
isolation and purification of total lipids from animal tissues. J. Biol.
Chem. 22:497–509.
Fraser, A. J. 1989. Triacylglycerol content as a condition index for fish,
bivalve, and crustacean larvae.Can. J. Fish. Aquat. Sci. 46:1868–1873.
Gallager, S. M., R. Mann & G. C. Sasaki. 1986. Lipid as an index of
growth and viability in three species of bivalve larvae. Aquaculture
56:81–103.
Hamasaki, K. & S. Kitada. 2008. Potential of stock enhancement for
decapod crustaceans. Rev. Fish. Sci. 16:164–174.
Harding, G. C. & A. J. Fraser. 1999. Application of the triacylglycerol/
sterol condition index to the interpretation of larval lobsterHomarus
americanus distribution in close proximity to Georges Bank, Gulf of
Maine. Mar. Ecol. Prog. Ser. 186:239–254.
Holme,M.- H., P. C. Southgate&C. Zeng. 2007. Survival, development
and growth response of mud crab, Scylla serrata, megalopae fed
semi-purified diets containing various fish oil:corn oil rations.
Aquaculture 269:427–435.
Kattner, G., M. Graeve, J. A. Calcagno, G. A. Lovrich, S. Thatje & K.
Anger. 2003. Lipid, fatty acid and protein utilization during
lecithotrophic larval development of Lithodes santolla (Molina)
and Paralomis granulose (Jacquinot). J. Exp. Mar. Biol. Ecol.
292:61–74.
Kharlamenko, V. I., S. I. Kiyashko, A. B. Imbs & D. I. Vyshkvartzev.
2001. Identification of food sources of invertebrates from the seagrass
Zostera marina community using carbon and sulfur stable isotope
ratio and fatty acid analyses. Mar. Ecol. Prog. Ser. 220:103–117.
Lautier, J. & J.- G. Lagarrigue. 1987. Lipid metabolism of the female
crabPachygrapsus marmoratus during themolt cycle.Biochem. Syst.
Ecol. 15:611–619.
Limbourn, A. J. & P. D. Nichols. 2009. Lipid, fatty acid and protein
content of late larval to early juvenile stages of the western rock lobster,
Panulirus cygnus. Comp. Biochem. Physiol. Part B 152:292–298.
Litzow, M. A., K. M. Bailey, F. G. Prahl & R. Heintz. 2006. Climate
regime shifts and reorganization of fish communities: the essential
fatty acid limitation hypothesis. Mar. Ecol. Prog. Ser. 315:1–11.
Meade, M. E. & S. E. Watts. 1995. Weight gain and survival of juvenile
Australian crayfish Cherax quadricarinatus fed formulated feeds.
J. World Aquacult. Soc. 26:469–474.
Meglen, R.R. 1992. Examining large databases: a chemometric approach
using principal component analysis. Mar. Chem. 39:217–237.
Mercier, L., I. Racotta, G. Yepiz-Plascencia, A. Muhlia-Almazan, R.
Civera, M. F. Quinones-Arreola, M. Wille, P. Sorgeloos & E.
Palacios. 2009. Effect of diets containing different levels of highly
unsaturated fatty acids on physiological and immune responses in
Pacific whiteleg shrimp Litopenaeus vannamei (Boone) exposed to
handling stress. Aquat. Res. 40:1849–1863.
Merican, Z. O. & K. F. Shim. 1996. Qualitative requirements of
essential fatty acids for juvenile, Penaeus monodon. Aquaculture
147:275–291.
Morrison, W. R. & L. M. Smith. 1964. Preparation of fatty acid methyl
esters and dimethylacetals from lipids with boron fluoridemethanol.
J. Lipid Res. 5:600–608.
Nair, C. M., K. R. Salin & K. A. Kumar. 2007. Use of Cyclop-eeze as
a substitute for Artemia nauplii in larval rearing of giant freshwater
prawn Macrobrachium rosenbergii (De Man 1879). Aquacult. Nutr.
13:88–93.
Nghia, T. T.,M.Wille, S. Vandendriessche, Q. TheVinh& P. Sorgeloos.
2007. Influence of highly unsaturated fatty acids in live food on
larviculture of mud crab Scylla paramamosain (Estampador 1949).
Aquacult. Res. 38:1512–1528.
O’Halloran, M. J. & R. K. O’Dor. 1988. Molt cycle of male snow crabs,
Chionoecetes opilio, from observations of external features, setal
changes, and feeding behavior. J. Crustac. Biol. 8:164–176.
Ouellet, P. & C. T. Taggart. 1992. Lipid condition and survival in shrimp
(Pandalus borealis) larvae. Can. J. Fish. Aquat. Sci. 49:368–378.
Parrish, C. C. 1987. Separation of aquatic lipid classes by Chromarod
thin-layer chromatography with measurement by Iatroscan flame
ionization detection. Can. J. Fish. Aquat. Sci. 44:722–731.
Parrish, C. C. 1988. Dissolved and particulate marine lipid classes:
a review. Mar. Chem. 23:17–40.
Parrish, C. C. 2009. Essential fatty acids in aquatic food webs. In: M. T.
Arts, M. T. Brett & M. J. Kainz, editors. Lipids in aquatic
ecosystems. Dordrecht: Springer. pp. 309–326.
Parrish, C. C., T. A. Abrajano, S. M. Budge, R. J. Helleur, E. D.
Hudson, K. Pulchan & C. Ramos. 2000. Lipid and phenolic
biomarkers in marine ecosystems: analysis and applications. In:
P. J. Wangersky, editor. Marine chemistry. Heidelberg: Springer-
Verlag. pp. 193–223.
Parrish, C. C., N. J. Turner, R. E. Ommer & S. M. Solberg. 2008.
Conclusions: what food security in coastal communities really
means. In: C. C. Parrish, N. J. Turner & S. M. Solberg, editors.
Resetting the kitchen table: food security, culture, health and
resilience in coastal communities. New York: Nova Science Pub-
lishers. pp. 191–198.
Pirtle, J. L. & A. W. Stoner. 2010. Red king crab (Paralithodes
camtschaticus) early post-settlement habitat choice: structure, food
and ontogeny. J. Exp. Mar. Biol. Ecol. 393:130–137.
Reddy, P. S., P. R. Reddy &G. P. C. Nagaraju. 2004. The synthesis and
effects of prostaglandins on the ovary of the crabOziotelphusa senex
senex. Gen. Comp. Endo. 135:35–41.
Sanchez-Paz, A., F. Garcia-Carreno, A. Muhlia-Almazan, A. B.
Peregrino-Uriarte, J. Hernandez-Lopez & G. Yepiz-Plascencia.
2006. Usage of energy reserves in crustaceans during starvation:
status and future directions. Insect Biochem. Mol. Biol. 36:241–249.
Sargent, J. R. 1995. Origins and functions of egg lipids: nutritional
implications. In: N. R. Bromage & J. R. Roberts, editors. Brood-
stock management and egg and larval quality. Cambridge, UK:
Oxford University Press. pp. 353–372.
Sargent, J., L. McEvoy, A. Estevez, G. Bell, M. Bell, J. Henderson &D.
Tocher. 1999. Lipid nutrition of marine fish during early develop-
ment: current status and future directions.Aquaculture 179:217–229.
Sasaki, G. C., J. M. Capuzzo & P. Biesiot. 1986. Nutritional and
bioenergetic considerations in the development of the American
lobsterHomarus americanus. Can. J. Fish. Aquat. Sci. 43:2311–2319.
Sheen, S. S. & S. W. Wu. 2002. Essential fatty acid requirements of
juvenile mud crab, Scylla serrata (Forskal, 1775) (Decapoda,
Scyllaridae). Crustaceana 75:1387–1401.
Stevens, B. G., editor. 2006. Alaska crab stock enhancement and
rehabilitation: workshop proceedings. Alaska Sea Grant College
Program AK-SG-06-04. Fairbanks, AK: Alaska Sea Grant College
Program, University of Fairbanks. p. 88.
Stevens, C. J., D. Deibel & C. C. Parrish. 2004. Species-specific differences
in lipid composition and omnivory inArctic copepods collected in deep
water during autumn (NorthWater Ploynya).Mar. Biol. 144:905–915.
Stoner, A. W., M. L. Ottmar & S. A. Haines. 2010a. Temperature and
habitat complexity mediate cannibalism in red king crab: observations
COPEMAN ET AL.164
on activity, feeding and prey defense mechanisms. J. Shellfish Res.
29:1005–1012.
Stoner, A. W., M. L. Ottmar & L. A. Copeman. 2010b. Temperature
effects on the molting, growth, and lipid composition of newly-
settled red king crab. J. Exp. Mar. Biol. Ecol. 393:138–147.
Sui, L., M. Wille, Y. Cheng & P. Sorgeloos. 2007. The effect of dietary
n-3 HUFA levels and DHA/EPA ratios on growth, survival and
osmotic stress tolerance of Chinese mitten crab Eriocheir sinensis
larvae. Aquaculture 272:139–150.
Suprayudi, M. A., T. Takeuchi, & K. Hamasaki. 2004. Essential fatty
acids for larval mud crab Scylla serrata: implications of lack of the
ability to bioconvert C18 unsaturated fatty acids to highly un-
saturated fatty acids. Aquaculture 231:403–416.
Tizol-Correa, R., L. Carreon-Palau, B. O. Arredondo-Vega, G.Murugan,
L. Torrentera, T. D. N. J. Maldonado-Montiel & A. M. Maeda-
Martınez. 2006. Fatty acid composition of Artemia (Branchiopoda:
Anostraca) cysts from tropical salterns of southern Mexico and Cuba.
J. Crustac. Biol. 26:503–509.
Wen, X., L. Chen, Y. Ku & K. Zhou. 2006. Effect of feeding and lack
of food on the growth, gross biochemical and fatty acid compo-
sition of juvenile crab, Eriocheir sinensis. Aquaculture 252:598–
607.
Wu, X., Y. Cheng, L. Sui, C. Zeng, P. C. Southgate & X. Yang. 2007.
Effect of dietary supplementation of phospholipids and highly un-
saturated fatty acids on reproductive performance and offspring
quality of Chinese mitten crab, Eriocheir sinensis (H. Milne-
Edwards), female broodstock. Aquaculture 272:602–613.
Zheng, J. & G. H. Kruse. 2000. Recruitment patterns of Alaskan crabs
in relation to decadal shifts in climate and physical oceanography.
ICES J. Mar. Sci. 57:438–451.
Zhou, S., T. C. Shirley & G. H. Kruse. 1998. Feeding and growth of the
red king crab Paralithodes camtschaticus under laboratory condi-
tions. J. Crustac. Biol. 18:337–345.
Zmora, O., A. Findiesen, J. Stubblefield, V. Frenkel & Y. Zohar. 2005.
Large-scale juvenile production of the blue crab Callinectes sapidus.
Aquaculture 244:129–139.
IMPORTANCE OF LIPIDS DURING EARLY DEVELOPMENT OF RED KING CRAB 165