The Economics of Powder River Basin Coalbed Methane Development Prepared for: U.S. Department of Energy Prepared by: Gregory C. Bank Vello A. Kuuskraa [email protected] Advanced Resources International, Inc. January 2006
Disclaimer This material was prepared as an account of work sponsored by an agency of the United States Government. Neither the United States nor the United States Department of Energy, nor any of their employees, makes any warranty, express or implied, or assumes any legal liability or responsibility for the accuracy, completeness, or usefulness of any information, apparatus, product, or process disclosed, or represents that its use would not infringe privately owned rights.
The Economics of Powder River Basin Coalbed Methane Development
i January 2006
DEPARTMENT OF ENERGY
FOREWORD
In November 2002, the U.S. Department of Energy (DOE), Office of Fossil Energy (FE), and the Department’s National Energy Technology Laboratory (NETL) published the Powder River Basin Coalbed Methane Development and Produced Water Management Study. The study found that the Powder River Basin contains a considerably larger volume of coalbed methane (CBM) resources than previously estimated, and that development of these resources could be significantly impacted by the costs and economic feasibility of produced water management practices and requirements. The study outlined alternative water disposal options, clearly identified their costs, and made a substantive argument that requiring active treatment of produced water (with then current reverse osmosis technology) would substantially reduce the amount of economically recoverable Powder River Basin CBM. Since November 2002, the domestic natural gas marketplace has changed significantly. Prices have risen to extraordinarily high levels, reflecting the pressure increased natural gas demand has placed on our aging, and vulnerable, domestic natural gas exploration, production, processing, and transportation infrastructure. Natural gas exploration and production costs have also seen a sharp rise as the demand for oilfield equipment and workers has grown, and concerns over the environmental impact of natural gas operations have increased the lag time experienced between initial well drilling and the start of natural gas production. These changes in the natural gas marketplace are reflected in Powder River Basin CBM development. Over the past three years approximately 5,500 new CBM wells have been drilled, more areas of the basin have been opened to drilling, the gas gathering and transportation infrastructure has been expanded, and produced water management techniques and technologies have improved. However, due to this increased activity, there is substantially more information available regarding gas content of the basin’s coals, the quantity and quality of produced water in various parts of the basin, and the overall economics of Powder River Basin CBM development. Increased CBM development on federal lands and interest in development on Native American lands in the Powder River Basin has also placed greater demands on federal and state agencies charged with evaluating the environmental impact of this development. The Department of the Interior (DOI), Bureau of Land Management (BLM), updated its Resource Management Plan for the basin using an Environmental Impact Statement (EIS) to evaluate the environmental impacts associated with CBM development in the region. The Environmental Protection Agency (EPA) (Region 8) is conducting a study of Best Professional Judgment (BPJ) general permit requirements for CBM produced water on Indian Reservations in the region. The BLM EIS and the EPA Region 8 BPJ Study (and possible follow-on actions) will have a significant impact on the development of CBM reserves in the Powder River Basin.
The Economics of Powder River Basin Coalbed Methane Development
ii January 2006
Recognizing this, FE and NETL updated the November 2002 study. This new study, The Economics of Powder River Basin Coalbed Methane Development, examines recent data on actual Powder River Basin CBM well production performance and adjusts the prior study’s CBM recovery model to reflect this new data. The study updates costs associated with CBM development in the Powder River Basin and, via a “cost multiplier,” adjusts those costs sensitive to energy price changes. The study also updates water management costs and identifies and incorporates costs of utilizing ion exchange technology. The present study concludes, as had our earlier study, that the choice of CBM produced water management practice has a significant effect on volumes of CBM economically producible from the Powder River Basin, and particularly from the basin’s Indian Reservation lands. The more stringent and costly the water management option, the less of the CBM resource in the basin that will be economic, generating lower domestic gas production and lower public revenues. The present study is one of a number of DOE sponsored studies that examine the issues surrounding CBM development. These include development of CBM development best management practices utilizing Geographic Information System (GIS) technologies, a CBM primer for the public, a handbook for the development and review of environmental documents required for CBM projects, analysis of the options for beneficial use of CBM produced water, research on technologies for produced water treatment, and the carbon dioxide (CO2) sequestration potential of CBM reservoirs. DOE recognizes that CBM produced water represents a valuable resource in the Powder River Basin and elsewhere in the arid western United States, and that it can be managed with no significant adverse environmental impacts. For more information about this and other DOE oil and gas environmental projects visit the FE Web site: http://www.fossil.energy.gov or contact Peter Lagiovane at: 202-586-8116.
The Economics of Powder River Basin Coalbed Methane Development
iii January 2006
TECHNICAL PREFACE As with any resource assessment, technical and economic results are the product of the assumptions and methodology used. In this study, key assumptions as well as cost and price data and economic methodologies employed are provided in attached Appendices. Many quantities shown in various tables have been subject to rounding; therefore, aggregation of basic and intermediate quantities may differ from the values shown. Approximately 5,500 more wells have been drilled in the Powder River Basin since we published our last study. Therefore, we examined well performance for areas of the basin that have seen the most CBM development in the past several years. This involved collecting new gas and water production data from the Big George and Wyodak coal seams and updating the “type curves” for these coal seams. These new data and “type curves” were incorporated into the assessment model. In addition, several other modifications and new assumptions were made to this model. These revisions include:
• an updated gas content isotherm based on data accumulated since the above reference study was published,
• modified produced water handling costs to be consistent with more recent basin practices,
• a wider range of commodity prices in addition to more robust economic evaluation criteria, and
• an updated coal seam "type wells" using more recent gas and water production data.
It is important to remember that the current study presents only a snapshot of Powder River Basin CBM development through the first half of 2005. Future development in the basin will make new data and interpretations available, which will lead to a more complete description of the coals and their fluid flow properties and a better understanding of the economics of Powder River Basin CBM development.
The Economics of Powder River Basin Coalbed Methane Development
iv January 2006
TABLE OF CONTENTS
I. INTRODUCTION 1.1 Background 1-1 1.2 Scope of Work 1-1 1.3 Summary of Methodology 1-2
II. SUMMARY OF FINDINGS
The gas content of the basin's coals and the quantity and quality of the produced water contained in these coals can vary significantly. The findings outlined below are based on economic cashflows for coal seams found in each township of the basin - over 500 township-seam combinations in total. Although the production characteristics of each seam were developed from an original group of fourteen "type wells" representing the major seams in the basin, the findings listed below may not apply to the actual production characteristics of every well in that seam. 1. The choice of the water disposal and management option directly
impacts the volume of economically producible CBM from the Powder River Basin. 2-1
2. At lower wellhead natural gas prices, the impact of progressively more stringent water disposal options is more severe; at higher wellhead natural gas prices, the impact is less severe as progressively more costly water management practices can be accommodated at the economic threshold used in the model. 2-2
3. Similar to the impacts in the overall PRB, alternative water
management and disposal practices have a significant impact on the economic production of CBM on Indian (Northern Cheyenne and Crow) Reservation lands. 2-8
4. At low wellhead gas prices of $3.00/Mcf, the CBM production
impact on Indian Reservation lands in the PRB of using higher cost water management and disposal practices widens. 2-13
5. At higher wellhead gas prices of $7.00/Mcf, the CBM production
impact on Indian Reservation lands in the PRB of using higher cost water management and disposal practices is considerably less. 2-13
6. Progressively more stringent water disposal and management
options also reduce federal, state and local tax receipts that would accrue from royalty and production tax payments on CBM production. 2-18
The Economics of Powder River Basin Coalbed Methane Development
v January 2006
III. STUDY APPROACH AND METHODOLOGY 1. Basin Area 3-1 2. Basin Structure and Stratigraphy 3-1 3. Reservoir Parameters 3-5 4. Estimating Gas and Water Production 3-9 5. Produced Water Quality 3-9 6. Partial Reverse Osmosis Treatment with Surface Discharge 3-18
IV. BASIC COST AND ECONOMICS MODEL
1. Introduction 4-1 2. Capital Costs for PRB CBM Well 4-1 3. O&M Costs for PRB CBM Well 4-3 4. Gas, Compression, and Fuel Use 4-3 5. Other Considerations 4-3 6. Gas Transportation and Basis Differentials 4-4 7. Economic Scenarios 4-5
V. ANALYSIS OF COALBED METHANE PRODUCTION AND WATER MANAGEMENT ON INDIAN RESERVATION LANDS IN THE PRB 1. Background 5-1 2. Assembling the CBM Resource Database 5-1 3. Estimating Technically and Economically Recoverable Resources 5-7 4. Results of the Analysis 5-7
APPENDIX A Cost–Price Relationships for Powder River Basin CBM
Development APPENDIX B Summary of Well & Infrastructure Costs APPENDIX C Summary of Water Management Practices and Costs
The Economics of Powder River Basin Coalbed Methane Development
vi January 2006
List of Tables
Table 1 Estimated Economically Recoverable PRB CBM at $4.00/Mcf Wellhead Price ($5.70/Mcf at Henry Hub) and 15% IRR 2-2
Table 2. Estimated Economically Recoverable PRB CBM at $3 and $7.00/Mcf Wellhead Price ($4.50/Mcf to $9.30/Mcf at Henry Hub) and 15% IRR 2-4
Table 3. Estimated Relationship of Wellhead Natural Gas Prices and Water Management Practices to Economically Producible CBM from the Powder River Basin, Assuming a 15% Hurdle Rate 2-5
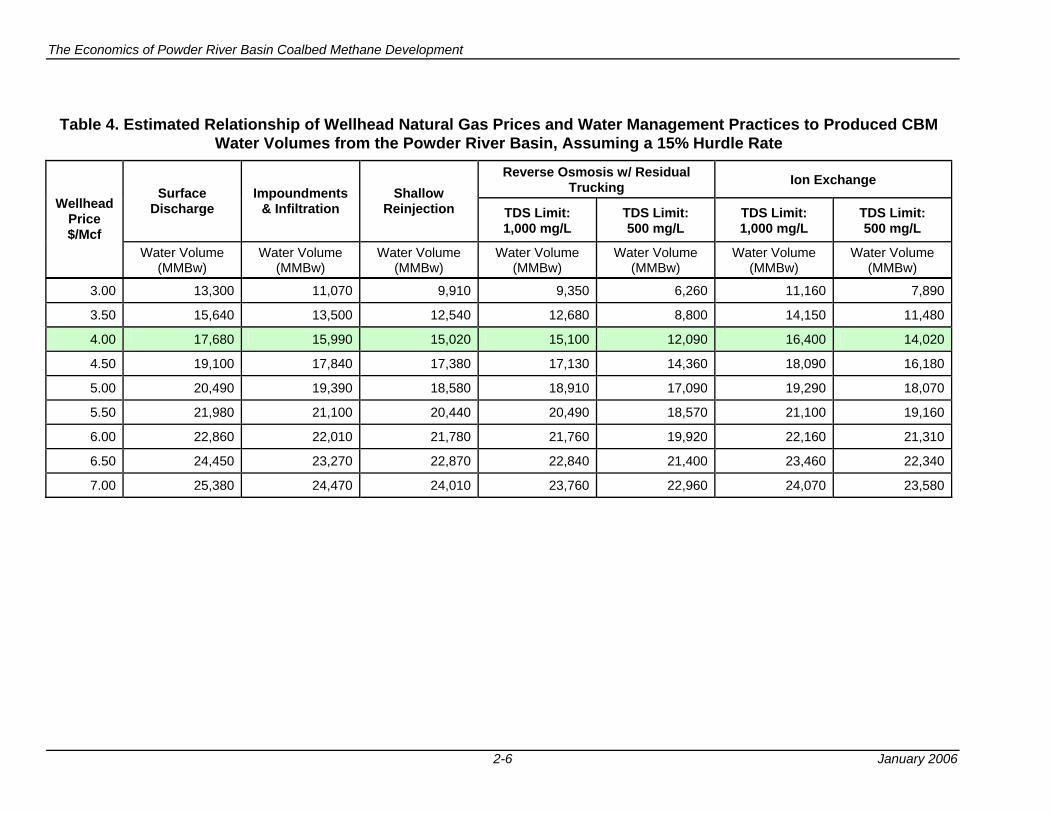
Table 4. Estimated Relationship of Wellhead Natural Gas Prices and Water Management Practices to Produced CBM Water Volumes from the Powder River Basin, Assuming a 15% Hurdle Rate 2-6
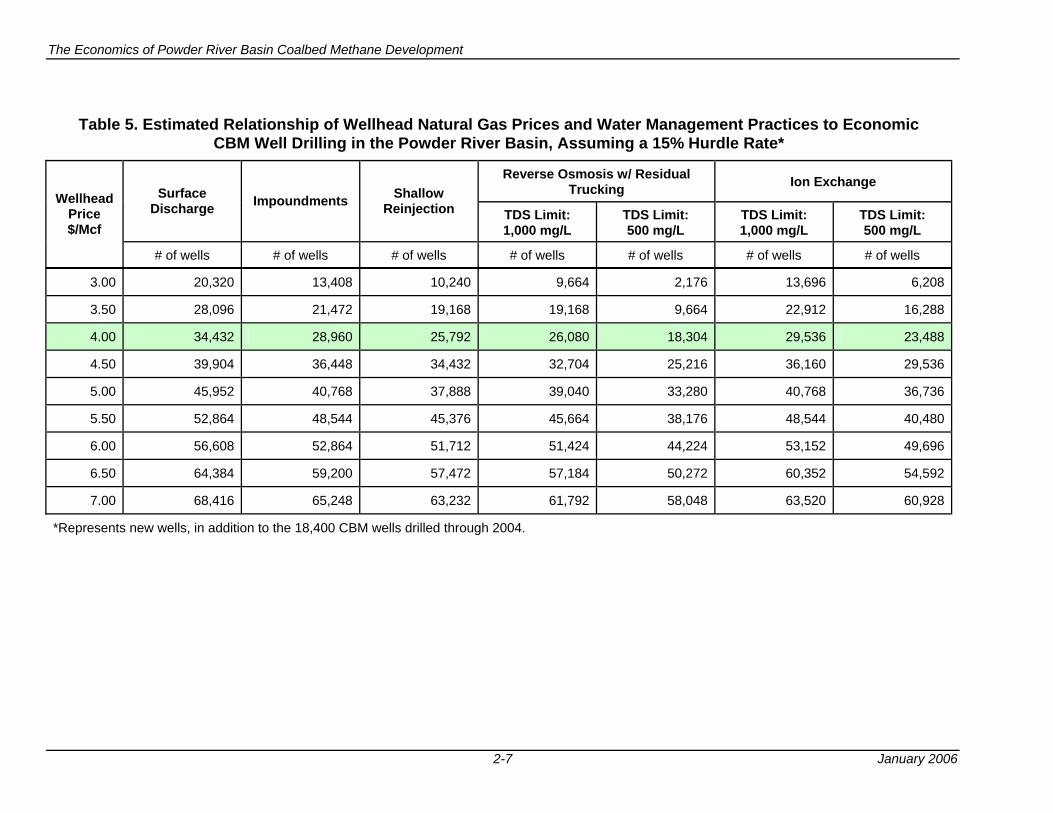
Table 5. Estimated Relationship of Wellhead Natural Gas Prices and Water Management Practices to Economic CBM Well Drilling in the Powder River Basin, Assuming a 15% Hurdle Rate 2-7
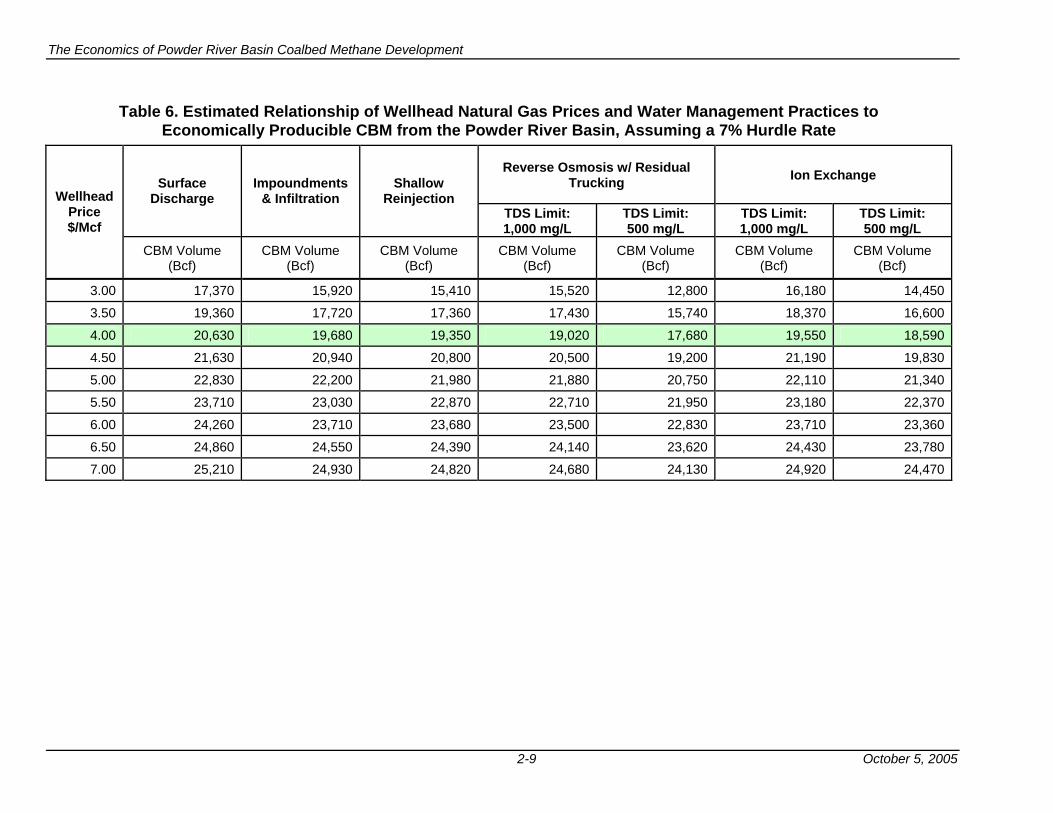
Table 6. Estimated Relationship of Wellhead Natural Gas Prices and Water Management Practices to Economically Producible CBM from the Powder River Basin, Assuming a 7% Hurdle Rate 2-9
Table 7. Estimated Relationship of Wellhead Natural Gas Prices and Water Management Practices to Produced CBM Water Volumes from the Powder River Basin, Assuming a 7% Hurdle Rate 2-10
Table 8. Estimated Relationship of Wellhead Natural Gas Prices and Water Management Practices to Economic CBM Well Drilling in the Powder River Basin, Assuming a 7% Hurdle Rate 2-11
Table 9. Estimated Economically Recoverable CBM from Indian Reservation Lands at $4.00/Mcf Wellhead Price 2-12
Table 10. Estimated Economically Recoverable CBM from Indian Reservation Lands at $3.00/Mcf Wellhead Price 2-13
Table 11. Estimated Economically Recoverable CBM from Indian Reservation Lands at $7.00/Mcf Wellhead Price 2-14
Table 12. Estimated Relationship of Wellhead Natural Gas Prices and Water Management Practices to Economically Producible CBM from Indian Reservations Lands in the Powder River Basin, Assuming 15% Hurdle Rate and 16.7% Royalty 2-15
Table 13. Estimated Relationship of Wellhead Natural Gas Prices and Water Management Practices to Produced CBM Water Volumes 2-16
Table 14. Estimated Relationship of Wellhead Natural Gas Prices and Water Management Practices to Economic CBM Well Drilling from Indian Reservation Lands in the Powder River Basin, Assuming 15% Hurdle Rate and 16.7% Royalty 2-17
Table 15. Estimated Change in Public Revenues with Increasingly Stringent Water Management 2-19
Table 16. Estimated Relationship of Wellhead Natural Gas Prices and Water Management Practices to Federal Royalties from CBM Production in the Powder River Basin 2-20
The Economics of Powder River Basin Coalbed Methane Development
vii January 2006
Table 17. Estimated Relationship of Wellhead Natural Gas Prices and Water Management Practices on State Royalty and Severance/Ad Valorem Taxes from CBM Production in the Powder River Basin. (million $) 2-21
Table 18A.
Reservoir Properties for One Township in Northeast Wyoming 3-7
Table 18B.
Reservoir Properties for Particular Coal Seams in the Selected Areas of the PRB 3-8
Table 19. History Matched "Type-Wells" for Particular Coal Seams in Selected Areas of the PRB 3-11
Table 20. Capital Costs for Illustrative CBM Well, Powder River Basin 4-2Table 21. O&M/G&A Costs for Illustrative CBM Well, Powder River Basin 4-3Table 22. The Relationship between Natural Gas Prices at the Wellhead, the
Wyoming Pool hub and the Henry Hub ($/Mcf) 4-4Table 23. Estimated Relationship of Wellhead Natural Gas Prices and Water
Management Practices to Economically Producible CBM from Indian Reservations Lands in the Powder River Basin, Using a 15% Hurdle Rate 5-8
Table 24. Estimated Relationship of Wellhead Natural Gas Prices and Water Management Practices to Produced CBM Water Volumes from Indian Reservations Lands in the Powder River Basin, Using a 15% Hurdle Rate 5-10
Table 25. Estimated Relationship of Wellhead Natural Gas Prices and Water Management Practices to Economic CBM Well Drilling on Indian Reservations Lands in the Powder River Basin, Using a 15% Hurdle Rate 5-12
Table 26. Estimated Relationship of Wellhead Natural Gas Prices and Water Management Practices to Economic CBM Well Drilling on Indian Reservations Lands in the Powder River Basin, Using a 7% Hurdle Rate 5-14
Table 27. Estimated Relationship of Wellhead Natural Gas Prices and Water Management Practices to Produced CBM Water Volumes from Indian Reservations Lands in the Powder River Basin, Using a 7% Hurdle Rate 5-16
Table 28. Estimated Relationship of Wellhead Natural Gas Prices and Water Management Practices to Economic CBM Well Drilling on Indian Reservations Lands in the Powder River Basin, Using a 7% Hurdle Rate 5-18
The Economics of Powder River Basin Coalbed Methane Development
viii January 2006
List of Figures
Figure 1. Outline and Location of Powder River Basin 3-2Figure 2. Powder River Basin Partitions 3-3Figure 3. Coal-Bearing Units of the Tongue River Member of the Fort Union Formation 3-4Figure 4. Powder River Basin CBM Isotherm 3-6Figure 5. Actual and History Matched Gas and Water Production per Well from a Group of
300 Anderson Coal Seam Wells in the Northeastern Portion of the PRB 3-10Figure 6. Recent Big George CBM Development 3-12Figure 7. Townships with CBM Produced Water TDS Data Provided by EPA/ERG 3-13Figure 8. Townships with CBM Produced Water TDS Data Available from the WOGCC 3-15Figure 9. Townships with CBM Produced Water TDS Data in USGS Open File Report 3-16Figure 10. Regional Distribution of CBM Produced Water TDS Data for the Powder River
Basin 3-17Figure 11. Partial RO Treatment with Surface Discharge 3-19Figure 12. Outline of the Northern Cheyenne and Crow Reservations In the Powder River
Basin 5-2Figure 13. Outline and Location Map for the Northern Cheyenne Reservation 5-3Figure 14. Outline and Location Map for the Crow Reservation 5-4Figure 15. Data Sources for Constructing the Coal Resource Database for the Crow and
Northern Cheyenne Reservations 5-6
The Economics of Powder River Basin Coalbed Methane Development
1-1 January 2006
I. Introduction 1.1 Background. In November 2002, the U.S. Department of Energy (DOE), Office of Fossil Energy (FE), and the Department’s National Energy Technology Laboratory (NETL), published the Powder River Basin Coalbed Methane Development and Produced Water Management Study. The study, conducted for the Department by Advanced Resources International (ARI), outlined the geophysical and economic realities of CBM development in the basin, and identified the impact on this development of various CBM produced water management processes and technologies. The study described alternative produced water disposal options, clearly identified their costs, and made a compelling argument that requiring active treatment of produced water (using then current reverse osmosis technology) would substantially reduce the amount of economically recoverable Powder River Basin CBM. Since November 2002, the domestic natural gas marketplace has changed significantly. Prices have risen to extraordinarily high levels while exploration and production costs have increased as the demand for oilfield equipment and workers has soared and increased concerns over the environmental impact of natural gas operations have increased the lag time experienced between initial well drilling and the start of natural gas production. These changes are reflected in the Powder River Basin. Over the past three years approximately 5,000 new CBM wells have been drilled, more areas of the basin have been opened to drilling, the gas gathering and transportation infrastructure has been expanded, and produced water management techniques and technologies have improved. As a result of this activity, there is substantially more information available regarding the gas content of the basin’s coals, the quantity and quality of produced water in various parts of the basin, and the overall economics of Powder River Basin CBM development. Recognizing this, DOE and FE requested ARI to augment its CBM resource database and use its economic models to re-evaluate the impact of produced water management and disposal options on Powder River Basin CBM development. This report transmits ARI’s analysis and findings.
1.2 Scope of Work. The Scope of Work for this Powder River Basin CBM Resource and Economic Modeling task involved assembling new data and performing analyses of alternative produced water disposal and management options associated with CBM development in this basin. Accomplishing this Scope of Work involved performing the following four tasks:
The Economics of Powder River Basin Coalbed Methane Development
1-2 January 2006
Task 1. Update Capital and Operating Costs in the Powder River Basin CBM Play to Reflect Current Conditions. ARI re-examined all capital costs associated with CBM development in the Powder River Basin. Updated well drilling, lease equipment, and operating and maintenance costs were compiled. In addition, “price-cost” relationship equations were constructed for each of these cost areas to account for changes in costs associated with changes in natural gas price. Task 2. Update Costs and Performance of Five Water Management Cases and Add Two Cases. ARI examined the costs associated with five water management practices covered in previous studies. These were Surface Discharge, Impoundment/Infiltration, Shallow Reinjection, and Reverse Osmosis (RO) at two water discharge quality levels. Costs and performance for each of these water management practices were updated to reflect current conditions. Costs for two additional water management cases (using Ion Exchange, at two water discharge quality levels) were compiled and incorporated into the economic model. Task 3. Examine Well Performance and Update Production Volumes, as Necessary. ARI examined well performance for coal seams of the basin, such as Big George, that have seen the most CBM development in the past several years. This involved collecting new gas and water production data from new wells drilled into the Big George coal seam and updating the “type curves” for these coal seams. These new data and “type curves” were incorporated into the assessment model. Task 4. Incorporate Additional Economic Parameters Into the Model. Five major modifications were made to the CBM Economic Model: 1) a delay factor was incorporated to account for the increased lag time experienced between initial well drilling and start of CBM production as observed from the large number of shut-in CBM wells reported by the state of Wyoming; 2) a modified gas price track was implemented, ranging from $3.00/mcf (wellhead) to $7.00/mcf (wellhead), in $0.50/mcf increments; 3) a new relationship was developed between gas price (at Henry Hub) and the “basis” differential, to replace the single “basis” differential in the original CBM Economic Model; 4) new capital investment expensing and depreciation schedules and state and federal tax rates were added to convert the before tax cash flow to an after tax basis; and 5) two rate of return “hurdle rates” were incorporated into the model, a minimum value requested by the Environmental Protection Agency (EPA) of 7% (after tax) and a more common industry standard of 15% (after tax). The latter reflects the minimum rate of return hurdle rate that producers use to evaluate CBM economics versus competing capital investments. For each wellhead gas price case and water management and disposal option, the updated CBM Economic Model provides: volume of economically producible CBM resources, volume of produced water associated with economically producible CBM resources, amounts of federal and state royalties generated from CBM production, and amounts of state ad valorem and production taxes generated from CBM production.
1.3 Summary of Methodology. The coal database and economic models used in this study were based on the previously published study, Powder River Coalbed Methane Development and Produced Water Management Study (DOE/NETL-2003/1184), prepared for DOE/NETL by ARI. The field development practice assumes one well per coal seam (single-seam completion technology) as opposed to more advanced, but not widely used multi-seam technology where one well is used to complete and produce a number of
The Economics of Powder River Basin Coalbed Methane Development
1-3 January 2006
coal seams. In addition to the changes to the CBM Economic Model discussed above several additional modifications and new assumptions were made to this model. These revisions include an updated gas content isotherm, based on data accumulated since the above reference study was published; modified produced water handling costs, to be consistent with more recent basin practices; and, updated coal seam "type wells" using additional gas and water production data since the publication of the above cited DOE/NETL report. The major modifications incorporated into the CBM cost and performance methodology are projected in a series of Appendices to this report:
• Appendix A, “Cost-Price Relationships for Powder River Basin CBM Development,” presents the data and equations used in the model that link changes in gas prices with changes in costs.
• COST–PRICE RELATIONSHIPS FOR POWDER RIVER BASIN CBM DEVELOPMENt • Appendix B, “Summary of Well Drilling and Infrastructure Costs” provides an overview
of the CBM Cost and Economic Model.
• Appendix C, “Summary of Water Management Practices and Costs” provides an in-depth presentation of the costs of alternative CBM-produced water management practices in the Powder River Basin.
The Economics of Powder River Basin Coalbed Methane Development
2-1 January 2006
II. Summary of Findings The analysis shows that the choice of the CBM-produced water management practice has a significant effect on the volumes of CBM that may become economically producible from the Powder River Basin and particularly from the basin’s Indian Reservation lands. The more stringent and costly the water management option, the less of the CBM resource in the basin that will be economic, generating lower domestic gas production and lower public revenues. The overall study findings are presented in more detail below.
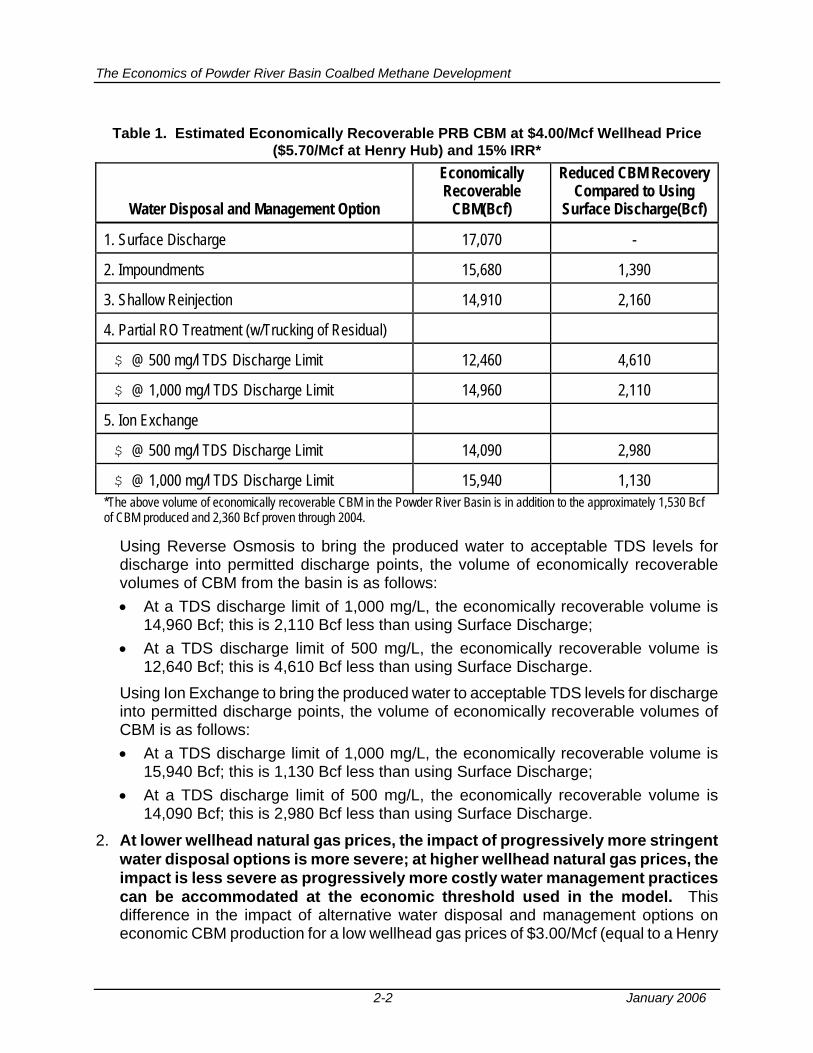
1. The choice of the water disposal and management option directly impacts the volume of economically producible coalbed methane from the Powder River Basin. Using a $4 per Mcf wellhead natural gas price (approximately equal to a Henry Hub “marker price” of $5.70 per Mcf) and a 15% rate of return economic “hurdle rate” (representing current industry investment decision-making criteria), the impacts of each water disposal and management option on economic CBM production are discussed below and tabulated on Table 1: • With Surface Discharge of produced waters, 17,070 Bcf of CBM is economically
recoverable from the Powder River Basin. • With Impoundments and Infiltration of produced water (a somewhat more costly
water management options than surface disposal), 15,680 Bcf of CBM is economically recoverable from the Powder River Basin; this is 1,390 Bcf less than with Surface Discharge.
• With Shallow Reinjection of produced water, 14,910 Bcf of CBM is economically recoverable from the Powder River Basin; this is 2,160 Bcf less than with Surface Discharge.
The Economics of Powder River Basin Coalbed Methane Development
2-2 January 2006
Table 1. Estimated Economically Recoverable PRB CBM at $4.00/Mcf Wellhead Price
($5.70/Mcf at Henry Hub) and 15% IRR*
Water Disposal and Management Option
Economically Recoverable
CBM(Bcf)
Reduced CBM Recovery Compared to Using
Surface Discharge(Bcf)
1. Surface Discharge 17,070 -
2. Impoundments 15,680 1,390
3. Shallow Reinjection 14,910 2,160
4. Partial RO Treatment (w/Trucking of Residual)
$ @ 500 mg/l TDS Discharge Limit 12,460 4,610
$ @ 1,000 mg/l TDS Discharge Limit 14,960 2,110
5. Ion Exchange
$ @ 500 mg/l TDS Discharge Limit 14,090 2,980
$ @ 1,000 mg/l TDS Discharge Limit 15,940 1,130 *The above volume of economically recoverable CBM in the Powder River Basin is in addition to the approximately 1,530 Bcf of CBM produced and 2,360 Bcf proven through 2004.
Using Reverse Osmosis to bring the produced water to acceptable TDS levels for discharge into permitted discharge points, the volume of economically recoverable volumes of CBM from the basin is as follows: • At a TDS discharge limit of 1,000 mg/L, the economically recoverable volume is
14,960 Bcf; this is 2,110 Bcf less than using Surface Discharge; • At a TDS discharge limit of 500 mg/L, the economically recoverable volume is
12,640 Bcf; this is 4,610 Bcf less than using Surface Discharge. Using Ion Exchange to bring the produced water to acceptable TDS levels for discharge into permitted discharge points, the volume of economically recoverable volumes of CBM is as follows: • At a TDS discharge limit of 1,000 mg/L, the economically recoverable volume is
15,940 Bcf; this is 1,130 Bcf less than using Surface Discharge; • At a TDS discharge limit of 500 mg/L, the economically recoverable volume is
14,090 Bcf; this is 2,980 Bcf less than using Surface Discharge.
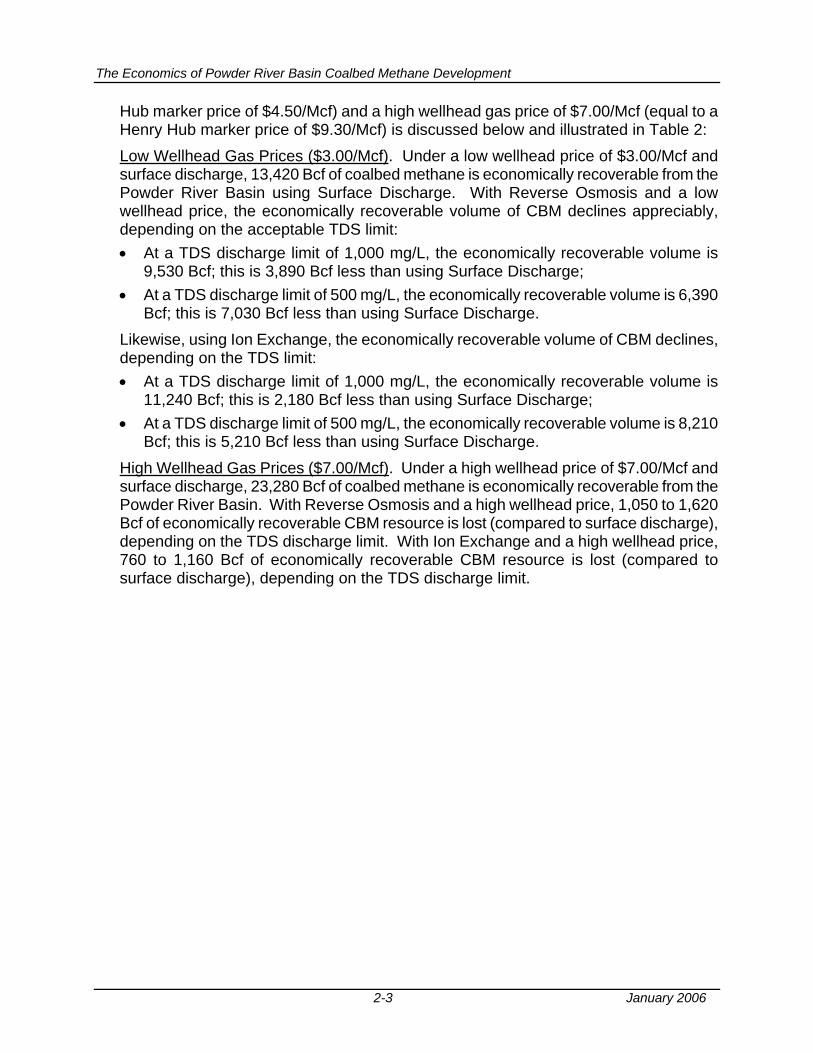
2. At lower wellhead natural gas prices, the impact of progressively more stringent water disposal options is more severe; at higher wellhead natural gas prices, the impact is less severe as progressively more costly water management practices can be accommodated at the economic threshold used in the model. This difference in the impact of alternative water disposal and management options on economic CBM production for a low wellhead gas prices of $3.00/Mcf (equal to a Henry
The Economics of Powder River Basin Coalbed Methane Development
2-3 January 2006
Hub marker price of $4.50/Mcf) and a high wellhead gas price of $7.00/Mcf (equal to a Henry Hub marker price of $9.30/Mcf) is discussed below and illustrated in Table 2: Low Wellhead Gas Prices ($3.00/Mcf). Under a low wellhead price of $3.00/Mcf and surface discharge, 13,420 Bcf of coalbed methane is economically recoverable from the Powder River Basin using Surface Discharge. With Reverse Osmosis and a low wellhead price, the economically recoverable volume of CBM declines appreciably, depending on the acceptable TDS limit: • At a TDS discharge limit of 1,000 mg/L, the economically recoverable volume is
9,530 Bcf; this is 3,890 Bcf less than using Surface Discharge; • At a TDS discharge limit of 500 mg/L, the economically recoverable volume is 6,390
Bcf; this is 7,030 Bcf less than using Surface Discharge. Likewise, using Ion Exchange, the economically recoverable volume of CBM declines, depending on the TDS limit: • At a TDS discharge limit of 1,000 mg/L, the economically recoverable volume is
11,240 Bcf; this is 2,180 Bcf less than using Surface Discharge; • At a TDS discharge limit of 500 mg/L, the economically recoverable volume is 8,210
Bcf; this is 5,210 Bcf less than using Surface Discharge. High Wellhead Gas Prices ($7.00/Mcf). Under a high wellhead price of $7.00/Mcf and surface discharge, 23,280 Bcf of coalbed methane is economically recoverable from the Powder River Basin. With Reverse Osmosis and a high wellhead price, 1,050 to 1,620 Bcf of economically recoverable CBM resource is lost (compared to surface discharge), depending on the TDS discharge limit. With Ion Exchange and a high wellhead price, 760 to 1,160 Bcf of economically recoverable CBM resource is lost (compared to surface discharge), depending on the TDS discharge limit.
The Economics of Powder River Basin Coalbed Methane Development
2-4 January 2006
Table 2. Estimated Economically Recoverable PRB CBM at $3.00 and $7.00/Mcf Wellhead Price ($4.50/Mcf to $9.30/Mcf at Henry Hub) and 15% IRR*
Economically Recoverable CBM
(Bcf)
Reduced CBM Recovery Compared to
Using Surface Discharge
(Bcf)
Water Disposal and Management Option @
$3.00/Mcf @
$7.00/Mcf @
$3.00/Mcf @
$7.00/Mcf
1. Surface Discharge 13,420 23,280 - -
2. Partial RO Treatment (w/Trucking of Residual)
@ 500 mg/l TDS Discharge Limit 6,390 21,660 7,030 1,620
@ 1,000 mg/l TDS Discharge Limit 9,530 22,230 3,890 1,050
3. Ionic Exchange
@ 500 mg/l TDS Discharge Limit 8,210 22,120 5,210 1,160
@ 1,000 mg/l TDS Discharge Limit 11,240 22,520 2,180 760 *The above volume of economically recoverable CBM in the Powder River Basin is in addition to the approximately 1,530 Bcf of CBM produced and 2,360 Bcf proven through 2004.
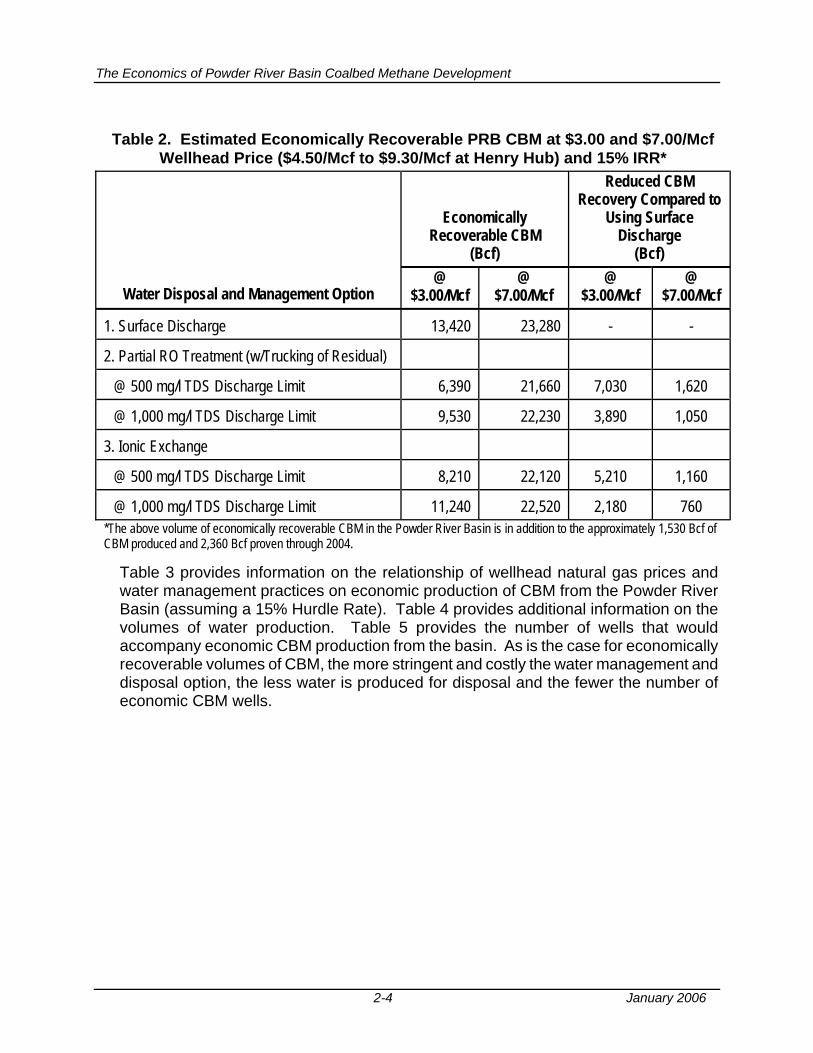
Table 3 provides information on the relationship of wellhead natural gas prices and water management practices on economic production of CBM from the Powder River Basin (assuming a 15% Hurdle Rate). Table 4 provides additional information on the volumes of water production. Table 5 provides the number of wells that would accompany economic CBM production from the basin. As is the case for economically recoverable volumes of CBM, the more stringent and costly the water management and disposal option, the less water is produced for disposal and the fewer the number of economic CBM wells.
The Economics of Powder River Basin Coalbed Methane Development
2-5 January 2006
Table 3. Estimated Relationship of Wellhead Natural Gas Prices and Water Management Practices to Economically Producible CBM from the Powder River Basin, Assuming a 15% Hurdle Rate
Reverse Osmosis w/ Residual Trucking Ion Exchange
Surface Discharge
Impoundments & Infiltration
Shallow Reinjection
TDS Limit: 1,000 mg/L
TDS Limit: 500 mg/L
TDS Limit: 1,000 mg/L
TDS Limit: 500 mg/L
Wellhead Price $/Mcf
CBM Volume (Bcf)
CBM Volume (Bcf)
CBM Volume (Bcf)
CBM Volume (Bcf)
CBM Volume (Bcf)
CBM Volume (Bcf)
CBM Volume (Bcf)
3.00 13,420 11,110 10,100 9,530 6,390 11,240 8,210
3.50 15,520 13,610 12,780 12,880 9,210 14,060 11,820
4.00 17,070 15,680 14,910 14,960 12,460 15,940 14,090
4.50 18,240 17,460 16,980 16,660 14,440 17,450 15,880
5.00 19,480 18,410 17,840 18,060 16,740 18,450 17,560
5.50 20,810 20,030 19,360 19,400 17,860 19,980 18,340
6.00 21,440 20,820 20,610 20,550 19,120 20,850 20,210
6.50 22,640 21,840 21,560 21,490 20,320 22,020 21,090
7.00 23,280 22,790 22,500 22,230 21,660 22,520 22,120
The Economics of Powder River Basin Coalbed Methane Development
2-6 January 2006
Table 4. Estimated Relationship of Wellhead Natural Gas Prices and Water Management Practices to Produced CBM
Water Volumes from the Powder River Basin, Assuming a 15% Hurdle Rate
Reverse Osmosis w/ Residual Trucking Ion Exchange
Surface Discharge
Impoundments & Infiltration
Shallow Reinjection TDS Limit:
1,000 mg/L TDS Limit: 500 mg/L
TDS Limit: 1,000 mg/L
TDS Limit: 500 mg/L
Wellhead Price $/Mcf
Water Volume (MMBw)
Water Volume (MMBw)
Water Volume (MMBw)
Water Volume (MMBw)
Water Volume (MMBw)
Water Volume (MMBw)
Water Volume (MMBw)
3.00 13,300 11,070 9,910 9,350 6,260 11,160 7,890
3.50 15,640 13,500 12,540 12,680 8,800 14,150 11,480
4.00 17,680 15,990 15,020 15,100 12,090 16,400 14,020
4.50 19,100 17,840 17,380 17,130 14,360 18,090 16,180
5.00 20,490 19,390 18,580 18,910 17,090 19,290 18,070
5.50 21,980 21,100 20,440 20,490 18,570 21,100 19,160
6.00 22,860 22,010 21,780 21,760 19,920 22,160 21,310
6.50 24,450 23,270 22,870 22,840 21,400 23,460 22,340
7.00 25,380 24,470 24,010 23,760 22,960 24,070 23,580
The Economics of Powder River Basin Coalbed Methane Development
2-7 January 2006
Table 5. Estimated Relationship of Wellhead Natural Gas Prices and Water Management Practices to Economic
CBM Well Drilling in the Powder River Basin, Assuming a 15% Hurdle Rate*
Reverse Osmosis w/ Residual Trucking Ion Exchange
Surface Discharge Impoundments Shallow
Reinjection TDS Limit: 1,000 mg/L
TDS Limit: 500 mg/L
TDS Limit: 1,000 mg/L
TDS Limit: 500 mg/L
Wellhead Price $/Mcf
# of wells # of wells # of wells # of wells # of wells # of wells # of wells
3.00 20,320 13,408 10,240 9,664 2,176 13,696 6,208
3.50 28,096 21,472 19,168 19,168 9,664 22,912 16,288
4.00 34,432 28,960 25,792 26,080 18,304 29,536 23,488
4.50 39,904 36,448 34,432 32,704 25,216 36,160 29,536
5.00 45,952 40,768 37,888 39,040 33,280 40,768 36,736
5.50 52,864 48,544 45,376 45,664 38,176 48,544 40,480
6.00 56,608 52,864 51,712 51,424 44,224 53,152 49,696
6.50 64,384 59,200 57,472 57,184 50,272 60,352 54,592
7.00 68,416 65,248 63,232 61,792 58,048 63,520 60,928
*Represents new wells, in addition to the 18,400 CBM wells drilled through 2004.
The Economics of Powder River Basin Coalbed Methane Development
2-8 January 2006
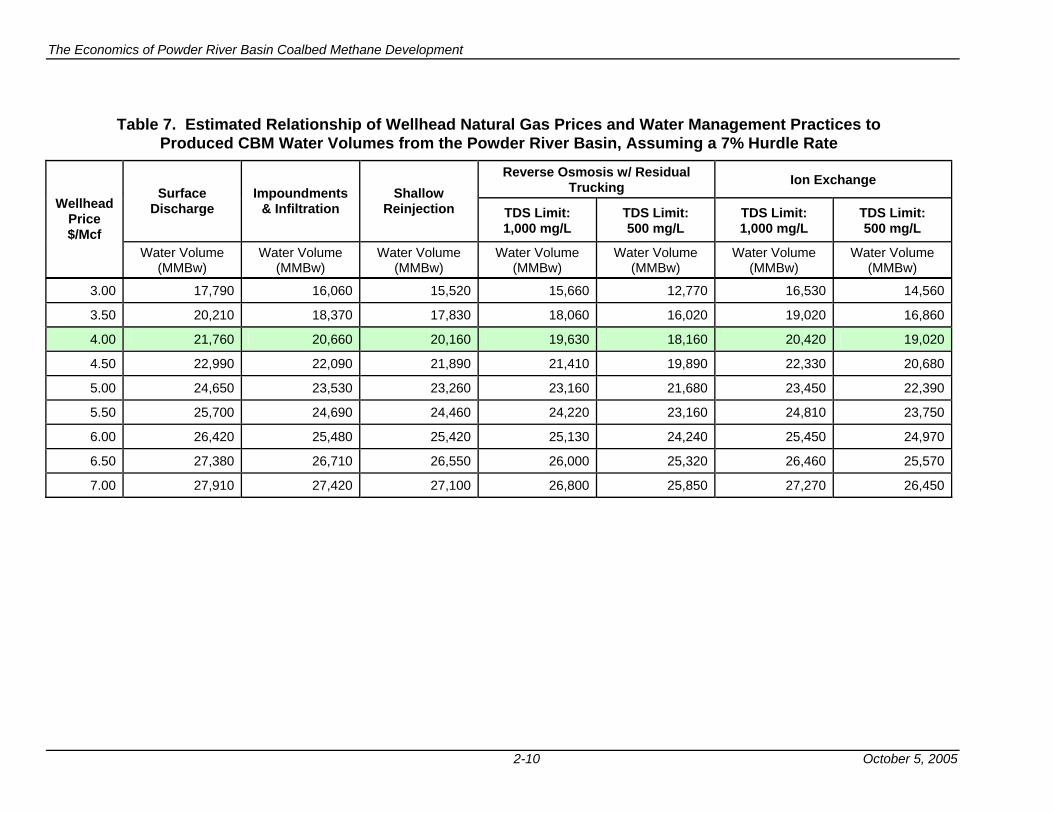
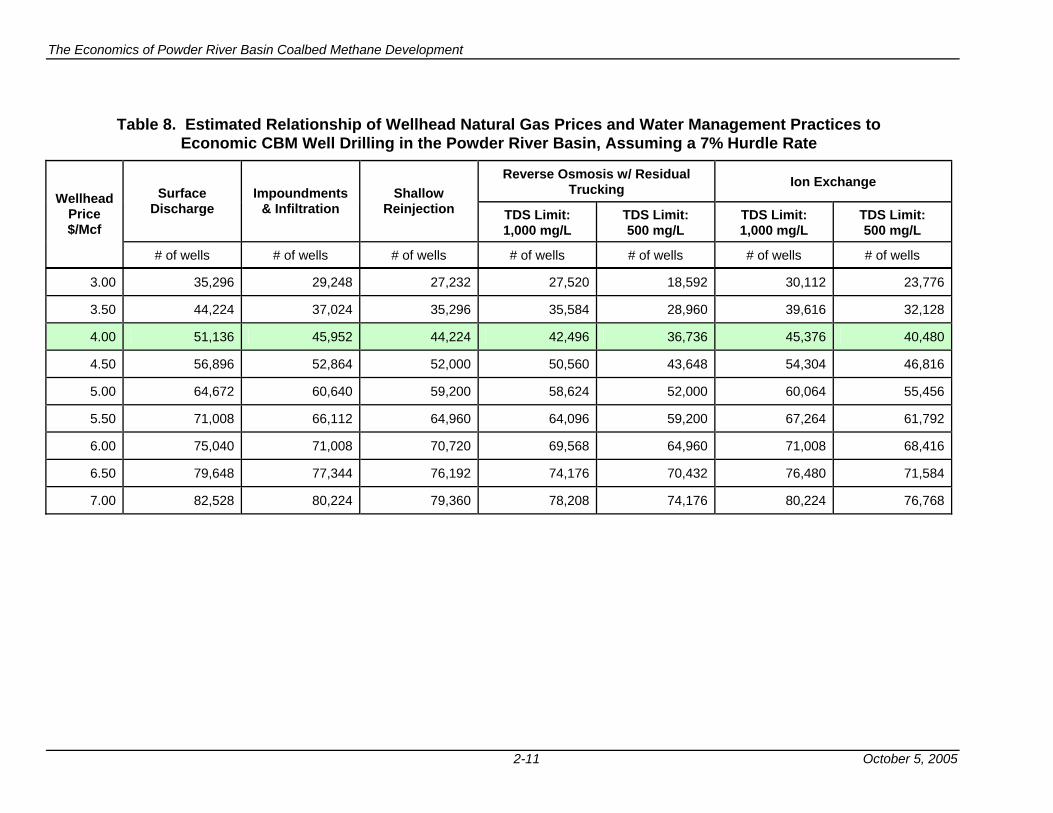
Table 6 shows the relationship of wellhead natural gas prices and water management practices on the economic production of CBM, assuming a 7% after-tax rate of return hurdle rate. Table 7 provides information on the volumes of water production. Table 8 provides the number of wells that would accompany economic CBM production from the basin, under this lower hurdle rate assumption.
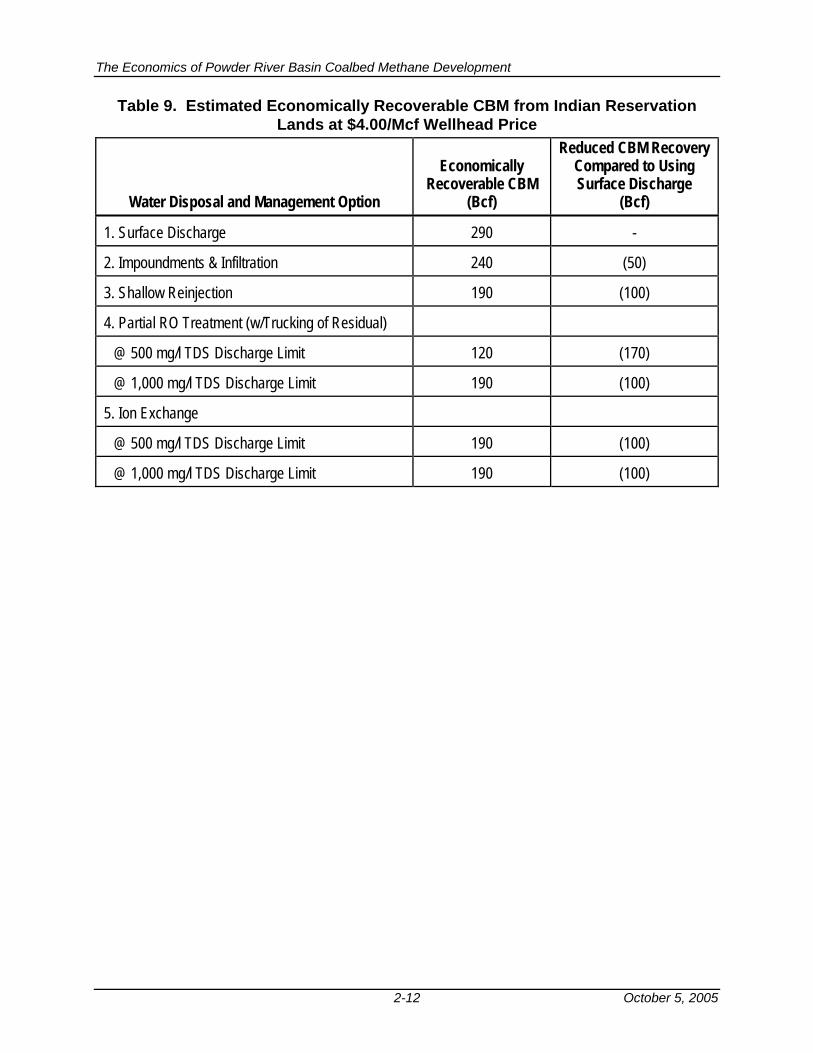
3. Similar to the impacts in the overall PRB, alternative water management and disposal practices have a significant impact on the economic production of coalbed methane on Indian (Northern Cheyenne and Crow) Reservation lands. At a $4.00/Mcf wellhead price (and assuming a 16.7% royalty), much of the potential CBM production on these lands would become uneconomic, should stringent water management practices be required (Table 9): • Using Surface Discharge for produced CBM water, the volume of economically
recoverable CBM on the Indian Reservation lands in the Powder River Basin is 290 Bcf.
• Using Impoundments for produced water, the volume of recoverable CBM on the Indian Reservation lands in the Powder River Basin is 240 Bcf, a reduction of 50 Bcf compared to Surface Discharge.
• Using Shallow Reinjection of produced CBM water lowers the volume of economically recoverable CBM on the Indian Reservation lands by 100 Bcf, to a total of 190 Bcf.
• Using Reverse Osmosis with a TDS discharge limit of 500 mg/L reduces economically recoverable CBM on the Indian Reservation lands by 170 Bcf, to a total of 120 Bcf; a discharge limit of 1,000 mg/L reduces the economic volume by 100 Mcf, to a total of 190 Bcf.
• Using Ion Exchange technology for the treatment of the produced CBM water, with a TDS discharge limit of either 500 mg/L or 1,000 mg/L, reduces economically recoverable CBM on the Indian Reservation lands by 100 Bcf, to a total of 190 Bcf.
The Economics of Powder River Basin Coalbed Methane Development
2-9 October 5, 2005
Table 6. Estimated Relationship of Wellhead Natural Gas Prices and Water Management Practices to Economically Producible CBM from the Powder River Basin, Assuming a 7% Hurdle Rate
Reverse Osmosis w/ Residual Trucking Ion Exchange Surface
Discharge Impoundments
& Infiltration Shallow
Reinjection TDS Limit: 1,000 mg/L
TDS Limit: 500 mg/L
TDS Limit: 1,000 mg/L
TDS Limit: 500 mg/L
Wellhead Price $/Mcf
CBM Volume (Bcf)
CBM Volume (Bcf)
CBM Volume (Bcf)
CBM Volume (Bcf)
CBM Volume (Bcf)
CBM Volume (Bcf)
CBM Volume (Bcf)
3.00 17,370 15,920 15,410 15,520 12,800 16,180 14,450
3.50 19,360 17,720 17,360 17,430 15,740 18,370 16,600
4.00 20,630 19,680 19,350 19,020 17,680 19,550 18,590
4.50 21,630 20,940 20,800 20,500 19,200 21,190 19,830
5.00 22,830 22,200 21,980 21,880 20,750 22,110 21,340
5.50 23,710 23,030 22,870 22,710 21,950 23,180 22,370
6.00 24,260 23,710 23,680 23,500 22,830 23,710 23,360
6.50 24,860 24,550 24,390 24,140 23,620 24,430 23,780
7.00 25,210 24,930 24,820 24,680 24,130 24,920 24,470
The Economics of Powder River Basin Coalbed Methane Development
2-10 October 5, 2005
Table 7. Estimated Relationship of Wellhead Natural Gas Prices and Water Management Practices to
Produced CBM Water Volumes from the Powder River Basin, Assuming a 7% Hurdle Rate
Reverse Osmosis w/ Residual Trucking Ion Exchange
Surface Discharge
Impoundments & Infiltration
Shallow Reinjection TDS Limit:
1,000 mg/L TDS Limit: 500 mg/L
TDS Limit: 1,000 mg/L
TDS Limit: 500 mg/L
Wellhead Price $/Mcf
Water Volume (MMBw)
Water Volume (MMBw)
Water Volume (MMBw)
Water Volume (MMBw)
Water Volume (MMBw)
Water Volume (MMBw)
Water Volume (MMBw)
3.00 17,790 16,060 15,520 15,660 12,770 16,530 14,560
3.50 20,210 18,370 17,830 18,060 16,020 19,020 16,860
4.00 21,760 20,660 20,160 19,630 18,160 20,420 19,020
4.50 22,990 22,090 21,890 21,410 19,890 22,330 20,680
5.00 24,650 23,530 23,260 23,160 21,680 23,450 22,390
5.50 25,700 24,690 24,460 24,220 23,160 24,810 23,750
6.00 26,420 25,480 25,420 25,130 24,240 25,450 24,970
6.50 27,380 26,710 26,550 26,000 25,320 26,460 25,570
7.00 27,910 27,420 27,100 26,800 25,850 27,270 26,450
The Economics of Powder River Basin Coalbed Methane Development
2-11 October 5, 2005
Table 8. Estimated Relationship of Wellhead Natural Gas Prices and Water Management Practices to
Economic CBM Well Drilling in the Powder River Basin, Assuming a 7% Hurdle Rate
Reverse Osmosis w/ Residual Trucking Ion Exchange
Surface Discharge
Impoundments & Infiltration
Shallow Reinjection TDS Limit:
1,000 mg/L TDS Limit: 500 mg/L
TDS Limit: 1,000 mg/L
TDS Limit: 500 mg/L
Wellhead Price $/Mcf
# of wells # of wells # of wells # of wells # of wells # of wells # of wells
3.00 35,296 29,248 27,232 27,520 18,592 30,112 23,776
3.50 44,224 37,024 35,296 35,584 28,960 39,616 32,128
4.00 51,136 45,952 44,224 42,496 36,736 45,376 40,480
4.50 56,896 52,864 52,000 50,560 43,648 54,304 46,816
5.00 64,672 60,640 59,200 58,624 52,000 60,064 55,456
5.50 71,008 66,112 64,960 64,096 59,200 67,264 61,792
6.00 75,040 71,008 70,720 69,568 64,960 71,008 68,416
6.50 79,648 77,344 76,192 74,176 70,432 76,480 71,584
7.00 82,528 80,224 79,360 78,208 74,176 80,224 76,768
The Economics of Powder River Basin Coalbed Methane Development
2-12 October 5, 2005
Table 9. Estimated Economically Recoverable CBM from Indian Reservation Lands at $4.00/Mcf Wellhead Price
Water Disposal and Management Option
Economically Recoverable CBM
(Bcf)
Reduced CBM Recovery Compared to Using Surface Discharge
(Bcf)
1. Surface Discharge 290 -
2. Impoundments & Infiltration 240 (50)
3. Shallow Reinjection 190 (100)
4. Partial RO Treatment (w/Trucking of Residual)
@ 500 mg/l TDS Discharge Limit 120 (170)
@ 1,000 mg/l TDS Discharge Limit 190 (100)
5. Ion Exchange
@ 500 mg/l TDS Discharge Limit 190 (100)
@ 1,000 mg/l TDS Discharge Limit 190 (100)
The Economics of Powder River Basin Coalbed Methane Development
2-13 October 5, 2005
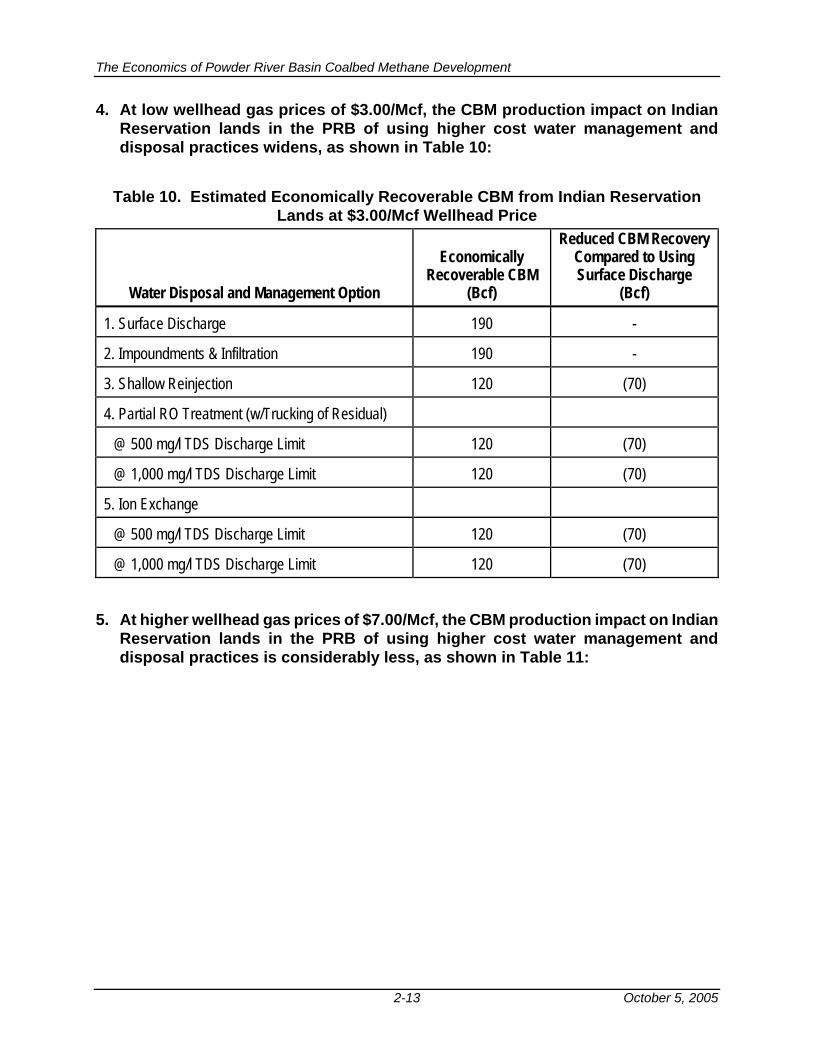
4. At low wellhead gas prices of $3.00/Mcf, the CBM production impact on Indian Reservation lands in the PRB of using higher cost water management and disposal practices widens, as shown in Table 10:
Table 10. Estimated Economically Recoverable CBM from Indian Reservation
Lands at $3.00/Mcf Wellhead Price
Water Disposal and Management Option
Economically Recoverable CBM
(Bcf)
Reduced CBM Recovery Compared to Using Surface Discharge
(Bcf)
1. Surface Discharge 190 -
2. Impoundments & Infiltration 190 -
3. Shallow Reinjection 120 (70)
4. Partial RO Treatment (w/Trucking of Residual)
@ 500 mg/l TDS Discharge Limit 120 (70)
@ 1,000 mg/l TDS Discharge Limit 120 (70)
5. Ion Exchange
@ 500 mg/l TDS Discharge Limit 120 (70)
@ 1,000 mg/l TDS Discharge Limit 120 (70)
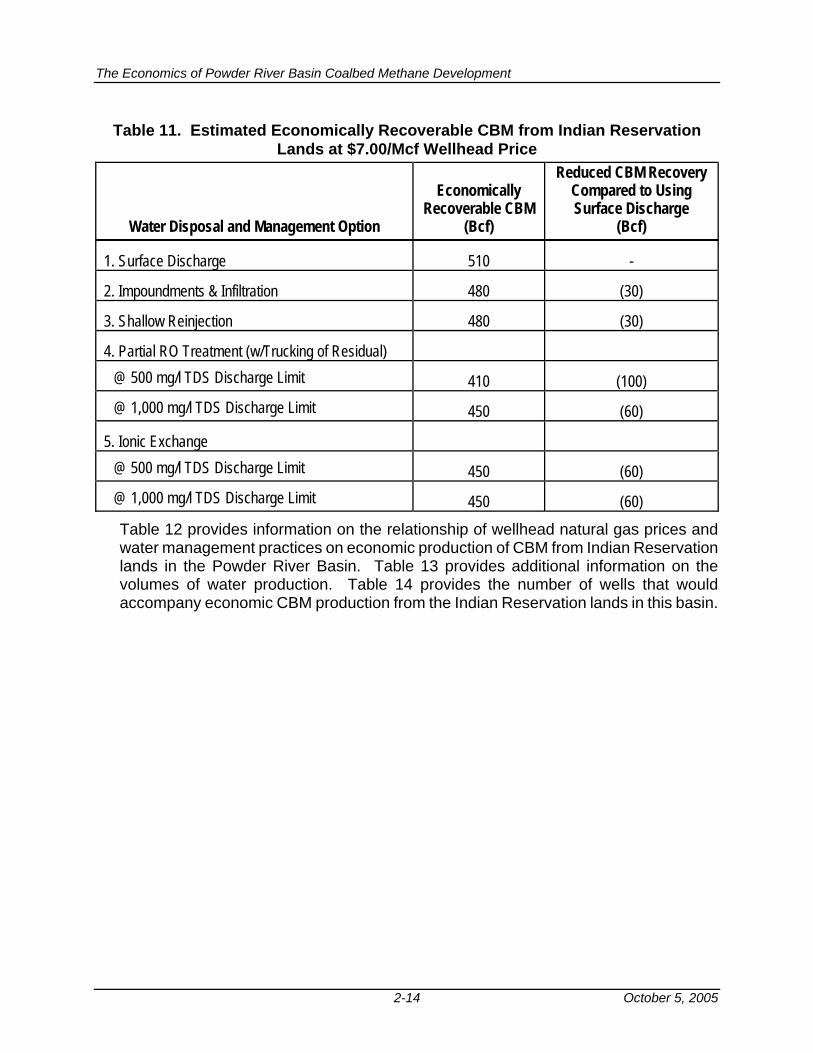
5. At higher wellhead gas prices of $7.00/Mcf, the CBM production impact on Indian Reservation lands in the PRB of using higher cost water management and disposal practices is considerably less, as shown in Table 11:
The Economics of Powder River Basin Coalbed Methane Development
2-14 October 5, 2005
Table 11. Estimated Economically Recoverable CBM from Indian Reservation
Lands at $7.00/Mcf Wellhead Price
Water Disposal and Management Option
Economically Recoverable CBM
(Bcf)
Reduced CBM Recovery Compared to Using Surface Discharge
(Bcf)
1. Surface Discharge 510 -
2. Impoundments & Infiltration 480 (30)
3. Shallow Reinjection 480 (30)
4. Partial RO Treatment (w/Trucking of Residual) @ 500 mg/l TDS Discharge Limit 410 (100) @ 1,000 mg/l TDS Discharge Limit 450 (60)
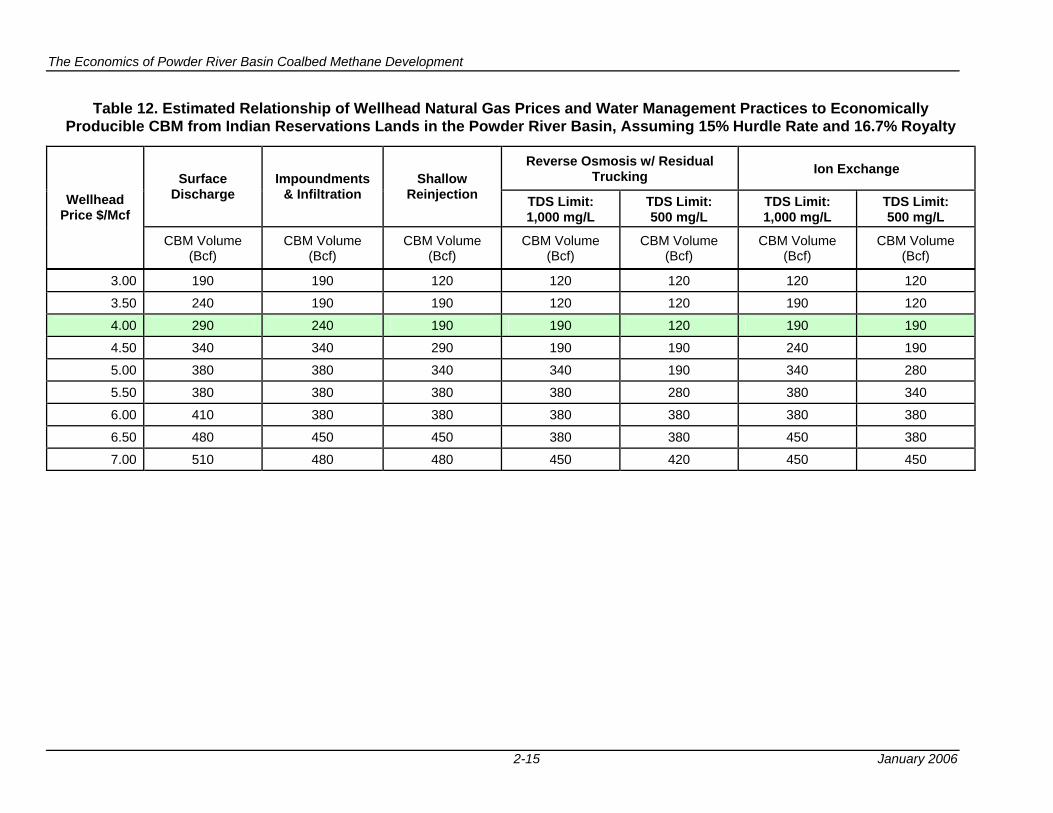
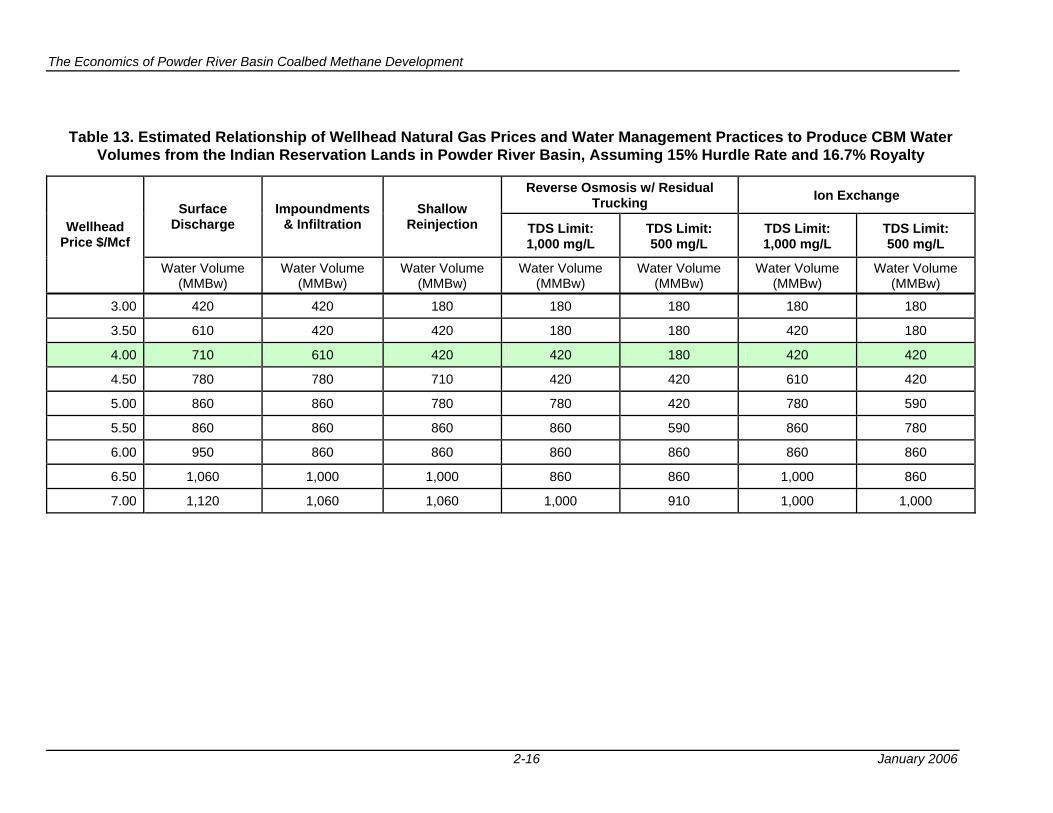
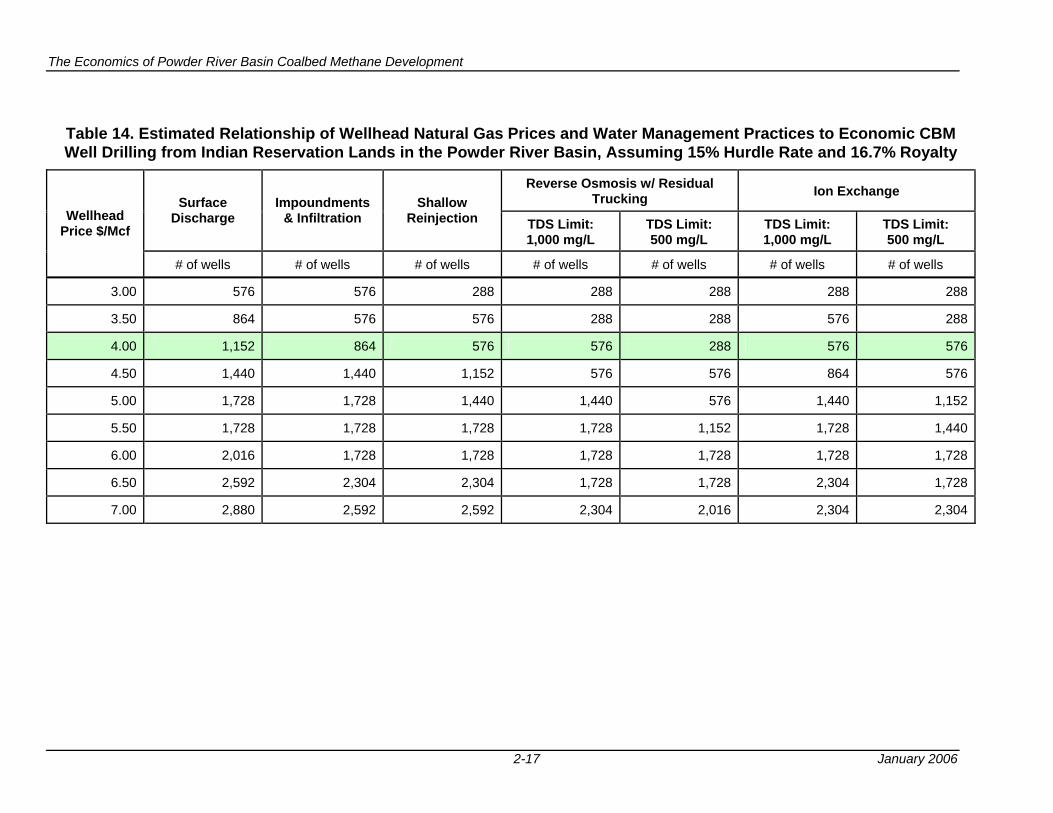
5. Ionic Exchange @ 500 mg/l TDS Discharge Limit 450 (60) @ 1,000 mg/l TDS Discharge Limit 450 (60) Table 12 provides information on the relationship of wellhead natural gas prices and water management practices on economic production of CBM from Indian Reservation lands in the Powder River Basin. Table 13 provides additional information on the volumes of water production. Table 14 provides the number of wells that would accompany economic CBM production from the Indian Reservation lands in this basin.
The Economics of Powder River Basin Coalbed Methane Development
2-15 January 2006
Table 12. Estimated Relationship of Wellhead Natural Gas Prices and Water Management Practices to Economically Producible CBM from Indian Reservations Lands in the Powder River Basin, Assuming 15% Hurdle Rate and 16.7% Royalty
Reverse Osmosis w/ Residual Trucking Ion Exchange
Surface Discharge
Impoundments & Infiltration
Shallow Reinjection TDS Limit:
1,000 mg/L TDS Limit: 500 mg/L
TDS Limit: 1,000 mg/L
TDS Limit: 500 mg/L
Wellhead Price $/Mcf
CBM Volume (Bcf)
CBM Volume (Bcf)
CBM Volume (Bcf)
CBM Volume (Bcf)
CBM Volume (Bcf)
CBM Volume (Bcf)
CBM Volume (Bcf)
3.00 190 190 120 120 120 120 120
3.50 240 190 190 120 120 190 120
4.00 290 240 190 190 120 190 190
4.50 340 340 290 190 190 240 190
5.00 380 380 340 340 190 340 280
5.50 380 380 380 380 280 380 340
6.00 410 380 380 380 380 380 380
6.50 480 450 450 380 380 450 380
7.00 510 480 480 450 420 450 450
The Economics of Powder River Basin Coalbed Methane Development
2-16 January 2006
Table 13. Estimated Relationship of Wellhead Natural Gas Prices and Water Management Practices to Produce CBM Water Volumes from the Indian Reservation Lands in Powder River Basin, Assuming 15% Hurdle Rate and 16.7% Royalty
Reverse Osmosis w/ Residual Trucking Ion Exchange
Surface Discharge
Impoundments & Infiltration
Shallow Reinjection TDS Limit:
1,000 mg/L TDS Limit: 500 mg/L
TDS Limit: 1,000 mg/L
TDS Limit: 500 mg/L
Wellhead Price $/Mcf
Water Volume (MMBw)
Water Volume (MMBw)
Water Volume (MMBw)
Water Volume (MMBw)
Water Volume (MMBw)
Water Volume (MMBw)
Water Volume (MMBw)
3.00 420 420 180 180 180 180 180
3.50 610 420 420 180 180 420 180
4.00 710 610 420 420 180 420 420
4.50 780 780 710 420 420 610 420
5.00 860 860 780 780 420 780 590
5.50 860 860 860 860 590 860 780
6.00 950 860 860 860 860 860 860
6.50 1,060 1,000 1,000 860 860 1,000 860
7.00 1,120 1,060 1,060 1,000 910 1,000 1,000
The Economics of Powder River Basin Coalbed Methane Development
2-17 January 2006
Table 14. Estimated Relationship of Wellhead Natural Gas Prices and Water Management Practices to Economic CBM Well Drilling from Indian Reservation Lands in the Powder River Basin, Assuming 15% Hurdle Rate and 16.7% Royalty
Reverse Osmosis w/ Residual Trucking Ion Exchange
Surface Discharge
Impoundments & Infiltration
Shallow Reinjection TDS Limit:
1,000 mg/L TDS Limit: 500 mg/L
TDS Limit: 1,000 mg/L
TDS Limit: 500 mg/L
Wellhead Price $/Mcf
# of wells # of wells # of wells # of wells # of wells # of wells # of wells
3.00 576 576 288 288 288 288 288
3.50 864 576 576 288 288 576 288
4.00 1,152 864 576 576 288 576 576
4.50 1,440 1,440 1,152 576 576 864 576
5.00 1,728 1,728 1,440 1,440 576 1,440 1,152
5.50 1,728 1,728 1,728 1,728 1,152 1,728 1,440
6.00 2,016 1,728 1,728 1,728 1,728 1,728 1,728
6.50 2,592 2,304 2,304 1,728 1,728 2,304 1,728
7.00 2,880 2,592 2,592 2,304 2,016 2,304 2,304
The Economics of Powder River Basin Coalbed Methane Development
2-18 January 2006
6. Progressively more stringent water disposal and management options also reduce federal, state and local tax receipts that would accrue from royalty and production tax payments on CBM production. The analysis of the loss of public revenues is provided below at a wellhead gas price of $4.00/Mcf (equivalent to a $5.70 Henry Hub marker price), as shown in Table 15: Federal royalty collections on oil and natural gas production (on federal lands) provide an important portion of federal receipts. Approximately one-half of these receipts are subsequently transferred to state governments for their use in funding public services: • Using Surface Discharge for produced CBM water, the federal Treasury would
collect $4,620 million in royalties from federal lands from CBM production in the Powder River Basin (before redistribution of a portion of this royalty to the states of Montana and Wyoming).
• Using Impoundments to handle the produced CBM water, the federal royalty collections would drop by $300 million, to a total of $4,320 million.
• Using Shallow Reinjection of the produced CBM water, the federal royalty collections would drop by $460 million, to a total of $4,160 million.
• Using Reverse Osmosis to treat the CBM water, the reduction in federal royalty collections would depend on the TDS discharge limit:
o $450 million would be lost at a TDS discharge limit of 1,000 mg/L; and o $990 million would be lost at a TDS discharge limit of 500 mg/L.
• Using Ion Exchange to treat the CBM water, the reduction in federal royalty collections would depend on the TDS discharge limit:
o $230 million would be lost at a TDS discharge limit of 1,000 mg/L; and o $640 million would be lost at a TDS discharge limit of 500 mg/L.
State royalties and production tax receipts are an important source of public revenues in Montana and Wyoming and fund much of the educational and other public services in these states. • Using Surface Disposal of the produced CBM water, the Montana and Wyoming
state royalty, severance and ad valorem tax receipts from CBM development in the Powder River would be $7,340 million.
• Using Impoundments to handle the produced CBM water, the state royalty and tax receipts would drop by $480 million, to a total of $6,860 million.
• Using Shallow Reinjection of the produced CBM water, the state royalty and tax receipts would drop by $730 million, to a total of $6,610 million.
• Using partial reverse osmosis treatment of the produced CBM water, the reduction in state royalty and tax collection would depend on the TDS discharge limit:
o $710 million would be lost at a TDS discharge limit of 1,000 mg/L; and o $1,570 million would be lost at a TDS discharge limit of 500 mg/L.
The Economics of Powder River Basin Coalbed Methane Development
2-19 January 2006
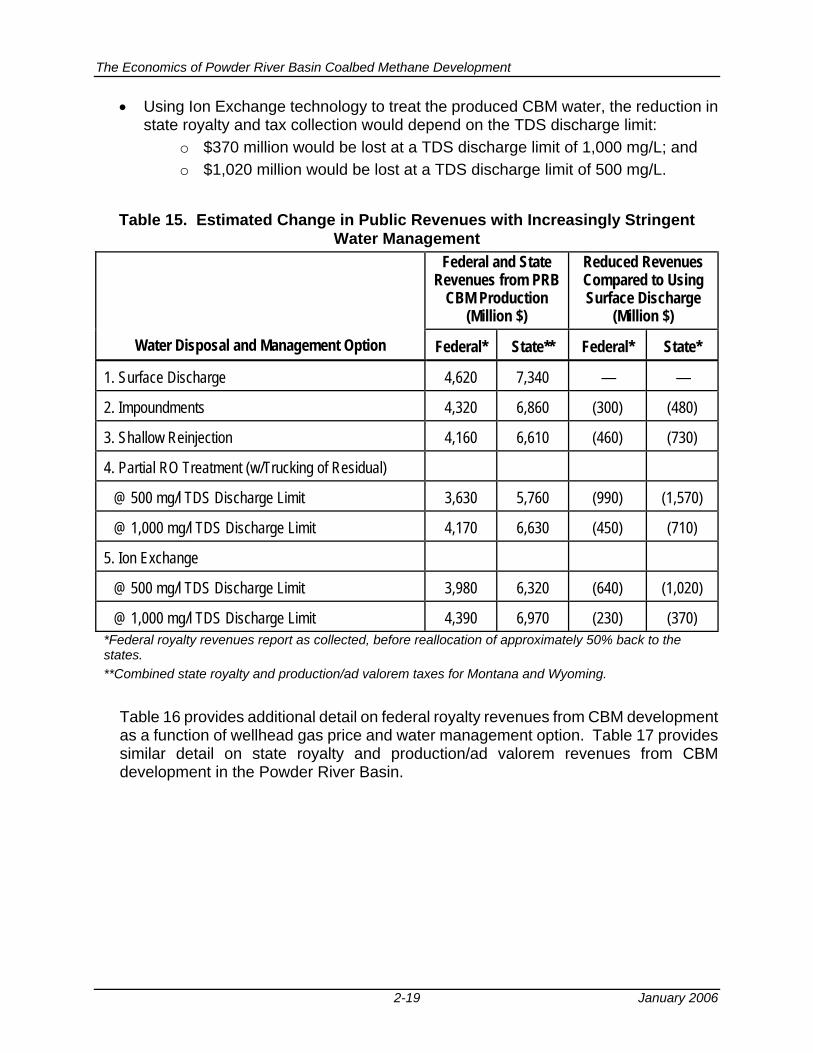
• Using Ion Exchange technology to treat the produced CBM water, the reduction in state royalty and tax collection would depend on the TDS discharge limit:
o $370 million would be lost at a TDS discharge limit of 1,000 mg/L; and o $1,020 million would be lost at a TDS discharge limit of 500 mg/L.
Table 15. Estimated Change in Public Revenues with Increasingly Stringent Water Management
Federal and State Revenues from PRB
CBM Production (Million $)
Reduced Revenues Compared to Using Surface Discharge
(Million $)
Water Disposal and Management Option Federal* State** Federal* State*
1. Surface Discharge 4,620 7,340 — —
2. Impoundments 4,320 6,860 (300) (480)
3. Shallow Reinjection 4,160 6,610 (460) (730)
4. Partial RO Treatment (w/Trucking of Residual)
@ 500 mg/l TDS Discharge Limit 3,630 5,760 (990) (1,570)
@ 1,000 mg/l TDS Discharge Limit 4,170 6,630 (450) (710)
5. Ion Exchange
@ 500 mg/l TDS Discharge Limit 3,980 6,320 (640) (1,020)
@ 1,000 mg/l TDS Discharge Limit 4,390 6,970 (230) (370) *Federal royalty revenues report as collected, before reallocation of approximately 50% back to the states. **Combined state royalty and production/ad valorem taxes for Montana and Wyoming.
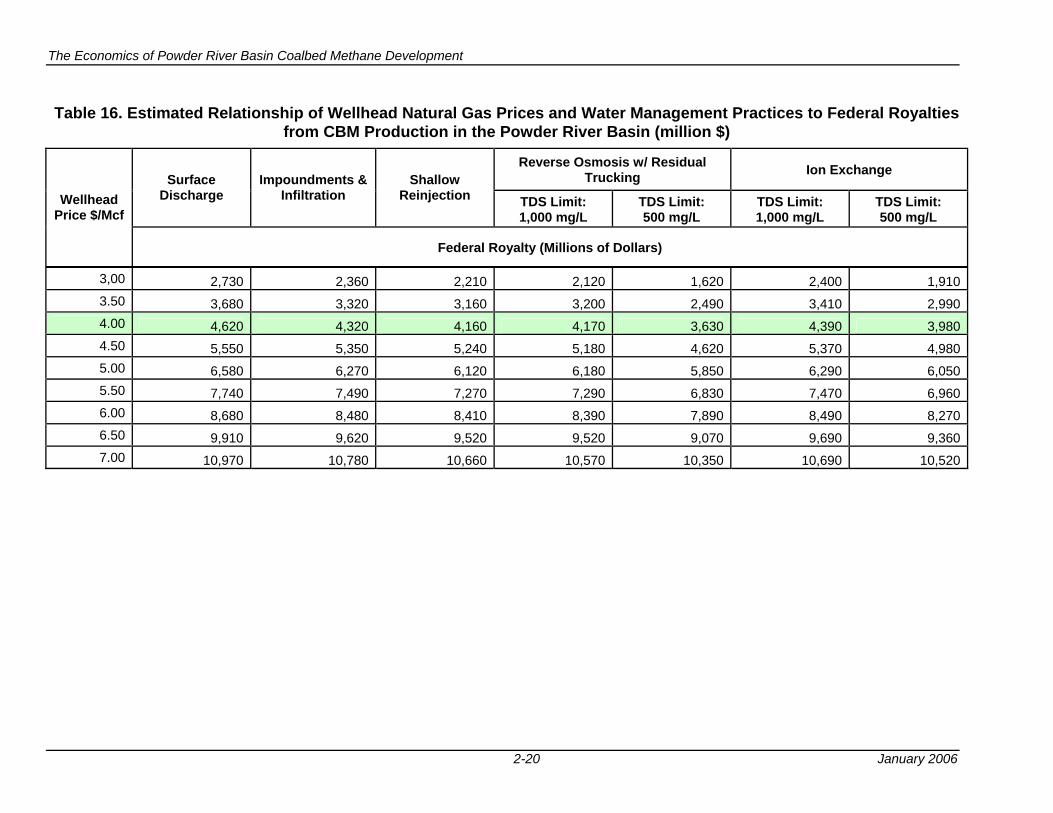
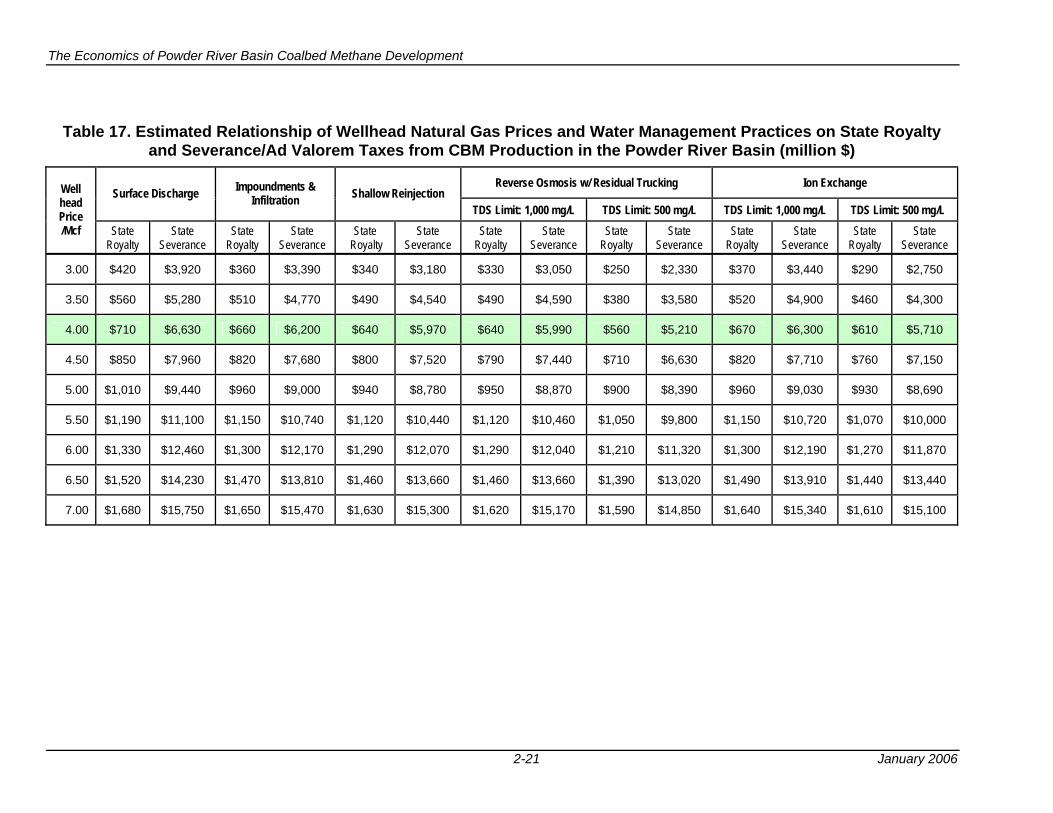
Table 16 provides additional detail on federal royalty revenues from CBM development as a function of wellhead gas price and water management option. Table 17 provides similar detail on state royalty and production/ad valorem revenues from CBM development in the Powder River Basin.
The Economics of Powder River Basin Coalbed Methane Development
2-20 January 2006
Table 16. Estimated Relationship of Wellhead Natural Gas Prices and Water Management Practices to Federal Royalties from CBM Production in the Powder River Basin (million $)
Reverse Osmosis w/ Residual Trucking Ion Exchange
Surface Discharge
Impoundments & Infiltration
Shallow Reinjection TDS Limit:
1,000 mg/L TDS Limit: 500 mg/L
TDS Limit: 1,000 mg/L
TDS Limit: 500 mg/L
Wellhead Price $/Mcf
Federal Royalty (Millions of Dollars)
3,00 2,730 2,360 2,210 2,120 1,620 2,400 1,910 3.50 3,680 3,320 3,160 3,200 2,490 3,410 2,990 4.00 4,620 4,320 4,160 4,170 3,630 4,390 3,980 4.50 5,550 5,350 5,240 5,180 4,620 5,370 4,980 5.00 6,580 6,270 6,120 6,180 5,850 6,290 6,050 5.50 7,740 7,490 7,270 7,290 6,830 7,470 6,960 6.00 8,680 8,480 8,410 8,390 7,890 8,490 8,270 6.50 9,910 9,620 9,520 9,520 9,070 9,690 9,360 7.00 10,970 10,780 10,660 10,570 10,350 10,690 10,520
The Economics of Powder River Basin Coalbed Methane Development
2-21 January 2006
Table 17. Estimated Relationship of Wellhead Natural Gas Prices and Water Management Practices on State Royalty
and Severance/Ad Valorem Taxes from CBM Production in the Powder River Basin (million $)
Reverse Osmosis w/ Residual Trucking Ion Exchange Surface Discharge Impoundments &
Infiltration Shallow Reinjection TDS Limit: 1,000 mg/L TDS Limit: 500 mg/L TDS Limit: 1,000 mg/L TDS Limit: 500 mg/L
Well head Price /Mcf State
Royalty State
Severance State
Royalty State
Severance State
Royalty State
Severance State
Royalty State
Severance State
Royalty State
Severance State
Royalty State
Severance State
Royalty State
Severance
3.00 $420 $3,920 $360 $3,390 $340 $3,180 $330 $3,050 $250 $2,330 $370 $3,440 $290 $2,750
3.50 $560 $5,280 $510 $4,770 $490 $4,540 $490 $4,590 $380 $3,580 $520 $4,900 $460 $4,300
4.00 $710 $6,630 $660 $6,200 $640 $5,970 $640 $5,990 $560 $5,210 $670 $6,300 $610 $5,710
4.50 $850 $7,960 $820 $7,680 $800 $7,520 $790 $7,440 $710 $6,630 $820 $7,710 $760 $7,150
5.00 $1,010 $9,440 $960 $9,000 $940 $8,780 $950 $8,870 $900 $8,390 $960 $9,030 $930 $8,690
5.50 $1,190 $11,100 $1,150 $10,740 $1,120 $10,440 $1,120 $10,460 $1,050 $9,800 $1,150 $10,720 $1,070 $10,000
6.00 $1,330 $12,460 $1,300 $12,170 $1,290 $12,070 $1,290 $12,040 $1,210 $11,320 $1,300 $12,190 $1,270 $11,870
6.50 $1,520 $14,230 $1,470 $13,810 $1,460 $13,660 $1,460 $13,660 $1,390 $13,020 $1,490 $13,910 $1,440 $13,440
7.00 $1,680 $15,750 $1,650 $15,470 $1,630 $15,300 $1,620 $15,170 $1,590 $14,850 $1,640 $15,340 $1,610 $15,100
The Economics of Powder River Basin Coalbed Methane Development
3-1 January 2006
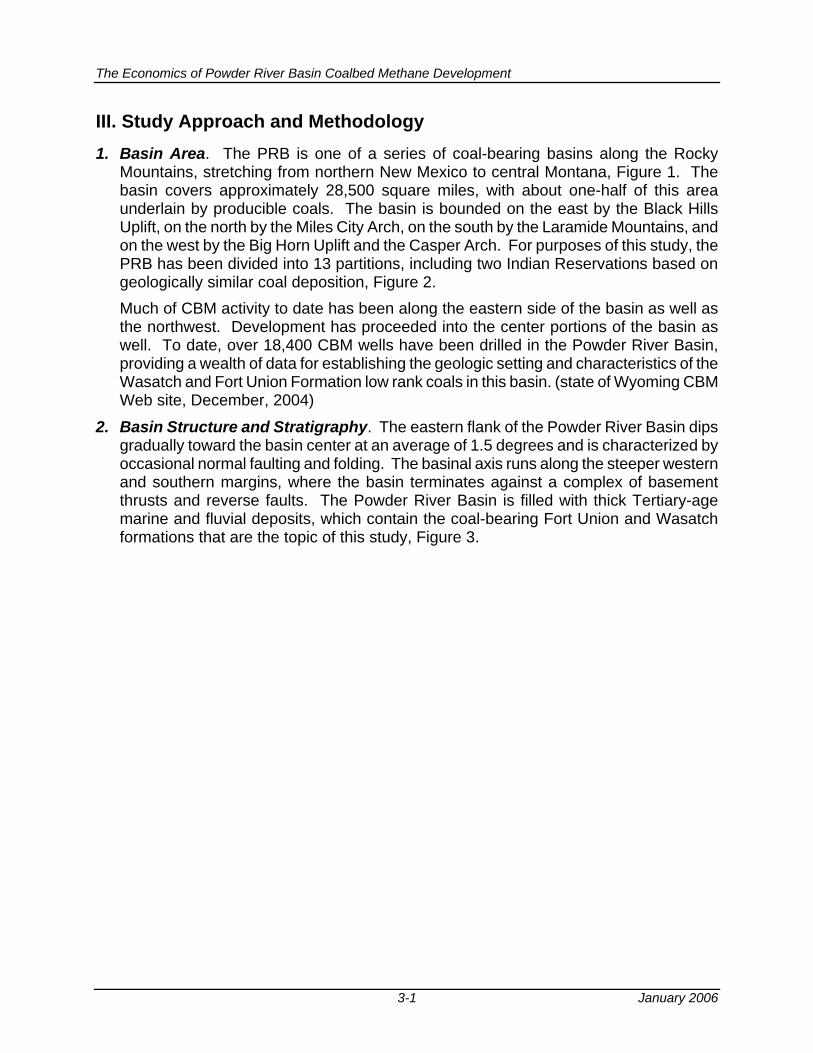
III. Study Approach and Methodology 1. Basin Area. The PRB is one of a series of coal-bearing basins along the Rocky
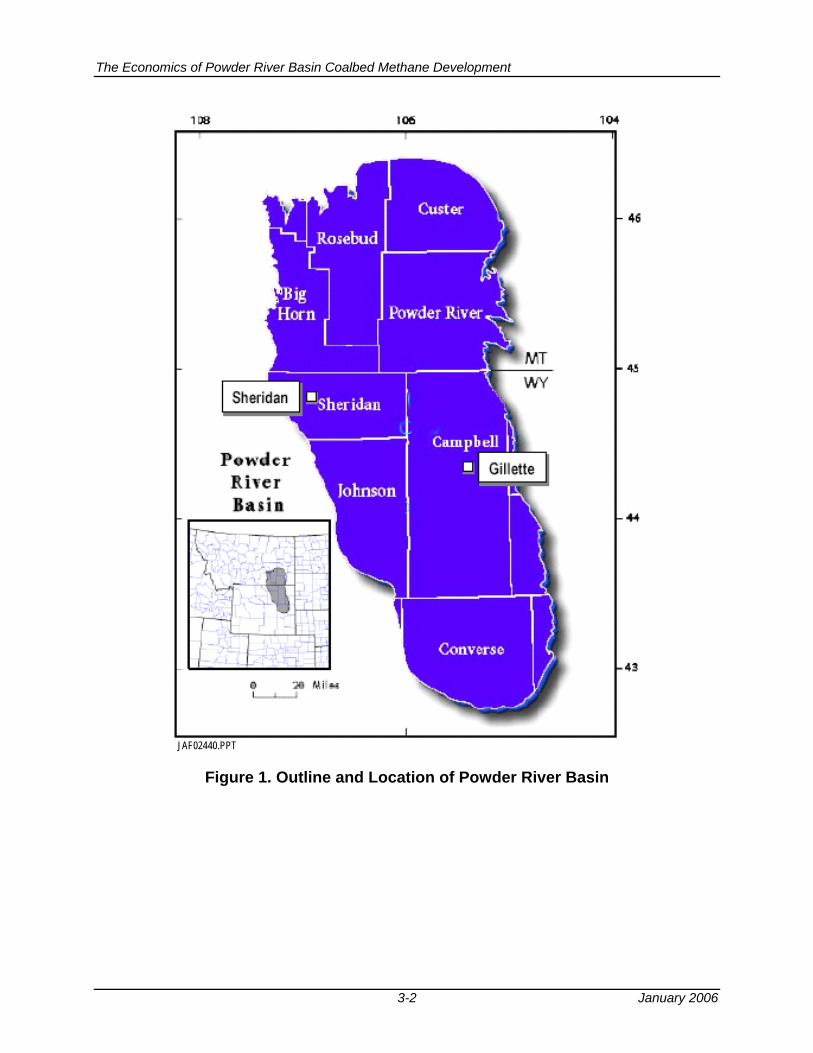
Mountains, stretching from northern New Mexico to central Montana, Figure 1. The basin covers approximately 28,500 square miles, with about one-half of this area underlain by producible coals. The basin is bounded on the east by the Black Hills Uplift, on the north by the Miles City Arch, on the south by the Laramide Mountains, and on the west by the Big Horn Uplift and the Casper Arch. For purposes of this study, the PRB has been divided into 13 partitions, including two Indian Reservations based on geologically similar coal deposition, Figure 2. Much of CBM activity to date has been along the eastern side of the basin as well as the northwest. Development has proceeded into the center portions of the basin as well. To date, over 18,400 CBM wells have been drilled in the Powder River Basin, providing a wealth of data for establishing the geologic setting and characteristics of the Wasatch and Fort Union Formation low rank coals in this basin. (state of Wyoming CBM Web site, December, 2004)
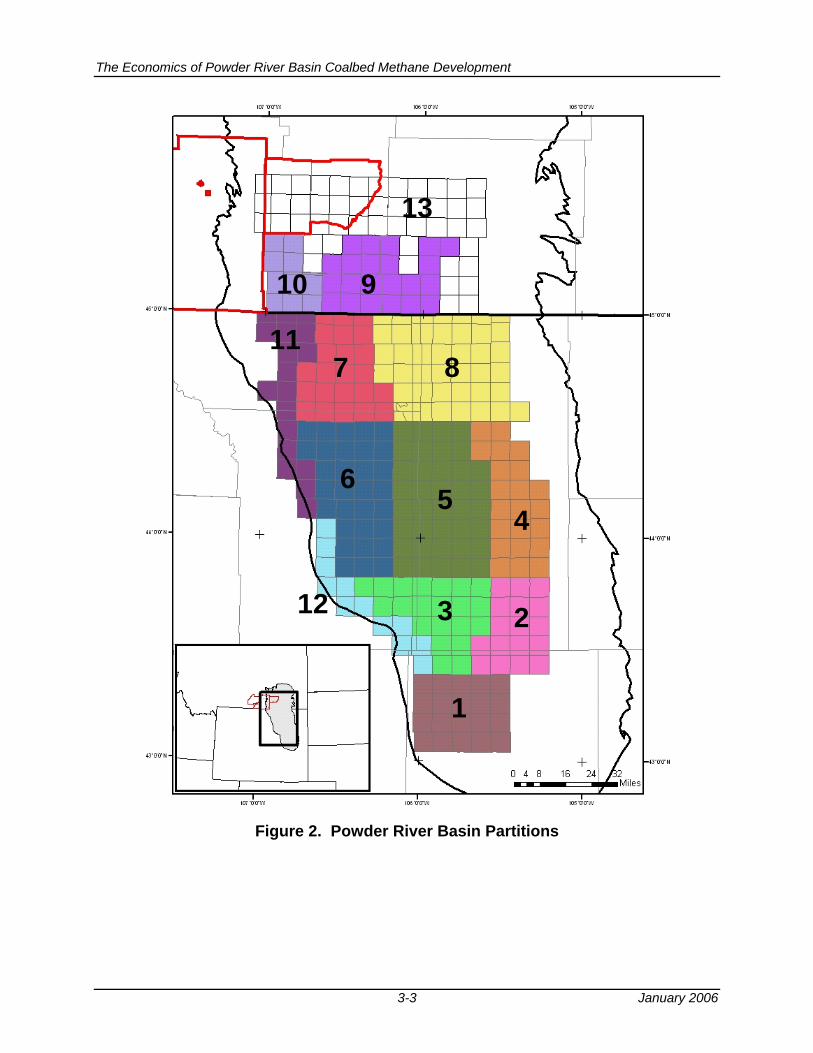
2. Basin Structure and Stratigraphy. The eastern flank of the Powder River Basin dips gradually toward the basin center at an average of 1.5 degrees and is characterized by occasional normal faulting and folding. The basinal axis runs along the steeper western and southern margins, where the basin terminates against a complex of basement thrusts and reverse faults. The Powder River Basin is filled with thick Tertiary-age marine and fluvial deposits, which contain the coal-bearing Fort Union and Wasatch formations that are the topic of this study, Figure 3.
The Economics of Powder River Basin Coalbed Methane Development
3-2 January 2006
JAF02440.PPT Figure 1. Outline and Location of Powder River Basin
The Economics of Powder River Basin Coalbed Methane Development
3-3 January 2006
8
23
65
4
9
711
1
10
13
12
Figure 2. Powder River Basin Partitions
The Economics of Powder River Basin Coalbed Methane Development
3-4 January 2006
Figure 3. Coal-Bearing Units of the
Tongue River Member of the Fort Union Formation
The Economics of Powder River Basin Coalbed Methane Development
3-5 January 2006
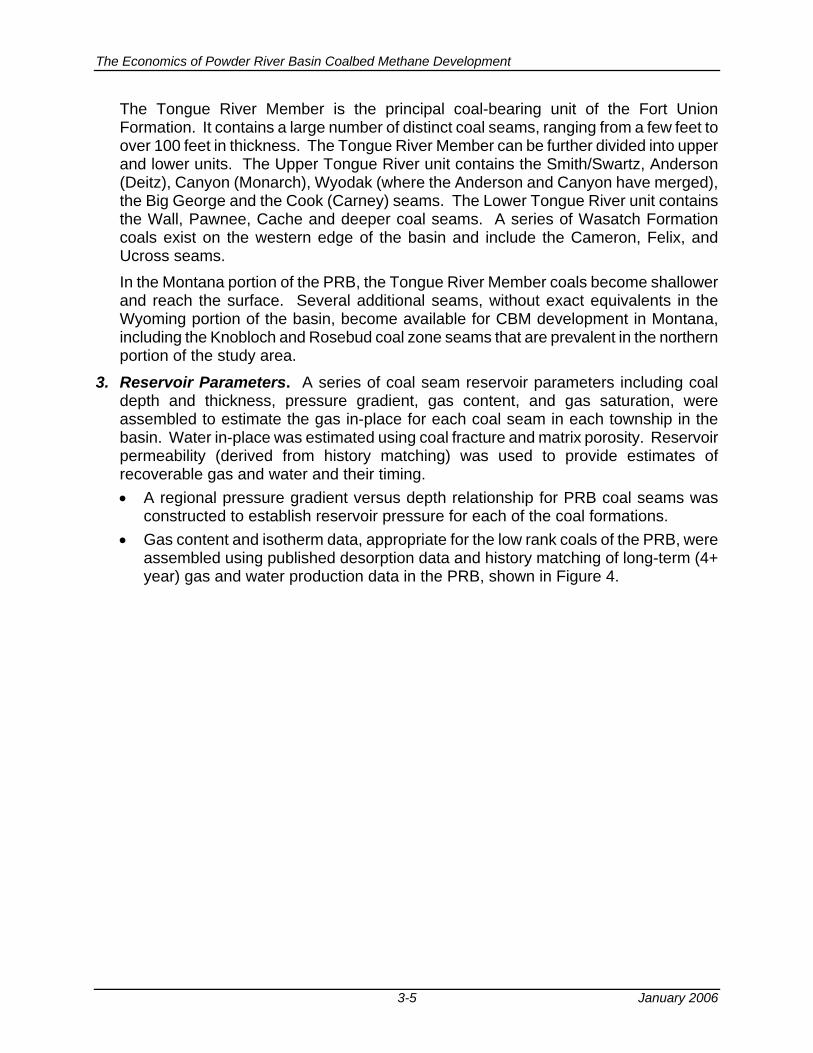
The Tongue River Member is the principal coal-bearing unit of the Fort Union Formation. It contains a large number of distinct coal seams, ranging from a few feet to over 100 feet in thickness. The Tongue River Member can be further divided into upper and lower units. The Upper Tongue River unit contains the Smith/Swartz, Anderson (Deitz), Canyon (Monarch), Wyodak (where the Anderson and Canyon have merged), the Big George and the Cook (Carney) seams. The Lower Tongue River unit contains the Wall, Pawnee, Cache and deeper coal seams. A series of Wasatch Formation coals exist on the western edge of the basin and include the Cameron, Felix, and Ucross seams. In the Montana portion of the PRB, the Tongue River Member coals become shallower and reach the surface. Several additional seams, without exact equivalents in the Wyoming portion of the basin, become available for CBM development in Montana, including the Knobloch and Rosebud coal zone seams that are prevalent in the northern portion of the study area.
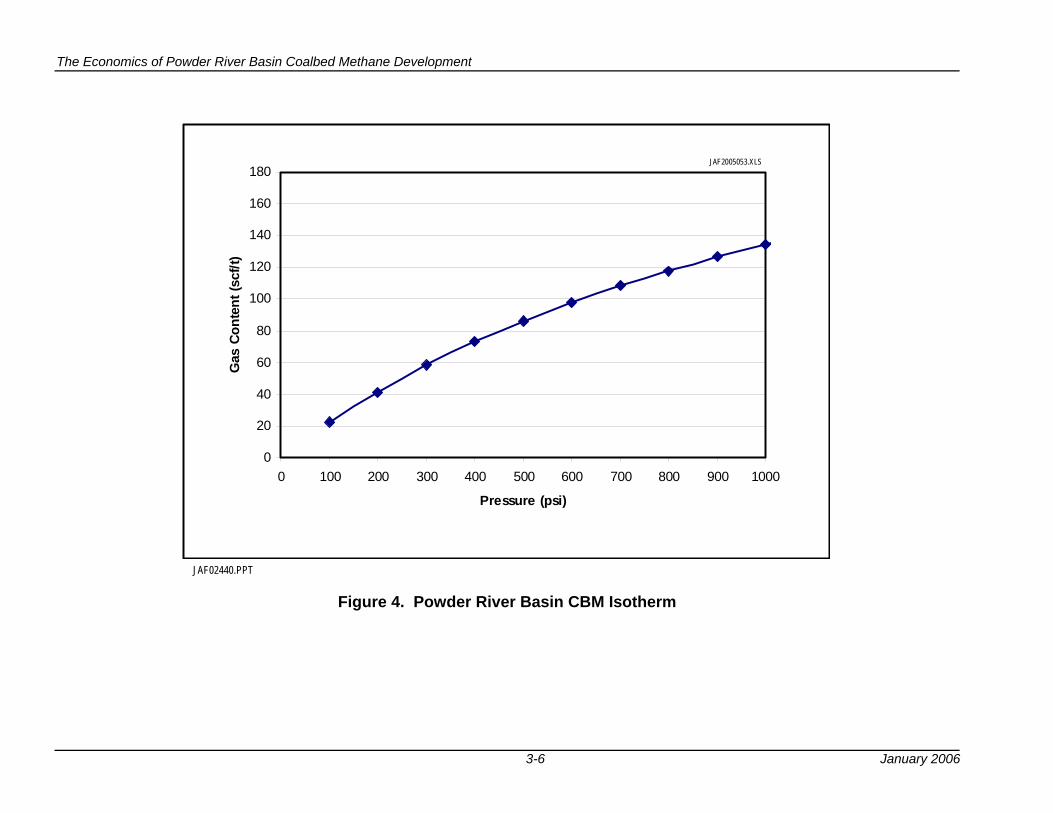
3. Reservoir Parameters. A series of coal seam reservoir parameters including coal depth and thickness, pressure gradient, gas content, and gas saturation, were assembled to estimate the gas in-place for each coal seam in each township in the basin. Water in-place was estimated using coal fracture and matrix porosity. Reservoir permeability (derived from history matching) was used to provide estimates of recoverable gas and water and their timing. • A regional pressure gradient versus depth relationship for PRB coal seams was
constructed to establish reservoir pressure for each of the coal formations. • Gas content and isotherm data, appropriate for the low rank coals of the PRB, were
assembled using published desorption data and history matching of long-term (4+ year) gas and water production data in the PRB, shown in Figure 4.
The Economics of Powder River Basin Coalbed Methane Development
3-6 January 2006
0
20
40
60
80
100
120
140
160
180
0 100 200 300 400 500 600 700 800 900 1000
Pressure (psi)
Gas
Con
tent
(scf
/t)
JAF2005053.XLS
JAF02440.PPT Figure 4. Powder River Basin CBM Isotherm
The Economics of Powder River Basin Coalbed Methane Development
3-7 January 2006
• The nature of early time water and gas production was used to establish whether the PRB coals were undersaturated, fully saturated or contained free gas in the fracture and matrix pore space.
• History matching of water production was used to establish the fracture and matrix porosity for the PRB coal. History matching of gas and water production was used to establish fracture and matrix permeability.
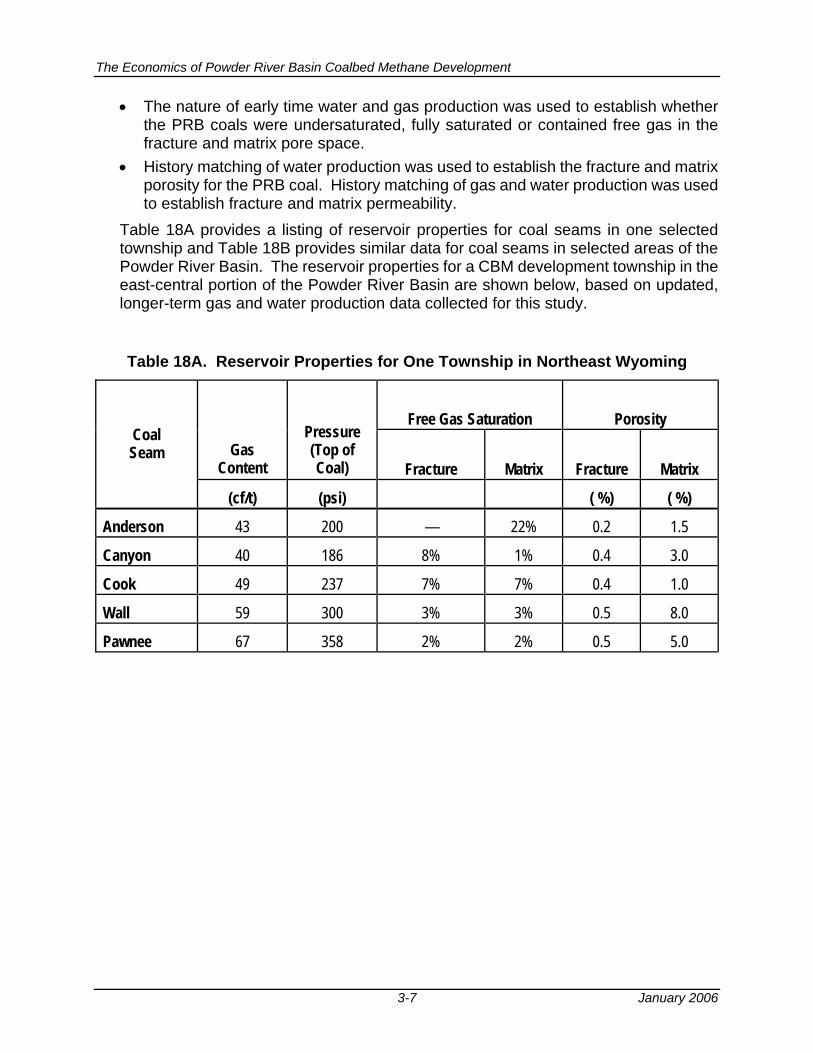
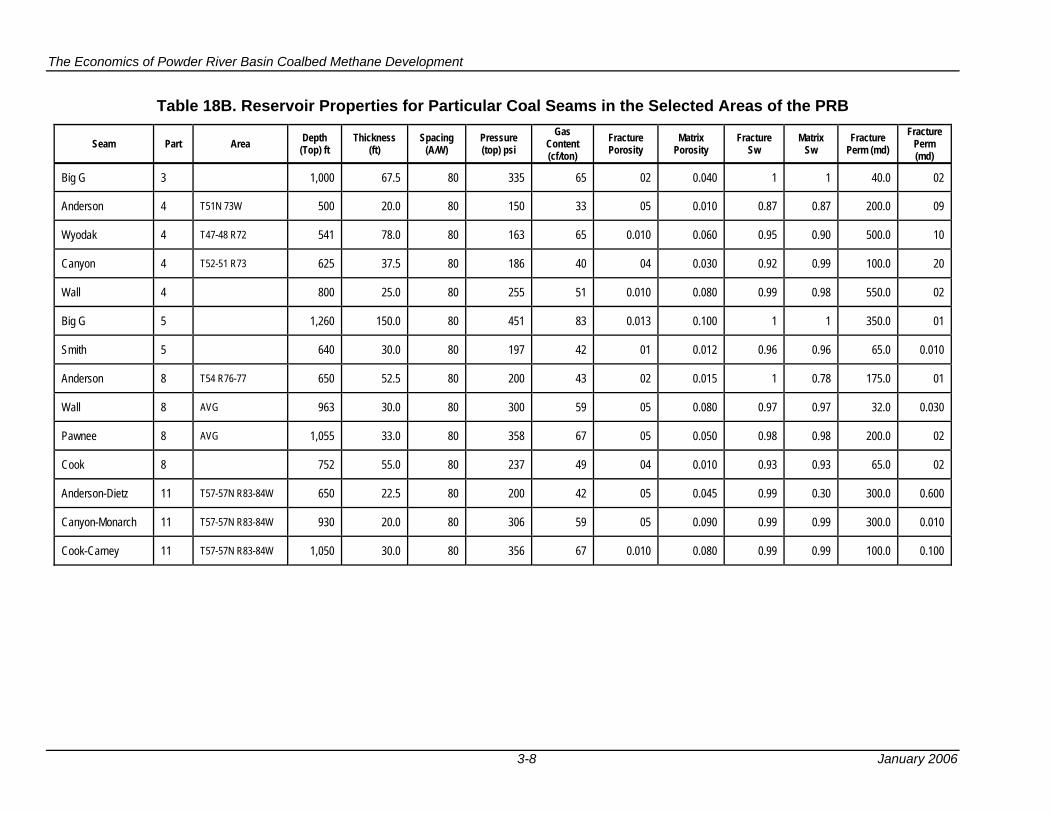
Table 18A provides a listing of reservoir properties for coal seams in one selected township and Table 18B provides similar data for coal seams in selected areas of the Powder River Basin. The reservoir properties for a CBM development township in the east-central portion of the Powder River Basin are shown below, based on updated, longer-term gas and water production data collected for this study.
Table 18A. Reservoir Properties for One Township in Northeast Wyoming
Free Gas Saturation Porosity
Gas Content
Pressure (Top of Coal) Fracture Matrix Fracture Matrix
Coal Seam
(cf/t) (psi) ( %) ( %)
Anderson 43 200 — 22% 0.2 1.5
Canyon 40 186 8% 1% 0.4 3.0
Cook 49 237 7% 7% 0.4 1.0
Wall 59 300 3% 3% 0.5 8.0
Pawnee 67 358 2% 2% 0.5 5.0
The Economics of Powder River Basin Coalbed Methane Development
3-8 January 2006
Table 18B. Reservoir Properties for Particular Coal Seams in the Selected Areas of the PRB
Seam Part Area Depth (Top) ft
Thickness (ft)
Spacing (A/W)
Pressure (top) psi
Gas Content (cf/ton)
Fracture Porosity
Matrix Porosity
Fracture Sw
Matrix Sw
Fracture Perm (md)
Fracture Perm (md)
Big G 3 1,000 67.5 80 335 65 02 0.040 1 1 40.0 02
Anderson 4 T51N 73W 500 20.0 80 150 33 05 0.010 0.87 0.87 200.0 09
Wyodak 4 T47-48 R72 541 78.0 80 163 65 0.010 0.060 0.95 0.90 500.0 10
Canyon 4 T52-51 R73 625 37.5 80 186 40 04 0.030 0.92 0.99 100.0 20
Wall 4 800 25.0 80 255 51 0.010 0.080 0.99 0.98 550.0 02
Big G 5 1,260 150.0 80 451 83 0.013 0.100 1 1 350.0 01
Smith 5 640 30.0 80 197 42 01 0.012 0.96 0.96 65.0 0.010
Anderson 8 T54 R76-77 650 52.5 80 200 43 02 0.015 1 0.78 175.0 01
Wall 8 AVG 963 30.0 80 300 59 05 0.080 0.97 0.97 32.0 0.030
Pawnee 8 AVG 1,055 33.0 80 358 67 05 0.050 0.98 0.98 200.0 02
Cook 8 752 55.0 80 237 49 04 0.010 0.93 0.93 65.0 02
Anderson-Dietz 11 T57-57N R83-84W 650 22.5 80 200 42 05 0.045 0.99 0.30 300.0 0.600
Canyon-Monarch 11 T57-57N R83-84W 930 20.0 80 306 59 05 0.090 0.99 0.99 300.0 0.010
Cook-Carney 11 T57-57N R83-84W 1,050 30.0 80 356 67 0.010 0.080 0.99 0.99 100.0 0.100
The Economics of Powder River Basin Coalbed Methane Development
3-9 January 2006
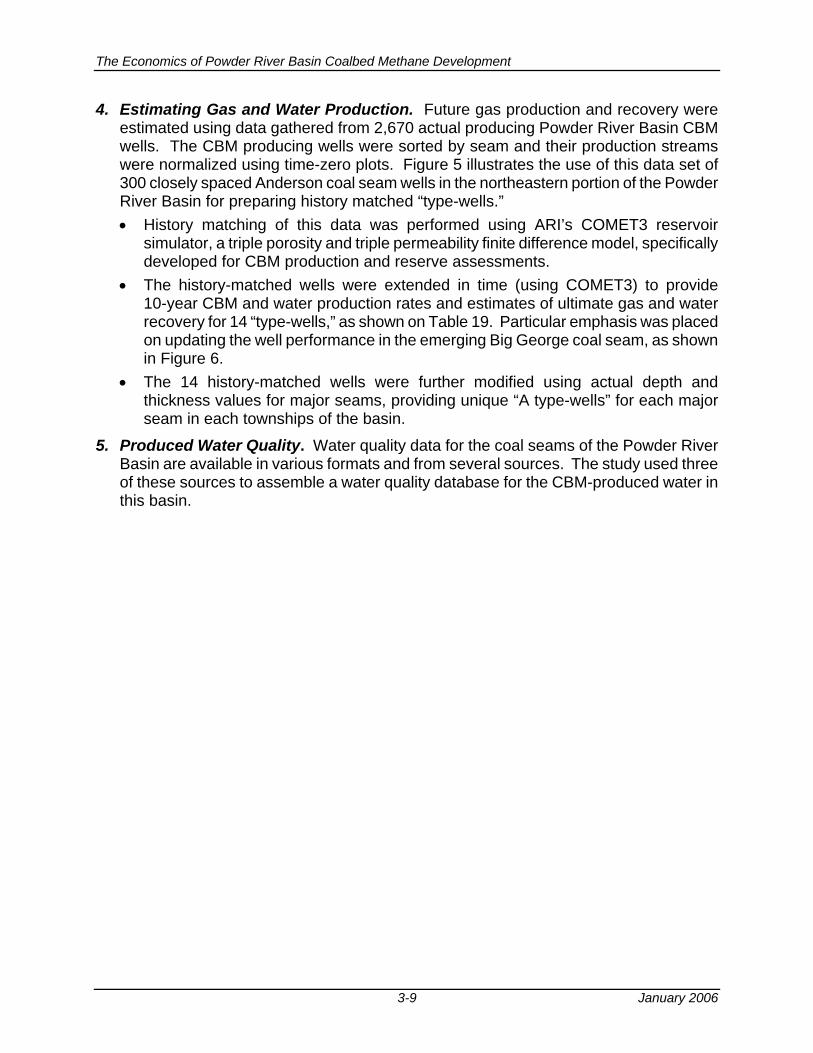
4. Estimating Gas and Water Production. Future gas production and recovery were estimated using data gathered from 2,670 actual producing Powder River Basin CBM wells. The CBM producing wells were sorted by seam and their production streams were normalized using time-zero plots. Figure 5 illustrates the use of this data set of 300 closely spaced Anderson coal seam wells in the northeastern portion of the Powder River Basin for preparing history matched “type-wells.” • History matching of this data was performed using ARI’s COMET3 reservoir
simulator, a triple porosity and triple permeability finite difference model, specifically developed for CBM production and reserve assessments.
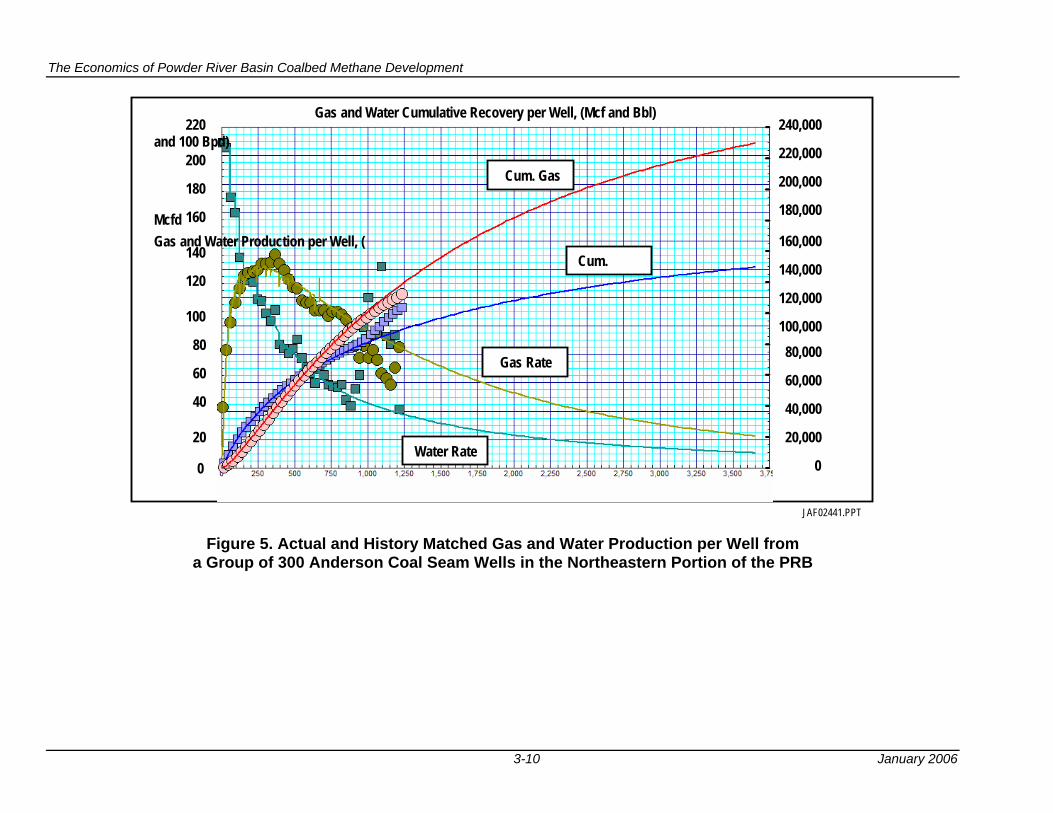
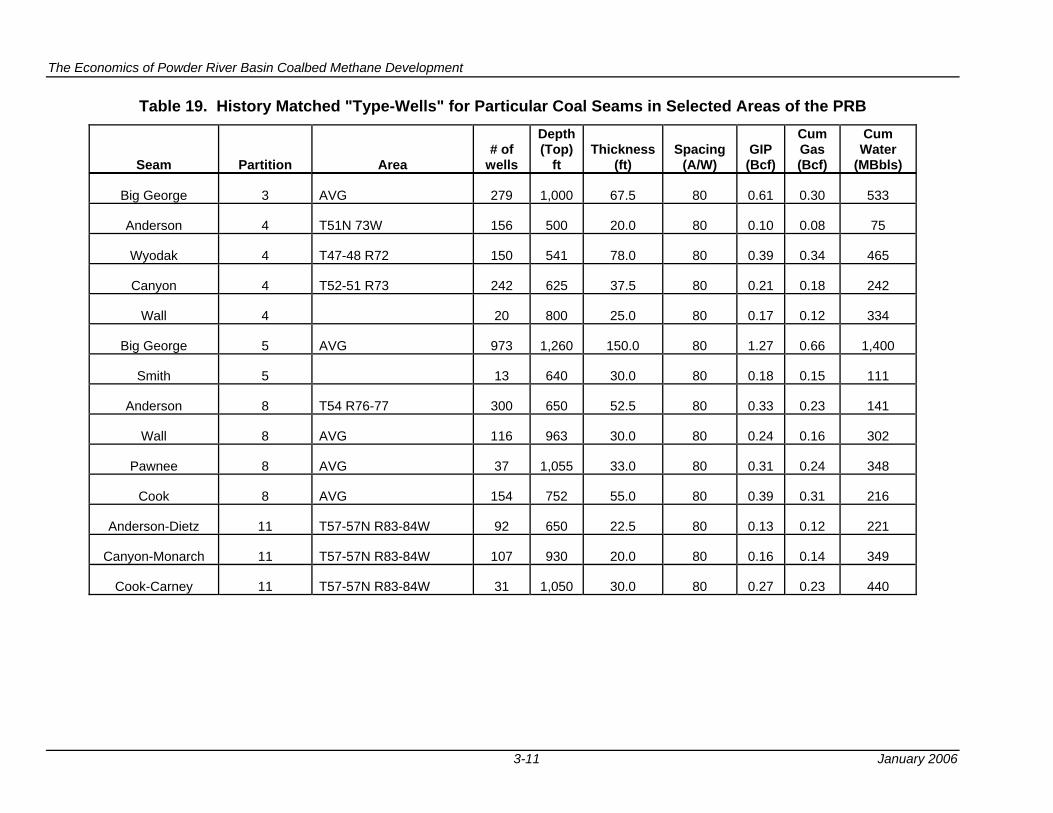
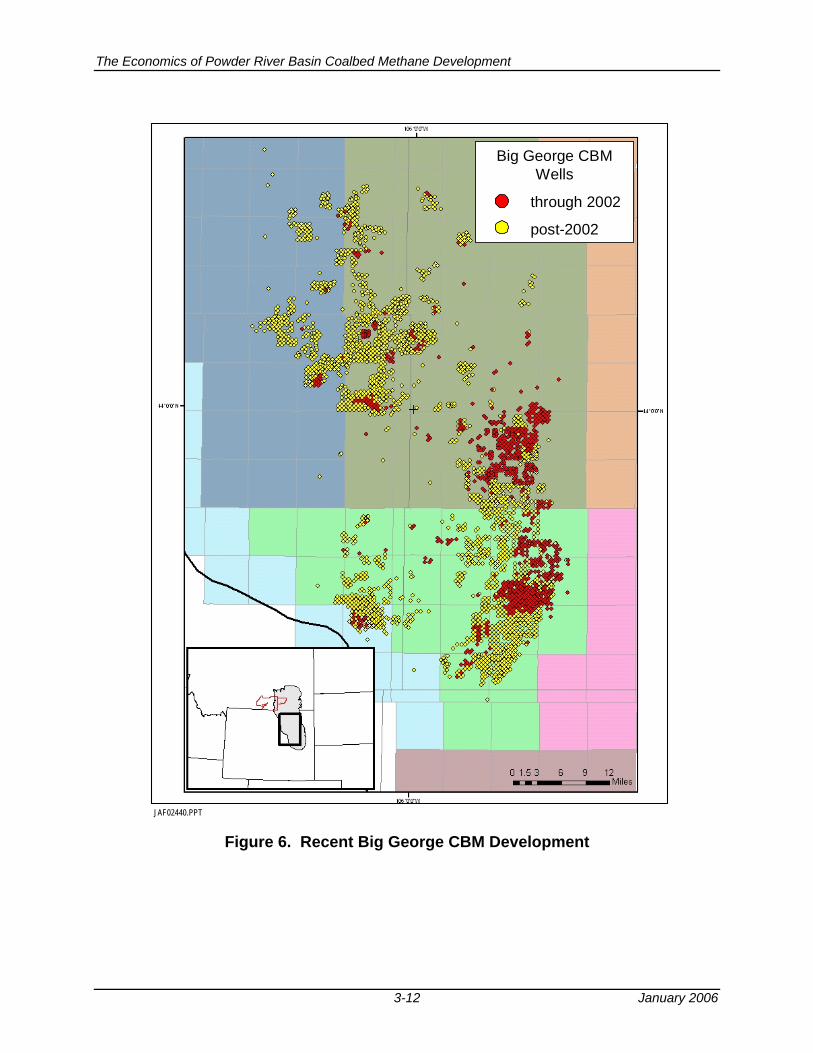
• The history-matched wells were extended in time (using COMET3) to provide 10-year CBM and water production rates and estimates of ultimate gas and water recovery for 14 “type-wells,” as shown on Table 19. Particular emphasis was placed on updating the well performance in the emerging Big George coal seam, as shown in Figure 6.
• The 14 history-matched wells were further modified using actual depth and thickness values for major seams, providing unique “A type-wells” for each major seam in each townships of the basin.
5. Produced Water Quality. Water quality data for the coal seams of the Powder River Basin are available in various formats and from several sources. The study used three of these sources to assemble a water quality database for the CBM-produced water in this basin.
The Economics of Powder River Basin Coalbed Methane Development
3-10 January 2006
Figure 5. Actual and History Matched Gas and Water Production per Well from
a Group of 300 Anderson Coal Seam Wells in the Northeastern Portion of the PRB
JAF02441.PPT
240,000
220,000
200,000
180,000
160,000
140,000
120,000
100,00080,000
60,000
40,000
20,000
0
Gas and Water Cumulative Recovery per Well, (Mcf and Bbl)
Gas and Water Production per Well, (Mcfd
and 100 Bpd)
Cum. Gas
Cum.
Gas Rate
Water Rate
220
200
180
160
140
120
100
80
60
40
20
0
The Economics of Powder River Basin Coalbed Methane Development
3-11 January 2006
Table 19. History Matched "Type-Wells" for Particular Coal Seams in Selected Areas of the PRB
Seam Partition Area # of
wells
Depth (Top)
ft Thickness
(ft) Spacing
(A/W) GIP (Bcf)
Cum Gas (Bcf)
Cum Water
(MBbls)
Big George 3 AVG 279 1,000 67.5 80 0.61 0.30 533
Anderson 4 T51N 73W 156 500 20.0 80 0.10 0.08 75
Wyodak 4 T47-48 R72 150 541 78.0 80 0.39 0.34 465
Canyon 4 T52-51 R73 242 625 37.5 80 0.21 0.18 242
Wall 4 20 800 25.0 80 0.17 0.12 334
Big George 5 AVG 973 1,260 150.0 80 1.27 0.66 1,400
Smith 5 13 640 30.0 80 0.18 0.15 111
Anderson 8 T54 R76-77 300 650 52.5 80 0.33 0.23 141
Wall 8 AVG 116 963 30.0 80 0.24 0.16 302
Pawnee 8 AVG 37 1,055 33.0 80 0.31 0.24 348
Cook 8 AVG 154 752 55.0 80 0.39 0.31 216
Anderson-Dietz 11 T57-57N R83-84W 92 650 22.5 80 0.13 0.12 221
Canyon-Monarch 11 T57-57N R83-84W 107 930 20.0 80 0.16 0.14 349
Cook-Carney 11 T57-57N R83-84W 31 1,050 30.0 80 0.27 0.23 440
The Economics of Powder River Basin Coalbed Methane Development
3-12 January 2006
JAF02440.PPT
Big George CBM Wells
through 2002
post-2002
Big George CBM Wells
through 2002
post-2002
Figure 6. Recent Big George CBM Development
The Economics of Powder River Basin Coalbed Methane Development
3-13 January 2006
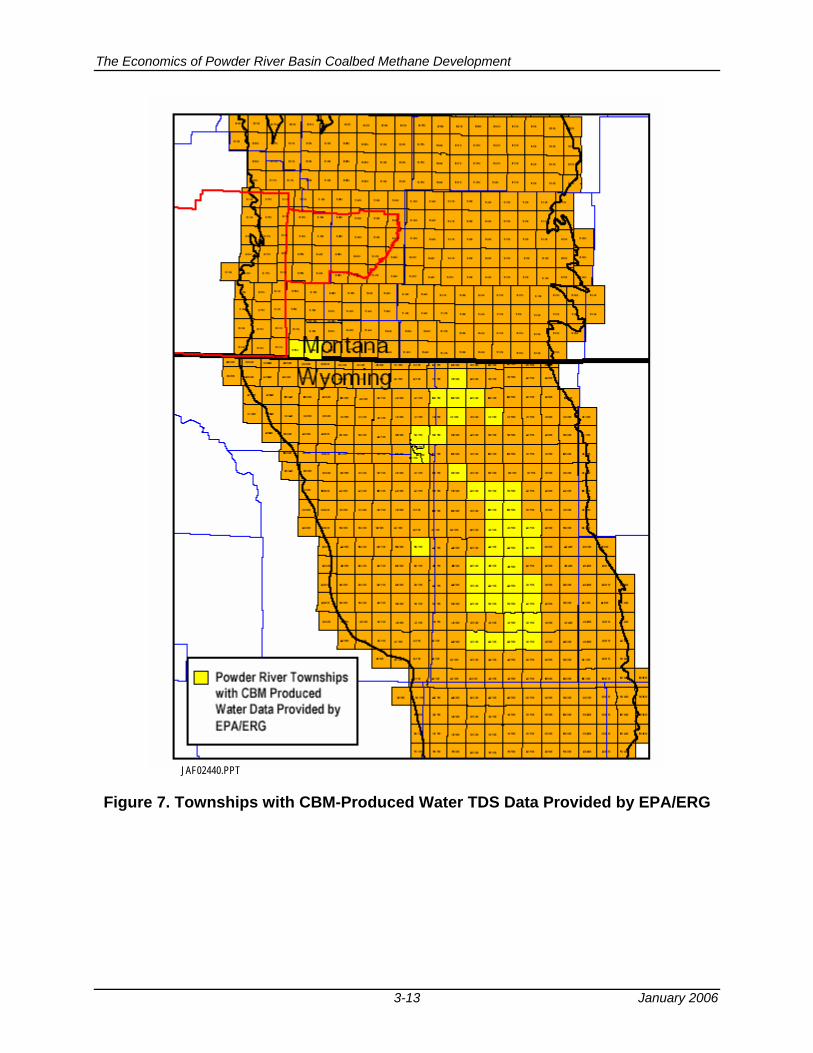
Figure 7. Townships with CBM-Produced Water TDS Data Provided by EPA/ERG
JAF02440.PPT
The Economics of Powder River Basin Coalbed Methane Development
3-14 January 2006
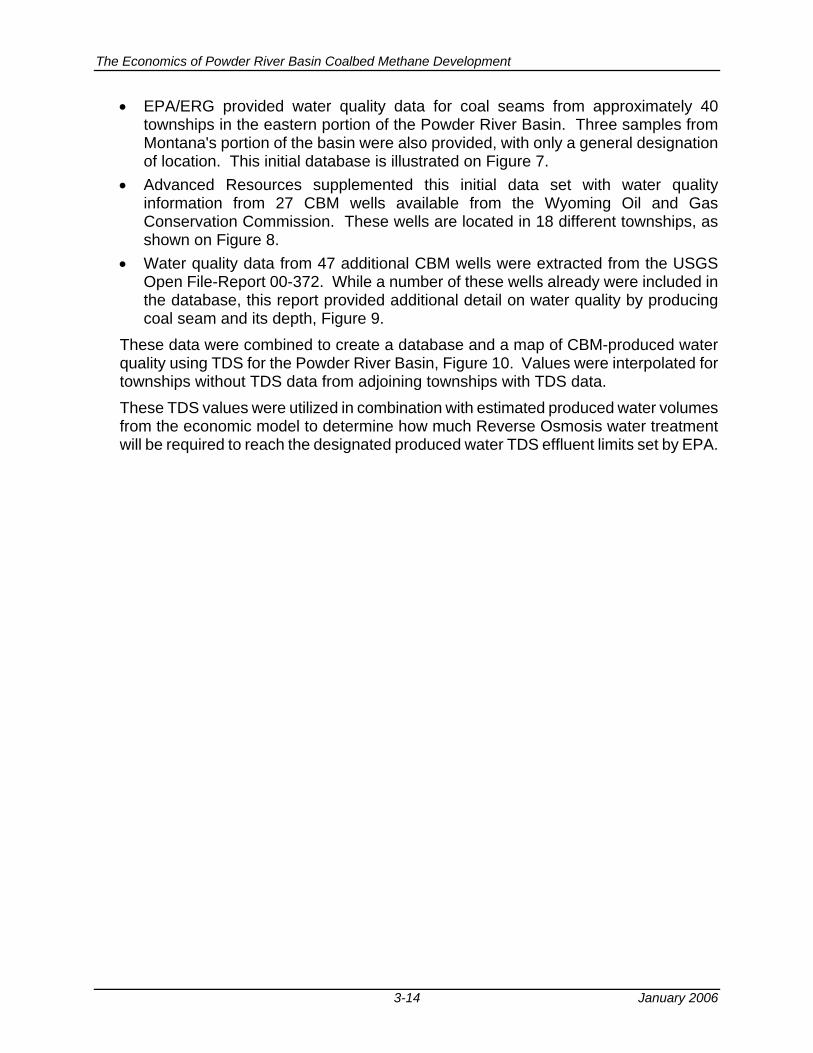
• EPA/ERG provided water quality data for coal seams from approximately 40 townships in the eastern portion of the Powder River Basin. Three samples from Montana's portion of the basin were also provided, with only a general designation of location. This initial database is illustrated on Figure 7.
• Advanced Resources supplemented this initial data set with water quality information from 27 CBM wells available from the Wyoming Oil and Gas Conservation Commission. These wells are located in 18 different townships, as shown on Figure 8.
• Water quality data from 47 additional CBM wells were extracted from the USGS Open File-Report 00-372. While a number of these wells already were included in the database, this report provided additional detail on water quality by producing coal seam and its depth, Figure 9.
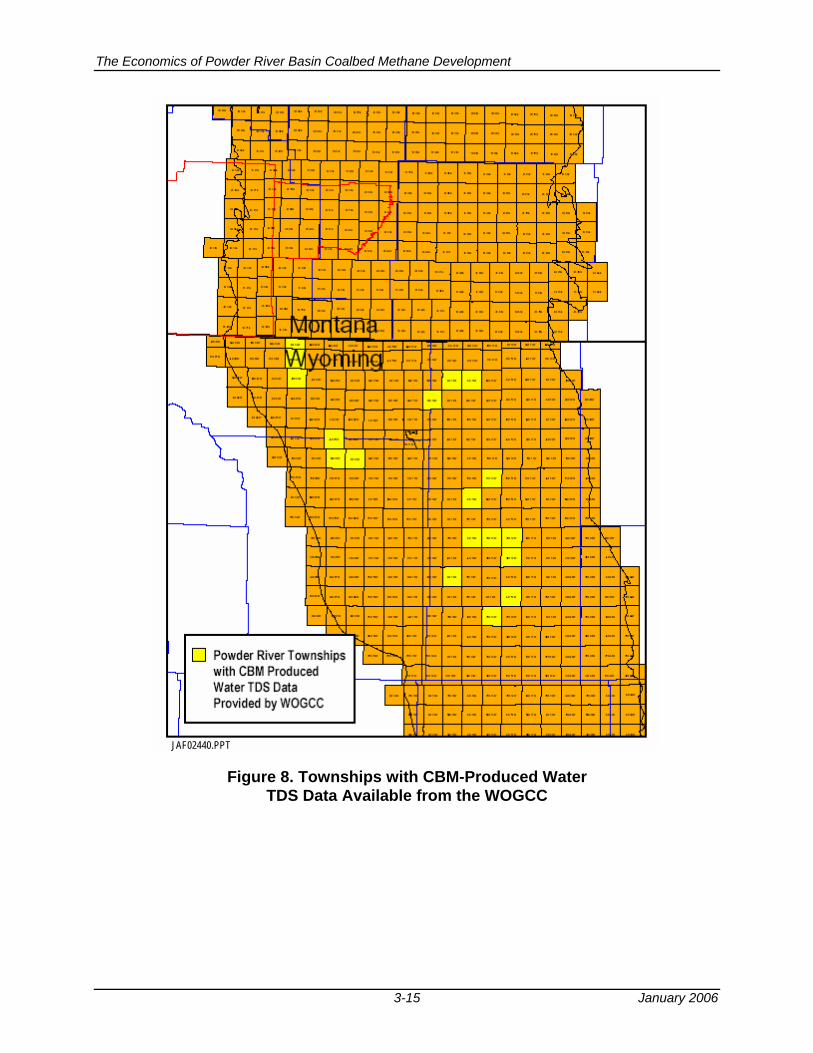
These data were combined to create a database and a map of CBM-produced water quality using TDS for the Powder River Basin, Figure 10. Values were interpolated for townships without TDS data from adjoining townships with TDS data. These TDS values were utilized in combination with estimated produced water volumes from the economic model to determine how much Reverse Osmosis water treatment will be required to reach the designated produced water TDS effluent limits set by EPA.
The Economics of Powder River Basin Coalbed Methane Development
3-15 January 2006
JAF02440.PPT Figure 8. Townships with CBM-Produced Water
TDS Data Available from the WOGCC

The Economics of Powder River Basin Coalbed Methane Development
3-16 January 2006
JAF02440.PPT Figure 9. Townships with CBM-Produced Water TDS Data
in USGS Open File Report
The Economics of Powder River Basin Coalbed Methane Development
3-17 January 2006
JAF02440.PPT Figure 10. Regional Distribution of CBM-Produced
Water TDS Data for the Powder River Basin
The Economics of Powder River Basin Coalbed Methane Development
3-18 January 2006
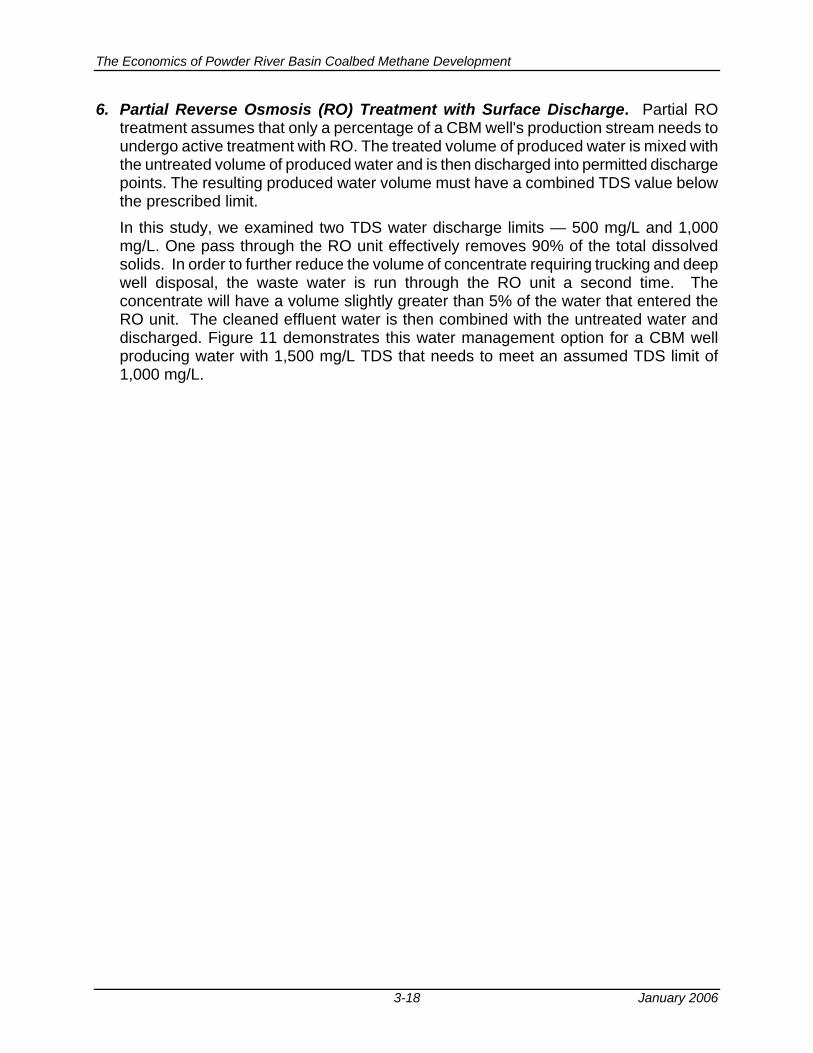
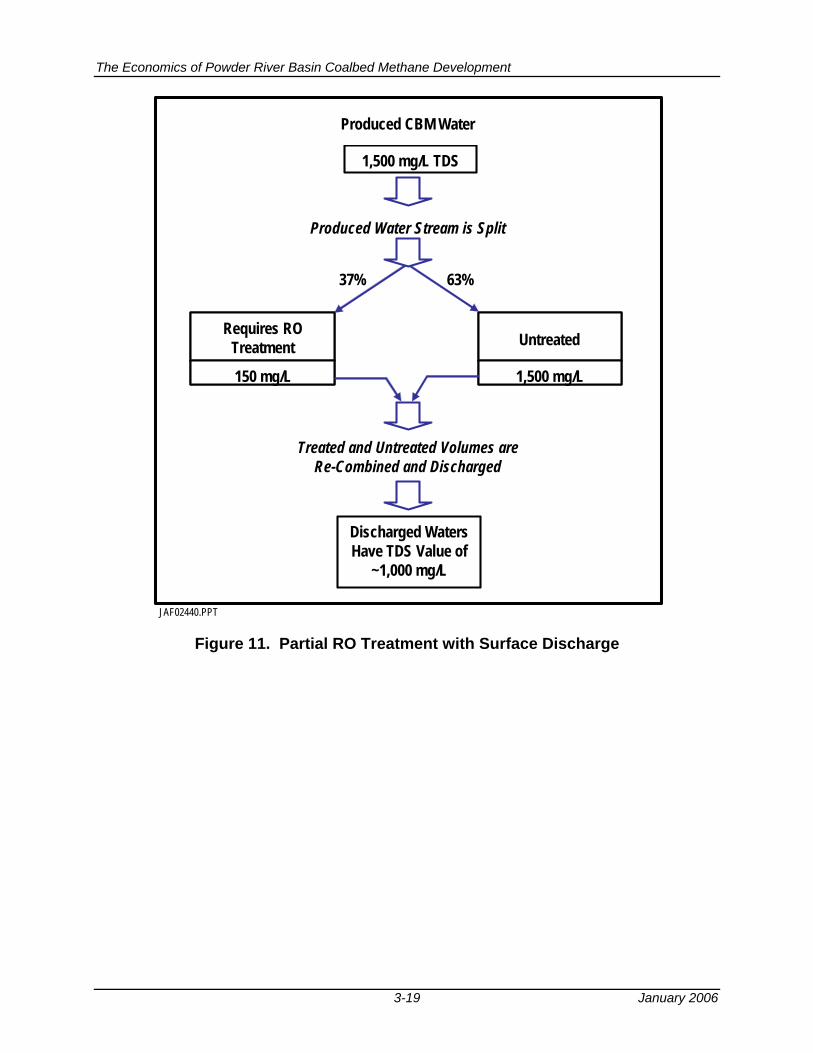
6. Partial Reverse Osmosis (RO) Treatment with Surface Discharge. Partial RO treatment assumes that only a percentage of a CBM well's production stream needs to undergo active treatment with RO. The treated volume of produced water is mixed with the untreated volume of produced water and is then discharged into permitted discharge points. The resulting produced water volume must have a combined TDS value below the prescribed limit. In this study, we examined two TDS water discharge limits — 500 mg/L and 1,000 mg/L. One pass through the RO unit effectively removes 90% of the total dissolved solids. In order to further reduce the volume of concentrate requiring trucking and deep well disposal, the waste water is run through the RO unit a second time. The concentrate will have a volume slightly greater than 5% of the water that entered the RO unit. The cleaned effluent water is then combined with the untreated water and discharged. Figure 11 demonstrates this water management option for a CBM well producing water with 1,500 mg/L TDS that needs to meet an assumed TDS limit of 1,000 mg/L.
The Economics of Powder River Basin Coalbed Methane Development
3-19 January 2006
1,500 mg/L TDS
Requires RO Treatment
150 mg/L
Requires RO Treatment
150 mg/L 1,500 mg/L1,500 mg/L
Discharged Waters Have TDS Value of
~1,000 mg/L
Produced Water Stream is Split
Treated and Untreated Volumes are Re-Combined and Discharged
Produced CBM Water
37% 63%
Untreated
JAF02440.PPT Figure 11. Partial RO Treatment with Surface Discharge
The Economics of Powder River Basin Coalbed Methane Development
4-1 January 2006
IV. BASIC COST AND ECONOMICS MODEL 1. Introduction. This study used an updated version of ARI's CBM cost and economic
model, CECON (Coalbed Economics), to assess the feasibility of developing CBM with alternative water management options. The model contains four main components: 1) field development capital costs; 2) field operating and maintenance costs; 3) gas transportation and compressions costs; and 4) other costs. These costs are estimated as a function of gas prices, based on the cost-price relationships set forth in Appendix A. The economic model incorporates alternative natural gas prices (at either Henry Hub or at the wellhead), royalties, production taxes and other factors that impact CBM costs and economics. The economic model is an industry-standard discounted cash flow (DCF) model that provides both an internal rate of return and the net present value (NPV) of an investment at various discount rates and at various gas prices.
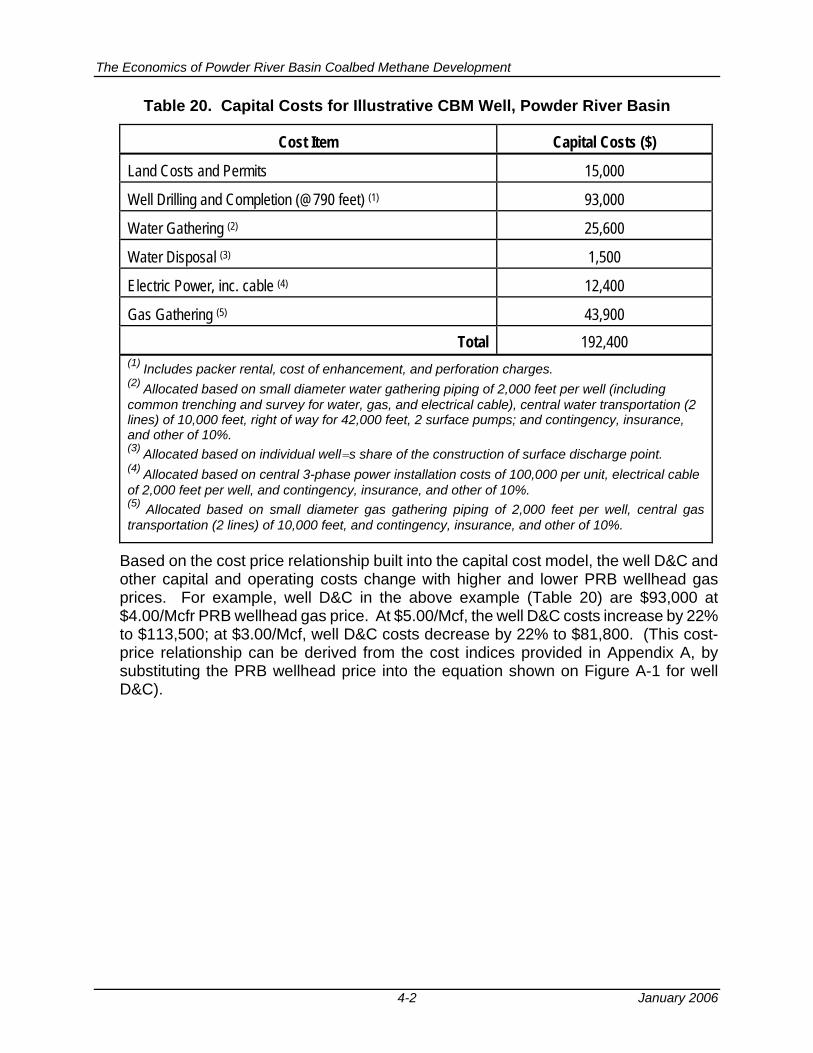
2. Capital Costs for PRB CBM Well. The basic capital costs for a PRB CBM well include outlays for land, permits, drilling and completion, infrastructure, and water management. These costs vary considerably by well depth and location. For illustrative purposes, Table 20 shows the capital costs for a Powder River Basin CBM well at 790 feet of depth, spaced on 80 acres with 2 wells per pad (assuming a $4.00/Mcf PRB wellhead gas price). Capital costs are per well, assuming a 16 well, 8 pad development unit. Gas treating and compression is assumed provided by a third party contract and is included in annual operating costs. The cost example assumes that impoundments are used for produced CBM waters disposal. The field development capital costs for the example PRB CBM well are estimated at $192,400.
The Economics of Powder River Basin Coalbed Methane Development
4-2 January 2006
Table 20. Capital Costs for Illustrative CBM Well, Powder River Basin
Cost Item Capital Costs ($)
Land Costs and Permits 15,000
Well Drilling and Completion (@790 feet) (1) 93,000
Water Gathering (2) 25,600
Water Disposal (3) 1,500
Electric Power, inc. cable (4) 12,400
Gas Gathering (5) 43,900 Total 192,400
(1) Includes packer rental, cost of enhancement, and perforation charges. (2) Allocated based on small diameter water gathering piping of 2,000 feet per well (including common trenching and survey for water, gas, and electrical cable), central water transportation (2 lines) of 10,000 feet, right of way for 42,000 feet, 2 surface pumps; and contingency, insurance, and other of 10%. (3) Allocated based on individual well=s share of the construction of surface discharge point. (4) Allocated based on central 3-phase power installation costs of 100,000 per unit, electrical cable of 2,000 feet per well, and contingency, insurance, and other of 10%. (5) Allocated based on small diameter gas gathering piping of 2,000 feet per well, central gas transportation (2 lines) of 10,000 feet, and contingency, insurance, and other of 10%.
Based on the cost price relationship built into the capital cost model, the well D&C and other capital and operating costs change with higher and lower PRB wellhead gas prices. For example, well D&C in the above example (Table 20) are $93,000 at $4.00/Mcfr PRB wellhead gas price. At $5.00/Mcf, the well D&C costs increase by 22% to $113,500; at $3.00/Mcf, well D&C costs decrease by 22% to $81,800. (This cost-price relationship can be derived from the cost indices provided in Appendix A, by substituting the PRB wellhead price into the equation shown on Figure A-1 for well D&C).
The Economics of Powder River Basin Coalbed Methane Development
4-3 January 2006
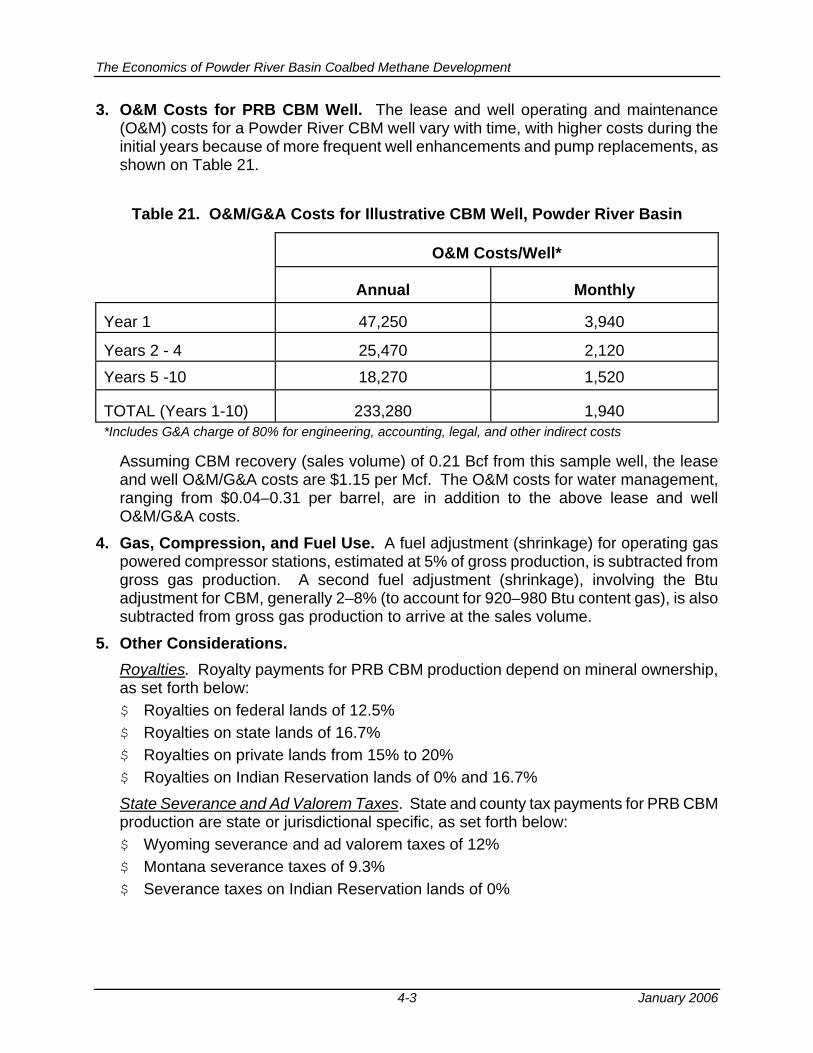
3. O&M Costs for PRB CBM Well. The lease and well operating and maintenance (O&M) costs for a Powder River CBM well vary with time, with higher costs during the initial years because of more frequent well enhancements and pump replacements, as shown on Table 21.
Table 21. O&M/G&A Costs for Illustrative CBM Well, Powder River Basin
O&M Costs/Well* Annual Monthly
Year 1 47,250 3,940
Years 2 - 4 25,470 2,120
Years 5 -10 18,270 1,520
TOTAL (Years 1-10) 233,280 1,940 *Includes G&A charge of 80% for engineering, accounting, legal, and other indirect costs
Assuming CBM recovery (sales volume) of 0.21 Bcf from this sample well, the lease and well O&M/G&A costs are $1.15 per Mcf. The O&M costs for water management, ranging from $0.04–0.31 per barrel, are in addition to the above lease and well O&M/G&A costs.
4. Gas, Compression, and Fuel Use. A fuel adjustment (shrinkage) for operating gas powered compressor stations, estimated at 5% of gross production, is subtracted from gross gas production. A second fuel adjustment (shrinkage), involving the Btu adjustment for CBM, generally 2–8% (to account for 920–980 Btu content gas), is also subtracted from gross gas production to arrive at the sales volume.
5. Other Considerations. Royalties. Royalty payments for PRB CBM production depend on mineral ownership, as set forth below: $ Royalties on federal lands of 12.5% $ Royalties on state lands of 16.7% $ Royalties on private lands from 15% to 20% $ Royalties on Indian Reservation lands of 0% and 16.7% State Severance and Ad Valorem Taxes. State and county tax payments for PRB CBM production are state or jurisdictional specific, as set forth below: $ Wyoming severance and ad valorem taxes of 12% $ Montana severance taxes of 9.3% $ Severance taxes on Indian Reservation lands of 0%

The Economics of Powder River Basin Coalbed Methane Development
4-4 January 2006
Income Taxes. The economic model is an after tax model. As such state and federal income taxes are incorporated into the cash flow model. The tax rates for Montana and Wyoming are set forth below: $ Montana state Income tax rate ranges from 2–11% and 11% was used in the study. $ Wyoming collects no state income tax. $ Federal income tax rate is set at 35%.
6. Gas Transportation and Basis Differentials. The costs for gas treatment, compression, and transportation are added to the wellhead gas prices reported in this version of the economic model to estimate the applicable Henry Hub natural gas price. These costs will vary depending on the gas system charges for transporting natural gas from the central compressor outlet to the Colorado Interstate Gas (CIG) hub (or another hub). This gas treatment, compression, and transportation cost is projected to be $0.70/Mcf based on the gas transportation charges from three systems in the PRB. The “basis differential” also needs to be added to the wellhead gas price reported in this version of the economic model to estimate the applicable Henry Hub natural gas price. The basis differential contains the costs to transport gas from the CIG (or other) hub in the Powder River Basin to market. The “basis differential” varies with market conditions and with natural gas price. We have included a relationship that relates basis differential to wellhead prices in the Powder River Basin. The differential ranges from $0.80 at low natural gas prices ($3.00/mcf wellhead) to $1.60 at higher prices ($7.00/mcf wellhead). Table 22 shows the relationship between wellhead price, the Wyoming Pool Hub and the Henry Hub marker price.
Table 22. The Relationship between Natural Gas Prices at the Wellhead, the
Wyoming Pool Hub and the Henry Hub (/Mcf)
Wellhead Price (/Mcf)
In-Basin Transportation
Wyoming Pool Hub Price
Basis Differential
Henry Hub Market Price
3 0.70 3.70 0.80 4.50
4 0.70 4.70 1 5.70
5 0.70 5.70 1.20 6.90
6 0.70 6.70 1.40 8.10 7 0.70 7.70 1.60 9.30
Given these two adjustments, the economic model runs are reported at a realized wellhead price. To calculate a posted sale price for natural gas, the current basis differential and the basin transportation costs would need to be added to the wellhead price.
The Economics of Powder River Basin Coalbed Methane Development
4-5 January 2006
7. Economic Scenarios. The study provided results at nine wellhead gas prices. The first price run was at a constant $3.00/Mcf realized wellhead price over a 10-year well life. The subsequent price runs were made at $0.50/Mcf increments in the realized wellhead price, up to $7.00/Mcf. A total of 126 economic cases were examined, consisting of 9 wellhead price cases and 7 water disposal and management options, and each combination was run at two hurdle rates. The first hurdle rate represents the minimum return on investment that an operator in the Powder River Basin would require in developing a field. This hurdle rate is set at 15% after tax. A second rate of return hurdle rate is also run, This hurdle rate is set at 7% (after tax). To evaluate the economic impact of two water quality thresholds, we made two economic runs for the Partial Reverse Osmosis water management case and two economic runs for the Ion Exchange case. For each of these management practices, the first assumed a CBM-produced water effluent TDS target of 500 mg/L; the second assumed a CBM produced water effluent TDS target of 1,000 mg/L. Additional detail on the economic model and the economic analyses of the impacts of alternative water disposal options on economic CBM-production is provided for three sample townships in Appendix D.
The Economics of Powder River Basin Coalbed Methane Development
5-1 January 2006
V. ANALYSIS OF COALBED METHANE PRODUCTION AND WATER MANAGEMENT ON INDIAN RESERVATION LANDS IN THE PRB
1. Background. An important aspect of the study was to assess the impact of alternative water management options on the economics of CBM recovery from the Northern Cheyenne and Crow Reservations in the Powder River Basin. The Northern Cheyenne and Crow Reservations are in the northwestern portion of the Powder River Basin, as shown in Figure 12. The Northern Cheyenne Reservation is on the north-central border of the Powder River Basin CBM play where the coal seams become shallow and relatively thin. The Crow Reservation is on the northwestern border of the Powder River Basin CBM play where the coals outcrop and also become shallow or thin or are absent. Figure 13 provides a more detailed outline and topography of the Northern Cheyenne Reservation. Figure 14 provides the more detailed outline and topography of the Crow Reservation.
2. Assembling the CBM Resource Database. Essentially no compiled, publicly available data is available on the coal resources of the two Indian Reservations in the PRB. As a result, Advanced Resources assembled a preliminary coal resource database using: 1) older publicly available well logs for wells drilled on these reservations for oil and natural gas; and, 2) available coal outcrop and basin outline maps.
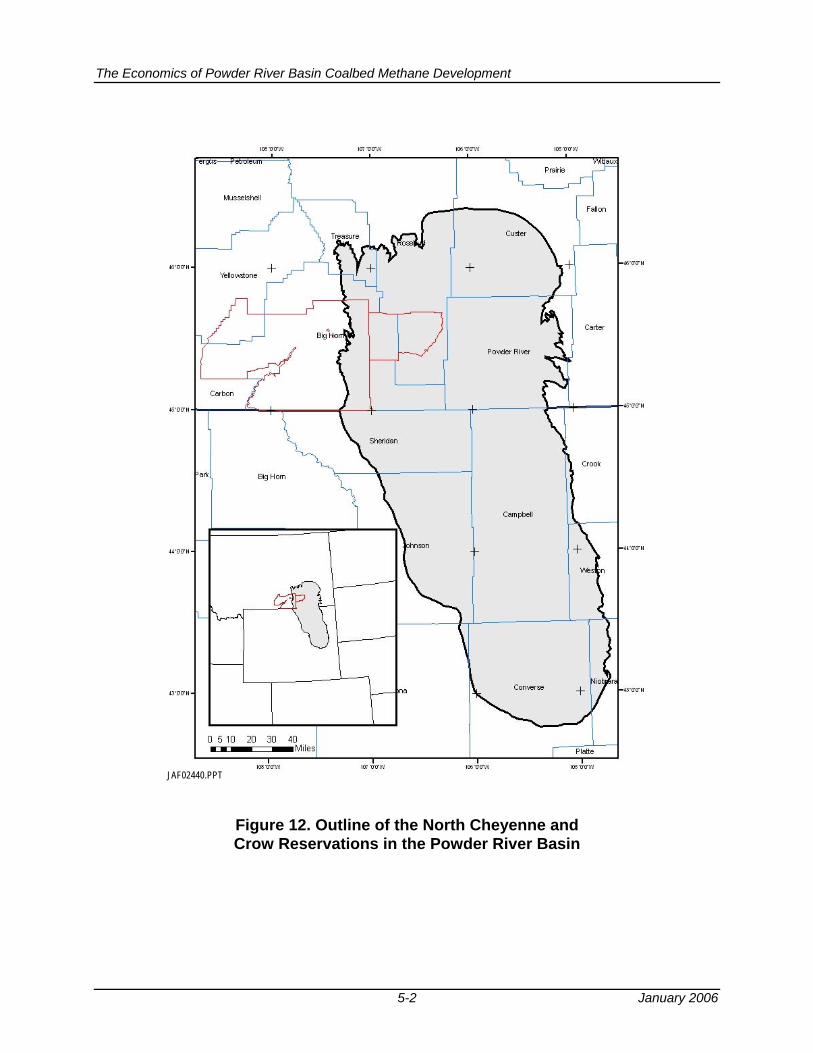
The Economics of Powder River Basin Coalbed Methane Development
5-2 January 2006
JAF02440.PPT
Figure 12. Outline of the North Cheyenne and Crow Reservations in the Powder River Basin
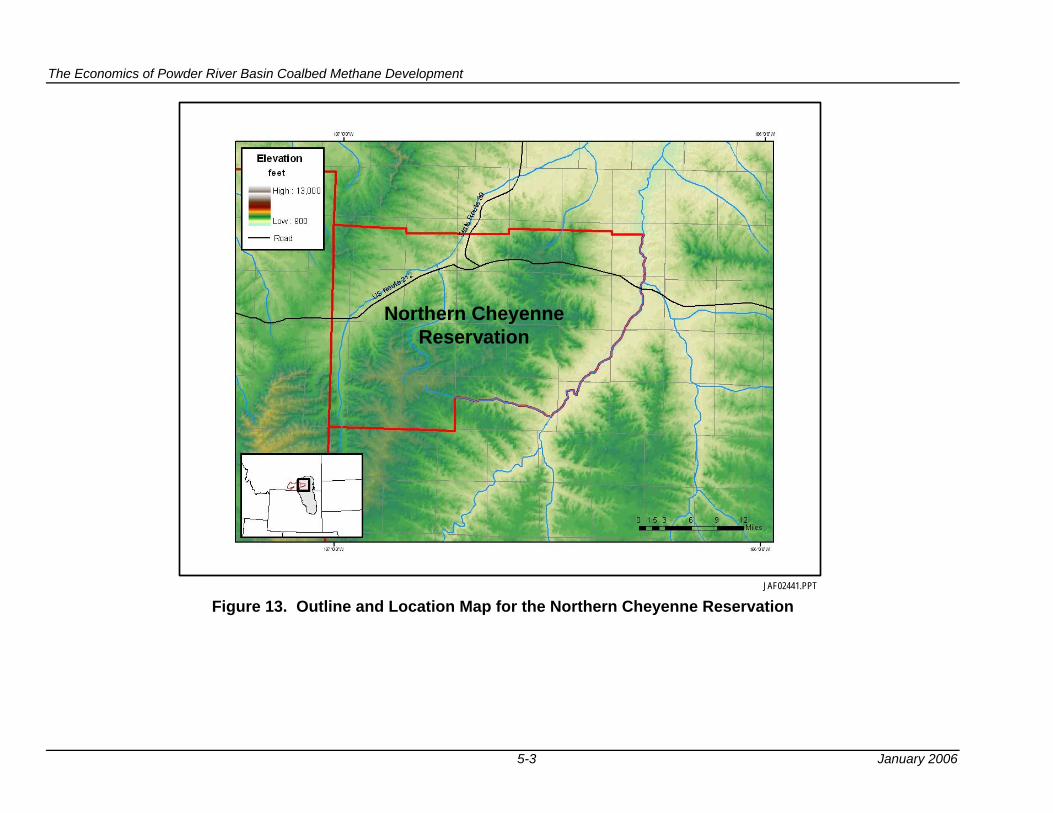
The Economics of Powder River Basin Coalbed Methane Development
5-3 January 2006
Northern Cheyenne Reservation
JAF02441.PPT Figure 13. Outline and Location Map for the Northern Cheyenne Reservation
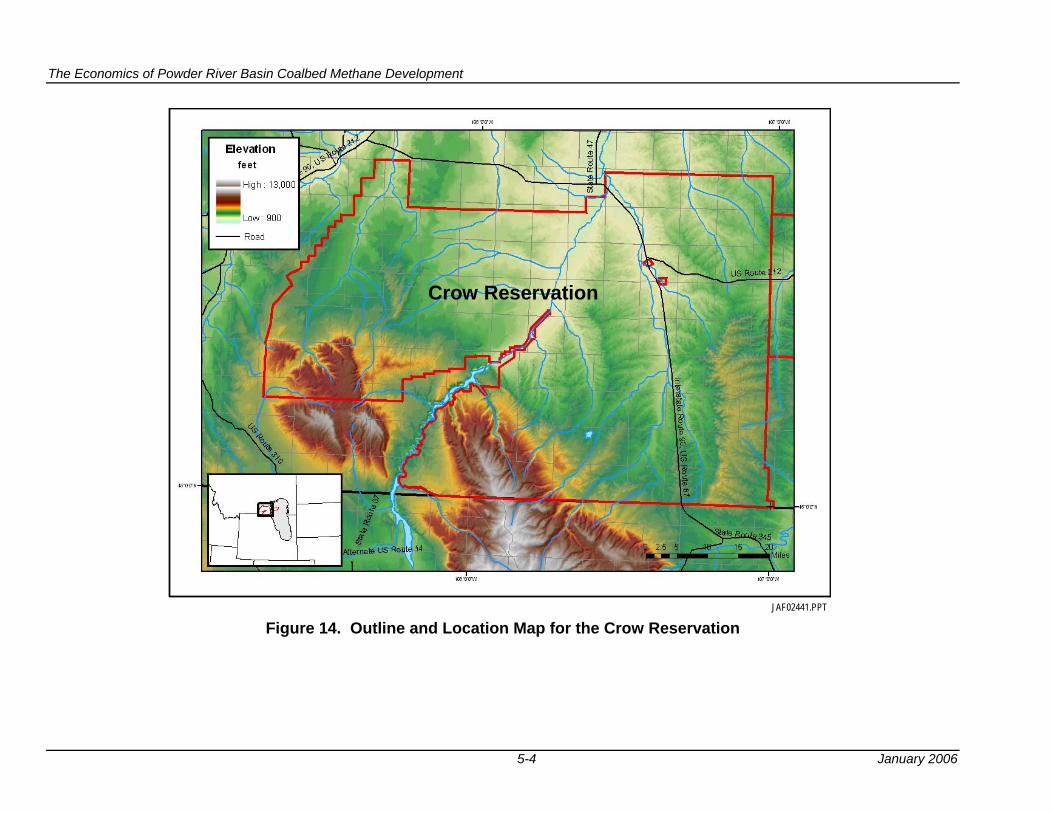
The Economics of Powder River Basin Coalbed Methane Development
5-4 January 2006
Crow Reservation
JAF02441.PPT Figure 14. Outline and Location Map for the Crow Reservation
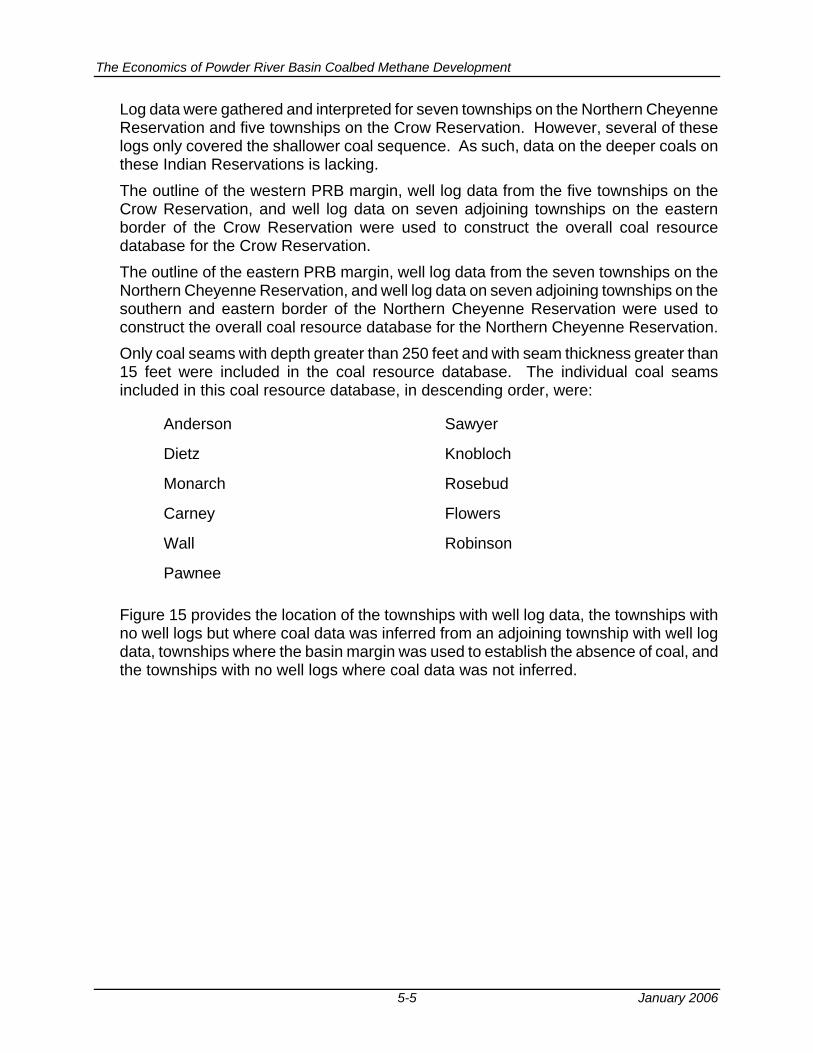
The Economics of Powder River Basin Coalbed Methane Development
5-5 January 2006
Log data were gathered and interpreted for seven townships on the Northern Cheyenne Reservation and five townships on the Crow Reservation. However, several of these logs only covered the shallower coal sequence. As such, data on the deeper coals on these Indian Reservations is lacking. The outline of the western PRB margin, well log data from the five townships on the Crow Reservation, and well log data on seven adjoining townships on the eastern border of the Crow Reservation were used to construct the overall coal resource database for the Crow Reservation. The outline of the eastern PRB margin, well log data from the seven townships on the Northern Cheyenne Reservation, and well log data on seven adjoining townships on the southern and eastern border of the Northern Cheyenne Reservation were used to construct the overall coal resource database for the Northern Cheyenne Reservation. Only coal seams with depth greater than 250 feet and with seam thickness greater than 15 feet were included in the coal resource database. The individual coal seams included in this coal resource database, in descending order, were:
Anderson Sawyer
Dietz Knobloch
Monarch Rosebud
Carney Flowers
Wall Robinson
Pawnee
Figure 15 provides the location of the townships with well log data, the townships with no well logs but where coal data was inferred from an adjoining township with well log data, townships where the basin margin was used to establish the absence of coal, and the townships with no well logs where coal data was not inferred.
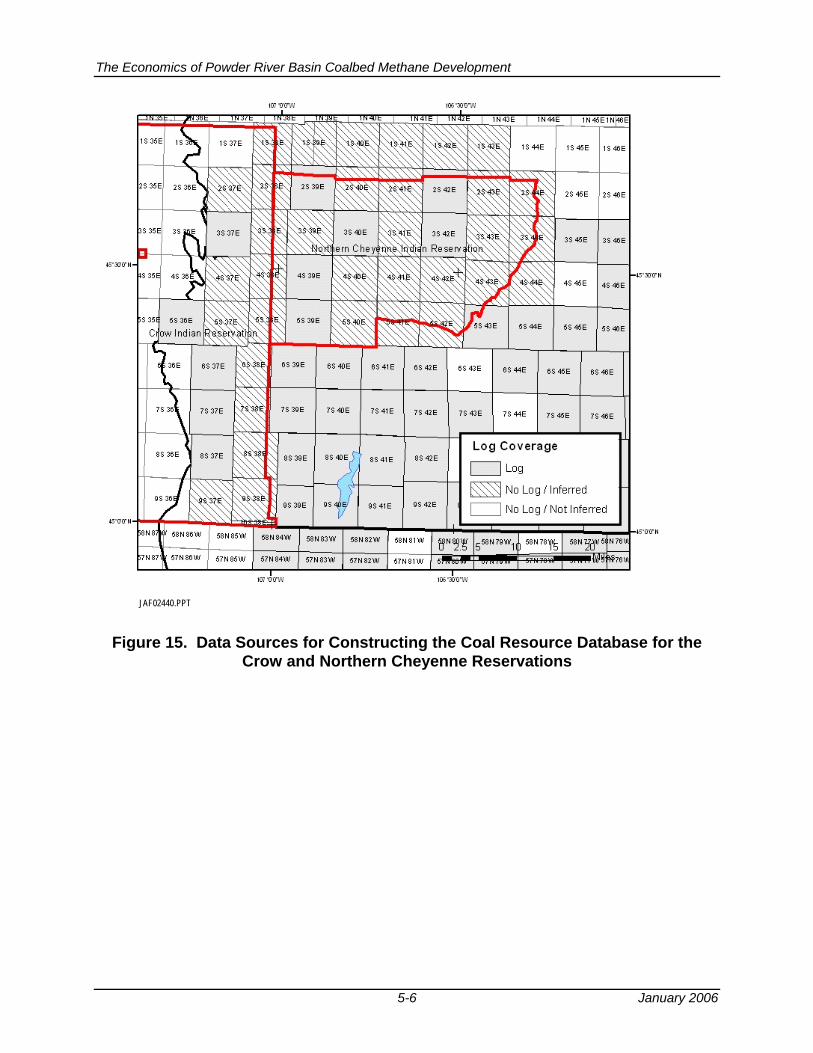
The Economics of Powder River Basin Coalbed Methane Development
5-6 January 2006
JAF02440.PPT
Figure 15. Data Sources for Constructing the Coal Resource Database for the Crow and Northern Cheyenne Reservations
The Economics of Powder River Basin Coalbed Methane Development
5-7 January 2006
3. Estimating Technically and Economically Recoverable Resources. The calculations of technically recoverable volumes of CBM for the two Indian Reservations were made on a township basis using the measured or inferred coal thickness and depth data and the appropriate “type-wells” for each coal seam (adjusted for coal seam thickness and depth). The calculations of economically recoverable volumes of CBM were made by placing the technically recoverable gas and water productions streams (established from the above data) into Advanced Resources cost and economic model (CECON). The economic analysis was performed using two assumptions on royalty rates, a 16.7% royalty (as if a third party would be developing the resource) and a 0% royalty (assuming the resource would be developed by each Indian Tribe, similar to the CBM development in the San Juan Basin by Red Willow, the Ute Tribe CBM operating company). Except for a few townships with thick and extensive coal development, much of the coal resource on the Northern Cheyenne and particularly the Crow Reservation is too shallow or too thin for CBM development using conventional well completing practices and technology. Advanced well completions practices, such as multi-seam well (MSC) completion technology, that would link several of the thin and shallow coals to a single wellbore, would be particularly valuable for improving both the size and the economic potential for CBM development on these two Indian Reservations. Additional field-based research and demonstration is still required for successful adaptation and widespread use of this technology for Powder River Basin CBM; therefore MSC technology was not analyzed by this study.
4. Results of the Analysis. Table 23 provides the tabulation of CBM recovery on the Northern Cheyenne and Crow Reservations as a function of wellhead gas price and water management practice, assuming a 15% rate of return hurdle rate. Table 24 provides additional data on water production, and Table 25 provides the number for wells linked with the volume of economic CBM production. Table 26 provides the tabulation of CBM recovery on the Northern Cheyenne and Crow Reservations as a function of wellhead gas price and water management practice, assuming a 7% rate or return hurdle rate. Table 27 provides additional data on water production, and Table 28 provides the number for wells linked with the volume of economic CBM production.
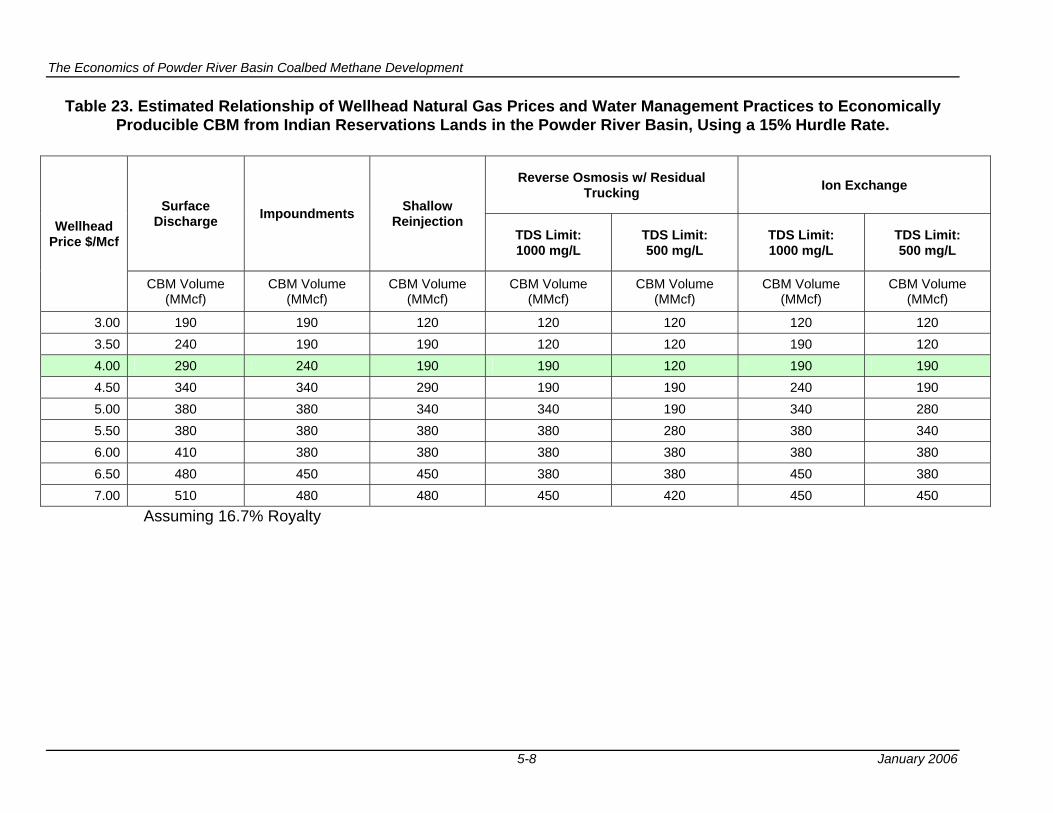
The Economics of Powder River Basin Coalbed Methane Development
5-8 January 2006
Table 23. Estimated Relationship of Wellhead Natural Gas Prices and Water Management Practices to Economically Producible CBM from Indian Reservations Lands in the Powder River Basin, Using a 15% Hurdle Rate.
Assuming 16.7% Royalty
Reverse Osmosis w/ Residual Trucking Ion Exchange
Surface Discharge Impoundments Shallow
Reinjection TDS Limit: 1000 mg/L
TDS Limit: 500 mg/L
TDS Limit: 1000 mg/L
TDS Limit: 500 mg/L
Wellhead Price $/Mcf
CBM Volume (MMcf)
CBM Volume (MMcf)
CBM Volume (MMcf)
CBM Volume (MMcf)
CBM Volume (MMcf)
CBM Volume (MMcf)
CBM Volume (MMcf)
3.00 190 190 120 120 120 120 120 3.50 240 190 190 120 120 190 120 4.00 290 240 190 190 120 190 190 4.50 340 340 290 190 190 240 190 5.00 380 380 340 340 190 340 280 5.50 380 380 380 380 280 380 340 6.00 410 380 380 380 380 380 380 6.50 480 450 450 380 380 450 380 7.00 510 480 480 450 420 450 450
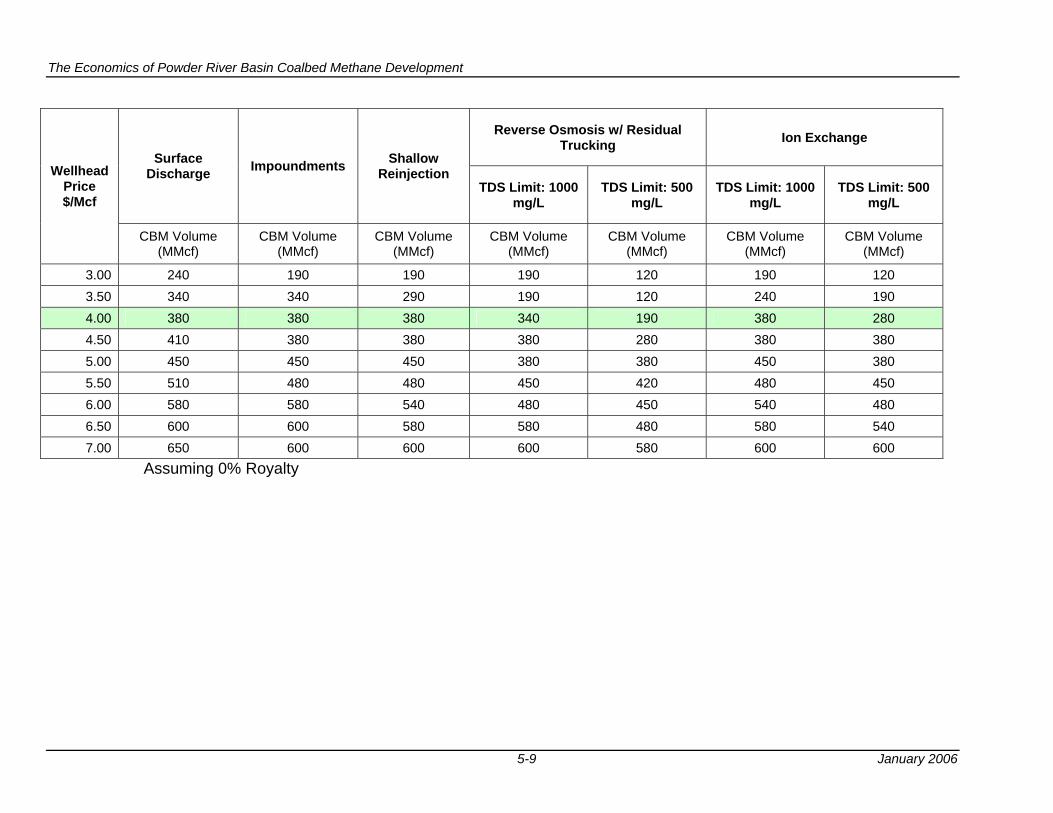
The Economics of Powder River Basin Coalbed Methane Development
5-9 January 2006
Assuming 0% Royalty
Reverse Osmosis w/ Residual Trucking Ion Exchange
Surface Discharge Impoundments Shallow
Reinjection TDS Limit: 1000
mg/L TDS Limit: 500
mg/L TDS Limit: 1000
mg/L TDS Limit: 500
mg/L
Wellhead Price $/Mcf
CBM Volume (MMcf)
CBM Volume (MMcf)
CBM Volume (MMcf)
CBM Volume (MMcf)
CBM Volume (MMcf)
CBM Volume (MMcf)
CBM Volume (MMcf)
3.00 240 190 190 190 120 190 120 3.50 340 340 290 190 120 240 190 4.00 380 380 380 340 190 380 280 4.50 410 380 380 380 280 380 380 5.00 450 450 450 380 380 450 380 5.50 510 480 480 450 420 480 450 6.00 580 580 540 480 450 540 480 6.50 600 600 580 580 480 580 540 7.00 650 600 600 600 580 600 600
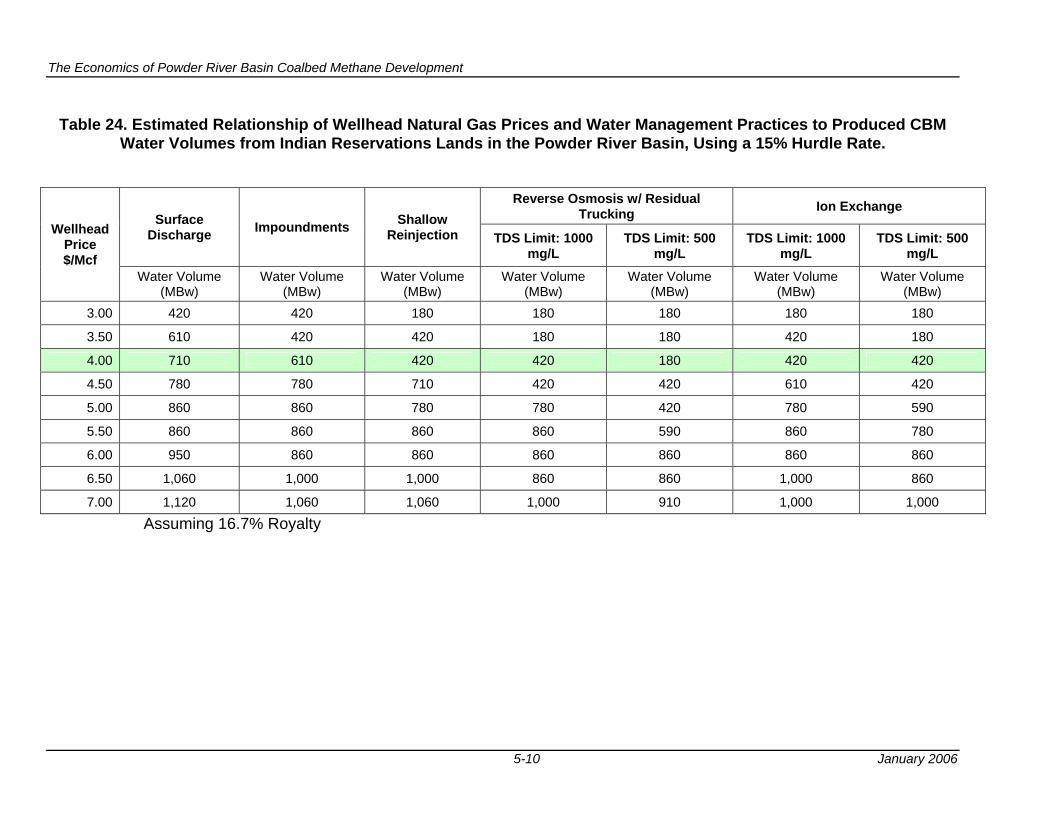
The Economics of Powder River Basin Coalbed Methane Development
5-10 January 2006
Table 24. Estimated Relationship of Wellhead Natural Gas Prices and Water Management Practices to Produced CBM
Water Volumes from Indian Reservations Lands in the Powder River Basin, Using a 15% Hurdle Rate.
Assuming 16.7% Royalty
Reverse Osmosis w/ Residual Trucking Ion Exchange
Surface Discharge Impoundments Shallow
Reinjection TDS Limit: 1000 mg/L
TDS Limit: 500 mg/L
TDS Limit: 1000 mg/L
TDS Limit: 500 mg/L
Wellhead Price $/Mcf
Water Volume (MBw)
Water Volume (MBw)
Water Volume (MBw)
Water Volume (MBw)
Water Volume (MBw)
Water Volume (MBw)
Water Volume (MBw)
3.00 420 420 180 180 180 180 180
3.50 610 420 420 180 180 420 180
4.00 710 610 420 420 180 420 420
4.50 780 780 710 420 420 610 420
5.00 860 860 780 780 420 780 590
5.50 860 860 860 860 590 860 780
6.00 950 860 860 860 860 860 860
6.50 1,060 1,000 1,000 860 860 1,000 860
7.00 1,120 1,060 1,060 1,000 910 1,000 1,000
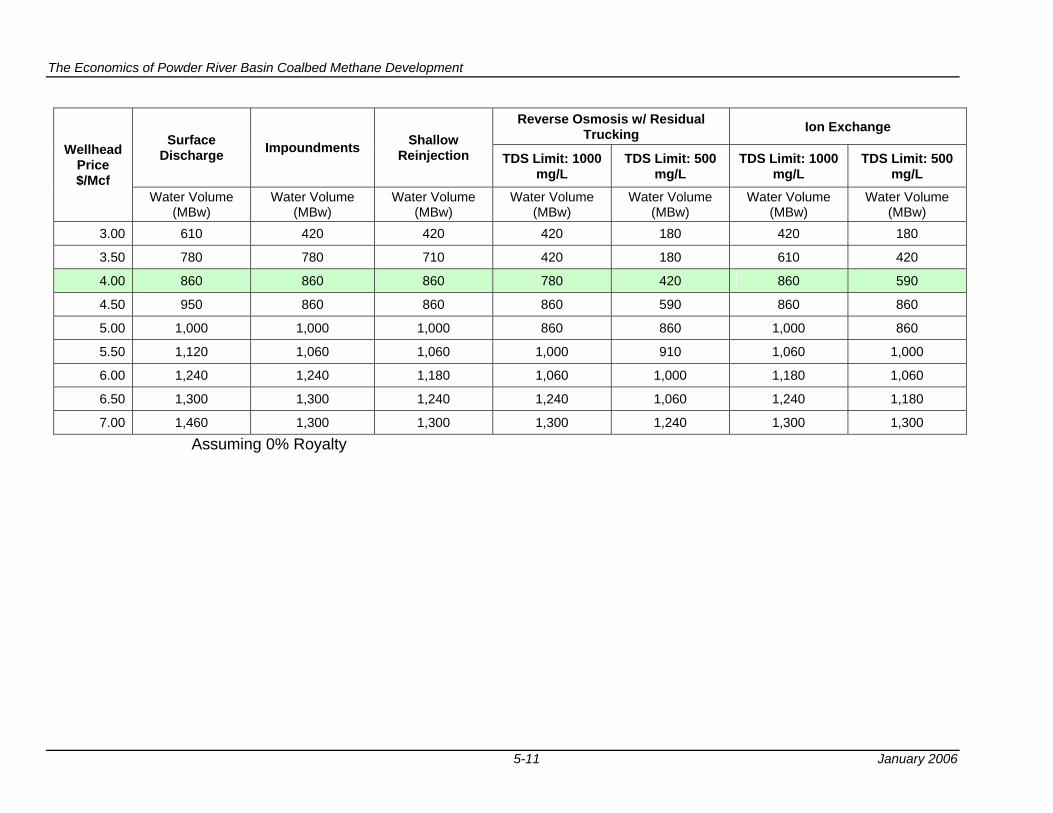
The Economics of Powder River Basin Coalbed Methane Development
5-11 January 2006
Assuming 0% Royalty
Reverse Osmosis w/ Residual Trucking Ion Exchange
Surface Discharge Impoundments Shallow
Reinjection TDS Limit: 1000 mg/L
TDS Limit: 500 mg/L
TDS Limit: 1000 mg/L
TDS Limit: 500 mg/L
Wellhead Price $/Mcf
Water Volume (MBw)
Water Volume (MBw)
Water Volume (MBw)
Water Volume (MBw)
Water Volume (MBw)
Water Volume (MBw)
Water Volume (MBw)
3.00 610 420 420 420 180 420 180
3.50 780 780 710 420 180 610 420
4.00 860 860 860 780 420 860 590
4.50 950 860 860 860 590 860 860
5.00 1,000 1,000 1,000 860 860 1,000 860
5.50 1,120 1,060 1,060 1,000 910 1,060 1,000
6.00 1,240 1,240 1,180 1,060 1,000 1,180 1,060
6.50 1,300 1,300 1,240 1,240 1,060 1,240 1,180
7.00 1,460 1,300 1,300 1,300 1,240 1,300 1,300
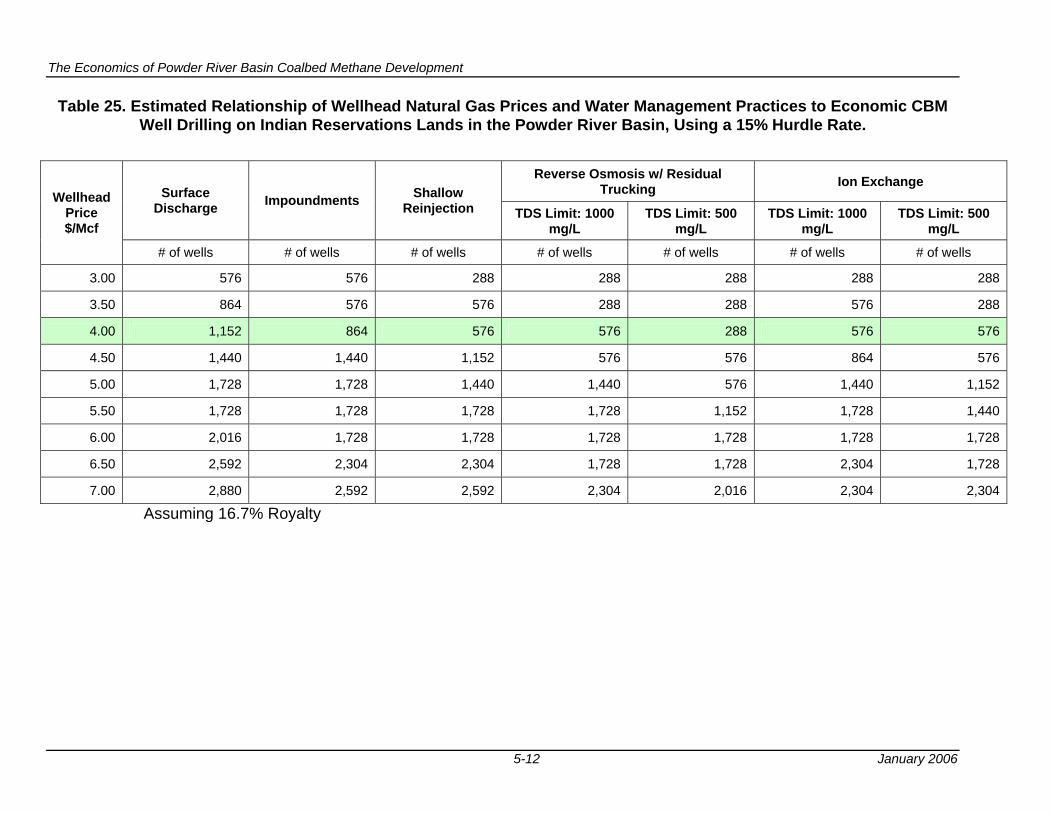
The Economics of Powder River Basin Coalbed Methane Development
5-12 January 2006
Table 25. Estimated Relationship of Wellhead Natural Gas Prices and Water Management Practices to Economic CBM Well Drilling on Indian Reservations Lands in the Powder River Basin, Using a 15% Hurdle Rate.
Assuming 16.7% Royalty
Reverse Osmosis w/ Residual Trucking Ion Exchange
Surface Discharge Impoundments Shallow
Reinjection TDS Limit: 1000 mg/L
TDS Limit: 500 mg/L
TDS Limit: 1000 mg/L
TDS Limit: 500 mg/L
Wellhead Price $/Mcf
# of wells # of wells # of wells # of wells # of wells # of wells # of wells
3.00 576 576 288 288 288 288 288
3.50 864 576 576 288 288 576 288
4.00 1,152 864 576 576 288 576 576
4.50 1,440 1,440 1,152 576 576 864 576
5.00 1,728 1,728 1,440 1,440 576 1,440 1,152
5.50 1,728 1,728 1,728 1,728 1,152 1,728 1,440
6.00 2,016 1,728 1,728 1,728 1,728 1,728 1,728
6.50 2,592 2,304 2,304 1,728 1,728 2,304 1,728
7.00 2,880 2,592 2,592 2,304 2,016 2,304 2,304
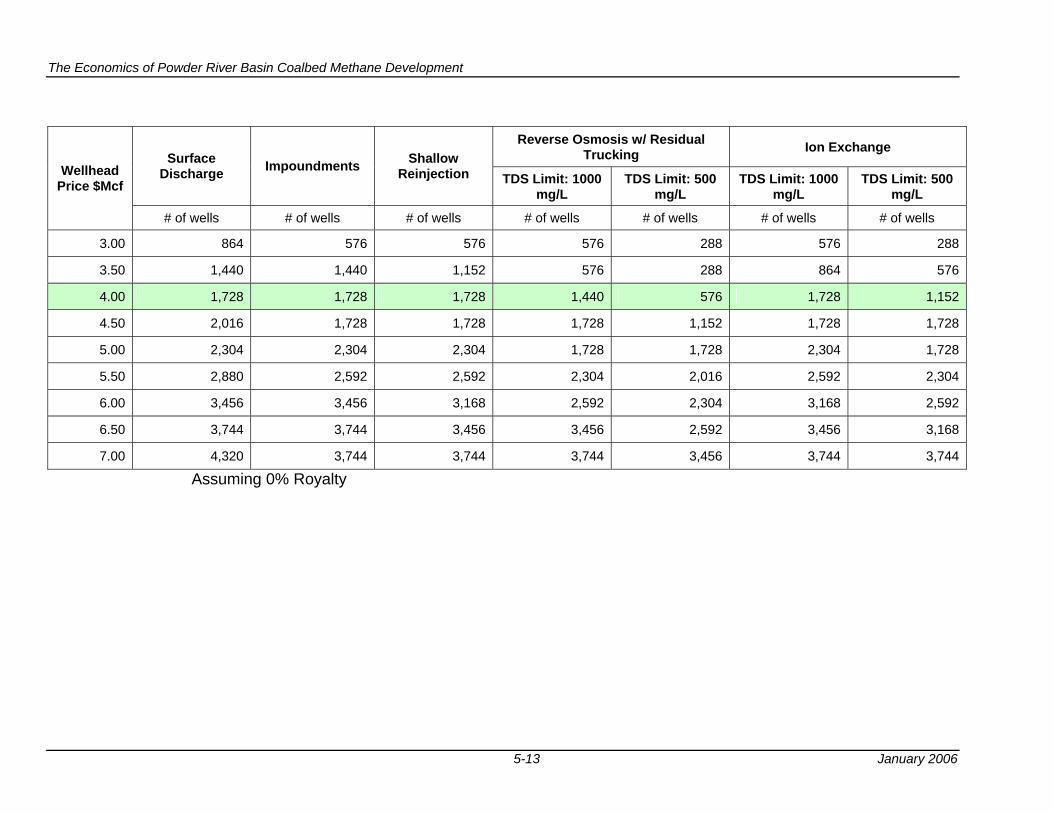
The Economics of Powder River Basin Coalbed Methane Development
5-13 January 2006
Assuming 0% Royalty
Reverse Osmosis w/ Residual Trucking Ion Exchange
Surface Discharge Impoundments Shallow
Reinjection TDS Limit: 1000 mg/L
TDS Limit: 500 mg/L
TDS Limit: 1000 mg/L
TDS Limit: 500 mg/L
Wellhead Price $Mcf
# of wells # of wells # of wells # of wells # of wells # of wells # of wells
3.00 864 576 576 576 288 576 288
3.50 1,440 1,440 1,152 576 288 864 576
4.00 1,728 1,728 1,728 1,440 576 1,728 1,152
4.50 2,016 1,728 1,728 1,728 1,152 1,728 1,728
5.00 2,304 2,304 2,304 1,728 1,728 2,304 1,728
5.50 2,880 2,592 2,592 2,304 2,016 2,592 2,304
6.00 3,456 3,456 3,168 2,592 2,304 3,168 2,592
6.50 3,744 3,744 3,456 3,456 2,592 3,456 3,168
7.00 4,320 3,744 3,744 3,744 3,456 3,744 3,744
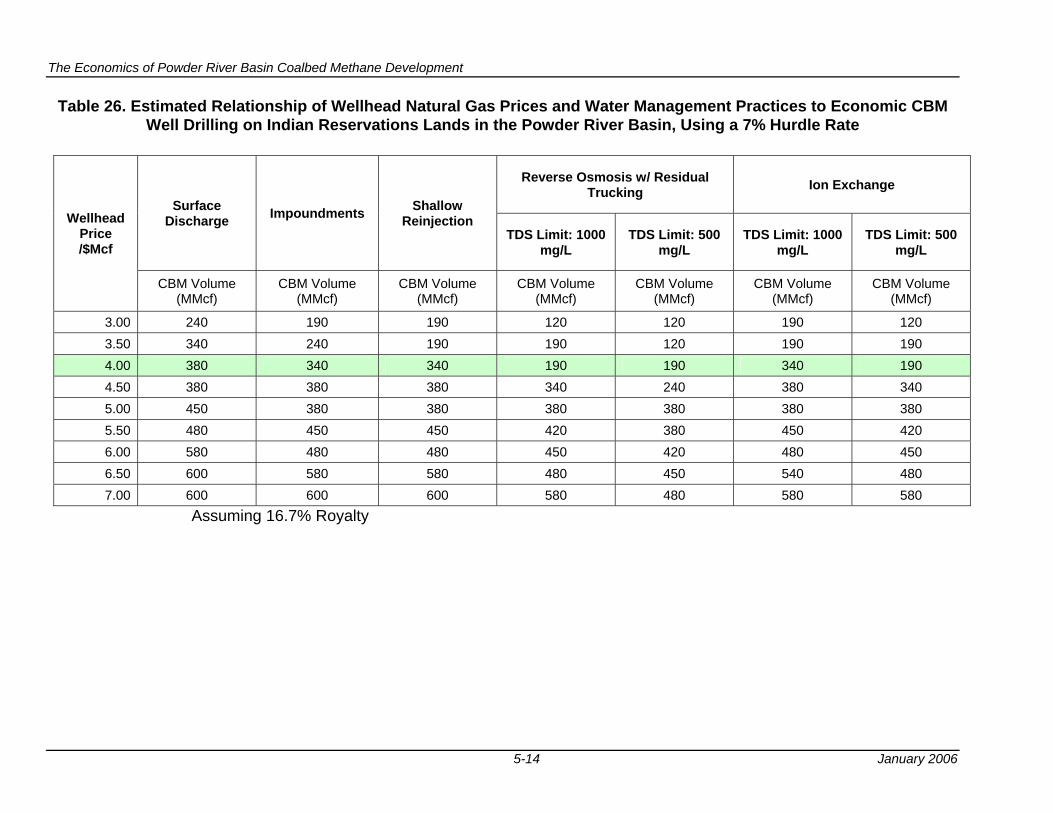
The Economics of Powder River Basin Coalbed Methane Development
5-14 January 2006
Table 26. Estimated Relationship of Wellhead Natural Gas Prices and Water Management Practices to Economic CBM Well Drilling on Indian Reservations Lands in the Powder River Basin, Using a 7% Hurdle Rate
Assuming 16.7% Royalty
Reverse Osmosis w/ Residual Trucking Ion Exchange
Surface Discharge Impoundments Shallow
Reinjection TDS Limit: 1000
mg/L TDS Limit: 500
mg/L TDS Limit: 1000
mg/L TDS Limit: 500
mg/L
Wellhead Price /$Mcf
CBM Volume (MMcf)
CBM Volume (MMcf)
CBM Volume (MMcf)
CBM Volume (MMcf)
CBM Volume (MMcf)
CBM Volume (MMcf)
CBM Volume (MMcf)
3.00 240 190 190 120 120 190 120 3.50 340 240 190 190 120 190 190 4.00 380 340 340 190 190 340 190 4.50 380 380 380 340 240 380 340 5.00 450 380 380 380 380 380 380 5.50 480 450 450 420 380 450 420 6.00 580 480 480 450 420 480 450 6.50 600 580 580 480 450 540 480 7.00 600 600 600 580 480 580 580
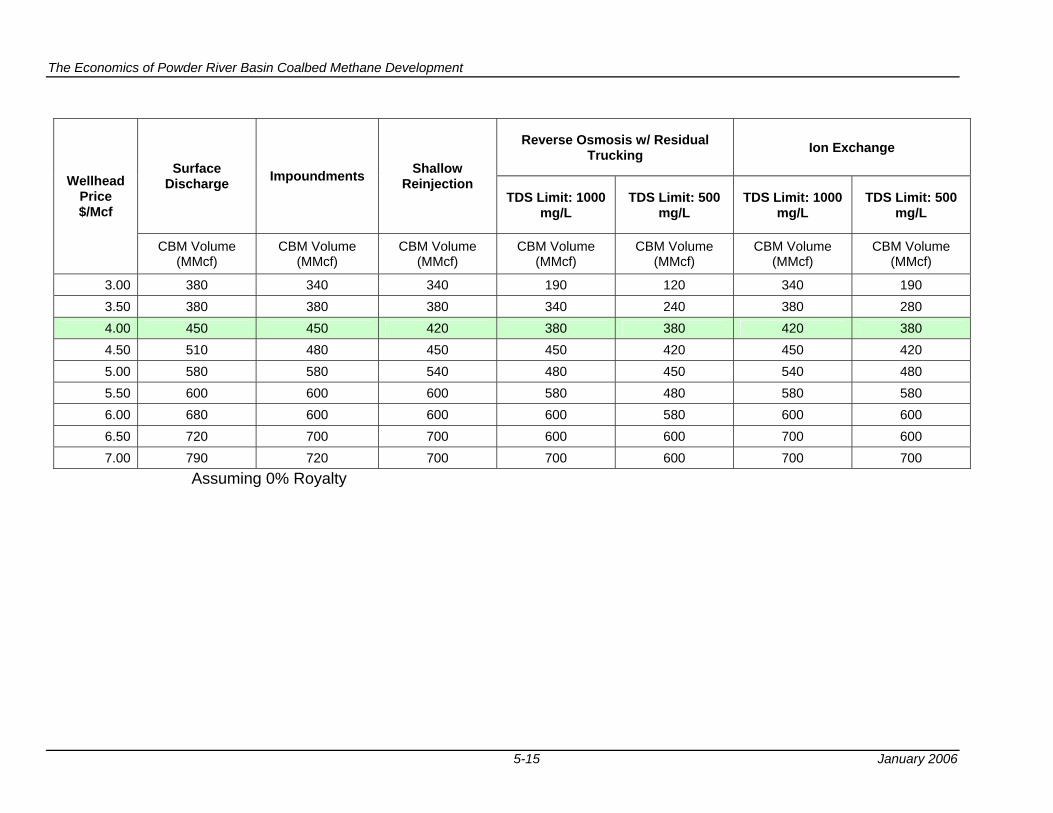
The Economics of Powder River Basin Coalbed Methane Development
5-15 January 2006
Assuming 0% Royalty
Reverse Osmosis w/ Residual Trucking Ion Exchange
Surface Discharge Impoundments Shallow
Reinjection TDS Limit: 1000
mg/L TDS Limit: 500
mg/L TDS Limit: 1000
mg/L TDS Limit: 500
mg/L
Wellhead Price $/Mcf
CBM Volume (MMcf)
CBM Volume (MMcf)
CBM Volume (MMcf)
CBM Volume (MMcf)
CBM Volume (MMcf)
CBM Volume (MMcf)
CBM Volume (MMcf)
3.00 380 340 340 190 120 340 190 3.50 380 380 380 340 240 380 280 4.00 450 450 420 380 380 420 380 4.50 510 480 450 450 420 450 420 5.00 580 580 540 480 450 540 480 5.50 600 600 600 580 480 580 580 6.00 680 600 600 600 580 600 600 6.50 720 700 700 600 600 700 600 7.00 790 720 700 700 600 700 700
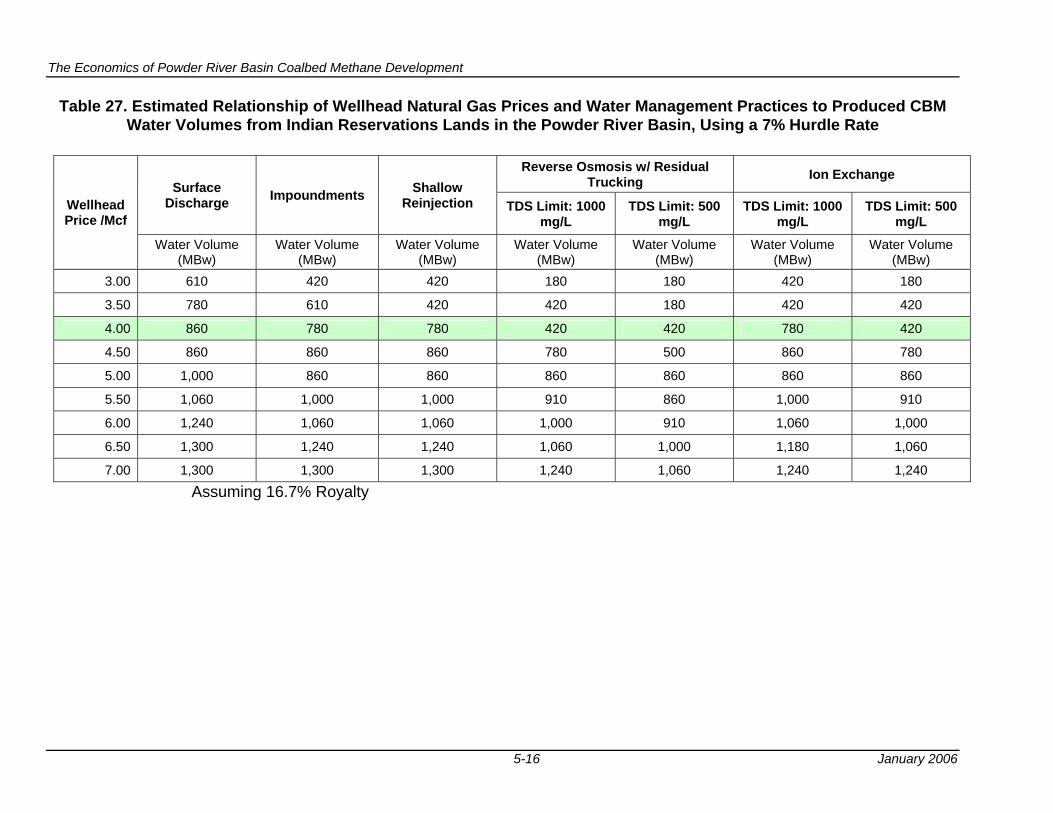
The Economics of Powder River Basin Coalbed Methane Development
5-16 January 2006
Table 27. Estimated Relationship of Wellhead Natural Gas Prices and Water Management Practices to Produced CBM Water Volumes from Indian Reservations Lands in the Powder River Basin, Using a 7% Hurdle Rate
Assuming 16.7% Royalty
Reverse Osmosis w/ Residual Trucking Ion Exchange
Surface Discharge Impoundments Shallow
Reinjection TDS Limit: 1000 mg/L
TDS Limit: 500 mg/L
TDS Limit: 1000 mg/L
TDS Limit: 500 mg/L
Wellhead Price /Mcf
Water Volume (MBw)
Water Volume (MBw)
Water Volume (MBw)
Water Volume (MBw)
Water Volume (MBw)
Water Volume (MBw)
Water Volume (MBw)
3.00 610 420 420 180 180 420 180
3.50 780 610 420 420 180 420 420
4.00 860 780 780 420 420 780 420
4.50 860 860 860 780 500 860 780
5.00 1,000 860 860 860 860 860 860
5.50 1,060 1,000 1,000 910 860 1,000 910
6.00 1,240 1,060 1,060 1,000 910 1,060 1,000
6.50 1,300 1,240 1,240 1,060 1,000 1,180 1,060
7.00 1,300 1,300 1,300 1,240 1,060 1,240 1,240
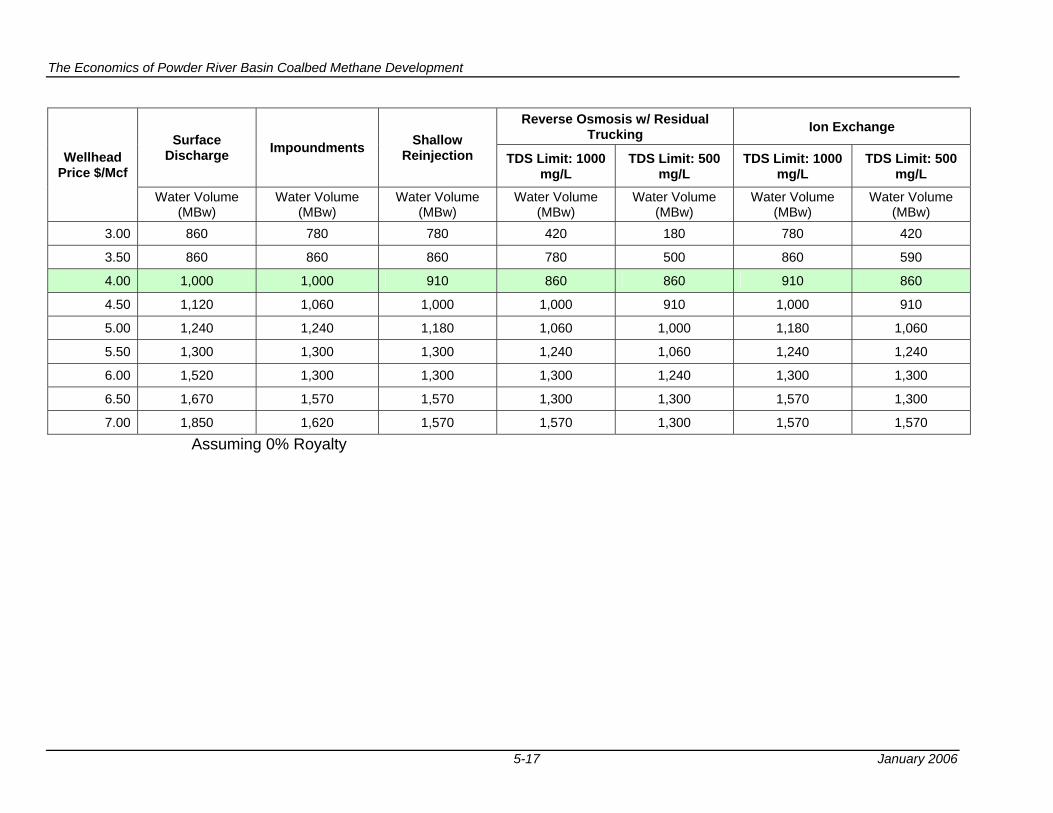
The Economics of Powder River Basin Coalbed Methane Development
5-17 January 2006
Assuming 0% Royalty
Reverse Osmosis w/ Residual Trucking Ion Exchange
Surface Discharge Impoundments Shallow
Reinjection TDS Limit: 1000 mg/L
TDS Limit: 500 mg/L
TDS Limit: 1000 mg/L
TDS Limit: 500 mg/L
Wellhead Price $/Mcf
Water Volume (MBw)
Water Volume (MBw)
Water Volume (MBw)
Water Volume (MBw)
Water Volume (MBw)
Water Volume (MBw)
Water Volume (MBw)
3.00 860 780 780 420 180 780 420
3.50 860 860 860 780 500 860 590
4.00 1,000 1,000 910 860 860 910 860
4.50 1,120 1,060 1,000 1,000 910 1,000 910
5.00 1,240 1,240 1,180 1,060 1,000 1,180 1,060
5.50 1,300 1,300 1,300 1,240 1,060 1,240 1,240
6.00 1,520 1,300 1,300 1,300 1,240 1,300 1,300
6.50 1,670 1,570 1,570 1,300 1,300 1,570 1,300
7.00 1,850 1,620 1,570 1,570 1,300 1,570 1,570
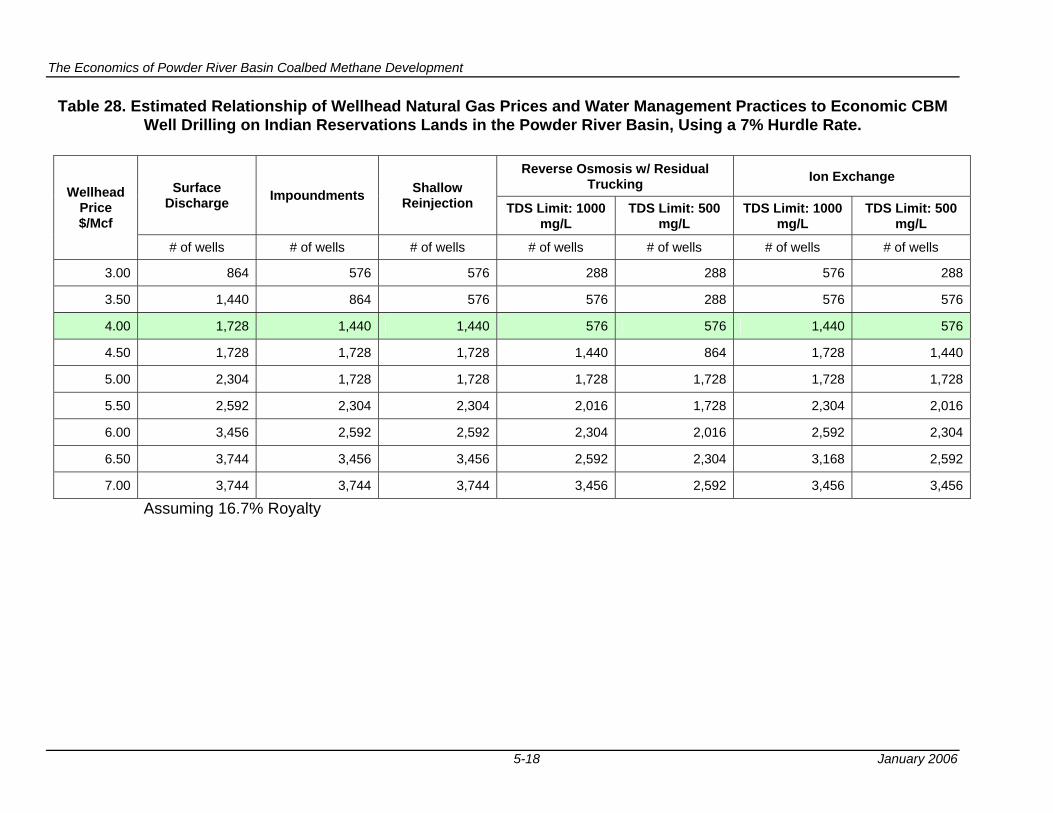
The Economics of Powder River Basin Coalbed Methane Development
5-18 January 2006
Table 28. Estimated Relationship of Wellhead Natural Gas Prices and Water Management Practices to Economic CBM Well Drilling on Indian Reservations Lands in the Powder River Basin, Using a 7% Hurdle Rate.
Assuming 16.7% Royalty
Reverse Osmosis w/ Residual Trucking Ion Exchange
Surface Discharge Impoundments Shallow
Reinjection TDS Limit: 1000 mg/L
TDS Limit: 500 mg/L
TDS Limit: 1000 mg/L
TDS Limit: 500 mg/L
Wellhead Price $/Mcf
# of wells # of wells # of wells # of wells # of wells # of wells # of wells
3.00 864 576 576 288 288 576 288
3.50 1,440 864 576 576 288 576 576
4.00 1,728 1,440 1,440 576 576 1,440 576
4.50 1,728 1,728 1,728 1,440 864 1,728 1,440
5.00 2,304 1,728 1,728 1,728 1,728 1,728 1,728
5.50 2,592 2,304 2,304 2,016 1,728 2,304 2,016
6.00 3,456 2,592 2,592 2,304 2,016 2,592 2,304
6.50 3,744 3,456 3,456 2,592 2,304 3,168 2,592
7.00 3,744 3,744 3,744 3,456 2,592 3,456 3,456
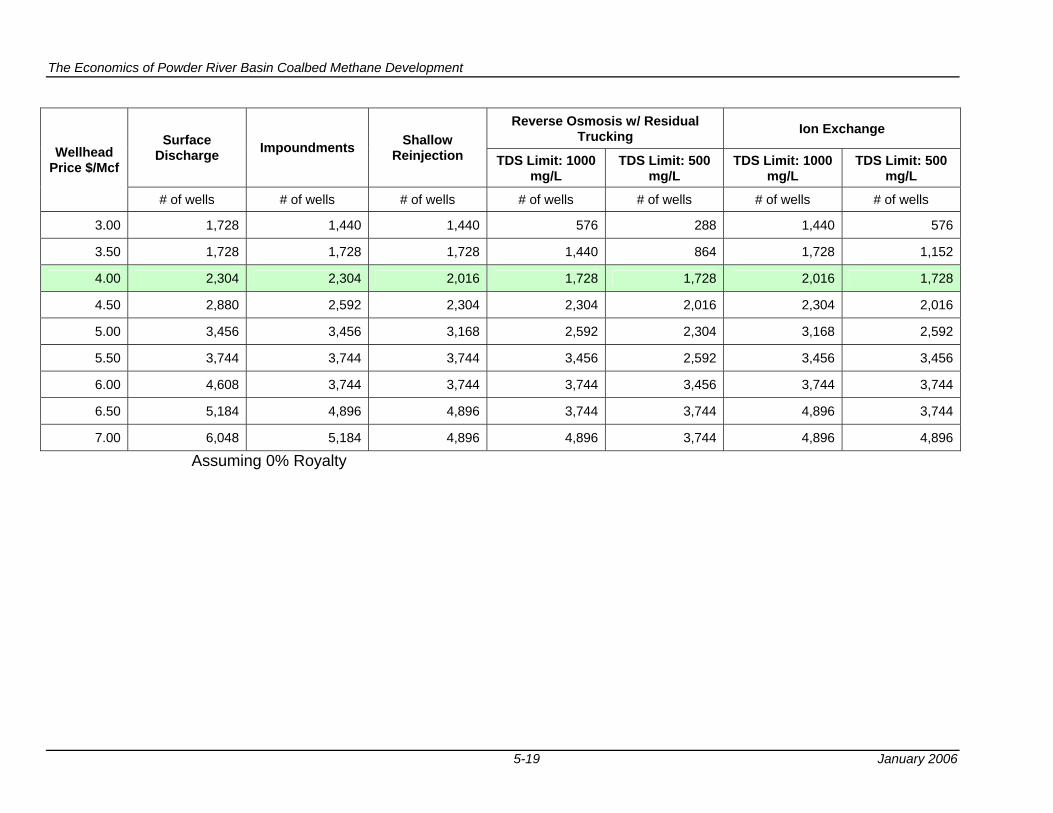
The Economics of Powder River Basin Coalbed Methane Development
5-19 January 2006
Assuming 0% Royalty
Reverse Osmosis w/ Residual Trucking Ion Exchange
Surface Discharge Impoundments Shallow
Reinjection TDS Limit: 1000 mg/L
TDS Limit: 500 mg/L
TDS Limit: 1000 mg/L
TDS Limit: 500 mg/L
Wellhead Price $/Mcf
# of wells # of wells # of wells # of wells # of wells # of wells # of wells
3.00 1,728 1,440 1,440 576 288 1,440 576
3.50 1,728 1,728 1,728 1,440 864 1,728 1,152
4.00 2,304 2,304 2,016 1,728 1,728 2,016 1,728
4.50 2,880 2,592 2,304 2,304 2,016 2,304 2,016
5.00 3,456 3,456 3,168 2,592 2,304 3,168 2,592
5.50 3,744 3,744 3,744 3,456 2,592 3,456 3,456
6.00 4,608 3,744 3,744 3,744 3,456 3,744 3,744
6.50 5,184 4,896 4,896 3,744 3,744 4,896 3,744
7.00 6,048 5,184 4,896 4,896 3,744 4,896 4,896
APPENDIX A
COST–PRICE RELATIONSHIPS FOR POWDER RIVER BASIN COALBED
METHANE DEVELOPMENT
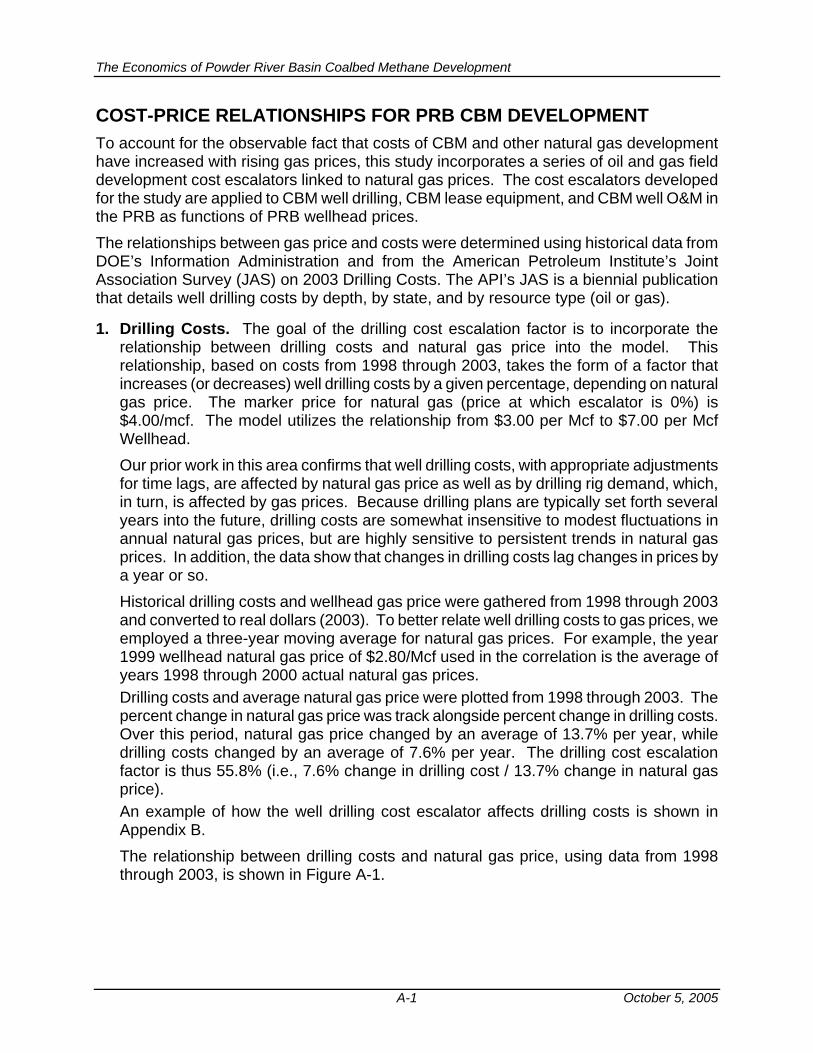
The Economics of Powder River Basin Coalbed Methane Development
A-1 October 5, 2005
COST-PRICE RELATIONSHIPS FOR PRB CBM DEVELOPMENT To account for the observable fact that costs of CBM and other natural gas development have increased with rising gas prices, this study incorporates a series of oil and gas field development cost escalators linked to natural gas prices. The cost escalators developed for the study are applied to CBM well drilling, CBM lease equipment, and CBM well O&M in the PRB as functions of PRB wellhead prices. The relationships between gas price and costs were determined using historical data from DOE’s Information Administration and from the American Petroleum Institute’s Joint Association Survey (JAS) on 2003 Drilling Costs. The API’s JAS is a biennial publication that details well drilling costs by depth, by state, and by resource type (oil or gas).
1. Drilling Costs. The goal of the drilling cost escalation factor is to incorporate the relationship between drilling costs and natural gas price into the model. This relationship, based on costs from 1998 through 2003, takes the form of a factor that increases (or decreases) well drilling costs by a given percentage, depending on natural gas price. The marker price for natural gas (price at which escalator is 0%) is $4.00/mcf. The model utilizes the relationship from $3.00 per Mcf to $7.00 per Mcf Wellhead. Our prior work in this area confirms that well drilling costs, with appropriate adjustments for time lags, are affected by natural gas price as well as by drilling rig demand, which, in turn, is affected by gas prices. Because drilling plans are typically set forth several years into the future, drilling costs are somewhat insensitive to modest fluctuations in annual natural gas prices, but are highly sensitive to persistent trends in natural gas prices. In addition, the data show that changes in drilling costs lag changes in prices by a year or so. Historical drilling costs and wellhead gas price were gathered from 1998 through 2003 and converted to real dollars (2003). To better relate well drilling costs to gas prices, we employed a three-year moving average for natural gas prices. For example, the year 1999 wellhead natural gas price of $2.80/Mcf used in the correlation is the average of years 1998 through 2000 actual natural gas prices. Drilling costs and average natural gas price were plotted from 1998 through 2003. The percent change in natural gas price was track alongside percent change in drilling costs. Over this period, natural gas price changed by an average of 13.7% per year, while drilling costs changed by an average of 7.6% per year. The drilling cost escalation factor is thus 55.8% (i.e., 7.6% change in drilling cost / 13.7% change in natural gas price). An example of how the well drilling cost escalator affects drilling costs is shown in Appendix B. The relationship between drilling costs and natural gas price, using data from 1998 through 2003, is shown in Figure A-1.
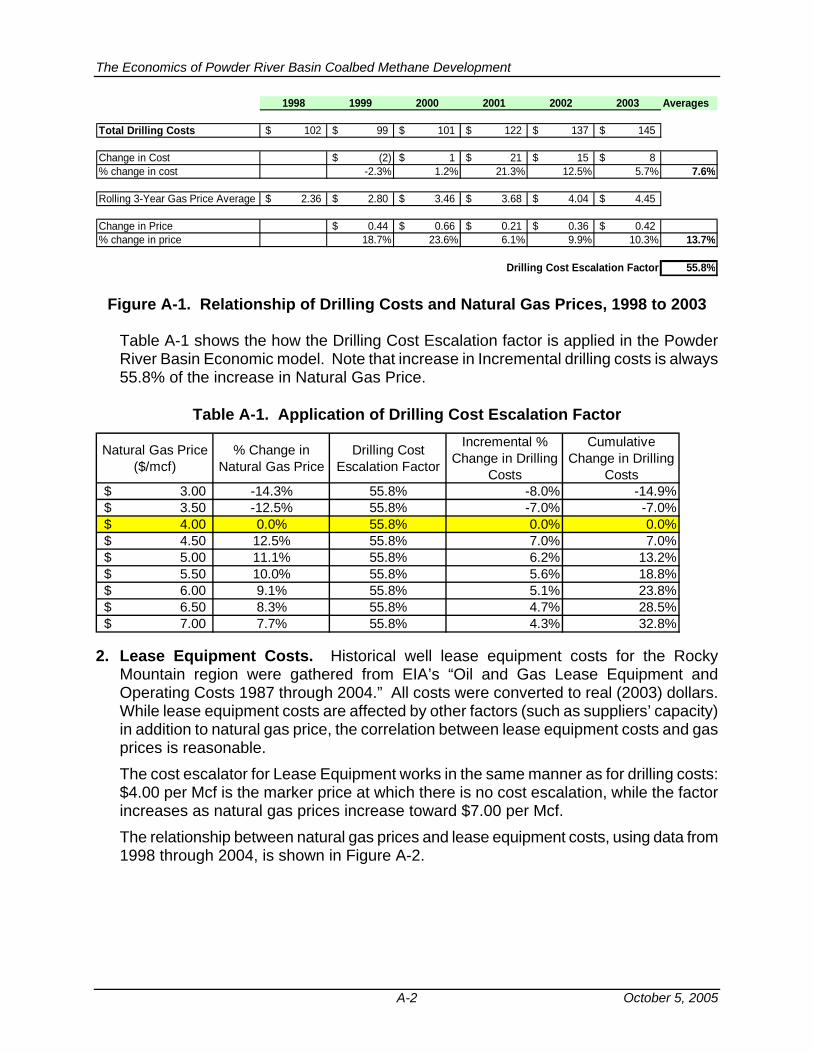
The Economics of Powder River Basin Coalbed Methane Development
A-2 October 5, 2005
1998 1999 2000 2001 2002 2003 Averages
Total Drilling Costs 102$ 99$ 101$ 122$ 137$ 145$
Change in Cost (2)$ 1$ 21$ 15$ 8$ % change in cost -2.3% 1.2% 21.3% 12.5% 5.7% 7.6%
Rolling 3-Year Gas Price Average 2.36$ 2.80$ 3.46$ 3.68$ 4.04$ 4.45$
Change in Price 0.44$ 0.66$ 0.21$ 0.36$ 0.42$ % change in price 18.7% 23.6% 6.1% 9.9% 10.3% 13.7%
Drilling Cost Escalation Factor 55.8%
Figure A-1. Relationship of Drilling Costs and Natural Gas Prices, 1998 to 2003
Table A-1 shows the how the Drilling Cost Escalation factor is applied in the Powder River Basin Economic model. Note that increase in Incremental drilling costs is always 55.8% of the increase in Natural Gas Price.
Table A-1. Application of Drilling Cost Escalation Factor
Natural Gas Price ($/mcf)
% Change in Natural Gas Price
Drilling Cost Escalation Factor
Incremental % Change in Drilling
Costs
Cumulative Change in Drilling
Costs3.00$ -14.3% 55.8% -8.0% -14.9%3.50$ -12.5% 55.8% -7.0% -7.0%4.00$ 0.0% 55.8% 0.0% 0.0%4.50$ 12.5% 55.8% 7.0% 7.0%5.00$ 11.1% 55.8% 6.2% 13.2%5.50$ 10.0% 55.8% 5.6% 18.8%6.00$ 9.1% 55.8% 5.1% 23.8%6.50$ 8.3% 55.8% 4.7% 28.5%7.00$ 7.7% 55.8% 4.3% 32.8%
2. Lease Equipment Costs. Historical well lease equipment costs for the Rocky Mountain region were gathered from EIA’s “Oil and Gas Lease Equipment and Operating Costs 1987 through 2004.” All costs were converted to real (2003) dollars. While lease equipment costs are affected by other factors (such as suppliers’ capacity) in addition to natural gas price, the correlation between lease equipment costs and gas prices is reasonable. The cost escalator for Lease Equipment works in the same manner as for drilling costs: $4.00 per Mcf is the marker price at which there is no cost escalation, while the factor increases as natural gas prices increase toward $7.00 per Mcf. The relationship between natural gas prices and lease equipment costs, using data from 1998 through 2004, is shown in Figure A-2.
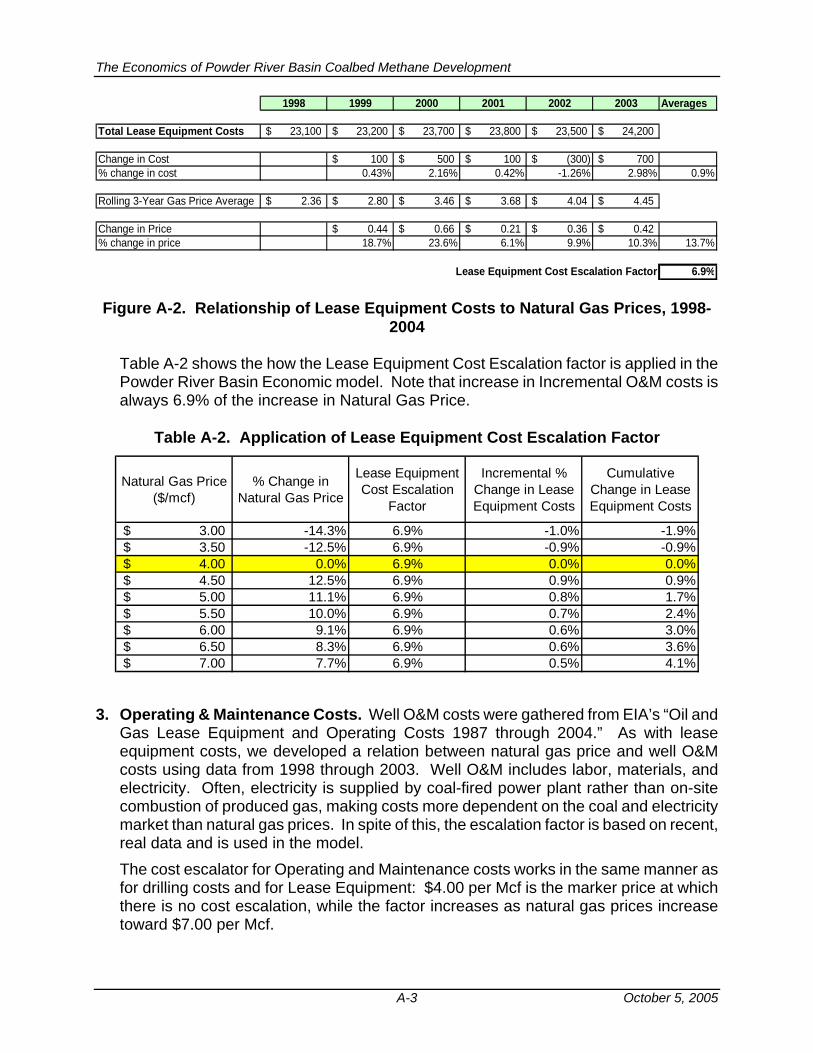
The Economics of Powder River Basin Coalbed Methane Development
A-3 October 5, 2005
1998 1999 2000 2001 2002 2003 Averages
Total Lease Equipment Costs 23,100$ 23,200$ 23,700$ 23,800$ 23,500$ 24,200$
Change in Cost 100$ 500$ 100$ (300)$ 700$ % change in cost 0.43% 2.16% 0.42% -1.26% 2.98% 0.9%
Rolling 3-Year Gas Price Average 2.36$ 2.80$ 3.46$ 3.68$ 4.04$ 4.45$
Change in Price 0.44$ 0.66$ 0.21$ 0.36$ 0.42$ % change in price 18.7% 23.6% 6.1% 9.9% 10.3% 13.7%
Lease Equipment Cost Escalation Factor 6.9%
Figure A-2. Relationship of Lease Equipment Costs to Natural Gas Prices, 1998-2004
Table A-2 shows the how the Lease Equipment Cost Escalation factor is applied in the Powder River Basin Economic model. Note that increase in Incremental O&M costs is always 6.9% of the increase in Natural Gas Price.
Table A-2. Application of Lease Equipment Cost Escalation Factor
Natural Gas Price ($/mcf)
% Change in Natural Gas Price
Lease Equipment Cost Escalation
Factor
Incremental % Change in Lease Equipment Costs
Cumulative Change in Lease Equipment Costs
3.00$ -14.3% 6.9% -1.0% -1.9%3.50$ -12.5% 6.9% -0.9% -0.9%4.00$ 0.0% 6.9% 0.0% 0.0%4.50$ 12.5% 6.9% 0.9% 0.9%5.00$ 11.1% 6.9% 0.8% 1.7%5.50$ 10.0% 6.9% 0.7% 2.4%6.00$ 9.1% 6.9% 0.6% 3.0%6.50$ 8.3% 6.9% 0.6% 3.6%7.00$ 7.7% 6.9% 0.5% 4.1%
3. Operating & Maintenance Costs. Well O&M costs were gathered from EIA’s “Oil and Gas Lease Equipment and Operating Costs 1987 through 2004.” As with lease equipment costs, we developed a relation between natural gas price and well O&M costs using data from 1998 through 2003. Well O&M includes labor, materials, and electricity. Often, electricity is supplied by coal-fired power plant rather than on-site combustion of produced gas, making costs more dependent on the coal and electricity market than natural gas prices. In spite of this, the escalation factor is based on recent, real data and is used in the model. The cost escalator for Operating and Maintenance costs works in the same manner as for drilling costs and for Lease Equipment: $4.00 per Mcf is the marker price at which there is no cost escalation, while the factor increases as natural gas prices increase toward $7.00 per Mcf.
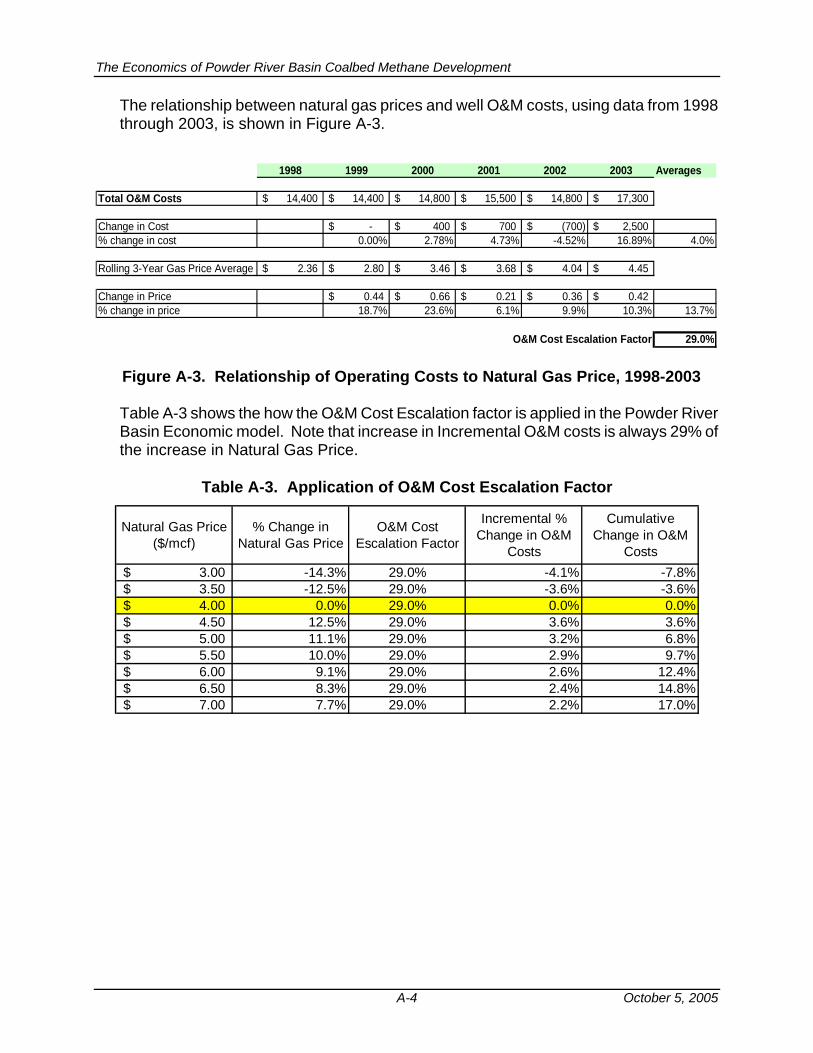
The Economics of Powder River Basin Coalbed Methane Development
A-4 October 5, 2005
The relationship between natural gas prices and well O&M costs, using data from 1998 through 2003, is shown in Figure A-3.
1998 1999 2000 2001 2002 2003 Averages
Total O&M Costs 14,400$ 14,400$ 14,800$ 15,500$ 14,800$ 17,300$
Change in Cost -$ 400$ 700$ (700)$ 2,500$ % change in cost 0.00% 2.78% 4.73% -4.52% 16.89% 4.0%
Rolling 3-Year Gas Price Average 2.36$ 2.80$ 3.46$ 3.68$ 4.04$ 4.45$
Change in Price 0.44$ 0.66$ 0.21$ 0.36$ 0.42$ % change in price 18.7% 23.6% 6.1% 9.9% 10.3% 13.7%
O&M Cost Escalation Factor 29.0%
Figure A-3. Relationship of Operating Costs to Natural Gas Price, 1998-2003
Table A-3 shows the how the O&M Cost Escalation factor is applied in the Powder River Basin Economic model. Note that increase in Incremental O&M costs is always 29% of the increase in Natural Gas Price.
Table A-3. Application of O&M Cost Escalation Factor
Natural Gas Price ($/mcf)
% Change in Natural Gas Price
O&M Cost Escalation Factor
Incremental % Change in O&M
Costs
Cumulative Change in O&M
Costs3.00$ -14.3% 29.0% -4.1% -7.8%3.50$ -12.5% 29.0% -3.6% -3.6%4.00$ 0.0% 29.0% 0.0% 0.0%4.50$ 12.5% 29.0% 3.6% 3.6%5.00$ 11.1% 29.0% 3.2% 6.8%5.50$ 10.0% 29.0% 2.9% 9.7%6.00$ 9.1% 29.0% 2.6% 12.4%6.50$ 8.3% 29.0% 2.4% 14.8%7.00$ 7.7% 29.0% 2.2% 17.0%
APPENDIX B
SUMMARY OF WELL DRILLING AND INFRASTRUCTURE COSTS
The Economics of Powder River Basin Coalbed Methane Development
B-1 January 2006
SUMMARY OF WELL DRILLING AND INFRASTRUCTURE COSTS
I. CBM CAPITAL COSTS A. Well Drilling and Completion
1. Land Costs and Permits. Regular land and permit costs for the CBM development in the Powder River Basin include the following: • Mineral lease purchase and maintenance • WOGCC hearing, division orders, and permits • DEQ, State Engineer Office and BLM permits The costs for water disposal permits are included later The cost for a mineral lease is $200 per acre. The costs for regular permitting and studies are $7,000 for an 80-acre well pad. For a federal lease, additional costs are required for NEPA and other permitting studies, estimated to cost an additional $14,000 for an 80-acre well pad. For purposes of this study we will assume that approximately one-half of the leases are federal. This would add $7,000 to the cost of an average permit. The total land and permit costs for an 80-acre well pad are estimated at $30,000. With two wells per pad, the cost per CBM well is $15,000.
2. Well Drilling and Completion. Well drilling and completion costs are governed primarily by well depth, assuming single zone coal seam completions. The intangible (expensed) and tangible (capitalized) drilling and completion costs for two representative PRB CBM wells, one at 500 feet and one at 950 feet, are provided below:
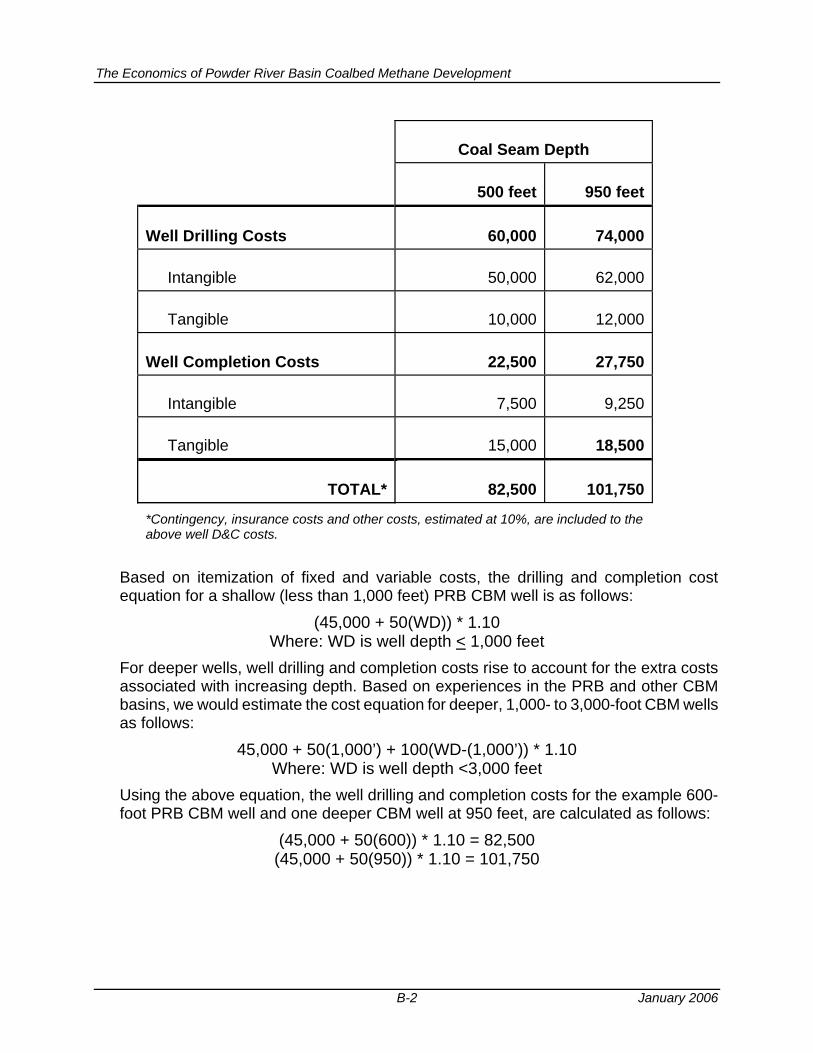
The Economics of Powder River Basin Coalbed Methane Development
B-2 January 2006
Coal Seam Depth
500 feet
950 feet
Well Drilling Costs 60,000 74,000
Intangible 50,000 62,000
Tangible 10,000 12,000 Well Completion Costs 22,500 27,750
Intangible 7,500 9,250
Tangible 15,000 18,500
TOTAL* 82,500 101,750
*Contingency, insurance costs and other costs, estimated at 10%, are included to the above well D&C costs.
Based on itemization of fixed and variable costs, the drilling and completion cost equation for a shallow (less than 1,000 feet) PRB CBM well is as follows:
(45,000 + 50(WD)) * 1.10 Where: WD is well depth < 1,000 feet
For deeper wells, well drilling and completion costs rise to account for the extra costs associated with increasing depth. Based on experiences in the PRB and other CBM basins, we would estimate the cost equation for deeper, 1,000- to 3,000-foot CBM wells as follows:
45,000 + 50(1,000’) + 100(WD-(1,000’)) * 1.10 Where: WD is well depth <3,000 feet
Using the above equation, the well drilling and completion costs for the example 600-foot PRB CBM well and one deeper CBM well at 950 feet, are calculated as follows:
(45,000 + 50(600)) * 1.10 = 82,500 (45,000 + 50(950)) * 1.10 = 101,750
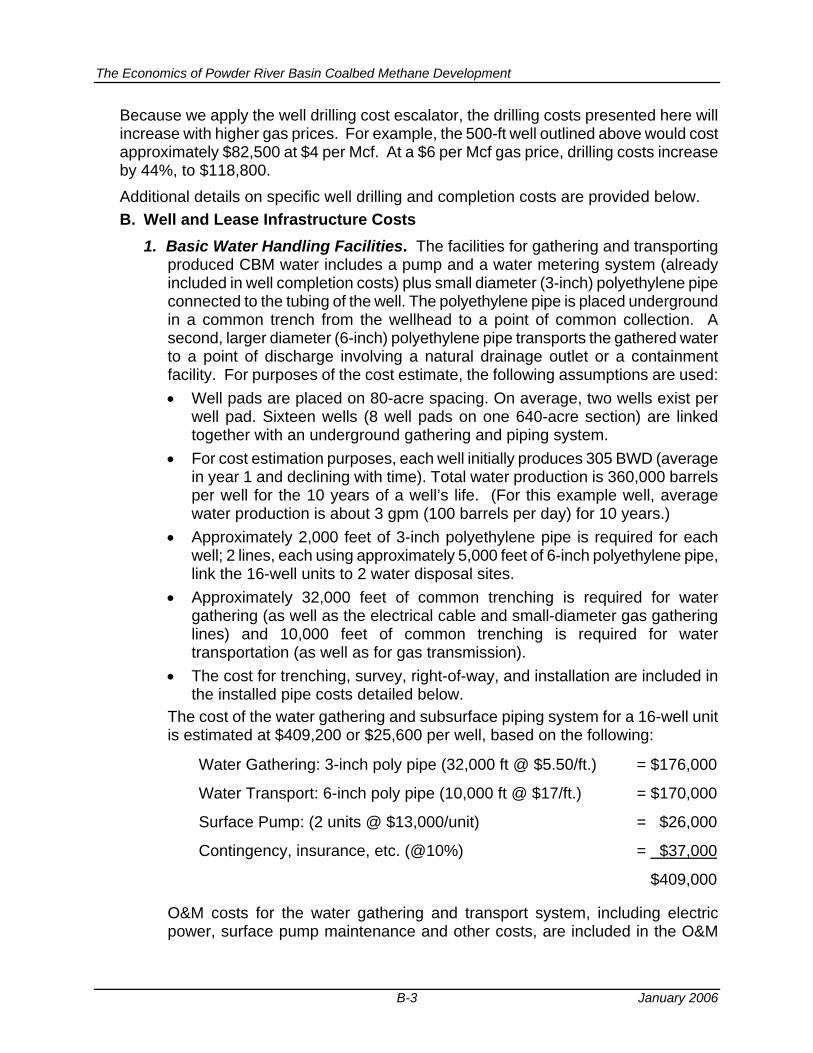
The Economics of Powder River Basin Coalbed Methane Development
B-3 January 2006
Because we apply the well drilling cost escalator, the drilling costs presented here will increase with higher gas prices. For example, the 500-ft well outlined above would cost approximately $82,500 at $4 per Mcf. At a $6 per Mcf gas price, drilling costs increase by 44%, to $118,800. Additional details on specific well drilling and completion costs are provided below. B. Well and Lease Infrastructure Costs
1. Basic Water Handling Facilities. The facilities for gathering and transporting produced CBM water includes a pump and a water metering system (already included in well completion costs) plus small diameter (3-inch) polyethylene pipe connected to the tubing of the well. The polyethylene pipe is placed underground in a common trench from the wellhead to a point of common collection. A second, larger diameter (6-inch) polyethylene pipe transports the gathered water to a point of discharge involving a natural drainage outlet or a containment facility. For purposes of the cost estimate, the following assumptions are used: • Well pads are placed on 80-acre spacing. On average, two wells exist per
well pad. Sixteen wells (8 well pads on one 640-acre section) are linked together with an underground gathering and piping system.
• For cost estimation purposes, each well initially produces 305 BWD (average in year 1 and declining with time). Total water production is 360,000 barrels per well for the 10 years of a well’s life. (For this example well, average water production is about 3 gpm (100 barrels per day) for 10 years.)
• Approximately 2,000 feet of 3-inch polyethylene pipe is required for each well; 2 lines, each using approximately 5,000 feet of 6-inch polyethylene pipe, link the 16-well units to 2 water disposal sites.
• Approximately 32,000 feet of common trenching is required for water gathering (as well as the electrical cable and small-diameter gas gathering lines) and 10,000 feet of common trenching is required for water transportation (as well as for gas transmission).
• The cost for trenching, survey, right-of-way, and installation are included in the installed pipe costs detailed below.
The cost of the water gathering and subsurface piping system for a 16-well unit is estimated at $409,200 or $25,600 per well, based on the following:
Water Gathering: 3-inch poly pipe (32,000 ft @ $5.50/ft.) = $176,000
Water Transport: 6-inch poly pipe (10,000 ft @ $17/ft.) = $170,000
Surface Pump: (2 units @ $13,000/unit) = $26,000
Contingency, insurance, etc. (@10%) = $37,000
$409,000
O&M costs for the water gathering and transport system, including electric power, surface pump maintenance and other costs, are included in the O&M
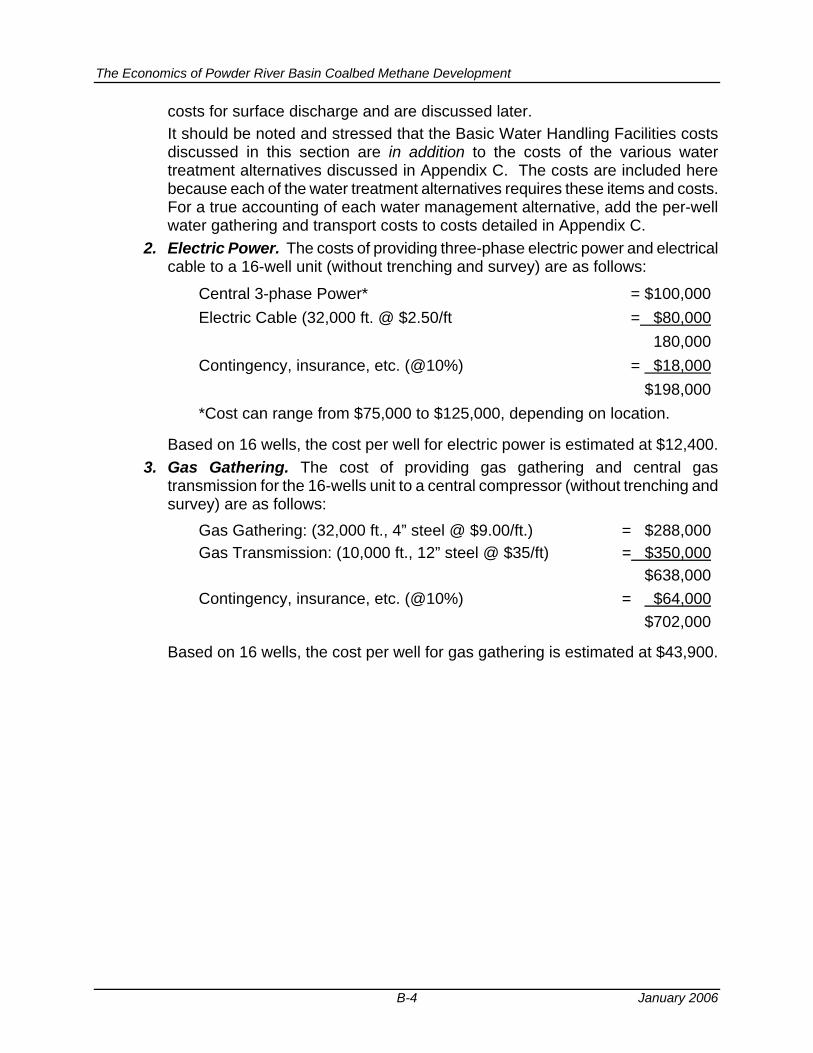
The Economics of Powder River Basin Coalbed Methane Development
B-4 January 2006
costs for surface discharge and are discussed later. It should be noted and stressed that the Basic Water Handling Facilities costs discussed in this section are in addition to the costs of the various water treatment alternatives discussed in Appendix C. The costs are included here because each of the water treatment alternatives requires these items and costs. For a true accounting of each water management alternative, add the per-well water gathering and transport costs to costs detailed in Appendix C.
2. Electric Power. The costs of providing three-phase electric power and electrical cable to a 16-well unit (without trenching and survey) are as follows:
Central 3-phase Power* = $100,000Electric Cable (32,000 ft. @ $2.50/ft = $80,000 180,000Contingency, insurance, etc. (@10%) = $18,000 $198,000*Cost can range from $75,000 to $125,000, depending on location.
Based on 16 wells, the cost per well for electric power is estimated at $12,400. 3. Gas Gathering. The cost of providing gas gathering and central gas
transmission for the 16-wells unit to a central compressor (without trenching and survey) are as follows:
Gas Gathering: (32,000 ft., 4” steel @ $9.00/ft.) = $288,000Gas Transmission: (10,000 ft., 12” steel @ $35/ft) = $350,000 $638,000Contingency, insurance, etc. (@10%) = $64,000 $702,000
Based on 16 wells, the cost per well for gas gathering is estimated at $43,900.
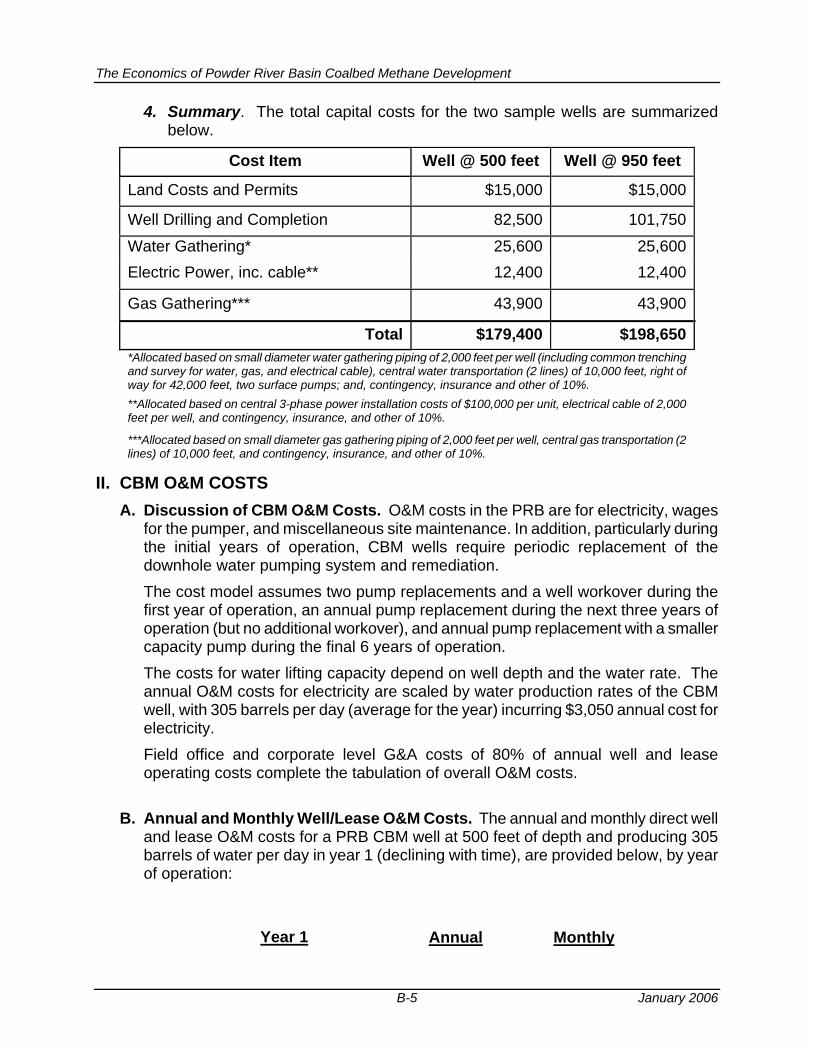
The Economics of Powder River Basin Coalbed Methane Development
B-5 January 2006
4. Summary. The total capital costs for the two sample wells are summarized below.
Cost Item Well @ 500 feet Well @ 950 feet
Land Costs and Permits $15,000 $15,000
Well Drilling and Completion 82,500 101,750
Water Gathering* 25,600 25,600Electric Power, inc. cable** 12,400 12,400
Gas Gathering*** 43,900 43,900
Total $179,400 $198,650*Allocated based on small diameter water gathering piping of 2,000 feet per well (including common trenching and survey for water, gas, and electrical cable), central water transportation (2 lines) of 10,000 feet, right of way for 42,000 feet, two surface pumps; and, contingency, insurance and other of 10%. **Allocated based on central 3-phase power installation costs of $100,000 per unit, electrical cable of 2,000 feet per well, and contingency, insurance, and other of 10%.
***Allocated based on small diameter gas gathering piping of 2,000 feet per well, central gas transportation (2 lines) of 10,000 feet, and contingency, insurance, and other of 10%.
II. CBM O&M COSTS A. Discussion of CBM O&M Costs. O&M costs in the PRB are for electricity, wages
for the pumper, and miscellaneous site maintenance. In addition, particularly during the initial years of operation, CBM wells require periodic replacement of the downhole water pumping system and remediation. The cost model assumes two pump replacements and a well workover during the first year of operation, an annual pump replacement during the next three years of operation (but no additional workover), and annual pump replacement with a smaller capacity pump during the final 6 years of operation. The costs for water lifting capacity depend on well depth and the water rate. The annual O&M costs for electricity are scaled by water production rates of the CBM well, with 305 barrels per day (average for the year) incurring $3,050 annual cost for electricity. Field office and corporate level G&A costs of 80% of annual well and lease operating costs complete the tabulation of overall O&M costs.
B. Annual and Monthly Well/Lease O&M Costs. The annual and monthly direct well
and lease O&M costs for a PRB CBM well at 500 feet of depth and producing 305 barrels of water per day in year 1 (declining with time), are provided below, by year of operation:
Year 1
Annual
Monthly
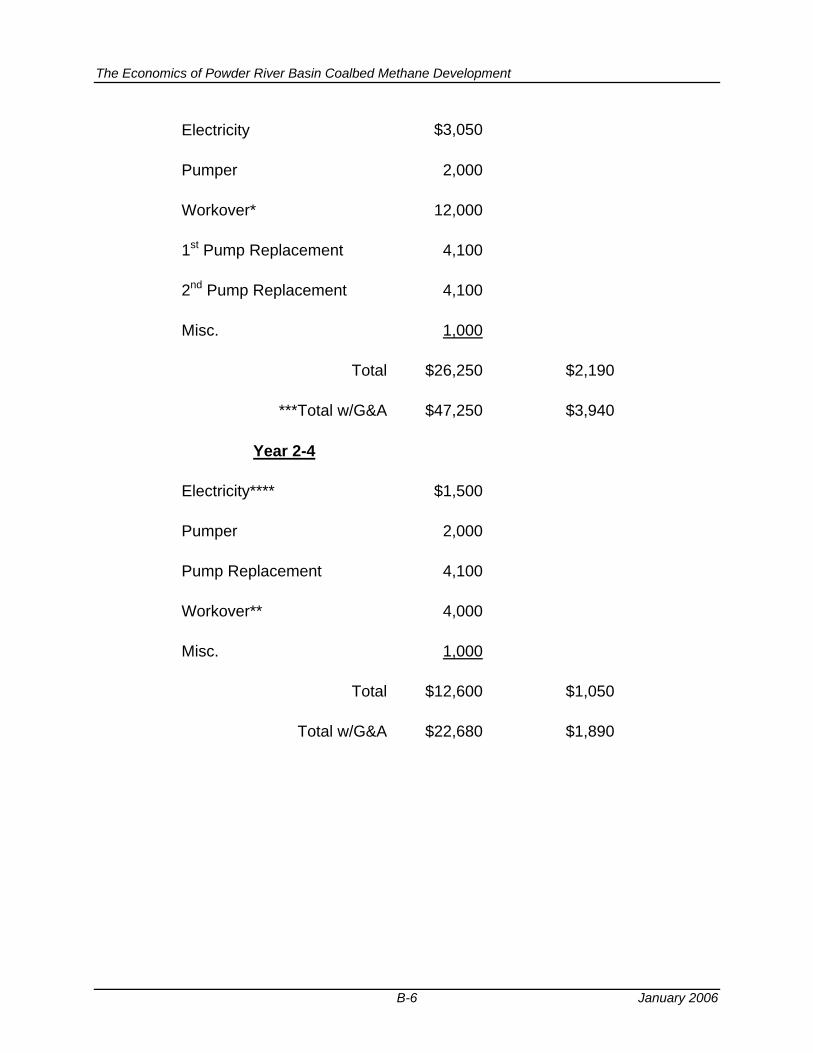
The Economics of Powder River Basin Coalbed Methane Development
B-6 January 2006
Electricity
$3,050
Pumper
2,000
Workover*
12,000
1st Pump Replacement
4,100
2nd Pump Replacement
4,100
Misc.
1,000
Total
$26,250
$2,190
***Total w/G&A
$47,250
$3,940
Year 2-4
Electricity****
$1,500
Pumper
2,000
Pump Replacement
4,100
Workover**
4,000
Misc.
1,000
Total
$12,600
$1,050
Total w/G&A
$22,680
$1,890
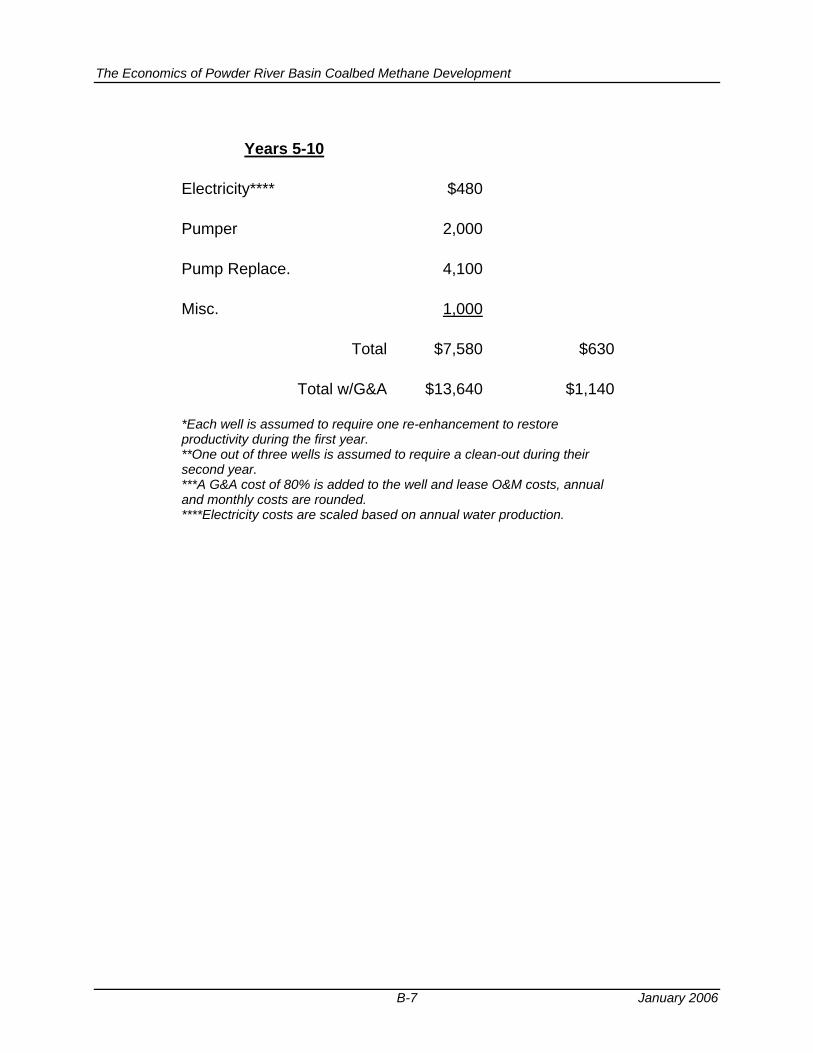
The Economics of Powder River Basin Coalbed Methane Development
B-7 January 2006
Years 5-10
Electricity****
$480
Pumper
2,000
Pump Replace.
4,100
Misc.
1,000
Total
$7,580
$630
Total w/G&A
$13,640
$1,140
*Each well is assumed to require one re-enhancement to restore productivity during the first year. **One out of three wells is assumed to require a clean-out during their second year. ***A G&A cost of 80% is added to the well and lease O&M costs, annual and monthly costs are rounded. ****Electricity costs are scaled based on annual water production.
APPENDIX C
SUMMARY OF WATER MANAGEMENT PRACTICES AND COSTS
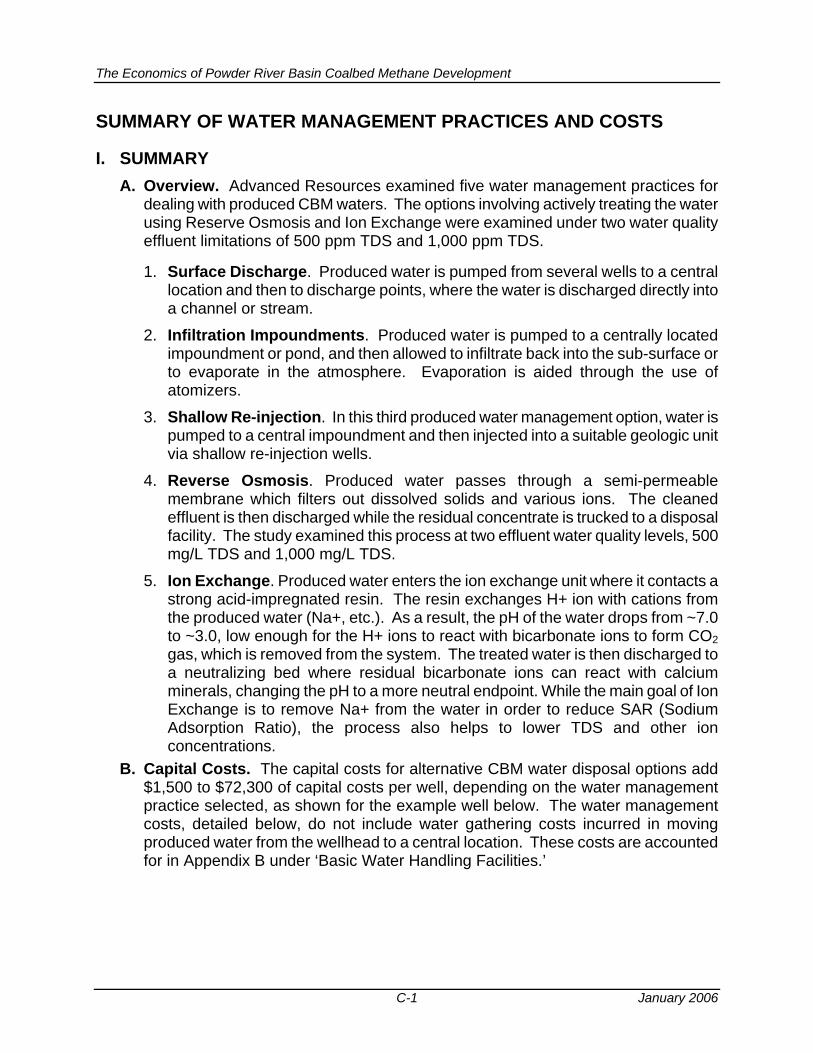
The Economics of Powder River Basin Coalbed Methane Development
C-1 January 2006
SUMMARY OF WATER MANAGEMENT PRACTICES AND COSTS
I. SUMMARY A. Overview. Advanced Resources examined five water management practices for
dealing with produced CBM waters. The options involving actively treating the water using Reserve Osmosis and Ion Exchange were examined under two water quality effluent limitations of 500 ppm TDS and 1,000 ppm TDS.
1. Surface Discharge. Produced water is pumped from several wells to a central location and then to discharge points, where the water is discharged directly into a channel or stream.
2. Infiltration Impoundments. Produced water is pumped to a centrally located impoundment or pond, and then allowed to infiltrate back into the sub-surface or to evaporate in the atmosphere. Evaporation is aided through the use of atomizers.
3. Shallow Re-injection. In this third produced water management option, water is pumped to a central impoundment and then injected into a suitable geologic unit via shallow re-injection wells.
4. Reverse Osmosis. Produced water passes through a semi-permeable membrane which filters out dissolved solids and various ions. The cleaned effluent is then discharged while the residual concentrate is trucked to a disposal facility. The study examined this process at two effluent water quality levels, 500 mg/L TDS and 1,000 mg/L TDS.
5. Ion Exchange. Produced water enters the ion exchange unit where it contacts a strong acid-impregnated resin. The resin exchanges H+ ion with cations from the produced water (Na+, etc.). As a result, the pH of the water drops from ~7.0 to ~3.0, low enough for the H+ ions to react with bicarbonate ions to form CO2 gas, which is removed from the system. The treated water is then discharged to a neutralizing bed where residual bicarbonate ions can react with calcium minerals, changing the pH to a more neutral endpoint. While the main goal of Ion Exchange is to remove Na+ from the water in order to reduce SAR (Sodium Adsorption Ratio), the process also helps to lower TDS and other ion concentrations.
B. Capital Costs. The capital costs for alternative CBM water disposal options add $1,500 to $72,300 of capital costs per well, depending on the water management practice selected, as shown for the example well below. The water management costs, detailed below, do not include water gathering costs incurred in moving produced water from the wellhead to a central location. These costs are accounted for in Appendix B under ‘Basic Water Handling Facilities.’
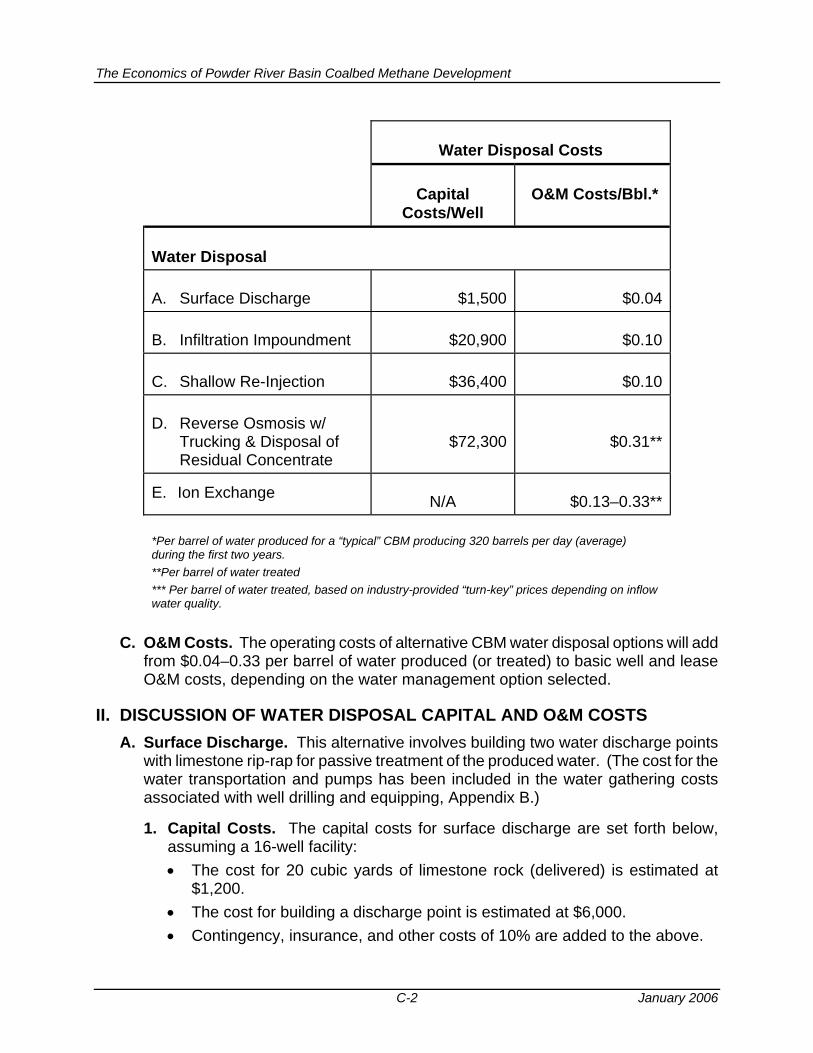
The Economics of Powder River Basin Coalbed Methane Development
C-2 January 2006
Water Disposal Costs
Capital Costs/Well
O&M Costs/Bbl.*
Water Disposal A. Surface Discharge $1,500 $0.04 B. Infiltration Impoundment $20,900 $0.10 C. Shallow Re-Injection $36,400 $0.10 D. Reverse Osmosis w/
Trucking & Disposal of Residual Concentrate
$72,300 $0.31**
E. Ion Exchange N/A $0.13–0.33**
*Per barrel of water produced for a “typical” CBM producing 320 barrels per day (average) during the first two years. **Per barrel of water treated *** Per barrel of water treated, based on industry-provided “turn-key” prices depending on inflow water quality.
C. O&M Costs. The operating costs of alternative CBM water disposal options will add
from $0.04–0.33 per barrel of water produced (or treated) to basic well and lease O&M costs, depending on the water management option selected.
II. DISCUSSION OF WATER DISPOSAL CAPITAL AND O&M COSTS A. Surface Discharge. This alternative involves building two water discharge points
with limestone rip-rap for passive treatment of the produced water. (The cost for the water transportation and pumps has been included in the water gathering costs associated with well drilling and equipping, Appendix B.)
1. Capital Costs. The capital costs for surface discharge are set forth below, assuming a 16-well facility: • The cost for 20 cubic yards of limestone rock (delivered) is estimated at
$1,200. • The cost for building a discharge point is estimated at $6,000. • Contingency, insurance, and other costs of 10% are added to the above.
The Economics of Powder River Basin Coalbed Methane Development
C-3 January 2006
• The cost for the NPDES permit is approximately $1,000 per well. • The total cost is estimated at $7,920 for a 16-well facility or 500 per typical
CBM well, plus $1,000 per well fort the NPDES permit.
2. Operational Maintenance Costs. The operating costs for monitoring surface discharge, including electricity and maintenance for the surface pumps, are estimated at $0.04 per barrel of produced water.
B. Infiltration Impoundment. This alternative involves constructing an impoundment (pond) and installing enhanced evaporation equipment (atomizers) or a surface irritation system.
1. Capital Costs. The capital costs for constructing the impoundments are set forth below: • The size of the impoundment is 3 acres with a dam of 13 feet, providing 20
acre-feet (150,000 barrels) of water capacity. This is sufficient to hold 30 days of production from a 16-well unit.
• Annual water infiltration is estimated at 8 feet of water loss per year, with enhanced evaporation and surface irrigation providing 12 feet of water loss per year. Together, this provides 60 acre-feet (approximately 465,000 barrels) of water loss per year or about 1,275 barrels per day (with more during summer months and less during winter months).
• An irrigation or atomizing system is added to the impoundment. One such unit is able to dispose of 45 gpm or 1,500 barrels per day.
• At an average water rate of 320 barrels per day (during the first two years of wells operation), the 16-well unit will produce about 5,000 barrels per day of water. One impoundment with an irrigation system will accommodate about 8 wells (and more wells during subsequent years). A 16-well unit requires two such infiltration and evaporation impoundments.
• The cost for constructing one impoundment is estimated at $56,300, based on handling of 32,300 cubic yards of material at $1.35 per cubic yard. The costs for design, permitting, and monitoring of the facility are $26,000. Surface use agreement adds $16,000. Outfall construction is an additional $5,500. The total capital costs required to construct one infiltration impoundment is $103,800.
• Reclamation costs, including re-filling, soil replacement, and replanting for one impoundment, are $14,000 (on a present-value basis).
• The cost for one atomizer or irrigation system is estimated at $27,000 for a 1,500-barrels per day (45 gpm) unit installed. Two such units are required.
• Contingency, insurance, right-of-way, and other costs of 10% are added. The total cost for two infiltration and evaporation impoundments is $318,600, plus $1,000 per well for the NPDES permit, or $20,900 per well, as shown below:
Construction = $207,600
The Economics of Powder River Basin Coalbed Methane Development
C-4 January 2006
Reclamation = $28,000
Atomizers/Irrigation = $54,000
Contingency = $29,000
Total $318,600
2. Operating and Maintenance Costs. The operating cost for the infiltration and evaporation impoundment is estimated at $0.10 per barrel of water produced, including $0.03 per barrel for electricity and maintenance for the surface pumps, $0.02 per barrel for maintaining the impoundments, and $0.05 per barrel for operating the atomizer system.
C. Shallow Re-Injection. This alternative involves identifying shallow, relatively fresh water zones into which the CBM produced water could be re-injected. A handful of such shallow well injection projects exist, but with a mixed record of success. Shallow re-injection is still a high-risk option, requiring more in-depth geological study to identify favorable re-injection zones. Therefore, shallow re-injection was evaluated from the standpoint of its future potential impact on CBM development in the Powder River Basin.
• Ideally, the shallow re-injection zone would be under-pressured and highly permeable. This would help reduce or eliminate pump costs and reduce the number of required injection wells.
• The costs for a large, central shallow re-injection facility (or two smaller facilities) capable of dispersing 30,000 barrels per day from 96-producing CBM well is as follows:
• The cost of two 3-acre (20 acre-foot) infiltration impoundments (with a combined capacity for 300,000 barrels) is estimated at $235,500. This would provide storage for about 10 days of water production from a 96-well unit. The annual water loss from two impoundments would be modest, on the order of 1,500 barrels per day.
• The remainder of the produced water would be injected into a series of shallow wells. Assuming water injection capacity of 2,000 barrels per day (based on water production and a select number of injection projects in the basin) and success rate of 75%, approximately 20 shallow wells be drilled (15 would become injectors).
• Each injection well is estimated to cost approximately $142,500. This includes water transportation, pumps, injection facilities, permits, etc.
Assuming average shallow well drilling and completion costs per well of $142,500, the costs for 20 wells would be $2,850,000 plus $235,500 for the impoundment facilities. With 10% added for contingency, shallow re-injection requires $3,394,000 plus $1,000 per well for permitting and study or $36,350 per well, as shown below:
The Economics of Powder River Basin Coalbed Methane Development
C-5 January 2006
Impoundments (2) $235,500
Shallow Wells (20) $2,850,000
Contingency (@10%) $308,550
NPDES Permitting = $96,000
Total $3,394,000
2. Operating and Maintenance Costs. The operating costs for the shallow wells and impoundment (including electricity and maintenance for the surface pumps) are estimated at $0.10 per barrel of water produced.
D. Reverse Osmosis (RO). This alternative involves constructing water holding and residual concentration storage impoundments, installing a water treatment system for RO, surface discharging the treated water, and trucking the residual concentrate. This method would involve treating a portion of the produced water stream followed by the blending of the treated and untreated fraction to form an effluent that meets one of two possible TDS discharge limits.
1. Capital Costs. The capital costs are for a centralized facility consisting of one unit able to service 32 average producing CBM wells. • The cost of four surface discharge points is estimated at $28,800. The cost
for 31,680 feet of additional water piping is $538,600, plus 10% contingency for the discharge points and piping. The total for a 32-well unit is $624,100. In addition, $1,000 per well is required for permitting and studies, bringing the total to $656,100 for a 32-well unit.
• The cost of one 3-acre (20 acre-foot) infiltration impoundment (with a capacity of 150,000 barrels) is estimated at $129,500, including $14,000 (PV) for reclamation and 10% for contingency (from above). This would provide storage for about 15 days of water production from a 32-well unit. The cost of a second, smaller (2 acre-foot) lined impoundment for storing the concentrate from the RO unit is estimated at $11,800, plus $17,700 for piping and miscellaneous. This would provide storage for up to one month of concentrate. The total cost for impoundments is estimated at $159,000.
• Assuming a 32-well unit and 320 barrels of water per day per well (average water rate for first two years), one 300-gpm (10,286 barrel per day) unit is required capacity to treat 10,240 barrels per day.
• The cost for one RO unit is $750,000. Assuming 90% for site preparation, the electrical system, and civil items and 10% for contingency, insurance, and other, the total cost for unit is $1,500,000.
• Trucking followed by disposal at a deep injection waste well is the expected method of dealing with the residual concentrate from RO. The residual concentrate is expected to be 5% of the treated water, or approximately 500 barrels per day. The costs associated with disposal by trucking are presented in the next section.
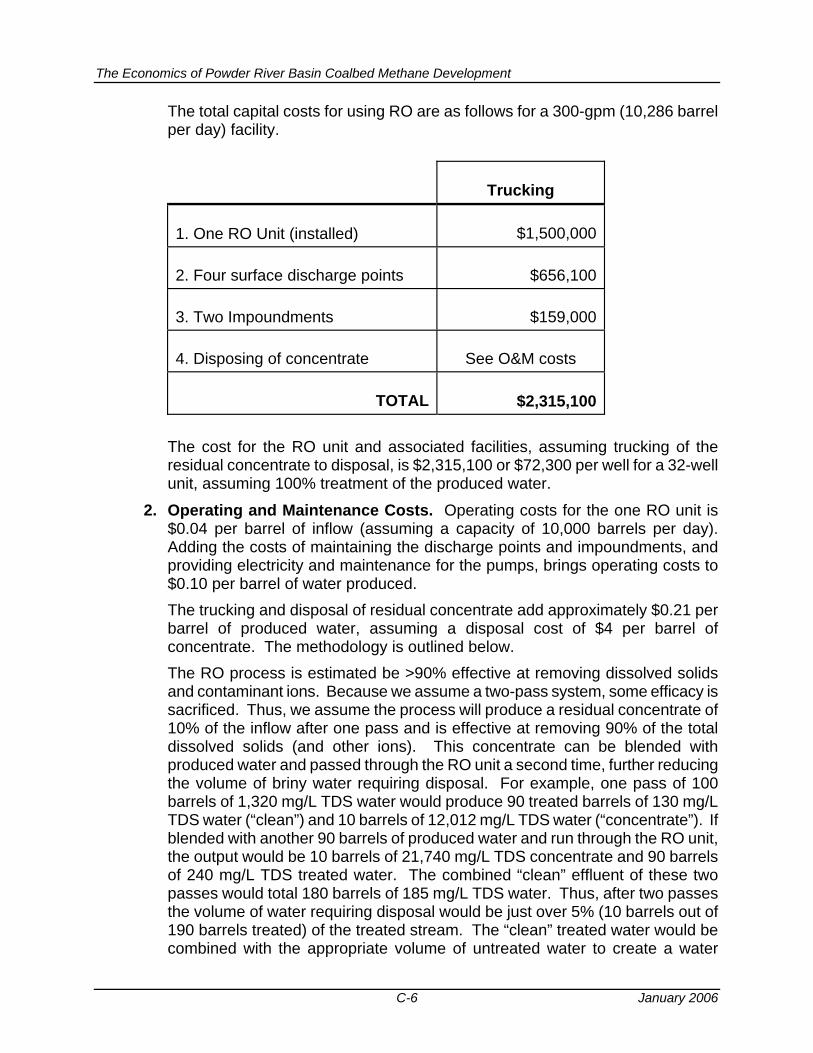
The Economics of Powder River Basin Coalbed Methane Development
C-6 January 2006
The total capital costs for using RO are as follows for a 300-gpm (10,286 barrel per day) facility.
Trucking
1. One RO Unit (installed)
$1,500,000
2. Four surface discharge points
$656,100
3. Two Impoundments
$159,000
4. Disposing of concentrate
See O&M costs
TOTAL
$2,315,100
The cost for the RO unit and associated facilities, assuming trucking of the residual concentrate to disposal, is $2,315,100 or $72,300 per well for a 32-well unit, assuming 100% treatment of the produced water.
2. Operating and Maintenance Costs. Operating costs for the one RO unit is $0.04 per barrel of inflow (assuming a capacity of 10,000 barrels per day). Adding the costs of maintaining the discharge points and impoundments, and providing electricity and maintenance for the pumps, brings operating costs to $0.10 per barrel of water produced. The trucking and disposal of residual concentrate add approximately $0.21 per barrel of produced water, assuming a disposal cost of $4 per barrel of concentrate. The methodology is outlined below. The RO process is estimated be >90% effective at removing dissolved solids and contaminant ions. Because we assume a two-pass system, some efficacy is sacrificed. Thus, we assume the process will produce a residual concentrate of 10% of the inflow after one pass and is effective at removing 90% of the total dissolved solids (and other ions). This concentrate can be blended with produced water and passed through the RO unit a second time, further reducing the volume of briny water requiring disposal. For example, one pass of 100 barrels of 1,320 mg/L TDS water would produce 90 treated barrels of 130 mg/L TDS water (“clean”) and 10 barrels of 12,012 mg/L TDS water (“concentrate”). If blended with another 90 barrels of produced water and run through the RO unit, the output would be 10 barrels of 21,740 mg/L TDS concentrate and 90 barrels of 240 mg/L TDS treated water. The combined “clean” effluent of these two passes would total 180 barrels of 185 mg/L TDS water. Thus, after two passes the volume of water requiring disposal would be just over 5% (10 barrels out of 190 barrels treated) of the treated stream. The “clean” treated water would be combined with the appropriate volume of untreated water to create a water
The Economics of Powder River Basin Coalbed Methane Development
C-7 January 2006
volume that meets one of the two TDS limits used in this study. The residual concentrate would be removed via truck and disposed in an off-site disposal well at a cost of $4 per barrel of brine (or $0.21 per barrel of treated water). The percentage of water that would need to be treated in this example would be either 29% (1,000 TDS limit) or 73% (500 TDS limit).
E. Ion Exchange. This alternative involves installing a water treatment system for Ion Exchange (IX), constructing holding impoundments for treated water, and building two surface discharge points. Disposal of the residual concentrate is by removal from the site and re-injection in a deep disposal well. The costs for concentrate disposal are included in the O&M costs below. The treated effluent would meet required TDS limits of either 500 mg/L or 1,000 mg/L.
1. Capital Costs. The capital costs are for a large, central unit able to service approximately 96 producing CBM wells with moderately high TDS waters. • The cost of 12 surface discharge points is estimated at $86,400. The cost for
22 miles of additional water piping is $1,974,700. Including 10% contingency, the total for a 96-well unit is $2,267,200. In addition, $1,000 per well is required for permitting and studies, bringing the total to $2,363,200 for a 96-well unit.
• The cost of one 3-acre (20 acre-foot) infiltration impoundment (with a capacity of 150,000 barrels) is estimated at $129,500, including $14,000 (PV) for reclamation and 10% for contingency (from above). This would provide storage for about 15 days of water production from a 32-well unit. Three such impoundments are required to provide 15 days of produced water storage capacity for 96 wells. The total cost for three impoundments is $388,500.
• Assuming a 96-well unit and 320 barrels of water per day per well (average water rate for first two years), the Ion Exchange units must be capable of treating 30,000 barrels per day.
• The Ion Exchange process capital cost estimates provided by our vendor were included in their quoted “full service, turn-key costs” and thus are discussed under operating and maintenance costs.
2. Operating and Maintenance Costs. Operating costs for the impoundments and surface discharge points are $0.06 per barrel. This includes monitoring surface discharge points, electricity and maintenance for the surface pumps, and maintenance of the surface impoundments. The “full service, turn-key costs” are a per-barrel cost charged by the vendor for the Ion Exchange unit. It includes cost for acid, electricity, spent brine disposal, labor, parts, etc. The producer must deliver the CBM water to the IX units and must handle the clean effluent. All aspects of the treatment process are included in the per-barrel costs. The full service, turn-key costs for IX range from $0.03 to $0.27 per barrel (based on the water quality limits used in the model). These costs are treated in the model like O&M costs.