Tennessee Birth Defects 1999-2003

Tennessee Birth Defects 1999-2003
Suggested Citation: Tennessee Birth Defects Registry (2007). Tennessee Birth Defects 1999‐2003. Tennessee Department of Health: Nashville, TN.
Tennessee Birth Defects Registry

Page ii
.
Table of Contents Executive Summary......................................................................................................................... 1 Overview.......................................................................................................................................... 2
Impact of Birth Defects ................................................................................................................ 2
History of the Tennessee Birth Defects Registry ........................................................................ 2
Methods....................................................................................................................................... 3
Overall Birth Defects by Organ System in Tennessee, 1999-2003................................................. 6 Characteristics Associated with Birth Defects............................................................................. 9
Neural Tube Defects...................................................................................................................... 12 NTDs in Tennessee, 1999-2003. .............................................................................................. 13
Cardiovascular Defects ................................................................................................................. 14 Gastroschisis ................................................................................................................................. 16 Chromosomal Defects ................................................................................................................... 17 Prevention Education .................................................................................................................... 19 Technical Notes............................................................................................................................. 21 References .................................................................................................................................... 22 Glossary of Terms ......................................................................................................................... 23 Appendix A .................................................................................................................................... 27 Appendix B .................................................................................................................................... 29
List of Figures Figure 1. Leading causes of infant mortality, United States 2004. ....................................................................................... 2Figure 2. Annual birth defects rates in Tennessee, 1999-2003 .............................................................................................8 Figure 3. Percentage of birth defect diagnoses by organ system in Tennessee, 1999-2003................................................8 Figure 4. Infants with birth defects by maternal age, Tennessee (1999-2003)......................................................................9 Figure 5. Infants with birth defects by race/ethnicity, Tennessee (1999-2003) .....................................................................9 Figure 6. Infants with major birth defects in Tennessee, 1999-2003 .................................................................................. 10 Figure 7. Neural tube defects rates in Tennessee, 1999-2003........................................................................................... 13 Figure 8. Neural tube defects by race/ethnicity .................................................................................................................. 13 Figure 9. Distribution of the types of cardiovascular defects in Tennessee, 1999-2003 .................................................... 14 Figure 10. Cardiovascular defects in Tennessee, 1999-2003 ............................................................................................ 14 Figure 11. Cardiovascular birth defect cases in Tennessee, 1999-2003............................................................................ 15 Figure 12. Gastroschisis in Tennessee, 1999-2003 ........................................................................................................... 16 Figure 13. Gastroschisis by maternal age in Tennessee, 1999-2003 ................................................................................ 16 Figure 14. Down syndrome rates by maternal age in Tennessee, 1999-2003 ................................................................... 17 Figure 15. Chromosomal defects in Tennessee, 1999-2003.............................................................................................. 17 Figure A1 (Appendix A). Tennessee perinatal regions and perinatal centers .....................................................................28 List of Tables Table 1. Overall birth defects counts and rates in Tennessee, 1999-2003 ...........................................................................6 Table 2 Top five birth defect diagnoses in TN (1999-2003)...................................................................................................8 Table B1 (Appendix B). Birth defects by race/ethnicity, 1999-2003 ....................................................................................30 Table B2 (Appendix B). Birth defects by sex, 1999-2003 ....................................................................................................34 Table B3 (Appendix B). Birth defects by perinatal region, 1999-2003.................................................................................37
Page iii

Page iv
Executive Summary This is the second widely distributed population‐based statewide report produced and published by the Tennessee Birth Defects Registry (TBDR). Its purpose is to inform on the prevalence of birth defects in Tennessee and of the registry’s efforts to further birth defects surveillance in Tennessee. The report is an extension of the first report published in 2005 and details the birth prevalence of 44 major birth defects for Tennessee infants born in the years 1999 through 2003. The report contains sections detailing the overall statewide birth defects counts and rates for each of the 44 birth defects diagnoses that are tracked by the registry. The 44 birth defects diagnoses comprise a list of birth defects to be surveyed compiled by the National Birth Defects Prevention Network (NBDPN) and the Centers for Disease Control and Prevention (CDC). The statewide counts and rates are broken down by infant sex, race/ethnicity, and perinatal region. In addition, the mission, organization, and methods of the TBDR are described. Several specific birth defects or birth defects groups are described in more detail. These special sections have been included to discuss in more depth birth defects that have either known risk factors and/or prevention strategies (e.g. Neural Tube Defects) or are highly prevalent (e.g. Cardiovascular Defects). The report ends with a section on known prevention strategies to reduce a woman’s risk of having an infant with a birth defect. The overall rate of birth defects for the state of Tennessee is 349.1 birth defects per 10,000 live births and the overall number of infants affected by birth defects is 276.3 cases per 10,000 live births. The rate of cases affected by birth defects is lower than the total rate of birth defects per live birth since a single infant may have more than one birth defect. The annual prevalences of both birth defects and of cases (i.e. infants) affected by birth defects from 1999 through 2003 have not shown any statistically significant changes over the five year period. Rates continue to vary by maternal age, infant’s sex, infant’s race/ethnicity, and perinatal region. As seen across the nation as well as in Tennessee, infants born to older aged mothers and male infants are associated with higher rates of birth defects. In Tennessee, the birth defects rates varied by perinatal region with the Northeast having a higher rate of birth defects than the other regions; the rates generally declined as one moved through the East, Middle, and Western regions. Currently, the TBDR is attempting to evaluate factors that may affect the regional differences as well as the race/ethnic and gender differences in birth defects rates. The TBDR is reviewing individual case records in all Tennessee hospitals that have reported birth defects. All of the efforts of the TBDR and its collaborations with the NBDPN and the CDC are done with a focus on effective prevention and treatment programs that will ultimately diminish the burden of birth defects in Tennessee and elsewhere.
Page 1
Overview
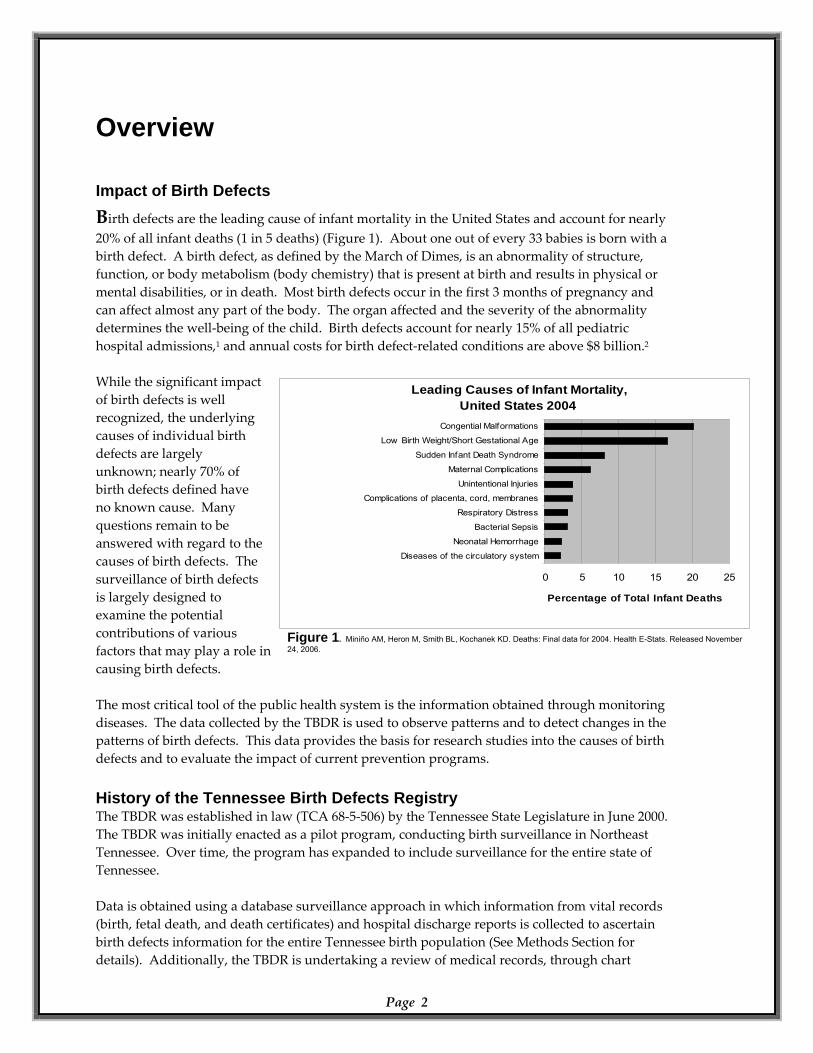
Impact of Birth Defects Birth defects are the leading cause of infant mortality in the United States and account for nearly 20% of all infant deaths (1 in 5 deaths) (Figure 1). About one out of every 33 babies is born with a birth defect. A birth defect, as defined by the March of Dimes, is an abnormality of structure, function, or body metabolism (body chemistry) that is present at birth and results in physical or mental disabilities, or in death. Most birth defects occur in the first 3 months of pregnancy and can affect almost any part of the body. The organ affected and the severity of the abnormality determines the well‐being of the child. Birth defects account for nearly 15% of all pediatric hospital admissions,1 and annual costs for birth defect‐related conditions are above $8 billion.2 While the significant impact of birth defects is well recognized, the underlying causes of individual birth defects are largely unknown; nearly 70% of birth defects defined have no known cause. Many questions remain to be answered with regard to the causes of birth defects. The surveillance of birth defects is largely designed to examine the potential contributions of various factors that may play a role in causing birth defects.
Leading Causes of Infant Mortality, United States 2004
0 5 10 15 20 25
Congential Malformations
Low Birth Weight/Short Gestational Age
Sudden Infant Death Syndrome
Maternal Complications
Unintentional Injuries
Complications of placenta, cord, membranes
Respiratory Distress
Bacterial Sepsis
Neonatal Hemorrhage
Diseases of the circulatory system
Percentage of Total Infant Deaths
The most critical tool of the public health system is the information obtained through monitoring diseases. The data collected by the TBDR is used to observe patterns and to detect changes in the patterns of birth defects. This data provides the basis for research studies into the causes of birth defects and to evaluate the impact of current prevention programs. History of the Tennessee Birth Defects Registry The TBDR was established in law (TCA 68‐5‐506) by the Tennessee State Legislature in June 2000. The TBDR was initially enacted as a pilot program, conducting birth surveillance in Northeast Tennessee. Over time, the program has expanded to include surveillance for the entire state of Tennessee. Data is obtained using a database surveillance approach in which information from vital records (birth, fetal death, and death certificates) and hospital discharge reports is collected to ascertain birth defects information for the entire Tennessee birth population (See Methods Section for details). Additionally, the TBDR is undertaking a review of medical records, through chart
Page 2
Figure 1. Miniño AM, Heron M, Smith BL, Kochanek KD. Deaths: Final data for 2004. Health E-Stats. Released November 24, 2006.
Page 3
abstraction by trained nurses visiting all Tennessee hospitals that report birth defects, to evaluate and improve the validity of the TBDR surveillance methods. The TBDR has shared birth defects statistics and related information with public interest groups such as the March of Dimes, the Tennessee Perinatal Association, and the Tennessee Folic Acid Council and with the NBDPN and the CDC. The first publicly issued and widely distributed report by the TBDR was in 2005. Mission of the TBDR
To provide annual information on birth defects prevalence and trends. To provide information on the possible association of environmental hazards and other potential causes of birth defects.
To evaluate current birth‐defects prevention initiatives, providing guidance and strategies for improving those initiatives.
To provide families of children with birth defects information on public services available to children with birth defects.
Methods Case Definition and Data Collection The TBDR is housed within the Office of Policy, Planning, and Assessment (PPA) in the Tennessee Department of Health. The surveillance system is composed of data abstracted from the Hospital Discharge Data System (HDDS) and the Birth, Death, and Fetal Death Statistical Data Systems which are compiled, processed, and stored by the Health Statistics and Vital Records sections of PPA. This report presents data on selected birth defects occurring in infants born to Tennessee residents during the calendar years 1999 through 2003. Birth defect counts included are: (1) A birth defect in a live birth diagnosed during the first year of life. (2) A birth defect diagnosed in a fetal death case that was at least 500 grams in weight/mass or in absence of weight/mass of at least 22‐weeks gestational age. The program does not currently monitor defects in pregnancy terminations. The hospital discharge data, and in cases of fetal death the fetal death certificate, has been the source of the birth defect diagnoses, while the birth/death/fetal death certificate has provided information on maternal characteristics, demographics, and residential geography not provided by the hospital discharge information. The TBDR has tracked 44 major congenital anomalies in eight diagnostic categories (Central Nervous System; Ear and Eye; Cardiovascular; Orofacial; Gastrointestinal; Genitourinary; Musculoskeletal; Chromosomal). Current surveillance methods allow for timely, statewide, population based coverage. The TBDR currently has linked birthing events and birth defects diagnoses from 1999 through the end of 2003; the five years of data are presented in this report. All counts and rates have been aggregated over the five years, from 1999 through 2003 unless otherwise stated.
Page 4
Data Analysis The TBDR follows guidelines established by the NBDPN. A defect may occur alone or in conjunction with other defects. For patients with multiple birth defect diagnoses, each diagnosis was counted separately. For each of the eight birth defect categories, the total represents the number of cases (or patients) with either one or more diagnoses in that category. A case (or patient) may have had multiple diagnoses in one category or diagnoses in multiple categories. For these reasons, the totals for each category are not the total number of diagnoses in that category but the total number of cases (or affected infants) having at least one diagnosis in that category. The category totals cannot be added to obtain the total number of cases in Tennessee since an infant may be counted in more than one category. Birth prevalence is the preferred method of reporting birth defects. Birth prevalence is calculated as the number of birth defect cases born at a point in time per 10,000 live births. The prevalence tables list the number of cases found, the estimated prevalence rate per 10,000 live births, and the 95% confidence interval for that rate. The confidence interval (CI) can be used to assess the stability of the rate. The 95% CI is the range of the rate that should contain the true rate 95% of the time. Wide confidence intervals reflect less certainty that the estimated rate is the true rate. The width of the confidence interval is dependent on the size of the sample with larger sample supporting greater confidence. The reader is advised to use caution when interpreting rates based on small numbers of observed cases. (Technical note: Confidence intervals for 100 or less cases are exact Poisson; otherwise, confidence intervals are based on the normal approximation.) Data limitations also exist in any large scale surveillance system and may lead to an underreporting of birth defects. The TBDR is currently investigating the reliability of case ascertainment through a highly trained public health nursing staff that is systematically reviewing and abstracting information from medical records at the hospitals where birth defects are diagnosed and treated. This approach was started in 2005 and currently focuses on a limited subset of births. Data limitations common to current population‐based birth defects surveillance registries and also a consideration in the data interpretation of the TBDR are:
The TBDR reports from hospital discharge data during the first year of life. Thus, defects may be underreported that are: (1) undiagnosed in the first year of life (e.g. kidney malformations or heart defects that are largely asymptomatic); and (2) diagnosed after birth within the first year of life but do not require hospitalization over the course of the first year of life.
Misclassification of birth defects may occur through coding errors or vague diagnoses that occur in the hospitals. Current studies at the TBDR are investigating the validity of the coding through chart abstraction by trained public health nurses.
With advancements in medical technology, prenatal diagnosis of birth defects is improving and occurring more often in out‐patient settings than in previous decades. The early identification birth defects has allowed women options in the management of their affected pregnancies such as earlier referrals to obstetricians that specialize in high risk pregnancies and elective termination. For example, studies at the CDC3 have estimated that up to 50% of all pregnancies affected with a neural tube defect (a very serious birth defect with high morbidity and/or mortality) may be discontinued and would not be included in the hospital records that are surveyed. The TBDR does not have data on elective terminations and still births prior to 22 weeks gestation age.
Confidentiality All personal identifying information collected and maintained by the TBDR is considered confidential, and great care is taken to protect the confidentiality of the data. Published data are presented at an aggregate level in order to protect patient information confidentiality. The Tennessee Department of Health and the TBDR have developed procedures to guarantee the confidentiality of personal medical information and to protect the privacy of patients and families. These procedures uphold our ethical and legal obligations to safeguard confidentiality and fully comply with state and federal laws and guidelines.
Page 5
Overall Birth Defects by Organ System in Tennessee, 1999-2003
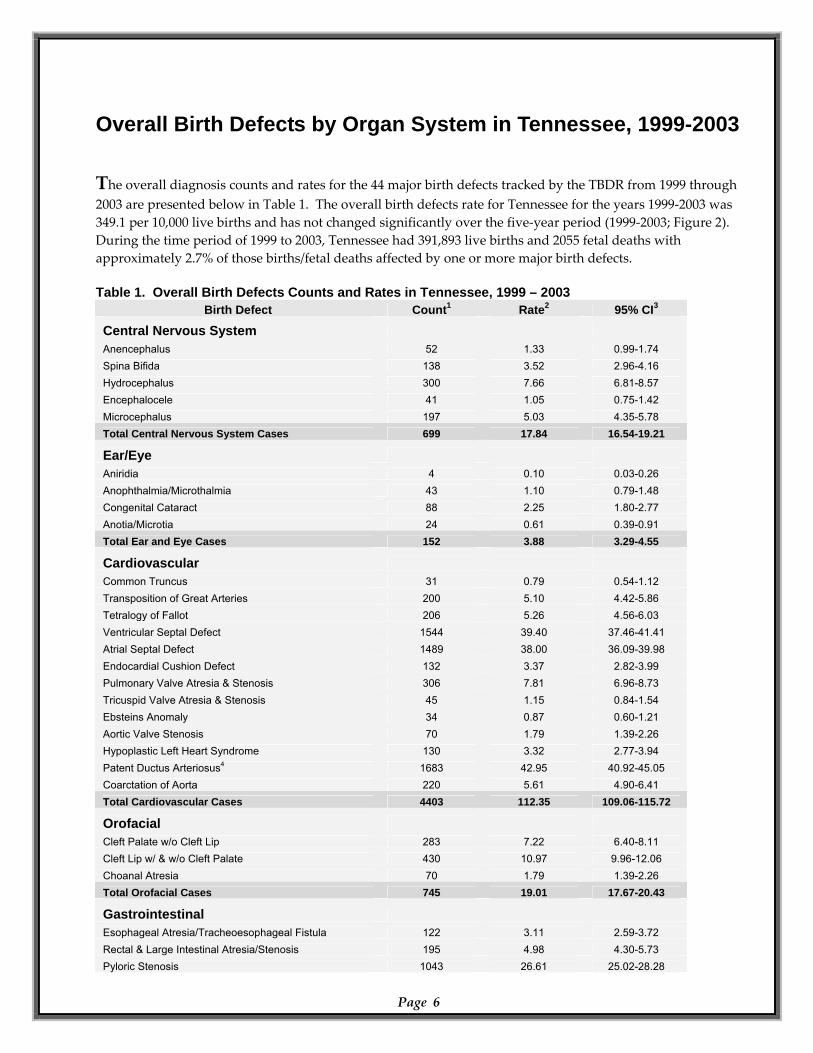
The overall diagnosis counts and rates for the 44 major birth defects tracked by the TBDR from 1999 through 2003 are presented below in Table 1. The overall birth defects rate for Tennessee for the years 1999‐2003 was 349.1 per 10,000 live births and has not changed significantly over the five‐year period (1999‐2003; Figure 2). During the time period of 1999 to 2003, Tennessee had 391,893 live births and 2055 fetal deaths with approximately 2.7% of those births/fetal deaths affected by one or more major birth defects. Table 1. Overall Birth Defects Counts and Rates in Tennessee, 1999 – 2003
Page 6
Birth Defect Count1 Rate2 95% CI3
Central Nervous System Anencephalus 52 1.33 0.99-1.74 Spina Bifida 138 3.52 2.96-4.16 Hydrocephalus 300 7.66 6.81-8.57 Encephalocele 41 1.05 0.75-1.42 Microcephalus 197 5.03 4.35-5.78 Total Central Nervous System Cases 699 17.84 16.54-19.21
Ear/Eye Aniridia 4 0.10 0.03-0.26 Anophthalmia/Microthalmia 43 1.10 0.79-1.48 Congenital Cataract 88 2.25 1.80-2.77 Anotia/Microtia 24 0.61 0.39-0.91 Total Ear and Eye Cases 152 3.88 3.29-4.55
Cardiovascular Common Truncus 31 0.79 0.54-1.12 Transposition of Great Arteries 200 5.10 4.42-5.86 Tetralogy of Fallot 206 5.26 4.56-6.03 Ventricular Septal Defect 1544 39.40 37.46-41.41 Atrial Septal Defect 1489 38.00 36.09-39.98 Endocardial Cushion Defect 132 3.37 2.82-3.99 Pulmonary Valve Atresia & Stenosis 306 7.81 6.96-8.73 Tricuspid Valve Atresia & Stenosis 45 1.15 0.84-1.54 Ebsteins Anomaly 34 0.87 0.60-1.21 Aortic Valve Stenosis 70 1.79 1.39-2.26 Hypoplastic Left Heart Syndrome 130 3.32 2.77-3.94 Patent Ductus Arteriosus4 1683 42.95 40.92-45.05 Coarctation of Aorta 220 5.61 4.90-6.41 Total Cardiovascular Cases 4403 112.35 109.06-115.72
Orofacial Cleft Palate w/o Cleft Lip 283 7.22 6.40-8.11 Cleft Lip w/ & w/o Cleft Palate 430 10.97 9.96-12.06 Choanal Atresia 70 1.79 1.39-2.26 Total Orofacial Cases 745 19.01 17.67-20.43
Gastrointestinal Esophageal Atresia/Tracheoesophageal Fistula 122 3.11 2.59-3.72 Rectal & Large Intestinal Atresia/Stenosis 195 4.98 4.30-5.73 Pyloric Stenosis 1043 26.61 25.02-28.28

Birth Defect Count1 Rate2 95% CI3
Hirschprungs Disease (congenital megacolon) 117 2.99 2.47-3.58 Biliary Atresia 24 0.61 0.39-0.91 Total Gastrointestinal Cases 1485 37.89 35.99-39.87
Genitourinary Bladder Extrophy 13 0.33 0.18-0.57 Hypospadias & Epispadias 1823 46.52 44.41-48.70 Obstructive Genitourinary Defect 870 22.20 20.75-23.73 Renal Agenesis/Hypoplasia 137 3.50 2.93-4.13 Total Genitourinary Cases 2807 71.63 69.00-74.33
Musculoskeletal Reduction Deformity (upper limbs) 95 2.42 1.96-2.96 Reduction Deformity (lower limbs) 38 0.97 0.69-1.33 Gastroschisis 168 4.29 3.66-4.99 Omphalocele 107 2.73 2.24-3.30 Diaphragmatic Hernia 123 3.14 2.61-3.74 Congenital Hip Dislocation 338 8.62 7.73-9.60 Total Musculoskeletal Cases 852 21.74 20.31-23.25
Chromosomal Trisomy 13 37 0.94 0.66-1.30 Down Syndrome 481 12.27 11.20-13.42 Trisomy 18 65 1.66 1.28-2.11 Total Chromosomal Cases 578 14.75 13.57-16.00
Other Fetal Alcohol Syndrome 126 3.22 2.68-3.83 Total Cases 10,826 276.25 271.07-281.50 Total Live Births 391,893
1 Counts include birth defects in live births and fetal deaths. 2 Rates per 10,000 live births. 3 Confidence intervals (CI) for 100 or less cases are exact Poisson; otherwise, confidence intervals are based on the normal approximation. 4 Patent ductus arteriosus is counted as a birth defect only for birth weights of 2500 grams or more. Diagnostic data were derived from the Tennessee Hospital Discharge Data System (THDDS, 1999-2004), the Tennessee Death Statistical System (1999-2004) and the Tennessee Fetal Death Statistical System (1999-2003). Total live births and birth weights are from the Tennessee Birth Statistical System (1999-2003).
Page 7
Percentage of Birth Defect Diagnoses by Organ Systemin Tennessee, 1999-2003
(n,%)
Orofacial(783, 6%)
Gastrointestinal(1501, 11%)Genitourinary
(2843, 21%)Musculoskeletal
(869, 6%)
Cardiovascular(6090, 45%)
Fetal Alcohol Syndrome(126, 1%)
Eye/Ear(159, 1%)
Chromosomal(583, 4%)
Central Nervous System
(728, 5%)
Annual Birth Defect Rates in Tennessee, 1999-2003
349.46
351.26
343.10
355.19 359.96
200
250
300
350
400
1998 1999 2000 2001 2002 2003 2004
Year
Rat
e(b
irth
def
ect c
ount
per
10
,000
live
bir
ths)
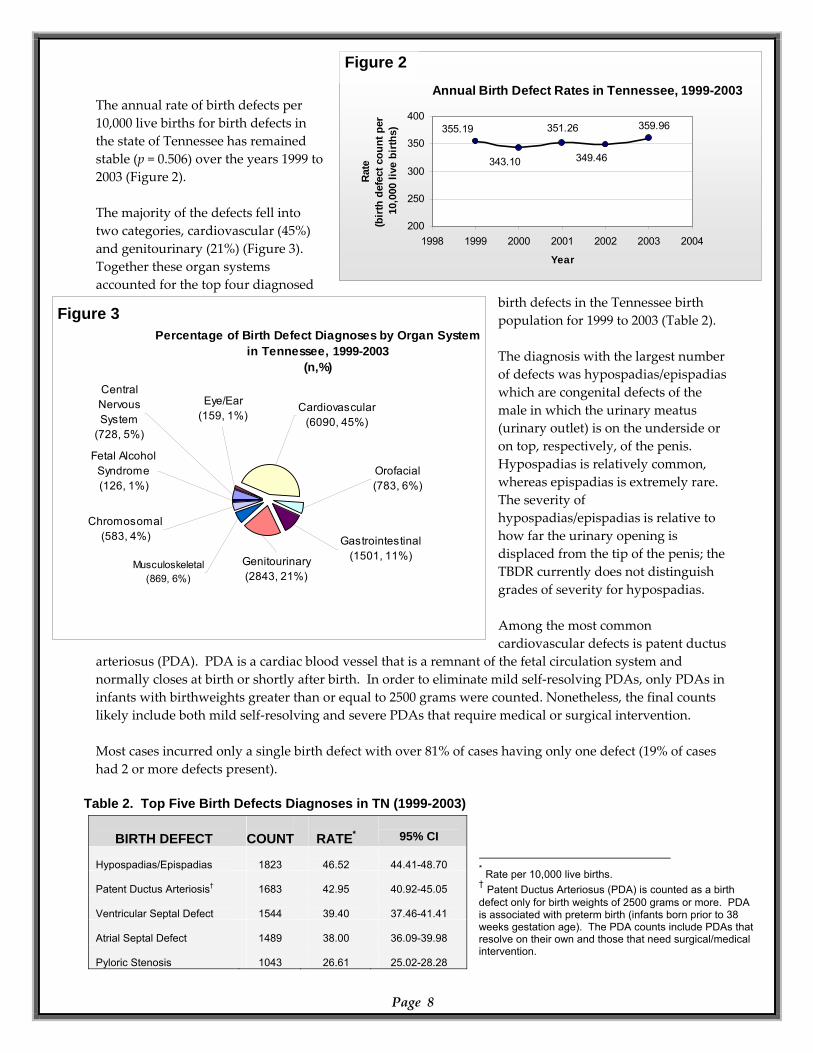
The annual rate of birth defects per 10,000 live births for birth defects in the state of Tennessee has remained stable (p = 0.506) over the years 1999 to 2003 (Figure 2). The majority of the defects fell into two categories, cardiovascular (45%) and genitourinary (21%) (Figure 3). Together these organ systems accounted for the top four diagnosed
birth defects in the Tennessee birth population for 1999 to 2003 (Table 2). The diagnosis with the largest number of defects was hypospadias/epispadias which are congenital defects of the male in which the urinary meatus (urinary outlet) is on the underside or on top, respectively, of the penis. Hypospadias is relatively common, whereas epispadias is extremely rare. The severity of hypospadias/epispadias is relative to how far the urinary opening is displaced from the tip of the penis; the TBDR currently does not distinguish grades of severity for hypospadias. Among the most common cardiovascular defects is patent ductus
arteriosus (PDA). PDA is a cardiac blood vessel that is a remnant of the fetal circulation system and normally closes at birth or shortly after birth. In order to eliminate mild self‐resolving PDAs, only PDAs in infants with birthweights greater than or equal to 2500 grams were counted. Nonetheless, the final counts likely include both mild self‐resolving and severe PDAs that require medical or surgical intervention. Most cases incurred only a single birth defect with over 81% of cases having only one defect (19% of cases had 2 or more defects present).
Table 2. Top Five Birth Defects Diagnoses in TN (1999-2003) * Rate per 10,000 live births. † Patent Ductus Arteriosus (PDA) is counted as a birth defect only for birth weights of 2500 grams or more. PDA is associated with preterm birth (infants born prior to 38 weeks gestation age). The PDA counts include PDAs that resolve on their own and those that need surgical/medical intervention.
Page 8
BIRTH DEFECT
COUNT
RATE*
95% CI
Hypospadias/Epispadias
1823
46.52
44.41-48.70
Patent Ductus Arteriosis†
1683
42.95
40.92-45.05
Ventricular Septal Defect
1544
39.40
37.46-41.41
Atrial Septal Defect
1489
38.00
36.09-39.98
Pyloric Stenosis
1043
26.61
25.02-28.28
Figure 2
Figure 3
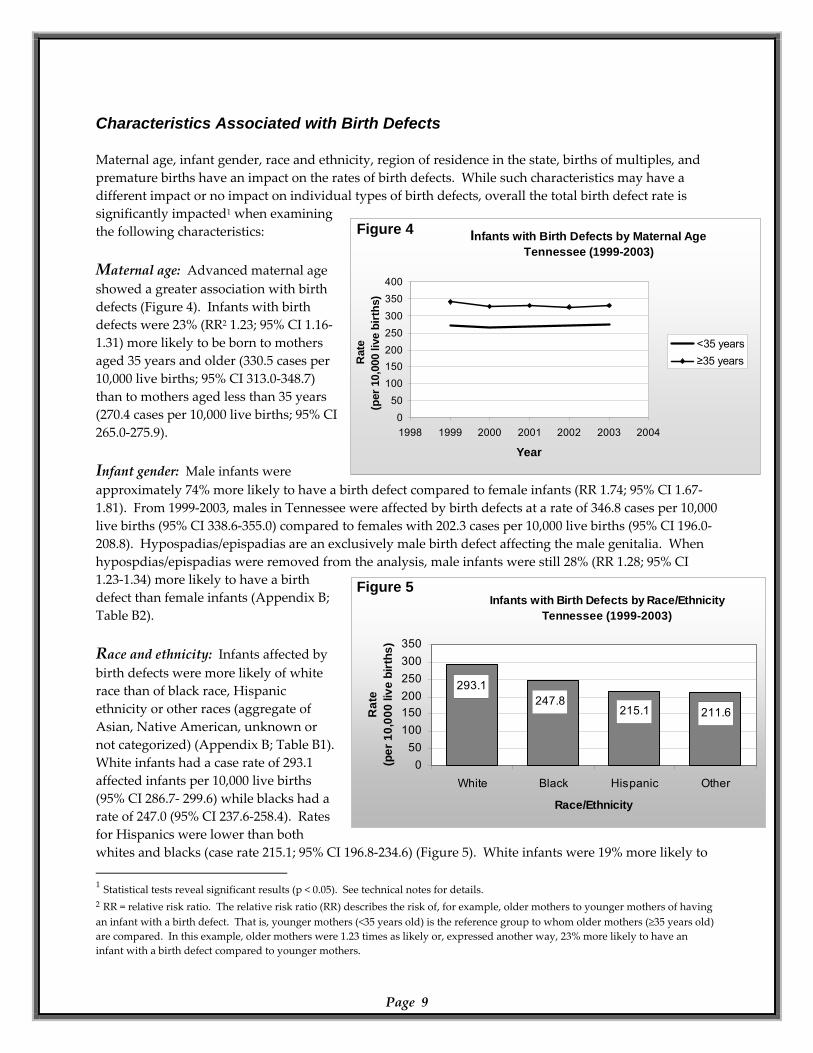
Characteristics Associated with Birth Defects
Infants with Birth Defects by Maternal AgeTennessee (1999-2003)
400
050
100150200250300350
1998 1999 2000 2001 2002 2003 2004
Year
Rat
e(p
er 1
0,00
0 liv
e bi
rths
)
<35 years≥35 years
Maternal age, infant gender, race and ethnicity, region of residence in the state, births of multiples, and premature births have an impact on the rates of birth defects. While such characteristics may have a different impact or no impact on individual types of birth defects, overall the total birth defect rate is significantly impacted1 when examining the following characteristics: Maternal age: Advanced maternal age showed a greater association with birth defects (Figure 4). Infants with birth defects were 23% (RR2 1.23; 95% CI 1.16‐1.31) more likely to be born to mothers aged 35 years and older (330.5 cases per 10,000 live births; 95% CI 313.0‐348.7) than to mothers aged less than 35 years (270.4 cases per 10,000 live births; 95% CI 265.0‐275.9).
Infants with Birth Defects by Race/EthnicityTennessee (1999-2003)
211.6215.1247.8
293.1
050
100150200250300350
White Black Hispanic Other
Race/Ethnicity
Rat
e(p
er 1
0,00
0 liv
e bi
rths
)
Infant gender: Male infants were approximately 74% more likely to have a birth defect compared to female infants (RR 1.74; 95% CI 1.67‐1.81). From 1999‐2003, males in Tennessee were affected by birth defects at a rate of 346.8 cases per 10,000 live births (95% CI 338.6‐355.0) compared to females with 202.3 cases per 10,000 live births (95% CI 196.0‐208.8). Hypospadias/epispadias are an exclusively male birth defect affecting the male genitalia. When hypospdias/epispadias were removed from the analysis, male infants were still 28% (RR 1.28; 95% CI 1.23‐1.34) more likely to have a birth defect than female infants (Appendix B; Table B2). Race and ethnicity: Infants affected by birth defects were more likely of white race than of black race, Hispanic ethnicity or other races (aggregate of Asian, Native American, unknown or not categorized) (Appendix B; Table B1). White infants had a case rate of 293.1 affected infants per 10,000 live births (95% CI 286.7‐ 299.6) while blacks had a rate of 247.0 (95% CI 237.6‐258.4). Rates for Hispanics were lower than both whites and blacks (case rate 215.1; 95% CI 196.8‐234.6) (Figure 5). White infants were 19% more likely to 1 Statistical tests reveal significant results (p < 0.05). See technical notes for details. 2 RR = relative risk ratio. The relative risk ratio (RR) describes the risk of, for example, older mothers to younger mothers of having an infant with a birth defect. That is, younger mothers (<35 years old) is the reference group to whom older mothers (≥35 years old) are compared. In this example, older mothers were 1.23 times as likely or, expressed another way, 23% more likely to have an infant with a birth defect compared to younger mothers.
Page 9
Figure 5
Figure 4
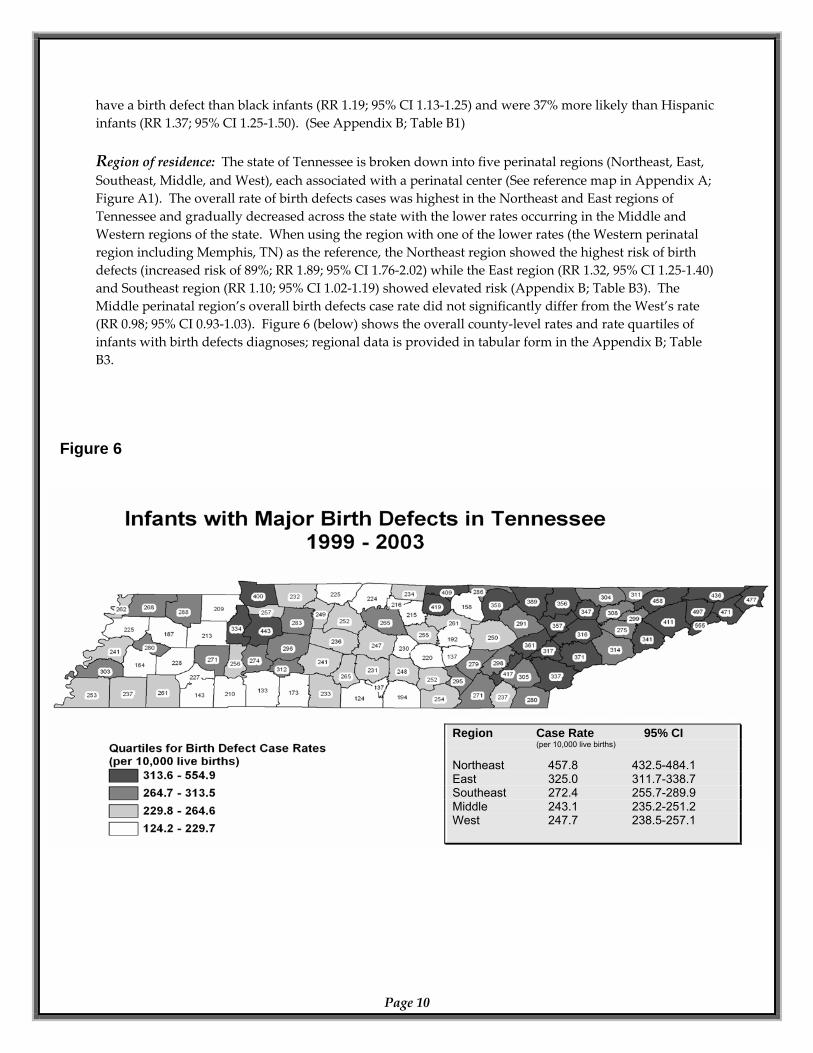
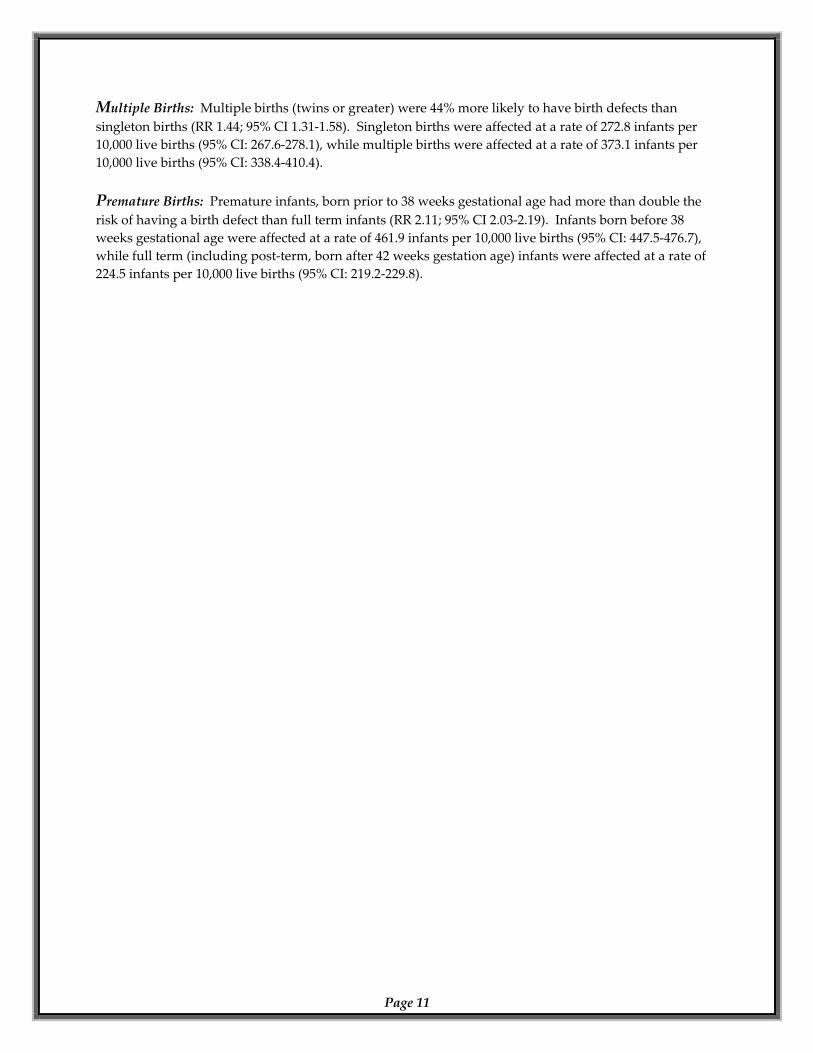
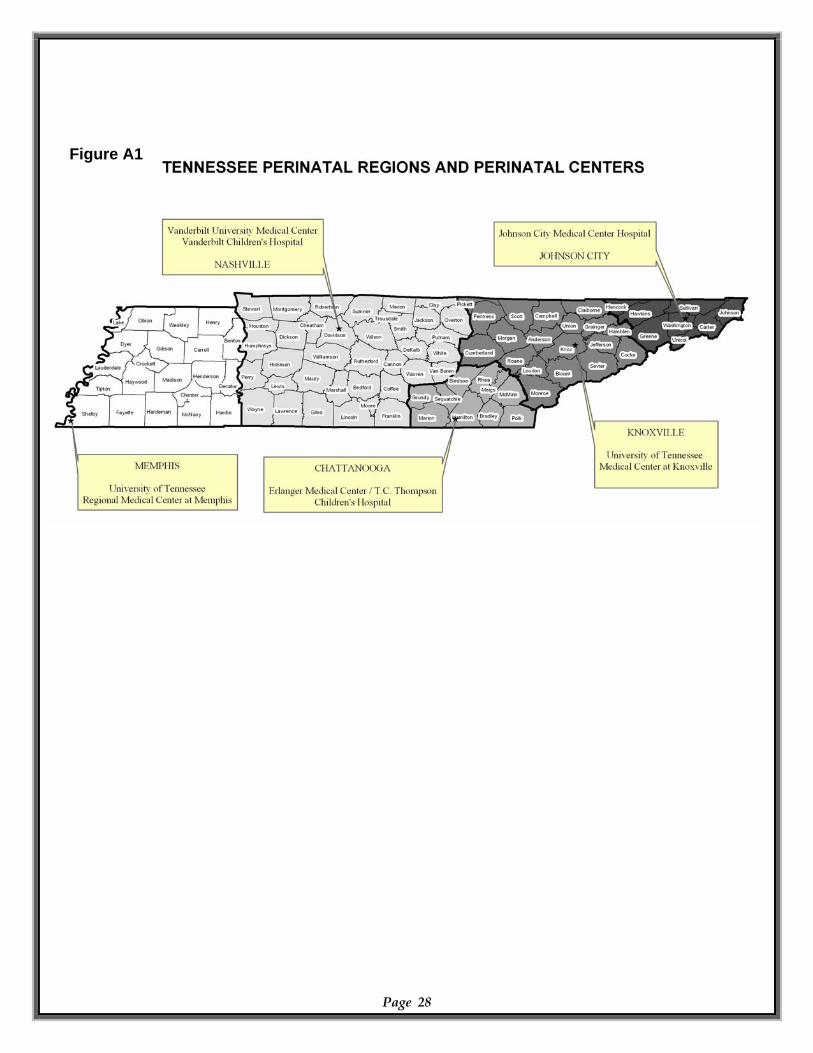
have a birth defect than black infants (RR 1.19; 95% CI 1.13‐1.25) and were 37% more likely than Hispanic infants (RR 1.37; 95% CI 1.25‐1.50). (See Appendix B; Table B1) Region of residence: The state of Tennessee is broken down into five perinatal regions (Northeast, East, Southeast, Middle, and West), each associated with a perinatal center (See reference map in Appendix A; Figure A1). The overall rate of birth defects cases was highest in the Northeast and East regions of Tennessee and gradually decreased across the state with the lower rates occurring in the Middle and Western regions of the state. When using the region with one of the lower rates (the Western perinatal region including Memphis, TN) as the reference, the Northeast region showed the highest risk of birth defects (increased risk of 89%; RR 1.89; 95% CI 1.76‐2.02) while the East region (RR 1.32, 95% CI 1.25‐1.40) and Southeast region (RR 1.10; 95% CI 1.02‐1.19) showed elevated risk (Appendix B; Table B3). The Middle perinatal region’s overall birth defects case rate did not significantly differ from the West’s rate (RR 0.98; 95% CI 0.93‐1.03). Figure 6 (below) shows the overall county‐level rates and rate quartiles of infants with birth defects diagnoses; regional data is provided in tabular form in the Appendix B; Table B3.
Page 10
Figure 6
Region Case Rate 95% CI (per 10,000 live births) Northeast 457.8 432.5-484.1 East 325.0 311.7-338.7 Southeast 272.4 255.7-289.9 Middle 243.1 235.2-251.2 West 247.7 238.5-257.1
Multiple Births: Multiple births (twins or greater) were 44% more likely to have birth defects than singleton births (RR 1.44; 95% CI 1.31‐1.58). Singleton births were affected at a rate of 272.8 infants per 10,000 live births (95% CI: 267.6‐278.1), while multiple births were affected at a rate of 373.1 infants per 10,000 live births (95% CI: 338.4‐410.4).
Page 11
Premature Births: Premature infants, born prior to 38 weeks gestational age had more than double the risk of having a birth defect than full term infants (RR 2.11; 95% CI 2.03‐2.19). Infants born before 38 weeks gestational age were affected at a rate of 461.9 infants per 10,000 live births (95% CI: 447.5‐476.7), while full term (including post‐term, born after 42 weeks gestation age) infants were affected at a rate of 224.5 infants per 10,000 live births (95% CI: 219.2‐229.8).
Neural Tube Defects
Neural tube defects (NTD) are serious congenital malformations of the central nervous system (comprising of the brain and spinal cord) in which the embryonic structure that forms the brain and spinal cord (i.e. the neural tube) fails to develop properly during the first four weeks of pregnancy, often before a woman knows she is pregnant. By definition, NTDs include: anencephaly, spina bifida, and encephalocele with spina bifida and anencephaly accounting for the majority. Since more than 80% of NTDs are anencephalus and spina bifida, the reporting standard is to count only anencephalus and spina bifida as NTD cases. In this report, NTDs are referring to and only including anencephalus and spina bifida. NTDs result in physical and neurological impairment, which are disabling and in some cases fatal. Those infants surviving with a NTD encounter numerous procedures and surgical interventions, an enormous financial and emotional burden in additional to life long physical disabilities; intellectual outcomes vary widely and depend on the severity of the defect. Anencephaly occurs when the cranial portion of the neural tube fails to close resulting with incomplete development of the brain. Infants with anencephalus are either still born or die shortly after birth. Spina bifida occurs when the neural tube fails to close along the spine with a vast majority of cases occurring in the lumbosacral region. The openings must be surgically repaired, usually within 24‐48 hours after birth. The level of impairment depends on where the neural tube fails to close; the closer the affected vertebrae of the spinal cord are to the head, the more significant the impairment. A majority of NTD affected pregnancies are suspected before the child is born by measuring the level of alpha‐fetoprotein (AFP) in the mother’s blood through a test called the “quad screen,” which is performed between 15‐18 weeks gestational age to test for NTDs as well as Down syndrome (Trisomy 21), Edward syndrome (Trisomy 18), and abdominal wall defects. If the AFP screen indicates a high risk of a NTD, then the mother will be referred for a detailed ultrasound and a further referral for genetic counseling may also be offered. A targeted, comprehensive, or Level II ultrasound is up to 90% effective at detecting major birth defects. An inadequate intake or abnormal metabolism of folate is a risk factor for NTDs. While mandatory grain fortification of folic acid in the United States in 1998 has reduced NTDs somewhat,4 research suggests if all women of child‐bearing age consumed 400 micrograms of folic acid every day, then rates of children born with an NTD would decrease by 50‐70%.5 With NTDs occurring within 28 days after conception and with most pregnancies unplanned, ALL women of child bearing age should take a daily vitamin containing 400 micrograms of folic acid, in addition to eating a balanced, healthy diet. With nearly two decades of research on folic acid, a large percentage of women continue to be unaware of this powerful prevention method.6,7
Page 12
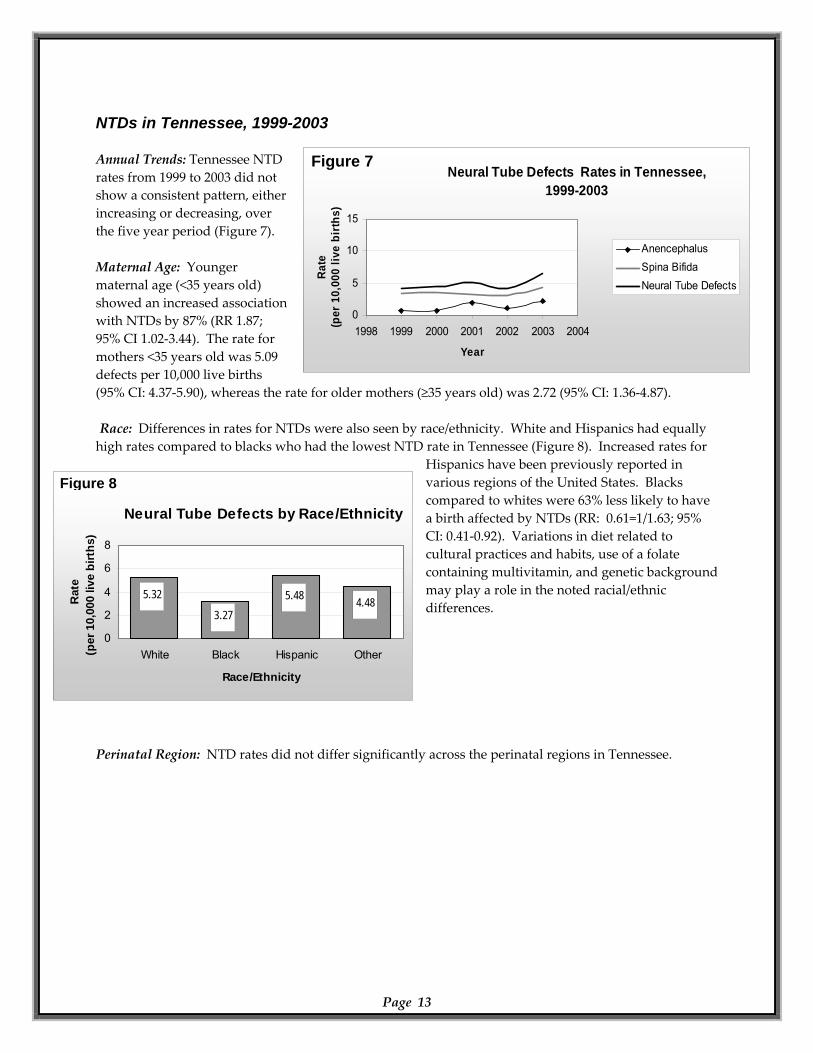
NTDs in Tennessee, 1999-2003 Annual Trends: Tennessee NTD rates from 1999 to 2003 did not show a consistent pattern, either increasing or decreasing, over the five year period (Figure 7).
Neural Tube Defects Rates in Tennessee,1999-2003
0
5
10
15
1998 1999 2000 2001 2002 2003 2004
Year
Rate
(p
er 1
0,00
0 liv
e bi
rths
)
AnencephalusSpina BifidaNeural Tube Defects
Maternal Age: Younger maternal age (<35 years old) showed an increased association with NTDs by 87% (RR 1.87; 95% CI 1.02‐3.44). The rate for mothers <35 years old was 5.09 defects per 10,000 live births (95% CI: 4.37‐5.90), whereas the rate for older mothers (≥35 years old) was 2.72 (95% CI: 1.36‐4.87).
Neural Tube Defects by Race/Ethnicity
5.32
3.275.48 4.48
0
2
4
6
8
White Black Hispanic Other
Race/Ethnicity
Rat
e(p
er 1
0,00
0 liv
e bi
rths
)
Race: Differences in rates for NTDs were also seen by race/ethnicity. White and Hispanics had equally high rates compared to blacks who had the lowest NTD rate in Tennessee (Figure 8). Increased rates for
Hispanics have been previously reported in various regions of the United States. Blacks compared to whites were 63% less likely to have a birth affected by NTDs (RR: 0.61=1/1.63; 95% CI: 0.41‐0.92). Variations in diet related to cultural practices and habits, use of a folate containing multivitamin, and genetic background may play a role in the noted racial/ethnic differences.
Perinatal Region: NTD rates did not differ significantly across the perinatal regions in Tennessee.
Page 13
Figure 7
Figure 8
Cardiovascular Defects
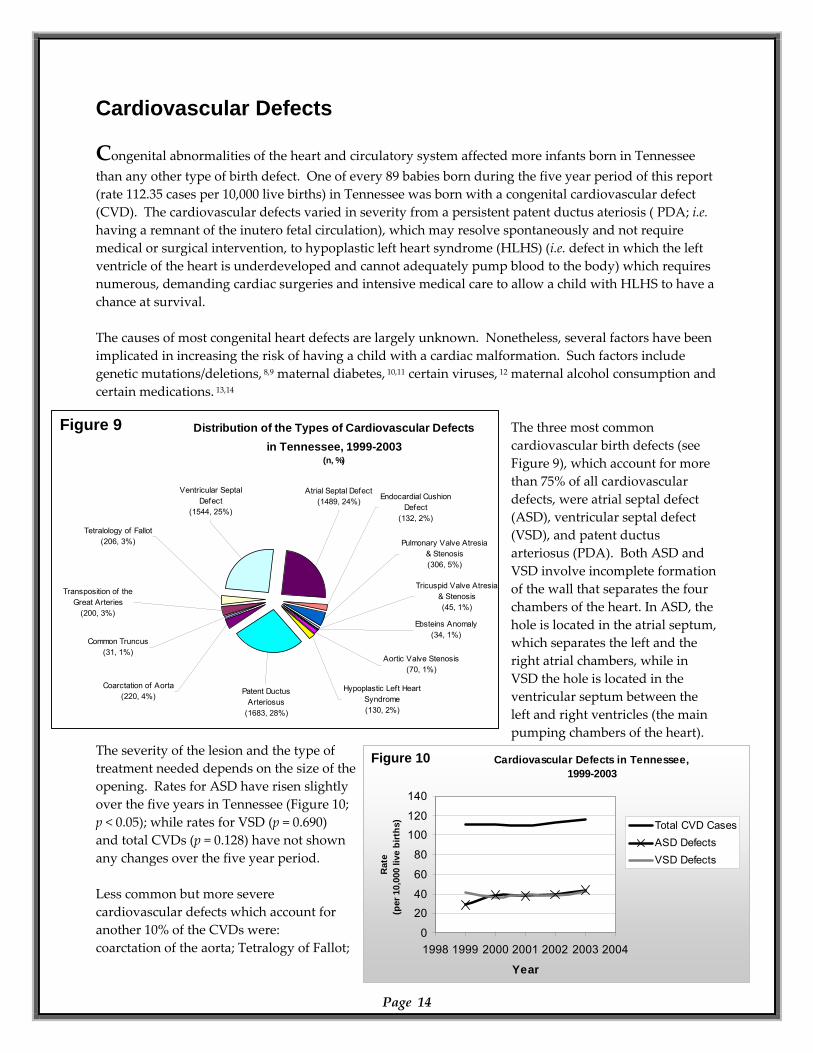
Congenital abnormalities of the heart and circulatory system affected more infants born in Tennessee than any other type of birth defect. One of every 89 babies born during the five year period of this report (rate 112.35 cases per 10,000 live births) in Tennessee was born with a congenital cardiovascular defect (CVD). The cardiovascular defects varied in severity from a persistent patent ductus ateriosis ( PDA; i.e. having a remnant of the inutero fetal circulation), which may resolve spontaneously and not require medical or surgical intervention, to hypoplastic left heart syndrome (HLHS) (i.e. defect in which the left ventricle of the heart is underdeveloped and cannot adequately pump blood to the body) which requires numerous, demanding cardiac surgeries and intensive medical care to allow a child with HLHS to have a chance at survival. The causes of most congenital heart defects are largely unknown. Nonetheless, several factors have been implicated in increasing the risk of having a child with a cardiac malformation. Such factors include genetic mutations/deletions, 8,9 maternal diabetes, 10,11 certain viruses, 12 maternal alcohol consumption and certain medications. 13,14
Cardiovascular Defects in Tennessee, 1999-2003
0
2040
60
80
100120
140
1998 1999 2000 2001 2002 2003 2004
Rat
e(p
er 1
0,00
0 liv
e bi
rths
) Total CVD CasesASD DefectsVSD Defects
Distribution of the Types of Cardiovascular Defectsin Tennessee, 1999-2003
(n, %)
Common Truncus(31, 1%)
Transposition of the Great Arteries
(200, 3%)
Tetralology of Fallot(206, 3%)
Coarctation of Aorta (220, 4%) Patent Ductus
Arteriosus(1683, 28%)
Ebsteins Anomaly(34, 1%)
Aortic Valve Stenosis(70, 1%)
Hypoplastic Left Heart Syndrome(130, 2%)
Pulmonary Valve Atresia & Stenosis(306, 5%)
Tricuspid Valve Atresia & Stenosis(45, 1%)
Endocardial Cushion Defect
(132, 2%)
Atrial Septal Defect(1489, 24%)
Ventricular Septal Defect
(1544, 25%)
The three most common cardiovascular birth defects (see Figure 9), which account for more than 75% of all cardiovascular defects, were atrial septal defect (ASD), ventricular septal defect (VSD), and patent ductus arteriosus (PDA). Both ASD and VSD involve incomplete formation of the wall that separates the four chambers of the heart. In ASD, the hole is located in the atrial septum, which separates the left and the right atrial chambers, while in VSD the hole is located in the ventricular septum between the left and right ventricles (the main pumping chambers of the heart).
The severity of the lesion and the type of treatment needed depends on the size of the opening. Rates for ASD have risen slightly over the five years in Tennessee (Figure 10; p < 0.05); while rates for VSD (p = 0.690) and total CVDs (p = 0.128) have not shown any changes over the five year period. Less common but more severe cardiovascular defects which account for another 10% of the CVDs were: coarctation of the aorta; Tetralogy of Fallot;
Page 14
Year
Figure 9
Figure 10
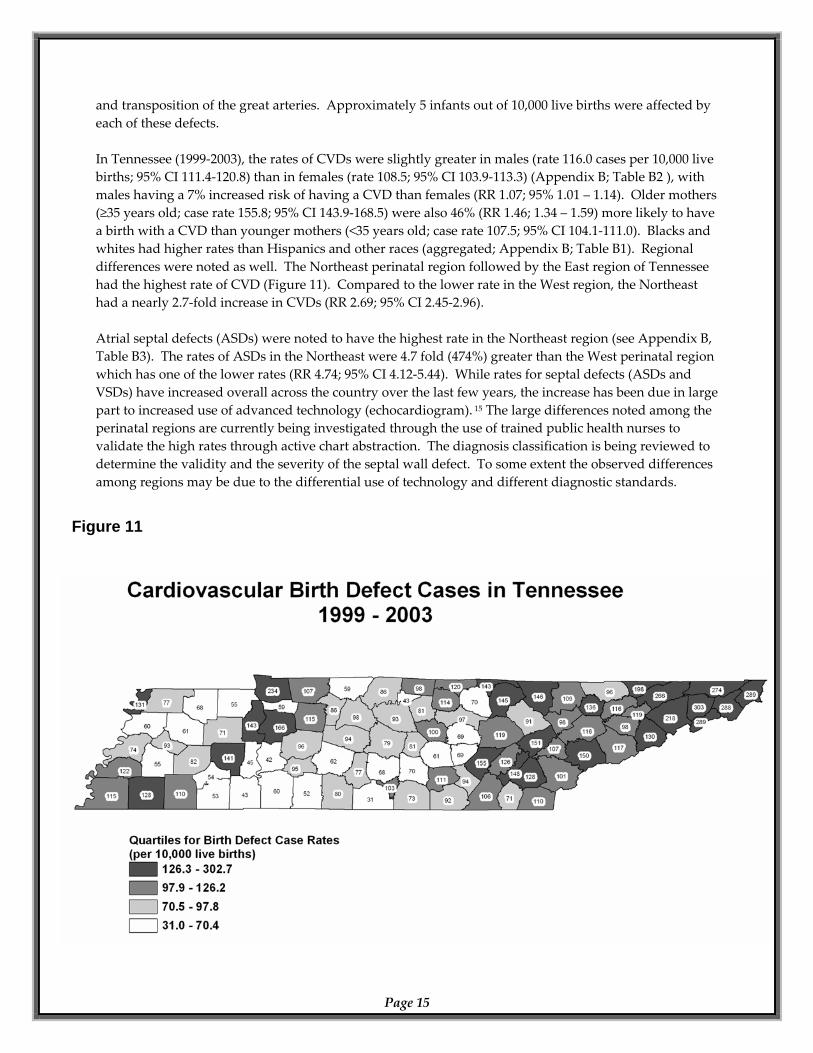
and transposition of the great arteries. Approximately 5 infants out of 10,000 live births were affected by each of these defects. In Tennessee (1999‐2003), the rates of CVDs were slightly greater in males (rate 116.0 cases per 10,000 live births; 95% CI 111.4‐120.8) than in females (rate 108.5; 95% CI 103.9‐113.3) (Appendix B; Table B2 ), with males having a 7% increased risk of having a CVD than females (RR 1.07; 95% 1.01 – 1.14). Older mothers (≥35 years old; case rate 155.8; 95% CI 143.9‐168.5) were also 46% (RR 1.46; 1.34 – 1.59) more likely to have a birth with a CVD than younger mothers (<35 years old; case rate 107.5; 95% CI 104.1‐111.0). Blacks and whites had higher rates than Hispanics and other races (aggregated; Appendix B; Table B1). Regional differences were noted as well. The Northeast perinatal region followed by the East region of Tennessee had the highest rate of CVD (Figure 11). Compared to the lower rate in the West region, the Northeast had a nearly 2.7‐fold increase in CVDs (RR 2.69; 95% CI 2.45‐2.96). Atrial septal defects (ASDs) were noted to have the highest rate in the Northeast region (see Appendix B, Table B3). The rates of ASDs in the Northeast were 4.7 fold (474%) greater than the West perinatal region which has one of the lower rates (RR 4.74; 95% CI 4.12‐5.44). While rates for septal defects (ASDs and VSDs) have increased overall across the country over the last few years, the increase has been due in large part to increased use of advanced technology (echocardiogram). 15 The large differences noted among the perinatal regions are currently being investigated through the use of trained public health nurses to validate the high rates through active chart abstraction. The diagnosis classification is being reviewed to determine the validity and the severity of the septal wall defect. To some extent the observed differences among regions may be due to the differential use of technology and different diagnostic standards.
Page 15
Figure 11
Gastroschisis
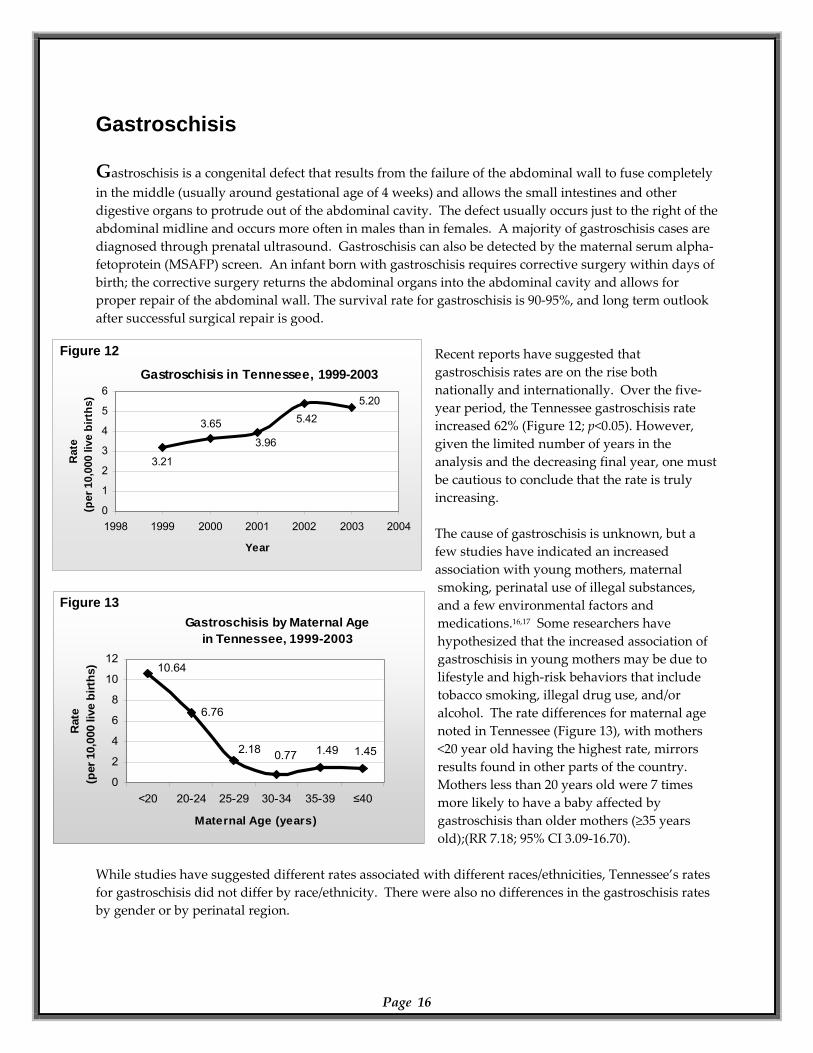
Gastroschisis is a congenital defect that results from the failure of the abdominal wall to fuse completely in the middle (usually around gestational age of 4 weeks) and allows the small intestines and other digestive organs to protrude out of the abdominal cavity. The defect usually occurs just to the right of the abdominal midline and occurs more often in males than in females. A majority of gastroschisis cases are diagnosed through prenatal ultrasound. Gastroschisis can also be detected by the maternal serum alpha‐fetoprotein (MSAFP) screen. An infant born with gastroschisis requires corrective surgery within days of birth; the corrective surgery returns the abdominal organs into the abdominal cavity and allows for proper repair of the abdominal wall. The survival rate for gastroschisis is 90‐95%, and long term outlook after successful surgical repair is good.
Gastroschisis in Tennessee, 1999-20036) 5.20
5.42
3.96
3.65
3.21
0
1
2
3
4
5
1998 1999 2000 2001 2002 2003 2004
Year
Rat
e(p
er 1
0,00
0 liv
e bi
rths
Recent reports have suggested that gastroschisis rates are on the rise both nationally and internationally. Over the five‐year period, the Tennessee gastroschisis rate increased 62% (Figure 12; p<0.05). However, given the limited number of years in the analysis and the decreasing final year, one must be cautious to conclude that the rate is truly increasing. The cause of gastroschisis is unknown, but a few studies have indicated an increased association with young mothers, maternal smoking, perinatal use of illegal substances, and a few environmental factors and medications.16,17 Some researchers have hypothesized that the increased association of gastroschisis in young mothers may be due to lifestyle and high‐risk behaviors that include tobacco smoking, illegal drug use, and/or alcohol. The rate differences for maternal age noted in Tennessee (Figure 13), with mothers <20 year old having the highest rate, mirrors results found in other parts of the country. Mothers less than 20 years old were 7 times more likely to have a baby affected by gastroschisis than older mothers (≥35 years old);(RR 7.18; 95% CI 3.09‐16.70).
Gastroschisis by Maternal Agein Tennessee, 1999-2003
1.45
6.76
10.64
6
8
10
12
≤40
Rat
e0
live
birt
hs)
1.490.772.18
0
2
4
<20 20-24 25-29 30-34 35-39
Maternal Age (years)
(per
10,
00
While studies have suggested different rates associated with different races/ethnicities, Tennessee’s rates for gastroschisis did not differ by race/ethnicity. There were also no differences in the gastroschisis rates by gender or by perinatal region.
Page 16
Figure 12
Figure 13
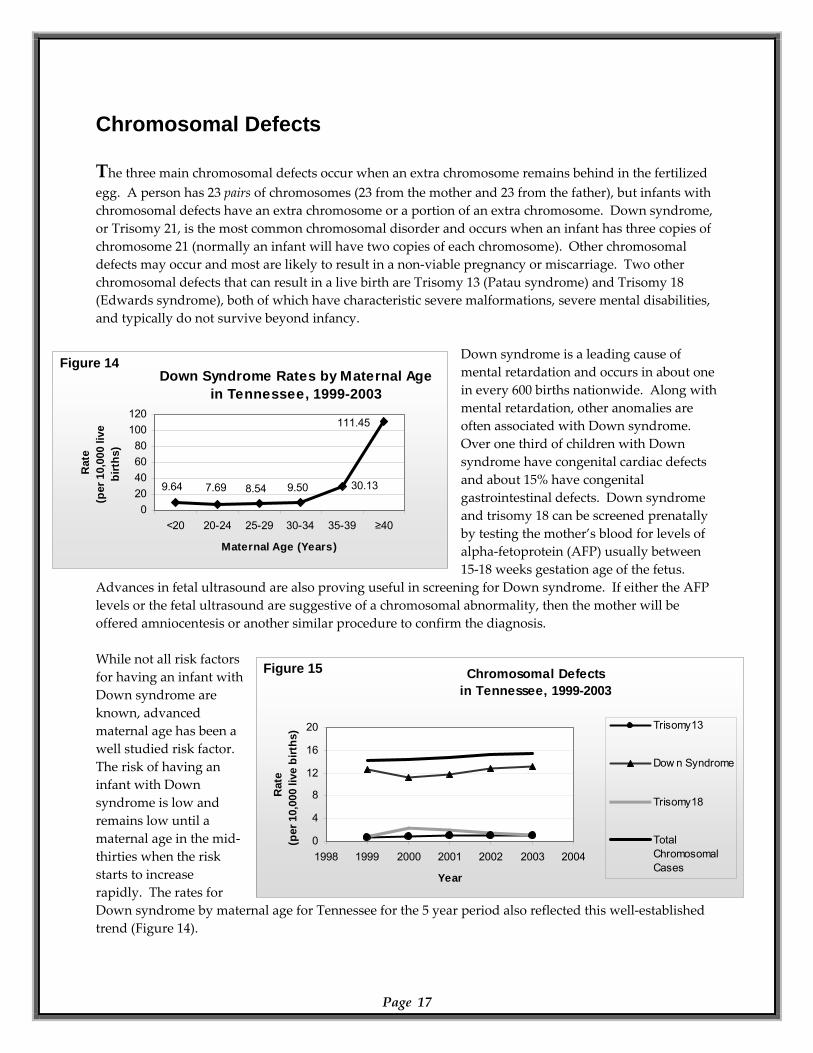
Chromosomal Defects
The three main chromosomal defects occur when an extra chromosome remains behind in the fertilized egg. A person has 23 pairs of chromosomes (23 from the mother and 23 from the father), but infants with chromosomal defects have an extra chromosome or a portion of an extra chromosome. Down syndrome, or Trisomy 21, is the most common chromosomal disorder and occurs when an infant has three copies of chromosome 21 (normally an infant will have two copies of each chromosome). Other chromosomal defects may occur and most are likely to result in a non‐viable pregnancy or miscarriage. Two other chromosomal defects that can result in a live birth are Trisomy 13 (Patau syndrome) and Trisomy 18 (Edwards syndrome), both of which have characteristic severe malformations, severe mental disabilities, and typically do not survive beyond infancy.
Chromosomal Defectsin Tennessee, 1999-2003
0
4
8
12
16
20
1998 1999 2000 2001 2002 2003 2004
Year
Rat
e(p
er 1
0,00
0 liv
e bi
rths
) Trisomy13
Dow n Syndrome
Trisomy18
TotalChromoCases
somal
Down Syndrome Rates by Maternal Agein Tennessee, 1999-2003
111.45
30.139.508.547.699.64
020406080
100120
<20 20-24 25-29 30-34 35-39 ≥40
Maternal Age (Years)
Rat
e(p
er 1
0,00
0 liv
e bi
rths
)
Down syndrome is a leading cause of mental retardation and occurs in about one in every 600 births nationwide. Along with mental retardation, other anomalies are often associated with Down syndrome. Over one third of children with Down syndrome have congenital cardiac defects and about 15% have congenital gastrointestinal defects. Down syndrome and trisomy 18 can be screened prenatally by testing the mother’s blood for levels of alpha‐fetoprotein (AFP) usually between 15‐18 weeks gestation age of the fetus.
Advances in fetal ultrasound are also proving useful in screening for Down syndrome. If either the AFP levels or the fetal ultrasound are suggestive of a chromosomal abnormality, then the mother will be offered amniocentesis or another similar procedure to confirm the diagnosis. While not all risk factors for having an infant with Down syndrome are known, advanced maternal age has been a well studied risk factor. The risk of having an infant with Down syndrome is low and remains low until a maternal age in the mid‐thirties when the risk starts to increase rapidly. The rates for Down syndrome by maternal age for Tennessee for the 5 year period also reflected this well‐established trend (Figure 14).
Page 17
Figure 14
Figure 15
The prevalence of Down syndrome was not changed over the five years studied (Figure 15). Collectively, all chromosomal defects tracked by the registry in Tennessee showed a very slight increase over the five year period (p < 0.05). No differences in rates for either Down syndrome or all of the chromosomal defects were found when accounting for infant gender, race/ethnicity, or perinatal region.
Page 18
Prevention Education
Prevention is the best strategy in public health. A woman can reduce her risk of delivering a baby born with a birth defect or other adverse outcome by taking precautions before (i.e. preconception care) and during pregnancy. The best time to start preventing pregnancy related complications occur even before a woman becomes pregnant (preconception). Most of the baby’s vital organs and systems have been formed in the first four to eight weeks of gestation and before a woman realizes she is pregnant. A majority of birth defects often occur during this four to eight week period, and the public health and medical community have begun to learn of a few simple actions that women can do to improve the health of their children; but many of these actions are only most effective if started prior to becoming pregnant.18 While no guarantee exists that one will have a healthy baby, the following preventive measures can improve a woman’s chance of having a healthy baby. 18,19
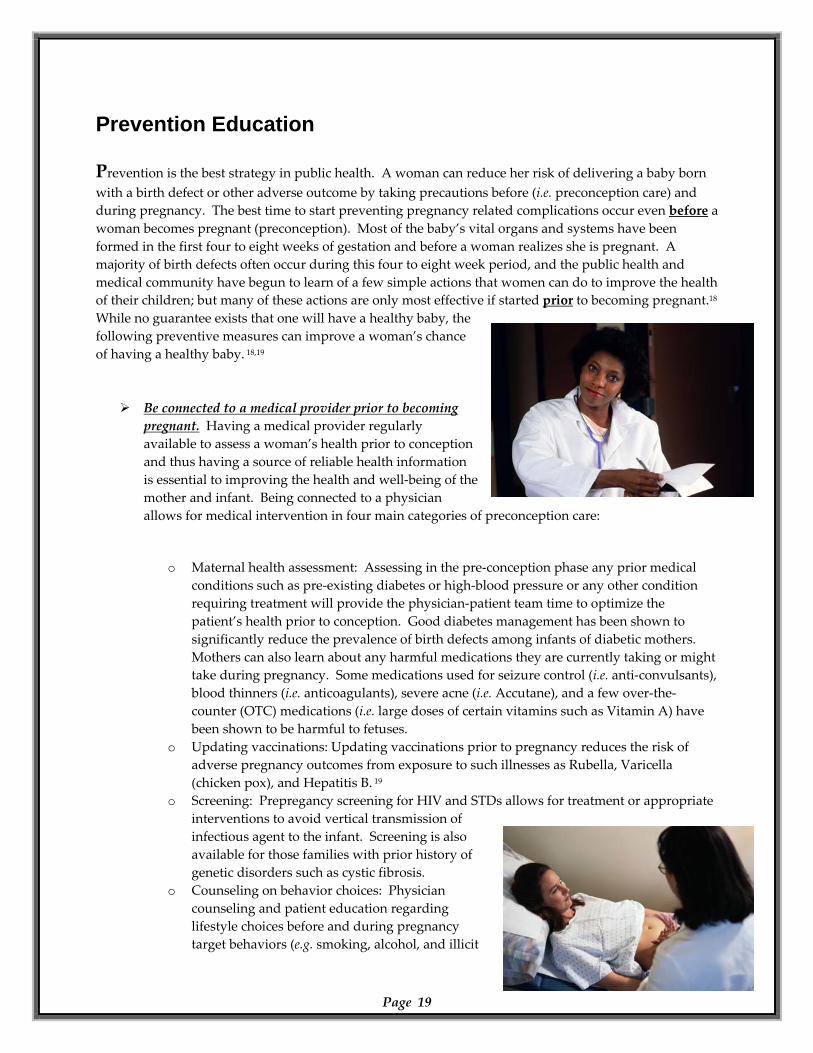
Be connected to a medical provider prior to becoming pregnant. Having a medical provider regularly available to assess a woman’s health prior to conception and thus having a source of reliable health information is essential to improving the health and well‐being of the mother and infant. Being connected to a physician allows for medical intervention in four main categories of preconception care:
o Maternal health assessment: Assessing in the pre‐conception phase any prior medical conditions such as pre‐existing diabetes or high‐blood pressure or any other condition requiring treatment will provide the physician‐patient team time to optimize the patient’s health prior to conception. Good diabetes management has been shown to significantly reduce the prevalence of birth defects among infants of diabetic mothers. Mothers can also learn about any harmful medications they are currently taking or might take during pregnancy. Some medications used for seizure control (i.e. anti‐convulsants), blood thinners (i.e. anticoagulants), severe acne (i.e. Accutane), and a few over‐the‐counter (OTC) medications (i.e. large doses of certain vitamins such as Vitamin A) have been shown to be harmful to fetuses.
o Updating vaccinations: Updating vaccinations prior to pregnancy reduces the risk of adverse pregnancy outcomes from exposure to such illnesses as Rubella, Varicella (chicken pox), and Hepatitis B. 19
o Screening: Prepregancy screening for HIV and STDs allows for treatment or appropriate interventions to avoid vertical transmission of infectious agent to the infant. Screening is also available for those families with prior history of genetic disorders such as cystic fibrosis.
Page 19
o Counseling on behavior choices: Physician counseling and patient education regarding lifestyle choices before and during pregnancy target behaviors (e.g. smoking, alcohol, and illicit
drug use) associated with increased health risks for the fetus.
Consume at least 400 micrograms of folic acid daily. Studies have shown that consuming a daily vitamin with 400 micrograms of folic acid prior to becoming pregnant and during pregnancy can greatly reduce the risk of neural tube defects. Consuming folic acid may also be able to prevent other birth defects such as cleft lip/cleft palate and certain cardiac defects.
Eat a healthy, balanced diet. A well‐balanced diet and multivitamin will provide essential nutrients to the mother and her growing fetus. Having a balanced diet allows for many nutrients to be available in several bio‐available formats, allowing for greater bio‐availability (i.e. access of nutrients to the body in forms that are useful to the body).
Exercise regularly. Regular exercise allows for increased strength for the mother and often reduces the normal side‐effects of pregnancy such as back pain due to increased mass in the abdominal area and shortness of breath due to decreased lung volume as the fetus pushes up on the mother’s diaphragm.
Be at an ideal body weight prior to pregnancy. Women who are significantly underweight or overweight may encounter more problems during pregnancy. Women who are overweight prior to conception have an increased risk of high blood pressure and diabetes during pregnancy. If underweight prior to conception, a woman may have an increased risk of delivering a premature infant.
Avoid smoking. In general, all people should avoid smoking or second‐hand smoke as much as possible. Avoidance of smoke should continue during and after pregnancy. Smoking during pregnancy is associated with an increased risk of spontaneous abortion (miscarriage) and with still birth as well as SIDS (sudden infant death syndrome), low birth weight, premature birth, and is potentially associated with increased risk of certain birth defects. Second‐hand smoke exposure can lead to significant respiratory complications in infants and small children.
Avoid alcohol. Alcohol consumption is the leading cause of preventable mental retardation among infants. The most severe effects of alcohol are seen with Fetal Alcohol Syndrome (FAS) where the infant has physical, mental, and behavioral problems. While the exact threshold of alcohol exposure that leads to birth defects is unknown presently and may depend on many unknown maternal factors, the current recommendations are to avoid alcohol consumption during pregnancy and to avoid binge drinking and/or frequent drinking prior to pregnancy.
Page 20
Avoid illicit drugs. Illicit drugs such as cocaine, heroin, marijuana and others can seriously harm a mother and her unborn fetus. Use of intravenous drugs carries the risk of infections that could be passed from mother to infant such as HIV and/or Hepatitis C (and/or Hepatitis B if not previously successfully immunized). Cocaine is associated with placental abruption (i.e. when the placenta separates from the uterine wall) and is usually the reason for late term vaginal bleeding; placental abruption can lead to significant morbidity and/or mortality for both mother and fetus.
Limit exposure to environmental hazards.
o Chemicals and toxic substances should be avoided during pregnancy. o Pregnant women should also avoid changing cat litter to prevent Toxoplasma infection
(toxoplasmosis) to the fetus; cats are known hosts to the parasite and can transmit the parasite from cat feces through oral ingestion by humans who fail to wash hands properly. The parasite can also be found and cause infection by consumption of raw and undercooked meats. Toxoplasmosis during pregnancy can result in a congenital infection in the fetus and lead to visual impairment, learning disabilities, and/or mental retardation. Toxoplasma infection in a healthy child/adult individual usually is benign.
o Listeriosis is another infection that is usually not serious in the healthy individual but can be quite serious for pregnant woman (particularly for the fetus) and for immunocompromised people (i.e. those whose immune system is not at full strength due to illness or due to medical treatment). Maternal infection has been associated with preterm labor, spontaneous abortion (miscarriage), and fetal death. Food born transmission usually causes sporadic outbreaks, and it is for this reason that pregnant women are instructed to avoid soft cheeses (i.e. Brie, feta, Camembert, blue‐veined cheese, and Mexican queso cheese); unpasterized milk products; delicatessen meats/cheeses; and refrigerated meat spreads such as paté.19
Technical Notes
Data was analyzed using SAS version 9.1 (SAS Institute). Prevalence is calculated as the number of birth defect cases born at a point in time per 10,000 live births. Confidence intervals for 100 or less cases are exact Poisson; otherwise, confidence intervals are based on the normal approximation. Categorized variables were compared and tested for statistical significance using Chi‐square tests and logistic regression analysis. Time trend analyses were done using linear regression.
Page 21
References:
1. Yoon PW, Olney RS, Khoury MJ, Sappenfield WM, Chavez GF, Taylor D. Contribution of birth defects and genetic diseases to pediatric hospitalizations. A population‐based study. 1997. Arch Pediatr Adolesc Med; Nov; 151(11):1082‐3.
2. Center for Disease Control and Prevention. Economic costs of birth defects and cerebral palsy – United States, 1992. MMWR, 1995; 44(37):694‐9.
3. Cragan JD, Khoury MJ. Effect of prenatal diagnosis on epidemiologic studies of birth defects. 2000. Epidemiology; Nov., Vol. 11, No. 6: 695‐9.
4. Centers for Disease Control and Prevention. Spina bifida and anencephaly before and after folic acid mandate – United States, 1995‐1996 and 1999‐2000. MMWR, 2004; 53:362‐5.
5. Czeizel AE, Dudas I. Prevention of the first occurrence of neural tube defects by periconceptional vitamin supplementation. 1992. N Engl J Med; 327:1832‐5.
6. Center for Disease Control and Prevention. Use of vitamins containing folic acid among women of childbearing age – United States, 2004. MMWR, 2004; 53(36):847‐50.
7. Canfield MA, Przbyla SM, Case AP, Ramadhani T, Suarez L, Dyer J. Folic acid awareness and supplementation among Texas women of childbearing age. 2006. Prev Med; Jul;43(1):27‐30.
8. Goldmuntz E, Clark BJ, Mitchell LE, Jawad AF, Cuneo BF, Reed L, McDonald‐McGinn D, Chien P Feuer J, Zackai EH, Emanuel BS, Driscoll DA. Frequency of 22q11 deletions in patients with conotruncal defects. 1998. J Am Coll Cardiol; Aug; 32(2):492‐8.
9. Boudjemline Y, Fermont L, Le Bidois J, Lyonnet S, Sidi D, Bonnet D. Prevalence of 22q11 deletion in fetuses with conotruncal cardiac defects: A 6‐year prospective study. 2001. J Pediatr; 138:520‐524.
10. Becerra JE, Khoury MJ, Cordero JF, Erickson JD. Diabetes mellitus during pregnancy and the risks for specific birth defects: a population‐based case‐control study. 1990. Pediatrics; Jan;85(1):1‐9.
11. Loffredo CA, Wilson PD, Ferencz C. Maternal diabetes: an independent risk factor for major cardiovascular malformations with increased mortality of affected infants. 2001. Teratology; Aug; 64(2):98‐106.
12. Freij BJ, South MA, Sever JL. Maternal rubella and the congenital rubella syndrome. 1988. Clin Perinatol. Jun;15(2):247‐57.
13. Ferencz C, Loffredo CA, Correa‐Villasenor A, Wilson PD, eds. 1997. Genetic and Environmental Risk Factors of Major Cardiovascular Malformations: The Baltimore‐Washington Infant Study 1981‐1989. Armonk, NY: Fuytura Publishing Co., Inc.
14. Mone S, Gillman M, Miller T, Herman E, Lipshultz S. Effects of environmental exposures on the cardiovascular system: prenatal period through adolescence. 2004. Pediatrics. 113(4).
15. Martin GR, Perry LW, Ferencz C. Increased prevalence of ventrical septal defect: epidemic or improved diagnosis. 1989. Pediatrics. Feb;83(2):200‐3.
16. Werler MM, Mitchell AA, Shapiro S. Demographic, reproductive, medical, and environmental factors in relation to gastroschisis. 1992. Teratology. Apr;45(4):353‐60.
17. Torfs CP, Katz EA, Bateson TF, Lam PK, Curry CJ. Maternal medications and environmental exposures as risk factors for gastroschisis. 1996. Teratology. Aug;54(2):84‐92.
18. Center for Disease Control and Prevention. Recommendations to Improve Preconception Health and Health Care – United States. MMWR, 2006; 55(RR‐6).
Page 22
19. Pickering LK, ed. Red Book: 2006 Report of the Committee on Infectious Diseases. 27th ed. Elk Grove Village, IL: American Academy of Peditarics; 2006.

Glossary of Terms
Agenesis Absence of part(s) of the body. Lack of development or failure to develop part(s) of the body.
Alpha-fetoprotein A protein produced by the fetus during
gestation. The level of this protein can be measured during the pregnancy. The level of this protein is elevated in pregnancies with neural tube defects and may be decreased in pregnancies with Down syndrome.
Amniocentesis A method of prenatal diagnosis which a small
amount of amniotic fluid is withdrawn to obtain fetal cells, which can be tested for the presence of some genetic diseases.
Anencephalus Congenital absence of the skull, with cerebral
hemispheres completely missing or reduced to small masses attached to the base of the skull. Anencephaly is not compatible with life.
Aniridia The complete absence of the iris of the eye or a
defect of the iris. Anophthalmia A developmental defect characterized by
complete absence of the eyes, or by the presence of vestigial eyes.
Anotia A congenital absence of one or both ears. Aortic valve stenosis
A cardiac anomaly characterized by a narrowing or stricture of the aortic valve.
Aplasia Absence of a tissue or organ due to lack of cell
proliferation. Atresia Absence or closure of a normal opening. Atrial septal defect A congenital cardiac malformation in which
there are one or several openings in the atrial septum (wall between the right and left atria). Most common type is called ostium secundum defect.
Biliary atresia A congenital absence or underdevelopment of
one or more of the ducts in the biliary tract. Bladder exstrophy Incomplete closure of the anterior wall of the
bladder and the abdominal cavity. The upper urinary tract is generally normal. Often associated with anorectal and genital malformations.
Congenital cataract An opacity (clouding) of the lens of the eye that
has its origin prenatally. Choanal atresia or stenosis
A congenital anomaly in which a bony or membranous formation blocks the passageway between the nose and the pharynx.
Chromosome Threadlike structure in cells that individual
genes are arranged along.
Chromosome abnormalities
A major group of genetic diseases in which alterations of chromosome number or structure occur and are observable by microscope.
Cleft lip The congenital failure of the fetal components of
the lip to fuse or join, forming a groove or fissure in the lip. Infants with this condition can have difficulty feeding and may use assistive devices for feeding. This condition is corrected when the infant can tolerate surgery.
Cleft palate The congenital failure of the palate to fuse
properly forming a grooved depression or fissure in the roof of the mouth. This defect varies in degree of severity. The fissure can extend into the hard and soft palate and into the nasal cavities. Infants with this condition have difficulty feeding, and may use assistive devices for feeding. Surgical correction is begun as soon as possible. Children with cleft palates are at high risk for hearing problems due to ear infections.
Coarctation of the aorta
Localized narrowing of the aorta. This condition can vary from mild to severe.
Common truncus arteriosus
A congenital heart defect in which the common arterial trunk fails to divide into pulmonary artery and aorta.
Confidence interval (95%)
The interval that contains the true prevalence (which can only be estimated) 95% of the time.
Congenital Existing at or dating from birth although the
defect may not be recognized at the time of birth.
Congenital hip dislocation
Location of the head of the femur (bone of the upper leg) outside its normal location in the cup-shaped cavity formed by the hip bones (acetabulum).
Diaphragmatic hernia
A failure of the diaphragm to form completely, leaving a hole. Abdominal organs can protrude through the hole into the chest cavity and interfere with development of the heart and lungs. Usually life-threatening and requires emergent surgery.
Down syndrome (Trisomy 21)
The chromosomal abnormality characterized by an extra copy of chromosome 21. In rare cases this syndrome is caused by translocation. Down syndrome is characterized by moderate to severe retardation, sloping forehead, small ear canals, flat-bridge of the nose and short fingers and toes. Many infants have congenital heart disease.
Dysgenesis Anomalous or disorganized formation of an
organ.
Page 23
Dysplasia Disorganized cell structure or arrangement within a tissue or organ.
Page 24
Ebstein anomaly A congenital heart defect in which the tricuspid valve is displaced downward into the right ventricle.
Edwards syndrome See Trisomy 18. Embryonic period The first eight weeks after fertilization, during which
most, but not all, organs are formed. Encephalocele Herniation of the brain through a defect in the skull. Endocardial cushion defect
In the complete form, a septal defect involving both the upper chambers (atria, atrial septal defect) and lower chambers (ventricles, ventricular septal defect) such that there is a single large atrioventricular septal defect. There are incomplete forms as well.
Epispadias Displacement of the opening of the urethra
(urethral meatus) dorsally and proximally (on top and closer to the body) in relation to the tip of the glans of the penis.
Esophageal stenosis or atresia
A narrowing or incomplete formation of the esophagus. Usually a surgical emergency. Frequently associated with a Tracheoesophageal Fistula.
Extremely low birth weight
Birth weight less than 1,000 grams, regardless of gestational age.
Fetal alcohol syndrome
A constellation of physical abnormalities (including characteristic abnormal facial features and growth retardation), and problems of behavior and cognition in children born to mothers who drank alcohol during pregnancy.
Fetal death (stillborn)
Death prior to complete expulsion or extraction of an infant or fetus of 500 grams or more, or, in absence of weight, of 22 weeks’ gestation or greater; death is indicated by the fact that, after expulsion or extraction, the fetus does not breathe or show any other evidence of life, such as beating of the heart, pulsation of the umbilical cord or definite movement of voluntary muscles (68-3-102).
Fetal period The period from the ninth week after fertilization
through delivery. Fetal ultrasound A diagnostic examination of the fetus using
ultrasound (sound waves at a frequency above what is detectable to human hearing).
Fistula An abnormal passage from an internal organ to the
body surface or between two internal organs or structures.
Folic acid deficiency
A lack of folic acid in the mother’s diet which may lead to an increased risk for neural tube defects. Current recommendations from the March of Dimes indicate that women who are or may become pregnant should take a folic acid supplement to decrease the risk of neural tube defect.
Gastroschisis A congenital opening of the abdominal wall with
protrusion of the intestines. This condition is surgically treated.
Genetic counseling The delivery of information about the risks, natural
history, and management of genetic diseases to patients and/or their families.
Hirschsprung’s disease
The congenital absence of autonomic ganglia (nerves controlling involuntary and reflexive movement) in the muscles of the colon. This results in immobility of the intestines and may cause obstruction or stretching of the intestines. This condition is repaired surgically in early childhood by the removal of the affected portion of the intestine.
Holocephalus The abnormal accumulation of fluid within the
spaces of the brain. Hydrocephalus The abnormal accumulation of fluid within the skull. Hyperplasia Overgrowth characterized by an increase in the
number of cells of tissue. Hypoplasia A condition of arrested development in which an
organ or part remains below the normal size or in an immature state.
Hypoplastic left heart syndrome
Atresia, or a marked hypoplasia, of the aortic valve, atresia or marked hypoplasia for the mitral valve, with hypoplasia of the ascending aorta and underdevelopment of the left ventricle.
Hypospadias A congenital defect in which the urinary meatus
(urinary outlet) is on the underside of the penis or on the perineum (area between the genitals and anus). The urinary sphincters are not defective so incontinence does not occur. The condition may be surgically corrected if needed for cosmetic, urologic, or reproductive reasons.
Infant death Death of a live-born infant before 12 months of
age. Live birth Spontaneous delivery of an infant that exhibits
signs of life, including a heartbeat, spontaneous breathing, or movement of voluntary muscles. Transient cardiac contractions and fleeting respiratory efforts or gasps are not necessarily considered signs of life by all programs.
Lower limb reduction defects
The congenital absence of a portion of the lower limb. There are two general types of defect, transverse and longitudinal. Transverse defects appear like amputations, or like missing segments of the limb. Longitudinal defects are missing rays of the limb (for example, a missing tibia and great toe).
Low birth weight Birth weight less than 2,500 grams, regardless of
gestational age. Malformation A primary morphologic defect resulting from an
abnormal developmental process.
Maternal serum screening
A diagnostic method that examines the mother’s blood serum for indicators of anomalies in the process of fetal development.
Mental retardation A condition of below average intellectual ability (IQ
less than 70) that is present from birth or infancy. Microcephaly Congenital smallness of the head, with
corresponding smallness of the brain. Microphthalmia The congenital abnormal smallness of one or both
eyes. Can occur in the presence of other ocular defects.
Page 25
Microtia A small or maldeveloped external ear and atretic or stenotic external auditory canal.
Multifactorial A term used to describe characteristics or diseases
that are caused by a combination of multiple genetic and environmental factors.
Multiple congenital anomaly
Term used to describe the presence of more than one anomaly at birth.
Mutagen Substance that is known to cause a mutation. Mutations Alterations in the sequence of DNA. Neonatal death Death of a live-born infant within the first 28 days
after birth. Early neonatal death refers to death during the first 7 days. Late neonatal death refers to death after 7 days but before 29 days.
Neonatal (newborn) period
The first 28 days following delivery of a live-born infant.
Neural tube defect A defect resulting from failure of the neural tube to
close in the first month of pregnancy. The major conditions include anencephaly, spina bifida, and encephalocele.
Obstructive genitourinary defect
Stenosis or atresia of the urinary tract at any level. Severity of the defect depends largely upon the level of the obstruction. Urine accumulates behind the obstruction.
Omphalocele The protrusion of intestines into the umbilicus. The
defect is usually closed surgically soon after birth. Patau Syndrome See Trisomy 13 Patent ductus arteriosus
A blood vessel between the pulmonary artery and the aorta. This is normal in fetal life, but can cause problems after birth, particularly in premature infants.
Periconceptual At or around the time of conception. Perinatal Before, during, or after delivery. The exact time
period may vary from 20 to 28 complete weeks of gestation through 7 to 28 days after delivery, depending on the context in which the term is used.
Postnatal After delivery. Postterm infant An infant born after 42 completed weeks of
gestation. Prenatal Before delivery. Preterm infant An infant born before 37 completed weeks of
gestation. Pulmonary artery anomaly
Abnormality in the formation of the pulmonary artery such as stenosis or atresia.
Pulmonary valve atresia or stenosis
Failure of formation of the pulmonary valve or a narrowing or obstruction of the pulmonary valve, resulting in obstruction of blood flow from the right ventricle to the pulmonary artery.
Pyloric stenosis A narrowing of the outlet from the stomach to the
small intestine resulting in complete or partial obstruction of the passage of food and gastric contents.
Rectal and large intestinal atresia/stenosis
Complete or partial occlusion of the lumen of one or more segments of the large intestine and/or rectum.
Reduction defects: lower and upper limbs
The congenital absence of a portion of the lower or upper limbs. There are two general types of defect, transverse and longitudinal. Transverse defects appear like amputations with the complete or partial absence of the arm or leg. Longitudinal defects are missing rays of the limb and may involve the preaxial (thumb or big toe side) or central parts of the arm or leg.
Renal agenesis or dysgenesis
The failure, or deviation, of embryonic development of the kidney.
Spina bifida An incomplete closure of the vertebral spin (usually
posterior) through which spinal cord tissue or membranes (meninges) covering the spine herniated.
Stenosis A narrowing or constriction the diameter of a bodily
passage or orifice. Stenosis or atresia of the small intestine
A narrowing or incomplete formation of the small intestine obstructing movement through the digestive tract.
Syndrome A pattern of multiple primary malformations or
defects all due to a single underlying cause (for example, Down syndrome).
Teratogen A substance in the environment that can cause a
birth defect. Term infant An infant born after 37 complete weeks and before
42 complete weeks of gestation. Tetralogy of Fallot The simultaneous presence of a ventricular septal
defect, pulmonic stenosis, a malpositioned aorta that overrides the ventricular septum, and right ventricular hypertrophy.
Transposition of the great arteries
A congenital malformation in which the aorta arises from the right ventricle and the pulmonary artery from the left ventricle (opposite of normal), so that the venous return from the peripheral circulation is recirculated without being oxygenated in the lungs. Immediate surgical correction is needed. When this is not associated with other cardiac defects, and not corrected, it is fatal.
Tricuspid valve atresia or stenosis
A congenital cardiac condition characterized by the absence or constriction of the tricuspid valve.
Trisomy A chromosomal abnormality characterized by one
more than the normal number of chromosomes. Normally, cells contain two of each chromosome. In trisomy, cells contain three copies of a specific chromosome.
Trisomy 13 (Patau syndrome)
The chromosomal abnormality caused by an extra chromosome 13. Characterized by impaired midline facial development, cleft lip and palate, polydactyly and severe mental retardation. Most infants do not survive beyond 6 months of life.
Trisomy 18 (Edwards syndrome)
The chromosomal abnormality caused by an extra copy of chromosome 18. It is characterized by mental retardation, growth retardation, low-set ears, skull malformation and short digits. Survival for more than a few months is rare.

Trisomy 21 See Down Syndrome. Ventricular Septal Defect
A congenital cardiac malformation in which there are one or several openings in the ventricular system (Muscular and fibrous wall between the right and left ventricle or right and left lower chambers of the heart).
Very low birth weight
Birth weight less than 1,500 grams, regardless of gestational age.
Page 26

Appendix A
Page 27
Tennessee Perinatal Region
Page 28
Figure A1

Appendix B
Birth Defect Tables
Page 29
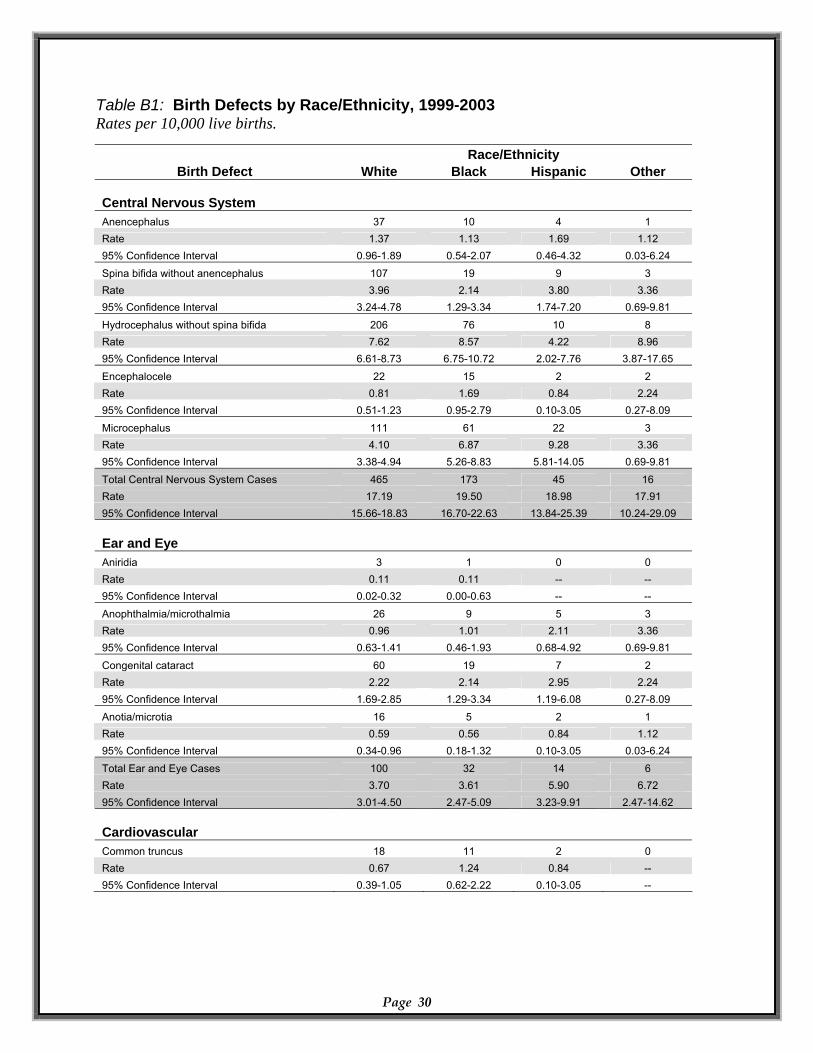
Table B1: Birth Defects by Race/Ethnicity, 1999-2003 Rates per 10,000 live births. Race/Ethnicity
Birth Defect White Black Hispanic Other Central Nervous System Anencephalus 37 10 4 1 Rate 1.37 1.13 1.69 1.12 95% Confidence Interval 0.96-1.89 0.54-2.07 0.46-4.32 0.03-6.24 Spina bifida without anencephalus 107 19 9 3 Rate 3.96 2.14 3.80 3.36 95% Confidence Interval 3.24-4.78 1.29-3.34 1.74-7.20 0.69-9.81
Hydrocephalus without spina bifida 206 76 10 8 Rate 7.62 8.57 4.22 8.96 95% Confidence Interval 6.61-8.73 6.75-10.72 2.02-7.76 3.87-17.65
Encephalocele 22 15 2 2 Rate 0.81 1.69 0.84 2.24 95% Confidence Interval 0.51-1.23 0.95-2.79 0.10-3.05 0.27-8.09
Microcephalus 111 61 22 3 Rate 4.10 6.87 9.28 3.36 95% Confidence Interval 3.38-4.94 5.26-8.83 5.81-14.05 0.69-9.81 Total Central Nervous System Cases 465 173 45 16 Rate 17.19 19.50 18.98 17.91 95% Confidence Interval 15.66-18.83 16.70-22.63 13.84-25.39 10.24-29.09 Ear and Eye Aniridia 3 1 0 0
Page 30
Rate 0.11 0.11 -- -- 95% Confidence Interval 0.02-0.32 0.00-0.63 -- --
Anophthalmia/microthalmia 26 9 5 3 Rate 0.96 1.01 2.11 3.36 95% Confidence Interval 0.63-1.41 0.46-1.93 0.68-4.92 0.69-9.81
Congenital cataract 60 19 7 2 Rate 2.22 2.14 2.95 2.24 95% Confidence Interval 1.69-2.85 1.29-3.34 1.19-6.08 0.27-8.09 Anotia/microtia 16 5 2 1 Rate 0.59 0.56 0.84 1.12 95% Confidence Interval 0.34-0.96 0.18-1.32 0.10-3.05 0.03-6.24 Total Ear and Eye Cases 100 32 14 6 Rate 3.70 3.61 5.90 6.72 95% Confidence Interval 3.01-4.50 2.47-5.09 3.23-9.91 2.47-14.62 Cardiovascular Common truncus 18 11 2 0 Rate 0.67 1.24 0.84 -- 95% Confidence Interval 0.39-1.05 0.62-2.22 0.10-3.05 --
Page 31
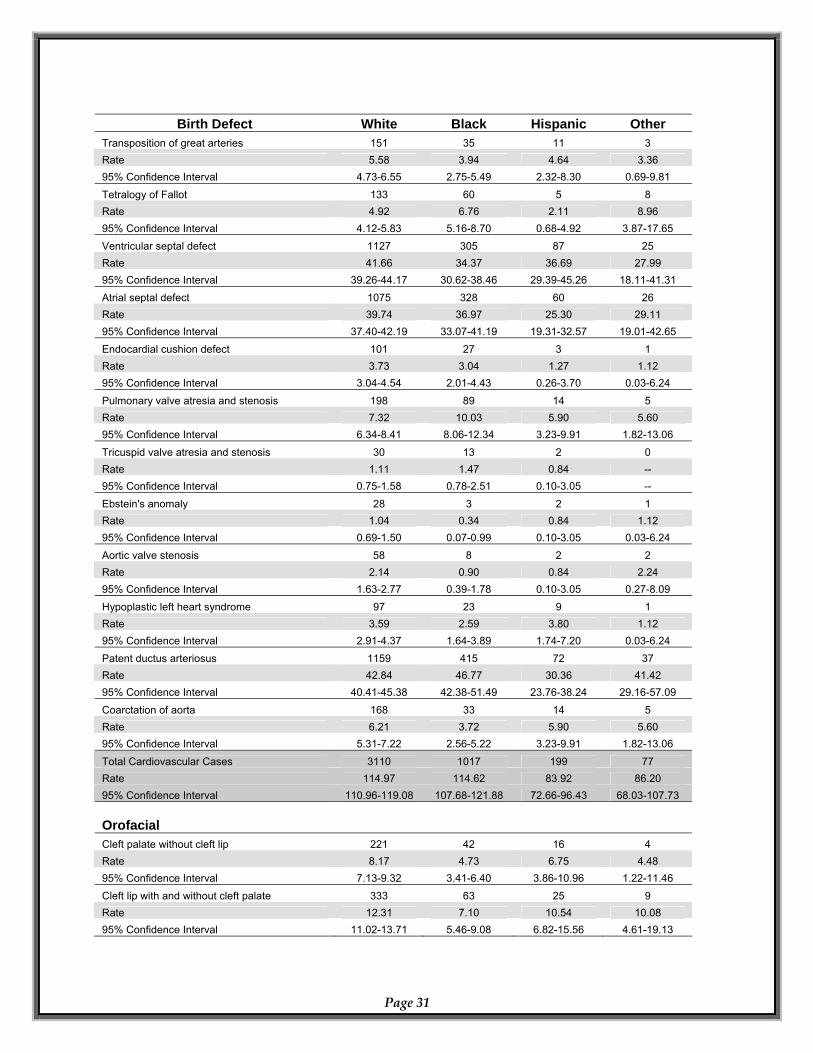
Birth Defect White Black Hispanic Other Transposition of great arteries 151 35 11 3 Rate 5.58 3.94 4.64 3.36 95% Confidence Interval 4.73-6.55 2.75-5.49 2.32-8.30 0.69-9.81
Tetralogy of Fallot 133 60 5 8 Rate 4.92 6.76 2.11 8.96 95% Confidence Interval 4.12-5.83 5.16-8.70 0.68-4.92 3.87-17.65 Ventricular septal defect 1127 305 87 25 Rate 41.66 34.37 36.69 27.99 95% Confidence Interval 39.26-44.17 30.62-38.46 29.39-45.26 18.11-41.31 Atrial septal defect 1075 328 60 26 Rate 39.74 36.97 25.30 29.11 95% Confidence Interval 37.40-42.19 33.07-41.19 19.31-32.57 19.01-42.65 Endocardial cushion defect 101 27 3 1 Rate 3.73 3.04 1.27 1.12 95% Confidence Interval 3.04-4.54 2.01-4.43 0.26-3.70 0.03-6.24
Pulmonary valve atresia and stenosis 198 89 14 5 Rate 7.32 10.03 5.90 5.60 95% Confidence Interval 6.34-8.41 8.06-12.34 3.23-9.91 1.82-13.06
Tricuspid valve atresia and stenosis 30 13 2 0 Rate 1.11 1.47 0.84 -- 95% Confidence Interval 0.75-1.58 0.78-2.51 0.10-3.05 --
Ebstein's anomaly 28 3 2 1 Rate 1.04 0.34 0.84 1.12 95% Confidence Interval 0.69-1.50 0.07-0.99 0.10-3.05 0.03-6.24 Aortic valve stenosis 58 8 2 2 Rate 2.14 0.90 0.84 2.24 95% Confidence Interval 1.63-2.77 0.39-1.78 0.10-3.05 0.27-8.09 Hypoplastic left heart syndrome 97 23 9 1 Rate 3.59 2.59 3.80 1.12 95% Confidence Interval 2.91-4.37 1.64-3.89 1.74-7.20 0.03-6.24 Patent ductus arteriosus 1159 415 72 37 Rate 42.84 46.77 30.36 41.42 95% Confidence Interval 40.41-45.38 42.38-51.49 23.76-38.24 29.16-57.09
Coarctation of aorta 168 33 14 5 Rate 6.21 3.72 5.90 5.60 95% Confidence Interval 5.31-7.22 2.56-5.22 3.23-9.91 1.82-13.06
Total Cardiovascular Cases 3110 1017 199 77 Rate 114.97 114.62 83.92 86.20 95% Confidence Interval 110.96-119.08 107.68-121.88 72.66-96.43 68.03-107.73 Orofacial Cleft palate without cleft lip 221 42 16 4 Rate 8.17 4.73 6.75 4.48 95% Confidence Interval 7.13-9.32 3.41-6.40 3.86-10.96 1.22-11.46 Cleft lip with and without cleft palate 333 63 25 9 Rate 12.31 7.10 10.54 10.08 95% Confidence Interval 11.02-13.71 5.46-9.08 6.82-15.56 4.61-19.13
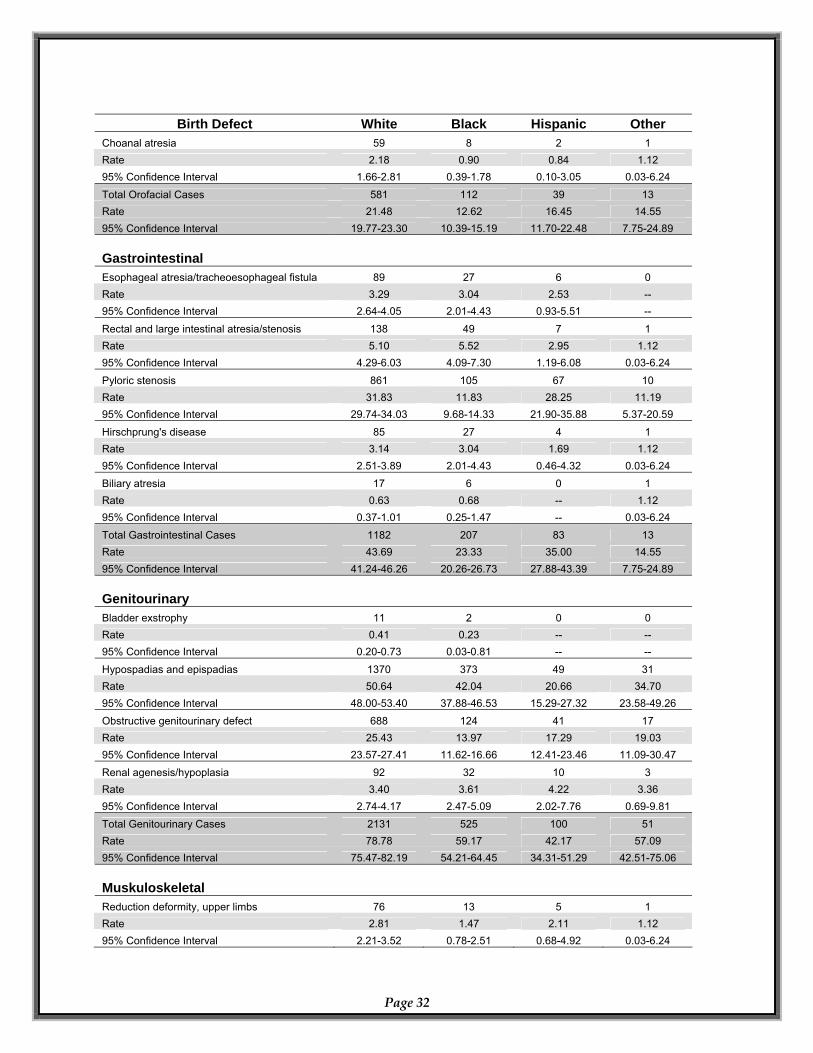
Page 32
Birth Defect White Black Hispanic Other Choanal atresia 59 8 2 1 Rate 2.18 0.90 0.84 1.12 95% Confidence Interval 1.66-2.81 0.39-1.78 0.10-3.05 0.03-6.24
Total Orofacial Cases 581 112 39 13 Rate 21.48 12.62 16.45 14.55 95% Confidence Interval 19.77-23.30 10.39-15.19 11.70-22.48 7.75-24.89 Gastrointestinal Esophageal atresia/tracheoesophageal fistula 89 27 6 0 Rate 3.29 3.04 2.53 -- 95% Confidence Interval 2.64-4.05 2.01-4.43 0.93-5.51 --
Rectal and large intestinal atresia/stenosis 138 49 7 1 Rate 5.10 5.52 2.95 1.12 95% Confidence Interval 4.29-6.03 4.09-7.30 1.19-6.08 0.03-6.24
Pyloric stenosis 861 105 67 10 Rate 31.83 11.83 28.25 11.19 95% Confidence Interval 29.74-34.03 9.68-14.33 21.90-35.88 5.37-20.59
Hirschprung's disease 85 27 4 1 Rate 3.14 3.04 1.69 1.12 95% Confidence Interval 2.51-3.89 2.01-4.43 0.46-4.32 0.03-6.24 Biliary atresia 17 6 0 1 Rate 0.63 0.68 -- 1.12 95% Confidence Interval 0.37-1.01 0.25-1.47 -- 0.03-6.24 Total Gastrointestinal Cases 1182 207 83 13 Rate 43.69 23.33 35.00 14.55 95% Confidence Interval 41.24-46.26 20.26-26.73 27.88-43.39 7.75-24.89 Genitourinary Bladder exstrophy 11 2 0 0 Rate 0.41 0.23 -- -- 95% Confidence Interval 0.20-0.73 0.03-0.81 -- --
Hypospadias and epispadias 1370 373 49 31 Rate 50.64 42.04 20.66 34.70 95% Confidence Interval 48.00-53.40 37.88-46.53 15.29-27.32 23.58-49.26 Obstructive genitourinary defect 688 124 41 17 Rate 25.43 13.97 17.29 19.03 95% Confidence Interval 23.57-27.41 11.62-16.66 12.41-23.46 11.09-30.47 Renal agenesis/hypoplasia 92 32 10 3 Rate 3.40 3.61 4.22 3.36 95% Confidence Interval 2.74-4.17 2.47-5.09 2.02-7.76 0.69-9.81 Total Genitourinary Cases 2131 525 100 51 Rate 78.78 59.17 42.17 57.09 95% Confidence Interval 75.47-82.19 54.21-64.45 34.31-51.29 42.51-75.06 Muskuloskeletal Reduction deformity, upper limbs 76 13 5 1 Rate 2.81 1.47 2.11 1.12 95% Confidence Interval 2.21-3.52 0.78-2.51 0.68-4.92 0.03-6.24
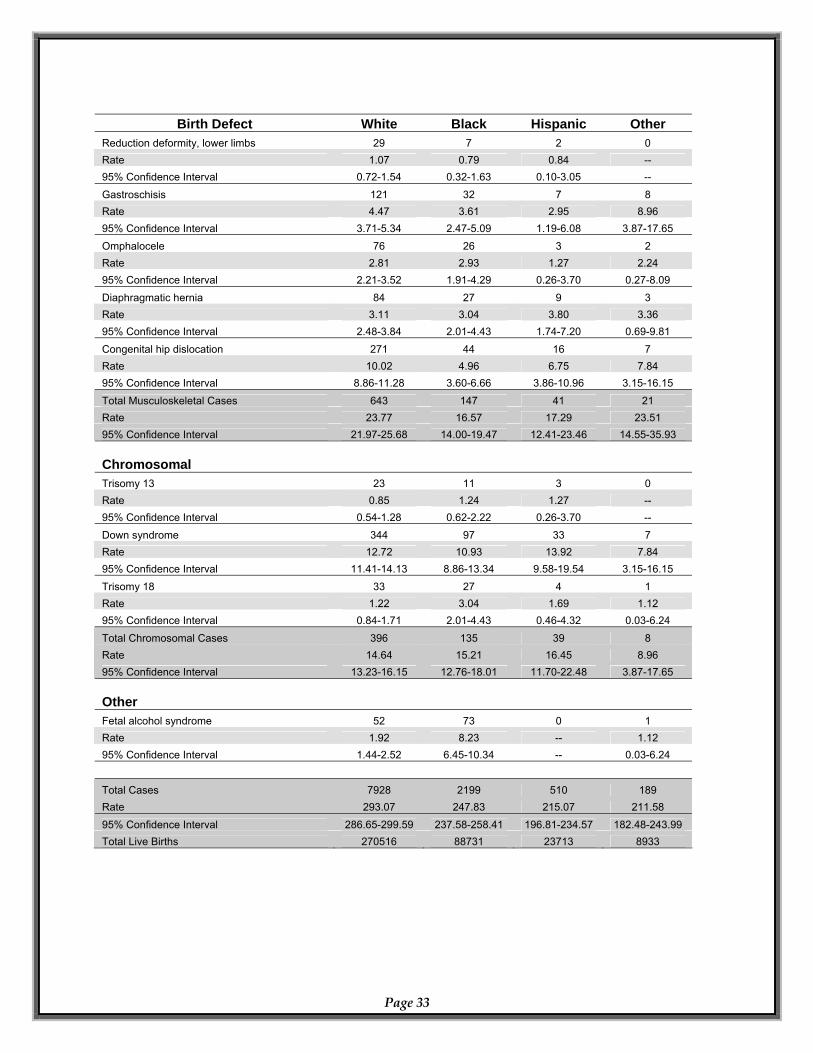
Birth Defect White Black Hispanic Other
Reduction deformity, lower limbs 29 7 2 0 Rate 1.07 0.79 0.84 -- 95% Confidence Interval 0.72-1.54 0.32-1.63 0.10-3.05 --
Gastroschisis 121 32 7 8 Rate 4.47 3.61 2.95 8.96 95% Confidence Interval 3.71-5.34 2.47-5.09 1.19-6.08 3.87-17.65 Omphalocele 76 26 3 2 Rate 2.81 2.93 1.27 2.24 95% Confidence Interval 2.21-3.52 1.91-4.29 0.26-3.70 0.27-8.09 Diaphragmatic hernia 84 27 9 3 Rate 3.11 3.04 3.80 3.36 95% Confidence Interval 2.48-3.84 2.01-4.43 1.74-7.20 0.69-9.81 Congenital hip dislocation 271 44 16 7 Rate 10.02 4.96 6.75 7.84 95% Confidence Interval 8.86-11.28 3.60-6.66 3.86-10.96 3.15-16.15
Total Musculoskeletal Cases 643 147 41 21 Rate 23.77 16.57 17.29 23.51 95% Confidence Interval 21.97-25.68 14.00-19.47 12.41-23.46 14.55-35.93 Chromosomal Trisomy 13 23 11 3 0 Rate 0.85 1.24 1.27 -- 95% Confidence Interval 0.54-1.28 0.62-2.22 0.26-3.70 -- Down syndrome 344 97 33 7 Rate 12.72 10.93 13.92 7.84 95% Confidence Interval 11.41-14.13 8.86-13.34 9.58-19.54 3.15-16.15 Trisomy 18 33 27 4 1 Rate 1.22 3.04 1.69 1.12 95% Confidence Interval 0.84-1.71 2.01-4.43 0.46-4.32 0.03-6.24
Total Chromosomal Cases 396 135 39 8 Rate 14.64 15.21 16.45 8.96 95% Confidence Interval 13.23-16.15 12.76-18.01 11.70-22.48 3.87-17.65 Other Fetal alcohol syndrome 52 73 0 1 Rate 1.92 8.23 -- 1.12 95% Confidence Interval 1.44-2.52 6.45-10.34 -- 0.03-6.24 Total Cases 7928 2199 510 189 Rate 293.07 247.83 215.07 211.58 95% Confidence Interval 286.65-299.59 237.58-258.41 196.81-234.57 182.48-243.99 Total Live Births 270516 88731 23713 8933
Page 33
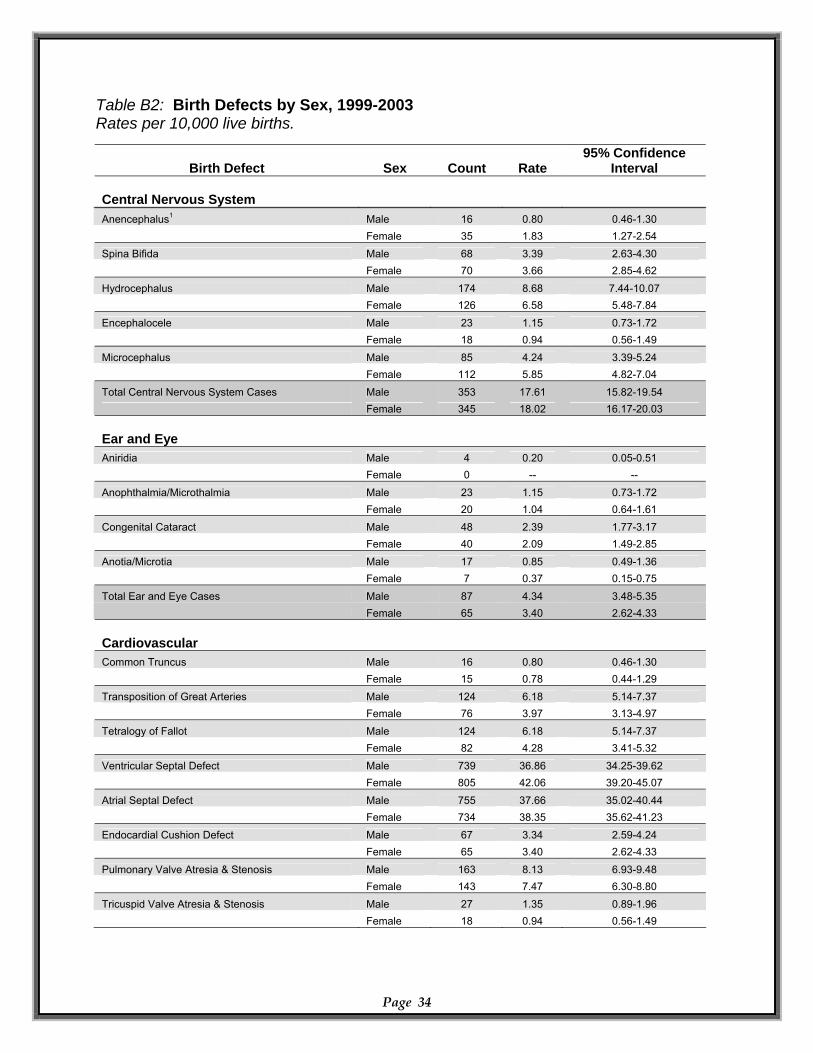
Table B2: Birth Defects by Sex, 1999-2003 Rates per 10,000 live births.
Birth Defect Sex Count Rate 95% Confidence
Interval Central Nervous System
Anencephalus1 Male 16 0.80 0.46-1.30 Female 35 1.83 1.27-2.54 Spina Bifida Male 68 3.39 2.63-4.30 Female 70 3.66 2.85-4.62
Hydrocephalus Male 174 8.68 7.44-10.07 Female 126 6.58 5.48-7.84
Encephalocele Male 23 1.15 0.73-1.72 Female 18 0.94 0.56-1.49 Microcephalus Male 85 4.24 3.39-5.24 Female 112 5.85 4.82-7.04
Total Central Nervous System Cases Male 353 17.61 15.82-19.54 Female 345 18.02 16.17-20.03 Ear and Eye
Aniridia Male 4 0.20 0.05-0.51 Female 0 -- --
Anophthalmia/Microthalmia Male 23 1.15 0.73-1.72 Female 20 1.04 0.64-1.61 Congenital Cataract Male 48 2.39 1.77-3.17 Female 40 2.09 1.49-2.85
Anotia/Microtia Male 17 0.85 0.49-1.36 Female 7 0.37 0.15-0.75
Total Ear and Eye Cases Male 87 4.34 3.48-5.35 Female 65 3.40 2.62-4.33 Cardiovascular
Common Truncus Male 16 0.80 0.46-1.30 Female 15 0.78 0.44-1.29 Transposition of Great Arteries Male 124 6.18 5.14-7.37 Female 76 3.97 3.13-4.97 Tetralogy of Fallot Male 124 6.18 5.14-7.37 Female 82 4.28 3.41-5.32
Ventricular Septal Defect Male 739 36.86 34.25-39.62 Female 805 42.06 39.20-45.07 Atrial Septal Defect 755 37.66 35.02-40.44 Male Female 734 38.35 35.62-41.23 Endocardial Cushion Defect Male 67 3.34 2.59-4.24 Female 65 3.40 2.62-4.33
Pulmonary Valve Atresia & Stenosis Male 163 8.13 6.93-9.48 Female 143 7.47 6.30-8.80 Tricuspid Valve Atresia & Stenosis 27 1.35 0.89-1.96 Male
Page 34
Female 18 0.94 0.56-1.49
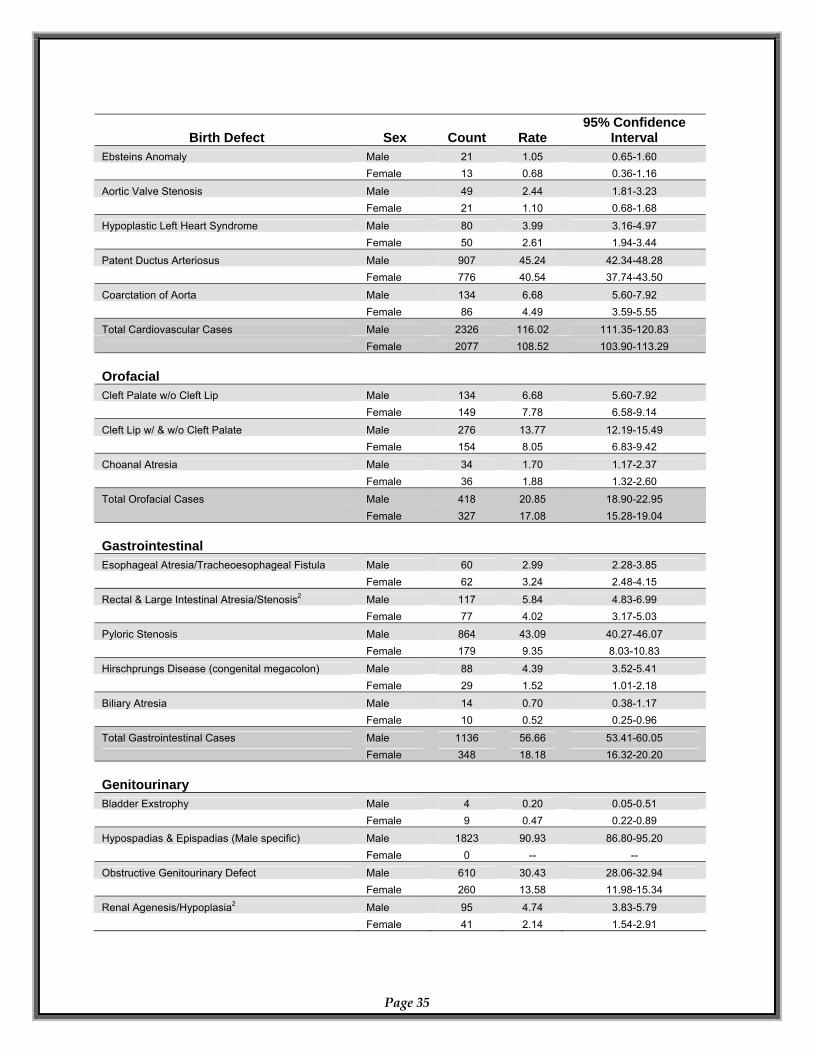
Birth Defect Sex Count Rate 95% Confidence
Interval Ebsteins Anomaly Male 21 1.05 0.65-1.60 Female 13 0.68 0.36-1.16
Aortic Valve Stenosis 49 2.44 1.81-3.23 Male Female 21 1.10 0.68-1.68 Hypoplastic Left Heart Syndrome Male 80 3.99 3.16-4.97 Female 50 2.61 1.94-3.44
Patent Ductus Arteriosus Male 907 45.24 42.34-48.28 Female 776 40.54 37.74-43.50
Coarctation of Aorta Male 134 6.68 5.60-7.92 Female 86 4.49 3.59-5.55 Total Cardiovascular Cases Male 2326 116.02 111.35-120.83 Female 2077 108.52 103.90-113.29 Orofacial Cleft Palate w/o Cleft Lip Male 134 6.68 5.60-7.92 Female 149 7.78 6.58-9.14
Cleft Lip w/ & w/o Cleft Palate Male 276 13.77 12.19-15.49 Female 154 8.05 6.83-9.42
Male 34 1.70 Choanal Atresia 1.17-2.37 Female 36 1.88 1.32-2.60 Total Orofacial Cases Male 418 20.85 18.90-22.95 327 17.08 15.28-19.04 Female Gastrointestinal Esophageal Atresia/Tracheoesophageal Fistula Male 60 2.99 2.28-3.85 Female 62 3.24 2.48-4.15
Rectal & Large Intestinal Atresia/Stenosis2 Male 117 5.84 4.83-6.99 Female 77 4.02 3.17-5.03
Pyloric Stenosis Male 864 43.09 40.27-46.07 Female 179 9.35 8.03-10.83 Hirschprungs Disease (congenital megacolon) Male 88 4.39 3.52-5.41 Female 29 1.52 1.01-2.18
Biliary Atresia Male 14 0.70 0.38-1.17 Female 10 0.52 0.25-0.96
Total Gastrointestinal Cases Male 1136 56.66 53.41-60.05 Female 348 18.18 16.32-20.20 Genitourinary
Bladder Exstrophy Male 4 0.20 0.05-0.51 Female 9 0.47 0.22-0.89 Hypospadias & Epispadias (Male specific) Male 1823 90.93 86.80-95.20 Female 0 -- --
Obstructive Genitourinary Defect Male 610 30.43 28.06-32.94 Female 260 13.58 11.98-15.34
Renal Agenesis/Hypoplasia2 Male 95 4.74 3.83-5.79 Female
Page 35
41 2.14 1.54-2.91
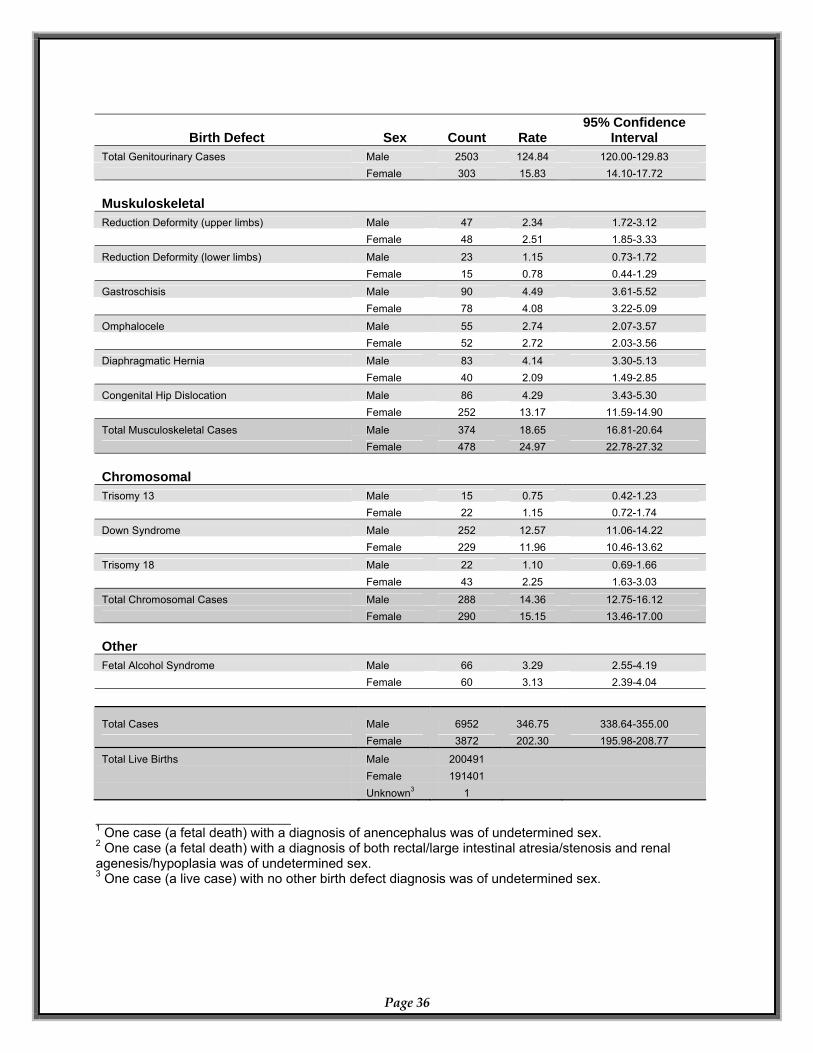
Birth Defect Sex Count Rate 95% Confidence
Interval Total Genitourinary Cases Male 2503 124.84 120.00-129.83 Female 303 15.83 14.10-17.72 Muskuloskeletal
Reduction Deformity (upper limbs) Male 47 2.34 1.72-3.12 Female 48 2.51 1.85-3.33
Reduction Deformity (lower limbs) Male 23 1.15 0.73-1.72 Female 15 0.78 0.44-1.29 Gastroschisis Male 90 4.49 3.61-5.52 Female 78 4.08 3.22-5.09
Omphalocele Male 55 2.74 2.07-3.57 Female 52 2.72 2.03-3.56
Diaphragmatic Hernia Male 83 4.14 3.30-5.13 Female 40 2.09 1.49-2.85 Congenital Hip Dislocation Male 86 4.29 3.43-5.30 Female 252 13.17 11.59-14.90
Total Musculoskeletal Cases Male 374 18.65 16.81-20.64 Female 478 24.97 22.78-27.32 Chromosomal
Trisomy 13 Male 15 0.75 0.42-1.23 Female 22 1.15 0.72-1.74
Down Syndrome Male 252 12.57 11.06-14.22 Female 229 11.96 10.46-13.62 Trisomy 18 Male 22 1.10 0.69-1.66 Female 43 2.25 1.63-3.03
Total Chromosomal Cases Male 288 14.36 12.75-16.12 Female 290 15.15 13.46-17.00 Other
Fetal Alcohol Syndrome Male 66 3.29 2.55-4.19 Female 60 3.13 2.39-4.04
Total Cases Male 6952 346.75 338.64-355.00 Female 3872 202.30 195.98-208.77
Total Live Births Male 200491 Female 191401 Unknown3 1
_________________________________ 1 One case (a fetal death) with a diagnosis of anencephalus was of undetermined sex. 2 One case (a fetal death) with a diagnosis of both rectal/large intestinal atresia/stenosis and renal agenesis/hypoplasia was of undetermined sex. 3 One case (a live case) with no other birth defect diagnosis was of undetermined sex.
Page 36
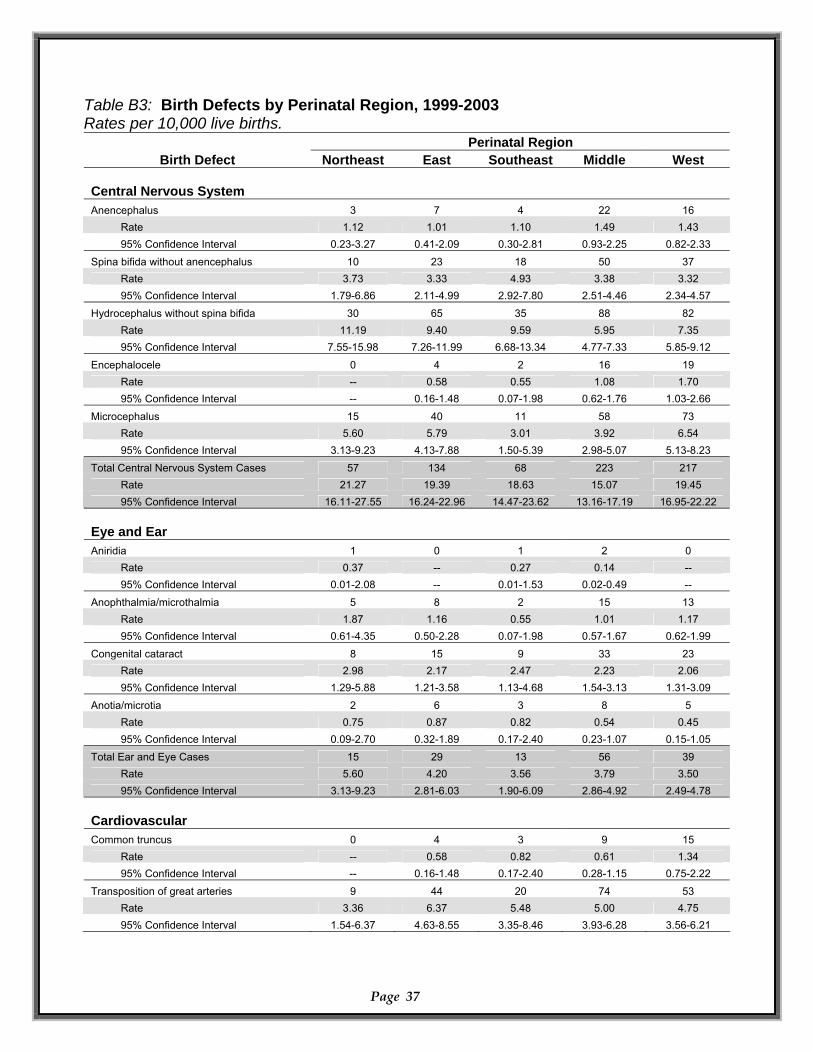
Table B3: Birth Defects by Perinatal Region, 1999-2003 Rates per 10,000 live births.
Page 37
Perinatal Region Birth Defect Northeast East Southeast Middle West
Central Nervous System Anencephalus 3 7 4 22 16
Rate 1.12 1.01 1.10 1.49 1.43 95% Confidence Interval 0.23-3.27 0.41-2.09 0.30-2.81 0.93-2.25 0.82-2.33
Spina bifida without anencephalus 10 23 18 50 37 Rate 3.73 3.33 4.93 3.38 3.32 95% Confidence Interval 1.79-6.86 2.11-4.99 2.92-7.80 2.51-4.46 2.34-4.57
Hydrocephalus without spina bifida 30 65 35 88 82 Rate 11.19 9.40 9.59 5.95 7.35 95% Confidence Interval 7.55-15.98 7.26-11.99 6.68-13.34 4.77-7.33 5.85-9.12
Encephalocele 0 4 2 16 19 Rate -- 0.58 0.55 1.08 1.70 95% Confidence Interval -- 0.16-1.48 0.07-1.98 0.62-1.76 1.03-2.66
Microcephalus 15 40 11 58 73 Rate 5.60 5.79 3.01 3.92 6.54 95% Confidence Interval 3.13-9.23 4.13-7.88 1.50-5.39 2.98-5.07 5.13-8.23
Total Central Nervous System Cases 57 134 68 223 217 Rate 21.27 19.39 18.63 15.07 19.45 95% Confidence Interval 16.11-27.55 16.24-22.96 14.47-23.62 13.16-17.19 16.95-22.22
Eye and Ear Aniridia 1 0 1 2 0
Rate 0.37 -- 0.27 0.14 -- 95% Confidence Interval 0.01-2.08 -- 0.01-1.53 0.02-0.49 --
Anophthalmia/microthalmia 5 8 2 15 13 Rate 1.87 1.16 0.55 1.01 1.17 95% Confidence Interval 0.61-4.35 0.50-2.28 0.07-1.98 0.57-1.67 0.62-1.99
Congenital cataract 8 15 9 33 23 Rate 2.98 2.17 2.47 2.23 2.06 95% Confidence Interval 1.29-5.88 1.21-3.58 1.13-4.68 1.54-3.13 1.31-3.09
Anotia/microtia 2 6 3 8 5 Rate 0.75 0.87 0.82 0.54 0.45 95% Confidence Interval 0.09-2.70 0.32-1.89 0.17-2.40 0.23-1.07 0.15-1.05
Total Ear and Eye Cases 15 29 13 56 39 Rate 5.60 4.20 3.56 3.79 3.50 95% Confidence Interval 3.13-9.23 2.81-6.03 1.90-6.09 2.86-4.92 2.49-4.78
Cardiovascular Common truncus 0 4 3 9 15
Rate -- 0.58 0.82 0.61 1.34 95% Confidence Interval -- 0.16-1.48 0.17-2.40 0.28-1.15 0.75-2.22
Transposition of great arteries 9 44 20 74 53 Rate 3.36 6.37 5.48 5.00 4.75 95% Confidence Interval 1.54-6.37 4.63-8.55 3.35-8.46 3.93-6.28 3.56-6.21
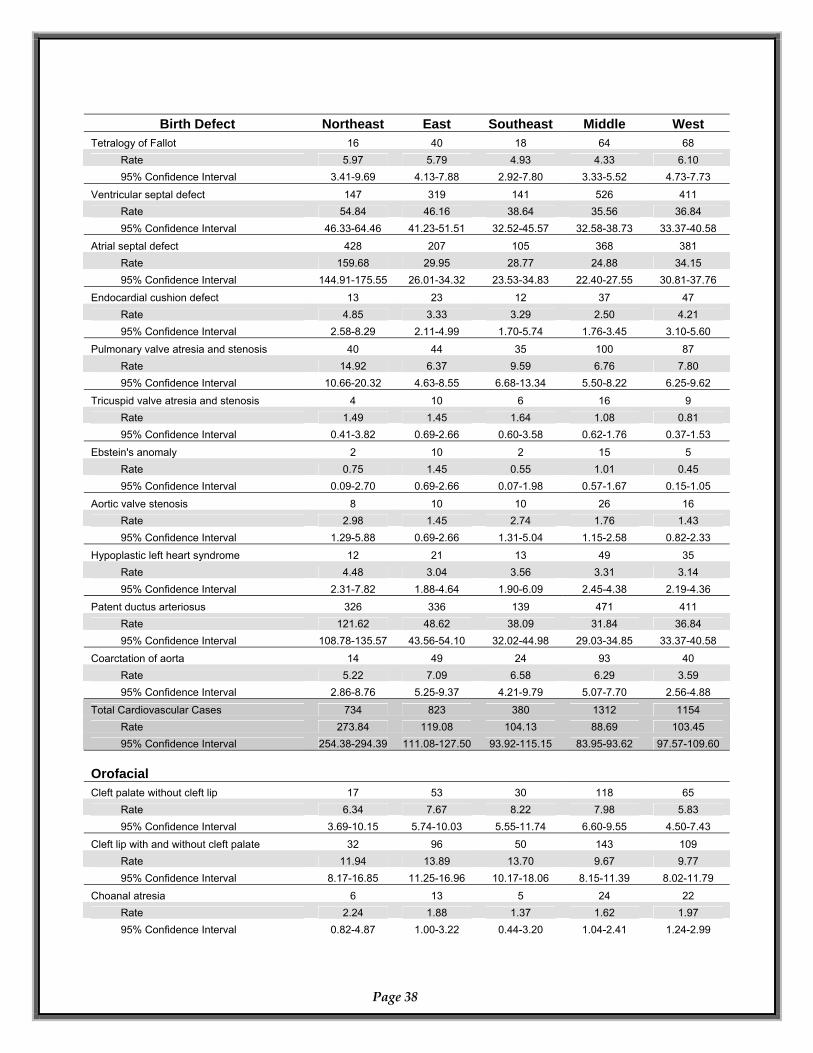
Page 38
Birth Defect Northeast East Southeast Middle West Tetralogy of Fallot 16 40 18 64 68
Rate 5.97 5.79 4.93 4.33 6.10 95% Confidence Interval 3.41-9.69 4.13-7.88 2.92-7.80 3.33-5.52 4.73-7.73
Ventricular septal defect 147 319 141 526 411 Rate 54.84 46.16 38.64 35.56 36.84 95% Confidence Interval 46.33-64.46 41.23-51.51 32.52-45.57 32.58-38.73 33.37-40.58
Atrial septal defect 428 207 105 368 381 Rate 159.68 29.95 28.77 24.88 34.15 95% Confidence Interval 144.91-175.55 26.01-34.32 23.53-34.83 22.40-27.55 30.81-37.76
Endocardial cushion defect 13 23 12 37 47 Rate 4.85 3.33 3.29 2.50 4.21 95% Confidence Interval 2.58-8.29 2.11-4.99 1.70-5.74 1.76-3.45 3.10-5.60
Pulmonary valve atresia and stenosis 40 44 35 100 87 Rate 14.92 6.37 9.59 6.76 7.80 95% Confidence Interval 10.66-20.32 4.63-8.55 6.68-13.34 5.50-8.22 6.25-9.62
Tricuspid valve atresia and stenosis 4 10 6 16 9 Rate 1.49 1.45 1.64 1.08 0.81 95% Confidence Interval 0.41-3.82 0.69-2.66 0.60-3.58 0.62-1.76 0.37-1.53
Ebstein's anomaly 2 10 2 15 5 Rate 0.75 1.45 0.55 1.01 0.45 95% Confidence Interval 0.09-2.70 0.69-2.66 0.07-1.98 0.57-1.67 0.15-1.05
Aortic valve stenosis 8 10 10 26 16 Rate 2.98 1.45 2.74 1.76 1.43 95% Confidence Interval 1.29-5.88 0.69-2.66 1.31-5.04 1.15-2.58 0.82-2.33
Hypoplastic left heart syndrome 12 21 13 49 35 Rate 4.48 3.04 3.56 3.31 3.14 95% Confidence Interval 2.31-7.82 1.88-4.64 1.90-6.09 2.45-4.38 2.19-4.36
Patent ductus arteriosus 326 336 139 471 411 Rate 121.62 48.62 38.09 31.84 36.84 95% Confidence Interval 108.78-135.57 43.56-54.10 32.02-44.98 29.03-34.85 33.37-40.58
Coarctation of aorta 14 49 24 93 40 Rate 5.22 7.09 6.58 6.29 3.59 95% Confidence Interval 2.86-8.76 5.25-9.37 4.21-9.79 5.07-7.70 2.56-4.88
Total Cardiovascular Cases 734 823 380 1312 1154 Rate 273.84 119.08 104.13 88.69 103.45 95% Confidence Interval 254.38-294.39 111.08-127.50 93.92-115.15 83.95-93.62 97.57-109.60
Orofacial Cleft palate without cleft lip 17 53 30 118 65
Rate 6.34 7.67 8.22 7.98 5.83 95% Confidence Interval 3.69-10.15 5.74-10.03 5.55-11.74 6.60-9.55 4.50-7.43
Cleft lip with and without cleft palate 32 96 50 143 109 Rate 11.94 13.89 13.70 9.67 9.77 95% Confidence Interval 8.17-16.85 11.25-16.96 10.17-18.06 8.15-11.39 8.02-11.79
Choanal atresia 6 13 5 24 22 Rate 2.24 1.88 1.37 1.62 1.97 95% Confidence Interval 0.82-4.87 1.00-3.22 0.44-3.20 1.04-2.41 1.24-2.99
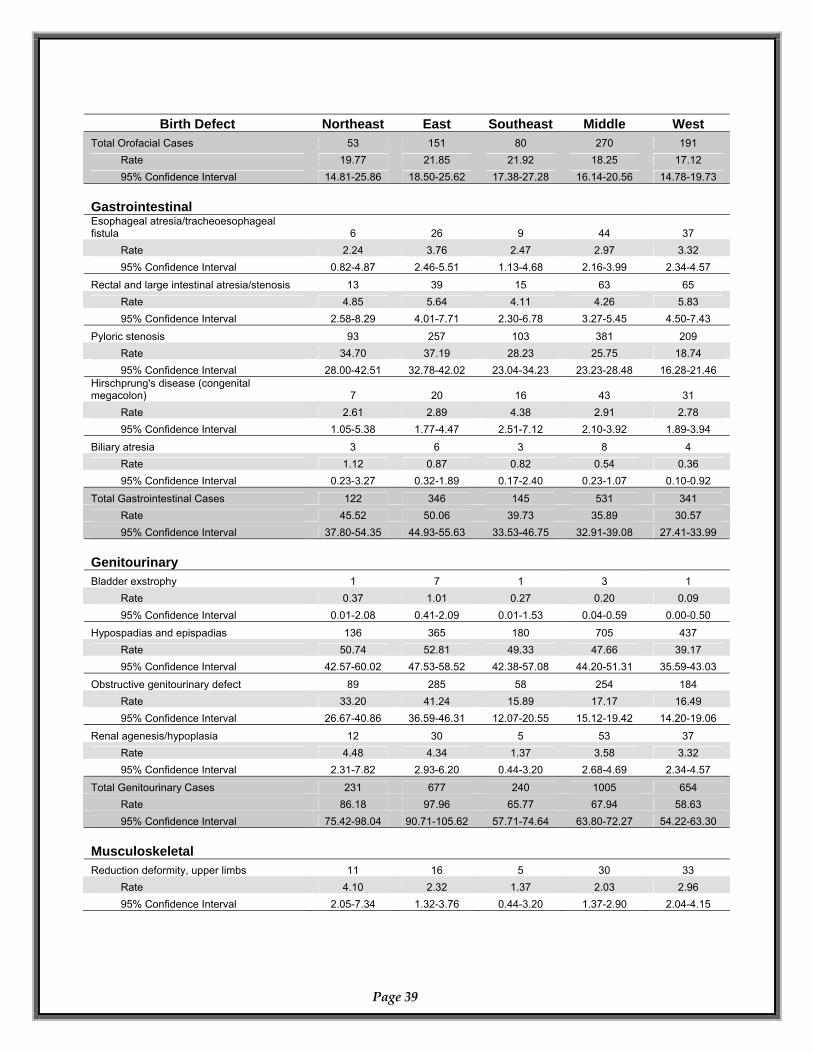
Page 39
Birth Defect Northeast East Southeast Middle West Total Orofacial Cases 53 151 80 270 191
Rate 19.77 21.85 21.92 18.25 17.12 95% Confidence Interval 14.81-25.86 18.50-25.62 17.38-27.28 16.14-20.56 14.78-19.73
Gastrointestinal Esophageal atresia/tracheoesophageal fistula 6 26 9 44 37
Rate 2.24 3.76 2.47 2.97 3.32 95% Confidence Interval 0.82-4.87 2.46-5.51 1.13-4.68 2.16-3.99 2.34-4.57
Rectal and large intestinal atresia/stenosis 13 39 15 63 65 Rate 4.85 5.64 4.11 4.26 5.83 95% Confidence Interval 2.58-8.29 4.01-7.71 2.30-6.78 3.27-5.45 4.50-7.43
Pyloric stenosis 93 257 103 381 209 Rate 34.70 37.19 28.23 25.75 18.74 95% Confidence Interval 28.00-42.51 32.78-42.02 23.04-34.23 23.23-28.48 16.28-21.46
Hirschprung's disease (congenital megacolon) 7 20 16 43 31
Rate 2.61 2.89 4.38 2.91 2.78 95% Confidence Interval 1.05-5.38 1.77-4.47 2.51-7.12 2.10-3.92 1.89-3.94
Biliary atresia 3 6 3 8 4 Rate 1.12 0.87 0.82 0.54 0.36 95% Confidence Interval 0.23-3.27 0.32-1.89 0.17-2.40 0.23-1.07 0.10-0.92
Total Gastrointestinal Cases 122 346 145 531 341 Rate 45.52 50.06 39.73 35.89 30.57 95% Confidence Interval 37.80-54.35 44.93-55.63 33.53-46.75 32.91-39.08 27.41-33.99
Genitourinary Bladder exstrophy 1 7 1 3 1
Rate 0.37 1.01 0.27 0.20 0.09 95% Confidence Interval 0.01-2.08 0.41-2.09 0.01-1.53 0.04-0.59 0.00-0.50
Hypospadias and epispadias 136 365 180 705 437 Rate 50.74 52.81 49.33 47.66 39.17 95% Confidence Interval 42.57-60.02 47.53-58.52 42.38-57.08 44.20-51.31 35.59-43.03
Obstructive genitourinary defect 89 285 58 254 184 Rate 33.20 41.24 15.89 17.17 16.49 95% Confidence Interval 26.67-40.86 36.59-46.31 12.07-20.55 15.12-19.42 14.20-19.06
Renal agenesis/hypoplasia 12 30 5 53 37 Rate 4.48 4.34 1.37 3.58 3.32 95% Confidence Interval 2.31-7.82 2.93-6.20 0.44-3.20 2.68-4.69 2.34-4.57
Total Genitourinary Cases 231 677 240 1005 654 Rate 86.18 97.96 65.77 67.94 58.63 95% Confidence Interval 75.42-98.04 90.71-105.62 57.71-74.64 63.80-72.27 54.22-63.30
Musculoskeletal Reduction deformity, upper limbs 11 16 5 30 33
Rate 4.10 2.32 1.37 2.03 2.96 95% Confidence Interval 2.05-7.34 1.32-3.76 0.44-3.20 1.37-2.90 2.04-4.15
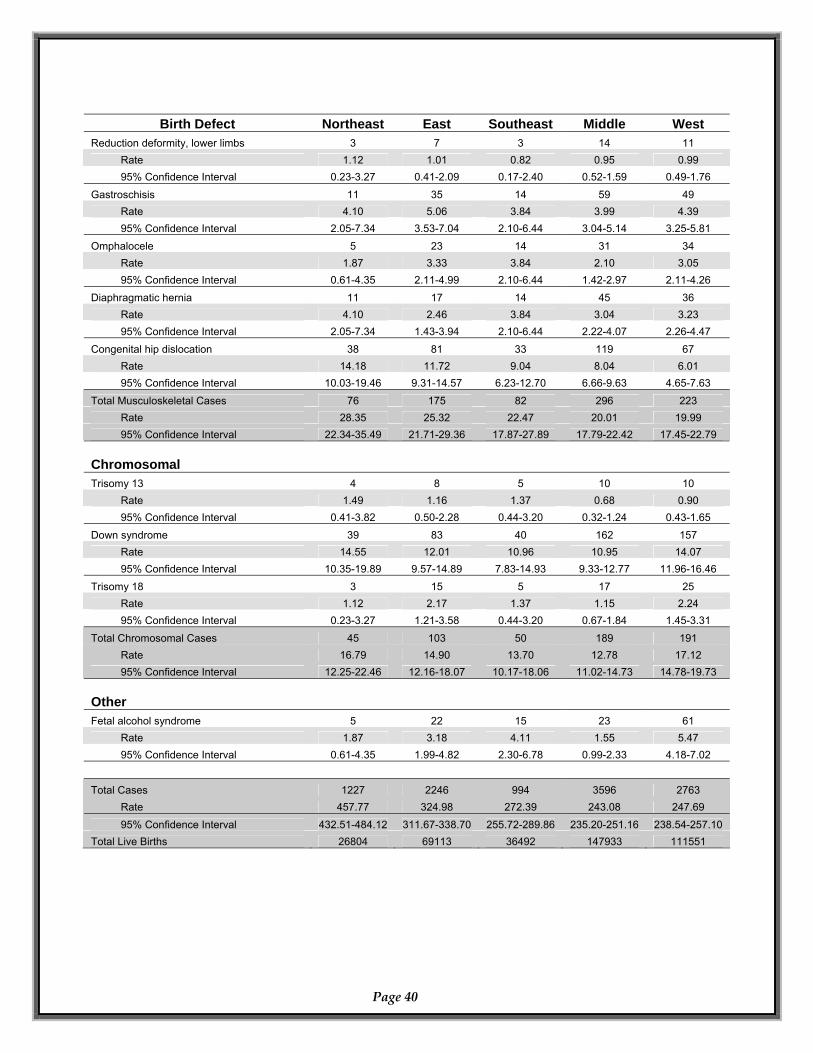
Birth Defect Northeast East Southeast Middle West
Reduction deformity, lower limbs 3 7 3 14 11 Rate 1.12 1.01 0.82 0.95 0.99 95% Confidence Interval 0.23-3.27 0.41-2.09 0.17-2.40 0.52-1.59 0.49-1.76
Gastroschisis 11 35 14 59 49 Rate 4.10 5.06 3.84 3.99 4.39 95% Confidence Interval 2.05-7.34 3.53-7.04 2.10-6.44 3.04-5.14 3.25-5.81
Omphalocele 5 23 14 31 34 Rate 1.87 3.33 3.84 2.10 3.05 95% Confidence Interval 0.61-4.35 2.11-4.99 2.10-6.44 1.42-2.97 2.11-4.26
Diaphragmatic hernia 11 17 14 45 36 Rate 4.10 2.46 3.84 3.04 3.23 95% Confidence Interval 2.05-7.34 1.43-3.94 2.10-6.44 2.22-4.07 2.26-4.47
Congenital hip dislocation 38 81 33 119 67 Rate 14.18 11.72 9.04 8.04 6.01 95% Confidence Interval 10.03-19.46 9.31-14.57 6.23-12.70 6.66-9.63 4.65-7.63
Total Musculoskeletal Cases 76 175 82 296 223 Rate 28.35 25.32 22.47 20.01 19.99 95% Confidence Interval 22.34-35.49 21.71-29.36 17.87-27.89 17.79-22.42 17.45-22.79
Chromosomal Trisomy 13 4 8 5 10 10
Rate 1.49 1.16 1.37 0.68 0.90 95% Confidence Interval 0.41-3.82 0.50-2.28 0.44-3.20 0.32-1.24 0.43-1.65
Down syndrome 39 83 40 162 157 Rate 14.55 12.01 10.96 10.95 14.07 95% Confidence Interval 10.35-19.89 9.57-14.89 7.83-14.93 9.33-12.77 11.96-16.46
Trisomy 18 3 15 5 17 25 Rate 1.12 2.17 1.37 1.15 2.24 95% Confidence Interval 0.23-3.27 1.21-3.58 0.44-3.20 0.67-1.84 1.45-3.31
Total Chromosomal Cases 45 103 50 189 191 Rate 16.79 14.90 13.70 12.78 17.12 95% Confidence Interval 12.25-22.46 12.16-18.07 10.17-18.06 11.02-14.73 14.78-19.73
Other Fetal alcohol syndrome 5 22 15 23 61
Rate 1.87 3.18 4.11 1.55 5.47 95% Confidence Interval 0.61-4.35 1.99-4.82 2.30-6.78 0.99-2.33 4.18-7.02
Total Cases 1227 2246 994 3596 2763
Rate 457.77 324.98 272.39 243.08 247.69 95% Confidence Interval 432.51-484.12 311.67-338.70 255.72-289.86 235.20-251.16 238.54-257.10
Total Live Births 26804 69113 36492 147933 111551
Page 40


Department of Health. Authorization No. 343924, No. of Copies 1,000 April 2007. This public document was promulgated at a cost of $3.30 per copy.


![Hospital-based Birth Defects · PDF fileHospital-based birth defects surveillance: ... Birth defects are one type of congenital conditions. [Slides 5-6] ... • Congenital malformations:](https://static.cupdf.com/doc/110x72/5ab1551c7f8b9a7e1d8c4658/hospital-based-birth-defects-birth-defects-surveillance-birth-defects-are-one.jpg)