1
Singapore’s Cooling Measures and Its Housing Market: Overview and Analysis
Yongheng Deng Joe Gyourko
Institute of Real Estate Studies
National University of Singapore
The Wharton School,
University of Pennsylvania
&
NBER
July 30, 2017
We benefitted from the excellent research assistance of Teng Li and Xiao (Betty) Wang. In
addition, we appreciate the willingness of various parties, including personnel from the Housing
Development Board (HDB), the Monetary Authority of Singapore (MAS) and the Real Estate
Developers’ Association of Singapore (REDAS), for helping inform us about the local market.
That said, all opinions and conclusion are our own, and we are responsible for any remaining
errors.
2
I. Introduction
Housing is an incredibly important asset in Singapore, not least because just over 90% of
all households own their units. Home equity is 40% of household sector net worth in Singapore,
which is far greater than the analogous share of 14% in the United States.1 Residential building
comprises a significant share of overall economic activity, too. Expenditures on ‘Residential
Buildings’ comprised 28% of all gross fixed capital formation in Singapore for 2015, and
amounted to just over 7% of GDP.
Governments around the world have a strong interest in their housing markets for social
reasons, too. Housing is the locus of where people spatially organize their personal and
professional lives. Distributional issues often are relevant in the sense that affordability
conditions can be a central concern for policy makers.
These factors lead governments to intervene in their housing markets, and Singapore is no
exception. The government is centrally involved in the property markets generally via sales of
public land for private (and public) building. More recently, the government decided to respond
to a large increase of 40%+ in its aggregate housing prices following the global financial crisis.
In addition to potential financial stability worries raised by this sharp increase, affordability
conditions deteriorated by about one-third between 2007 and 2010, as reflected in rising price-to-
income ratios for those buying modest-sized HDB flats.2
The Singaporean government decided to try to cool its housing market, and did so via a
series of ten interventions that began in September 2009, with the last round implemented in
December 2013. Housing prices in the public (HDB) and private sectors kept rising through the
1 All figures in this paragraph are from Yearbook of Statistics Singapore, 2016. The next section goes into more
detail on the importance of housing in the Singaporean economy. 2 This is based on calculations we made of affordability conditions over time. Section III provides more detail.
3
middle of 2013, around the time of the eighth specific policy announcement (each of which is
described more fully in Section 3). Subsequently, prices have fallen by 10%-15% according to
different price indices for the public and private sectors. Over this same time period, economic
growth in Singapore has slowed, but statistical analyses we conducted to test formally for co-
movement between housing price and economic fundamentals such as GDP and consumption do
not show a tight link between changes in the series. This does not mean that real estate has no
impact on the broader economy; it does; rather it indicates that Singapore’s cooling measures
have not generated any type of major collapse in the broader economy. Affordability conditions
as we measure them in terms of price-to-income ratios for modest quality purchasers in the HDB
sector have returned to pre-price jump levels.
These are beneficial outcomes, but caution remains in order regarding the magnitude of the
overall success of the intervention. The drops in prices are relatively recent; they began in mid-
2013 with stabilization occurring within the past year or so. There could be lagged responses in
terms of households slowly adjusting consumption or firms altering their investment plans
downward that our statistical tests based on currently available data are not powerful enough to
pick up. Moreover, there are the standard economic concerns about inefficiencies generated
from deadweight losses associated with each imposition of a tax as reflected in a new and
different seller’s stamp duty. Many were imposed throughout the long cooling process.
Different policies were imposed roughly every six months, making it virtually impossible for us
(or the government) to know what the impacts of any one intervention was. Such a strategy is
bound to raise uncertainties for households, builders and investors. That can generate its own
efficiency losses in a complex durable goods market such as housing.
One also should be concerned about unintended consequences of any intervention. An

4
interesting stylized fact about price changes in the private sector is that they rose much more in
the less expensive neighborhoods outside the Central region of the city. While beyond the scope
of our report, one wonders why this pattern resulted and whether different policies might have
had greater impact on the cheaper neighborhoods in which one presumes the government was
most worried about deteriorating affordability conditions.
The remainder of the paper proceeds as follows. The next section provides an overview of
Singapore’s housing market and its role in the general economy. This is followed in Section 3
with a detailed description of Singapore’s series of cooling efforts, along with two statistical tests
of their effects. The paper closes in Section 4 with a broader discussion of the benefits and costs
of Singapore’s intervention strategy, and suggests some changes that we hope will improve
similar efforts in the future.
II. Real Estate in the Singaporean Economy
Singapore is a city-state with very limited land resources. Its population density is high at
just over 8,000 people per square kilometer, as a resident population of 5.784 million lives on a
total land area of 719.1 square kilometers. The country is also highly developed, as its gross
domestic product (GDP) per capita is Int$87,855, which ranks Singapore among the top four in
the world (International Monetary Fund, 2016).
Real estate is a very important component of Singapore’s national economy. The
category ‘Residential Buildings’ comprised 28% of all Gross Fixed Capital Formation in the
country in 2015. In absolute Singaporean dollars, this was 28.8 billion out of 102.7 billion in
5
total Gross Fixed Capital Formation.3 That amounts to 7.2% of the 402.5 billion in GDP that
same year. This is much higher than the analogous share in the United States, which was 3.4%
of American GDP in 2015.4
The economic importance of the housing sector is highlighted by how much of it there is,
how valuable it is and by its share of total assets in the household sector’s balance sheet. The
stock itself is large and the ownership rate is high in Singapore. There were 1,322,900
residential dwelling units according to the Yearbook of Statistics Singapore, 2016, more than
enough to house the 1,225,300 households recorded in the General Household Survey 2015. A
breakdown of unit types is as follows: 74.1% (or just over 980,000) were HDB flats, 19.4%
(about 257,000) were condominiums or other private sector apartments, with 5.6% (about
74,000) being landed homes, and just under 1% being of another typically low quality unit (e.g.,
shop houses, zinc-roofed units, etc.). The vast majority of these units is owned, as Singapore’s
homeownership rate is just over 90%, compared to a little over 60% in the United States.
In 2015, Residential Property Assets were worth 833.5 billion Singaporean dollars and
comprised nearly 49% of the 1.82 trillion in total assets held by the household sector according
to Yearbook of Statistics Singapore 2016. On average, Singaporean households do not have a
substantial amount of mortgage debt taken out against their homes. In 2015, there were 224.8
billion in mortgages outstanding according the Yearbook of Statistics Singapore, 2016’s data on
the household sector balance. That implies about a 27% aggregate loan-to-value ratio on homes
for the household sector overall (224.8/833.5~0.27). Not surprisingly, housing’s share of the net
3 All Singaporean national accounts figures are for 2015 and are from the Yearbook of Statistics Singapore, 2016.
This includes public and private residential building, with the private sector contribution being 80% of the total in
2015. 4 In the U.S. national income accounts, this category is called Residential Fixed Investment. Its share got as high as
6.1% near the height of the U.S. housing boom in 2005, but 2%-4% are more typical numbers across American
housing cycles.
6
worth of Singaporean households is quite high—at 55% (833.5/1,518), although home equity’s
share of net worth is only about 40% (608.7/1,518~0.40). These numbers show housing to be a
more important component of household sector net worth than even in the United States. In
America, total house value is on 22% of all household sector assets.5 That this is only 25% of
American household sector net worth is at least partially due to the higher homeownership rate in
Singapore, which was 90.8% in 2015 versus about 63% in the United States. Home equity as a
share of household sector net worth in America was only 14% in 2015.
These data demonstrate how important housing wealth is in the Singaporean economy.
The large share in the Singaporean household sector’s balance sheet suggests that there could be
potentially important economic ramifications of changes in house prices (via possible wealth
effects on consumption) or housing unit construction (directly impacting measured GDP). Thus,
the consequence of regulatory interventions could impact not only the real estate industry, but
the broader economy. We will return to these potential impacts later in this report.
III. Government Intervention in the Land and Housing Market in Singapore
3.1 Overview
The Singapore government has played a pivotal role in developing and managing the
residential land and property market. In 1960, the Singapore Government Housing Development
Board (HDB) was established to address the fact that 1.3 million people, out of an estimated
population then of 1.89 million, were squatters in slums. A quarter century later in 1985,
Singapore had virtually no squatters, no ghettos, and no large ethnic enclaves. That success is
5 All U.S. household balance sheet data in this section are from Table B.101 Balance Sheet of Households and
Nonprofit Organizations (1) from the Federal Reserve Statistical Release Z.1 Financial Accounts of the United
States, Historical Annual Tables 2005-2015.
7
far more than a housing development and regulation story, of course, as it reflects broad and
deep economic development at the societal level. Still, the Singaporean government has been an
active participant in its housing market for many decades. 6
Since its inception, HDB has built 1,116,485 residential dwelling units (including 8,650
HDB Design, Build and Sell Scheme (DBSS) units.7 Just over four-fifths (82%) of Singapore’s
resident population lived in HDB flats as of 2016. This publicly-provided housing constitutes
the largest stock of affordable units, with landed and non-landed housing units in the private
market being much more limited in number, but providing a variety of choice of unsubsidized
housing units for middle- and high-income households. In a typical upward housing mobility
process, households facing liquidity constraints start the housing ladder by buying public
housing units at concessionary prices from the government. One of the government’s goals is for
households to build housing wealth through price appreciation and non-cash subsidies in the
form of concessionary prices for new public housing purchases. As the data reported above
show, the government has been successful in this respect, as housing wealth is a very large
component of the typical Singaporean household’s net worth.
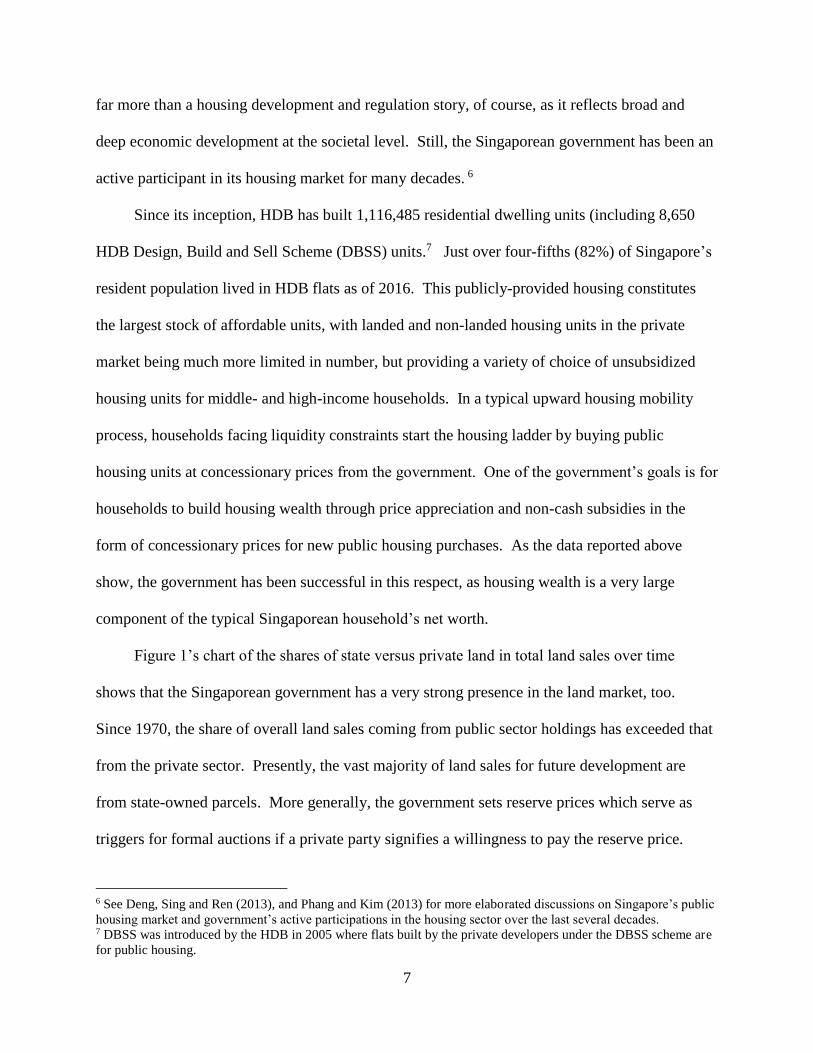
Figure 1’s chart of the shares of state versus private land in total land sales over time
shows that the Singaporean government has a very strong presence in the land market, too.
Since 1970, the share of overall land sales coming from public sector holdings has exceeded that
from the private sector. Presently, the vast majority of land sales for future development are
from state-owned parcels. More generally, the government sets reserve prices which serve as
triggers for formal auctions if a private party signifies a willingness to pay the reserve price.
6 See Deng, Sing and Ren (2013), and Phang and Kim (2013) for more elaborated discussions on Singapore’s public
housing market and government’s active participations in the housing sector over the last several decades. 7 DBSS was introduced by the HDB in 2005 where flats built by the private developers under the DBSS scheme are
for public housing.
8
Figure 1. Singapore State vs Private Land Shares over Time
Data source: Singapore Center for Livable Cities
Price-setting is one way in which the government can control the supply of land available for
developers.
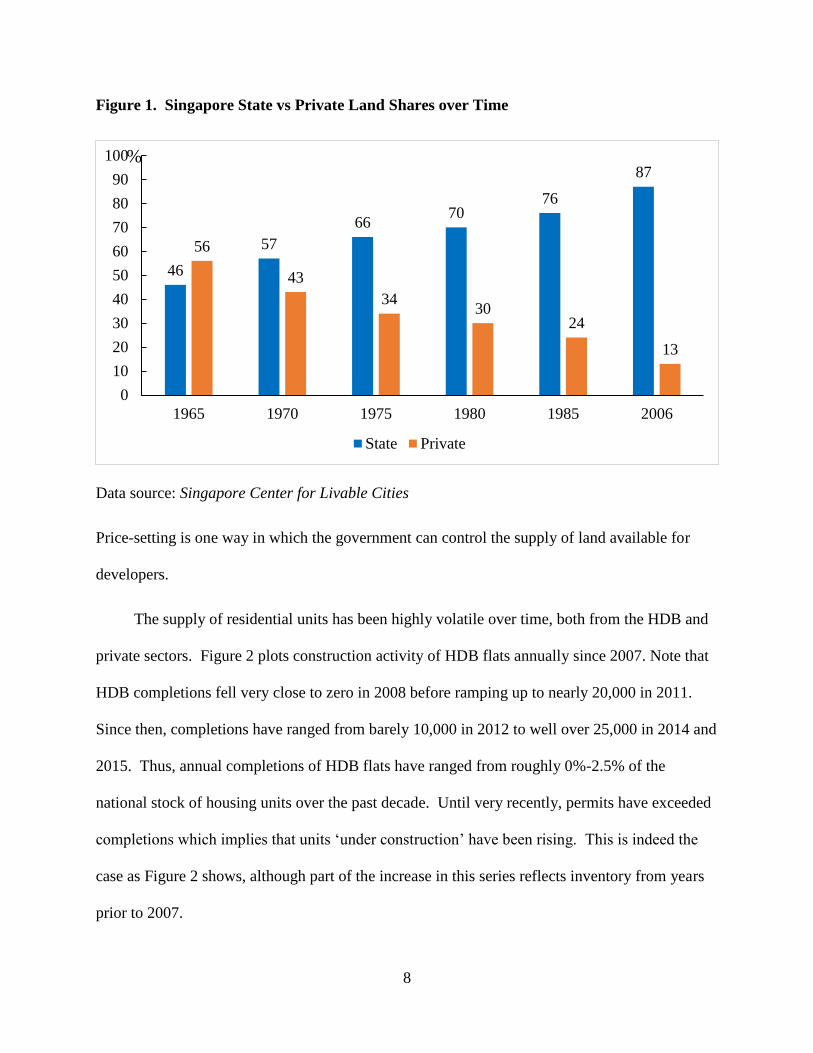
The supply of residential units has been highly volatile over time, both from the HDB and
private sectors. Figure 2 plots construction activity of HDB flats annually since 2007. Note that
HDB completions fell very close to zero in 2008 before ramping up to nearly 20,000 in 2011.
Since then, completions have ranged from barely 10,000 in 2012 to well over 25,000 in 2014 and
2015. Thus, annual completions of HDB flats have ranged from roughly 0%-2.5% of the
national stock of housing units over the past decade. Until very recently, permits have exceeded
completions which implies that units ‘under construction’ have been rising. This is indeed the
case as Figure 2 shows, although part of the increase in this series reflects inventory from years
prior to 2007.
46
57
6670
76
87
56
43
3430
24
13
0
10
20
30
40
50
60
70
80
90
100
1965 1970 1975 1980 1985 2006
State Private
%
9
Figure 2. Public Sector Building Activity
Data source: Data.gov.sg.
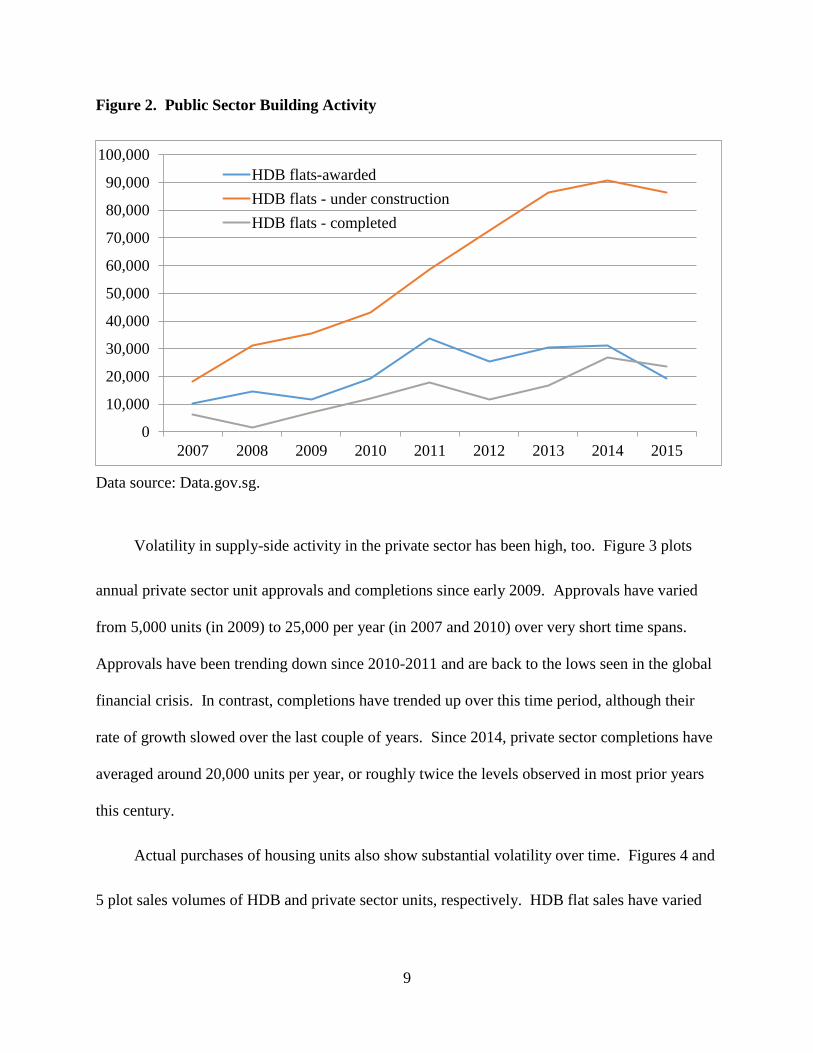
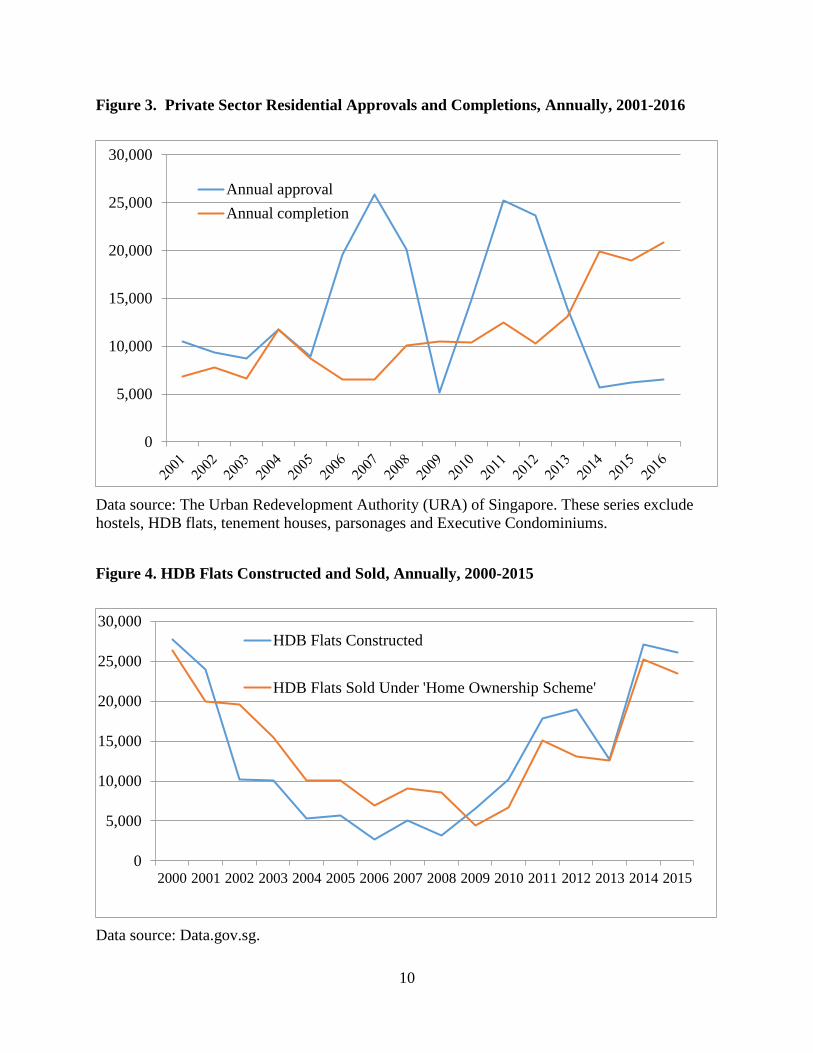
Volatility in supply-side activity in the private sector has been high, too. Figure 3 plots
annual private sector unit approvals and completions since early 2009. Approvals have varied
from 5,000 units (in 2009) to 25,000 per year (in 2007 and 2010) over very short time spans.
Approvals have been trending down since 2010-2011 and are back to the lows seen in the global
financial crisis. In contrast, completions have trended up over this time period, although their
rate of growth slowed over the last couple of years. Since 2014, private sector completions have
averaged around 20,000 units per year, or roughly twice the levels observed in most prior years
this century.
Actual purchases of housing units also show substantial volatility over time. Figures 4 and
5 plot sales volumes of HDB and private sector units, respectively. HDB flat sales have varied
0
10,000
20,000
30,000
40,000
50,000
60,000
70,000
80,000
90,000
100,000
2007 2008 2009 2010 2011 2012 2013 2014 2015
HDB flats-awarded
HDB flats - under construction
HDB flats - completed
10
Figure 3. Private Sector Residential Approvals and Completions, Annually, 2001-2016
Data source: The Urban Redevelopment Authority (URA) of Singapore. These series exclude
hostels, HDB flats, tenement houses, parsonages and Executive Condominiums.
Figure 4. HDB Flats Constructed and Sold, Annually, 2000-2015
Data source: Data.gov.sg.
0
5,000
10,000
15,000
20,000
25,000
30,000
Annual approval
Annual completion
0
5,000
10,000
15,000
20,000
25,000
30,000
2000 2001 2002 2003 2004 2005 2006 2007 2008 2009 2010 2011 2012 2013 2014 2015
HDB Flats Constructed
HDB Flats Sold Under 'Home Ownership Scheme'

11
from just under 5,000 in 2009 at the height of the global financial crisis to well over 20,000 per
year in 2014 and 2015 (and in 2000 and 2001). For many years prior to the global financial
crisis, purchases of HDB flats exceeded new units constructed, sometimes by as many as 10,000
homes. Since 2009, construction has outpaced sales annually. Transactions volumes in the
private sector also have varied substantially over time. Figure 5 (red bars) shows they quintupled
over the 2006-2007 period alone, before falling back to virtually zero in late 2008 and early
2009. They bounced back sharply over the ensuing year, but have trended down since then.
Thus, in the private sector, we see a market in which permits have fallen to very low levels, but
completions are relatively high while purchase activity is low.
Figure 5. Sales Volumes in the Singaporean Private Property Market (2009.03 – 2017.04;
2005.12=100)
Data source: The NUS SRPI is constructed by NUS Institute of Real Estate Studies. The sales
volume data are obtained from the REALIS of URA. See the URL at
https://spring.ura.gov.sg/lad/ore/login/index.cfm for more detail about the REALIS dataset.

12
Figure 6 reports prices in the public sector. This series tracks resale prices of HDB flats.
This HDB Resale Price Index (RPI) is calculated using resale transactions registered across
towns, flat types, and models. The base period is the 1st quarter of 2009, so that RPI has a value
of 100 in 1st quarter 2009.8 Note that the HDB index increased by nearly 50% from early 2009-
June 2013, before flatting out and then falling by 10.4% from an index value of 149.4 in June-
2013 to 133.9 in March-2017.
Figure 6. HDB Flats Resale Prices (2009Q1=100)
Data source: HDB InfoWEB, Resale Statistics, Resale Price Index (RPI).
Figure 7 then reports a private sector series published by the National University of
Singapore’s Institute of Real Estate Studies.9 This series begins further back in time so that we
8 The details of the construction the HDB RPI can be found in HDB InfoWEB, Resale Statistics, Resale Price Index
(RPI), (http://www.hdb.gov.sg/cs/infoweb/residential/buying-a-flat/resale/resale-statistics). 9 The Singapore Private Residential Price Index [SRPI] is a monthly transactions-based housing price index developed
and maintained by the Institute of Real Estate Studies (IRES) at the National University of Singapore which tracks
100
110
120
130
140
150
160 HDB Resale Price Index (2009Q1=100)
13
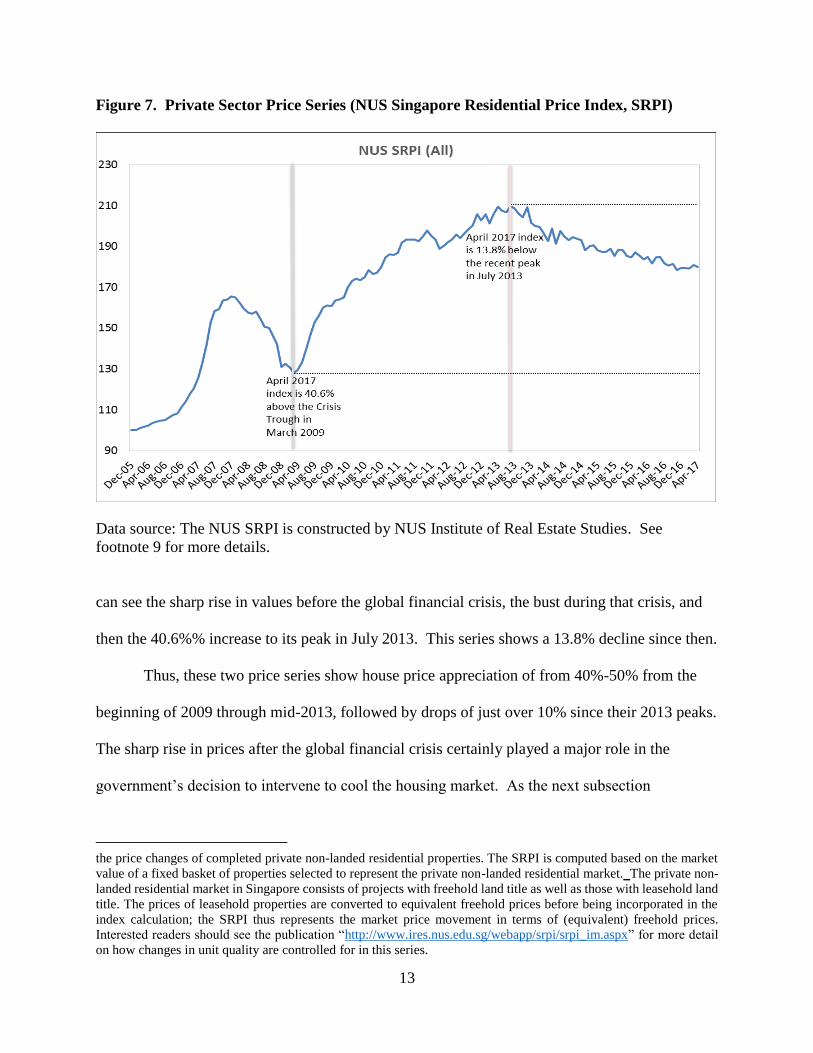
Figure 7. Private Sector Price Series (NUS Singapore Residential Price Index, SRPI)
Data source: The NUS SRPI is constructed by NUS Institute of Real Estate Studies. See
footnote 9 for more details.
can see the sharp rise in values before the global financial crisis, the bust during that crisis, and
then the 40.6%% increase to its peak in July 2013. This series shows a 13.8% decline since then.
Thus, these two price series show house price appreciation of from 40%-50% from the
beginning of 2009 through mid-2013, followed by drops of just over 10% since their 2013 peaks.
The sharp rise in prices after the global financial crisis certainly played a major role in the
government’s decision to intervene to cool the housing market. As the next subsection
the price changes of completed private non-landed residential properties. The SRPI is computed based on the market
value of a fixed basket of properties selected to represent the private non-landed residential market. The private non-
landed residential market in Singapore consists of projects with freehold land title as well as those with leasehold land
title. The prices of leasehold properties are converted to equivalent freehold prices before being incorporated in the
index calculation; the SRPI thus represents the market price movement in terms of (equivalent) freehold prices.
Interested readers should see the publication “http://www.ires.nus.edu.sg/webapp/srpi/srpi_im.aspx” for more detail
on how changes in unit quality are controlled for in this series.

14
documents, it did so via a sequence of policy changes.
3.2. Policy Measures to Cool Singapore’s Housing Market: September 2009-December 2013
The government’s interventions to cool the housing market are detailed in Appendix
Table 1. The first intervention occurred on September 14, 2009, with the removal of then extant
policies to boost the housing market. This was followed by nine other measures that were
imposed between February 20, 2010, and December 9, 2013.
The initial September 2009 policy abolished the then extant Interest Absorption Scheme
(IAS) and Interest-Only Housing Loans (IOL) programs. At the same, it was announced that
January 2009 budget assistance measures pertaining to the Residential Property Act would not be
extended.
Within a half year on February 20, 2010, the government clearly was still worried about
negative consequences of speculative activity, as it introduced a Seller’s Stamp Duty (SSD) for
properties sold within 1 year of purchase (up to 3% of the sales price) and simultaneously
lowered the loan-to-value ratio (LTV) to 80% for all housing loans provided by Financial
Institutes.
After another roughly half year period, on August 30, 2010, the SSD was changed to be
levied on properties sold within 3 years of purchases (more specifically, 3% for properties sold
within 1 year; 2% for 2 years and 1% for 3 years). For buyers already having one or more
outstanding housing loans (including HDB loans), the required minimum cash payment was
increased from 5% to 20% of purchase price, and LTVs were lowered from 80% to 70%.
A fourth round of cooling measure was announced on January 14, 2011. The SSD was
increased again, this time to cover properties sold within 4 years of purchase. The effective tax
15
rates became much higher, too: 16% for properties sold within 1 year; 12% for 2 years; 8% for 3
years and 4% for 4 years. The LTV was further lowered to 50% for purchasers that were not
individuals or households. For individuals and households with one or more outstanding housing
loans, the LTV was lowered to 60%.
Nearly a year passed before the government introduced an Additional Buyer’s Stamp
Duty (ABSD) on December 8, 2011. This included an additional 10% duty for foreigners, added
3% for a primary resident’s second property, and 3% for a Singaporean’s 3rd+ property.
Cooling round 6 was initiated on October 6, 2012, with the announcement that the length
of all residential loans would be capped at 35 years. Loans with terms in excess of 30 years
would have more burdensome LTV requirements, a rule that was applied to both private and
HDB properties.
As Figures 6 and 7 show, house prices in both the public and private sectors continued to
rise. So, on January 12, 2013, the government introduced a new set of cooling measures that
included provisions for ABSDs, LTVs, and minimum cash requirements at purchase. Appendix
Table 1 provides more detail on these features, which involved strengthening of already existing
measures. A new intervention was the imposition of a mortgage service ratio (MSR) for HDB
loans used to finance purchases or refinancings. No more than 30% of a borrower’s gross
monthly income could be used to finance payments on housing. Another policy introduced was
a requirement that primary residents would have to sell their HDB flat within six months of
purchasing a private sector housing unit.10 Finally, this portfolio included restrictions on
Executive Condominiums (EC). The maximum strata floor area of new EC units were capped at
160 square meters. Sales of new dual-key EC units were restricted to multi-generational families.
10 There also were rules introduced prohibiting the subletting of entire flats.

16
Developers of future EC sale sites from the Government Land Sales program were permitted to
launch units for sale fifteen months from the date of the award of the sites or after the physical
completion of foundation works, whichever was earlier. And, private enclosed spaces and
private roof terraces were to be treated as gross floor area (GFA). The GFA of such spaces in
non-landed residential developments, including ECs, would be counted as part of the ‘bonus’
GFA of a residential development and subject to payment of charges. This is in line with the
treatment of balconies under URA’s current guidelines.11
In the summer of the same year (June 29, 2013), the government instituted a total debt
service ratio (TDSR) that was capped at 60% for property loans taken out against Singaporean
and overseas properties (whether by individuals or entities established solely to purchase
properties). Later that same summer, on August 28, 2013, the government reduced the
maximum HDB loan tenure from 35 to 30 years, and made the maximum LTV on HDB loans
more binding for certain types of loans and borrowers.
The tenth and final cooling round occurred on December 9, 2013. With this initiative,
the government introduced three new measures to refine its Executive Condominium Housing
Scheme.
Appendix Table 1 describes each of these measures more fully. No further cooling
measures were introduced, but it was not until March 10, 2017, that the government formally
announced changes that ended the string of interventions to cool Singapore’s housing market.
Changes to the SSD and TDSR were announced, but there were no changes to extant ABSD or
LTV limits.
11 Interestingly, this announcement also included the first SSD for non-residential properties. For Industrial
properties, the SSD was 15% on properties held for under one year, 10% for those held between one and two years,
5% for those held between two and three years, with on duty imposed on properties held for at least three years.
17
3.3. Evaluating the Impact of Singapore’s Efforts to Cool Its Housing Market
There are formal and informal ways to investigate whether the Singaporean government
interventions had substantial impacts on the housing market specifically or the broader economy
more generally. Informally, one can simply look at what happened to the price growth series.
Both public and private market series kept rising for almost three years after the first cooling
initiative was announced and only started to fall by the latter half of 2013. However, such
‘eyeball econometrics’ certainly cannot attribute causality to any one intervention or to a group
of interventions.12 And, those aggregate series can mask important heterogeneity in how prices
changed across different subsets of the housing market.
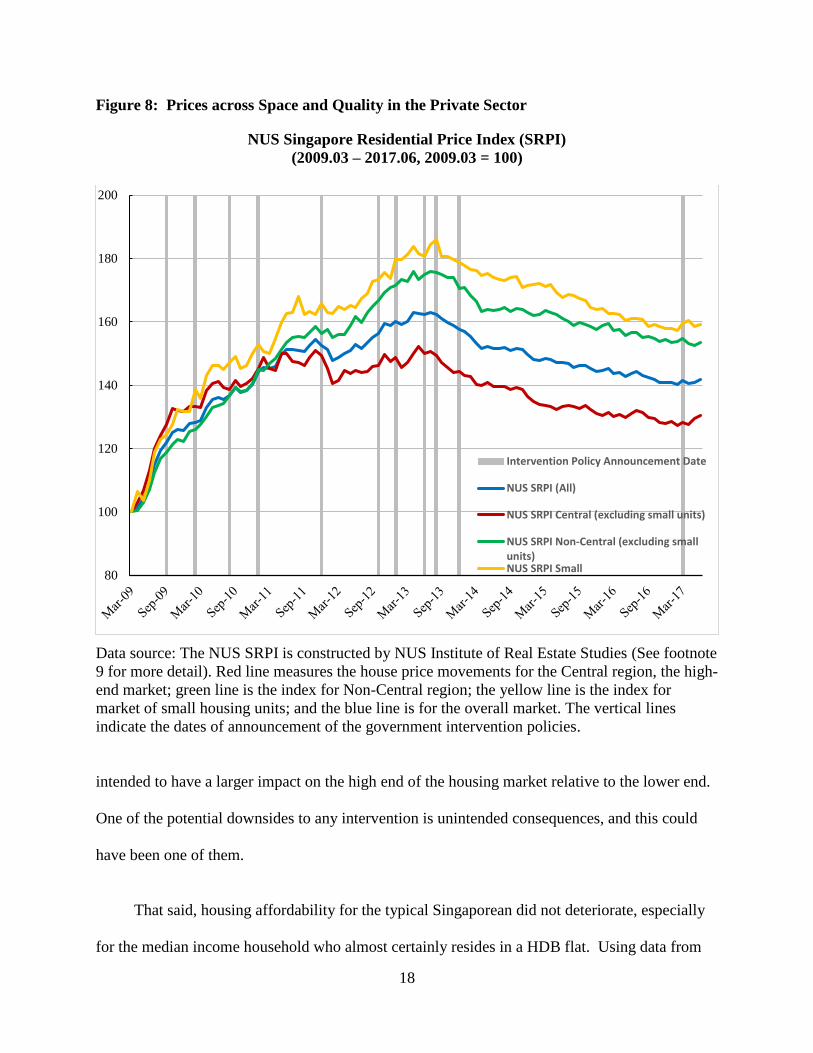
The potential importance of looking in more detail within a market is illustrated in Figure
8’s plot of price indexes for different sectors of the private, non-landed market. The highest-end
part of the market is depicted by the red curve for the Central Sector of Singapore. Lower
quality, smaller units are tracked in the yellow curve, with the green line for units outside the
Central Sector. All sectors are indexed to a value of 100 in the third quarter of 2009. Individual
policy interventions are marked by the blue, vertical dashed lines. Note that price growth in the
more expensive neighborhoods in the Central Sector experienced little more than half the
appreciation seen outside the Central Sector and among smaller units. Price appreciation across
higher versus lower quality units started to diverge in mid-2010 and widened more dramatically
from 2011-2013.
That what happened on average in a market differs from what happened away from the
mean can be highly relevant for policy analysis. It begs the question of whether the government
12 More specifically, one should not jump to the conclusion that the restrictive TDSR regulation imposed in late June
of 2013 was the causal factor. We will address this issue more formally below, and will show that there were not
any materially differential changes in price when comparing activity just after the intervention to just before the
intervention.
18
Figure 8: Prices across Space and Quality in the Private Sector
NUS Singapore Residential Price Index (SRPI)
(2009.03 – 2017.06, 2009.03 = 100)
Data source: The NUS SRPI is constructed by NUS Institute of Real Estate Studies (See footnote
9 for more detail). Red line measures the house price movements for the Central region, the high-
end market; green line is the index for Non-Central region; the yellow line is the index for
market of small housing units; and the blue line is for the overall market. The vertical lines
indicate the dates of announcement of the government intervention policies.
intended to have a larger impact on the high end of the housing market relative to the lower end.
One of the potential downsides to any intervention is unintended consequences, and this could
have been one of them.
That said, housing affordability for the typical Singaporean did not deteriorate, especially
for the median income household who almost certainly resides in a HDB flat. Using data from
80
100
120
140
160
180
200
Intervention Policy Announcement Date
NUS SRPI (All)
NUS SRPI Central (excluding small units)
NUS SRPI Non-Central (excluding smallunits)NUS SRPI Small
19
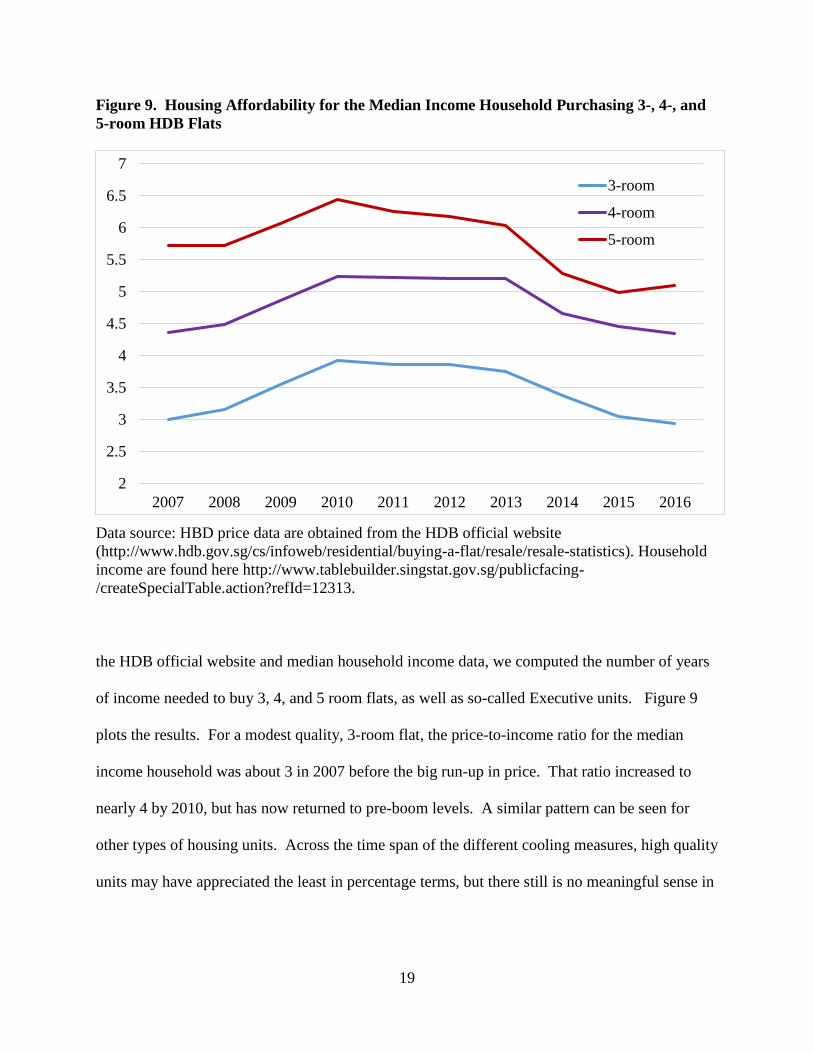
Figure 9. Housing Affordability for the Median Income Household Purchasing 3-, 4-, and
5-room HDB Flats
Data source: HBD price data are obtained from the HDB official website
(http://www.hdb.gov.sg/cs/infoweb/residential/buying-a-flat/resale/resale-statistics). Household
income are found here http://www.tablebuilder.singstat.gov.sg/publicfacing-
/createSpecialTable.action?refId=12313.
the HDB official website and median household income data, we computed the number of years
of income needed to buy 3, 4, and 5 room flats, as well as so-called Executive units. Figure 9
plots the results. For a modest quality, 3-room flat, the price-to-income ratio for the median
income household was about 3 in 2007 before the big run-up in price. That ratio increased to
nearly 4 by 2010, but has now returned to pre-boom levels. A similar pattern can be seen for
other types of housing units. Across the time span of the different cooling measures, high quality
units may have appreciated the least in percentage terms, but there still is no meaningful sense in
2
2.5
3
3.5
4
4.5
5
5.5
6
6.5
7
2007 2008 2009 2010 2011 2012 2013 2014 2015 2016
3-room
4-room
5-room

20
which one can conclude that affordability conditions are worse now for the typical Singaporean
household, especially for modest quality units.
3.3.1. Formal Statistical Evaluation: Cointegration Analysis
The discussion above documenting housing’s importance in both the household sector’s
balance sheet and in Singapore’s aggregate economy more generally raises the possibility that if
policy interventions change house prices (or if house price change exogenously for some other
reason), then we might also see their ramifications in other macro variables. For example,
changes in house prices could affect consumption (or output) as follows. We know from above
that housing equity is major component of overall household wealth for the typical Singaporean
household (who is an owner-occupier). Thus, if prices fall so that home equity declines, the
household may need to reduce consumption to restore its desired household wealth position. 13 It
is also possible that the scale of the real estate industry documented above could engender a tight
link between prices (or price changes) and the broader economy as reflected in measured GDP.
A well-known statistical approach to evaluating whether series like these move together is
via so-called cointegration tests that identify whether house prices covary over time with
macroeconomic indicators such as GDP, consumption, exports or imports, etc. They are obtained
from the Singapore Department of Statistics (http://www.singstat.gov.sg). The quarterly private
house prices and transaction volume variables are constructed based on the REALIS dataset. The
REALIS dataset provides us details of each transaction on private residential properties since
1995. By taking the average of house prices in each quarter, we get the quarterly private house
price variable. The transaction volume is defined as the total number of transactions on private
13 Agarwal and Qian (2017) study the consumption response to a housing policy experiment in Singapore that
resulted in a decrease in access to home equity. They report a statistically significant negative consumption response
to the housing market cooling policy shock, but their time period of analysis was before prices actually fell, so it is
not precisely the right experiment for our purposes.

21
residential properties in each quarter. The formal models we estimate, along with the statistical
results, are described in Appendix 2. Our tests use data from 1995(1)-2015(1).
Abstracting from the technical estimation details, we do not find convincing evidence that
house prices (whether measured by the HDB series or a unit housing price series we construct)
move together strongly with GDP, consumption, exports or imports. More formally, we fail to
reject the null that the housing market price series are not cointegrated with the different macro
variables in levels or first differences (i.e., price changes). Thus, the data do not provide support
for the contention that falls in house prices have resulted in materially lower consumption in
aggregate, which suggests that there is not a strong aggregate housing wealth effect channel in
the Singaporean data.
Does this imply that we were wrong above in arguing that real estate in general and
housing in particular are important components of the Singaporean economy? No, and the
reasons are as follows. One is that changes in house prices that affect home equity may not
actually impair household wealth in a way that impacts consumption. To see why, consider a
household that owns a $500,000 home that appreciates by 20% and is now worth $600,000. Is
the household really $100,000 wealthier (presuming debt and all else is held constant)? Not
necessarily. The household could sell its home for $600,000 in the current market, but it needs
to live somewhere. If it cannot trade down in quality and buy a cheaper home, so that is
continues to live in the same quality house, then it will cost $600,000 to buy that unit. This
household is not really wealthier from the rise in price.14 In this sense, homes are different from
stocks and other purely financial assets. If the same household bought a stock portfolio for
14 More formally, Poterba’s (1984) user cost of housing model implies that the costs to this owner of living in the
home rise proportionally to the rise in asset value. The two effects counterbalance and there is no net change in
wealth.
22
$500,000 last year and it is now worth $600,000, the household is $100,000 wealthier, as it can
maintain ownership of $500,000 worth of stocks, sell the rest and spend the proceeds on
consumption without lowering its original holdings of stock.15
Another potentially important reason why changes in prices might not move together with
changes in output, consumption, imports or exports is that the impacts might occur only with a
long lag and that we need more time to observe the impact of the recent drop in prices in
particular. This could happen for a number of reasons. One is that adjustment costs may be high
enough that households cannot (or do not want to) change spending patterns very quickly.
Another is that it may take a long time for changes in house prices to be salient enough for
households to recognize what has happened. The recent drop since 2013 has been fairly mild (at
the median) and has occurred slowly over time. More dramatic spikes or falls such as those that
occurred at the end of the last U.S. housing cycle in markets such as Las Vegas and Phoenix
might have different impacts.
A second set of results in Appendix 2 estimates the degree of cointegration of transactions
volume in the housing market with the same macroeconomic variables. We do find
cointegration between transactions volume and macro variables when we do not restrict the
trend, but those results are not robust to imposing a trend. Thus, it is possible that the
cointegration relationship we do find is due to spurious trend comovement between the two
series. The scale of the building activity relative to the overall economy suggested that there
would be some linkage, but the evidence is not strong. In addition, one needs to be careful that
15 Other reasons to think that housing-related wealth effects might exist is that financially constrained households
might be able to borrow against rises in home equity to finance added consumption. This is widely believed to have
happened in the United States during its last boom, but that requires a capital market and government regulator that
supports cash-out refinances. These are much less prevalent in Singapore (and other major Asian countries such as
China).
23
cointegration does not imply a specific direction of causality (e.g., from housing to the broader
economy).
We do not encourage interpreting these particular results as indicating that changes in the
housing market have had literally no impact on macroeconomic aggregates in Singapore. As just
noted, there is some evidence that transactions volumes in the housing market might be
cointegrated with macro variables such as output, consumption, exports and imports. And, house
prices (and their changes) may have complex and lagged effects that our tests and data simply
cannot identify. That said, the lack of strong cointegration with prices does indicate that the
Singaporean government’s interventions to cool the housing market have not as yet resulted in
major (negative) changes in aggregate consumption or output.
3.3.2. Formal Statistical Evaluation: Regression Discontinuity (RD) Analysis
Formal statistical evaluation of the impacts of Singapore’s individual moves to cool the
housing market is challenging for many reasons. For example, the policies themselves were
implemented at specific times during the boom or crisis periods when housing market conditions
are also being buffeted from shocks to the macro economy in Singapore market, in the region
(e.g., China) or even globally. This makes it difficult to cleanly identify a treatment group and a
control group for the purpose of estimating the counterfactual status of treated samples in case of
no treatment. In addition, the regulations usually were implemented as a policy package over a
fairly narrow time frame, often within six months of one another. Thus, disentangling the
treatment effects of each measure is nearly impossible. Policy evaluation research like this also
tends to suffer from a lack of suitable micro-level data, although we are more fortunate than
many researchers in this respect. That said, the low frequency of house price data increases the
24
difficulty of inferring the causal effects of property market policies.
Our empirical approach here is to us regression discontinuity analysis to estimate
whether prices changed around the time of the announcement. This is done using micro data on
property market sales prices and transactions volumes. The underlying data are from REALIS,
which is described above. Hence, these tests are implemented using data from the private sector,
not the HDB sector.
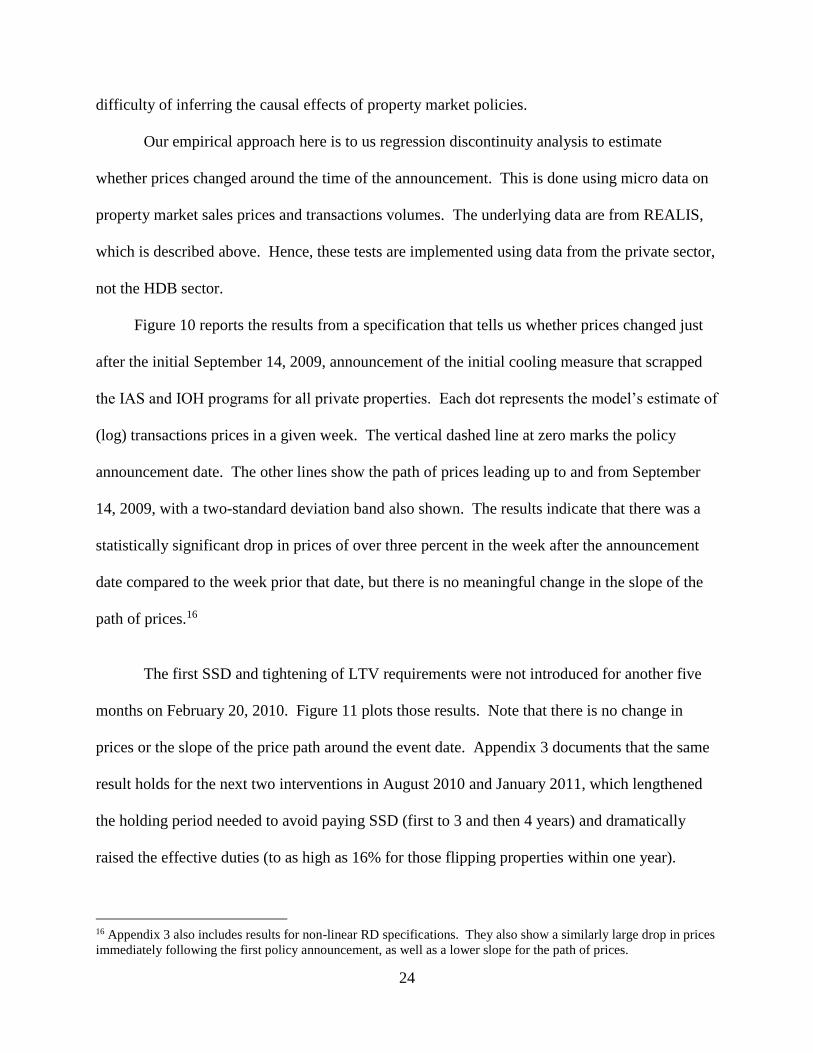
Figure 10 reports the results from a specification that tells us whether prices changed just
after the initial September 14, 2009, announcement of the initial cooling measure that scrapped
the IAS and IOH programs for all private properties. Each dot represents the model’s estimate of
(log) transactions prices in a given week. The vertical dashed line at zero marks the policy
announcement date. The other lines show the path of prices leading up to and from September
14, 2009, with a two-standard deviation band also shown. The results indicate that there was a
statistically significant drop in prices of over three percent in the week after the announcement
date compared to the week prior that date, but there is no meaningful change in the slope of the
path of prices.16
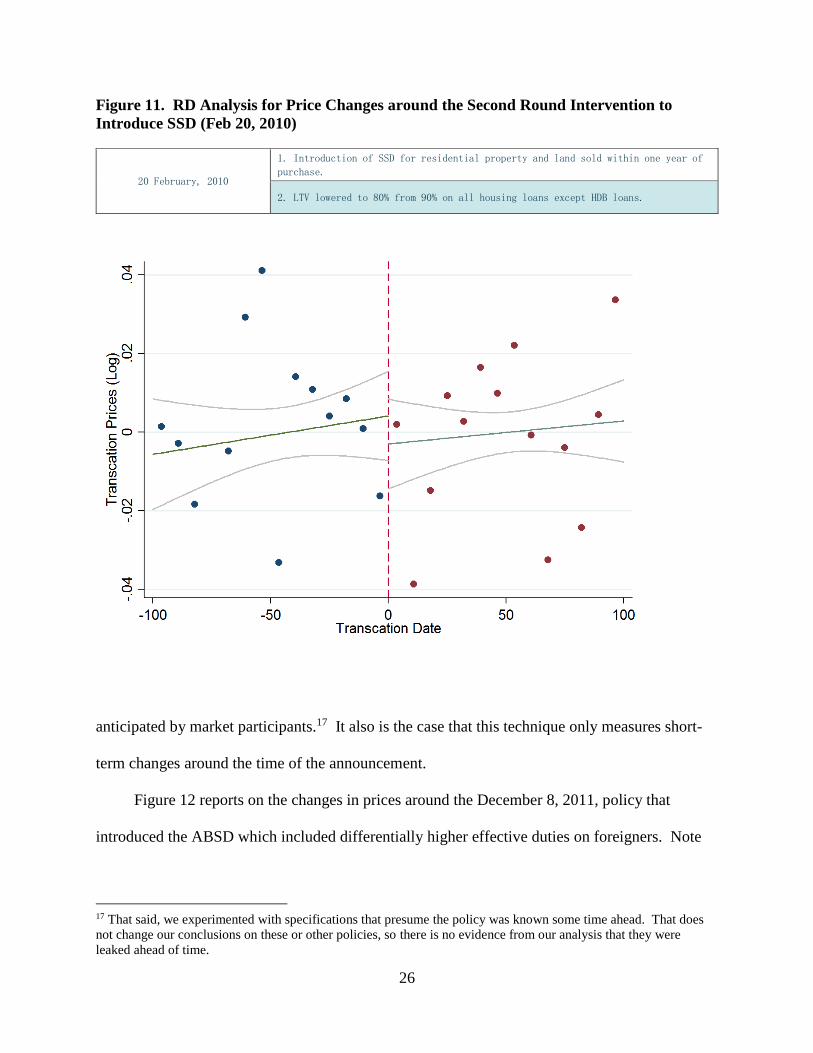
The first SSD and tightening of LTV requirements were not introduced for another five
months on February 20, 2010. Figure 11 plots those results. Note that there is no change in
prices or the slope of the price path around the event date. Appendix 3 documents that the same
result holds for the next two interventions in August 2010 and January 2011, which lengthened
the holding period needed to avoid paying SSD (first to 3 and then 4 years) and dramatically
raised the effective duties (to as high as 16% for those flipping properties within one year).
16 Appendix 3 also includes results for non-linear RD specifications. They also show a similarly large drop in prices
immediately following the first policy announcement, as well as a lower slope for the path of prices.

25
Figure 10. RD Analysis for Price Changes around the Initial Intervention (Sept 14, 2009)
14 September, 2009
1. Interest absorption scheme (deferment of instalments until TOP) and interest-
only housing loans (interest payment only until TOP) were scrapped for all
private properties.
Caution is in order when interpreting this set of results, as they highlight the strengths and
weaknesses of the estimation techniques being used. Taken literally, they imply that scrapping a
couple of minor subsidy programs had a material impact that lowered prices in the short term,
but that imposing increasingly strict taxes on short-term property flipping had no impact. A
plausible alternative interpretation is that the initial intervention to cool the market was a real
surprise and signaled the government would intervene further if necessary, with that implication
helping explain the immediate drop in prices and the fact that there were no changes associated
with the next three policy announcement. In essence, some of the future policies may have been
26
Figure 11. RD Analysis for Price Changes around the Second Round Intervention to
Introduce SSD (Feb 20, 2010)
20 February, 2010
1. Introduction of SSD for residential property and land sold within one year of
purchase.
2. LTV lowered to 80% from 90% on all housing loans except HDB loans.
anticipated by market participants.17 It also is the case that this technique only measures short-
term changes around the time of the announcement.
Figure 12 reports on the changes in prices around the December 8, 2011, policy that
introduced the ABSD which included differentially higher effective duties on foreigners. Note
17 That said, we experimented with specifications that presume the policy was known some time ahead. That does
not change our conclusions on these or other policies, so there is no evidence from our analysis that they were
leaked ahead of time.

27
Figure 12. RD Analysis for Price Changes around the 5th Round Intervention to Introduce
ABSD (Dec 8, 2011)
8 December, 2011
1. ABSD introduced for further cooling measures:
-Foreigners and non-individuals pay 10%, PRs buying second and subsequent
property pay 3%, Singaporeans buying third and subsequent property pay 3%.
2. Developers purchasing more than four residential units and following through
on intention to develop residential properties for sale would be waived ABSD
-To qualify, developers have to produce proof of development and sale within
five years.
that there is a discrete jump, not fall, in prices after this announcement. The change is a
statistically significant 4%. That this policy resulted in an immediate increase in prices indicates
that at least some of the true economic incidence fell largely on the buyers. Sellers did not have
to lower prices by the full amount of the duty. Foreigners especially appear to have had such an
inelastic demand for Singaporean housing that they were willing to bid up values in the face of
the tax. Appendix 3 indicates that something similar happened over a year later in January 2013,
28
when further changes to the ABSD were announced, with foreign purchasers again being treated
differentially (harshly). That is, prices jumped after the policy announcement, once again by
3%-4%. However, none of the remaining three policy interventions were associated with a
meaningful change in prices around the announcement dates.
In sum, this set of tests focusing on whether there was any immediate impact of a specific
policy announcement on prices in the private housing market provides mixed results. There is
evidence that the initial intervention was influential. However, the long sequence of subsequent
interventions makes it hard to identify individual effects, with most RD results showing no near-
term impact on prices. The fact that the specific announcements regarding ABSD with special
treatment of foreign buyers resulted in jumps in prices is also interesting, as it suggests those
buyers had very inelastic demands for Singapore housing. They were willing to pay more in the
face of the tax, as opposed to forcing the sellers to lower their prices by the full amount of the
special duty.
IV. Discussion and Conclusions
Evaluating any government’s intervention in its housing markets always is a challenging
undertaking because housing itself is a complex durable good which makes the market itself
complex. Moreover, the housing market is closely linked with so many other economic sectors
that it is virtually impossible to ‘hold all else constant’ in empirical analysis. Still, there is a
conceptual goal for intervention that can help guide regulators to more efficient outcomes. That
framework is described in the next subsection before we conclude with comments on
Singapore’s recent efforts to cool its housing markets.
29
4.1 Economically Efficient Housing Market Outcomes: A Target for Government Intervention
Governments around the world regularly intervene in their housing markets in a variety of
ways because housing is so socially and economically important. Housing is the sector in which
citizens organize their lives spatially, and any responsible government cares about how their
citizens live. ‘Making housing affordable’ is a typical goal, and it is useful to interpret that from
a market efficiency perspective.
For example, one question faced by government is whether it should try to reduce high
house prices to help achieve its affordability goal.18 In terms of pure economic efficiency, the
correct answer is ‘not necessarily’, as high prices may be serving a valuable economic role of
signaling a shortage and the need for added supply or the development of substitutes or other
alternatives. The answer would be ‘yes’ if monopoly power or other artificial supply restrictions
exist that are generating the high prices.19 Another justification for intervention would be the
need to maintain financial stability—if the government believed that prices were high for
speculative reasons not driven by fundamentals.
In housing, there is a benchmark one can use to help make sense of when markets are
affordable versus unaffordable from a supply-demand perspective. Developed by Glaeser and
Gyourko (2008), the argument rests on simple microeconomic fundamentals. In housing
markets, in which we typically believe that homebuilders can replicate a building at fairly close
to constant cost (in free land and labor markets), then the supply of (constant quality) housing
should be fairly elastic. That is depicted below in Figure 13, where Q* equals the current
That overall cost is what Glaeser and Gyourko (2008) term minimum profitable production
18 This is also routinely asked regarding energy prices. 19 Glaeser and Gyourko (2008) have argued that binding city-level restrictions on residential building in America’s
large coast markets reflect a type of market power that has led to artificially high prices. In this case, the
intervention should be to try to increase supply to combat the monopoly-like conditions.

30
Figure 13. The Minimum Profitable Production Cost (MPPC)
number of housing units in the market, and the flat supply schedule indicates that more could be
built at the same cost.cost (MPPC). It is made up of three terms: (a) the price of land (L) that
would obtain in a free market in which it could be traded at will; (b) the physical cost of
construction (CC), which includes all labor and materials costs needed to put up the building
itself; and (c) a normal entrepreneurial profit (DevProfit) for the homebuilder to compensate him
for taking on development risk. Thus, MPPC = L + CC + DevProfit. In a market with elastic
supply, price will equal this amount (i.e., P = MPPC) because demand will intersect supply on its
horizontal part as long as the city is growing.
This is not just the market price in equilibrium, but MPPC represents the true social cost of

31
supplying another unit of housing to the market. That cost is made up of the use of additional
land, additional labor and materials, and risk taken on by the builder. It is inefficient if the price
consumers pay for the unit is less than or greater than the true social cost (or MPPC). If market
prices are below MPPC, then people are not paying the full social cost of bringing the marginal
unit to market, and too much is being built; conversely, if market prices are well above MPPC,
then it is almost certainly the case that supply is being restricted and land prices being bid up;
existing landowners benefit, but that is an economic rent that they did not truly earn, and it
comes at the cost of too little housing being built, with demanders losing out by having to pay
artificially high prices.
From an efficiency perspective, governments should use the gap between market prices
and MPPC as guides for policy intervention.20 If market price equals MPPC, then there is no
obvious need for intervention, as builders are supplying new units and households are buying
them at their full social cost. It is not possible to produce a new unit at less the total social cost,
so no attempts should be made to price below that level.21 If prices have fallen below MPPC,
government should reexamine any subsidy programs it has that might have stimulated
overproduction. And, if prices are well above MPPC, then it should examine whether there are
artificial constraints preventing new supply, as if land and labor are priced fairly in free markets,
builders should be able to earn normal profits if prices are equal to MPPC.
20 The MPPC can be calculated in markets such as Singapore in which supply is thought to be more inelastic in
nature. 21 There still can be a case for policy intervention on distributional grounds, as there typically are some people in the
society who are so poor that they cannot afford housing priced at its full social cost (i.e., MPPC). In this case, the
proper response is to transfer income to the impoverished households so that that can buy the desired goods at
market prices. Intervening directly in the housing market itself would only distort an already efficient market.
There is no single correct answer on transfer policy in this case. Some societies are more egalitarian than others,
and will engage in larger income transfers. That is their preference and there is nothing in economics to say that is a
poor or incorrect policy. What economics can say is that there are costs to distorting efficiently priced markets, and
governments should not do if there are less costly ways to achieve their social goals (which would be an income
transfer to poor households in this particular context).

32
4.2. Putting Singapore’s Cooling Efforts in Perspective
The first question one should ask is whether the government had plausible reason to
intervene in the housing market. The answer is ‘yes’ on at least two grounds. The sharp rise in
prices across the HDB and private sectors following the onset of the global financial crisis
reasonably could have led regulators to believe that destabilizing speculative forces were at
work. On social grounds, the government probably was also concerned by the deterioration in
affordability conditions. Figure 9 above shows that the price-to-income ratio for people buying a
modest 3-room HDB flat rose by one-third between 2007 and 2010.
That there are reasonable grounds for intervening does not mean the regulators always
should act. That depends upon whether they can intervene at low enough cost to justify the
alleged benefits. Housing is such an important asset in the Singaporean economy and in terms of
household sector wealth that policies to lower its value always run the risk of creating collateral
damage in terms of consumption and output. Singaporean economic growth has fallen since the
global financial crisis, but co-integration tests do not indicate tight links between housing prices
(or price changes) in the private sector and output or consumption changes in the broader
economy. Of course, this does not prove that dampening the housing market literally had no
effect on the economy; logic suggests otherwise; rather, the proper conclusion is that the
impacts were not so significant (thus far, at least) that our statistical tests can pick them up.
Moreover, no test is foolproof and our co-integration test is an indirect way to measure this
policy effect.
There seems little doubt that the government would be pleased with the improvement in
33
affordability conditions documented in Figure 9. By the end of the cooling interventions,
modest-income Singaporean households were paying the same multiple of income for a HDB
flat as before the run-up in price.
That is not a bad report card, and arguably is a pretty good one. Even so, there are
worrisome features. One is the high level of volatility in quantities built and bought on the
supply side. This is evident prior to the policy intervention, too (see Figures 3 and 4 above).
Singapore is a mature, advanced economy, so it is unlikely that its true underlying fundamentals
are changing enough to justify such wide swings in building activity. Given the government’s
prominent role in the land and housing markets, it probably would be wise to reexamine its own
policies that might be contributing to this volatility. Housing is a complex market because it is a
long-lived durable good that cannot be built quickly, so perfect matching of supply with demand
is not feasible. However, efficiency will be enhanced in this type of market the more predictable
and stable policy is—especially on the supply side. 22
A second worry relates to the complexity and nature of the recent cooling interventions. It
is true that the economy or consumption did not collapse as a result of these interventions, but it
still is the case that a deadweight efficiency loss is created with every new tax imposed (and
most other regulations).23 Recall that we find relatively little evidence of near term price effects
from most of the interventions analyzed in Section 3.3.2. Given how quickly new interventions
22 Fu, Qian and Yeung (2016) study the impact of the Singapore government’s changes in the housing transaction
stamp duty policy in recent years and find that the rise in transaction cost substantially reduced speculative trading
in the treatment segment, significantly raised its price volatility and reduced price informativeness. They suggest
that the results are likely due to a relatively greater withdrawal by informed speculators than by destabilizing
speculators following the transaction cost increase. 23 Deng, Tu and Zhang (2016) study the impact of the effectiveness of the one of the key cooling measures
introduced by the Singapore Government -- the seller’s stamp duty (SSD). They find that SSD is less effective for
cooling the housing market in short run, but can play a positive role to maintain market stability in long run.
However, the study also find that aggressively using SSD may weaken the effectiveness of the subsequent additional
buyer’s stamp duty (ABSD) in curbing a housing market boom and lead to housing market anomalies.

34
were announced (roughly every six months), we doubt the government knew what the individual
policy impacts were either, especially in real time. Uncertainty among households and home
builders is heightened by this, which can create its own distortions. To reiterate, this did not
cause some economic collapse, but the efficiency losses are still there. Over time, they can add
up, especially when they are numerous as is the case here.
Implementing policy in rapid sequence that prevents fuller knowledge of effects along the
way also increases the risk of unintended consequences. One of the surprises to us was in Figure
8, which showed that values in the more preferred Central parts of Singapore rose less than other
parts of the city-state throughout the cooling efforts period. Presumably, the distributional goals
of the government were more concerned with making less expensive neighborhoods and housing
units more affordable to modest-income households. This raises the prospect that a different
policy mix would have had greater effects in more modestly-priced neighborhood. However, it
is possible that the government’s distributional goals might have included dampening down
prices in the most expensive units in the city. If so, that probably should be announced, as
transparency would allow builders and investors to plan accordingly.
A related question involves the costs and benefits of the policies imposing special duties
on foreign purchasers, regardless of their holding period of the property. Foreign capital flows
can be destabilizing, especially for a small country such as Singapore. But, small countries also
tend to interact with and need foreigners to grow and prosper. Targeting flippers is one thing,
but specially targeting foreigners is another, and could have longer-term consequences for their
view of investing in Singapore. Hence, we wonder how the government conceived of the costs
and benefits in this case.

35
4.3. Final Conclusions
As with many other countries around the world, Singapore’s government intervenes in its
housing markets in various ways. Given housing’s importance in the broader economy and as
part of the household sector’s net worth, it is vital that policy makers always intervene with great
care. If the potential costs are too high, it should not intervene and it should never intervene in
an afford to drive prices below their true social production cost.
Its recent efforts to cool the housing market, presumably undertaken to address
deteriorating affordability conditions for the typical household and to address potentially
destabilizing speculation, appear to have achieved their primary goals without significant
collateral damage to the broader economy. While that is a good outcome in and of itself, there
still are ways to improve policy implementation going forward.
Even before the sharp house price increase following the global financial crisis, supply
fluctuations were quite large on an annual basis. It seems unlikely these were driven by changes
in underlying fundamentals in such a mature economy as Singapore’s. Some of this seems likely
driven by policy itself. More stability and transparency in land sales and permitting activity
would reduce uncertainty for market participants, and raise welfare for suppliers and demanders
alike.
We also recommend policy implementation that can be well measured so that it can be
determined what works and what does not. The rapid sequence of recent cooling measures
makes it very hard to evaluate the impact of any one policy. There may have been a need for this
process, but it is not ideal as a general rule, because market participants cannot readily anticipate
future policies and plan accordingly. In a complex and expensive durable goods market such as
housing, that can be costly.

36
Unintended consequences are inevitable for any significant policy intervention, not just the
recent cooling measures. Both the government and private sector should closely monitor
consequences across the market and its different participants, and use those data to fine tune
policy as appropriate. We found fairly large differences across neighborhoods, with less
appreciation in private home values in the more expensive Central locations of Singapore.
Finally, the consequences (especially the potentially negative ones) of all interventions
should be considered. Here, we reference the targeting of foreign purchases, independent of
whether they involved, short-term flipping strategies. There can be good reasons for such
restrictions on foreigners, but there are potentially high long-run costs to such a policy,
especially for a small, open economy such as Singapore’s.
37
Selected References
Agarwal, Sumit and Wenland Qian. (2017). “Access to Home Equity and Consumption: Evidence
from a Policy Experiment,” Review of Economics and Statistics, 99(1), 40-52.
Deng, Yongheng, Sing, Tien Foo, and Ren Chaoqun. (2013) “The Story of Singapore’s Public
Housing: From a Nation of Home-Seekers to a Nation of Homeowners,” in The Future of Public
Housing: Ongoing Trend in the East and the West. Springer.
Fu, Yuming, Wenlan Qian and Bernard Yeung. 2016). “Speculative Investors and Transaction Tax:
Evidence from the Housing Market,” Management Science, 62(11) 3254-3270.
Glaeser, Edward L, and Joseph Gyourko. (2008). Rethinking Federal Housing Policy: How to
make Housing Plentiful and Affordable. American Enterprise Institute Press.
Phang, Sock-Yong and Kim, Kyung-Hwan. (2013) “Singapore’s Housing Policies: 1960-2013,”
paper for “Case Study Knowledge & learning Workshop”.
Deng, Yongheng, Yong Tu and Yanjiang Zhang. (2016) “The Behaviors of Flippers, Rental
Investors and Owner-Occupier4s in Singapore Private Housing Market,” NUS Institute of Real
Estate Studies Working Papers.