Simulation and Analysis of Dart Dispense Events with Collisions
Final Report Award Number: N00014-06-C-0011
William E. Dietz, Principal Investigator Phone: 256-327-8132
Fax: 256-327-8120 Email: [email protected]
James Y. Baltar
Kevin Losser Morris Morell
Digital Fusion Solutions, Inc. 5030 Bradford Drive Building 1, Suite 210 Huntsville, AL 35806
Report Documentation Page Form ApprovedOMB No. 0704-0188
Public reporting burden for the collection of information is estimated to average 1 hour per response, including the time for reviewing instructions, searching existing data sources, gathering andmaintaining the data needed, and completing and reviewing the collection of information. Send comments regarding this burden estimate or any other aspect of this collection of information,including suggestions for reducing this burden, to Washington Headquarters Services, Directorate for Information Operations and Reports, 1215 Jefferson Davis Highway, Suite 1204, ArlingtonVA 22202-4302. Respondents should be aware that notwithstanding any other provision of law, no person shall be subject to a penalty for failing to comply with a collection of information if itdoes not display a currently valid OMB control number.
1. REPORT DATE 2006
2. REPORT TYPE N/A
3. DATES COVERED -
4. TITLE AND SUBTITLE Simulation and Analysis of Dart Dispense Events with Collisions
5a. CONTRACT NUMBER
5b. GRANT NUMBER
5c. PROGRAM ELEMENT NUMBER
6. AUTHOR(S) 5d. PROJECT NUMBER
5e. TASK NUMBER
5f. WORK UNIT NUMBER
7. PERFORMING ORGANIZATION NAME(S) AND ADDRESS(ES) Digital Fusion Solutions, Inc. 5030 Bradford Drive Building 1, Suite 210Huntsville, AL 35806
8. PERFORMING ORGANIZATIONREPORT NUMBER
9. SPONSORING/MONITORING AGENCY NAME(S) AND ADDRESS(ES) 10. SPONSOR/MONITOR’S ACRONYM(S)
11. SPONSOR/MONITOR’S REPORT NUMBER(S)
12. DISTRIBUTION/AVAILABILITY STATEMENT Approved for public release, distribution unlimited
13. SUPPLEMENTARY NOTES The original document contains color images.
14. ABSTRACT
15. SUBJECT TERMS
16. SECURITY CLASSIFICATION OF: 17. LIMITATION OF ABSTRACT
SAR
18. NUMBEROF PAGES
23
19a. NAME OFRESPONSIBLE PERSON
a. REPORT unclassified
b. ABSTRACT unclassified
c. THIS PAGE unclassified
Standard Form 298 (Rev. 8-98) Prescribed by ANSI Std Z39-18
2
LONG-TERM GOALS Current approaches to beach and surf zone mine clearance depend on the dispensing of large numbers of darts from a parent missile or projectile. The mine clearance mission requires a uniform distribution of darts over the target area. The dispersal pattern is affected by many factors, including the angle of attack, velocity, and rotational rate of the parent vehicle, the aerodynamic design of the darts, dart collision, and the different aerodynamic regimes that exist in the vicinity of the dispenser. In the overall effort, computational modeling and simulation is used to provide insight and understanding of the dispense event. The primary long-term goal of the present effort is to understand and characterize, through simulation, analysis, and comparisons to wind tunnel and flight tests, the most important physical processes underlying the behavior of dispense events. OBJECTIVES Multiple-dart dispense systems are characterized by collisions between the darts or between the darts and parent vehicle, the presence of darts in the wake regions of other darts, and darts at high angles of attack. In previous efforts, two major dart configurations were under consideration: NGFS, which was fired from a gun, and MODS, which is designed to be dropped as a store from an aircraft. In this effort, the MODS configuration only is considered. In the MODS configuration, dart packs are exposed suddenly to ambient flow. The effect is to push the leading pack of darts into the trailing darts. Photographs from sled tests show that massive collisions occur, with the secondary effect that many darts attain very high angles of attack. This behavior leads to two main questions addressed in this effort:
• What is the relative effect of collisions, aerodynamics, and kinematics on dart dispersal?
• How are darts affected by the wake of leading darts at high angles of attack? The analysis of collision phenomena and high-alpha wake effects provides insight into the most important phenomena associated with a MODS dispense, and provides the foundation and underlying impetus of this effort. APPROACH The current effort undertakes four tasks that are critical to the effective analysis of proposed designs. They are 1) Collision Analysis, 2) Tandem Dart Wake Modeling, 3) MODS Dispense Event Simulation, and 4) Large Dart Pack Computations.
3
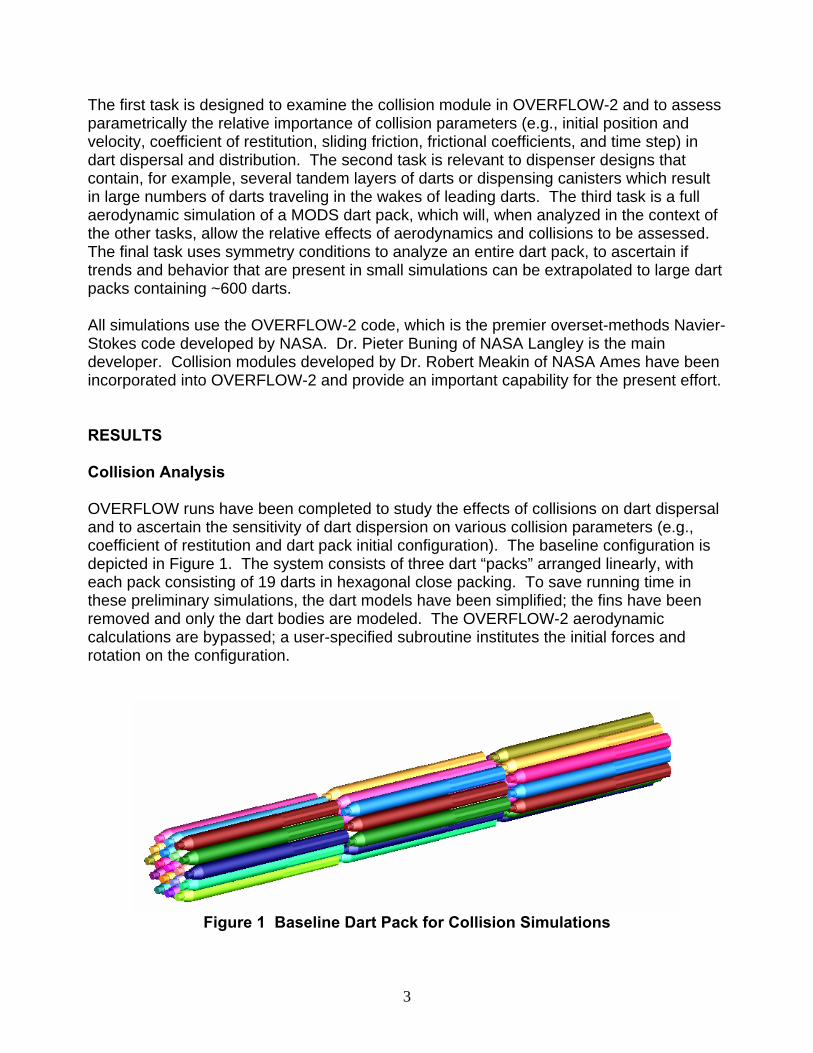
The first task is designed to examine the collision module in OVERFLOW-2 and to assess parametrically the relative importance of collision parameters (e.g., initial position and velocity, coefficient of restitution, sliding friction, frictional coefficients, and time step) in dart dispersal and distribution. The second task is relevant to dispenser designs that contain, for example, several tandem layers of darts or dispensing canisters which result in large numbers of darts traveling in the wakes of leading darts. The third task is a full aerodynamic simulation of a MODS dart pack, which will, when analyzed in the context of the other tasks, allow the relative effects of aerodynamics and collisions to be assessed. The final task uses symmetry conditions to analyze an entire dart pack, to ascertain if trends and behavior that are present in small simulations can be extrapolated to large dart packs containing ~600 darts. All simulations use the OVERFLOW-2 code, which is the premier overset-methods Navier-Stokes code developed by NASA. Dr. Pieter Buning of NASA Langley is the main developer. Collision modules developed by Dr. Robert Meakin of NASA Ames have been incorporated into OVERFLOW-2 and provide an important capability for the present effort. RESULTS Collision Analysis OVERFLOW runs have been completed to study the effects of collisions on dart dispersal and to ascertain the sensitivity of dart dispersion on various collision parameters (e.g., coefficient of restitution and dart pack initial configuration). The baseline configuration is depicted in Figure 1. The system consists of three dart “packs” arranged linearly, with each pack consisting of 19 darts in hexagonal close packing. To save running time in these preliminary simulations, the dart models have been simplified; the fins have been removed and only the dart bodies are modeled. The OVERFLOW-2 aerodynamic calculations are bypassed; a user-specified subroutine institutes the initial forces and rotation on the configuration.
Figure 1 Baseline Dart Pack for Collision Simulations
4
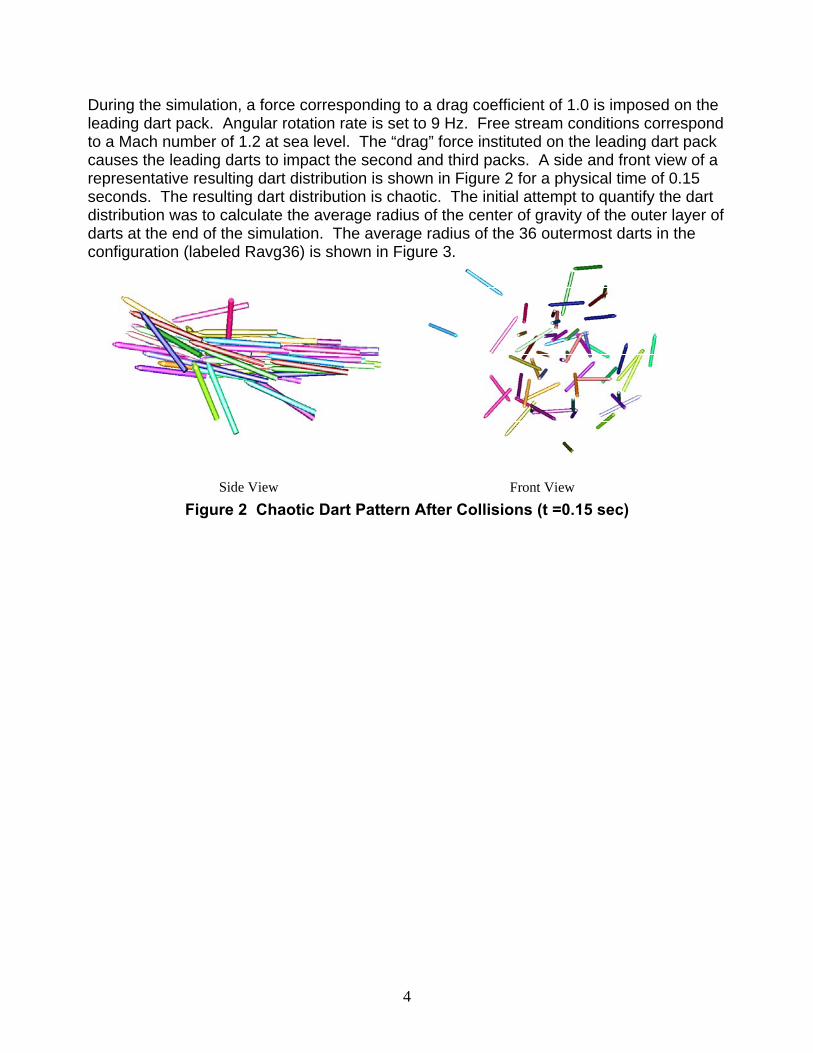
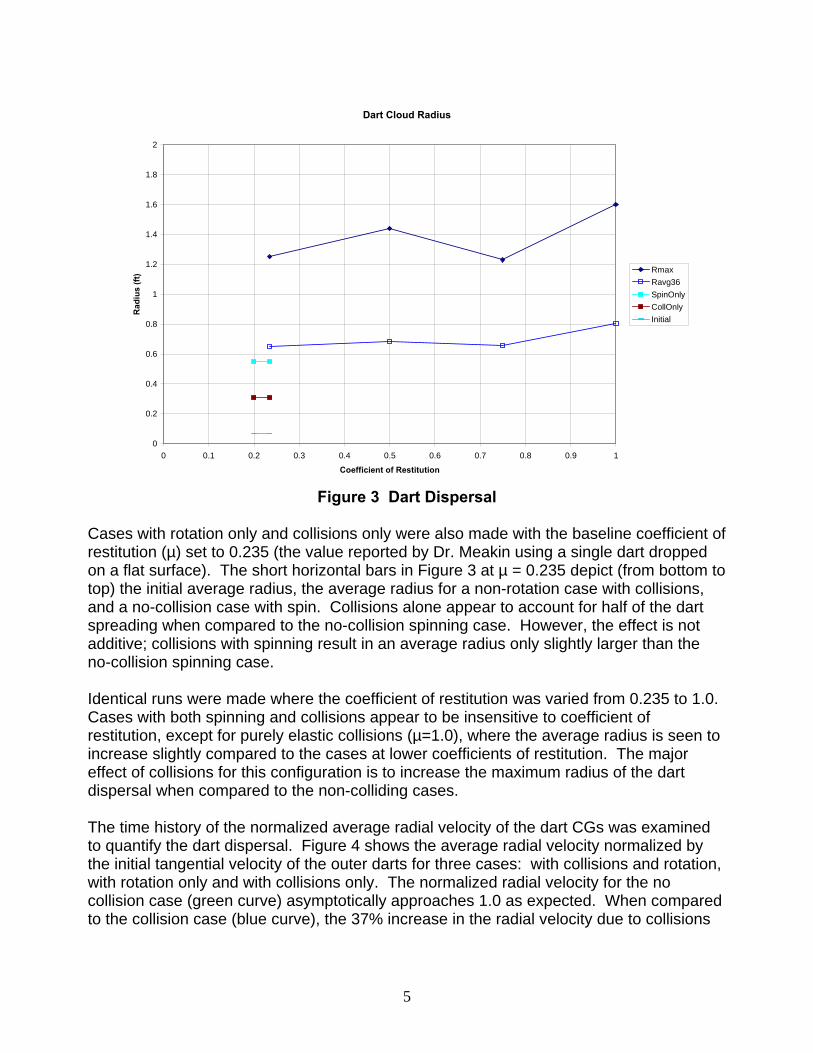
During the simulation, a force corresponding to a drag coefficient of 1.0 is imposed on the leading dart pack. Angular rotation rate is set to 9 Hz. Free stream conditions correspond to a Mach number of 1.2 at sea level. The “drag” force instituted on the leading dart pack causes the leading darts to impact the second and third packs. A side and front view of a representative resulting dart distribution is shown in Figure 2 for a physical time of 0.15 seconds. The resulting dart distribution is chaotic. The initial attempt to quantify the dart distribution was to calculate the average radius of the center of gravity of the outer layer of darts at the end of the simulation. The average radius of the 36 outermost darts in the configuration (labeled Ravg36) is shown in Figure 3.
Side View Front View
Figure 2 Chaotic Dart Pattern After Collisions (t =0.15 sec)
5
Dart Cloud Radius
0
0.2
0.4
0.6
0.8
1
1.2
1.4
1.6
1.8
2
0 0.1 0.2 0.3 0.4 0.5 0.6 0.7 0.8 0.9 1
Coefficient of Restitution
Rad
ius
(ft) Rmax
Ravg36SpinOnlyCollOnlyInitial
Figure 3 Dart Dispersal
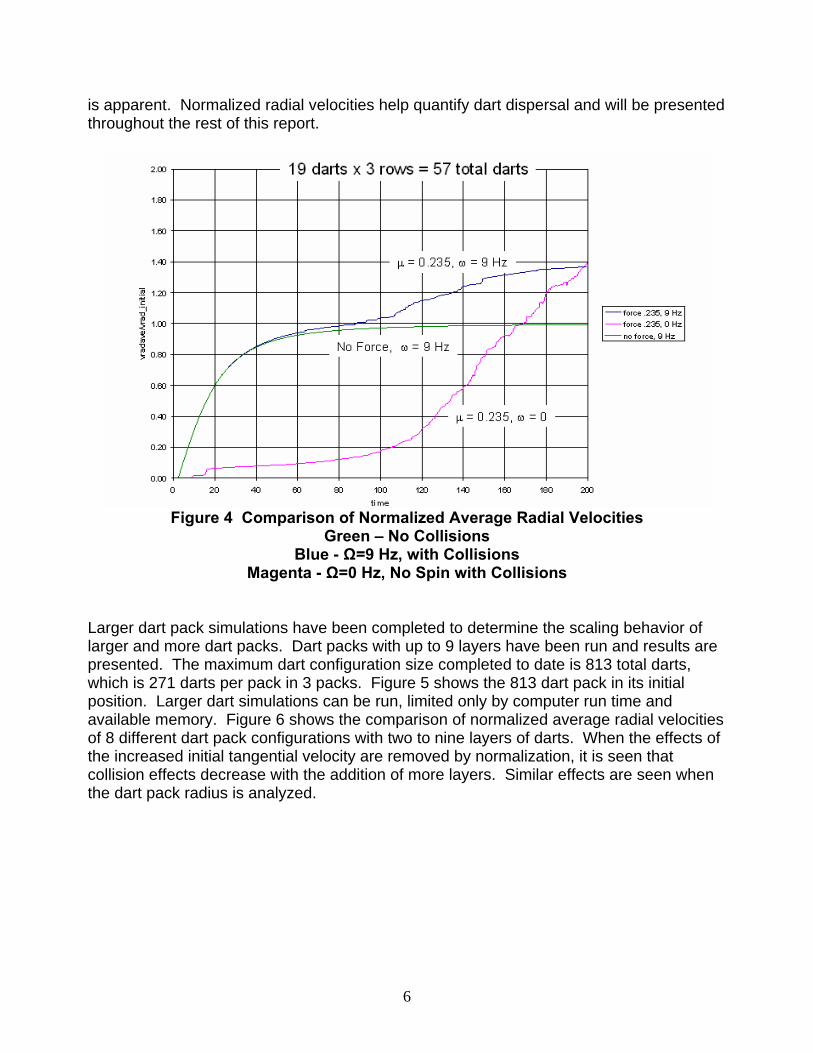
Cases with rotation only and collisions only were also made with the baseline coefficient of restitution (µ) set to 0.235 (the value reported by Dr. Meakin using a single dart dropped on a flat surface). The short horizontal bars in Figure 3 at µ = 0.235 depict (from bottom to top) the initial average radius, the average radius for a non-rotation case with collisions, and a no-collision case with spin. Collisions alone appear to account for half of the dart spreading when compared to the no-collision spinning case. However, the effect is not additive; collisions with spinning result in an average radius only slightly larger than the no-collision spinning case. Identical runs were made where the coefficient of restitution was varied from 0.235 to 1.0. Cases with both spinning and collisions appear to be insensitive to coefficient of restitution, except for purely elastic collisions (µ=1.0), where the average radius is seen to increase slightly compared to the cases at lower coefficients of restitution. The major effect of collisions for this configuration is to increase the maximum radius of the dart dispersal when compared to the non-colliding cases. The time history of the normalized average radial velocity of the dart CGs was examined to quantify the dart dispersal. Figure 4 shows the average radial velocity normalized by the initial tangential velocity of the outer darts for three cases: with collisions and rotation, with rotation only and with collisions only. The normalized radial velocity for the no collision case (green curve) asymptotically approaches 1.0 as expected. When compared to the collision case (blue curve), the 37% increase in the radial velocity due to collisions
6
is apparent. Normalized radial velocities help quantify dart dispersal and will be presented throughout the rest of this report.
Figure 4 Comparison of Normalized Average Radial Velocities
Green – No Collisions Blue - Ω=9 Hz, with Collisions
Magenta - Ω=0 Hz, No Spin with Collisions Larger dart pack simulations have been completed to determine the scaling behavior of larger and more dart packs. Dart packs with up to 9 layers have been run and results are presented. The maximum dart configuration size completed to date is 813 total darts, which is 271 darts per pack in 3 packs. Figure 5 shows the 813 dart pack in its initial position. Larger dart simulations can be run, limited only by computer run time and available memory. Figure 6 shows the comparison of normalized average radial velocities of 8 different dart pack configurations with two to nine layers of darts. When the effects of the increased initial tangential velocity are removed by normalization, it is seen that collision effects decrease with the addition of more layers. Similar effects are seen when the dart pack radius is analyzed.
7
Figure 5 813 Dart Pack - Initial Position
The most likely explanation for this somewhat counterintuitive result is that as the size of the dart pack increases, the relative effects of collisions vs. rotational effects diminishes. The outer layers of large dart packs will exhibit much greater initial tangential velocities due to the rotation of the pack than will the outer layers of smaller packs. As a result, rotation appears to play a larger role in dart dispersal than collisions as the size of the pack increases.
8
0.00
0.20
0.40
0.60
0.80
1.00
1.20
1.40
1.60
0 20 40 60 80 100 120 140 160 180 200
time
vrad
ave/
vrad
_ini
tial
571111832733815076518133 rows
Layers32457896
Normalized Radial Velocities
Total Darts
Figure 6 Large Dart Pack Collision Study
A study of the effects of initial rotational stagger of the dart pack has been completed. Figure 7 shows the configurations that were analyzed in this study. The dart pack is symmetric every 60° of rotation. A baseline 15° rotation was chosen so that the flat surface of the upstream dart would initially contact the oblique surface of the downstream dart. Figure 8 shows that when the darts are initially aligned (0° stagger) there is a smaller increase in the radial velocity, and thus the overall radius of the dart pack, since the flat surface of the upstream dart is initially contacting the flat surface of the nose of the downstream dart. A further increase in the radial velocity, and thus the overall radius of the dart pack, is predicted for the 30° configuration. These figures show that effects of initial rotational stagger of the dart pack are significant. The stagger between dart packs will be the rule rather than the exception, so it is concluded that the stagger of the packs plays an important role in dispersal.
9
Figure 7 Configurations for Initial Rotational Stagger Study
Figure 8 Initial Stagger Study: Comparison of Normalized Average Radial Velocities
The following conclusions about collisions in dispense events are made:
• The collision process is chaotic; very small changes in initial conditions will result in completely different dart patterns. As a result, collision analyses must be performed statistically.
10
• The collision process causes a spreading action of the darts, and therefore contributes to the dart dispersal process.
• The dispersal is relatively insensitive to coefficient of restitution. • The staggering of dart packs has a major effect on dispersal. • More dart layers appear to diminish the dispersal effect of collisions, and rotational
effects play a larger role as dart pack diameter increases. Tandem Dart Wake Modeling Two studies were conducted to investigate the wake influence of a single lead and aft dart combination utilizing the OVERFLOW-2 CFD code. Two darts are aligned with the lead dart in a stationary position while varying the trailing dart’s vertical position. The forward dart’s angle of attack is varied from 0° to 25° and its effects on the rear dart are observed. A second comparison was performed by moving the aft dart downstream and again adjusting its vertical position to observe the dart interference effects. Axial and normal force coefficients, along with pitch moment coefficients, are reported in this study to help quantify the wake and aft dart interactions. This study was performed with the lead dart at 0° and 25° angle of attack. Each configuration is compared to a single dart in undisturbed flow at 0° angle of attack. The undisturbed dart analysis, along with the other configurations, is performed at a free stream Mach number of 1.2. Also, each dart comparison is conducted using the MODS Venom Series II forward fin dart. Figure 9 shows a typical Mach number contour of the dart configuration with the lead dart at 0° angle of attack and the aft dart 1/6 inch behind the base of the lead dart. Previous dart drag studies have concentrated on two or more darts aligned with parallel longitudinal axes. In an actual dispense event, such alignment is likely to be the exception rather than the rule. More commonly, the darts will be at angles of attack, which provides a major impetus for this analysis. In Figure 10, the dart configuration is shown with the lead dart at a 25° angle of attack and the same aft dart location along with a plot of surface pressures and streamlines.
11
Figure 9 Mach Number Contour of Inline Dart Configuration
Figure 10 Surface Pressures and Streamlines of Tandem Dart Configuration
12
A comparison of axial and normal force coefficients along with pitching moment coefficient as a function of vertical location was made. The comparison was made with the forward dart at 0°, 10°, and 25° angle of attack. The aft dart was positioned at a location 1/6 inch from the base of the forward dart, which is the aft dart position at release. Figure 11 shows the axial force coefficient as a function of vertical location of the trailing dart. As expected, the peak in wake interactions takes place when the aft dart is directly behind the base of the lead dart at each angle of attack. As the aft dart is moved vertically in either direction from this peak, the axial force asymptotically approaches the undisturbed dart value when the dart is completely outside of the lead dart’s wake.
Axial Force Coefficient Comparison
0
0.2
0.4
0.6
0.8
1
1.2
-6 -5 -4 -3 -2 -1 0 1 2 3 4
z - Location (inches)
CA
CA @ AOA = 0CA @ AOA = 10CA @ AOA = 25CA Undisturbed Dart
Figure 11 Axial Force Coefficients for Trailing Dart
In the second two-dart wake-modeling study, wake interactions are observed to occur at extended distances downstream of the lead dart. With both darts at an angle of attack of 0°, the aft dart was positioned at 1/6 inch, 3 diameters, 6 diameters, and 10 diameters downstream of the lead dart while the vertical location of the aft dart was varied vertically. Axial and normal force coefficients and pitching moment coefficients for the aft dart were computed. A minimum in the aerodynamic coefficients is observed as far back as 10 diameters from the base of the forward dart. As the dart is moved vertically in either direction, the aft dart approaches free stream axial force values and experiences changes in the normal force coefficient. When the angle of attack of the lead dart is increased to 25°, the aft dart experiences similar reactions to the lead dart flow disturbances as to when the lead dart is at 0° angle of attack. As an example of the variation of the aerodynamic coefficients with the axial
13
location of the aft dart, Figure 12 shows the axial force coefficient as a function of axial and vertical location for the 25° angle of attack case. Again, the peak of the wake interactions occurs near the base of the lead dart and is observed as far back at 10 diameters downstream.
Axial Force Coefficients of Aft Dart
0
0.2
0.4
0.6
0.8
1
1.2
-6 -5 -4 -3 -2 -1 0 1 2 3 4
z - Location (inches)
CA
CA - 1/6 inchCA -3 diametersCA - 6 DiametersCA -10 DiametersCA - Undisturbed Dart
Lead Dart AOA of 25 Degrees
Figure 12 Axial Force Coefficient Comparison
Lead Dart AOA 25 Deg The conclusions obtained indicate:
• The effect of the wake is greatly increased as angle of attack of the leading dart is increased, in that a larger vertical displacement is required before the trailing dart is outside of the influence of the leading dart
• Wake effects persist far downstream, and therefore can be expected to influence dart motion even after significant spreading of the dart pack has occurred.
MODS Dispense Event Simulation To provide an aerodynamic baseline for comparison with the previous tasks, MODS configurations are being simulated with OVERFLOW-2. These simulations include the effects of aerodynamics, collisions, and rotations. Comparison of the aerodynamic simulations and the “aero-off” collision simulations will allow the assessment of the relative effects of aerodynamics and collisions on the dart dispense event.
14
Figure 13 111 Dart MODS Simulation in Support of Challenge Project Figure 13 depicts a 111-dart configuration that is currently underway. In support of the Challenge Project (see Current Efforts, below), a 651-dart configuration is being implemented. Large Dart Pack Computations Previous CFD calculations have been limited to the analysis of a relatively small number of darts, due to limitations of computational resources. Moving-body computations of dart packs have been obtained on pack configurations of 111 darts (37-dart packs, four radial layers, in three tandem rows). A full MODS dart pack consists of 13-14 radial layers, with each pack consisting of roughly 500-600 darts. Conclusions have been made from the smaller simulations that have been extrapolated to large dart packs. However, it is an open question as to the extent that behavior of relatively small packs can be assumed to be descriptive of the behavior of large packs. The purpose of this effort was to perform computations on an entire dart pack, by taking advantage of symmetry conditions that result from the hexagonal close packing (HCP) of the darts in carriage position.
15
Symmetry B.C.sSymmetry B.C.s
a) Full Dart Pack b) Symmetric Wedge
Figure 14 Application of Hexagonal Symmetry Figure 14 illustrates the approach. The full dart pack (Figure 14a) can be represented as a wedge of darts with appropriate boundary conditions imposed at the symmetry planes. The symmetry conditions correspond to inviscid wall boundary conditions, which require 1) zero mass flux normal to the boundary, and 2) zero gradients of density and energy (and by implication, pressure) normal to the boundary. As a result, a solution on the wedge is identical to a solution on the full dart pack. This approach is restricted to analysis at zero angle of attack. Static computations were performed for dart packs consisting of varying numbers of dart layers (Figure 15) in fully-packed (i.e., carriage) position. Application of the symmetry conditions required that the darts be modeled as finless; the effect of assuming finless darts will be assessed in subsequent computations. These computations also assume zero rotational rate; however, a follow-on effort (see Current Efforts, below) will impose rotational source terms on the configuration to simulate the effects of rotation on the aerodynamic forces. All computations were run at a free-stream Mach number of 1.2, and a free-stream Reynolds number corresponding to sea-level conditions.
Figure 15 Increasing Number of Radial Layers
16
Figure 16 depicts the pressure distribution on a dart pack consisting of 14 radial layers of darts. The highest pressures (red) occur in the central regions of the pack. The outer layers of darts experience lower pressures, due to the expansion of the fluid as it flows around the periphery of the pack. The low pressures on the sides of the outer layer of darts (blue) cause a radial component of force. If released under these conditions, the outer layer would be expelled outward. This tendency towards radial expulsion of the darts has been observed with the smaller pack computations.
Figure 16 Pressure Distribution on Large Dart Pack
Figure 17 depicts the distribution of radial normal force coefficient as a function of radial distance from the center, and as the number of dart layers is increased. The horizontal axis is normalized with maximum radius to allow more convenient comparisons of different sized dart packs. As expected, the normal forces on darts embedded in the pack are relatively low. The highest forces are experienced by darts on the outer layer. As the size of the dart pack is increased, the radial forces experienced by the outer layer of darts increases.
17
Figure 17 Effect of Number of Radial Layers on Radial Force Coefficient of Outer
Dart Layer However, the increase of radial force on the outer layer with dart pack size does not (and cannot) increase indefinitely. Figure 18 depicts the radial forces on the dart pack as a function of the number of radial dart layers. The radial force increases rapidly as the number of dart layers is increased, but asymptotes to a value slightly above 7 at about 9 layers of darts. This is due to the decrease of three-dimensional effects on outer-layer darts as the number of dart layers is increased. This result indicates that it is not necessary to model more than 9 layers of darts in large dart pack computations, as adding additional layers has little effect on the total radial force.
18
Figure 18 Asymptotic Behavior of Radial Force Coefficients
Next, simulations were run to assess the effects of dart dispersion on dart aerodynamics, i.e., how important is dart-dart interference as the darts move apart? Figure 19 illustrates the approach. Dart packs were run with the darts fully packed, and with various degrees of uniform separation.
Figure 19 Configurations to Assess Effects of Dart Spacing Figure 20 depicts the radial force acting on a full dart pack (15 layers) as the distance between the darts is increased. The force acting on the outer layer decreases rapidly as the dart spacing is increased. This also was observed with smaller studies involving pairs of darts. From these calculations, it is concluded that once the darts are more than one diameter apart, dart-dart interaction can be neglected.
19
Figure 20 Effect of Dart Pack Density on Radial Force Coefficient of Outer Layer
a) Darts in Packed Position b) Darts 4 Diameters Apart
Figure 21 Wake of Large Dart Pack
Figure 21 depicts the character of the flow field of large dart packs as the dart spacing is increased. When the dart pack is in initial packed position, the pack acts as a solid body, producing a large wake. As the darts move apart, the massive blockage observed with fully packed darts disappears. Each individual dart produces a wake, but overall the pack acts as a large porous body. This implies that drafting effects will be very prominent when the darts are fully packed, but will be of much less importance as the darts move apart. The results of these analyses can be summarized as follows:
20
• Significant radial expulsive forces are experienced by the outer layer of darts when the darts are fully packed. The inner layers experience negligible radial forces by comparison.
• The radial expulsive forces become a maximum when the dart pack contains about 8 or 9 layers. Adding additional layers does not increase the force.
• The radial expulsive forces diminish rapidly as the dart spacing increases.
This suggests that aerodynamic forces are important only in the initial stages of dart dispense. As the darts move apart, the expulsive forces and dart-dart interference diminish rapidly. This suggests a model of dispersion based only on initial conditions. A simple model was constructed that assumes:
• All aerodynamic forces act in the radial direction only. • The initially tangential velocities imparted by pack rotation (that asymptote to purely
radial motion over time) can be treated as an initial radial velocity. This suggests a 1-DOF algorithm that can be summarized as follows:
)(),(
/)(
)(
0
0
trtV
dtdrV
mrCQAdt
dV
rCQAdt
dVmF
rVr
r
r
rrefr
rrefr
r
r
for Solve
or,
velocity initial ntdisplaceme initial
=
=
==
==
=
ω
The results of this model are compared to experimentally derived results in Figure 22. The agreement is quite good between the sled test ST #2 and the flight test G4. The G2 flight test is a definite outlier, and displayed dart dispersal far greater than had been previously observed. This discrepancy is at present unexplained.
21
Figure 22 Dart Dispersion Model Results vs. Experiment
From this model, some interesting observations can be obtained. It appears that rotational velocity has only a slight effect on the dispersion rate. Significant dispersion occurs at a zero rotational rate, and only slightly more dispersion occurs at the nominal 9 Hz rotational rate. The explanation lies in the amount of time the darts reside in an aerodynamically active region (i.e., near the fully-packed configuration). For a non-rotating pack, the darts reside for a relatively long time within this region, and are accelerated outward by purely aerodynamic forces. At higher rotational rates, the darts are flung outward and reside for only a short period of time in the aerodynamically active region, and are affected much less by aerodynamics and much more by rotational effects. It can be concluded from this that the relative effects of aerodynamics can be lessened by increasing the rotational rate. In the collision studies, it was concluded that the effects of collisions also diminish as rotational rate is increased. As a result, rotational rate appears to be a major controllable factor that could be used to fine-tune the dispersion of the darts. This, coupled with control over the altitude at which dispense is initiated, should provide most of the needed control over the rate of dart dispersal. CURRENT EFFORTS Currently, efforts are underway in three main areas:
• Assessment of rotational effects on large dart packs. The large dart pack
simulations will be run with rotational effects added. This is accomplished through the use of rotational source terms in OVERFLOW-2. It was determined that the present implementation of the rotational terms in OVERFLOW-2 were incomplete.
22
Digital Fusion has implemented the full set of terms and will be performing the rotational computations soon.
• CFD Validation of the latest tunnel test. The recently completed wind tunnel test
is being simulated with OVERFLOW-2 for comparison and validation of the CFD approaches and algorithms.
• Support of the Challenge Project. The Challenge Project objective is to simulate
the dispensing of as many darts as computational resources and time will allow. Currently, preliminary studies are underway to determine the size of the dart packs that will be simulated. Based on earlier collision studies, three tandem dart packs will be used, as it was determined that more tandem packs did little to affect the overall dart dispersal. Computations are being performed on dart packs where the number of radial layers is the variable. At present, successful computations are being performed on dart packs containing three and four radial layers, for a total of 57 and 111 darts, respectively. The 57-dart release is depicted in Figure 23; the 111-dart case is underway. The factor limiting the total size of the problem has not been the OVERFLOW-2 flow solver, but the FOMOCO force and moment package that had, due to legacy coding, had hard-wired limits to the number of grids and surfaces that could be used. Simply increasing these limits did not work, as FOMOCO is a serial code, and memory limitations were encountered on kraken. Currently, FOMOCO is run on Digital Fusion’s local cluster, which is a shared-memory machine with very large amounts of memory available to a single processor. The FOMOCO files generated on the local cluster are uploaded to kraken.
Figure 23 Dispense of 57-Dart Configuration
23
Figure 24 651-Dart Configuration in Support of Challenge Project This procedure has allowed very large problems to be set up. Digital Fusion is currently setting up a 651-dart problem (Figure 24), consisting of three tandem dart packs, each with 9 radial layers of darts. The large dart pack simulations detailed in this report indicate that after 8 layers, the radial forces asymptote. As a result, the 651-dart case may be sufficient to run as the representative MODS dart dispense for the Challenge Project.