ISSN: 0973-4945; CODEN ECJHAO
E-Journal of Chemistry
http://www.e-journals.net 2010, 7(S1), S267-S277
Quantitative Determination of Ivermectin in
Raw Milk Using Positive ESI LC-MS/MS
MEENAKSHI DAHIYA, SHANTA SEN, KIRAN LAMBA,
MANJEET AGGARWAL and R. K. KHANDAL*
Shriram Institute for Industrial Research
University Road, Delhi-110007, India
Received 12 February 2010; Accepted 22 April 2010
Abstract: Ivermectin, a veterinary drug, is commonly used endectocide for
animal husbandry. The drug is available in the form of subcutaneous or topical
formulations. Its application may cause accumulation of its residues into the
animal tissues, which ultimately find their way into the food products, such as
milk and meat products. In order to determine the residues of ivermectin in milk,
a comparatively simple, sensitive and rapid method was developed and validated
using LC-MS/MS. The MRM transitions corresponding to m/z 892.71>569.6,
892.71>551.5 and 892.71>307.3 were used for the purpose of quantification and
evaluation of other parameters of the method. The limit of detection of the
method was found to be 0.1 µg/kg and the limit of quantitation was calculated as
0.2 µg/kg. The method was found to be linear in the range of 1.0 ng/mL to
100.0 ng/mL with correlation coefficient of 0.9992 for pure calibration curve and
0.9990 for the matrix- matched calibration curve. The recoveries of ivermectin
from the spiked samples of raw milk were found between 85 to 105%.
Keywords: Liquid chromatography, Mass spectrometry, Ivermectin, Milk.
Introduction
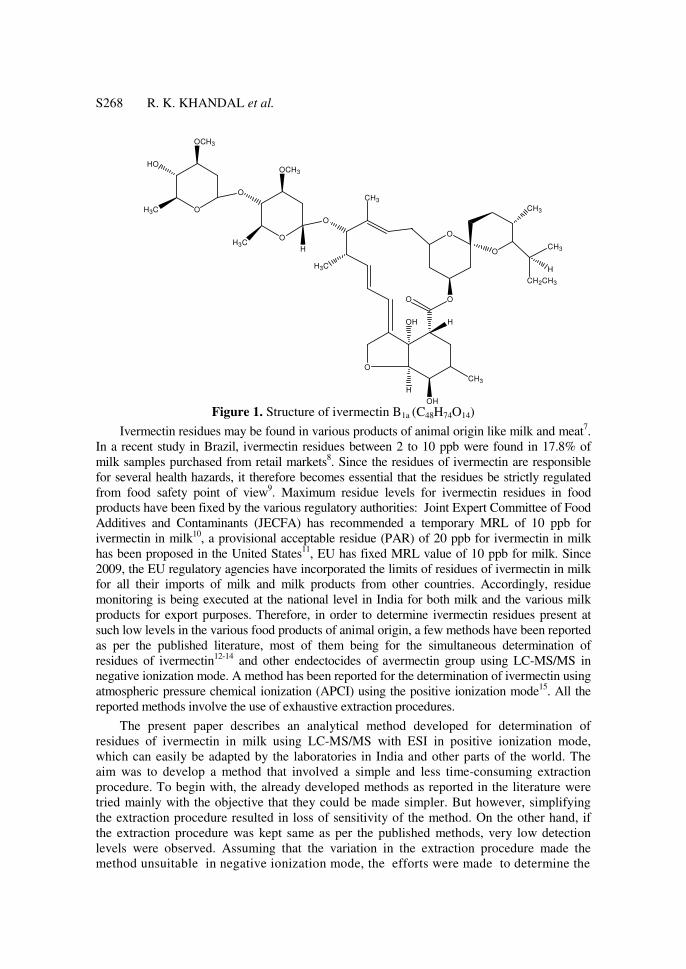
Ivermectin1 B1a (Figure 1), a broad spectrum antiparasitic veterinary drug derived from the
bacterium Streptomyces avermitilis, is a member of the macrocyclic lactone class of
endectocides, commonly referred to as avermectins. All the drugs belonging to the class are
used for controlling helminthes and ectoparasities in animals2-3
.
Ivermectin is available in the form of subcutaneous and topical formulations and is used
in the doses of 0.2 and 0.5 mg/kg body weight4-5
. All avermectins are highly lipophilic and
tend to accumulate in fat tissues, which act as a reservoir, contributing to their long-term
persistence in the body6.
S268 R. K. KHANDAL et al.
Figure 1. Structure of ivermectin B1a (C48H74O14)
Ivermectin residues may be found in various products of animal origin like milk and meat7.
In a recent study in Brazil, ivermectin residues between 2 to 10 ppb were found in 17.8% of
milk samples purchased from retail markets8. Since the residues of ivermectin are responsible
for several health hazards, it therefore becomes essential that the residues be strictly regulated
from food safety point of view9. Maximum residue levels for ivermectin residues in food
products have been fixed by the various regulatory authorities: Joint Expert Committee of Food
Additives and Contaminants (JECFA) has recommended a temporary MRL of 10 ppb for
ivermectin in milk10
, a provisional acceptable residue (PAR) of 20 ppb for ivermectin in milk
has been proposed in the United States11
, EU has fixed MRL value of 10 ppb for milk. Since
2009, the EU regulatory agencies have incorporated the limits of residues of ivermectin in milk
for all their imports of milk and milk products from other countries. Accordingly, residue
monitoring is being executed at the national level in India for both milk and the various milk
products for export purposes. Therefore, in order to determine ivermectin residues present at
such low levels in the various food products of animal origin, a few methods have been reported
as per the published literature, most of them being for the simultaneous determination of
residues of ivermectin12-14
and other endectocides of avermectin group using LC-MS/MS in
negative ionization mode. A method has been reported for the determination of ivermectin using
atmospheric pressure chemical ionization (APCI) using the positive ionization mode15
. All the
reported methods involve the use of exhaustive extraction procedures.
The present paper describes an analytical method developed for determination of
residues of ivermectin in milk using LC-MS/MS with ESI in positive ionization mode,
which can easily be adapted by the laboratories in India and other parts of the world. The
aim was to develop a method that involved a simple and less time-consuming extraction
procedure. To begin with, the already developed methods as reported in the literature were
tried mainly with the objective that they could be made simpler. But however, simplifying
the extraction procedure resulted in loss of sensitivity of the method. On the other hand, if
the extraction procedure was kept same as per the published methods, very low detection
levels were observed. Assuming that the variation in the extraction procedure made the
method unsuitable in negative ionization mode, the efforts were made to determine the
O
O
O
OCH3
H3C
OCH3
H3CH
O
CH3
O
CH3
O O
H
OH
OH
H
O
O
CH3
CH3
CH2CH3
HH3C
HO
Quantitative Determination of Ivermectin in Raw Milk S269
ivermectin content by using positive ionization mode for the analysis. In fact, results
obtained in the positive ionization mode were found to be much better than that obtained in
the negative ionization mode. Using positive ionization mode, intense signals were observed
that enabled the detection of ivermectin to still lower levels, as compared to that reported using
the negative ionization mode i.e. 0.1 µg/kg against the reported value 0.25 µg /kg12
. The
method has the potential to be the preferred one by the facilities in the developing world.
Moreover, this may pave way for simplification of other methods for residual avermectins.
Experimental
Reference standard of ivermectin B1a with purity of > 99% was purchased from Sigma
Aldrich. Acetonitrile, water and methanol (liquid chromatographic grade) were purchased
from Merck Specialties Private Limited. Ammonium formate (analytical reagent grade) was
purchased from Loba Chem Private Limited. Formic acid and n-hexane (analytical reagent
grade) was purchased from S.D Fine chem. Limited. Anhydrous sodium sulphate was
purchased from Rankem chem. limited.
Instrumentation
LC-MS/MS system:Waters 2695 series Alliance quaternary liquid chromatographic system
(Waters, USA) with a Triple Quadrupole Mass Spectrometer, Quattro micro API (Micro
mass, UK) equipped with a electro spray interface and masslynx 4.1 software (Micro mass)
for data acquisition and processing was used. The instrument was provided with a 120-vial
capacity sample management system.
Separation and analysis was carried out on Waters X Terra MS C-18, 5 µm and 2.1 x
100 mm column. Balance with readability of 0.01 mg and capacity of 180 g, Afcoset 3200,
Mettler toddler was used. Model-Spinix (Tarsons Products Pvt Ltd) vortex was used Syringe
filters of pore size 0.2 mm and 0.45 mm, with diameter of 25 mm (Advanced Microdevices
Private Limited) was used. Disposable 50 mL conical centrifuge tubes with screw caps
(Tarsons Products Pvt Ltd) was used. Rapid Vap (Labconco Corporation) nitrogen
evaporator was used. The extracts were centrifuged by using a high-speed refrigerated
centrifuge, the rotor head was suitable for eight 50 mL sample tubes (Remi Sales and
Engineering Ltd).
Milk samples
Two samples of milk containing 7.0% and 3.5% of fat were obtained from local milk
processors and were initially tested for the presence of ivermectin before freezing and
storage at -20 °C. Sample no. 1 and 2 contain 7.0% and 3.5% fat respectively.
Method
Preparation of standard solution
Approximately 10.0±0.1 mg ivermectin reference standard was accurately weighed into a
100 mL volumetric flask and dissolved and made to volume using methanol. This gave a
stock solution of 100 µg/mL. The solution was stored at 2-8 °C. From the stock solution
1 mL of aliquot was taken and diluted to 100 mL to give a standard solution of ivermectin
having a concentration of 1 µg/mL. The solutions were stored at 2° to 8 °C.
Preparation of calibration standard solutions
From the standard solution having concentration of 1 µg/mL, appropriate aliquots were
taken and further diluted with methanol so as to give a series of calibration standard
S270 R.K. KHANDAL et al.
solutions having ivermectin concentration of 1, 2.5, 5.0, 10, 25, 50 and 100 ng/mL
respectively. All solutions were stored at 2 ° to 8 °C.
Preparation of matrix- matched calibration standard solutions
For the matrix-matched calibration curve seven portions of 5.0±0.1 g sample of milk were
taken separately in seven individual centrifuge tubes and extracted using the procedure as
given under the heading sample preparation. The individual extracts obtained were
evaporated to dryness and reconstituted using ivermectin solutions containing 1, 2.5, 5.0, 10, 25,
50 and 100 ng/mL respectively, so as to give matrix matched calibrations standards having
concentrations 0.2, 0.5, 1.0, 2.0, 5.0, 10, 20 µg/kg.
Preparation of mobile phase
The mobile phase was prepared by mixing two solutions i.e. A and B in the ratio of 10:90
(A: B) and filtered through 0.45-micron filter membrane using the Millipore filtration unit.
Solution A (Ammonium formate 5 mM) prepared by dissolving 158 mg of ammonium
formate in 500 mL volumetric flask using water and solution B (0.1% formic acid in
methanol) prepared by adding 0.5 mL of formic acid in 500 mL of methanol.
Preparation of sample
Approximately 5.0±0.1 g of the liquid milk sample equilibrated at room temperature was
taken in the centrifuge tube and extracted with 10 mL of 50:50 mixtures of acetonitrile
and methanol using vortex mixer. The solution was then centrifuged at ambient
temperature for 10 minutes at 7000 rpm followed again by centrifugation at 4 °C at 7000
rpm for further 10 minutes. The supernatant layer was collected in a dry separating funnel.
The residue was extracted using the same process twice. The combined organic solvent
from all the three extractions was passed through anhydrous sodium sulphate and washed
with n-hexane saturated with acetonitrile. This solvent was then evaporated to dryness
under the stream of nitrogen and the dried extract was re-dissolved in 1ml methanol before
injecting into LC-MS/MS.
Liquid Chromatography- Mass Spectrometry (LC-MS-MS) conditions
Column
The separation of ivermectin was carried out using X Terra MS C-18 column (2.1 mm × 100 mm;
5 µm) and mobile phase comprising of A: 5 mM ammonium formate; B: 0.1% formic acid
in methanol; (A:B-10:90 in the isocratic mode). The LC column was set at 50 °C.
ESI Interface
Optimal parameters of the ESI interface were optimized by infusing 100 ng/mL standard
solution of ivermectin in the mobile phase using a Harvard syringe pump. LC-MS/MS
determination was performed by operating the mass spectrometer in positive ionisation mode.
Typical MS settings
Capillary voltage (kV): 3.5; cone voltage (V): 20; source temperature (°C): 120;
dessolvation temperature (°C): 450. Mass spectra was acquired over a scan range of m/z
from 100 Da to1000 Da for MS/MS mode, product ion scan mass spectra of protonated
molecules of ivermectin was acquired in the mass range of 200 Da to1000 Da. Three
different characteristic fragments i.e. 892.71>569.6, 892.71>551.5 and 892.71>307.3 were
monitored for ivermectin in multiple reaction monitoring mode (MRM) using a dwell time
of 50 milli seconds and collision energy of 18 (V) was used.
Quantitative Determination of Ivermectin in Raw Milk S271
Results and Discussion Liquid chromatographic separation
A comparatively simple, sensitive and an accurate method was developed for the determination of
ivermectin residues in raw milk using positive ESI LC-MS/MS. Using the chromatographic
conditions as mentioned above, a well resolved peak for ivermectin was obtained within two minutes
of the injection in the positive ionization mode. Optimum separation was achieved using 5 mM
ammonium formate (A) and 0.1% formic acid in methanol (B) in the ratio 10:90 as mobile phase.
Extraction procedure
For the extraction of ivermectin from the raw milk samples, a simplified extraction procedure was developed as compared to the ones in the existing analytical methods reported
12,14. The
previous methods12
have reported the use of tris buffer and SPE techniques for sample cleanup which not only makes the sample preparation cumbersome but the method was also proned to errors resulting in low recoveries and accuracy of the results. Based upon the past experience of the authors, the extraction method was thereby simplified as has been described above. Since ivermectin is soluble in solvents like methanol and acetonitrile, a combination of methanol and acetonitrile was taken for extracting the residues of ivermectin from milk samples. Any fat components which might have been coextracted along with the ivermectin residues were washed off with n-hexane saturated with acetonitrile. The extract was dried off under nitrogen and the dried extract was dissolved in 1 mL methanol and injected into LC-MS/MS.
Mass spectrometery
For the purpose of evaluating the fragment ions and the intensity of the signals, the reference
standard solution of ivermectin was infused using both positive and negative ESI mode of the
mass spectrometer detector. The results showed that the signals for both positive and negative
mode were comparable and either of the modes could be used for the purpose of development
of method for determination of residues of ivermectin in milk. But, when the same solution
was passed through the liquid chromatographic column using the reported aqueous solution of
triethyl amine as the mobile phase in negative ionisation mode12
, although all ions
873.3>229.25 and 873.3>567.03 were distinctly observed, the signal response was poor.
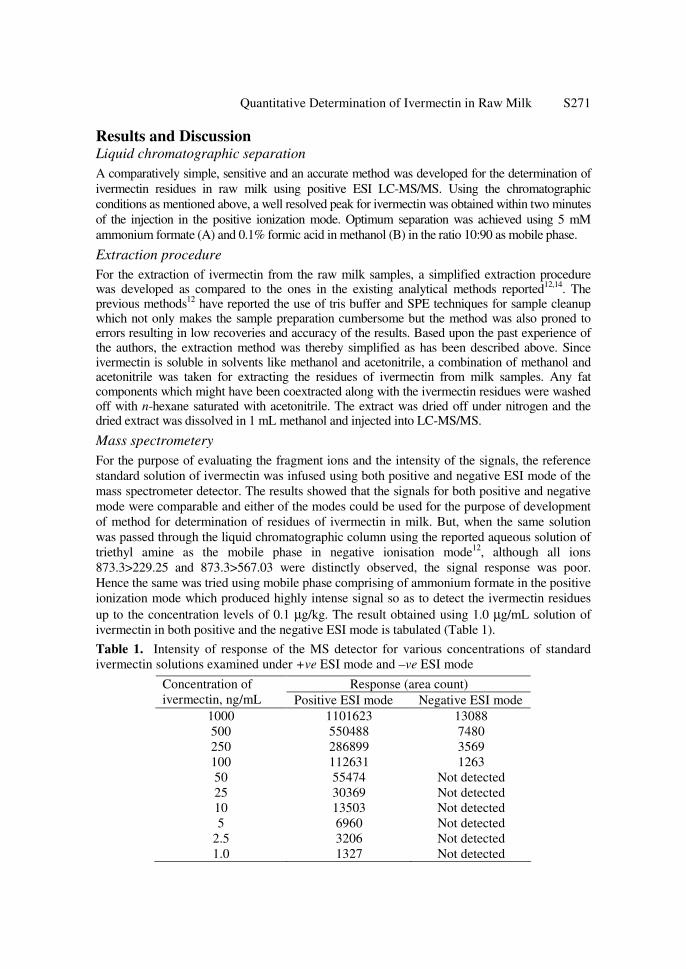
Hence the same was tried using mobile phase comprising of ammonium formate in the positive
ionization mode which produced highly intense signal so as to detect the ivermectin residues
up to the concentration levels of 0.1 µg/kg. The result obtained using 1.0 µg/mL solution of
ivermectin in both positive and the negative ESI mode is tabulated (Table 1).
Table 1. Intensity of response of the MS detector for various concentrations of standard
ivermectin solutions examined under +ve ESI mode and –ve ESI mode
Response (area count) Concentration of
ivermectin, ng/mL Positive ESI mode Negative ESI mode
1000 1101623 13088
500 550488 7480
250 286899 3569
100 112631 1263
50 55474 Not detected
25 30369 Not detected
10 13503 Not detected
5 6960 Not detected
2.5 3206 Not detected
1.0 1327 Not detected
S272 R.K. KHANDAL et al.
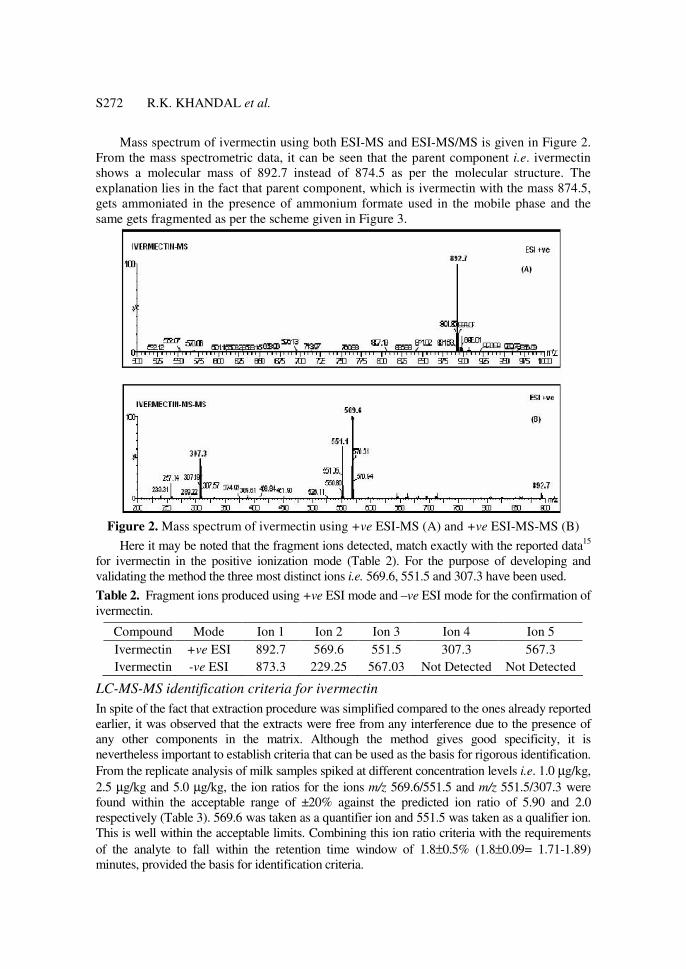
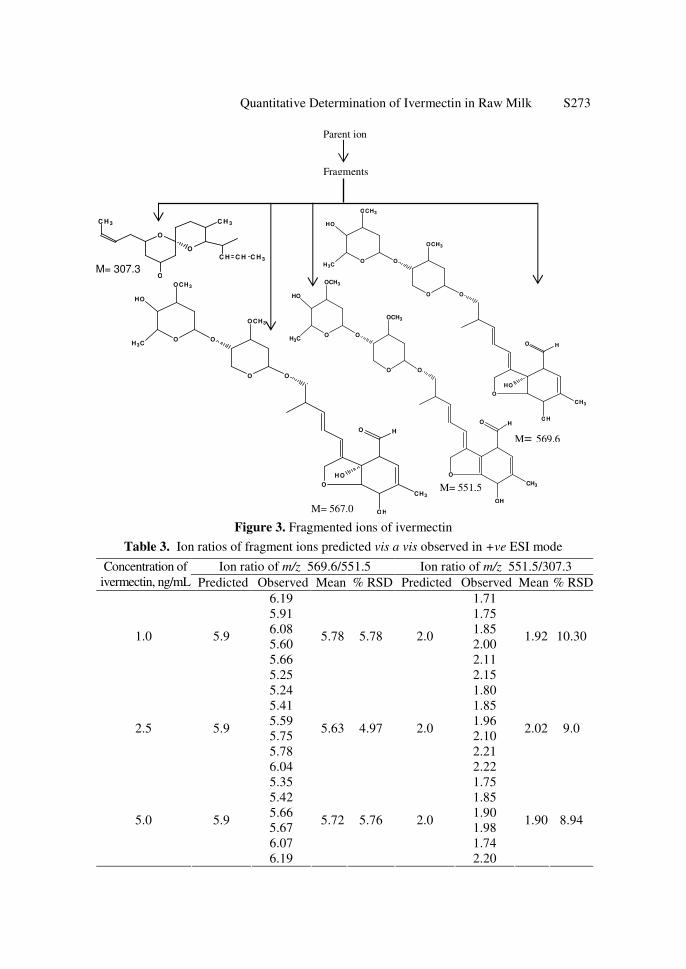
Mass spectrum of ivermectin using both ESI-MS and ESI-MS/MS is given in Figure 2.
From the mass spectrometric data, it can be seen that the parent component i.e. ivermectin
shows a molecular mass of 892.7 instead of 874.5 as per the molecular structure. The
explanation lies in the fact that parent component, which is ivermectin with the mass 874.5,
gets ammoniated in the presence of ammonium formate used in the mobile phase and the
same gets fragmented as per the scheme given in Figure 3.
Figure 2. Mass spectrum of ivermectin using +ve ESI-MS (A) and +ve ESI-MS-MS (B)
Here it may be noted that the fragment ions detected, match exactly with the reported data15
for ivermectin in the positive ionization mode (Table 2). For the purpose of developing and
validating the method the three most distinct ions i.e. 569.6, 551.5 and 307.3 have been used.
Table 2. Fragment ions produced using +ve ESI mode and –ve ESI mode for the confirmation of
ivermectin.
Compound Mode Ion 1 Ion 2 Ion 3 Ion 4 Ion 5
Ivermectin +ve ESI 892.7 569.6 551.5 307.3 567.3
Ivermectin -ve ESI 873.3 229.25 567.03 Not Detected Not Detected
LC-MS-MS identification criteria for ivermectin
In spite of the fact that extraction procedure was simplified compared to the ones already reported
earlier, it was observed that the extracts were free from any interference due to the presence of
any other components in the matrix. Although the method gives good specificity, it is
nevertheless important to establish criteria that can be used as the basis for rigorous identification.
From the replicate analysis of milk samples spiked at different concentration levels i.e. 1.0 µg/kg,
2.5 µg/kg and 5.0 µg/kg, the ion ratios for the ions m/z 569.6/551.5 and m/z 551.5/307.3 were
found within the acceptable range of ±20% against the predicted ion ratio of 5.90 and 2.0
respectively (Table 3). 569.6 was taken as a quantifier ion and 551.5 was taken as a qualifier ion.
This is well within the acceptable limits. Combining this ion ratio criteria with the requirements
of the analyte to fall within the retention time window of 1.8±0.5% (1.8±0.09= 1.71-1.89)
minutes, provided the basis for identification criteria.
Quantitative Determination of Ivermectin in Raw Milk S273
Figure 3. Fragmented ions of ivermectin
Table 3. Ion ratios of fragment ions predicted vis a vis observed in +ve ESI mode
Ion ratio of m/z 569.6/551.5 Ion ratio of m/z 551.5/307.3 Concentration of
ivermectin, ng/mL Predicted Observed Mean % RSD Predicted Observed Mean % RSD
6.19 1.71
5.91 1.75
6.08 1.85
5.60 2.00
5.66 2.11
1.0 5.9
5.25
5.78 5.78 2.0
2.15
1.92 10.30
5.24 1.80
5.41 1.85
5.59 1.96
5.75 2.10
5.78 2.21
2.5 5.9
6.04
5.63 4.97 2.0
2.22
2.02 9.0
5.35 1.75
5.42 1.85
5.66 1.90
5.67 1.98
6.07 1.74
5.0 5.9
6.19
5.72 5.76 2.0
2.20
1.90 8.94
M= 307.3
M= 567.0
M= 551.5
M= 569.6
Parent ion
Fragments
O
O
O
C H 3C H 3
C H C H C H 3
O
OCH3
HO
H3CO
O
OCH3
O
O
OH
CH3
O
HO
H
O
OCH3
HO
H3CO
O
OCH3
O
O
OH
CH3
O H
O
OCH3
HO
H3CO
O
OCH3
O
O
OH
CH3
O
HO
H
S274 R. K. KHANDAL et al.
Method Performance Characteristics
The method was validated as per the international union of pure and applied chemistry (IUPAC) and Eurachem guidelines
16.
Linearity
Seven calibration standards evenly spread over the concentration range of interest and encompassing the concentration levels reflecting EU regulatory limits were analyzed. The calibration standards were run in triplicate. The calibration curve prepared using the pure standards were found to be linear in the range of 1 ng/mL to 100 ng/mL with correlation coefficient of 0.9992. Linearity of the matrix- matched calibration standards in the concentration range of 0.2 µg/kg to 20 µg/kg and at the same concentration levels as that for the calibration standards was also evaluated in triplicate. The calibration curve for the matrix-matched standards was also found to be linear with correlation coefficient of 0.9990. The matrix effect was investigated by comparing standards in solvent with matrix-matched standards at different concentration levels. The relative response (Response matrix matched/ Response solvent) for the concentration levels of 1.0 ng/mL, 2.5 ng/mL, 5.0 ng/mL, 10 ng/mL, 25 ng/mL, 50 ng/mL and 100 ng/mL in solvent with respect to 0.2 µg/kg, 0.5 µg/kg, 1.0 µg/kg, 2.0 µg/kg, 5.0 µg/kg, 10 µg/kg and 20 µg/kg for milk was found to be 0.9850, 0.9950, 0.9952, 0.9982, 0.9965, 0.9910 and 0.9976 respectively. Since the data indicates that the matrix does not significantly suppress or enhance the response of the instrument, therefore, for all the calculation purposes pure calibration curve was used because of its simpler and easier operability.
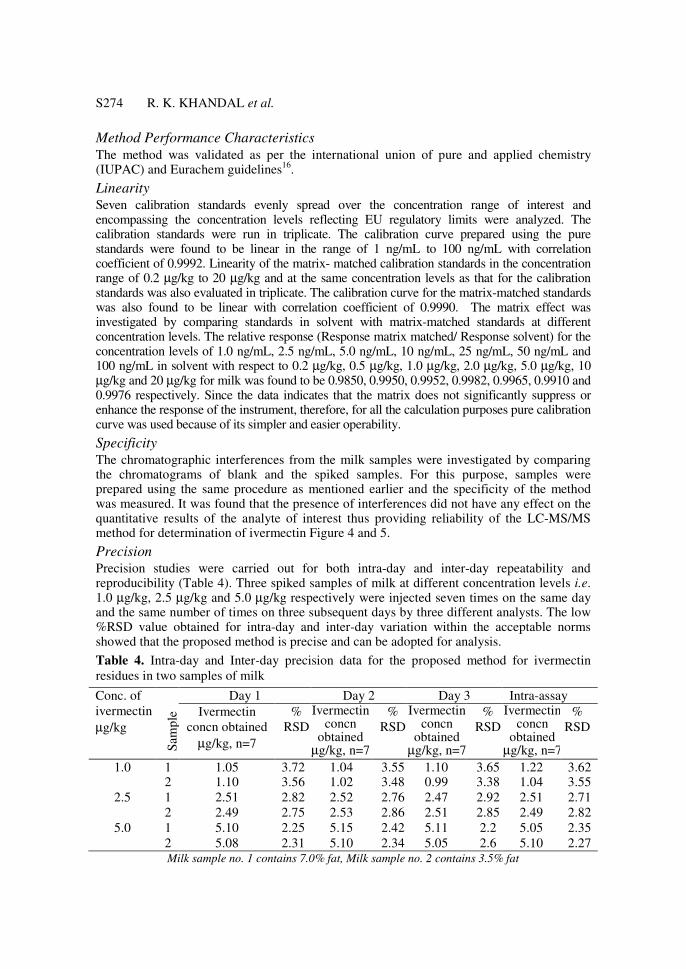
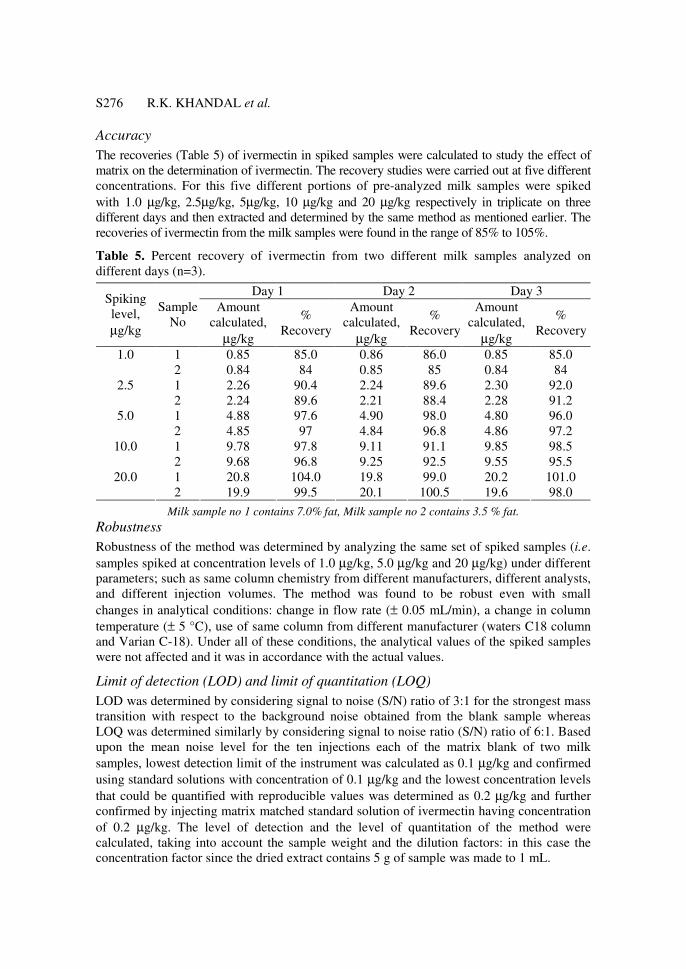
Specificity
The chromatographic interferences from the milk samples were investigated by comparing the chromatograms of blank and the spiked samples. For this purpose, samples were prepared using the same procedure as mentioned earlier and the specificity of the method was measured. It was found that the presence of interferences did not have any effect on the quantitative results of the analyte of interest thus providing reliability of the LC-MS/MS method for determination of ivermectin Figure 4 and 5.
Precision
Precision studies were carried out for both intra-day and inter-day repeatability and reproducibility (Table 4). Three spiked samples of milk at different concentration levels i.e. 1.0 µg/kg, 2.5 µg/kg and 5.0 µg/kg respectively were injected seven times on the same day and the same number of times on three subsequent days by three different analysts. The low %RSD value obtained for intra-day and inter-day variation within the acceptable norms showed that the proposed method is precise and can be adopted for analysis.
Table 4. Intra-day and Inter-day precision data for the proposed method for ivermectin
residues in two samples of milk
Day 1 Day 2 Day 3 Intra-assay Conc. of
ivermectin
µg/kg
Sam
ple
Ivermectin
concn obtained
µg/kg, n=7
%
RSD
Ivermectin concn
obtained µg/kg, n=7
%
RSD
Ivermectin concn
obtained µg/kg, n=7
%
RSD
Ivermectin concn
obtained µg/kg, n=7
%
RSD
1 1.05 3.72 1.04 3.55 1.10 3.65 1.22 3.62 1.0 2 1.10 3.56 1.02 3.48 0.99 3.38 1.04 3.55
1 2.51 2.82 2.52 2.76 2.47 2.92 2.51 2.71 2.5
2 2.49 2.75 2.53 2.86 2.51 2.85 2.49 2.82
1 5.10 2.25 5.15 2.42 5.11 2.2 5.05 2.35 5.0
2 5.08 2.31 5.10 2.34 5.05 2.6 5.10 2.27 Milk sample no. 1 contains 7.0% fat, Milk sample no. 2 contains 3.5% fat

Quantitative Determination of Ivermectin in Raw Milk S275
Figure 4. MRM transitions of control sample of milk showing absence of ivermectin
Figure 5. MRM transitions showing Ivermectin from analysis of spiked samples of milk
(Ivermectin concentration at 5.0 µg/kg).
S276 R.K. KHANDAL et al.
Accuracy
The recoveries (Table 5) of ivermectin in spiked samples were calculated to study the effect of
matrix on the determination of ivermectin. The recovery studies were carried out at five different
concentrations. For this five different portions of pre-analyzed milk samples were spiked
with 1.0 µg/kg, 2.5µg/kg, 5µg/kg, 10 µg/kg and 20 µg/kg respectively in triplicate on three
different days and then extracted and determined by the same method as mentioned earlier. The
recoveries of ivermectin from the milk samples were found in the range of 85% to 105%.
Table 5. Percent recovery of ivermectin from two different milk samples analyzed on
different days (n=3).
Day 1 Day 2 Day 3 Spiking
level,
µg/kg
Sample
No
Amount
calculated,
µg/kg
%
Recovery
Amount
calculated,
µg/kg
%
Recovery
Amount
calculated,
µg/kg
%
Recovery
1 0.85 85.0 0.86 86.0 0.85 85.0 1.0
2 0.84 84 0.85 85 0.84 84
1 2.26 90.4 2.24 89.6 2.30 92.0 2.5
2 2.24 89.6 2.21 88.4 2.28 91.2
1 4.88 97.6 4.90 98.0 4.80 96.0 5.0
2 4.85 97 4.84 96.8 4.86 97.2
1 9.78 97.8 9.11 91.1 9.85 98.5 10.0
2 9.68 96.8 9.25 92.5 9.55 95.5
1 20.8 104.0 19.8 99.0 20.2 101.0 20.0
2 19.9 99.5 20.1 100.5 19.6 98.0
Milk sample no 1 contains 7.0% fat, Milk sample no 2 contains 3.5 % fat.
Robustness
Robustness of the method was determined by analyzing the same set of spiked samples (i.e.
samples spiked at concentration levels of 1.0 µg/kg, 5.0 µg/kg and 20 µg/kg) under different
parameters; such as same column chemistry from different manufacturers, different analysts,
and different injection volumes. The method was found to be robust even with small
changes in analytical conditions: change in flow rate (± 0.05 mL/min), a change in column
temperature (± 5 °C), use of same column from different manufacturer (waters C18 column
and Varian C-18). Under all of these conditions, the analytical values of the spiked samples
were not affected and it was in accordance with the actual values.
Limit of detection (LOD) and limit of quantitation (LOQ)
LOD was determined by considering signal to noise (S/N) ratio of 3:1 for the strongest mass
transition with respect to the background noise obtained from the blank sample whereas
LOQ was determined similarly by considering signal to noise ratio (S/N) ratio of 6:1. Based
upon the mean noise level for the ten injections each of the matrix blank of two milk
samples, lowest detection limit of the instrument was calculated as 0.1 µg/kg and confirmed
using standard solutions with concentration of 0.1 µg/kg and the lowest concentration levels
that could be quantified with reproducible values was determined as 0.2 µg/kg and further
confirmed by injecting matrix matched standard solution of ivermectin having concentration
of 0.2 µg/kg. The level of detection and the level of quantitation of the method were calculated, taking into account the sample weight and the dilution factors: in this case the concentration factor since the dried extract contains 5 g of sample was made to 1 mL.
Quantitative Determination of Ivermectin in Raw Milk S277
Conclusion
The developed method using positive ESI LC-MS/MS allows the detection, quantitation and
confirmation of ivermectin in raw milk present at trace levels with high precision, accuracy
and sensitivity by using simple extraction procedure. In spite of using a simplified extraction
procedure, no interferences were observed from the matrix components during the
determination of ivermectin residues. The method can be used for the routine analysis of
ivermectin residues in milk with added advantages of speed and economy. The method can
also be tried for ivermectin content in other animal products like meat and poultry.
Acknowledgment
The authors are thankful to the Management of Shriram Institute for Industrial Research for
the guidance and support provided for undertaking the research study.
References
1. The Merck Index; Ivermectin, Fourteen Edition, 52 48, 908.
2. Campbell W C, New Zeal Vet J., 1981, 29, 174-178.
3. Vuik J, J Chromatogr., 1991, 553, 299.
4. Toutain P L, Campan M, Galtier P and Alvinerie M, J Vet Pharmacol Ther., 1988,
11, 288-291.
5. Alvinerie M, Sutra J F, Galtier P and Mage C, Res Vet Sci., 1999, 67, 229-232.
6. Schenck F J and Lagman L H, J AOAC Int., 1999, 75, 747-750.
7. Bassissi M F, Alvinerie M and Lespine A, Comp Biochem Physiol Part C: Toxicol
Pharmacol., 2004, 138, 437.
8. Lobato V, Rath S and Reyes F G R, Food Addit Contam., 2006, 23(7), 668-673.
9. Koesukwiwat U, Jayanta S and Leepipatpiboon N, J Chromatogr A, 2007, 1140,
147-156.
10. Joint FAO/WHO Expert Committee on Food Additives (JECFA). Residues of some
veterinary drugs in food animals (FNP 41-14) FAO Food and Nutrition Paper. WHO.
2002, p. 44.
11. Baynes R E, Martin-Jimenez T, Craigmill A L and Riviere J E, Regul Toxicol
Pharmacol., 1999, 29,287-299.
12. David A Durden and Janice Wotske, J AOAC Int., 2009, 92(2), 580-596.
13. Roberts Sheridan and Lucille Desjardins, J AOAC Int., 2006, 89(4), 1088-1094.
14. Alan L Chicoine, David A. Durden, George MacNaughton and Patricia M. Dowling,
Can Vet J., 2007, 48(8), 836-838.
15. United States Department of Agriculture Food Safety and Inspection Service, Office
of Public Health Science. SOP No. CLG-AVR1.01, 2003, 7-17.
16. Thompson M, Ellision S L R and Wood R, Pure Appl Chem., 2002, 74(5), 835-855.

Submit your manuscripts athttp://www.hindawi.com
Hindawi Publishing Corporationhttp://www.hindawi.com Volume 2014
Inorganic ChemistryInternational Journal of
Hindawi Publishing Corporation http://www.hindawi.com Volume 2014
International Journal ofPhotoenergy
Hindawi Publishing Corporationhttp://www.hindawi.com Volume 2014
Carbohydrate Chemistry
International Journal of
Hindawi Publishing Corporationhttp://www.hindawi.com Volume 2014
Journal of
Chemistry
Hindawi Publishing Corporationhttp://www.hindawi.com Volume 2014
Advances in
Physical Chemistry
Hindawi Publishing Corporationhttp://www.hindawi.com
Analytical Methods in Chemistry
Journal of
Volume 2014
Bioinorganic Chemistry and ApplicationsHindawi Publishing Corporationhttp://www.hindawi.com Volume 2014
SpectroscopyInternational Journal of
Hindawi Publishing Corporationhttp://www.hindawi.com Volume 2014
The Scientific World JournalHindawi Publishing Corporation http://www.hindawi.com Volume 2014
Medicinal ChemistryInternational Journal of
Hindawi Publishing Corporationhttp://www.hindawi.com Volume 2014
Chromatography Research International
Hindawi Publishing Corporationhttp://www.hindawi.com Volume 2014
Applied ChemistryJournal of
Hindawi Publishing Corporationhttp://www.hindawi.com Volume 2014
Hindawi Publishing Corporationhttp://www.hindawi.com Volume 2014
Theoretical ChemistryJournal of
Hindawi Publishing Corporationhttp://www.hindawi.com Volume 2014
Journal of
Spectroscopy
Analytical ChemistryInternational Journal of
Hindawi Publishing Corporationhttp://www.hindawi.com Volume 2014
Journal of
Hindawi Publishing Corporationhttp://www.hindawi.com Volume 2014
Quantum Chemistry
Hindawi Publishing Corporationhttp://www.hindawi.com Volume 2014
Organic Chemistry International
Hindawi Publishing Corporationhttp://www.hindawi.com Volume 2014
CatalystsJournal of
ElectrochemistryInternational Journal of
Hindawi Publishing Corporation http://www.hindawi.com Volume 2014