PARADISE ISLANDS? ISLAND STATES AND THE PROVISION OF ENVIRONMENTAL GOODS
SVERKER C. JAGERS
MARINA POVITKINA
MARTIN SJÖSTEDT
AKSEL SUNDSTRÖM
WORKING PAPER SERIES 2013:19 QOG THE QUALITY OF GOVERNMENT INSTITUTE Department of Political Science University of Gothenburg Box 711, SE 405 30 GÖTEBORG November 2013 ISSN 1653-8919 © 2013 by Sverker C. Jagers, Marina Povitkina, Martin Sjöstedt, and Aksel Sundström. All rights reserved.

Paradise Islands? Island States and the Provision of Environmental Goods QoG Working Paper Series 2013:19 November 2013 ISSN 1653-8919
ABSTRACT Island states have been shown to trump continental states on collective action-related outcomes, such as democracy and institutional quality. The argument tested in this article contends that the same logic might apply to environmental goods. However, our empirical analysis shows counter-intuitive results. Firstly, among the 107 cross-national environmental indicators we analyze, being an island only has a positive impact on 20 measurements. Secondly, the causal factors suggested to make islands outperform continen-tal states in other aspects have weak explanatory power when analyzing the variance of the states' envi-ronmental performances. We conclude by discussing how these findings can be further explored. Keywords Environmental goods; collective action; environment; island states.
Sverker C. Jagers The Quality of Government Institute Department of Political Science University of Gothenburg [email protected] Martin Sjöstedt The Quality of Government Institute Department of Political Science University of Gothenburg [email protected]
Marina Povitkina The Quality of Government Institute Department of Political Science University of Gothenburg [email protected] Aksel Sundström The Quality of Government Institute Department of Political Science University of Gothenburg [email protected]

Introduction
Island states have recently shown outstanding performances in a number of governance and collective
action-related outcomes. They have succeeded in establishing strong civil societies and seem to per-
form comparatively well on indices of political rights and civil liberties, while exhibiting, on average,
higher levels of democracy than continental states. In his seminal work Democracy and Development,
Hadenius (1992) found that in 1988 all but two of the thirteen most democratic developing countries
were island states (Belize and Costa Rica being the only exceptions). Nowadays, data from Freedom
House (2011) shows that among thirty countries that have the highest possible score on the Freedom
House democracy index, ten are islands. Furthermore, 30 out of 39 islands states are classified as free
and have the Freedom House democracy score ranging from 7 to 10 (Teorell, Samanni, Holmberg, &
Rothstein, 2011), though there are also deviating examples. Several island states are found on the very
opposite end of the democracy scale (e.g., Bahrain and Cuba). Yet, according to all the subsequent
references to Hadenius (1992), his work, together with the newest data, has spurred a growing and
broadened interest in the performance of island states. As a result we not only find (large- and small-
N) studies of how well island states perform in regard to democracy (Srebrnik, 2004; Anckar, 2002),
but also a number of articles investigating island states’ capacity to provide a variety of social goods,
such as economic development and rule of law (e.g., Briguglio, 1995; Anckar, 2006; Congdon-Fors,
2013).
In this paper, we study island states from a less explored angle, namely by investigating their
capacity to maintain environmental goods. This orientation is motivated by two reasons. Firstly, as
accounted for in this paper’s theory section, it has previously been suggested that successful collective
action in natural resource management is facilitated by many of the factors characterizing island states
(Ostrom, 1990; Agrawal & Goyal, 2001; Grafton & Knowles, 2004; Naidu, 2009). Secondly, recent
empirical findings indicate that there might be something in the features of island states that make
them less harmful to the environment. For instance, Povitkina (2012) reports that compared to conti-
nental states, island states tend to be less likely to overharvest their marine fisheries.

More specifically, the aim of the study is twofold: First, we make a systematic comparison of
how well island states and continental states perform in regard to different environmental indicators,
measured on the national level. The data set on environmental indicators consists of 107 different
measurements collected from what are commonly considered reliable sources, available across na-
tions. As such, this article utilizes, to our knowledge, the most comprehensive set of data on environ-
mental indicators available for researchers. Second, we narrow down our focus by selecting those 20
environmental indicators where island status, on average, tends to have a positive effect and we con-
tinue by investigating what factors seem to be driving these results. In this latter part, our criteria for
selecting potential independent variables are founded in previous (sociopolitical) research demonstrat-
ing that colonial heritage, religious dominance, isolation, cultural homogeneity, population size, and
occurrence of conflicts are factors that possibly explain why islands perform better in regard to level
of democracy, economic development, and rule of law (Anckar, 2006; Congdon-Fors, 2013; Srebrnik,
2004). Rather than studying the impact from the areas in which islands outperform continental
states—such as democracy, economic development, and the quality of government institutions—our
focus here is hence to explore the impact from the underlying features of islands states on their envi-
ronmental performance.1
In Table 1, we account for our specific research questions and the strategy outlining how they
will be answered (the latter is further elaborated in the methodology section). The remainder of the
paper is organized as follows. In the next section, we review previous research on island state perfor-
mance and discuss what characteristics that previously have been argued to explain why island states
outperform continental states. The subsequent section accounts for the methods used to fulfill our aim
and present the data being used. The result section is then organized according to the two-fold aim.
The article concludes with a critical examination of how these results can be brought further by sug-
gesting a number of research questions for future research.
1 The full list of island states analyzed in this paper is available in Appendix A.

TABLE 1. RESEARCH QUESTIONS AND EMPIRICAL STRATEGY
Question Empirical strategy
1. Do island states perform better than continental states in
regard to providing environmental goods?
If yes, in which respects?
We analyze a global sample (40 island states and 161 continental
states) of states’ performance in 107 different environmental indicators.
We discuss patterns and potential congruence among the environmen-
tal indicators where island states, on average, perform better than
continental states.
2. Can the factors identified as explanations for island states’
relative success as regards political and economic develop-
ment also explain islands’ success in certain environmental
indicators?
Focusing on the 20 measurements where island status has a positive
effect we analyze which factors from previous research (e.g., states’
level of homogeneity and size) can most successfully explain the link
between “islandness” and environmental performance.
Island States and Environmental Performance
While islands are usually defined as “sub-continental land areas, surrounded by water” (Glassner,
1990, p. 47), there is no agreed upon definition of what constitutes an island state. Anckar (1996, p.
702) identifies island states as “states that are islands, part of an island or consist of islands and part of
islands.” Congdon-Fors (2013, p. 11) provides a stricter definition of an island nation as “a country
with no land borders.” She claims that this understanding of an island country gives an advantage of
making it “even more reasonable to assume that country size in area is exogenous.” (2013, p. 11)
Hereafter we will refer to the latter definition of an island state thus being a country with no land bor-
ders, since it assumes that a country’s government is responsible for taking care of the whole territory
surrounded by water and is fully accountable for the environmental outcomes of the island.2
A common conception in the literature is that island states suffer from their smallness and isola-
tion. For example, Easterly and Kraay (2000) have argued that public goods provision has increasing
2 Following the approach of Congdon-Fors (2013) we treat Cuba as an island state—though a small part of its border is consti-tuted of the Guantanamo Bay—but do not treat Australia as a country but a continent. Moreover, we treat Taiwan as an island state, though it is formally a part of China.

returns to scale and, hence, that small states suffer from higher per capita costs of public goods (see
also Easterly & Rebelo, 1993; Alesina & Spoalare, 1997; Kuznets, 1960; Harden, 1985). Other studies
suggest that the private economy also has a lot of increasing returns to scale, and thus small states face
disadvantages in terms of, for example, diversifying their production. They may also be at a disad-
vantage due to their limited labor force and the difficulties in recruiting high-quality candidates from
their limited pool of workers (Congdon-Fors, 2007, 2013; Romer, 1986; Barro & Salai-Martin, 1995;
Briguglio, 1995; Armstrong & Read, 1998). In addition, many islands are thought to suffer from their
location because they are typically more remote, have higher transportation costs, smaller internal
markets, and experience a higher degree of vulnerability to both economic shocks and natural disasters
(Congdon-Fors, 2013; Srinivasan, 1986).
However, recent empirical studies largely turn these expectations on their head. Because, small
states—and, as it seems, island states in particular (Anckar, 2006)—are shown to trump continental
states on a number of institutional indicators and collective action-related outcomes. On average, they
have both higher income and productivity levels. They perform well on indices of civil and political
rights; they have provided bases for vibrant civil societies, compared to continental states (Srebrnik,
2004; Anckar & Anckar, 1995); and they tend to have stronger institutions in terms of democracy
parliamentarism, plurality elections, direct democracy, and rule of law (Ott, 2000; Easterly & Kraay,
2000; Congdon-Fors, 2007, 2013; Anckar, 2006). How can this be understood?
The literature, finding a positive effect from smallness, and “islandness” in particular, suggests
a number of causal mechanisms producing such beneficial outcomes. First, a common argument is
that islands tend to be more ethnically and linguistically homogenous (Clague, Gleason, & Knack,
2001). Homogeneity is in turn said to facilitate collective action and coordination by giving citizens “a
high degree of sympathetic identification with each other” and resulting in “a greater effort to feel
others out” (Anckar & Anckar, 1995, p. 222; Hache, 1998). The sense of community and cohesiveness
found in small island nations is, consequently, held to reduce the risk of conflict and, on the contrary,
stimulates the development of exchange, high quality institutions, and economic productivity. The
shared interests, intimacy, and distinct identity of island populations have also been interpreted in
terms of social capital. According to this logic, islands are more prone than non-islands to foster a
sense of national identity that is stronger than group identity. The “geographical precision” of island
states hence gives island populations a distinct sense of place, which in turn may lead to a sense of
unitarism and a better ability to accumulate national-level social capital as opposed to group-level
social capital (Baldicchino, 2005, p. 35). Yet, whether or not it really is homogeneity per se that ex-
plains the effect from the “island dummy”—the dichotomous measure whether a state is an island or
not— is up for discussion. There are in fact striking examples contradicting such claims. For example,
the demographic profile of Mauritius would, according to the homogeneity argument, be expected to
comprise a recipe for disaster. But although Mauritius is one of the most ethnically heterogeneous
states in the world, this small island state still performs extraordinarily well in terms of economic and
social development (Srebrnik, 2004). This clearly motivates both empirical investigations and a closer
look at other potential causal factors.
The second mechanism said to work in favor of positive developments in island states is their
distinct colonial history. Island states are, in this discussion, held to have experienced a comparatively
deep penetration of colonialism and British and Christian influences in particular. As claimed by
Clague et al. (2001), due to the fact that pre-imperial societies were less prevalent on most of the is-
lands, this deep penetration was in turn not perceived as a foreign import challenging pre-existing
values or established modes of political organization. Hence, the transplantation of institutions from
the colonizer to the colony was much more effective and non-upsetting in island states. On islands
democratic values have, thus, penetrated the citizenry to a larger extent than in continental colonies.
The fact that the citizens of islands in many cases are descendants of slaves has also been argued to
further stimulate such anti-authoritarian tendencies (Hadenius, 1992). Finally, the deep penetration of
colonialism is said to have been facilitated by geographically determined borders, which made the
borders less contested (Srebrnik, 2004).
Third, the fact that the island borders are given by nature is also a commonly maintained mech-
anism explaining island states’ outstanding performance in terms of political and social organization.
More specifically, the natural barrier formed by the water surrounding islands has been said to reduce
governments’ investments in security. The geographic features of islands imply both that the incen-
tives for a ruler to expand its territory and the de facto risk of getting invaded or embroiled in warfare
are significantly reduced (Congdon-Fors, 2007, 2013). Islands are hence argued to be sheltered from
conflict and the resulting lack of incentives to build up a strong military facilitates the decentralization
of power conducive to the development of high-quality institutions, accountability, and responsiveness
(Clague, Gleason, & Knack, 2001). In addition, because of the small jurisdictions, the cost of internal
conflicts is thought to be higher on islands than in continental states, which in turn promotes the de-
velopment of a basic consensus of values (King, 1993). Island inhabitants simply “must get along with
each other” and for that reason develop “sophisticated modes of accommodation” (Lowenthal, 1987,
pp. 38-39), or strategies for “managed intimacy” (Bray, 1991, p. 21; see also Srebrnik, 2004).
The fourth mechanism is size. Islands tend to be relatively small and the small size of the polity
is said to bring a number of advantages. For example, smallness implies that there are more opportuni-
ties for interactions between the ruler and the ruled and such accessibility to the political system is
generally perceived as encouraging citizen participation. Smallness per definition implies that there
are fewer layers of political organization, and this is, in turn, expected to facilitate transparency and
open channels of communication, which have positive effects on accountability and responsiveness on
the part of governments (Anckar, 1999). The leaders may also more easily acquire information about
the preferences and needs of their citizens, leading to greater government efficiency and potentially a
higher quality of government (Congdon-Fors, 2007). Anckar (1999) also argues that while small units
may be as categorically heterogeneous as larger polities, they tend to be more uniform in terms of
attitudes and values. This line of reasoning fleshes out Etro´s (2006) claim that the inhabitants of small
countries tend to more easily agree on a higher provision of public goods. In sum, smallness is, ac-
cording to this logic, expected to foster “highly personalized and transparent societies” (Bray, 1991,
pp. 38-39). However, a small geographical area and a small population size not only affect the rela-
tionship between the ruler and the ruled, but they also facilitate interaction within the populace. That
is, since small-scale social structures tend to be personalistic and informal, interactions on all levels
have a comparatively cooperative character.
The fifth and final mechanism focuses on aspects interchangeably referred to as remoteness, pe-
ripherality, or isolation. Ott (2000) argues that the overall pattern of interactions among island elites is
more cooperative, and this behavior tends to be mimicked by the citizenry as a whole. Remoteness,
peripherality, and isolation are hence expected to play a unifying role as inhabitants of remote loca-
tions face special problems, shared by all members of the community, which are thought to result in a
shared frame of reference (cf. Anckar, 1999; Congdon-Fors, 2007). Remoteness and isolation thus
facilitate preference homogeneity and cooperation since the links between self-interest and the inter-
ests of the nation are more obvious (Anckar & Anckar, 1995). More specifically, the geographic preci-
sion of island states facilitates unitarism and forms a shared national identity, which can explain island
states’ comparative success in terms of political and social development (Baldacchino, 2005).
Given the reviewed literature we identify five features that have been brought forward to ex-
plain why island states might perform better than continental states in collective action-related out-
comes. In sum, when answering our second research question regarding which are the major factors
explaining small islands’ relative success in environmental performance, the following five factors
will be included in the analysis:
• Homogeneity
• Colonial heritage
• Geographical characteristics
• Size
• Isolation
Island-related Environmental Collective Action: Theoretical Expectations
What bearing do these scholarly findings and arguments have on nations’ environmental performance?
Partly contrary to popular belief and previous theoretical expectations, the reviewed literature essen-
tially shows that island states have several comparative advantages that may promote cooperation and,
ultimately, the achievement of social, political, and economic development. Due to similarities in in-
ducements for collective action between different social goods, it is thus reasonable to assume that
(and worthwhile to investigate if) the same kind of logic being accounted for, applies also to environ-

mental goods. Perhaps the rest of the world can learn immensely from how island states perform col-
lective action?
In particular, theories about social, political, and economic development emphasize a number of
collective action-related factors and social dilemmas that are equally at the core of theories about envi-
ronmental goods. For example, it is a well-known fact that sustainable management of natural re-
sources depends fundamentally on the extent to which resource users expect other resource users to act
sustainably. Intuitively, it would of course be in each citizen’s interest not to overuse natural re-
sources. But as numerous deteriorating resource systems clearly indicate, environmental goods have
certain characteristics that make all resource users expect that others are overharvesting the resource,
thus engaging in overuse themselves (see Duit, 2011). This situation is similar to the familiar analogy
of the tragedy of the commons, also conceptualized as a collective action dilemma, a social trap, or as
the prisoner’s dilemma (Axelrod, 1984; Bromley, 1992; Rothstein, 2005). In all these conceptualiza-
tions, horizontal expectations that other resource users will embark on a non-cooperative path and free
ride on conservation efforts make every individual reluctant to participate in conserving the collective
good or employing a cooperative strategy themselves. Hence, theory suggests that social capital—the
standard measure of people’s tendency to cooperate—should be beneficial for nations’ environmental
performance (Grafton & Knowles, 2004; Duit, Hall, Mikusinski, & Angelstam, 2009). Several of the
causal mechanisms analyzed in the literature on the islands’ performance have in fact been previously
attributed as factors facilitating successful cooperation among individuals in natural resource man-
agement. For instance, the argument about size (both of the country and of the population) has been
brought up when discussing the impact of group size on collective action outcomes in cooperation
over common-pool resources. Accordingly, smaller groups will, on average, be more prone to cooper-
ate as this feature facilitates coordination (see Poteete & Ostrom, 2004; Agrawal & Goyal, 2001).
Similarly, heterogeneity has been shown to be a complex yet important factor for determining the out-
comes in cooperation over natural resources (see Erdlenbruch, Tidball, & van Soest 2008; Naidu,
2009). As stated by Grafton and Knowles: “The greater the social divergence the lower is the oppor-
tunity for collective action that may help address environmental concerns” (2004, p. 340).
However, the natural resource management literature within social science does not only
emphasize the importance of horizontal expectations. Recent research holds that in order to fully un-
derstand the drivers of unsustainable natural resource exploitation, state capacity—as well as the ver-
tical relationship between the government and the resource users—needs to be addressed (Sjöstedt,
2014). That is, institutional scholars have started to pay attention to not only the workings of local-
level institutional arrangements and horizontal expectations, but also to how those interact with, and
are affected by, the surrounding local and national institutions in which they are embedded or nested
(Ostrom, 1990; Firmin-Sellers, 1995; Agrawal & Gibson, 1999). As such, the issue of limited provi-
sions of environmental goods can be considered an interesting exploration of further aspects of the
performance of island states relative to continental states. The causal mechanisms reviewed above
would certainly suggest an affirmative answer to such a query.
At the same time, however, there are probably reasons to be cautious about the causality and
how the various mechanisms actually affect cooperative environmental behavior in the case of island
states. From our point of view, one could equally twist the coin and argue that because of a number of
other factors, we should rather expect negative outcomes when it comes to islands and environmental
performance. For example, island states—and especially the small island developing states (SIDS)—
are often considered to be more vulnerable to economic, political, or environmental shocks (Briguglio,
1995; Pelling & Uitto, 2001). In terms of the economy, island states are expected to suffer from great-
er output volatility and greater volatility in terms of trade, which might spur more intense resource
exploitation. It has also been pointed out that the lack of diversity in the productive base of island
states’ economies can be assumed to have negative effects on their resilience to disasters (Pelling &
Uitto, 2001). Moreover, from a political point of view, the flipside of the benefits from the personal-
istic and informal character of political interaction described above is that small polities might also be
more vulnerable to nepotism, cronyism, patronage, and political clientelism (Baldacchino, 1997; Ott,
2000; Srebrnik, 2004), which can be expected to have clear-cut negative effects on environmental
management. Finally, since islands tend to be located in geographic areas where hurricanes and ty-
phoons are common, they can also be expected to be more vulnerable to environmental shocks in the
form of natural disasters.
Bearing these critical reservations in mind, we now continue our exploratory endeavors of em-
pirically investigating whether or not islands outperform continental states when it comes to the envi-
ronment and if so, what may be the driving forces behind this. In the next section we account for the
data and methods that we have used and how our dependent and independent variables are made oper-
ational. Thereafter we present our results. In the concluding remarks, we summarize our major find-
ings, critically examine the research approach being chosen and suggest questions for future research.
Method and Data Description
Our empirical strategy consists of two parts. First, we evaluate in which environmental measurements
island states fare better than other states. Using bivariate regression analysis on a large number of en-
vironmental indicators across countries, we find a number of environmental measurements in which
island states on average seem to do better than continental states. Secondly, we then investigate why
this is so. We analyze the measurements where islands perform better in order to investigate what
factors seem to drive this relationship. We test the possible hypotheses derived from the literature and
draw inferences regarding which factors seem to explain the relative success of island states in these
environmental measurements.
Dependent Variables
It is inherently difficult to operationalize nations’ performance in the provision of “environmental
goods” into empirical measures with high content validity. As is known and widely discussed among
scholars addressing this concept, it is difficult to capture the environmental performance of states in
quantitative measurements (see Bell & Morse, 1999; Parris & Kates, 2003). As stated by Duit and
colleagues: “A problem confronting most studies aiming to compare environmental management per-
formance among countries is that of finding valid estimates of environmental quality” (2009, p. 43).
However, there are numerous attempts to quantify states’ environmental performance. The scholarly
community and policy makers have increasingly made environmental indicators available in recent
decades, measuring various aspects of national-level environmental performance (for overviews see
Smeets & Weterings, 1999; Hammond, Rodenburg, Bryant, & Woodward, 1995). These measure-
ments vary from aggregate indices such as the yearly Environmental Protection Index, where a coun-
try receives a score based on outcomes in numerous environmental aspects, to specific data on particu-
lar measures such as levels of a certain pollutant. A strategy to analyze nations’ environmental per-
formance is hence to study its position in such indices (see Grafton and Knowles, 2004). Yet, when
scholars assess countries’ environmental performance they often only focus on single environmental
indicators (e.g., Cole, 2007; Koyuncu & Yilmaz, 2009). It has been identified that this is a serious
threat to the inferences drawn about the various factors affecting the environmental performance of
states (see Barrett, Gibson, Hoffman, & McDubbins, 2006).
In order to meet the challenging task of operationalizing the truly multi-faceted notion of envi-
ronmental goods we adopt a rather ambitious approach. To capture this concept in its widest possible
sense, we use a unique data set where we have compiled all environmental indicators available for
large cross-country comparisons deemed to stem from reliable sources and measuring a relevant as-
pect of environmental performance. More specifically, this data set consists of 107 variables available
across countries. We collected the measurements according to three criteria: 1) if they measure aspects
of states’ environmental performance, 2) if they are deemed as credible, and 3) if they are available
across a large sample of countries for a recent year. Specifically, our criteria included only those
measurements which had data for at least 10 islands states in order to get a comparable sample. With
these principles in mind we collected the final number of measurements from various sources. We
utilized existing sources of information where a large number of measurements are available to the
public, for example the United Nations’ GEO online database and the Quality of Government data set.
Yet, we have found that no existing overview of environmental measurements capture the full availa-
bility of indicators for states’ environmental performance. The data set we compiled is thus the, to our
knowledge, most comprehensive overview of environmental indicators across a global sample of
countries.

The result is a data set of 107 measurements where the unit of analysis is countries. For an
overview of this data refer to Appendix B. When choosing environmental indicators, our aim was to
capture the full variance of the measurements addressing the fact that environmental goods is a diverse
concept where internal components will differ according to how they are affected by various factors
(Barrett et al., 2006). In order to clearly see which environmental factors drive the result, we used the
composite parts of environmental indices, choosing indicators as specific as possible. For example, the
Environmental Vulnerability Index is an aggregate score but consists of a number of subcomponents.
We therefore only study the composite parts of this index and not the built-up measurement in itself.
Following the same logic, we avoided compiling different measurements into a larger index.
When collecting the data, we found indicators from different sources essentially quantifying
the same concept. For example, several sources estimate national carbon dioxide emissions. In these
instances we have selected the measurement covering the largest number of states. For a full list of
environmental indicators being used as dependent variables in the empirical analysis in the first part of
our analysis, see Appendix B.
Independent Variables
In the second stage of our analysis we focus on the indices in which island states on average seem to
do better than continental states and set out to test the explanatory power of the causal mechanisms
discussed in previous literature on the performance of small states. These factors are derived from the
theoretical literature discussed above and are operationalized according to the following logic: Popu-
lation size is a measure of number of people (thousands) per each nation. The figures refer to the year
2005 and are taken from the United Nations Population Division.3 Isolation is the distance (kilome-
ters) from the nearest continent. If a country is within a continent it is assigned the value zero. The
figures are taken from the Environmental Vulnerability Index 2004.4 Homogeneity is measured with
the ethnic fractionalization variable. This measurement reflects the probability that two randomly se-
lected people from a given country will not belong to the same linguistic or religious group. The high-
3 The data is available at http://sedac.ciesin.columbia.edu/data/collection/cesic. 4 The data is available at http://sedac.ciesin.columbia.edu/data/collection/cesic.

er the number in this measurement, the more fractionalized society is. The indicator is developed by
Alesina, and colleagues (2003).5 Total area is a variable expressed in squared kilometers and refers to
a nation’s total area. The data are obtained from the CIA World Factbook.6 Conflicts are measured
with a variable expressed in the average number of conflict years per decade within the country over
the past 50 years. The data are taken from the International Disaster Database.7 Colonial heritage is a
dummy variable, assigning the value 1 if the country has ever been a British colony. This data is taken
from Teorell and Hadenius (2005)8. Island is a dummy variable measuring if the country is an island
(assigned 1).
Methodology
In the first part of the analysis the aim is to assess if island states perform better than continental states
in our 107 environmental measurements. To fulfill this purpose we run separate bivariate OLS regres-
sions for all the environmental indicators and use the island dummy as an independent variable to de-
termine statistically whether island status is associated with better performance in the chosen meas-
urements.9 As we will discuss below, this renders a sample of 20 environmental indicators where we
find positive effects from our island dummy variable.
In the second part of the analysis we focus on these 20 environmental indicators in which island
status has a positive effect. The aim of the analysis is to determine which of the six independent varia-
bles discussed above—that is, population size, ethnic fractionalization, colonial heritage, conflicts,
size, and isolation—can explain the islands’ better performance in these 20 different measurements. In
order to test what drives such results, we create interaction terms between an island dummy variable
and each of the six explanatory factors. The reason for doing so is to create an estimate for the coeffi-
cients of each variable that is contingent on whether a country is an island or not. For instance, the
5 The data is available at http://www.anderson.ucla.edu/faculty_pages/romain.wacziarg/downloads/fractionalization.xls. 6 Data from Sudan is taken from before the partition. See https://www.cia.gov/library/publications/the-world-factbook/. 7 The data is available at http://sedac.ciesin.columbia.edu/data/collection/cesic. 8 Available through Quality of Government data set (Teorell, Samanni, Holmberg, & Rothstein, 2011) 9 Regarding our numerous dependent variables, we took effort to investigate their individual dispersion. Six of our dependent variables (acidification exceedance from anthropogenic sulfur deposition, fish catch, generation of hazardous waste, and water footprint of production for blue water, green water, and return flows) were logarithmically transformed for a better model fit. When heteroskedasticity of errors was detected through Breusch-Pagan/Cook-Weisberg heteroskedasticity test, robust stand-ard errors were added to correct for it.
interaction effect between the size of a country and the island dummy variable allows us to investigate
if the positive effects on an environmental indicator from being an island stem from its size. We then
use OLS regression analysis to examine the explanatory power of these interactions for each of the 20
dependent variables where islands perform better.10
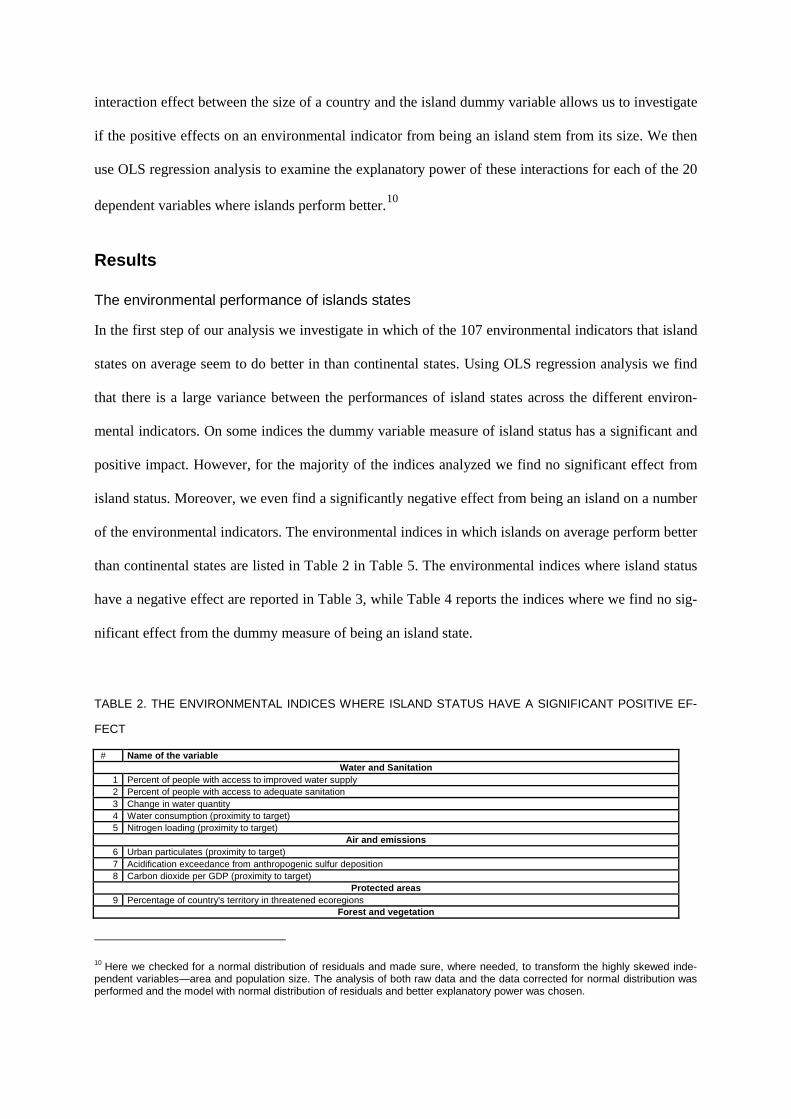
Results
The environmental performance of islands states
In the first step of our analysis we investigate in which of the 107 environmental indicators that island
states on average seem to do better in than continental states. Using OLS regression analysis we find
that there is a large variance between the performances of island states across the different environ-
mental indicators. On some indices the dummy variable measure of island status has a significant and
positive impact. However, for the majority of the indices analyzed we find no significant effect from
island status. Moreover, we even find a significantly negative effect from being an island on a number
of the environmental indicators. The environmental indices in which islands on average perform better
than continental states are listed in Table 2 in Table 5. The environmental indices where island status
have a negative effect are reported in Table 3, while Table 4 reports the indices where we find no sig-
nificant effect from the dummy measure of being an island state.
TABLE 2. THE ENVIRONMENTAL INDICES WHERE ISLAND STATUS HAVE A SIGNIFICANT POSITIVE EF-
FECT
# Name of the variable Water and Sanitation
1 Percent of people with access to improved water supply 2 Percent of people with access to adequate sanitation 3 Change in water quantity 4 Water consumption (proximity to target) 5 Nitrogen loading (proximity to target)
Air and emissions 6 Urban particulates (proximity to target) 7 Acidification exceedance from anthropogenic sulfur deposition 8 Carbon dioxide per GDP (proximity to target)
Protected areas 9 Percentage of country's territory in threatened ecoregions
Forest and vegetation
10 Here we checked for a normal distribution of residuals and made sure, where needed, to transform the highly skewed inde-pendent variables—area and population size. The analysis of both raw data and the data corrected for normal distribution was performed and the model with normal distribution of residuals and better explanatory power was chosen.

10 Forest cover change 11 Timber harvest rate (proximity to target)
Fisheries and the marine environment 12 Coastal shelf fishing pressure 13 Overfishing (proximity to target) 14 Fish catch in marine and inland waters 15 Clean waters
Ecological footprint 16 Water footprint of consumption - Internal 17 Water footprint of production - Green water 18 Water footprint of production - Blue water 19 Water footprint of production - Return flows
Waste 20 Generation of hazardous waste
TABLE 3. THE ENVIRONMENTAL INDICES WHERE ISLAND STATUS HAVE A SIGNIFICANT NEGATIVE
EFFECT
Air 21 Sulfur dioxide emissions per capita 22 Carbon dioxide per capita 23 Anthropogenic sulfur dioxide emissions per populated land area 24 Anthropogenic volatile organic compound emissions per populated land area 25 Use of ozone depleting substances per land area
Biodiversity 26 Endangered species 27 Threatened native bird species as a percentage of total native species 28 Threatened native species as a percentage of total native mammal species 29 Threatened native reptiles as a percentage of total native reptile species 30 Threatened amphibian species as a percentage of known amphibian species in each country
Protected areas 31 Marine protection 32 Ecoregion protection 33 Critical habitat protection
Forest 34 Percentage of total forest area that is certified for sustainable management
Fisheries and the marine environment 35 Sense of place - Lasting special places 36 Tons of fish catch per ton of fish catching capacity 37 Food provision - Mariculture 38 Natural products
Energy 39 Renewable energy (proximity to target)
Agriculture, pesticides, fertilizers 40 Fertilizer consumption per hectare of arable land 41 Pesticide consumption per hectare of arable land 42 Intensive farming
Land use 43 Fragmented habitats 44 Percentage of land that is built upon
Water footprint 45 Water footprint of consumption - External
Environmental regulation 46 Number of environmental agreements 47 Participation in international environmental agreements 48 Number of memberships in environmental intergovernmental organizations 49 Participation in the Responsible Care Program of the Chemical Manufacturer's Association
Anthropogenic pressure 50 Percentage of total land area (including inland waters) having very low anthropogenic impact 51 Percentage of total land area (including inland waters) having very high anthropogenic impact

TABLE 4. THE ENVIRONMENTAL INDICES WHERE ISLAND STATUS DID NOT HAVE ANY SIGNIFICANT
EFFECT
Water and sanitation 52 Freshwater availability per capita 53 Percentage of country under severe water stress 54 Water withdrawal score
Air 55 Sulfur dioxide emissions per GDP 56 Carbon dioxide emissions per electricity generation 57 Import of polluting goods and raw materials as percentage of total imports of goods and services 58 Use of ozone depleting substances per capita 59 Regional ozone (proximity to target) 60 Anthropogenic NOx emissions per populated land area
Biodiversity 61 Threatened flowering plants species as a percentage of all wild species 62 Threatened gymnosperms as a percentage of total native species of gymnosperms 63 Threatened native species of pteridophytes as a percentage of total native species 64 National biodiversity index 65 Extinctions
Protected areas 66 Terrestrial protected areas 67 Wilderness protection (proximity to target)
Forest and vegetation 68 Growing stock change 69 Forest loss 70 Natural vegetation cover remaining 71 Loss of natural vegetation cover
Fisheries and the marine environment 72 Fishing stocks overexploited 73 Fish catching capacity per fish producing area score 74 Fishing effort 75 Percentage of fish species overexploited and depleted 76 Fisheries protection score 77 Ecosystem imbalance 78 Food provision - Wild caught fisheries 79 Sense of place - Iconic species 80 Biodiversity - Habitats 81 Biodiversity - Species 82 Carbon storage 83 Coastal protection
Energy 84 Energy efficiency (proximity to target) 85 Energy materials score
Agriculture, pesticides, fertilizers 86 Salinized area due to irrigation as percentage of total arable land
Land use 87 Percentage of cultivated and modified land area with light soil degradation 88 Percentage of cultivated and modified land area with moderate soil degradation 89 Percentage of cultivated and modified land area with extreme soil degradation 90 Degradation 91 Percentage of modified land 92 Percentage of land cultivated 93 Percentage of cultivated and modified land area with strong soil degradation 94 Desertification sub-index
Ecofootprint 95 Water footprint of consumption - total 96 Water footprint of production - stress on blue water resources (%) 97 Ecological footprint per capita
Anthropogenic pressure 98 Spills 99 Mining
Environmental regulation 100 World Economic Forum Survey on environmental governance 101 Local Agenda 21 initiatives per million people 102 IUCN member organizations per million population 103 Number of ISO 14001 certified companies per billion dollars GDP (PPP) 104 Pesticide regulation 105 Percentage of variables missing from the CGSDI "Rio to Joburg Dashboard".
Other 106 World Economic Forum Survey on private sector environmental innovation 107 Contribution to international and bilateral funding of environmental projects and development aid

19
More specifically, analyzing the results reported in Tables 2 to 4, we find that being an is-
land has a significantly positive impact in only 20 of our 107 environmental measurements.
Island states seem to perform worse than continental states on average in 31 measurements in
the analysis. However, in a majority of the indicators, 56 out of the total 107, island status does
not have a statistically significant impact. Hence, this is the first important finding of this paper:
the positive effect from being an island on the performance in the environmental measurements
is far from a general one. In fact, in most of the measurements we find no such effect.
Judging from the first analysis, are there trends that lead us to infer that islands tend to
perform better in a certain type of environmental outcomes? Overall, the results are diverse and
the patterns are far from clear-cut. However, we find some trends in the bivariate results that
might be worth exploring further. Judging from Table 2, it seems that there is a positive effect
from being an island on several indices related to water quality. Inversely, islands seem to do
worse in other groups of environmental measurements, for example, indicators related to pro-
tected areas and biodiversity. Also, on measurements gauging environmental regulations, island
status seems to actually have a negative effect.
It should be noted that a focus on the exact number of measurements could be misleading
here. In our analysis some environmental features are only measured by few indicators, such as
greenhouse gas emissions, measured by the national levels of carbon dioxide emissions; other
aspects of environmental performance are estimated by several indicators in our analysis. For
instance, the detailed availability of data on biodiversity renders a more nuanced analysis of
such indicators as threatened mammal species, bird species, amphibian species, etc. Hence, the
large number of measurements for a certain concept might skew the general results if only ana-
lyzed in numerical terms. As mentioned before, we were careful not to include indicators that
measure identical concepts. However, this concern begs us to be cautious when making an in-

20
ference of the general pattern found in this analysis. But as a general pattern, the dummy meas-
ure of being an island state still has a significantly negative effect or no effect at all on far more
indices than it has a significantly positive effect.
The Impact from our Independent Variables on the Indices Where Islands Perform Bet-
ter
In the second part of our empirical analysis we analyze the 20 environmental indicators in
which island status has a significantly positive effect (see Table 2). The aim is to assess to what
extent the five factors (homogeneity, colonial heritage, geographical characteristics, size, and
isolation), suggested in the literature as beneficial characteristics of islands (measured in the six
indicators discussed above), can explain their good performance in these environmental indices.
Hence, we are not interested in the impact from these characteristics on the indices in general,
but specifically if they matter for the performance of island states. As mentioned, we therefore
model interaction terms between the island dummy variable and each of the six independent
indicators to see what features seem to drive the results from the positive effect of being an is-
land on the 20 environmental indices where islands perform better.

TABLE 5. THE EFFECT OF ISLAND-SPECIFIC FACTORS ON SELECTED ENVIRONMENTAL OUTCOMES, OLS REGRESSION ANALYSIS
Access to water
Access to sanitation Water quality Water
consumption Nitrogen loading
Urban particulates Acidification CO2 per GDP Threatened
ecoregions Forest cover change
Timber harvest rate
Interpretation of the DV, direct: an increase is interpreted as “good” for the environment, inverse: an increase is interpreted as “bad” for the environment.
direct direct direct direct direct direct inverse direct inverse direct direct
Interaction, islands-Isolation 0.040 0.029 -0.023 -0.605 -0.001 -0.013 0.001 -1.665 -0.012 0.035 0.023
(0.022) (0.026) (0.019) (4.025) (0.007) (0.007) (0.001) (2.195) (0.027) (0.028) (0.033) Interaction, islands-Area 0.787 3.390 3.680 244.400 6.308** 0.000 0.216 552.300 9.963* 2.399 -2.200
(4.056) (5.735) (3.409) (710.000) (2.333) (0.000) (0.127) (313.100) (4.851) (5.410) (2.072) Interaction, islands-Ethnic fract. 0.408 -10.110 -37.820 -4.833 3.243 6.554 0.726 -5.618* -18.220 24.300 -9.014 (25.450) (26.420) (24.030) (4.090) (8.187) (16.090) (0.935) (2.371) (30.740) (32.630) (9.596) Interaction, islands-Population 1.571 -0.340 -2.394 -90.330 -2.907 0.000 -0.270 -30.490 -6.726 -3.450 2.460
(5.246) (5.926) (3.082) (850.400) (2.834) (0.000) (0.229) (397.500) (6.404) (6.736) (2.338) Interaction, islands-Conflicts 0.004 0.110 -0.103 -8.015 0.219 -0.322 0.010 -107.300 3.011 0.472 0.252
(1.783) (1.133) (0.875) (246.000) (0.567) (0.953) (0.063) (103.700) (2.218) (2.293) (0.672) Interaction, islands-British 4.797 31.820* 6.368 1.823 -3.657 0.426 0.496 -156.100 -10.290 6.203 2.065 (12.220) (14.130) (13.540) (2.317) (4.492) (8.133) (0.350) (1.125) (14.860) (16.170) (6.753) Island dummy -27.090 -38.710 -8.811 -121.100 -42.580** 9.884 -1.536 -2.383 -50.040 -8.053 13.050 (32.820) (42.450) (28.520) (6.916) (16.050) (7.653) (1.032) (3.006) (36.290) (41.150) (14.810) Isolation -0.045* -0.040 0.033 1.440 0.002 0.019** -0.001 1.785 0.003 -0.032 -0.022 (0.021) (0.025) (0.018) (3.813) (0.007) (0.007) (0.001) (2.178) (0.026) (0.027) (0.033) Area -5.768** -4.242 2.543 -442.900 -6.487** 0.000 -0.298** -233.700 -15.850*** -4.065 1.789
(1.970) (2.495) (1.357) (254.000) (2.331) (0.000) (0.104) (230.200) (2.175) (2.507) (1.977) Ethnic fractionalization -47.910*** -49.970*** 17.460* 1.657 -3.005 -4.492 -1.824** 116.000 5.064 -33.800** 8.227 (10.020) (11.770) (6.987) (1.278) (8.102) (9.487) (0.632) (1.042) (12.350) (12.950) (9.295) Population 4.040 2.514 -7.150*** -205.700 2.933 0.000 0.574*** 53.900 17.16*** 1.717 -2.575
(2.355) (2.646) (1.615) (299.800) (2.827) (0.000) (0.135) (271.100) (2.886) (3.024) (2.290) Probability of conflict -1.903*** -1.905** 0.176 7.626 -0.250 -1.307* -0.098** 11.900 -0.692 -0.269 -0.894 (0.584) (0.604 (0.409) (73.880) (0.563) (0.577) (0.037) (64.360) (0.727) (0.752) (0.517) British colony -2.318 -8.621 -3.643 -1.160 2.642 -8.970 -0.734** 197.600 -17.67* -8.049 -6.540
(5.617) (6.119) (3.917) (721.700) (4.445) (5.853) (0.282) (529.600) (6.988) (7.299) (5.869) Constant 117.100*** 104.9*** 62.25*** 13.328*** 143.400*** 71.760*** -0.743 7.904*** 91.570*** 120.100*** 93.050***
(17.720) (24.140) (13.380) (2.356) (16.020) (4.564) (0.879) (1.978) (18.260) (21.650) (13.800) Observations 175 173 173 159 159 165 184 169 183 178 157 R-squared 0.349 0.336 0.351 0.136 0.137 0.178 0.308 0.077 0.377 0.158 0.100 Number of islands 30 29 28 15 15 23 35 30 34 32 16 Robust standard errors no yes yes no yes yes yes yes no no yes Population and area logged yes yes yes yes yes no yes yes yes yes yes Notes: Standard errors in parentheses, ***=p<0.001, **=p<0.01, *=p<0.05. Population and area are logged where they improve fit of the model. Robust standard errors are included in the models where heteroskedastisity is detected.
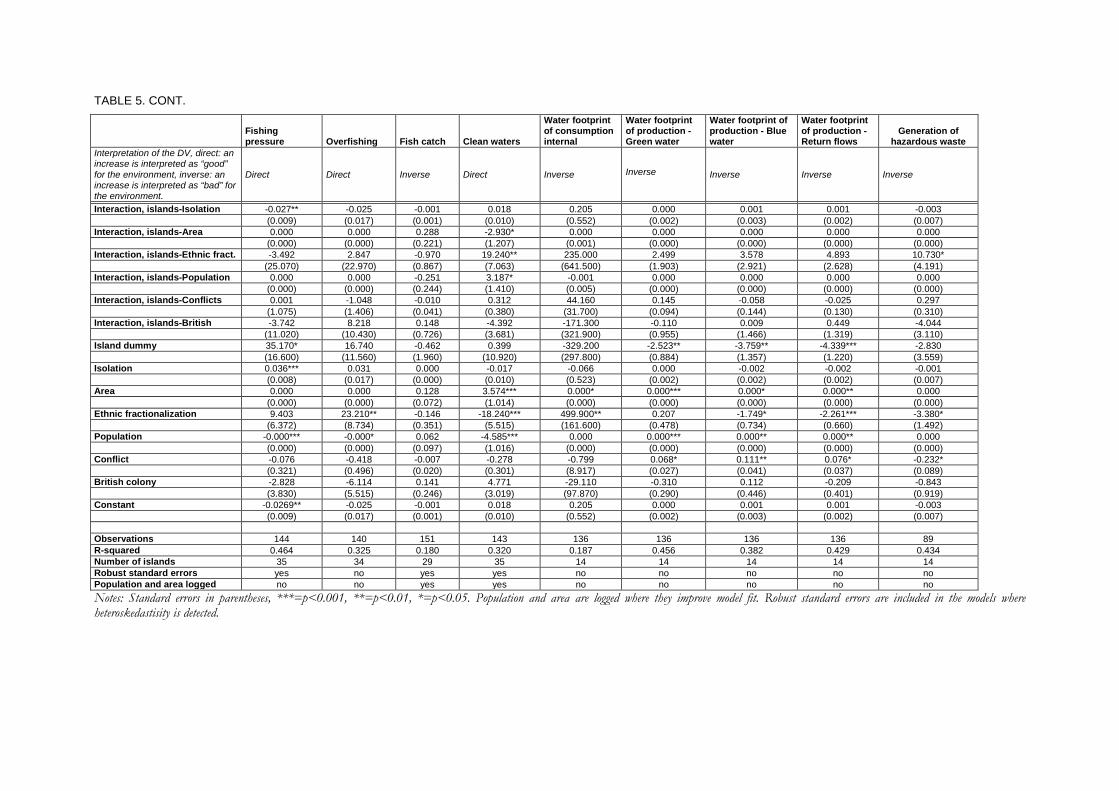
TABLE 5. CONT.
Fishing pressure Overfishing Fish catch Clean waters
Water footprint of consumption internal
Water footprint of production - Green water
Water footprint of production - Blue water
Water footprint of production - Return flows
Generation of hazardous waste
Interpretation of the DV, direct: an increase is interpreted as “good” for the environment, inverse: an increase is interpreted as “bad” for the environment.
Direct
Direct
Inverse
Direct
Inverse
Inverse
Inverse
Inverse
Inverse
Interaction, islands-Isolation -0.027** -0.025 -0.001 0.018 0.205 0.000 0.001 0.001 -0.003
(0.009) (0.017) (0.001) (0.010) (0.552) (0.002) (0.003) (0.002) (0.007)
Interaction, islands-Area 0.000 0.000 0.288 -2.930* 0.000 0.000 0.000 0.000 0.000
(0.000) (0.000) (0.221) (1.207) (0.001) (0.000) (0.000) (0.000) (0.000)
Interaction, islands-Ethnic fract. -3.492 2.847 -0.970 19.240** 235.000 2.499 3.578 4.893 10.730* (25.070) (22.970) (0.867) (7.063) (641.500) (1.903) (2.921) (2.628) (4.191) Interaction, islands-Population 0.000 0.000 -0.251 3.187* -0.001 0.000 0.000 0.000 0.000 (0.000) (0.000) (0.244) (1.410) (0.005) (0.000) (0.000) (0.000) (0.000) Interaction, islands-Conflicts 0.001 -1.048 -0.010 0.312 44.160 0.145 -0.058 -0.025 0.297
(1.075) (1.406) (0.041) (0.380) (31.700) (0.094) (0.144) (0.130) (0.310)
Interaction, islands-British -3.742 8.218 0.148 -4.392 -171.300 -0.110 0.009 0.449 -4.044 (11.020) (10.430) (0.726) (3.681) (321.900) (0.955) (1.466) (1.319) (3.110) Island dummy 35.170* 16.740 -0.462 0.399 -329.200 -2.523** -3.759** -4.339*** -2.830 (16.600) (11.560) (1.960) (10.920) (297.800) (0.884) (1.357) (1.220) (3.559) Isolation 0.036*** 0.031 0.000 -0.017 -0.066 0.000 -0.002 -0.002 -0.001 (0.008) (0.017) (0.000) (0.010) (0.523) (0.002) (0.002) (0.002) (0.007) Area 0.000 0.000 0.128 3.574*** 0.000* 0.000*** 0.000* 0.000** 0.000 (0.000) (0.000) (0.072) (1.014) (0.000) (0.000) (0.000) (0.000) (0.000) Ethnic fractionalization 9.403 23.210** -0.146 -18.240*** 499.900** 0.207 -1.749* -2.261*** -3.380* (6.372) (8.734) (0.351) (5.515) (161.600) (0.478) (0.734) (0.660) (1.492) Population -0.000*** -0.000* 0.062 -4.585*** 0.000 0.000*** 0.000** 0.000** 0.000
(0.000) (0.000) (0.097) (1.016) (0.000) (0.000) (0.000) (0.000) (0.000)
Conflict -0.076 -0.418 -0.007 -0.278 -0.799 0.068* 0.111** 0.076* -0.232* (0.321) (0.496) (0.020) (0.301) (8.917) (0.027) (0.041) (0.037) (0.089) British colony -2.828 -6.114 0.141 4.771 -29.110 -0.310 0.112 -0.209 -0.843
(3.830) (5.515) (0.246) (3.019) (97.870) (0.290) (0.446) (0.401) (0.919)
Constant -0.0269** -0.025 -0.001 0.018 0.205 0.000 0.001 0.001 -0.003
(0.009) (0.017) (0.001) (0.010) (0.552) (0.002) (0.003) (0.002) (0.007)
Observations 144 140 151 143 136 136 136 136 89 R-squared 0.464 0.325 0.180 0.320 0.187 0.456 0.382 0.429 0.434 Number of islands 35 34 29 35 14 14 14 14 14 Robust standard errors yes no yes yes no no no no no Population and area logged no no yes yes no no no no no Notes: Standard errors in parentheses, ***=p<0.001, **=p<0.01, *=p<0.05. Population and area are logged where they improve model fit. Robust standard errors are included in the models where heteroskedastisity is detected.

The results from the multivariate regression analysis, reported in Table 5, elucidate that the six
variables we use as independent variables have little explanatory power for why island states perform
better in these indices. When focusing on the interaction terms with the island dummy it is evident that
there are very few instances where we find significant effects. In fact, we find that in only nine of our
dependent variables the variance can to some extent be explained by the interaction terms.
Specifically, islands situated closer to the continent seem to exert less damaging pressure on fish
stocks on average. Smaller islands tend to have a lower percentage of their area situated in threatened
ecoregions and have cleaner coastal waters. However, at the same time they tend to have higher
nitrogen loading both in the water and atmosphere. However, on the contrary, islands with larger
populations tend to have cleaner coastal waters on average. Ethnic heterogeneity of populations on
islands tends to result in lower carbon dioxide emissions per capita and less generation of hazardous
waste, while fractionalized island states on average tend to have worse coastal water quality. Finally,
island states with a heritage of British colonialism tend to be associated with better access to
sanitation. In other words, the six independent factors we study seldom seem to be robust predictors of
the variance in the states’ performance in these environmental indices and these factors are not
especially good at predicting islands’ environmental performance in particular.
Summing Up The Results
It should be stated that there are numerous predictors for how states perform in environmental
measurements. We have, in the analysis performed in this paper, focused explicitly on the underlying
five factors said to make island states perform better in numerous institutional aspects (e.g.,
democracy and economic development). As such, we have not controlled statistically for potential
intermediary variables that might explain states’ general performance in the environmental
measurements. As stated, this is due to the fact that our aim has not been to explain fully how states
perform in these indices, but explicitly to test: (1) if island status has an impact on environmental
performance; and (2) if the variables identified as driving the islands’ positive performance in other
aspects are also important when analyzing their provision of environmental goods.

It is likely that an analysis of over a hundred dependent variables comes with a cost of nuances
and specificity. This article has approached the topic of island states’ environmental performance in
the broadest sense possible and, hence, might have lost some fine-tuned findings of certain
measurements if we would have, for instance, only studied one single environmental indicator. As the
questions for research in this paper are fairly unexplored we urge other scholars to continue this
discussion and perhaps complement this approach with a more in-depth examination. There is a need
for a careful analysis of specific policy areas; for instance, why are island states possibly
outperforming continental states in water-related indices? Also historical analysis can be performed in
small-N studies investigating why certain island states might differ in their environmental performance
in comparison to continental states. Future research could also take into account potentially omitted
variables from the analysis performed in this paper. For instance, the relationship between island states
and their environmental performance and economic development deserves more attention in future
research.
Concluding Remarks
There is a large body of literature discussing why islands seem to have better governance and
economic development than continental states, tracing this to certain features of islands’ composition
and history. Building on this literature and claiming that countries with better institutional
performance provide social goods more efficiently, we introduce a seldom investigated question: do
islands also perform better in terms of environmental goods, and if so, why? Using a unique data set of
107 environmental indicators available across countries, we perform the first empirical test of this
kind. It seems that the results are ambiguous. Islands seem to perform better in some measurements
and worse or with no difference from mainland states in others. Our findings do, however, suggest
some interesting trends. For instance, there is a positive effect from being an island on indicators
related to water quality, but a negative one on indicators related to environmental regulations and also
numerous measures of protected areas and biodiversity. Hence, it seems that island states are not better
in environmental performance than continental states in general.

We also analyze the environmental measurements where the island status of a state has a
positive effect and we draw inferences on which factors seem to be driving the results. Here we find
no unified pattern. For some indices, the factors are related to internal composition of islands, such as
their homogeneity. On other measurements, the observed effects seem to stem from geographical
factors of territory size, isolation, or their colonial history. For example, smaller islands tend to have
cleaner coastal waters; ethnic homogeneity seems to explain country’s performance in carbon dioxide
emissions and the generation of waste, while former British colonies seem to have better access to
sanitation.
The main contribution of our paper is the detailed comparative analysis of the provisioning
of environmental goods provision by islands and continental states. Addressing the problem of
measuring environmental performance, we have adopted a broad approach, where we analyze over a
hundred variables related to environmental outcomes. Future research would benefit of addressing not
only the underlying features of islands states—that is, the factors we focus on in this paper—but the
effect from the numerous possible intermediate factors (such as democracy, economic development,
and the quality of government institutions) that might determine states’ environmental performance.
We urge scholars to continue this endeavor by the use of different methods and approaches. Further
research is also required in order to disentangle the issue of why islands perform better than
continental states in respect to some indicators, while show worse outcomes in others.

REFERENCES
Agrawal, A., & Gibson, C. (1999). Enchantment and disenchantment: The role of community in
natural resource conservation. World Development, 27(4), 629-649.
Agrawal, A. & Goyal, S. (2001). Group size and collective action: Third-party monitoring in common-
pool resources. Comparative Political Studies, 34(1), 63-93.
Alesina, A., & Spoalare, E. (1997). On the number and size of nations. Quarterly Journal of
Economics, 112, 1027-1056.
Alesina, A., Devleeschauwer, A., Easterly, W., Kurlat, S., & Wacziarg, R. (2003). Fractionalization.
Journal of Economic Growth, 8, 155-194.
Anckar, D. & Anckar, C. (1995). Size, insularity and democracy. Scandinavian Political Studies,
18(4), 211-229.
Anckar, D. (1999). Homogeneity and smallness: Dahl and Tufte revisited. Scandinavian Political
Studies, 22, 29-44.
Anckar, D. (2002). Why are small island states democracies? The Round Table: The Commonwealth
Journal of International Affairs, 91(365), 375-390.
Anckar, D. (2006). Islandness or smallness? A comparative look at political institutions in small island
states. Island Studies Journal, 1(1), 43-54.
Armstrong, H., & Read, R. (1998). Trade and growth in small states: The impact of global trade
liberalizations. World Economy, 21(4), 563-585.
Axelrod, R. (1984). The Evolution of Cooperation. New York: Basic Books.
Baldicchino, G. (2005). The contribution of social capital to economic growth in small states: Lessons
from island jurisdictions. The Round Table: The Commonwealth Journal of International
Affairs, 94(1), 31-46.
Baldacchino, G. (1997). Global tourism and informal labour relations: The small-scale syndrome at
work. London: Mansell.

Barrett, C. B., Gibson, C. C., Hoffman, B. and McCubbins, M. D. (2006). The complex links between
governance and biodiversity. Conservation biology, 20(5), 1358-1366.
Barro, R., & Salai-Martin, X. 1995. Economic growth. New York: McGraw-Hill.
Bell, S., & Morse, S. 1999. Sustainability indicators: Measuring the immeasurable. London:
Earthscan.
Bray, M. (1991). Making small practical: the organization and management of ministries of education
in small states. London: Commonwealth Secretariat.
Briguglio, L. (1995). Small island developing states and their economic vulnerabilities. World
Development, 23(9), 1615-1632.
Bromley, D. W. (1992). Making the commons work. Theory, practice, and policy. San Francisco:
Institute for Contemporary Studies.
Central Intelligence Agency (CIA). (2012). The World Factbook. Retreived from
https://www.cia.gov/library/publications/the-world-factbook/
Clague, C., Gleason, S., & Knack, S. (2001). Determinants of lasting democracy in poor countries:
Culture, development, and institutions. Annals of the American Academy of Political and
Social Science, 573(1), 16-41.
Cole, M. A. (2007). Corruption, income and the environment: An empirical analysis. Ecological
Economics, 62(3-4), 637-647.
Congdon-Fors, H. (2007). Island status, country size and economic performance in former colonies:
The role of institutions (Working Paper in Economics #257). School of Business, Economics
and Law, the University of Gothenburg.
Congdon-Fors, H. (2013). Do island states have better institutions? Forthcoming in Journal of
Comparative Economics.
Dahl, R., & Tufte, E. R. (1973). Size and democracy: The case for decentralization. In L. Diamond
(Ed.), Developing democracy: Toward consolidation (pp. 117-160). Baltimore: John Hopkins
University Press.

Duit, A., Hall, O., Mikusinski, G., & Angelstam, P. (2009). Saving the woodpeckers: Social capital,
governance, and policy performance. The Journal of Environment and Development, 18(1),
42-61.
Duit, A. (2011). Patterns of environmental collective action: Some cross-national findings. Political
Studies, 59(4), 900–920.
Easterly, W., & Kraay, A. (2000). Small states, small problems? Income, growth, and volatility in
small states. World Development, 28(11), 2013-2027.
Easterly, W., & Rebelo, S. (1993). Fiscal policy and economic growth: An empirical investigation.
Journal of Monetary Economics, 32, 417-457.
Erdlenbruch, K., Tidball, M., & van Soest, D. (2008). Renewable resource management, user heterogeneity, and
the scope for cooperation. Ecological Economics, 64(3), 597-602.
Emerson, J. W., Hsu, A., Levy, M. A., de Sherbinin, A., Mara, V., Esty, D. C., & Jaiteh, M. (2012). 2012
Environmental Performance Index and Pilot Trend Environmental Performance Index. New Haven:
Yale Center for Environmental Law and Policy.
Etro, F. (2006). Political geography. Public Choice, 127, 329-351.
Firmin-Sellers, K. (1995). The politics of property rights. The American Political Science Review,
89(4), 867-881.
Glassner, M. (1990). Neptune’s domain: A political geography of the sea. London: Unwin Hyman.
Grafton, R. Q., & Knowles, S. (2004). Social capital and national environmental performance: A
cross-sectional analysis. The Journal of Environment Development, 13, 336-370.
Hache, J. (1998). Towards a political approach to the Island question. In G. Baldacchino & R.
Greenwood (Eds.), Competing strategies of socio-economic development for small islands
(pp. 31-68). Charlottetown, PEI: Institute of Island Studies, University of Prince Edward
Island.
Hadenius, A. (1992). Democracy and development. Cambridge: Cambridge University Press.
Hammond, A., Adriaanse, A., Rodenburg, E., Bryant, D., & Woodward, R. (1995). Environmental
indicators: A systematic approach to measuring and reporting on environmental policy
performance in the context of sustainable development. Washington DC: World Resources

Institute.
Harden, S. (1985). Small is dangerous: Micro-states in a macro-world. London: Frances Pinter.
King, R. (1993). The geographical fascination of islands. In D. G Lockhart (Ed.), The development
process in small island states (pp. 13-37). London: Routledge.
Knack, S., & Azfar, O. (2003). Trade intensity, country size and corruption. Economics of
Governance, 4(1), 1-18.
Kuznets, S. (1960). Economic growth of small nations. In E. A. G. Robinson (Ed.), The economic
consequences of the size of nations. Proceedings of a conference held by the international
economic associations. Toronto: MacMillan.
Koyuncu, C., & Yilmaz, R. (2009). The impact of corruption on deforestation: Cross-country
evidence. The Journal of Developing Areas, 42(2), 213-222.
Lowenthal, D. (1987). Social features. In C. Clarke, & T. Payne (Eds.), Politics, security and
development in small states (pp. 26-49). London: Allen & Unwin.
Naidu, S. C. (2009). Heterogeneity and collective management: Evidence from common forests in
Himachal Pradesh, India. World Development, 37(3), 676-686.
Ostrom, E. (1990). Governing the commons. Cambridge: Cambridge University Press.
Ott, D. (2000). Small is democratic: An examination of state size and democratic development. New
York: Garland.
Parris, T. M., & Kates, R. W. (2003). Characterizing and measuring sustainable development. Annual
Review of Environment and Resources, 28, 559-586.
Pelling, M., & Uitto, J. I. (2001). Small island developing states: Natural disaster vulnerability and
global change. Environmental Hazards, 3, 49–62.
Poteete, A. R., & Ostrom, E. (2004). Heterogeneity, group size and collective action: The role of
institutions in forest management development and change. Development and Change, 35(3),
435-461.
Povitkina, M. (2012). Does democracy lead to better environmental outcomes? The impact of
democracy on the health of marine ecosystems at different stages of economic development
(Master’s thesis, The University of Gothenburg, Gothenburg, Sweden).

Prescott-Allen, R. (2001). The wellbeing of nations: A country-by-country index of quality of life and
the environment. Washington, DC: Island Press.
Romer, P. M. (1986). Increasing returns and long-run growth. Journal of Political Economy, 94, 1002-
1037.
Rothstein, B. (2005). Social traps and the problem of trust. Cambridge: Cambridge University Press.
Sjöstedt, M. (2014). Horizontal and vertical resource dilemmas in natural resource management: The
case of African fisheries. Forthcoming in Fish & Fisheries.
Smeets, E., & Weterings, R. (1999). Environmental indicators: Typology and overview (European
Environmental Agency, Technical Reports no. 25). Copenhagen: European Environmental
Agency.
Srebnik, H. (2004). Small island nations and democratic values. World Development, 32(2), 329-341.
Srinivasan, T. N. (1986). The costs and benefits of being a small remote island landlocked or ministate
economy. World Bank Research Observer, 1(2), 197-202.
Teorell, J., & Hadenius, A. (2005). Determinants of democratization: Taking stock of the large-N
evidence. mimeo., Department of Government, Uppsala University.
Teorell, J., Samanni, M., Holmberg, S., & Rothstein, B. (2011). The quality of government dataset,
version 6Apr11. University of Gothenburg: The Quality of Government Institute. Retreived
from http://www.qog.pol.gu.se.

APPENDIX A. The list of independent island states used in the analysis:
1. Antigua and Barbuda 2. Bahamas 3. Bahrain 4. Barbados 5. Solomon Islands 6. Cape Verde 7. Sri Lanka 8. Comoros 9. Cuba 10. Cyprus 11. Dominica 12. Fiji 13. Kiribati 14. Grenada 15. Haiti 16. Iceland 17. Jamaica 18. Japan 19. Madagascar 20. Maldives 21. Malta 22. Mauritius 23. Nauru 24. Vanuatu 25. New Zealand 26. Micronesia 27. Marshall Islands 28. Palau 29. The Philippines 30. Saint Kitts and Nevis 31. Saint Lucia 32. Saint Vincent and the Grenadines 33. Sao Tome and Principe 34. Seychelles 35. Singapore 36. Tonga 37. Trinidad and Tobago 38. Tuvalu 39. Samoa
Island-colony, included in the analysis: 40. Taiwan (China)

APPENDIX B. The list of environmental indicators used as dependent variables
# Name of the variable Source of data Original source Reference year N N of
island states
Interpretation Explanation
Water and Sanitation
1 Access to drinking water (proximity to target) EPI 2012 WHO/UNICEF 1990-2005, 2008 196 35 direct percentage of a country’s population that has access to an improved source of drinking water
2 Access to sanitation (proximity to target) EPI 2012 WHO/UNICEF 1990-2005, 2008 192 33 direct percentage of people with access to adequate sanitation facilities in relation to the total population
3 Change in water quantity (proximity to target) EPI 2012 P. Döll, K. Fiedler, and J. Zhang. Global-scale analysis of river flow alterations due
to water withdrawals and reservoirs, Hydrol. Earth Syst. Sci., 13
2005 202 32 direct reduction of mean annual river flow from "natural" state resulting from water withdrawals and reservoirs
4 Water consumption (proximity to target) EPI2006 University of New Hampshire, Water Systems Analysis Group
mean annual 1950-1995 171 16 direct
percentage, human water demand
5 Freshwater availability per capita ESI 2005 Center for Environmental System Research, Kassel University
1961-1995 (long-term average) 150 10 direct
meters cubed/person; the sum of internal renewable water per capita (average annual surface runoff and groundwater recharge generated from endogenous precipitation, taking into account evaporation from lakes and wetlands) and per capita water inflow from other countries
6 Percentage of country under severe water stress ESI 2005 Center for Environmental Systems Research, University of Kassel
1961-1995 (long-term average) 150 10 inverse percentage of national territory in which water consumption
exceeds 40 percent of available water
7 Water withdrawal score Wellbeing index FAO 2001 165 20 direct annual withdrawals of ground and surface water for domestic, agricultural, and industrial uses, in cubic kilometers per year
8 Nitrogen loading (proximity to target) EPI2006 University of New Hampshire, Water Systems Analysis Group
mean annual 1950-1995 172 16 direct milligrams/liter; accounts for: atmospheric nitrogen deposition,
nitrogen fixation, nitrogenous fertilizer loads, livestock nitrogen loading; and human nitrogen loading
Air and emissions
9 Sulfur dioxide emissions per capita (proximity to target) EPI 2012
Smith et al. (2011). Anthropogenic sulfur dioxide emissions: 1850–2005, Atmos. Chem. Phys., WDI, CIA World
Factbook
1850-2005 138 13 direct Kilograms of sulfur dioxide /person
10 Sulfur dioxide emissions per GDP (proximity to target) EPI 2012
Smith et al. (2011). Anthropogenic sulfur dioxide emissions: 1850–2005, Atmos. Chem. Phys., WDI, CIESIN
1850-2005 138 13 direct grams of sulfur dioxide per US dollar PPP (in 2005 constant US dollars)
11 Carbon dioxide per capita (proximity to target)
EPI 2012 International Energy Agency 1960-2009 137 13 direct kilograms of carbon dioxide per person
12 Carbon dioxide per GDP (proximity to target) EPI2006 Carbon Dioxide Information Analysis 2000 181 34 direct tons of carbon dioxide/ US dollar GDP PPP, in 2000 US dollar
13 CO2 emissions per electricity generation (proximity to target) EPI 2012 International Energy Agency 1960-2009 137 13 direct
grams of CO2 per kWh
14 Urban Particulates (proximity to target) EPI2006 Global Model of Ambient Particulates (GMAPS), World Bank 1999, 2000 180 27 direct
µg/m 3; only cities larger than 100,000 population and national capitals were considered, with a population weighted PM10 concentration to account for exposure
15 Anthropogenic NOx emissions per populated land area ESI 2005 UNFCCC, Greenhouse gas (GHG)
emissions database, etc. 1990-2003 158 19 inverse metric tons NOx emissions per populated land area
16 Anthropogenic sulfur dioxide emissions per populated land area ESI 2005 UNFCCC, Greenhouse gas (GHG)
emissions database, etc. 1990-2003 153 17 inverse metric tons sulfur dioxide per populated land area
17 Anthropogenic volatile organic compound emissions per populated land area ESI 2005 UNFCCC, Greenhouse gas (GHG)
emissions database, etc. 1990-2003 159 20 inverse metric tons of non-methane volatile organic compounds per populated land area
18 Acidification exceedance from anthropogenic ESI 2005 Stockholm Environment Institute at York 1990 236 40 inverse percentage of total land area at risk of acidification exceedance

# Name of the variable Source of data Original source Reference year N N of
island states
Interpretation Explanation
sulfur deposition
19 Import of polluting goods and raw materials as a percentage of total imports of goods and services ESI 2005 COMTRADE 2002 114 14 inverse import of polluting goods and raw materials as a percentage of
total imports of goods and services
20 Use of ozone depleting substances per land area Wellbeing index
Ozone Secretariat, United Nations Environment Programme. 1999. Production
and consumption of ozone depleting substances 1986-1998.
Ozone Secretariat, UNEP, Nairobi
1995 154 27 inverse the use of ozone depleting substances per hectare of total (land and inland waters) area in grams of ozone depleting potential (g odp/ha)
21 Use of ozone depleting substances per capita Wellbeing index Ozone Secretariat, UNEP. 1999. Production
and consumption of ozone depleting substances 1986-1998
1995 154 27 inverse use of ozone depleting substances per person in grams of ozone depleting potential (g odp/capita)
22 Regional ozone (proximity to target) EPI2006 MOZART-data, dev. at NCAR processed at Princeton University 1990-2004 218 39 direct parts per billion, ozone concentration; 10 highest concentrations
from 1990-2004 years Biodiversity
23 Threatened native bird species as a percentage of total native species Wellbeing index IUCN Species Survival Commission 1995 168 32 inverse
percentage
24 Threatened native species as a percentage of total native mammal species Wellbeing index IUCN Species Survival Commission 1995 176 31 inverse
percentage
25 Threatened native reptiles as a percentage of total native reptile species Wellbeing index IUCN Species Survival Commission 1995 139 31 inverse
percentage
26 Threatened amphibian species as a percentage of known amphibian species in each country ESI 2005 IUCN-The World Conservation Union Red
List of Threatened Species 2004 191 27 inverse percentage
27 Threatened flowering plants species as a percentage of all wild species Wellbeing index IUCN Species Survival Commission 1995 142 30 inverse
percentage
28 Threatened gymnosperms as a percentage of total native species of gymnosperms Wellbeing index IUCN Species Survival Commission 1995 81 18 inverse
percentage
29 Threatened native species of pteridophytes as a percentage of total native species Wellbeing index IUCN Species Survival Commission 1995 69 15 inverse
percentage
30 Endangered species EVI2004 Needed Source?
2000 230 39 inverse
number of endangered and vulnerable species per 1000 square kilometers; focuses on those species that have become endangered or threatened in a country with implied impacts on biodiversity and ecosystem integrity
31 Extinctions EVI2004 IUCN Red Book 2000 1900-2000 229 39 number of species known to have become extinct since 1900 per 1000 square kilometers
32 National Biodiversity Index ESI 2008 Convention on Biological Diversity, Global Biodiversity Outlook 2001 160 14 direct
score 0-1; assesses a country's species richness by measuring species abundance (includes some adjustment allowing for country size); countries with land area less than 5000 square kilometers are excluded as are overseas territories and dependencies
Protected areas 33 Marine protection (proximity to target) EPI 2012 IUCN and UNEP-WCMC 1990-2010 185 40 direct percentage of exclusive economic zone area protected
34 Terrestrial protected areas WB UNEP-WCMC, WRI 2010 202 34 direct percentage of total terrestrial area
35 Ecoregion protection NRMI CIESIN 2011 233 40 direct
percentage of biome area protected within country's land area; capped at 10% for each biome, consistent with international target, and weighted by share of biome's area in the country land area.
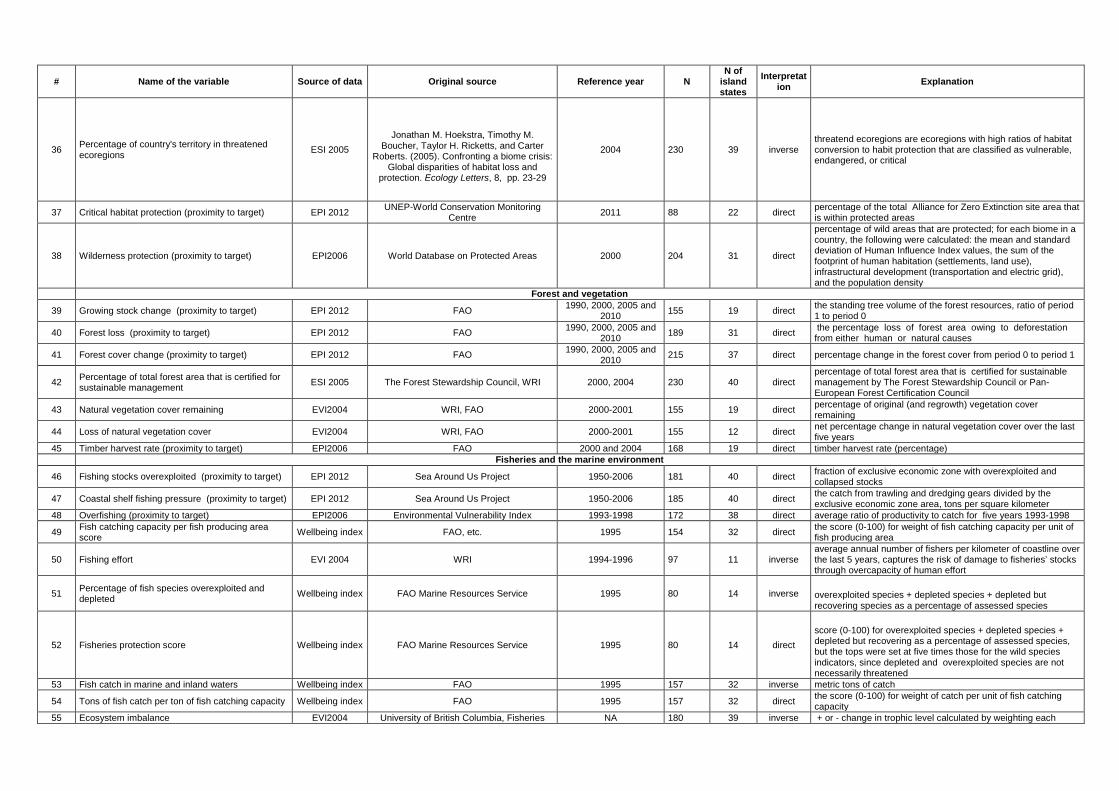
# Name of the variable Source of data Original source Reference year N N of
island states
Interpretation Explanation
36 Percentage of country's territory in threatened ecoregions ESI 2005
Jonathan M. Hoekstra, Timothy M. Boucher, Taylor H. Ricketts, and Carter
Roberts. (2005). Confronting a biome crisis: Global disparities of habitat loss and
protection. Ecology Letters, 8, pp. 23-29
2004 230 39 inverse threatend ecoregions are ecoregions with high ratios of habitat conversion to habit protection that are classified as vulnerable, endangered, or critical
37 Critical habitat protection (proximity to target) EPI 2012 UNEP-World Conservation Monitoring Centre 2011 88 22 direct percentage of the total Alliance for Zero Extinction site area that
is within protected areas
38 Wilderness protection (proximity to target) EPI2006 World Database on Protected Areas 2000 204 31 direct
percentage of wild areas that are protected; for each biome in a country, the following were calculated: the mean and standard deviation of Human Influence Index values, the sum of the footprint of human habitation (settlements, land use), infrastructural development (transportation and electric grid), and the population density
Forest and vegetation
39 Growing stock change (proximity to target) EPI 2012 FAO 1990, 2000, 2005 and 2010 155 19 direct the standing tree volume of the forest resources, ratio of period
1 to period 0
40 Forest loss (proximity to target) EPI 2012 FAO 1990, 2000, 2005 and 2010 189 31 direct the percentage loss of forest area owing to deforestation
from either human or natural causes
41 Forest cover change (proximity to target) EPI 2012 FAO 1990, 2000, 2005 and 2010 215 37 direct percentage change in the forest cover from period 0 to period 1
42 Percentage of total forest area that is certified for sustainable management ESI 2005 The Forest Stewardship Council, WRI 2000, 2004 230 40 direct
percentage of total forest area that is certified for sustainable management by The Forest Stewardship Council or Pan-European Forest Certification Council
43 Natural vegetation cover remaining EVI2004 WRI, FAO 2000-2001 155 19 direct percentage of original (and regrowth) vegetation cover remaining
44 Loss of natural vegetation cover EVI2004 WRI, FAO 2000-2001 155 12 direct net percentage change in natural vegetation cover over the last five years
45 Timber harvest rate (proximity to target) EPI2006 FAO 2000 and 2004 168 19 direct timber harvest rate (percentage) Fisheries and the marine environment
46 Fishing stocks overexploited (proximity to target) EPI 2012 Sea Around Us Project 1950-2006 181 40 direct fraction of exclusive economic zone with overexploited and collapsed stocks
47 Coastal shelf fishing pressure (proximity to target) EPI 2012 Sea Around Us Project 1950-2006 185 40 direct the catch from trawling and dredging gears divided by the exclusive economic zone area, tons per square kilometer
48 Overfishing (proximity to target) EPI2006 Environmental Vulnerability Index 1993-1998 172 38 direct average ratio of productivity to catch for five years 1993-1998
49 Fish catching capacity per fish producing area score Wellbeing index FAO, etc. 1995 154 32 direct the score (0-100) for weight of fish catching capacity per unit of
fish producing area
50 Fishing effort EVI 2004 WRI 1994-1996 97 11 inverse average annual number of fishers per kilometer of coastline over the last 5 years, captures the risk of damage to fisheries’ stocks through overcapacity of human effort
51 Percentage of fish species overexploited and depleted Wellbeing index FAO Marine Resources Service 1995 80 14 inverse overexploited species + depleted species + depleted but
recovering species as a percentage of assessed species
52 Fisheries protection score Wellbeing index FAO Marine Resources Service 1995 80 14 direct score (0-100) for overexploited species + depleted species + depleted but recovering as a percentage of assessed species, but the tops were set at five times those for the wild species indicators, since depleted and overexploited species are not necessarily threatened
53 Fish catch in marine and inland waters Wellbeing index FAO 1995 157 32 inverse metric tons of catch
54 Tons of fish catch per ton of fish catching capacity Wellbeing index FAO 1995 157 32 direct the score (0-100) for weight of catch per unit of fish catching capacity
55 Ecosystem imbalance EVI2004 University of British Columbia, Fisheries NA 180 39 inverse + or - change in trophic level calculated by weighting each

# Name of the variable Source of data Original source Reference year N N of
island states
Interpretation Explanation
Centre, Lower Mall Research Station
trophic level present in the national catch by the tons reported.; captures the risk of ecosystem stress and loss of diversity/ balance; the greater the downward trend, the more likely that the marine biomass and trophic structures have been damaged
56 Food provision - Wild caught fisheries OHI 2012 Ocean Health Index 2012 157 39 direct index, 0-100; reflects the amount of seafood captured in a sustainable way; the more seafood harvested or cultured sustainably, the higher the goal score
57 Food provision - Mariculture OHI 2012 Ocean Health Index 2012 157 39 direct index, 0-100; reflects the amount of seafood raised in a sustainable way; the more seafood harvested or cultured sustainably, the higher the goal score
58 Natural products OHI 2012 Ocean Health Index 2012 157 39 direct index, 0-100; measures how sustainably people harvest non-food products from the sea
59 Carbon storage OHI 2012 Ocean Health Index 2012 157 39 direct
index, 0-100; compares the current extent and condition of carbon dioxide storing coastal habitats (mangrove forests, seagrass meadows, and salt marshes) relative to their condition in the early 1980s.
60 Coastal protection OHI 2012 Ocean Health Index 2012 157 39 direct
index, 0- 100; measures the condition and extent of habitats that protect the coasts against storm waves and flooding; compares the current extent and condition of five key habitats that protect coastlines (mangrove forests, seagrass meadows, salt marshes, tropical coral reefs, and sea ice) from flooding and erosion relative to their condition in the early 1980s.
61 Sense of place - Iconic species OHI 2012 Ocean Health Index 2012 157 39 direct index, 0-100; measures the condition of iconic species to indicate some of ocean’s intangible benefits
62 Sense of place - Lasting special places OHI 2012 Ocean Health Index 2012 157 39 direct index, 0-100; measures the percent of protected coastline to indicate some of ocean’s intangible benefits
63 Clean waters OHI 2012 Ocean Health Index
2012 157 39 direct index, 0-100; measures contamination of waters by trash, nutrients, pathogens, and chemicals
64 Biodiversity - Habitats OHI 2012 Ocean Health Index
2012 157 39 direct index, 0-100; reflects conservation status of marine species
65 Biodiversity - Species OHI 2012 Ocean Health Index
2012 157 39 direct index, 0-100; reflects the condition of key habitats that support high numbers of species
Energy
66 Energy efficiency (proximity to target) EPI2006 Energy Information Administration 1994-2003 182 31 direct percentage of hydroelectric, biomass, geothermal, solar, and wind power production of total energy consumption
67 Renewable energy (proximity to target) EPI2006 Energy Information Administration 1994-2003 210 36 direct hydropower and renewable energy production as a percentage of total energy consumption; some countries exceed 100 percent because they are net exporters of renewable energy
68 Energy materials score Wellbeing index FAO 2001 180 32 direct the lower score of two indicators: energy consumption per hectare of total area and energy consumption per person; it is limited to an energy index because of a lack of data on consumption of materials and waste generation.
Waste 69 Generation of hazardous waste ESI 2005 UNEP 1992-2001 91 15 inverse metric tons of hazardous waste to be managed in the country Agriculture, pesticides, fertilizers
70 Salinized area due to irrigation as a percentage of total arable land ESI 2005 FAO
Arable land: 2000, Salinized area: MRYA
1990-1999 73 10 inverse percentage of total salinized arable land from irrigation
71 Fertilizer consumption per hectare of arable land ESI 2005 World Bank World Development Indicators MRYA 2001-2003 176 27 inverse 100 grams fertilizer consumption per hectare of arable land
72 Pesticide consumption per hectare of arable land ESI 2005 FAO MRYA 1990-2003 127 17 inverse kilograms of pesticide consumption per hectare of arable land
73 Intensive farming EVI 2004 FAO 1995-2000 176 32 mean tons of intensively farmed animals produced per year per

# Name of the variable Source of data Original source Reference year N N of
island states
Interpretation Explanation
square kilometer of land Land use
74 Percentage of modified land Wellbeing index WCMC, etc. mid-1990s 180 32 inverse percentage
75 Percentage of land cultivated Wellbeing index FAO, UNECE & FAO 2001 180 32 inverse percentage
76 Percentage of land that is built upon Wellbeing index WCMC, etc. mid-1990s 180 32 inverse percentage
77 Percentage of cultivated and modified land area with light soil degradation Wellbeing index UNEP/ISRIC, etc. 1990 167 19 inverse
a percentage of land with somewhat reduced agricultural suitability, where the light degree explains the level of soil degradation affecting an area given the weighted total percentage by the factors given; restoration to full productivity possible by modifying management; original biotic functions still largely intact
78 Percentage of cultivated and modified land area with moderate soil degradation Wellbeing index UNEP/ISRIC, etc. 1990 167 19 inverse percentage of land with greatly reduced agricultural suitability;
major improvements required to restore productivity; original biotic functions are partly destroyed
79 Percentage of cultivated and modified land Area with strong soil degradation Wellbeing index UNEP/ISRIC, etc. 1990 167 19 inverse percentage of land that is non-reclaimable at farm level; major
engineering works required for restoration; original biotic functions destroyed
80 Percentage of cultivated and modified land area with Extreme soil degradation Wellbeing index UNEP/ISRIC, etc. 1990 167 19 inverse percentage of land that is unreclaimable and beyond restoration;
original biotic functions fully destroyed
81 Degradation EVI2004 FAO 2000 165 12 inverse percentage of a country’s land area considered severely and very severely degraded; reflects the status of loss of ecosystems in a country (land can no longer revert to its natural ecosystem without active and costly rehabilitation by humans to reverse permanent damage, if at all)
82 Desertification sub-index EVI2004 EVI 2004 234 39 unweighted average of the scores for environmental risk occurrence (dry periods, hot winds, etc. )
83 Fragmented habitats EVI2004 World Bank World Development Indicators 2001 1990-1999 169 23 inverse
total length of all roads in a country (km)/land area (sq km); cumulative area of all fragments of natural cover greater than 1000 hectares in the country as a percent of total land area; a proxy measure for pressure on ecosystems resulting from fragmentation into discontinuous pieces that also relates to habitat disturbance and degradation; fragmentation is likely to affect biodiversity
Ecofootprint
84 Water footprint of consumption - total WWF 2008 Living planet report, WWF 2008 1997-2001 138 14 inverse gigameters cubed/year; total amount of water that is used to produce the goods and services consumed by the inhabitants of the nation
85 Water footprint of consumption - internal WWF 2008
Living planet report, WWF 2008 1997-2001 138 14 inverse water footprint from domestic supply
86 Water footprint of consumption - external WWF 2008
Living planet report, WWF 2008 1997-2001 138 14 inverse water footprint from imported water
87 Water footprint of production - Green water WWF 2008
Living planet report, WWF 2008 1997-2001 138 14 inverse volume of rainwater stored in the soil that evaporates from crop fields

# Name of the variable Source of data Original source Reference year N N of
island states
Interpretation Explanation
88 Water footprint of production - Blue water WWF 2008 Living planet report, WWF 2008
1997-2001 138 14 inverse volume of freshwater withdrawn from water bodies that is used and not returned
89 Water footprint of production - Return flows WWF 2008 Living planet report, WWF 2008
1997-2001 138 14 inverse volume of water polluted as a result of the production process
90 Stress on blue water resources from production WWF 2008 Living planet report, WWF 2008
1997-2001 138 14 inverse Ratio of total production water footprint minus the green component to total renewable water resources available in a country.
91 Ecological footprint per capita ESI 2005 Redefining Progress Ecological Footprint of Nations 2004 MRYA 1999-2000 145 10 inverse
hectares of biologically productive land required per capita Anthropogenic pressure
92 Percentage of total land area (including inland waters) having very low anthropogenic impact ESI 2005 The Human Influence Index, CIESIN 2004 222 39 direct measures anthropogenic impact on land and inland waters
based on human land uses, human access from roads, railways or major rivers, electrical infrastructure, and population density
93 Percentage of total land area (including inland waters) having very high anthropogenic impact ESI 2005 The Human Influence Index, CIESIN 2004 222 39 inverse Some repeat of above?
94 Spills EVI2004 ITOPF 2002, CRED 2000 1996-2000 150 36 inverse
number of spills greater than 1000 liters between 1996-2000; captures the risk to marine, estuarine, riverine, lake, ground water, and terrestrial ecosystems from spills of hydrocarbons and other toxic fluids.
95 Mining EVI2004 USGS - US Geological Survey 1996-2000 233 39 inverse average total mining production from 1996-2000 in tons/square kilometers/year; captures the risk to terrestrial, aquatic ecosystems, and ground waters from the effects of ecosystem disturbance, accidents, oil spills and toxic leachates, and processing from mining of all kinds.
Environmental regulation 96 Number of environmental agreements total ENTRI ENTRI 2008 202 39 direct Number of environmental agreements signed
97 Participation in international environmental agreements ESI 2005 9 major environmental treaties considered 2004 230 40 direct
Score between 0 and 1 with 0 corresponding to no participation and 1 equal to full participation; combines ratifications of treaties and conventions with the level of active participation in, contribution to, and compliance with the treaties' obligations; comprises nine major environmental treaties including Kyoto protocol, CITES, UNCCD
98 Number of memberships in environmental intergovernmental organizations ESI 2005 Yearbook of International Organizations 2003-2004 230 40 direct number of memberships in environmental intergovernmental
organizations
99 Pesticide regulation (proximity to target) EPI 2012 232 40 direct legislative status of countries on the Stockholm Convention on POPs usage, and also the degree to which the country has followed through on the objectives of the conventions by limiting or outlawing the use of certain toxic chemicals
100 World Economic Forum Survey on environmental governance ESI 2005 World Economic Forum (WEF) Survey, The
Global Competitiveness Report 2003-2004 102 12 direct survey questions addressing several aspects of environmental governance
101 Local Agenda 21 initiatives per million people ESI 2005 International Council for Local Environmental Initiatives, WDI 2001 112 13 direct
number of Local Agenda 21 initiatives per million people
102 Percentage of variables missing from the CGSDI "Rio to Joburg Dashboard" ESI 2005 Consultative Group on Sustainable
Development Indicators 2002 159 17 inverse percentage; the greater the number of missing variables, the poorer the data availability in that country; environmental monitoring and data systems are vital for tracking progress towards environmental sustainability

# Name of the variable Source of data Original source Reference year N N of
island states
Interpretation Explanation
103 IUCN member organizations per million population ESI 2005 IUCN-The World Conservation Union IUCN memberships: 2004, Population: 2003 207 37 direct
number of member organizations per million people;
104 Participation in the Responsible Care Program of the Chemical Manufacturer's Association ESI 2005 International Council of Chemical
Associations 2002 230 40 direct score 1-4; participation in the Responsible Care Program of the Chemical Manufacturer's Association; responsible handling of chemicals is important for environmental sustainability
105 Number of ISO 14001 certified companies per billion dollars GDP (PPP) ESI 2005
For ISO14001/EMAS registered companies: Reinhard Peglau, c/o Federal
Environmental Agency, Germany, For GDP (PPP) data: World Bank World Development Indicators 2004
ISO14001: 2003, GDP: MRYA 1998-2002 222 38 direct number of ISO 14001 certified companies per billion dollars
GDP (PPP)
Other
106 World Economic Forum Survey on private sector environmental innovation ESI 2005 World Economic Forum 2003, 2004 102 12 direct survey questions on private sector environmental innovation,
which contributes to developing solutions to environmental problems
107 Contribution to international and bilateral funding of environmental projects and development aid ESI 2005
Global Environmental Facility (GEF) contributions and receipts and Organisation for Economic Co-operation and Development (OECD) bilateral environmental aid; For ancillary economic data (GNI, PPP, USD current income): World Bank, World Development Indicators 2004; For population data: CIA World Factbook
2004 178 35 direct score, 0-100


![CWS ParadiseLine. · 3 ] Paradise Dry Slim 4 ] Paradise Paperroll 5 ] Paradise Paper Slim 6 ] Paradise Foam Universal* 7 ] Paradise Foam NT 8 ] Paradise Cream Universal* 9 ] Paradise](https://static.cupdf.com/doc/110x72/5ec6aefefa78e972cd305fc1/cws-3-paradise-dry-slim-4-paradise-paperroll-5-paradise-paper-slim-6-paradise.jpg)


![CWS ParadiseLine. Exklusive Waschraumgestaltung. · 2019-03-15 · 10 ] Paradise Antibact Slim 11 ] Paradise Disinfect 12 ] Paradise Air Bar 13 ] Paradise Seatcleaner 14 ] Paradise](https://static.cupdf.com/doc/110x72/5fb4caf7abd6f51d5367cf9d/cws-paradiseline-exklusive-2019-03-15-10-paradise-antibact-slim-11-paradise.jpg)


![CWS ParadiseLine. · 2019-04-02 · 12 ] Paradise Air Bar 13 ] Paradise Seatcleaner 14 ] Paradise Toiletpaper 15 ] Paradise Superroll 16 ] Paradise Paper Bin 17 ] Paradise Ladycare](https://static.cupdf.com/doc/110x72/5f4d115eb47f9811753b5af9/cws-2019-04-02-12-paradise-air-bar-13-paradise-seatcleaner-14-paradise.jpg)