New Zealand Population
Focus Question
population change over time including: population totals, age-sex structure, natural increase
population sustainability: capacity of the environment to support a population in the longer term.
population diversity: composition of the population including ethnicity, age, sex
population distribution: how and why population is spread across the landscape
migration and mobility of a population including both external and internal migration trends
Census
Class – Reading pg 139-142Copy in Census 2006 information pg 141Question pg 142
Population Change
1. Changes related to population size and structure and associated issues.
New Zealand’s population is constantly changing. The most noted change is the fact that since 1956 new Zealand's population has doubled!
Copy in boxes on page 144 – 1956 and 2006. Construct your own choropleth map using
outline map from pg 143
NZ population Change
New Zealand’s population has gone through peaks and troughs but as a nation it has remained a constant growing trend.
The main peak of New Zealand’s growth came during the 1860’s it was 20.7%
What is Population Growth?Discussion what were the main things to
affect NZ’s population since the 1800’s?
Growth Rate
Growth rate: Growth rate is measured using the percentage change in population per year. A negative growth rate i.e. -4% shows that population is decreasing. A positive growth rate i.e. 4% shows that the population is increasing by 4% each year.
Growth rate= Birth rate-death rate+/- migration.
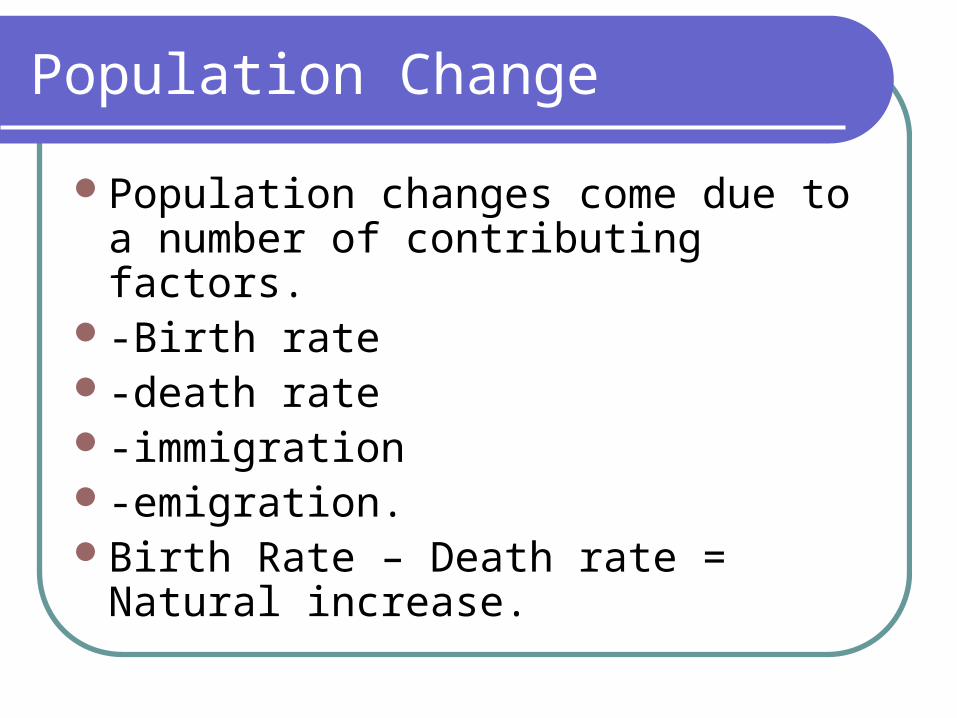
Population Change
Population changes come due to a number of contributing factors.
-Birth rate-death rate-immigration-emigration.Birth Rate – Death rate = Natural
increase.
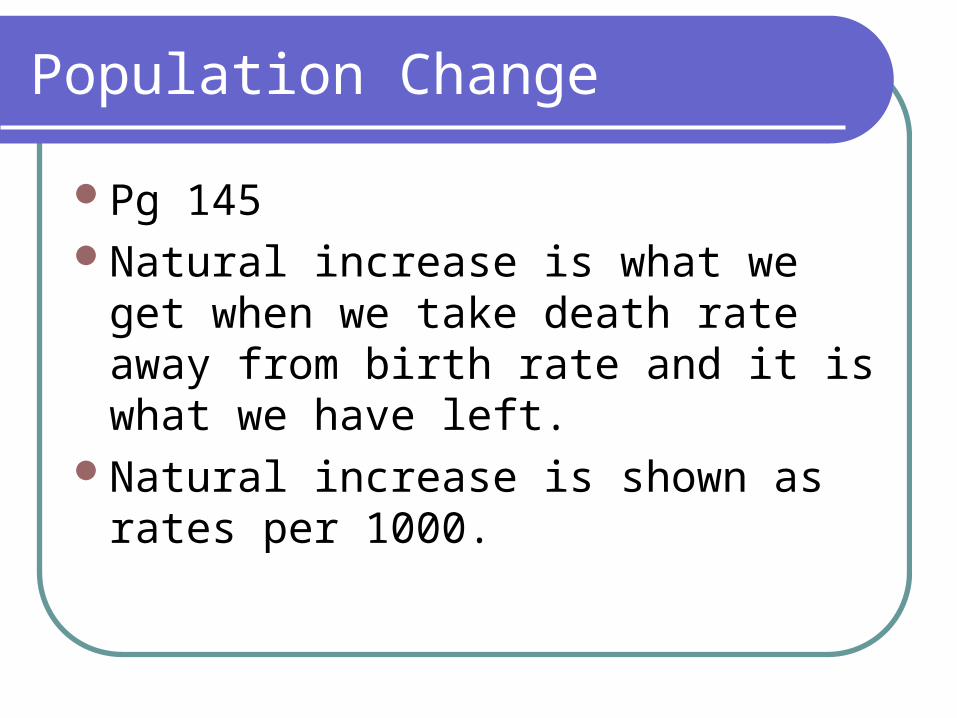
Population Change
Pg 145Natural increase is what we get when we
take death rate away from birth rate and it is what we have left.
Natural increase is shown as rates per 1000.
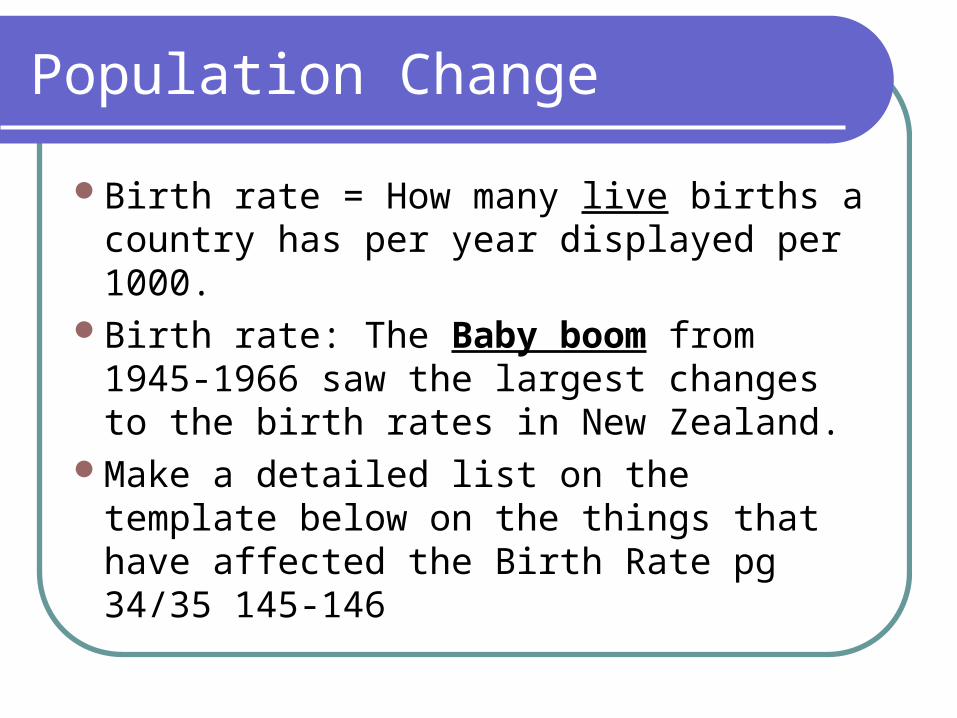
Population Change
Birth rate = How many live births a country has per year displayed per 1000.
Birth rate: The Baby boom from 1945-1966 saw the largest changes to the birth rates in New Zealand.
Make a detailed list on the template below on the things that have affected the Birth Rate pg 34/35 145-146
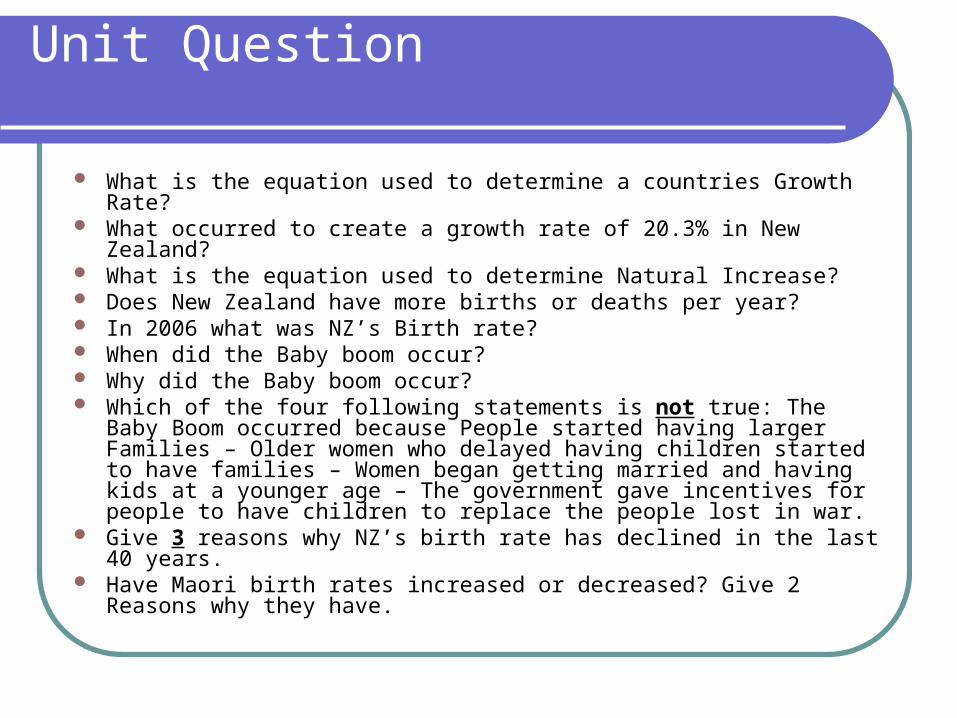
Unit Question
What is the equation used to determine a countries Growth Rate? What occurred to create a growth rate of 20.3% in New Zealand? What is the equation used to determine Natural Increase? Does New Zealand have more births or deaths per year? In 2006 what was NZ’s Birth rate? When did the Baby boom occur? Why did the Baby boom occur? Which of the four following statements is not true: The Baby Boom
occurred because People started having larger Families – Older women who delayed having children started to have families – Women began getting married and having kids at a younger age – The government gave incentives for people to have children to replace the people lost in war.
Give 3 reasons why NZ’s birth rate has declined in the last 40 years. Have Maori birth rates increased or decreased? Give 2 Reasons why
they have.
Death Rate
Death rate = How many deaths there are in a year displayed per 1000.
Death rate: 7.54 deaths/1,000 population. Healthcare: TB, Polio, Typhoid yellow fever vaccines Quick Birthing procedures Accessibility of healthcare International aid Slowly Water quality improvements –cleaning up disease Better crop yields due to farming - Education – Hygeine, Nutrition, agriculture
Death Rate
147 – Graph generalisation and create four bullet points.
Natural Increase Timeline: With indication on what is happening to Natural Increase.
Demographic Transition modelQuestions pg 150
Population Sustainability
Notes on Sustainability = Where pop growth is taking place – Where resource consumption is taking place – What will happen if the population does increase – Technology to aid in development.
Carrying Capacity – Overpopulation –Underpopulation.
Questions.
Population Diversity
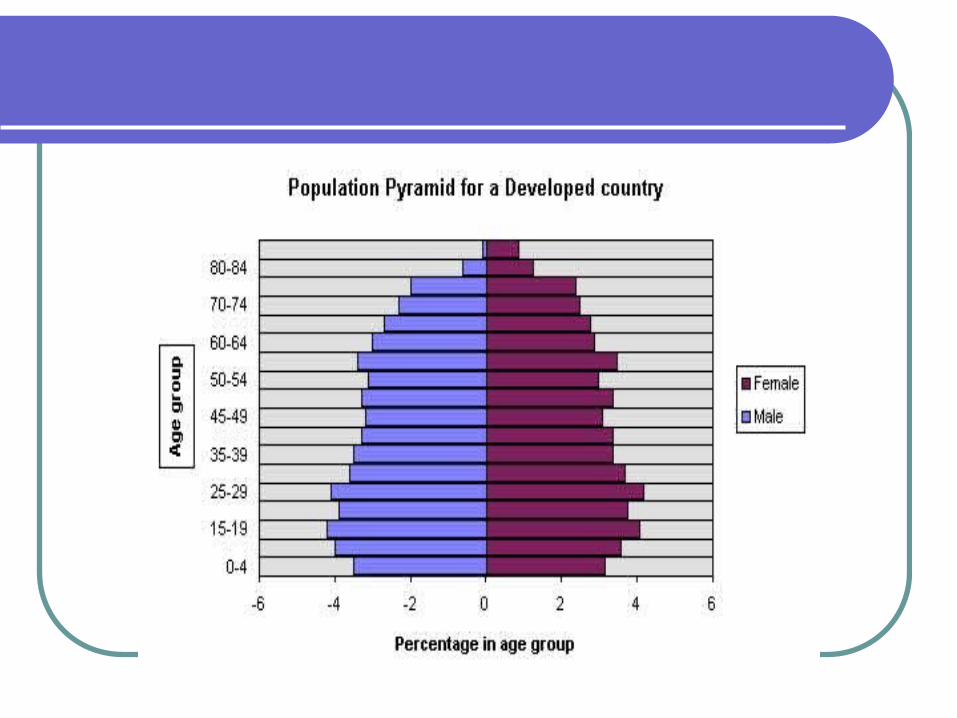
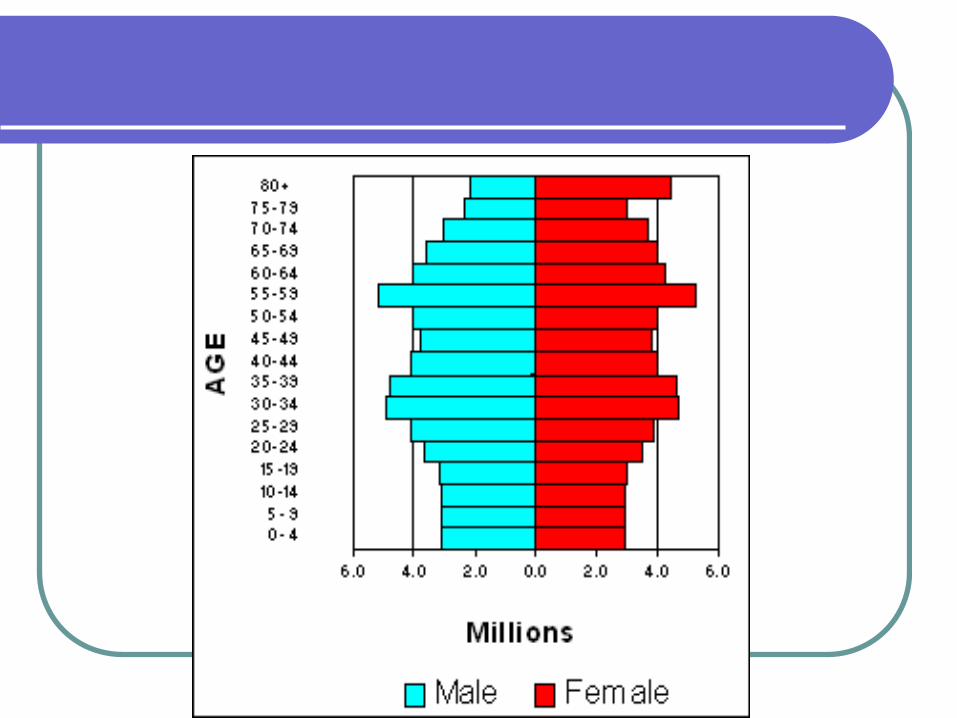
Age- Sex structure: Understanding population Pyramids – What each shaped Pyramid means.
Copy in Pyramids and explain shape.Various Ethnicities in New Zealand.
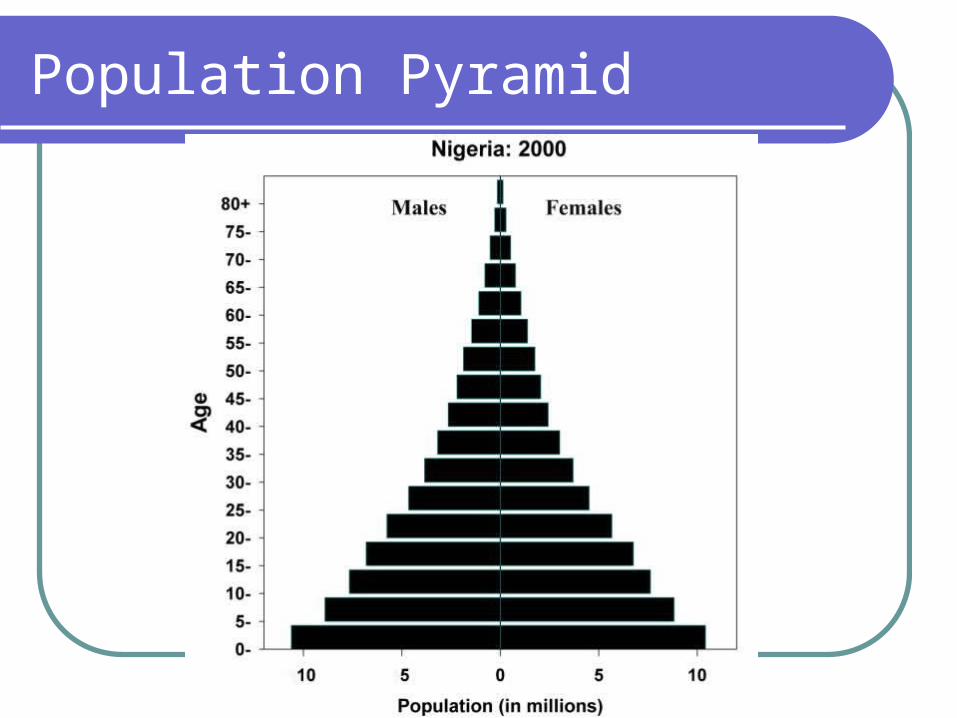
Population Pyramid
Ethnicity and employment
What is Ethnicity?How is NZ’s ethncity changing over
time?What groups make up the % of the
population.What is making the changes to
Employment in New Zealand.
Populations Structure
Notes.Discussion of pyramid shapes and
different reasons for them.
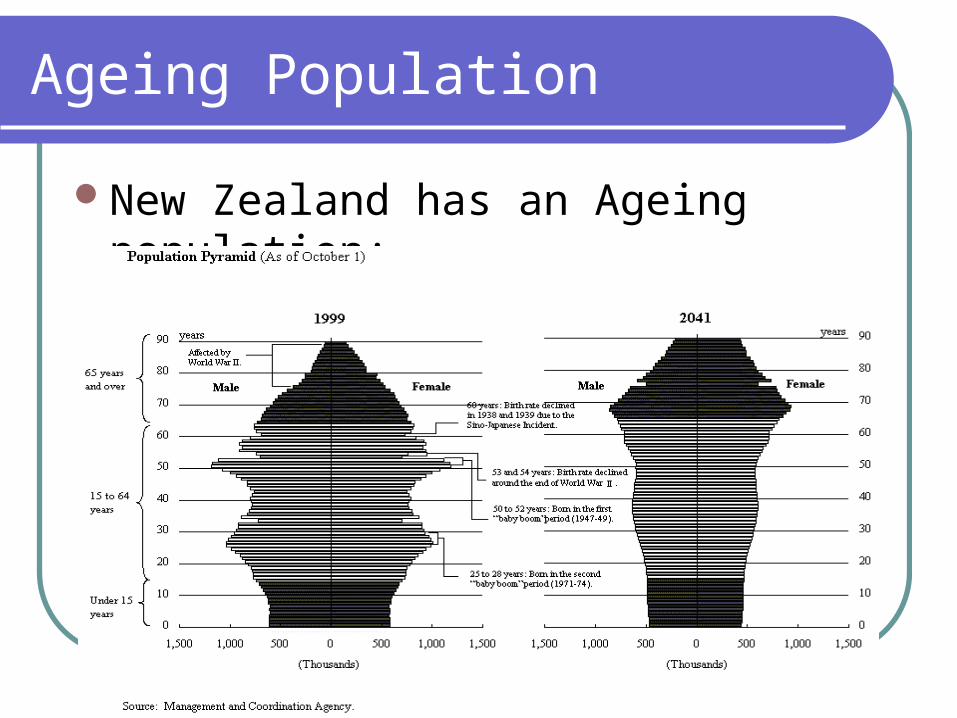
Ageing Population
New Zealand has an Ageing population:
Ageing Population
Ageing populations are when a nation has less people in the 0-14 age group and more in the 65+ age group.
Copy in the paragraph above the graph pg 152 and copy in the graph pg 152.
Reasons for an ageing population
People are living longer: Medical science has improved life expectancy The Baby boomers from 1945-1966 are getting near
retirement. Fewer babies are being born. More women are choosing careers over families.
Meaning they are having babies older. This is because there is a trend for people to become more affluent and establish living conditions before starting a family.
Using fig 19.3: What is the male and female life expectancy in New Zealand?
Issues with ageing population
Ageing populations place pressure on society: Using page 154 write paragraphs or brainstorm the issues associated with an ageing population.
Do the same for the possible solutions.
Population Distribution
New Zealand’s population is unevenly distributed. People generally tend to live in areas where relief and climatic conditions are favourable. Most people live on fertile plains, river deltas, rivers and close to the sea.
Speculate where the population will be using map on w.b
Notes on w.b from page 170
NZ’s increasingly urban pop
Copy in paragraph then explain fig 23.3 Explain fig 23.4 pg 172. NZ’s densely populated areas are influenced
by certain features. Landforms, climate, soil, distance from the sea, minerals.
Use 161+162 to explain how this is influenced. Structured overview print out. Do the same for cultural features.
Migration
Migration is the movement of people from one country or locality to another.
Two types of Migration: Internal = Movement within a country External = Movement across boundaries.
Voluntary migration occurs by choice and is done by people to improve there life.
These movement come down to the influence of push and pull factors.
Create a table of push and pull factors using 21.1 to guide.
Migration
A quarter of New Zealanders internally migrate once in every 2 years.
Copy in bullet points pg 168 Draw in map 168 21.2. Where do people go? NORTH: Since 1900 people have been
moving north. The drift is not sudden but continuous, Auckland and Bay of Plenty are the two quickest growing regions in New Zealand.
Why do we think this is?
NZ MIG
Copy in bullet points pg 169.Rural Urban Drift and Urban to Rural
Drift.Using paragraphs pg 169 make notes on
why people move in these two directions.
People moving away from Auckland