The Indian real estate sector is at crossroads today. The real estate markets across all the major cities have beenstagnant with low transaction activity. The market is saddled with large unsold inventory which at current rateof sales velocity will take more than four years to clear. Amidst this environment, there have been repeated callsfor reduction in the prices of residential assets. Market watchers believe that only rationalization in prices canbreak this logjam and lead to more transaction activity.
But what are the current price levels? And how much room does a developer have to reduce prices? In ourcurrent edition of PropIndex (Jul-Sep 2015), we look at the price trends across major cities. As different budgetsegments have unique demand-supply scenario, we’ve divided the capital value (Rs/sq ft) range in each city intoeight budget segments. The trend analysis has been done on a Q-on-Q basis for a two year period betweenJul-Sep 2013 and Jul-Sep 2015.
Our analysis shows that prices across different budget segments in each city have remained stagnant over theevaluation period. Comparing the cities basis their weighted average price movement over the two year periodshows that except for Pune and Chennai, none of the cities have even managed to get a double digit growth.Even in case of these two cities, the price increment has been 11.8% and 10.8%, respectively. Delhi was theworst performer with a net decline of 14.8%. Big mid-segment real estate markets like Bengaluru and Noidasaw 7.6% and 3.2% price increment. However, when these marginal increments in prices are adjusted forinflation, we find that the net movement in prices is either zero or even negative.
This stagnation in the market is reflected in the Jul-Sep 2015 National PropIndex which remained at the samelevel as the previous quarter. In case of individual cities, Bengaluru again witnessed the maximum appreciationof 4% while Delhi declined further by 5%. Western cities of Pune, Mumbai and Ahmedabad all witnessedpositive movement in their city indices.
Today, the developers understand the requirement of easing acquisition cost for consumers. Towards this end,they have come up with various attractive payment plans like subvention schemes where EMI till possession ispaid by the developer or possession linked payment plans. Apart from this, they are also offering freebies anddiscounts. When the financial saving from these payment plans or freebies/discounts are factored, it translatesinto 5%-15% saving to the consumer. With RBI easing policy rates and attendant reduction in home loan rates,the developer community expects that the combination of lower interest rates and freebies/discounts will getthe fence sitters to take the leap.
Therefore, in short to medium term, we do not expect developers to take the drastic step of upfront reduction incapital values. They are more likely to persist with discount and freebies to pass lower cost to consumers. Anupfront reduction in prices may send strong negative signals and have a domino effect. Consumers may start tohold their purchase decision expecting prices to fall further.
These are changing times and we would love to hear from you. Do write to us at [email protected] share yours views on this report and how we could make PropIndex even better.
FOREWORD
Sudhir PaiCEO, Magicbricks.com

Magicbricks PropIndex
Magicbricks PropIndexis a tool whichempowers propertyseekers and investorswith detailedinformation on themovement of residentialapartment prices andsupply of properties inIndia. No credibleproperty index can be afunction of direct valuesas the changes aregoverned by multiplefactors.
Magicbricks PropIndexhas taken this realityinto account andproduced an index basedon listing of apartmentsand their capital andrental values on thewebsite.
“Magicbricks has over12,00,000 activeproperties posted bymore than 2.5 Lac activeusers in 600+ cities and17,000+ localities. Ourusers include owners,agents and developers.”
Methodology
Apartment values arebased on listings onMagicbricks. Theseinclude multi-storeyapartments and singleunits on plotteddevelopments, referredto as builder floors onMagicbricks.com.
The Index is structuredin such a way thatindividual properties
are aggregated into theirrespective cities andthen to the NationalIndex. Weightages forPropIndex are based onthe supply of propertieswithin the locality/city.Based on this structure,PropIndex gives arealistic picture oftrends in price/supplyacross different propertymarkets in each city. Wehave used differentweightages for ListedPrice Monitor/RentMonitor. Therefore, readas a whole, PropIndexalong with tablesprovided for Listed PriceMonitor, Rent Monitor,Yield Monitor andCapital Values, gives anexcellent perspective ofthe property marketperformance in thequarter.
While listing and itsvalues/supply provide alevel of understandingof the market, there aremeticulous data checksto prevent aberrationscreeping in the Index.These are based onstatistical calculations,industry inputs andlogical interpretations.
The National PropertyIndex (NPI) is indicativeof the extent of activityas well as pricemovements across citiesand localities in themajor cities active onMagicbricks.com. Theindex includes the top11 cities (these have
been chosen based ontheir activity levels) andhas an individual cityreport for each of thesecities. While the NPI andits movements are ofinterest to the expertcommunity of bankers,builders and investors,the PropIndex has alsotaken care to explain thenuances of indexmovements at thelocality level that wouldhelp the huge base ofMagicbricks.comconsumers.
Insights into consumerdemand have beengathered throughanalysis of searchinformation on the site.This helps understandthe best localities bydemand, the type andconfiguration of units aswell as the budget-wisepreferences.
The PropIndex is theresult of meticulousresearch at the localitylevel and throughdetailed discussionswith experts atMagicbricks.com’soffline and onlineinitiatives.
The Indian real estatemarket is dynamic andthe PropIndex reflectsthose changes. Since it isderived from a dynamicdatabase, additions anddeletions of localitieshappen as a function ofmarket dynamics.
METHODOLOGY

There is a wealth of information within these pages. For better readability, we have presented some data as tables and others asgraphs. Between them, you will find how property markets have performed in the Apr-Jun 2015 quarter from differentperspectives – from that of capital appreciation, from a rental/yield realisation perspective and from a supply standpoint. DemandAnalysis section also explains what consumers look for.
We recommend that you evaluate the city report in its entirety and that will provide a rounded perspective of the performance ofthe property market within each city. Here are the details of what you will find in each of the city reports enclosed within:
1. City Property Index – This is a composite index which is a function of supply of properties as well as the average capitalappreciation/drop in various localities of the city in the quarter. The City Index is the weighted average of the average rate persquare foot in that locality and the supply of properties from that locality. Premium localities (with higher average rate persquare foot) as well as localities with higher supply of properties will have a bigger impact on the Index. For example, if thesupply of properties from a premium locality drops, that locality will end up having a lower weightage in the Index which inturn will push the Index downwards (and vice-versa). On the other hand, supply of properties remaining unchanged, theIndex will be influenced by capital appreciation within the locality.
2. Listed Price Monitor – This metric shows the capital appreciation/drop within a locality and is calculated on the basis ofmovement in the “average rate per square foot” within that locality. By and large, the movement in the “average rate persquare foot” reflects capital appreciation/drop. However, in a few select cases, we have observed that the average rate persquare foot moves due to a change in the mix of apartments within that locality (e.g. if the ratio of premium apartments,which command a higher per square foot rate, changes over the quarter). In these few circumstances, the Listed Price Monitorwill, in turn, reflect this input. Such changes have been explained in the text of the City Reports.
3. Rent Monitor – This reflects the rental appreciation/drop within a locality. It is calculated on the basis of movement in the“average rent per square foot” within that locality. By and large, the movement in the “average rent per square foot” reflectsrental appreciation/drop. However, in a few select cases, we have observed that the average rent per square foot moves due toa change in the mix of apartments within that locality (e.g. if the ratio of premium apartments, which command a higher persquare foot rent, changes over the quarter). In these few circumstances, the Rent Monitor will, in turn, reflect this input. Suchchanges have been explained in the text of the City Reports.
4. Yield Meter – Yield is the annual rate of return earned on property. The Yield Meter depicts the gross yield percentagesacross various localities. Gross yield is a ratio of average annual rental value to the average capital value of the property.
5. Capital Value Tables (given in Annexures) – This shows the actual range of prices within which properties were available ineach locality in the quarter. Prices are shown in Rupees per square foot basis, these are the prevailing rates for properties ineach locality.
6. Price Trend Analysis – This analysis of looks at distribution of real estate assets on the basis of capital value (Rs/sq ft). We have grouped the city localities into various budget segments on the basis of their capital values. We then evaluate thehistoric price trend for these budget segments over a two year period from Jul-Sep 2013 - Jul-Sep 2015.
7. Editorial Speak – PropIndex has gone from strength to strength – adding more analytics, insights and diverse views inevery edition. To enhance the insights provided by our data, PropIndex now includes city perspectives from editors of theTimes Property.
GLOSSARY & DEFINITIONS

NOTES
JUL-SEP 2015
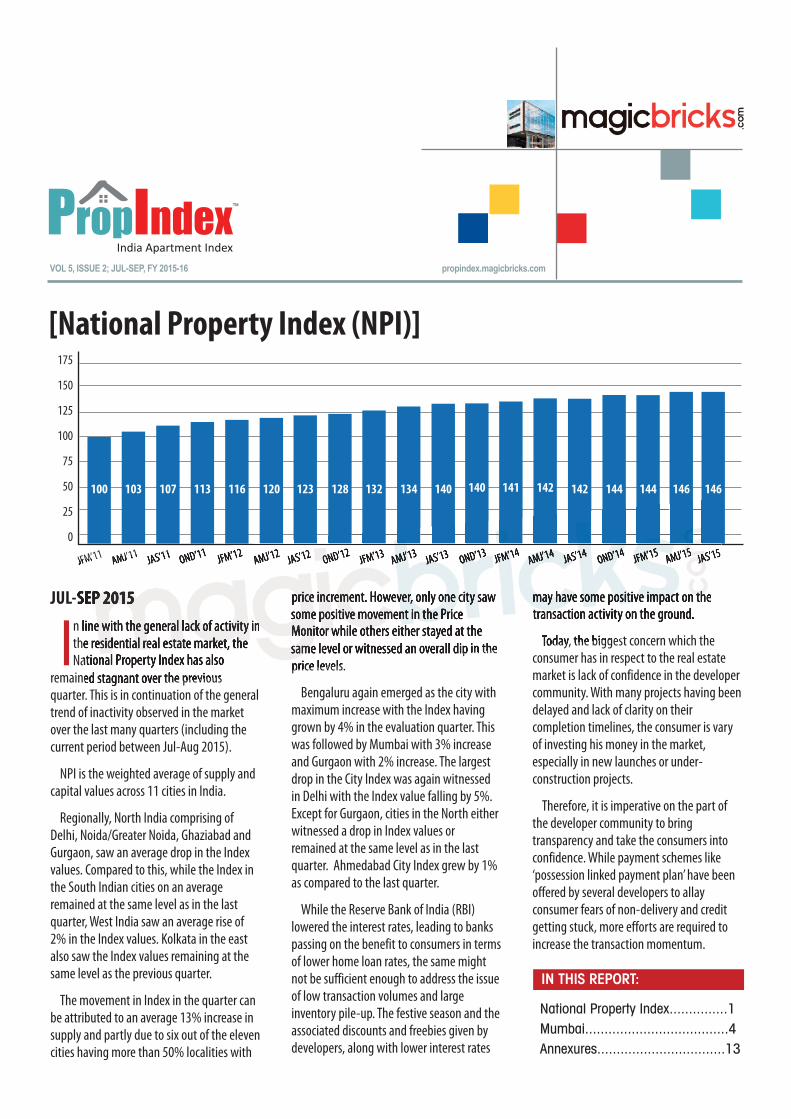
In line with the general lack of activity inthe residential real estate market, theNational Property Index has also
remained stagnant over the previousquarter. This is in continuation of the generaltrend of inactivity observed in the marketover the last many quarters (including thecurrent period between Jul-Aug 2015).
NPI is the weighted average of supply andcapital values across 11 cities in India.
Regionally, North India comprising ofDelhi, Noida/Greater Noida, Ghaziabad andGurgaon, saw an average drop in the Indexvalues. Compared to this, while the Index inthe South Indian cities on an averageremained at the same level as in the lastquarter, West India saw an average rise of2% in the Index values. Kolkata in the eastalso saw the Index values remaining at thesame level as the previous quarter.
The movement in Index in the quarter canbe attributed to an average 13% increase insupply and partly due to six out of the elevencities having more than 50% localities with
price increment. However, only one city sawsome positive movement in the PriceMonitor while others either stayed at thesame level or witnessed an overall dip in theprice levels.
Bengaluru again emerged as the city withmaximum increase with the Index havinggrown by 4% in the evaluation quarter. Thiswas followed by Mumbai with 3% increaseand Gurgaon with 2% increase. The largestdrop in the City Index was again witnessedin Delhi with the Index value falling by 5%.Except for Gurgaon, cities in the North eitherwitnessed a drop in Index values orremained at the same level as in the lastquarter. Ahmedabad City Index grew by 1%as compared to the last quarter.
While the Reserve Bank of India (RBI)lowered the interest rates, leading to bankspassing on the benefit to consumers in termsof lower home loan rates, the same mightnot be sufficient enough to address the issueof low transaction volumes and largeinventory pile-up. The festive season and theassociated discounts and freebies given bydevelopers, along with lower interest rates
may have some positive impact on thetransaction activity on the ground.
Today, the biggest concern which theconsumer has in respect to the real estatemarket is lack of confidence in the developercommunity. With many projects having beendelayed and lack of clarity on theircompletion timelines, the consumer is varyof investing his money in the market,especially in new launches or under-construction projects.
Therefore, it is imperative on the part ofthe developer community to bringtransparency and take the consumers intoconfidence. While payment schemes like‘possession linked payment plan’ have beenoffered by several developers to allayconsumer fears of non-delivery and creditgetting stuck, more efforts are required toincrease the transaction momentum.
IN THIS REPORT:
National Property Index...............1Mumbai.....................................4Annexures.................................13
[National Property Index (NPI)]
VOL 5, ISSUE 2; JUL-SEP, FY 2015-16 propindex.magicbricks.com
175
150
125
100
75
50
25
0
100 103 107 113 116 120 123 128 132 134 140 140 141 142 142 144 144 146
JFM’11 AMJ’11 JAS’11 OND’11 JFM’12 AMJ’12JAS’12 OND’12
JFM’13 AMJ’13JAS’13 OND’13 JFM’14
AMJ’14 JAS’14 OND’14 JFM’15 AMJ’15
146
JAS’15
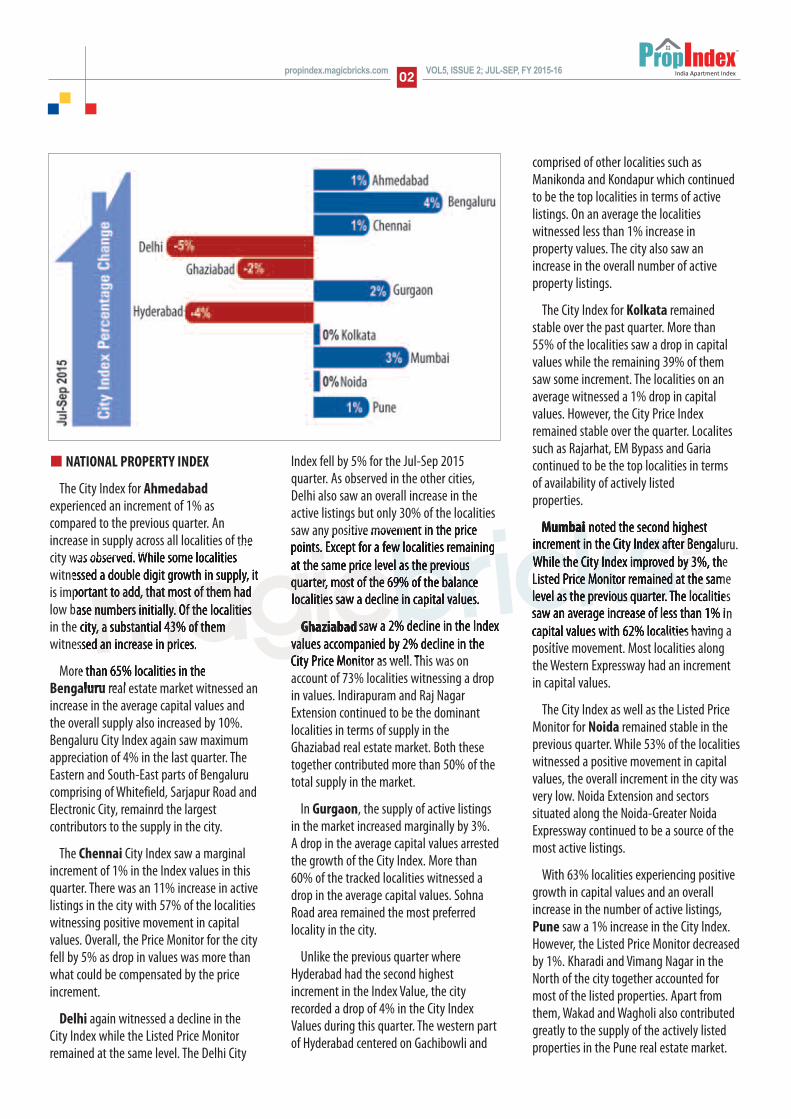
NATIONAL PROPERTY INDEX
The City Index for Ahmedabadexperienced an increment of 1% ascompared to the previous quarter. Anincrease in supply across all localities of thecity was observed. While some localitieswitnessed a double digit growth in supply, itis important to add, that most of them hadlow base numbers initially. Of the localitiesin the city, a substantial 43% of themwitnessed an increase in prices.
More than 65% localities in theBengaluru real estate market witnessed anincrease in the average capital values andthe overall supply also increased by 10%.Bengaluru City Index again saw maximumappreciation of 4% in the last quarter. TheEastern and South-East parts of Bengalurucomprising of Whitefield, Sarjapur Road andElectronic City, remainrd the largestcontributors to the supply in the city.
The Chennai City Index saw a marginalincrement of 1% in the Index values in thisquarter. There was an 11% increase in activelistings in the city with 57% of the localitieswitnessing positive movement in capitalvalues. Overall, the Price Monitor for the cityfell by 5% as drop in values was more thanwhat could be compensated by the priceincrement.
Delhi again witnessed a decline in theCity Index while the Listed Price Monitorremained at the same level. The Delhi City
Index fell by 5% for the Jul-Sep 2015quarter. As observed in the other cities,Delhi also saw an overall increase in theactive listings but only 30% of the localitiessaw any positive movement in the pricepoints. Except for a few localities remainingat the same price level as the previousquarter, most of the 69% of the balancelocalities saw a decline in capital values.
Ghaziabad saw a 2% decline in the Indexvalues accompanied by 2% decline in theCity Price Monitor as well. This was onaccount of 73% localities witnessing a dropin values. Indirapuram and Raj NagarExtension continued to be the dominantlocalities in terms of supply in theGhaziabad real estate market. Both thesetogether contributed more than 50% of thetotal supply in the market.
In Gurgaon, the supply of active listingsin the market increased marginally by 3%. A drop in the average capital values arrestedthe growth of the City Index. More than60% of the tracked localities witnessed adrop in the average capital values. SohnaRoad area remained the most preferredlocality in the city.
Unlike the previous quarter whereHyderabad had the second highestincrement in the Index Value, the cityrecorded a drop of 4% in the City IndexValues during this quarter. The western partof Hyderabad centered on Gachibowli and
comprised of other localities such asManikonda and Kondapur which continuedto be the top localities in terms of activelistings. On an average the localitieswitnessed less than 1% increase in property values. The city also saw anincrease in the overall number of activeproperty listings.
The City Index for Kolkata remainedstable over the past quarter. More than 55% of the localities saw a drop in capitalvalues while the remaining 39% of themsaw some increment. The localities on anaverage witnessed a 1% drop in capitalvalues. However, the City Price Indexremained stable over the quarter. Localitessuch as Rajarhat, EM Bypass and Gariacontinued to be the top localities in terms of availability of actively listed properties.
Mumbai noted the second highestincrement in the City Index after Bengaluru.While the City Index improved by 3%, theListed Price Monitor remained at the samelevel as the previous quarter. The localitiessaw an average increase of less than 1% incapital values with 62% localities having apositive movement. Most localities alongthe Western Expressway had an increment in capital values.
The City Index as well as the Listed PriceMonitor for Noida remained stable in theprevious quarter. While 53% of the localitieswitnessed a positive movement in capitalvalues, the overall increment in the city wasvery low. Noida Extension and sectorssituated along the Noida-Greater NoidaExpressway continued to be a source of themost active listings.
With 63% localities experiencing positivegrowth in capital values and an overallincrease in the number of active listings,Pune saw a 1% increase in the City Index.However, the Listed Price Monitor decreasedby 1%. Kharadi and Vimang Nagar in theNorth of the city together accounted formost of the listed properties. Apart fromthem, Wakad and Wagholi also contributedgreatly to the supply of the actively listedproperties in the Pune real estate market.
02VOL5, ISSUE 2; JUL-SEP, FY 2015-16propindex.magicbricks.com
-1%

INDIAN REAL ESTATE MARKET –FUTURE SCENARIO
The Indian real estate market has beenstagnant in terms of transaction and capitalvalue of real estate assets. The number of newproject launches has tapered drastically inmost cities compared to the earlier years. Withsmall exceptions, sale of units has fallenfurther from the decline of the previous year.
The fall in unit sales over the last few yearshas translated into a large inventory of unsoldstock. By one estimate, the total number ofunsold inventory exceeds 700,000 units andthe market will require more than four years toclear this. One of the main reasons for the fall
in new project launches is the level of unsoldinventory in the market.
Consequent to this logjam , the prices havealso remained stagnant over the last couple ofyears. To understand the price trends,Magicbricks analyzed the weighted averageprice for 11 cities in the PropIndex.
The weighted average price for a city takesinto account the average price of its localitiesand the weights assigned to each is the supply
in that locality. The analysis has been done fora two year period from Jul-Sep 2013 to Jul-Sep2015. For ease of comparison, cities have beendivided into segments having weightedaverage price greater than Rs 6,000 per sq ftand with prices lower than Rs 6,000 per sq ft.
As the graphs shows, the prices in the citieshave either seen very low rise or outright drop.In case of the four cities with weightedaverage price greater than Rs 6,000 per sq ft,Pune with 11.8% increase is the only city withany visible price movement.
Mumbai and Delhi have seen a drop invalues. In fact, Delhi witnessed the largestdrop amongst all cities. Gurgaon also remained
stagnant with negligent growth. Even in caseof Pune, when inflation is taken into account,the price increase is nullified.
In case of the other seven cities with aweighted average of less than Rs 6,000 per sqft, the story repeats itself. With 10.8% increaseduring the evaluation period, Chennai saw thehighest increment. With the exception ofGhaziabad, other cities also saw a marginalprice increase. The prices in Ghaziabad cityactually dropped by 6.6%.
Given the high inventory level and low salesvolume, the market needs to correct the prices.Our analysis shows the prices have beenstagnant for over two years now. When this isindexed to inflation, the values have dropped.
Short of announcing a cut in prices,developers have used innovative schemes tolower the acquisition cost. These vary fromattractive payment schemes to giving freebieslike modular kitchen and other white goods tooffering discounts or waiver on charges like carparking, club house etc. The developers arealso ready to offer up to 25% discount on thetotal cost in case it is a one time payment.
The impact of the schemes is such that priceshave already come down by 10%-20%. This isdemonstrated with an example. Let’s assume a1400 sq ft property costs Rs 60 lakh, Rs 4,286per sq ft in capital values. This comes with asubvention scheme where the developer paysthe EMI on the loan amount during theconstruction period. The EMI is transferred tothe consumer on possession. Assuming a loanamount of Rs 48 lakh (80% of the unit value),interest rate of 9.5% and a loan tenure of 25years, the EMI is Rs 41,937 per month.
The developer pays this EMI for theconstruction period of 24 months. The totalamount paid is slightly more than Rs 10 lakh.Simply put, the actual cost to the buyer is Rs 50 lakh, translating into a rate of Rs 3,567per sq ft, a discount of almost 17%.
Developers are expecting that freebies andattractive payment plans combined with therecent drop in home loan rates will help inreviving sales. Therefore, in short to mediumterms, developers are unlikely to have anyincentive in dropping the prices upfront.
03VOL5, ISSUE 2; JUL-SEP, FY 2015-16 propindex.magicbricks.com
Mumbai to have India's tallest 130-storey commercialbuilding at Port Trust land to monetise the asset andease the space crunch in the city
Mumbai has the highest unsold housing inventory inthe country and more than 2/3rd of this unsoldinventory is priced over Rs 1 crore, a report says
A recent report has placed Mumbai at second spotamong top 20 global cities, which offers the highestrental yield for office space
State government’s new IT/ITeS policy is expected tocreate demand for commercial spaces and IT campusesin Navi Mumbai and Pune
Environmental clearances crucialfor projects above 20,000 sq m.Developers not happy, reports say
For high-rises taller than 50 m,NOC from the Airports Authority of India is now mandatory
In a landmark decision, housingsocieties to get deemed conveyancecertificates in 6 months of application
State govt sanctions Rs 35,400 crorefor the development of 118-kmMumbai Metro network
MUMBAI 04VOL5, ISSUE 2; JUL-SEP, FY 2015-16propindex.magicbricks.com
MUMBAI REAL ESTATE IN PERSPECTIVE Q2 2015
As it happenedMUMBAI
HOT NOT
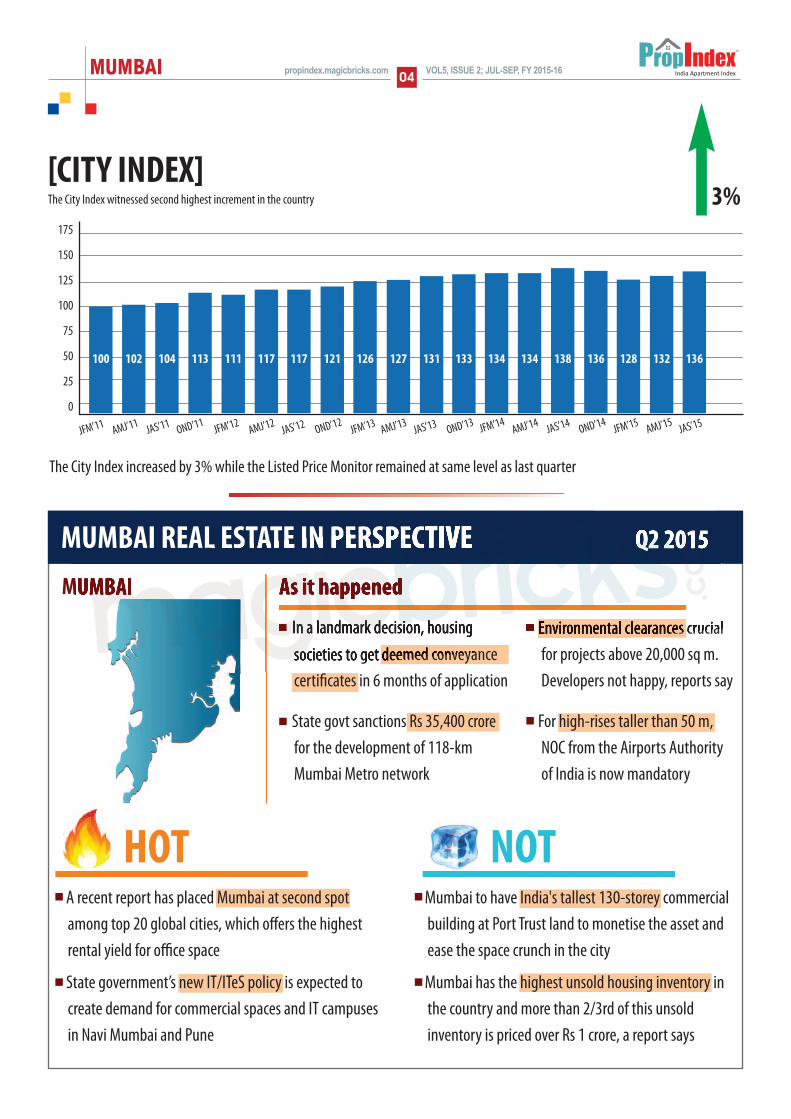
The City Index increased by 3% while the Listed Price Monitor remained at same level as last quarter
[CITY INDEX]The City Index witnessed second highest increment in the country
175
150
125
100
75
50
25
0
100 102 104 113 111 117 117 121 126 127 131 133 134 134 138 136 128 132
JFM’11 AMJ’11 JAS’11 OND’11 JFM’12 AMJ’12JAS’12 OND’12
JFM’13 AMJ’13JAS’13 OND’13 JFM’14
AMJ’14 JAS’14 OND’14 JFM’15 AMJ’15
3%
136
JAS’15
MUMBAI05VOL5, ISSUE 2; JUL-SEP, FY 2015-16 propindex.magicbricks.com
[PROPINDEX - MUMBAI]The City Index witnessed the second highest gain in cities for Jul-Sep 2015 quarter. There is an overallincrease in the average capital values for 62% of localities across the city. But the Listed Price Monitorstayed at the same level as last quarter
l Mumbai has ‘the’ costliest residential realestate in India and caters to allsocioeconomic classes. This report definesthe Mumbai market as areasencompassing the whole of MumbaiMetropolitan Region – including the citiesof Mumbai, Thane and Navi Mumbai
l On a national affordability basis, Mumbaireal estate market is mostly premium,with properties under Rs 6,000 per sq ftforming only 16% of the total market.
l On the other hand, following the neo-affordable definition of affordability forthe city, around 35% of the properties inthe market are available for under
Rs 1 crore. Most of the locations under thissegment are physically located in Thaneand Navi Mumbai areas
l The ongoing slowdown of the real estatemarket has had a lasting effect on thesupply of the city. A significantrestructuring was witnessed among theresidential properties available in varioussegments. As a result, the Rs 4,000-8,000per sq ft has increased its market share bya whole 10% of the total supply in the cityto reach the level of 35%
l The biggest loser in the currentrestructuring has been the Rs 14,000-24,000 per sq ft segment, which has lost
more than 11% of the city’s market share,tumbling to 27% of the total supply in thecity this quarter
l The other two price brackets of ‘the Rs 8,000 -14,000 per sq ft’ and the ‘aboveRs 24,000 per sq ft’ largely remainedunchanged during the quarter
l On an overall basis, the real estate markethas shed just 0.8% of its price in the lasttwp years. The current weighted average price of the city stands at Rs 14,325 per sq ft. On an individual basis,the prices of various budget segmentshave witnessed huge variations in therange of 1 to 14%
[Key Takeaways]
With the Modi govt completing ayear in June 2015, expectationswere riding high. The real estate
sector being one of the biggest contributors tothe overall GDP, was one of the frontrunnerstowards realising those expectations. Thecabinet provided a 6.5% interest subsidy forthe tenure of 15 years to EWS and LIG, thusproviding them with financial aid to buyaffordable homes.
The Union Cabinet also approved thescheme of the NDA govt i.e. ‘Housing for All by2022’. With positive announcements, there wasanother good news - the final environmentalclearance to the Navi Mumbai Airport. Anothermajor infrastructural breakthrough came whenthe MMRDA announced the construction of anelevated road connecting BKC to the EasternExpress Highway. The Bureau of IndianStandards (BIS) also released a detailed andrevised publication for ‘Recommendations for
Earthquake-resistant design structures’ in Julyso developers adhere to safety standardsduring construction.
RBI kept the repo rate and reverse repo rateunchanged in August at 7.50% and 6.5%,respectively. To bring transparency in the landrecords, the govt is working on a pilot study,linking transactions data and sales data withthe GIS maps in Mumbai and Thane, controllingthe Ready Reckoner Rates.
Come September, the govt announced thelist of 98 cities for the ‘Smart Cities Initiative’.The industry was also reeling under unsoldinventory. Hence, the RBI governor askeddevelopers to slash prices to drive the realtymarket and cut the unsold stock.
The Municipal Corporation of GreaterMumbai initiated steps to reduce the timetaken for getting the necessary permissions forstarting construction. Going forward, Thane
realty also got a boost with the announcementof an additional FSI of 0.33 for construction. Aprogressive feat was when, in order tomaintain the environmental balance and boosturban planning, the National Green Tribunal(NGT) issued a judgment wherein, it was mademandatory for developers to get environmentclearance for projects above 20,000 sq mts.
Another major announcement was madeby the Maharashtra govt wherein the newIT/ITeS Policy 2015 was announced, to boostthe realty market of Navi Mumbai. With thefestive season slated to begin, the RBI governorgave developers and potential home-buyers areason to cheer by cutting the repo rate by 50basis points with the repo rate at 6.75%.
Therefore, the previous quarter witnessedits fair share of ups and downs. But the lessonslearnt will pave the way forward for a brighterand a more buoyant future.
A realty case study
Viren Naidu, Editor, Times Property (Mumbai)
EDITORIAL
MUMBAI 06VOL5, ISSUE 2; JUL-SEP, FY 2015-16propindex.magicbricks.com
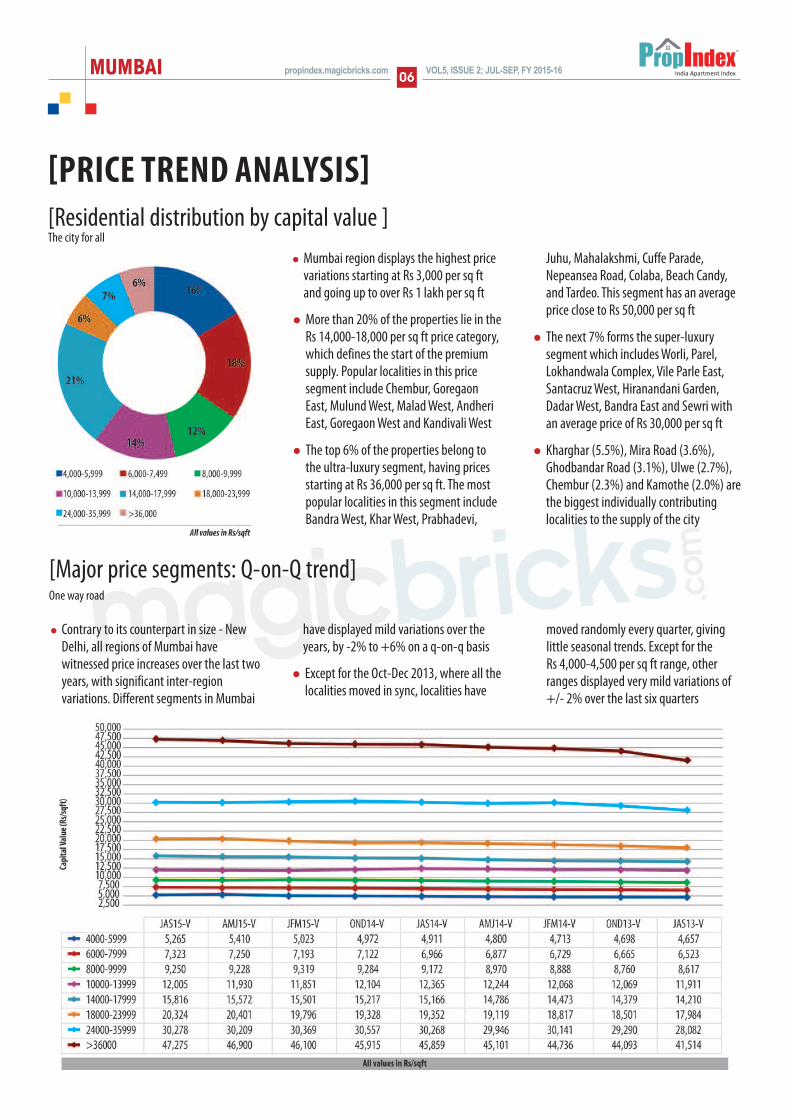
[Residential distribution by capital value ]
[PRICE TREND ANALYSIS]
[Major price segments: Q-on-Q trend]
l Mumbai region displays the highest pricevariations starting at Rs 3,000 per sq ftand going up to over Rs 1 lakh per sq ft
l More than 20% of the properties lie in theRs 14,000-18,000 per sq ft price category,which defines the start of the premiumsupply. Popular localities in this pricesegment include Chembur, GoregaonEast, Mulund West, Malad West, AndheriEast, Goregaon West and Kandivali West
l The top 6% of the properties belong tothe ultra-luxury segment, having pricesstarting at Rs 36,000 per sq ft. The mostpopular localities in this segment includeBandra West, Khar West, Prabhadevi,
Juhu, Mahalakshmi, Cuffe Parade,Nepeansea Road, Colaba, Beach Candy,and Tardeo. This segment has an averageprice close to Rs 50,000 per sq ft
l The next 7% forms the super-luxurysegment which includes Worli, Parel,Lokhandwala Complex, Vile Parle East,Santacruz West, Hiranandani Garden,Dadar West, Bandra East and Sewri withan average price of Rs 30,000 per sq ft
l Kharghar (5.5%), Mira Road (3.6%),Ghodbandar Road (3.1%), Ulwe (2.7%),Chembur (2.3%) and Kamothe (2.0%) arethe biggest individually contributinglocalities to the supply of the city
l Contrary to its counterpart in size - NewDelhi, all regions of Mumbai havewitnessed price increases over the last twoyears, with significant inter-regionvariations. Different segments in Mumbai
have displayed mild variations over theyears, by -2% to +6% on a q-on-q basis
l Except for the Oct-Dec 2013, where all thelocalities moved in sync, localities have
moved randomly every quarter, givinglittle seasonal trends. Except for the Rs 4,000-4,500 per sq ft range, otherranges displayed very mild variations of+/- 2% over the last six quarters
The city for all
One way road
MUMBAI07VOL5, ISSUE 2; JUL-SEP, FY 2015-16 propindex.magicbricks.com
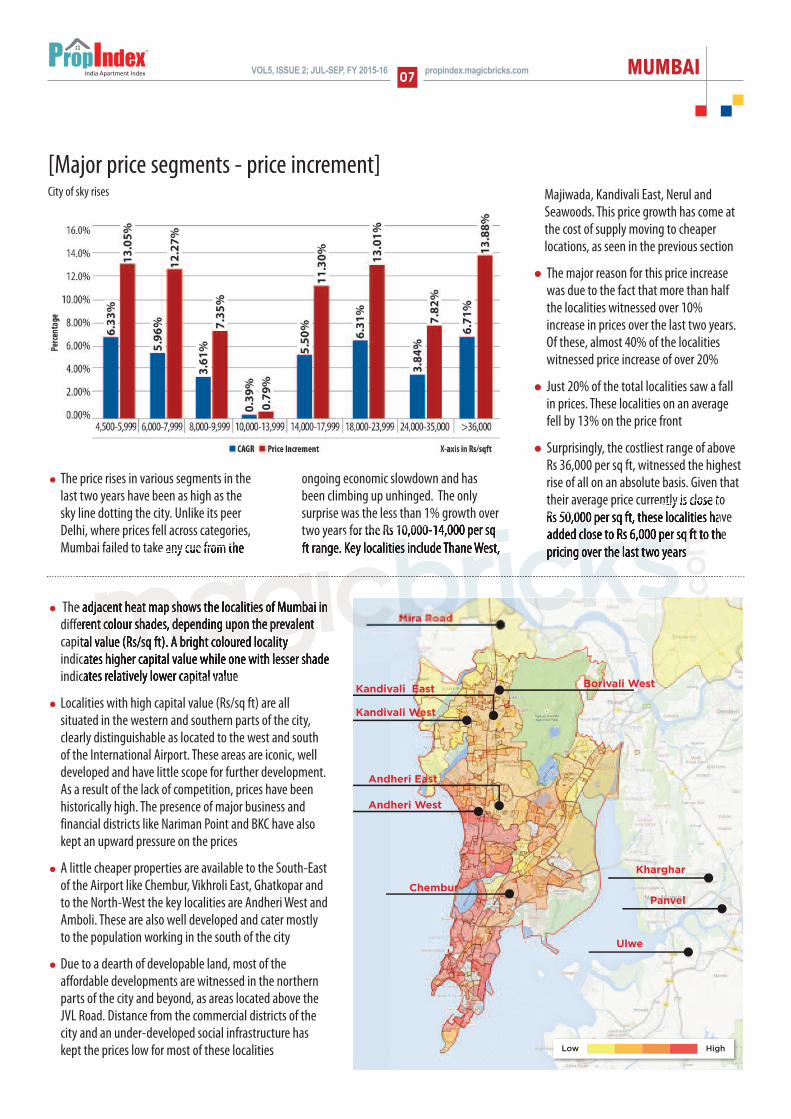
l The adjacent heat map shows the localities of Mumbai indifferent colour shades, depending upon the prevalentcapital value (Rs/sq ft). A bright coloured localityindicates higher capital value while one with lesser shadeindicates relatively lower capital value
l Localities with high capital value (Rs/sq ft) are allsituated in the western and southern parts of the city,clearly distinguishable as located to the west and southof the International Airport. These areas are iconic, welldeveloped and have little scope for further development.As a result of the lack of competition, prices have beenhistorically high. The presence of major business andfinancial districts like Nariman Point and BKC have alsokept an upward pressure on the prices
l A little cheaper properties are available to the South-Eastof the Airport like Chembur, Vikhroli East, Ghatkopar andto the North-West the key localities are Andheri West andAmboli. These are also well developed and cater mostlyto the population working in the south of the city
l Due to a dearth of developable land, most of theaffordable developments are witnessed in the northernparts of the city and beyond, as areas located above theJVL Road. Distance from the commercial districts of thecity and an under-developed social infrastructure haskept the prices low for most of these localities
Majiwada, Kandivali East, Nerul andSeawoods. This price growth has come atthe cost of supply moving to cheaperlocations, as seen in the previous section
l The major reason for this price increasewas due to the fact that more than halfthe localities witnessed over 10%increase in prices over the last two years.Of these, almost 40% of the localitieswitnessed price increase of over 20%
l Just 20% of the total localities saw a fallin prices. These localities on an averagefell by 13% on the price front
l Surprisingly, the costliest range of aboveRs 36,000 per sq ft, witnessed the highestrise of all on an absolute basis. Given thattheir average price currently is close to Rs 50,000 per sq ft, these localities haveadded close to Rs 6,000 per sq ft to thepricing over the last two years
l The price rises in various segments in thelast two years have been as high as thesky line dotting the city. Unlike its peerDelhi, where prices fell across categories,Mumbai failed to take any cue from the
ongoing economic slowdown and hasbeen climbing up unhinged. The onlysurprise was the less than 1% growth overtwo years for the Rs 10,000-14,000 per sqft range. Key localities include Thane West,
City of sky rises
[Major price segments - price increment]
MUMBAI 08VOL5, ISSUE 2; JUL-SEP, FY 2015-16propindex.magicbricks.com
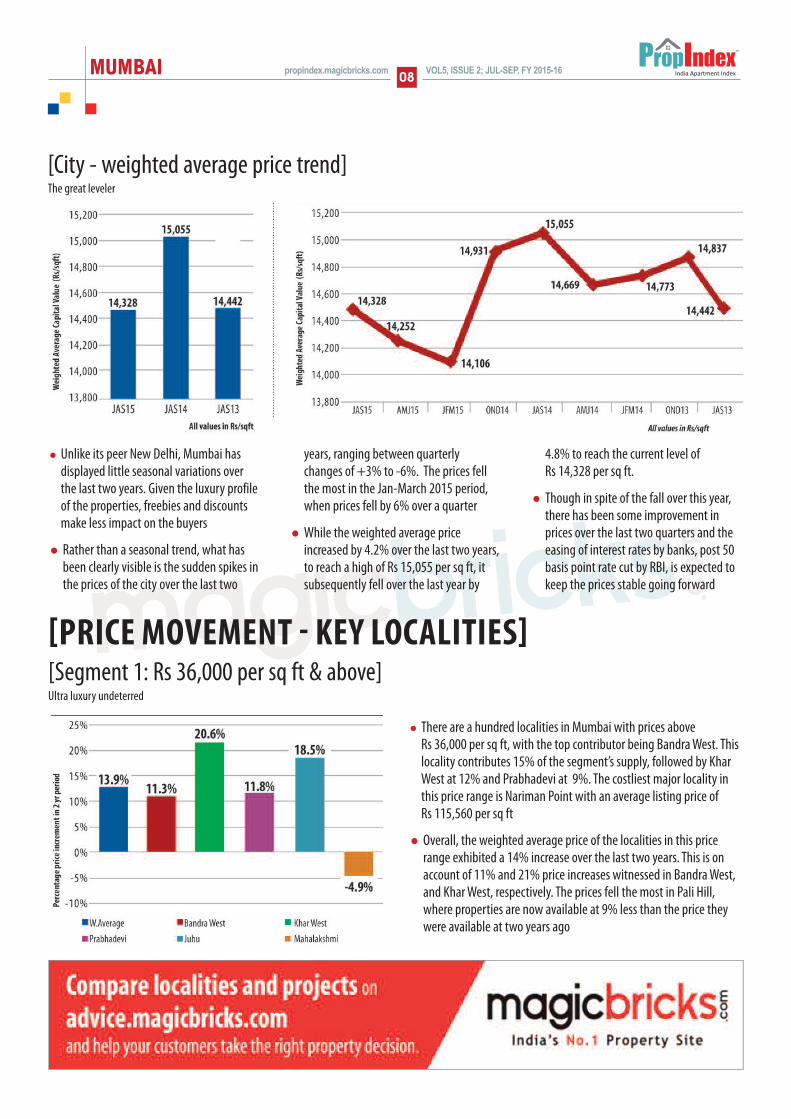
[City - weighted average price trend]
l Unlike its peer New Delhi, Mumbai hasdisplayed little seasonal variations overthe last two years. Given the luxury profileof the properties, freebies and discountsmake less impact on the buyers
l Rather than a seasonal trend, what hasbeen clearly visible is the sudden spikes inthe prices of the city over the last two
years, ranging between quarterlychanges of +3% to -6%. The prices fellthe most in the Jan-March 2015 period,when prices fell by 6% over a quarter
l While the weighted average priceincreased by 4.2% over the last two years,to reach a high of Rs 15,055 per sq ft, itsubsequently fell over the last year by
4.8% to reach the current level of Rs 14,328 per sq ft.
l Though in spite of the fall over this year,there has been some improvement inprices over the last two quarters and theeasing of interest rates by banks, post 50basis point rate cut by RBI, is expected tokeep the prices stable going forward
The great leveler
l There are a hundred localities in Mumbai with prices above Rs 36,000 per sq ft, with the top contributor being Bandra West. Thislocality contributes 15% of the segment’s supply, followed by KharWest at 12% and Prabhadevi at 9%. The costliest major locality inthis price range is Nariman Point with an average listing price of Rs 115,560 per sq ft
l Overall, the weighted average price of the localities in this pricerange exhibited a 14% increase over the last two years. This is onaccount of 11% and 21% price increases witnessed in Bandra West,and Khar West, respectively. The prices fell the most in Pali Hill,where properties are now available at 9% less than the price theywere available at two years ago
[Segment 1: Rs 36,000 per sq ft & above]Ultra luxury undeterred
[PRICE MOVEMENT - KEY LOCALITIES]
MUMBAI09VOL5, ISSUE 2; JUL-SEP, FY 2015-16 propindex.magicbricks.com
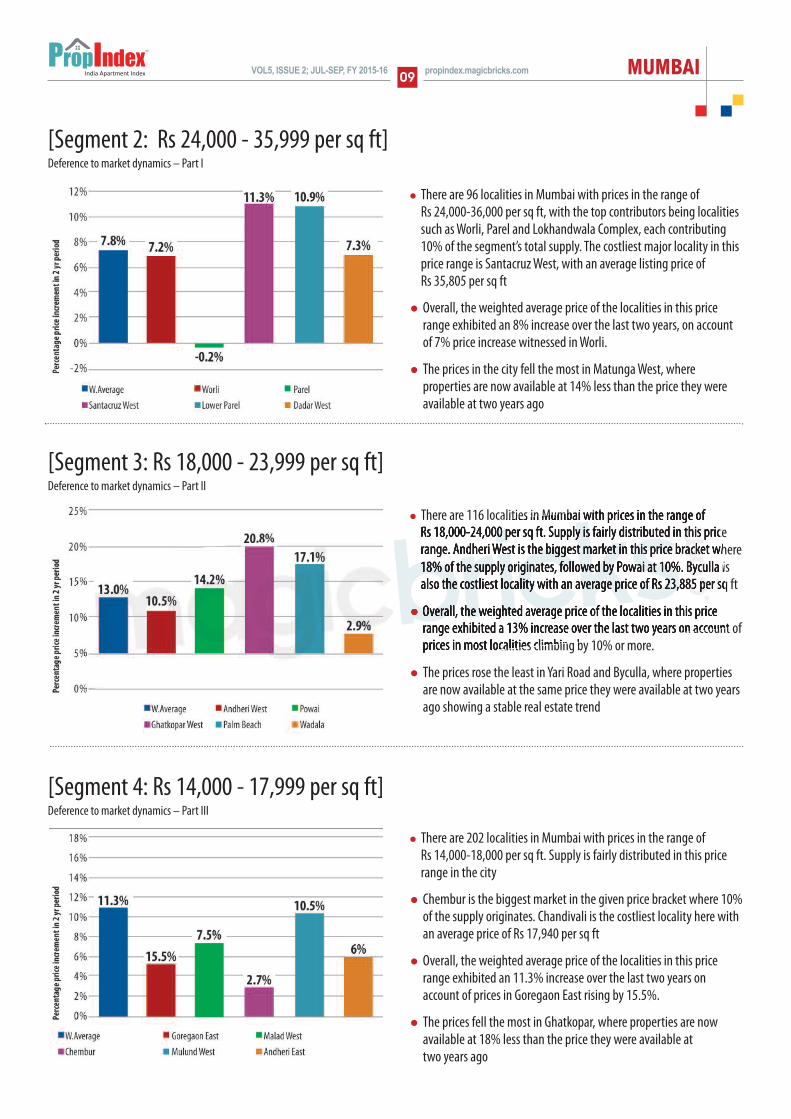
l There are 96 localities in Mumbai with prices in the range of Rs 24,000-36,000 per sq ft, with the top contributors being localitiessuch as Worli, Parel and Lokhandwala Complex, each contributing10% of the segment’s total supply. The costliest major locality in thisprice range is Santacruz West, with an average listing price of Rs 35,805 per sq ft
l Overall, the weighted average price of the localities in this pricerange exhibited an 8% increase over the last two years, on accountof 7% price increase witnessed in Worli.
l The prices in the city fell the most in Matunga West, whereproperties are now available at 14% less than the price they wereavailable at two years ago
[Segment 2: Rs 24,000 - 35,999 per sq ft]Deference to market dynamics – Part I
l There are 202 localities in Mumbai with prices in the range of Rs 14,000-18,000 per sq ft. Supply is fairly distributed in this pricerange in the city
l Chembur is the biggest market in the given price bracket where 10%of the supply originates. Chandivali is the costliest locality here withan average price of Rs 17,940 per sq ft
l Overall, the weighted average price of the localities in this pricerange exhibited an 11.3% increase over the last two years onaccount of prices in Goregaon East rising by 15.5%.
l The prices fell the most in Ghatkopar, where properties are nowavailable at 18% less than the price they were available at two years ago
[Segment 4: Rs 14,000 - 17,999 per sq ft]Deference to market dynamics – Part III
l There are 116 localities in Mumbai with prices in the range of Rs 18,000-24,000 per sq ft. Supply is fairly distributed in this pricerange. Andheri West is the biggest market in this price bracket where18% of the supply originates, followed by Powai at 10%. Byculla isalso the costliest locality with an average price of Rs 23,885 per sq ft
l Overall, the weighted average price of the localities in this pricerange exhibited a 13% increase over the last two years on account ofprices in most localities climbing by 10% or more.
l The prices rose the least in Yari Road and Byculla, where propertiesare now available at the same price they were available at two yearsago showing a stable real estate trend
[Segment 3: Rs 18,000 - 23,999 per sq ft]Deference to market dynamics – Part II
MUMBAI 10VOL5, ISSUE 2; JUL-SEP, FY 2015-16propindex.magicbricks.com
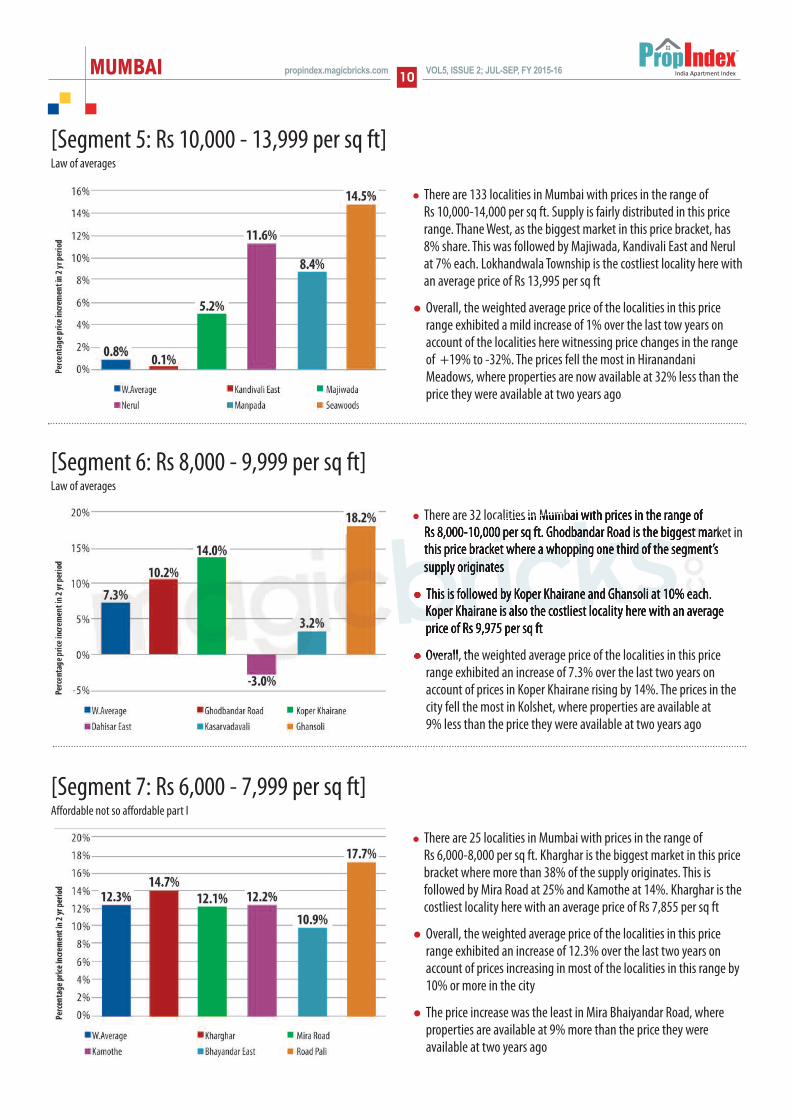
l There are 133 localities in Mumbai with prices in the range of Rs 10,000-14,000 per sq ft. Supply is fairly distributed in this pricerange. Thane West, as the biggest market in this price bracket, has8% share. This was followed by Majiwada, Kandivali East and Nerulat 7% each. Lokhandwala Township is the costliest locality here withan average price of Rs 13,995 per sq ft
l Overall, the weighted average price of the localities in this pricerange exhibited a mild increase of 1% over the last tow years onaccount of the localities here witnessing price changes in the rangeof +19% to -32%. The prices fell the most in HiranandaniMeadows, where properties are now available at 32% less than theprice they were available at two years ago
[Segment 5: Rs 10,000 - 13,999 per sq ft]Law of averages
l There are 25 localities in Mumbai with prices in the range of Rs 6,000-8,000 per sq ft. Kharghar is the biggest market in this pricebracket where more than 38% of the supply originates. This isfollowed by Mira Road at 25% and Kamothe at 14%. Kharghar is thecostliest locality here with an average price of Rs 7,855 per sq ft
l Overall, the weighted average price of the localities in this pricerange exhibited an increase of 12.3% over the last two years onaccount of prices increasing in most of the localities in this range by10% or more in the city
l The price increase was the least in Mira Bhaiyandar Road, whereproperties are available at 9% more than the price they wereavailable at two years ago
[Segment 7: Rs 6,000 - 7,999 per sq ft]Affordable not so affordable part I
l There are 32 localities in Mumbai with prices in the range of Rs 8,000-10,000 per sq ft. Ghodbandar Road is the biggest market inthis price bracket where a whopping one third of the segment’ssupply originates
l This is followed by Koper Khairane and Ghansoli at 10% each. Koper Khairane is also the costliest locality here with an averageprice of Rs 9,975 per sq ft
l Overall, the weighted average price of the localities in this pricerange exhibited an increase of 7.3% over the last two years onaccount of prices in Koper Khairane rising by 14%. The prices in thecity fell the most in Kolshet, where properties are available at 9% less than the price they were available at two years ago
[Segment 6: Rs 8,000 - 9,999 per sq ft]Law of averages
MUMBAI11VOL5, ISSUE 2; JUL-SEP, FY 2015-16 propindex.magicbricks.com
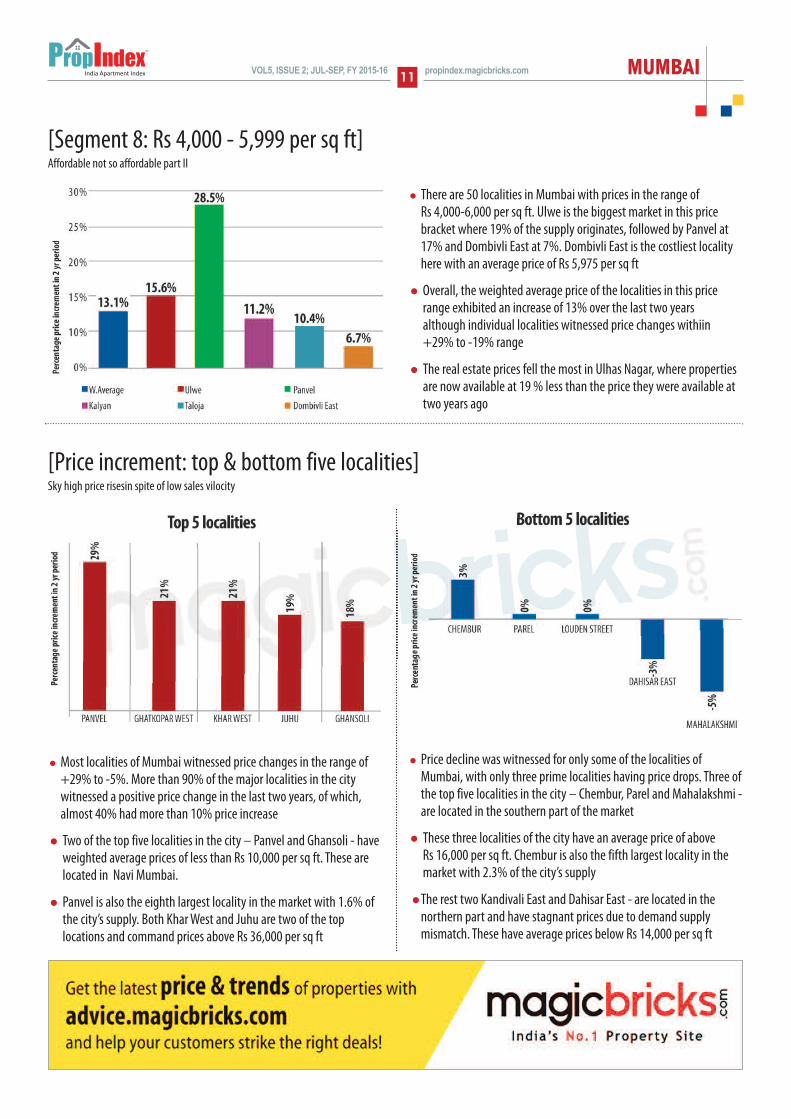
[Price increment: top & bottom five localities]Sky high price risesin spite of low sales vilocity
l Most localities of Mumbai witnessed price changes in the range of+29% to -5%. More than 90% of the major localities in the citywitnessed a positive price change in the last two years, of which,almost 40% had more than 10% price increase
l Two of the top five localities in the city – Panvel and Ghansoli - haveweighted average prices of less than Rs 10,000 per sq ft. These arelocated in Navi Mumbai.
l Panvel is also the eighth largest locality in the market with 1.6% ofthe city’s supply. Both Khar West and Juhu are two of the toplocations and command prices above Rs 36,000 per sq ft
l Price decline was witnessed for only some of the localities ofMumbai, with only three prime localities having price drops. Three ofthe top five localities in the city – Chembur, Parel and Mahalakshmi -are located in the southern part of the market
l These three localities of the city have an average price of above Rs 16,000 per sq ft. Chembur is also the fifth largest locality in themarket with 2.3% of the city’s supply
lThe rest two Kandivali East and Dahisar East - are located in thenorthern part and have stagnant prices due to demand supplymismatch. These have average prices below Rs 14,000 per sq ft
l There are 50 localities in Mumbai with prices in the range of Rs 4,000-6,000 per sq ft. Ulwe is the biggest market in this pricebracket where 19% of the supply originates, followed by Panvel at17% and Dombivli East at 7%. Dombivli East is the costliest localityhere with an average price of Rs 5,975 per sq ft
l Overall, the weighted average price of the localities in this pricerange exhibited an increase of 13% over the last two years although individual localities witnessed price changes withiin+29% to -19% range
l The real estate prices fell the most in Ulhas Nagar, where propertiesare now available at 19 % less than the price they were available attwo years ago
[Segment 8: Rs 4,000 - 5,999 per sq ft]Affordable not so affordable part II
MUMBAI 12VOL5, ISSUE 2; JUL-SEP, FY 2015-16propindex.magicbricks.com
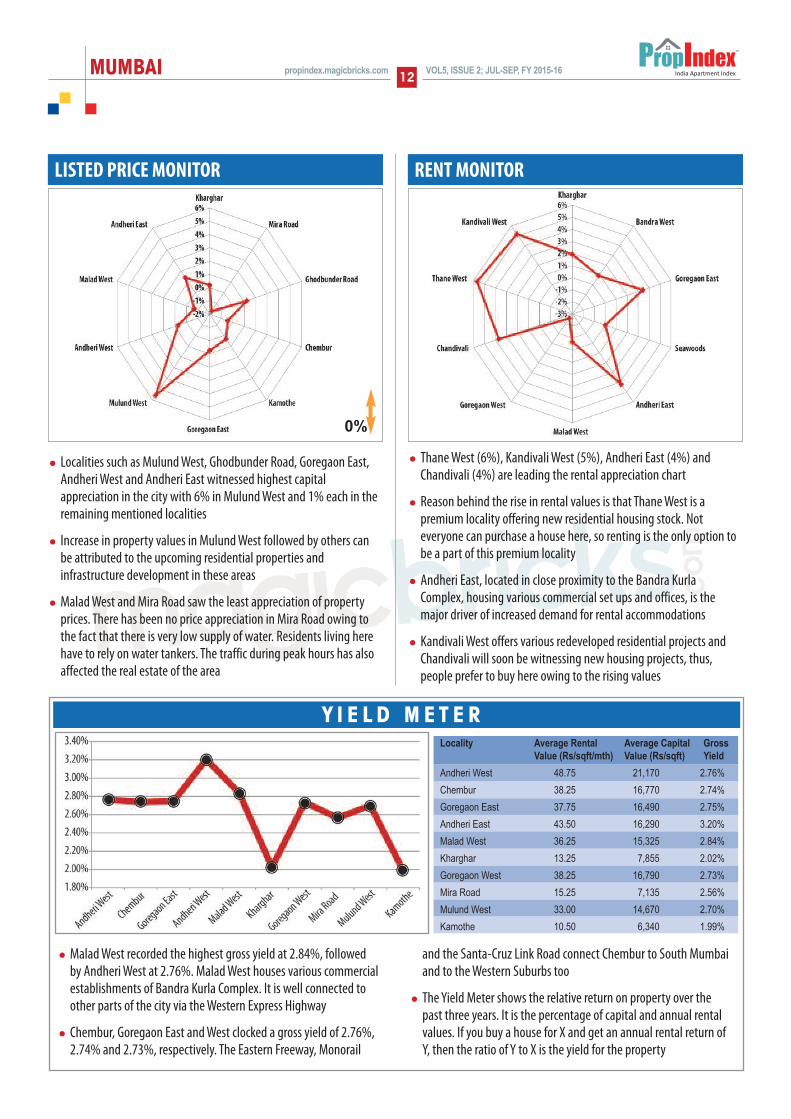
l Localities such as Mulund West, Ghodbunder Road, Goregaon East,Andheri West and Andheri East witnessed highest capitalappreciation in the city with 6% in Mulund West and 1% each in theremaining mentioned localities
l Increase in property values in Mulund West followed by others canbe attributed to the upcoming residential properties andinfrastructure development in these areas
l Malad West and Mira Road saw the least appreciation of propertyprices. There has been no price appreciation in Mira Road owing tothe fact that there is very low supply of water. Residents living herehave to rely on water tankers. The traffic during peak hours has alsoaffected the real estate of the area
LISTED PRICE MONITOR
Locality Average Rental Average Capital Gross Value (Rs/sqft/mth) Value (Rs/sqft) Yield
Andheri West 48.75 21,170 2.76%Chembur 38.25 16,770 2.74%Goregaon East 37.75 16,490 2.75%Andheri East 43.50 16,290 3.20%Malad West 36.25 15,325 2.84%Kharghar 13.25 7,855 2.02%Goregaon West 38.25 16,790 2.73%Mira Road 15.25 7,135 2.56%Mulund West 33.00 14,670 2.70%Kamothe 10.50 6,340 1.99%
Y I E L D M E T E R
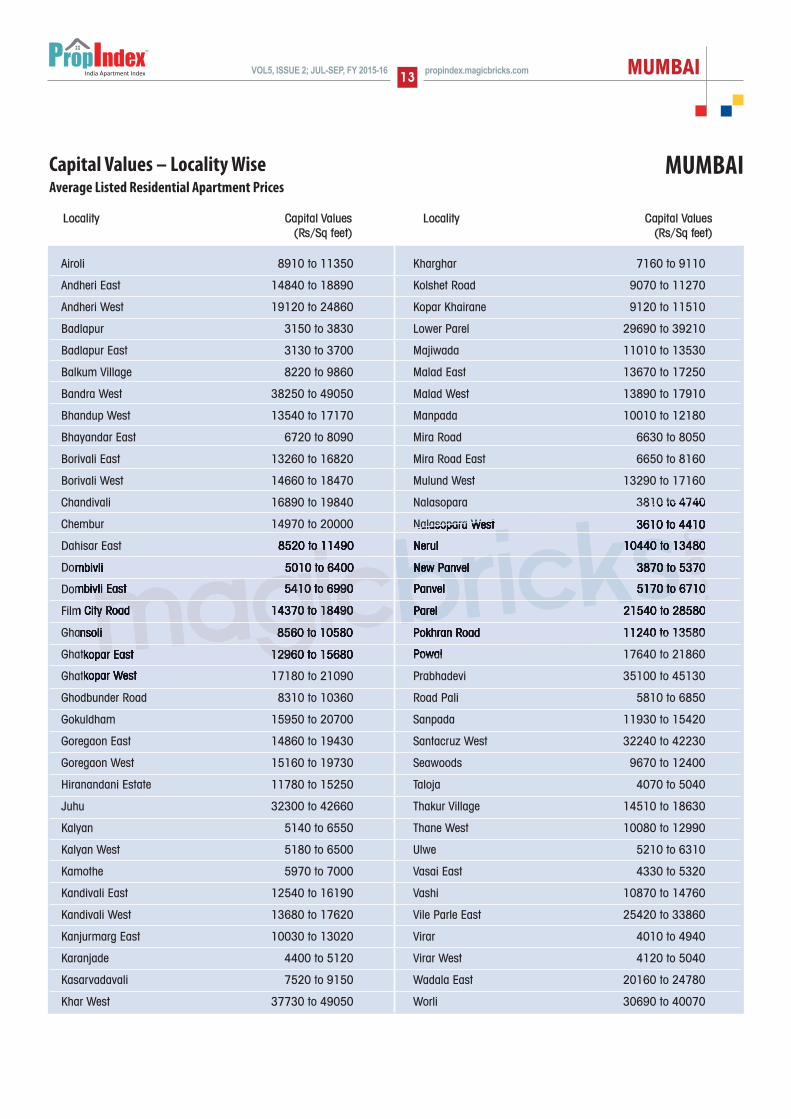
RENT MONITOR
l Thane West (6%), Kandivali West (5%), Andheri East (4%) andChandivali (4%) are leading the rental appreciation chart
l Reason behind the rise in rental values is that Thane West is apremium locality offering new residential housing stock. Noteveryone can purchase a house here, so renting is the only option tobe a part of this premium locality
l Andheri East, located in close proximity to the Bandra KurlaComplex, housing various commercial set ups and offices, is themajor driver of increased demand for rental accommodations
l Kandivali West offers various redeveloped residential projects andChandivali will soon be witnessing new housing projects, thus,people prefer to buy here owing to the rising values
0%
l Malad West recorded the highest gross yield at 2.84%, followedby Andheri West at 2.76%. Malad West houses various commercialestablishments of Bandra Kurla Complex. It is well connected toother parts of the city via the Western Express Highway
l Chembur, Goregaon East and West clocked a gross yield of 2.76%,2.74% and 2.73%, respectively. The Eastern Freeway, Monorail
and the Santa-Cruz Link Road connect Chembur to South Mumbaiand to the Western Suburbs too
l The Yield Meter shows the relative return on property over thepast three years. It is the percentage of capital and annual rentalvalues. If you buy a house for X and get an annual rental return ofY, then the ratio of Y to X is the yield for the property
Airoli 8910 to 11350
Andheri East 14840 to 18890
Andheri West 19120 to 24860
Badlapur 3150 to 3830
Badlapur East 3130 to 3700
Balkum Village 8220 to 9860
Bandra West 38250 to 49050
Bhandup West 13540 to 17170
Bhayandar East 6720 to 8090
Borivali East 13260 to 16820
Borivali West 14660 to 18470
Chandivali 16890 to 19840
Chembur 14970 to 20000
Dahisar East 8520 to 11490
Dombivli 5010 to 6400
Dombivli East 5410 to 6990
Film City Road 14370 to 18490
Ghansoli 8560 to 10580
Ghatkopar East 12960 to 15680
Ghatkopar West 17180 to 21090
Ghodbunder Road 8310 to 10360
Gokuldham 15950 to 20700
Goregaon East 14860 to 19430
Goregaon West 15160 to 19730
Hiranandani Estate 11780 to 15250
Juhu 32300 to 42660
Kalyan 5140 to 6550
Kalyan West 5180 to 6500
Kamothe 5970 to 7000
Kandivali East 12540 to 16190
Kandivali West 13680 to 17620
Kanjurmarg East 10030 to 13020
Karanjade 4400 to 5120
Kasarvadavali 7520 to 9150
Khar West 37730 to 49050
Kharghar 7160 to 9110
Kolshet Road 9070 to 11270
Kopar Khairane 9120 to 11510
Lower Parel 29690 to 39210
Majiwada 11010 to 13530
Malad East 13670 to 17250
Malad West 13890 to 17910
Manpada 10010 to 12180
Mira Road 6630 to 8050
Mira Road East 6650 to 8160
Mulund West 13290 to 17160
Nalasopara 3810 to 4740
Nalasopara West 3610 to 4410
Nerul 10440 to 13480
New Panvel 3870 to 5370
Panvel 5170 to 6710
Parel 21540 to 28580
Pokhran Road 11240 to 13580
Powai 17640 to 21860
Prabhadevi 35100 to 45130
Road Pali 5810 to 6850
Sanpada 11930 to 15420
Santacruz West 32240 to 42230
Seawoods 9670 to 12400
Taloja 4070 to 5040
Thakur Village 14510 to 18630
Thane West 10080 to 12990
Ulwe 5210 to 6310
Vasai East 4330 to 5320
Vashi 10870 to 14760
Vile Parle East 25420 to 33860
Virar 4010 to 4940
Virar West 4120 to 5040
Wadala East 20160 to 24780
Worli 30690 to 40070
MUMBAI13VOL5, ISSUE 2; JUL-SEP, FY 2015-16 propindex.magicbricks.com
Capital Values – Locality WiseAverage Listed Residential Apartment Prices
Locality Capital Values (Rs/Sq feet)
Locality Capital Values (Rs/Sq feet)
MUMBAI


NOTES


VOL5, ISSUE 2; JUL-SEP, FY 2015-16propindex.magicbricks.com
D I S C L A I M E R
Every effort has been made to make this Index as complete and as accurate as possible. MagicBricks accepts no responsibility for inaccuracies inthe information/data contained in this book. It shall have neither liability nor responsibility to any person or entity with respect to any loss ordamage caused, or alleged to have been caused, directly or indirectly, by the information contained in this book. The information/data in this
book is subject to change from time to time due to market condition.
CONTACT USl Post your feedback to -
propindex @timesgroup.com
l Join our discussion forum at -openhouse.magicbricks.com
l For business enquiries - [email protected]
l You may also share your opinion with #PropIndex onour Twitter handle @magicbricks or connect with us onFacebook at www.facebook.com/magicbricksTOI
PROPINDEX TEAM
l Content & Research: E Jayashree Kurup, Dipti Tandon, Subodh Kumar, Rohit Vats, Bhawna Mongia, Devendra Lohmor,Namrata Ekka, Preeti Sharma, Renu Arya, Pushpa Rawat, Surbhi Gupta, Namrata Hazarika,Puneet Kukreja & Bikash Kumar
l Layout Design:Harsha Khattar