
2
IDFC : Investor Presentation (H1FY2014)
October 31, 2013

3
1. Snapshot
2. Balance Sheet & Financials
3. Concentration and product analysis
4. Borrowings
5. Shareholding
6. Highlights
4
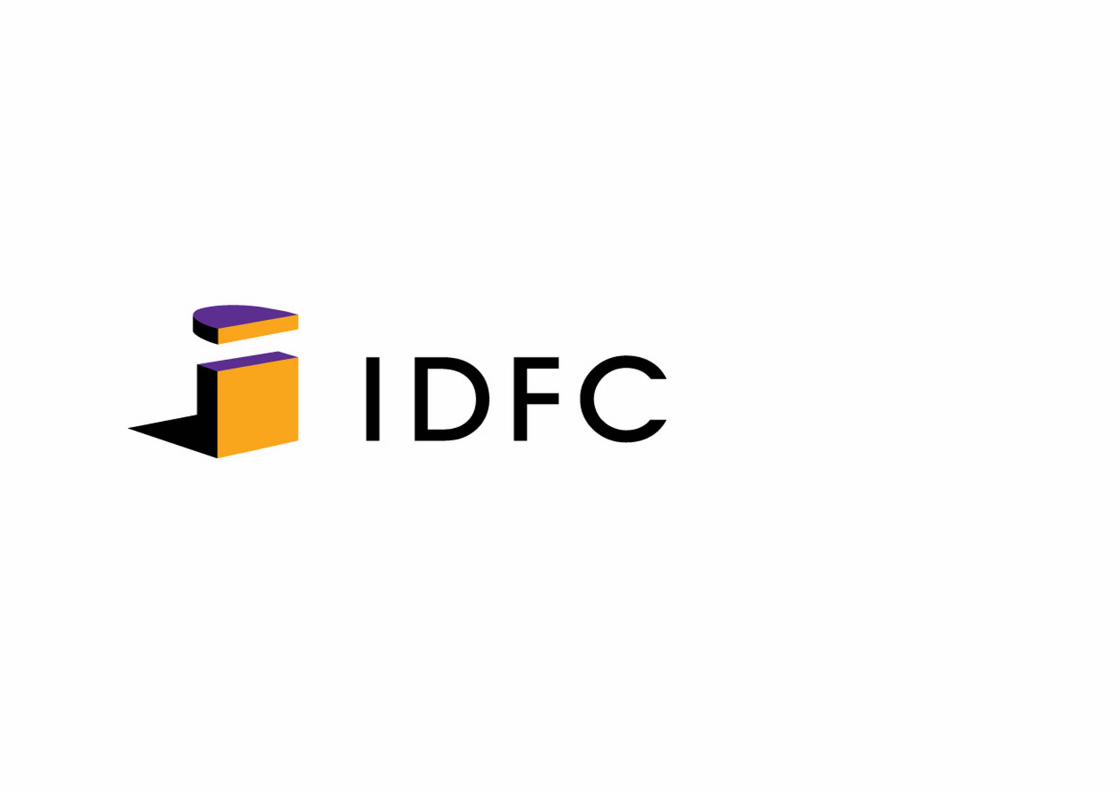
NII
`1,371 cr
Non-Int Income
`531 cr
Op. Income
`1,911 cr
Op. Expenses^
`277 cr
Provisions
`109 cr
9% 52% 18% 18%
PAT
`1,044 cr
22%
Balance Sheet
`69,961 cr
10%
Loan Book
`55,957 cr
3%
Borrowings
`52,670 cr
8%
Networth
`14,752 cr
12%
2.9%
14.5%
RoA*
RoE* Cost / Income*
Gross NPL
Net NPLLeverage
Loan Spreads*
Loan NIMs*
Tier I
Cap Adeq
14.9%0.32%
0.20%
2.9%
4.5%
21.6%
23.9%4.7x
15%(10%)
^ Adjusted Opex increased by 10% to `265 cr
*Rolling 12 months Oct’12-Sep’13 vs FY13
0% 2%
5
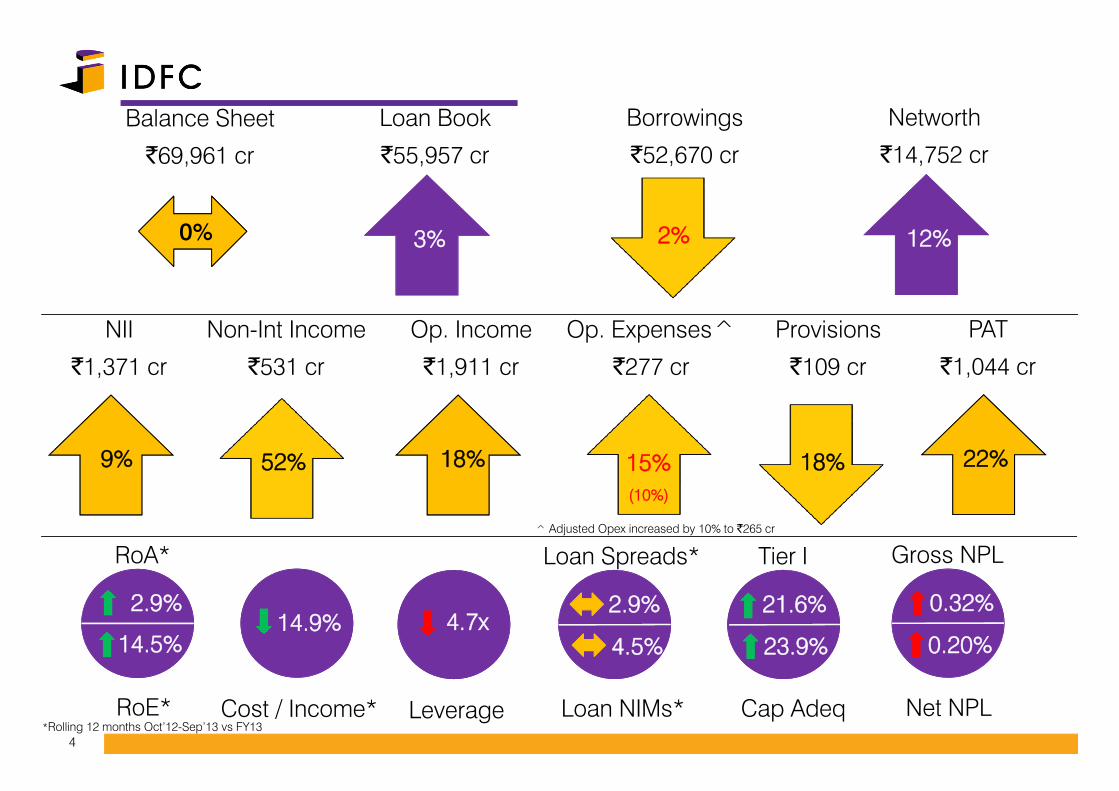
Resources :
Business Highlights
Project Finance Fixed Income & Treasury
Approvals : `14,976 cr (3% YoY increase – H1FY13 : `14,527 cr)
Disbursements : `5,650 cr (46% YoY decrease –H1FY13 : `10,487 cr)
Cumulative OS Approvals : `79,358 crore (10% YoY increase)
Loan Book : `55,957 crore (3% YoY increase , 3% Q-o-Q decrease)
NII Loan Book : `1,273 crore (11% YoY increase, 2% Q-o-Q increase)
Loan Related Fees : `33 crore (68% YoY decrease)
Loan Provisions : `92 crore (40% YoY increase)
Loan Loss Provision Ratio : 1.95%
NII Treasury : `99 cr (11% YoY decrease)
Fixed Income : `121 cr (H1FY13 - `32 crore)
Treasury Assets : `7,388 cr (17% decrease)
India Rating reaffirmed its “AAA” rating to IDFC
Borrowings outstanding : `52,670 cr (2% YoY decrease)
Overall Spreads for rolling 12 months ending Sept’13 : 2.4% (FY13 : 2.5%)
Capital Adequacy : 23.9% (of which Tier I : 21.6%) vs 22.1% as on Mar’13

6
Operating Expenses :
Business Highlights
Investment Banking & Broking Alternatives
Institutional Broking income : `14 cr(6% YoY decrease)
Investment Banking income : `7 cr(55% YoY decrease)
Average AUM : `7,806 cr
- Private Equity : `3,969 cr
- Project Equity : `3,837cr
Asset management fees from alternatives : `55 cr (5% YoYdecrease)
Capital Gains & Carry : `11 cr
HR expenses : `147 crore (10% YoY increase)
Non HR expenses : `130 crore (22% YoY increase). Adjusted for Fungibility Non HR Expenses increased by 12%
Cost / Income (rolling 12 months ending Sept’ 13): 14.9% (FY13 : 15.1%). Adjusted for Fungibility Cost / Income
ratio 14.6% vs FY13 15.0%
Public Market AMC
Average AUM H1FY14 : `40,773 crore (Debt : Equity –82:18)
8th Rank AMC
Market Share (Q2FY14) : 4.9%
Asset management Fees from AMC : `131 crore (75% YoYincrease)
Principal Gains (excluding cap gains and carry) : `159 crore (H1FY13 : `51 crore)
7
1. Snapshot
2. Balance Sheet & Financials
3. Concentration and product analysis
4. Borrowings
5. Shareholding
6. Highlights
8
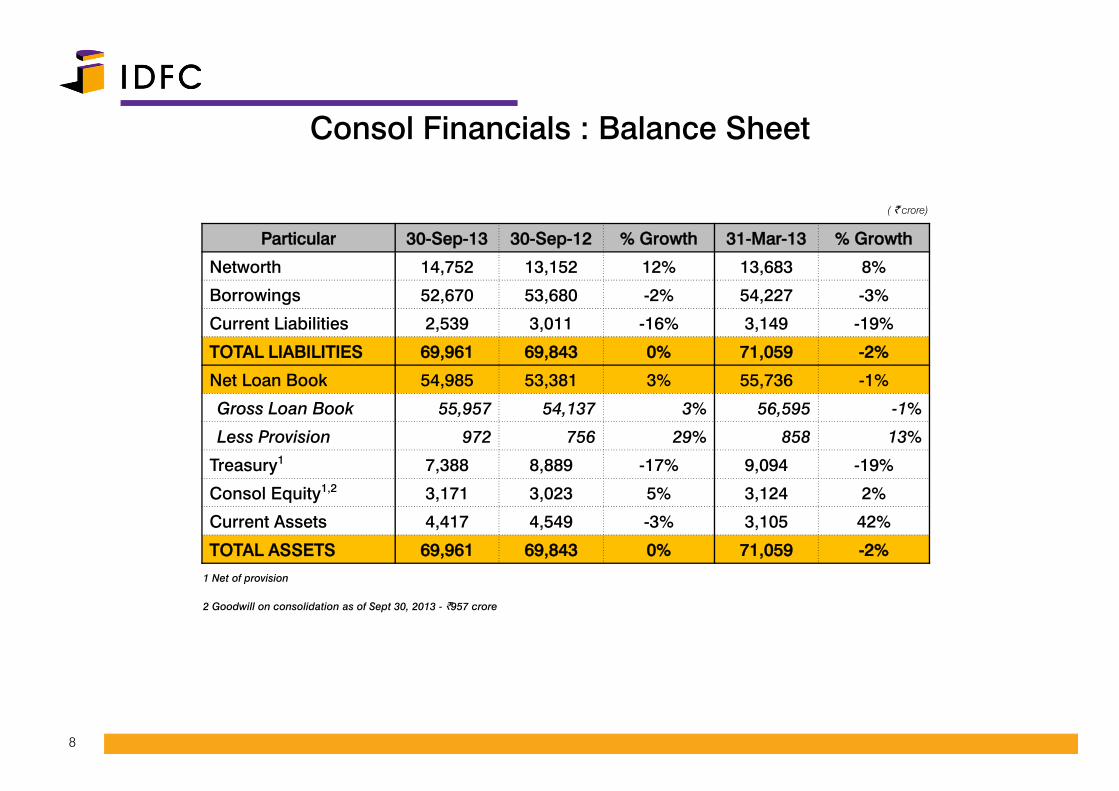
Consol Financials : Balance Sheet
( ` crore)
Particular 30-Sep-13 30-Sep-12 % Growth 31-Mar-13 % Growth
Networth 14,752 13,152 12% 13,683 8%
Borrowings 52,670 53,680 -2% 54,227 -3%
Current Liabilities 2,539 3,011 -16% 3,149 -19%
TOTAL LIABILITIES 69,961 69,843 0% 71,059 -2%
Net Loan Book 54,985 53,381 3% 55,736 -1%
Gross Loan Book 55,957 54,137 3% 56,595 -1%
Less Provision 972 756 29% 858 13%
Treasury1 7,388 8,889 -17% 9,094 -19%
Consol Equity1,2 3,171 3,023 5% 3,124 2%
Current Assets 4,417 4,549 -3% 3,105 42%
TOTAL ASSETS 69,961 69,843 0% 71,059 -2%1 Net of provision
2 Goodwill on consolidation as of Sept 30, 2013 - `957 crore
9
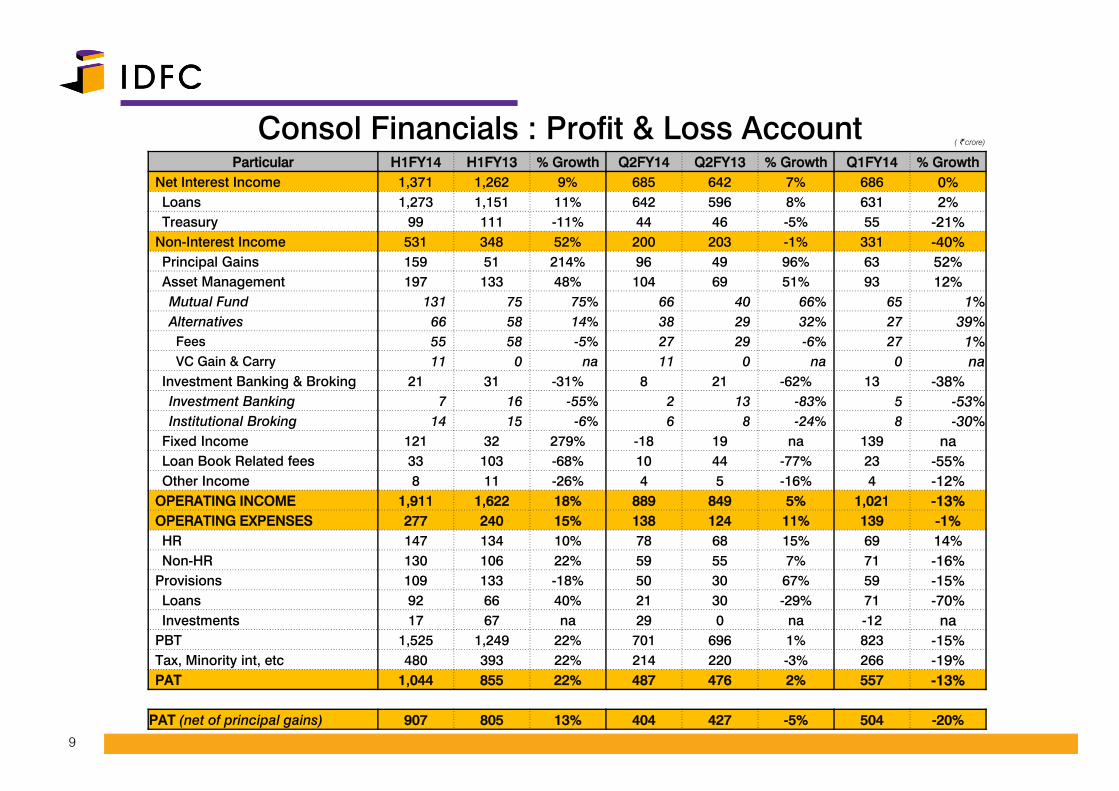
Consol Financials : Profit & Loss Account( ` crore)
Particular H1FY14 H1FY13 % Growth Q2FY14 Q2FY13 % Growth Q1FY14 % GrowthNet Interest Income 1,371 1,262 9% 685 642 7% 686 0%Loans 1,273 1,151 11% 642 596 8% 631 2%Treasury 99 111 -11% 44 46 -5% 55 -21%
Non-Interest Income 531 348 52% 200 203 -1% 331 -40%Principal Gains 159 51 214% 96 49 96% 63 52%Asset Management 197 133 48% 104 69 51% 93 12%Mutual Fund 131 75 75% 66 40 66% 65 1%Alternatives 66 58 14% 38 29 32% 27 39%Fees 55 58 -5% 27 29 -6% 27 1%VC Gain & Carry 11 0 na 11 0 na 0 na
Investment Banking & Broking 21 31 -31% 8 21 -62% 13 -38%Investment Banking 7 16 -55% 2 13 -83% 5 -53%Institutional Broking 14 15 -6% 6 8 -24% 8 -30%
Fixed Income 121 32 279% -18 19 na 139 naLoan Book Related fees 33 103 -68% 10 44 -77% 23 -55%Other Income 8 11 -26% 4 5 -16% 4 -12%
OPERATING INCOME 1,911 1,622 18% 889 849 5% 1,021 -13%OPERATING EXPENSES 277 240 15% 138 124 11% 139 -1%HR 147 134 10% 78 68 15% 69 14%Non-HR 130 106 22% 59 55 7% 71 -16%
Provisions 109 133 -18% 50 30 67% 59 -15%Loans 92 66 40% 21 30 -29% 71 -70%Investments 17 67 na 29 0 na -12 na
PBT 1,525 1,249 22% 701 696 1% 823 -15%Tax, Minority int, etc 480 393 22% 214 220 -3% 266 -19%PAT 1,044 855 22% 487 476 2% 557 -13%
PAT (net of principal gains) 907 805 13% 404 427 -5% 504 -20%

10
Consol Financials : RoA Tree(% of avg total assets)
Particular Oct12 -Sep13
Jul12 -Jun13 FY13 Jan12 -
Dec12Oct11 -Sep12
Net Interest Income 3.7% 3.8% 3.8% 3.9% 3.9%Loans 3.5% 3.5% 3.5% 3.6% 3.6%Treasury 0.3% 0.3% 0.3% 0.3% 0.3%
Non-Interest Income 1.5% 1.5% 1.3% 1.0% 1.2%Principal Investments 0.4% 0.4% 0.3% 0.2% 0.3%Asset Management 0.5% 0.5% 0.5% 0.4% 0.4%Investment Banking & Broking 0.1% 0.1% 0.1% 0.1% 0.1%Fixed Income 0.3% 0.4% 0.2% 0.1% 0.1%Loan Related & Other Fees 0.2% 0.2% 0.3% 0.3% 0.3%Other Income 0.0% 0.0% 0.0% 0.0% 0.0%
OPERATING INCOME 5.2% 5.3% 5.2% 5.0% 5.1%OPERATING EXPENSES 0.8% 0.8% 0.8% 0.8% 0.9%HR 0.4% 0.4% 0.4% 0.5% 0.5%Non-HR 0.3% 0.4% 0.3% 0.3% 0.4%
Provisions 0.5% 0.4% 0.5% 0.4% 0.5%PBT 4.0% 4.1% 3.9% 3.7% 3.8%Tax, Minority int, etc 1.2% 1.2% 1.1% 1.2% 1.2%PAT 2.8% 2.9% 2.8% 2.6% 2.6%
11
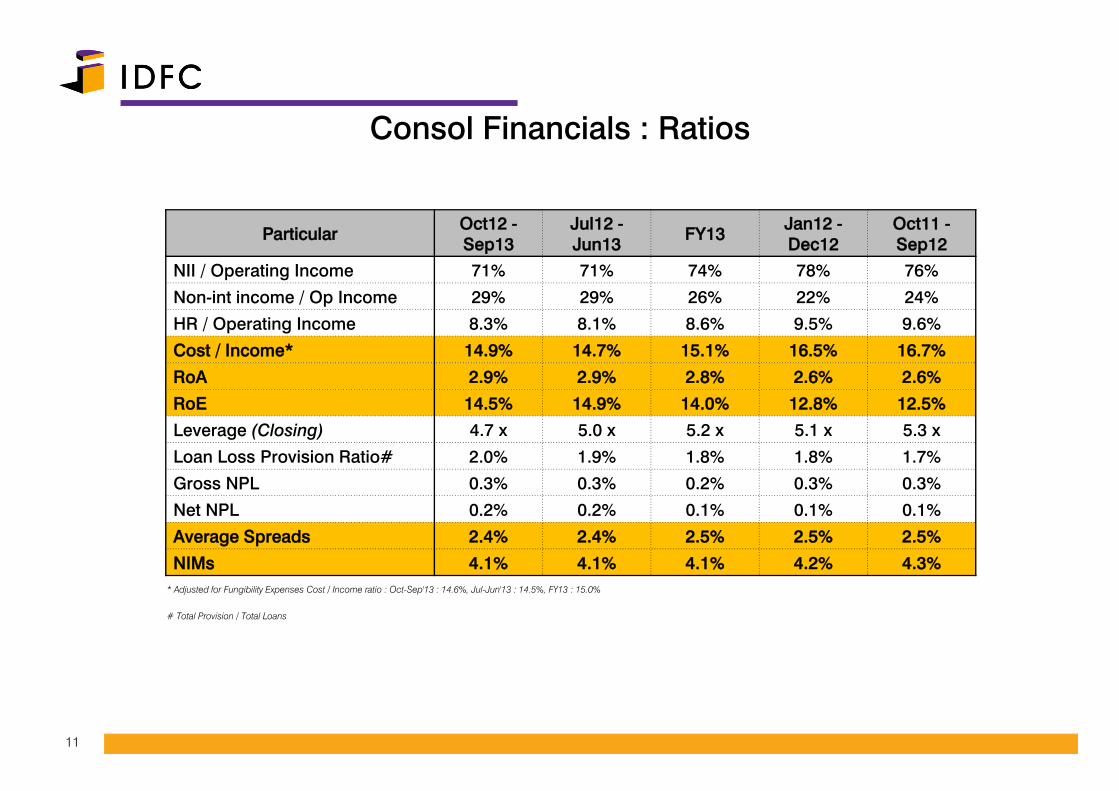
Consol Financials : Ratios
Particular Oct12 -Sep13
Jul12 -Jun13 FY13 Jan12 -
Dec12Oct11 -Sep12
NII / Operating Income 71% 71% 74% 78% 76%
Non-int income / Op Income 29% 29% 26% 22% 24%
HR / Operating Income 8.3% 8.1% 8.6% 9.5% 9.6%
Cost / Income* 14.9% 14.7% 15.1% 16.5% 16.7%
RoA 2.9% 2.9% 2.8% 2.6% 2.6%
RoE 14.5% 14.9% 14.0% 12.8% 12.5%
Leverage (Closing) 4.7 x 5.0 x 5.2 x 5.1 x 5.3 x
Loan Loss Provision Ratio# 2.0% 1.9% 1.8% 1.8% 1.7%
Gross NPL 0.3% 0.3% 0.2% 0.3% 0.3%
Net NPL 0.2% 0.2% 0.1% 0.1% 0.1%
Average Spreads 2.4% 2.4% 2.5% 2.5% 2.5%
NIMs 4.1% 4.1% 4.1% 4.2% 4.3%* Adjusted for Fungibility Expenses Cost / Income ratio : Oct-Sep'13 : 14.6%, Jul-Jun'13 : 14.5%, FY13 : 15.0%
# Total Provision / Total Loans

12
1. Snapshot
2. Balance Sheet & Financials
3. Concentration and product analysis
4. Borrowings
5. Shareholding
6. Highlights

13
Concentration Analysis (Sector)
Top 20 Companies : 41% of total (Jun’13 : 39%)
Top 20 Industrial Groups : 62% of total (Jun’13 : 62%)
Cumulative OS Approvals
Outstanding Disbursement
Top 20 Companies : 39% of total (Jun’13 : 41%)
Top 20 Industrial Groups : 61% of total (Jun’13 : 63%)
(Amounts in ` crore)
Particular Sep-13 % of Total Mar-13 % of Total Sep-12 % of Total
Energy 27,136 34% 29,234 40% 29,031 40%
Transportation 19,478 25% 18,210 25% 16,804 23%
Telecom 20,550 26% 14,927 21% 17,510 24%
Others 12,194 15% 10,226 14% 9,097 13%
TOTAL 79,358 100% 72,597 100% 72,441 100%
(Amounts in ` crore)
Particular Sep-13 % of Total Mar-13 % of Total Sep-12 % of Total
Energy 24,420 41% 25,212 41% 25,076 42%
Transportation 15,501 26% 14,365 24% 13,318 23%
Telecom 12,013 20% 13,772 23% 14,092 24%
Others 8,207 14% 7,433 12% 6,596 11%
TOTAL 60,142 100% 60,782 100% 59,083 100%
14
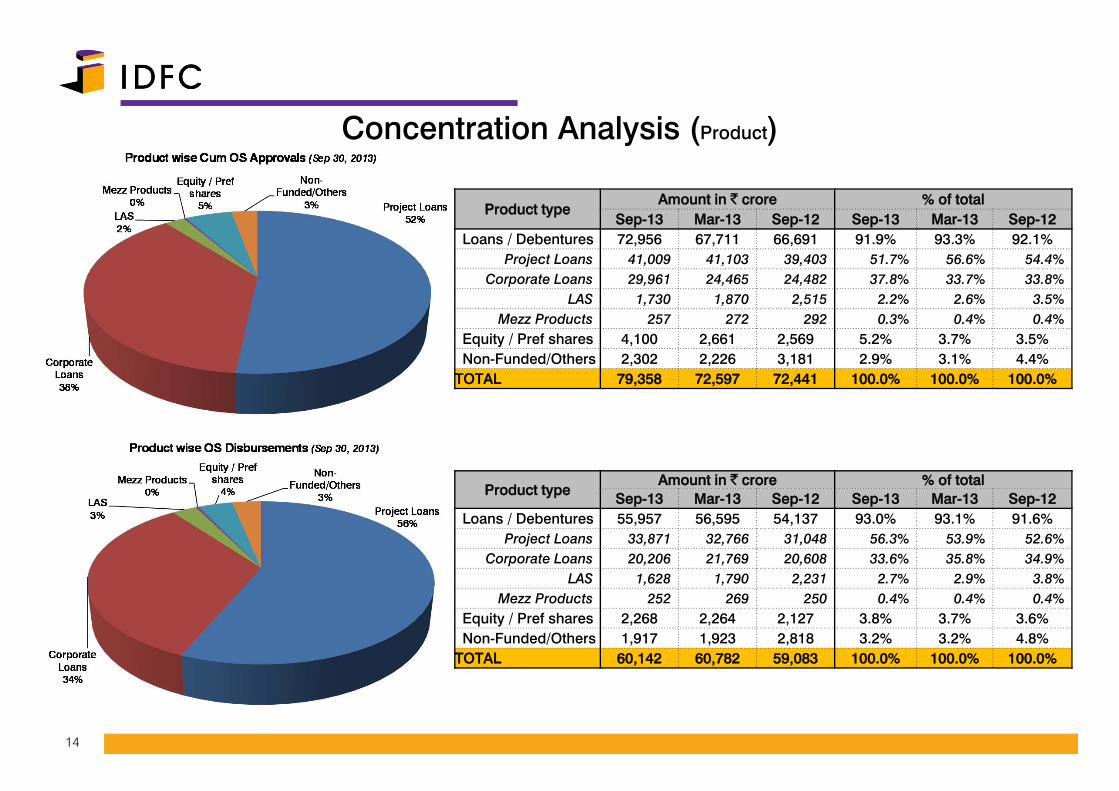
Concentration Analysis (Product)
Product typeAmount in ` crore % of total
Sep-13 Mar-13 Sep-12 Sep-13 Mar-13 Sep-12Loans / Debentures 72,956 67,711 66,691 91.9% 93.3% 92.1%
Project Loans 41,009 41,103 39,403 51.7% 56.6% 54.4%Corporate Loans 29,961 24,465 24,482 37.8% 33.7% 33.8%
LAS 1,730 1,870 2,515 2.2% 2.6% 3.5%Mezz Products 257 272 292 0.3% 0.4% 0.4%
Equity / Pref shares 4,100 2,661 2,569 5.2% 3.7% 3.5%Non-Funded/Others 2,302 2,226 3,181 2.9% 3.1% 4.4%
TOTAL 79,358 72,597 72,441 100.0% 100.0% 100.0%
Product typeAmount in ` crore % of total
Sep-13 Mar-13 Sep-12 Sep-13 Mar-13 Sep-12Loans / Debentures 55,957 56,595 54,137 93.0% 93.1% 91.6%
Project Loans 33,871 32,766 31,048 56.3% 53.9% 52.6%Corporate Loans 20,206 21,769 20,608 33.6% 35.8% 34.9%
LAS 1,628 1,790 2,231 2.7% 2.9% 3.8%Mezz Products 252 269 250 0.4% 0.4% 0.4%
Equity / Pref shares 2,268 2,264 2,127 3.8% 3.7% 3.6%Non-Funded/Others 1,917 1,923 2,818 3.2% 3.2% 4.8%
TOTAL 60,142 60,782 59,083 100.0% 100.0% 100.0%

15
Energy Cum OS Approvals Tree
Tota l Cumulat ive OS Approvals as on Sep 30, 2013 - ` 79,358 Crore CUM OS APPR100%
Energy 34% 66% Others
Generation 22.1% 12%
Construct ion 5.9% 16.2% Operationa l
IPP/Merchant 4.1% 1.9% Renewables / Captives
Gas 2.4% 1.6% Captive Fuel / Others
T&D, Private Util i t ies, others
16
1. Snapshot
2. Balance Sheet & Financials
3. Concentration and product analysis
4. Borrowings
5. Shareholding
6. Highlights
17
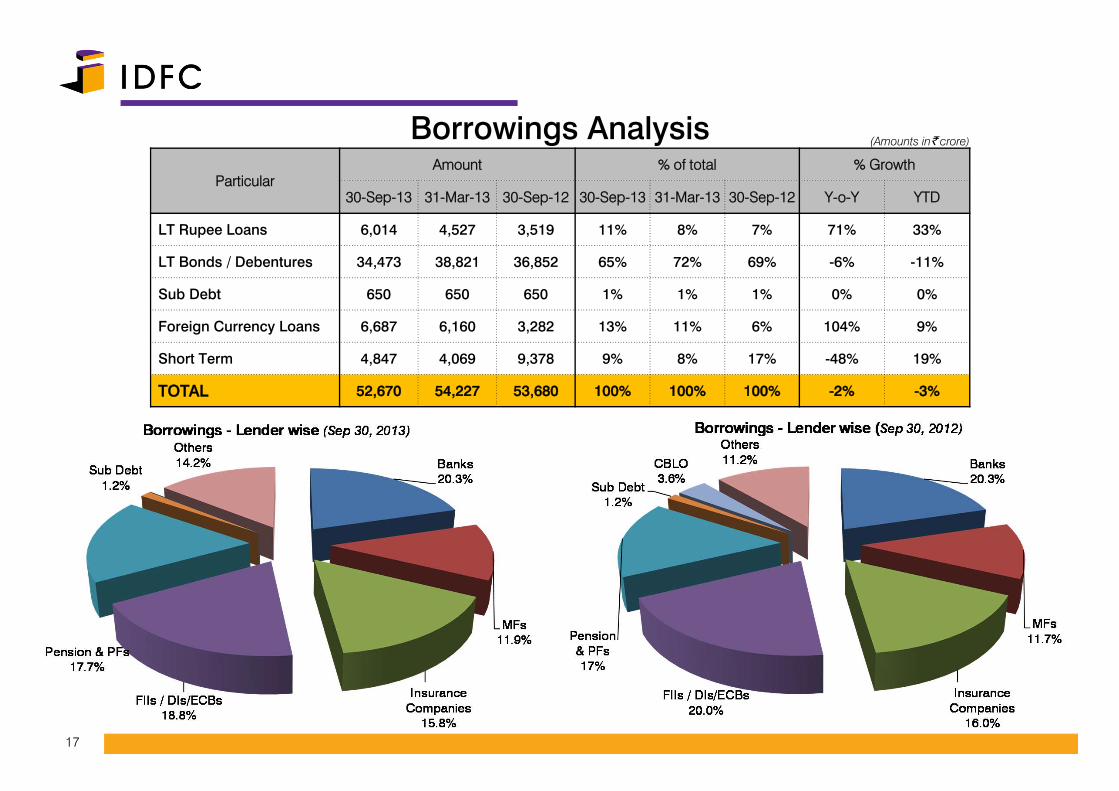
Borrowings Analysis (Amounts in` crore)
ParticularAmount % of total % Growth
30-Sep-13 31-Mar-13 30-Sep-12 30-Sep-13 31-Mar-13 30-Sep-12 Y-o-Y YTD
LT Rupee Loans 6,014 4,527 3,519 11% 8% 7% 71% 33%
LT Bonds / Debentures 34,473 38,821 36,852 65% 72% 69% -6% -11%
Sub Debt 650 650 650 1% 1% 1% 0% 0%
Foreign Currency Loans 6,687 6,160 3,282 13% 11% 6% 104% 9%
Short Term 4,847 4,069 9,378 9% 8% 17% -48% 19%
TOTAL 52,670 54,227 53,680 100% 100% 100% -2% -3%
18
1. Snapshot
2. Balance Sheet & Financials
3. Concentration and product analysis
4. Borrowings
5. Shareholding
6. Highlights
19
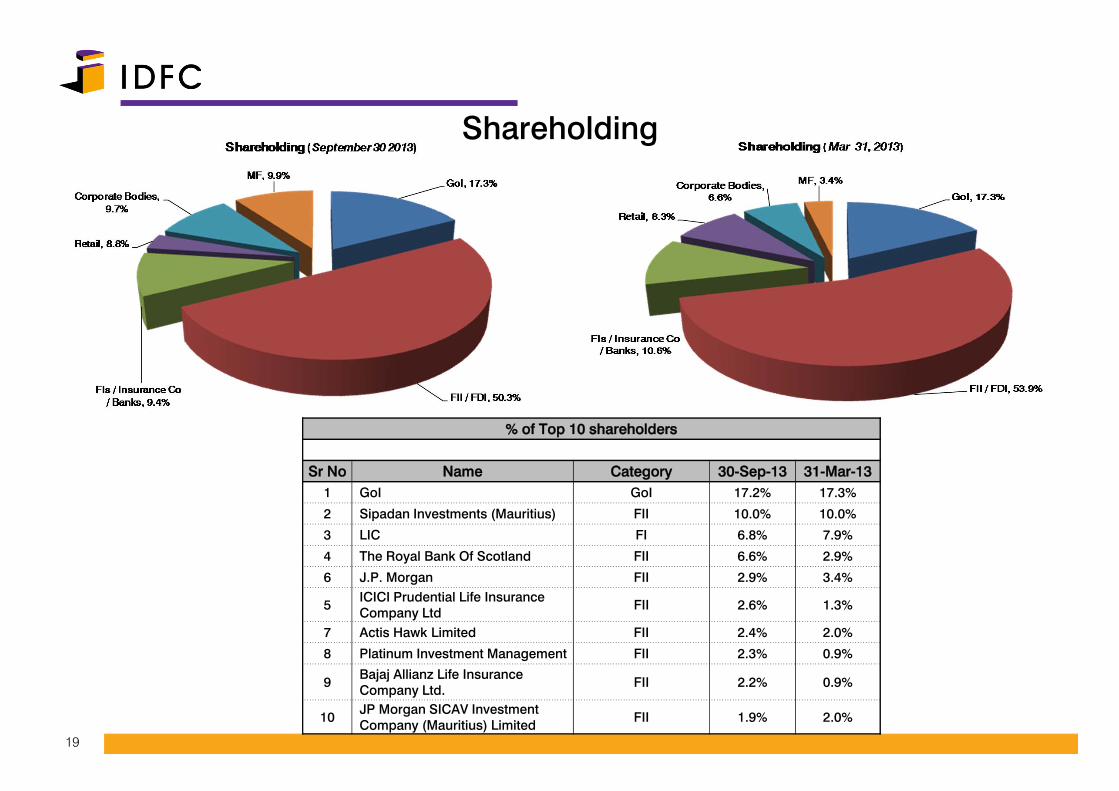
Shareholding
% of Top 10 shareholders
Sr No Name Category 30-Sep-13 31-Mar-131 GoI GoI 17.2% 17.3%
2 Sipadan Investments (Mauritius) FII 10.0% 10.0%
3 LIC FI 6.8% 7.9%
4 The Royal Bank Of Scotland FII 6.6% 2.9%
6 J.P. Morgan FII 2.9% 3.4%
5 ICICI Prudential Life Insurance Company Ltd FII 2.6% 1.3%
7 Actis Hawk Limited FII 2.4% 2.0%
8 Platinum Investment Management FII 2.3% 0.9%
9 Bajaj Allianz Life Insurance Company Ltd. FII 2.2% 0.9%
10 JP Morgan SICAV Investment Company (Mauritius) Limited FII 1.9% 2.0%

20
1. Snapshot
2. Balance Sheet & Financials
3. Concentration and product analysis
4. Borrowings
5. Shareholding
6. Highlights

21
Other Highlights
Adjusted Duration :- Assets : 1.4 years (Jun 30, 2013 : 1.5 years)- Liabilities : 1.6 years (Jun 30, 2013 : 1.8 years)
Assets Under Management :
Fund NameAUM (Sep 30, 2013)
` Crore USD* (bn)
IDFC Private Equity** 3,969 0.8
Fund I 47 0.0
Fund II 1,478 0.3
Fund III 2,445 0.5
IDFC Project Equity Fund** 3,837 0.8
IDFC Mutual Fund 40,773 6.5
Equity 7,430 1.2
Debt 33,343 5.3
Total 48,579 8.1
**Exchange rate: Pvt & Proj Eq - rate prevailing at the time of Fund Close; Others 1 USD = ` 62.78 as on Sep 30, 2013..