Ingersoll RandQ3 2021 Earnings Presentation
November 4, 2021
Forward-Looking Statements
2
This presentation contains “forward-looking statements” as that term is defined in Section 27A of the Securities Act of 1933, as amended, and Section 21E of the Securities Exchange Act of 1934, as
amended by the Private Securities Litigation Reform Act of 1995, including statements related to Ingersoll Rand Inc.’s (the “Company” or “Ingersoll Rand” and f/k/a Gardner Denver Holdings, Inc. or “Gardner
Denver”) expectations regarding the performance of its business, its financial results, its liquidity and capital resources and other non-historical statements. These forward-looking statements generally are
identified by the words “believe,” “project,” “expect,” “anticipate,” “estimate,” “forecast,” “outlook,” “target,” “endeavor,” “seek,” “predict,” “intend,” “strategy,” “plan,” “may,” “could,” “should,” “will,” “would,” “will
be,” “on track to” “will continue,” “will likely result,” “guidance” or the negative thereof or variations thereon or similar terminology generally intended to identify forward-looking statements. All statements other
than historical facts are forward-looking statements.
These forward-looking statements are based on Ingersoll Rand’s current expectations and are subject to risks and uncertainties, which may cause actual results to differ materially from these current
expectations. Should one or more of these risks or uncertainties materialize, or should underlying assumptions prove incorrect, actual results may vary materially from those indicated or anticipated by such
forward-looking statements. The inclusion of such statements should not be regarded as a representation that such plans, estimates or expectations will be achieved. Important factors that could cause
actual results to differ materially from such plans, estimates or expectations include, among others, (1) the impact on the Company’s business, suppliers and customers and global economic conditions of the
COVID-19 pandemic; (2) unexpected costs, charges or expenses resulting from the completed and proposed business combinations; (3) uncertainty of the expected financial performance of the Company;
(4) failure to realize the anticipated benefits of the completed and proposed business combinations; (5) the ability of the Company to implement its business strategy; (6) difficulties and delays in achieving
revenue and cost synergies; (7) inability of the Company to retain and hire key personnel; (8) evolving legal, regulatory and tax regimes; (10) changes in general economic and/or industry specific conditions;
(10) actions by third parties, including government agencies; (11) adverse impact on our operations and financial performance due to natural disaster, catastrophe, pandemic or other events outside of our
control; and (12) other risk factors detailed in Ingersoll Rand’s most recent Annual Report on Form 10-K filed with the Securities and Exchange Commission (the “SEC”), as such factors may be updated from
time to time in its periodic filings with the SEC, which are available on the SEC’s website at http://www.sec.gov. The foregoing list of important factors is not exclusive.
Any forward-looking statements speak only as of the date of this presentation. Ingersoll Rand undertakes no obligation to update any forward-looking statements, whether as a result of new information or
developments, future events or otherwise, except as required by law. Readers are cautioned not to place undue reliance on any of these forward-looking statements.
Non-GAAP Financial Measures
Included in this presentation are certain non-GAAP financial measures designed to supplement, and not substitute, the financial information provided in accordance with generally accepted accounting
principles (“GAAP”) in the United States of America because management believes such measures are useful to investors. The reconciliation of those measures to the most comparable GAAP measures for
historical periods is set forth in the appendix to this presentation. Reconciliations of non-GAAP measures related to full-year 2021 guidance have not been provided due to the unreasonable efforts it would
take to provide such reconciliations due to the high variability, complexity and uncertainty with respect to forecasting and quantifying certain amounts that are necessary for such reconciliations, including net
income (loss) and adjustments that could be made for acquisitions-related expenses, restructuring and other business transformation costs, gains or losses on foreign currency exchange and the timing and
magnitude of other amounts in the reconciliation of historic numbers. For the same reasons, we are unable to address the probable significance of the unavailable information, which could have a potentially
unpredictable, and potentially significant, impact on our future GAAP financial results.
IRX Fueling Strong Performance
Commercial and operational outperformance in Q3 2021
amidst challenging supply chain and inflationary
environment
A Premier Industrial Company with Iconic Brands and Market-Leading Positions
3
Significant Continued Investment in our Company
Organic and inorganic growth investment fueling
continued outperformance
1
2
Acceleration through Capital Allocation Strategy
Robust M&A-focused strategy along with initiation of
quarterly dividend and share repurchase program
3
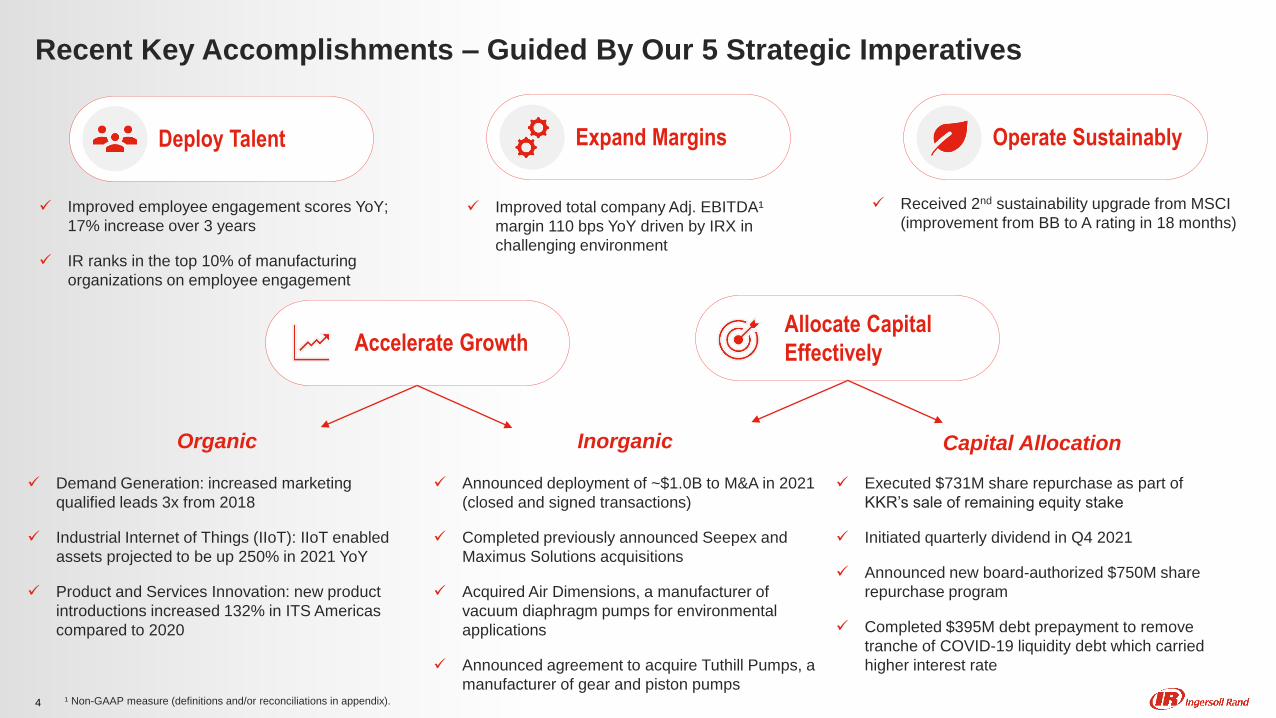
Recent Key Accomplishments – Guided By Our 5 Strategic Imperatives
4
Deploy Talent
Accelerate Growth
Expand Margins
Allocate Capital
Effectively
Operate Sustainably
Organic Inorganic Capital Allocation
Executed $731M share repurchase as part of
KKR’s sale of remaining equity stake
Initiated quarterly dividend in Q4 2021
Announced new board-authorized $750M share
repurchase program
Completed $395M debt prepayment to remove
tranche of COVID-19 liquidity debt which carried
higher interest rate
Announced deployment of ~$1.0B to M&A in 2021
(closed and signed transactions)
Completed previously announced Seepex and
Maximus Solutions acquisitions
Acquired Air Dimensions, a manufacturer of
vacuum diaphragm pumps for environmental
applications
Announced agreement to acquire Tuthill Pumps, a
manufacturer of gear and piston pumps
Demand Generation: increased marketing
qualified leads 3x from 2018
Industrial Internet of Things (IIoT): IIoT enabled
assets projected to be up 250% in 2021 YoY
Product and Services Innovation: new product
introductions increased 132% in ITS Americas
compared to 2020
Received 2nd sustainability upgrade from MSCI
(improvement from BB to A rating in 18 months) Improved employee engagement scores YoY;
17% increase over 3 years
IR ranks in the top 10% of manufacturing
organizations on employee engagement
Improved total company Adj. EBITDA¹
margin 110 bps YoY driven by IRX in
challenging environment
¹ Non-GAAP measure (definitions and/or reconciliations in appendix).
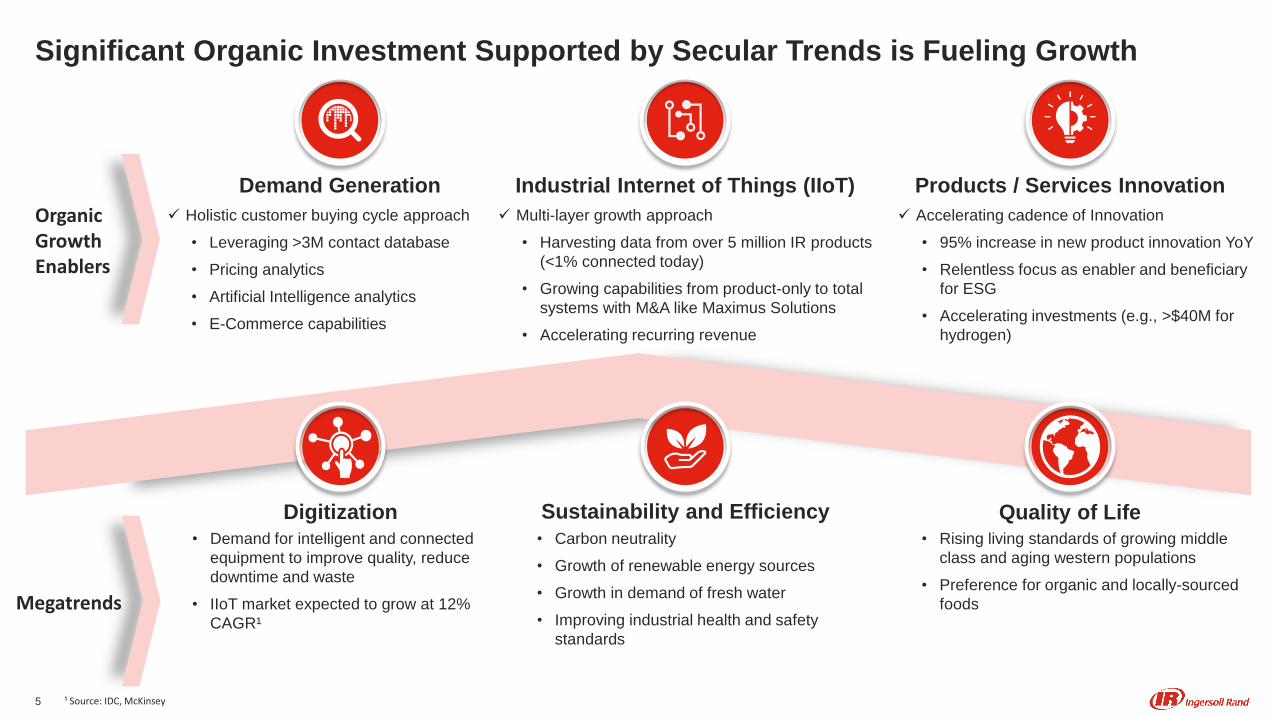
Significant Organic Investment Supported by Secular Trends is Fueling Growth
Holistic customer buying cycle approach
• Leveraging >3M contact database
• Pricing analytics
• Artificial Intelligence analytics
• E-Commerce capabilities
Demand Generation Industrial Internet of Things (IIoT)
Multi-layer growth approach
• Harvesting data from over 5 million IR products
(<1% connected today)
• Growing capabilities from product-only to total
systems with M&A like Maximus Solutions
• Accelerating recurring revenue
Products / Services Innovation
Accelerating cadence of Innovation
• 95% increase in new product innovation YoY
• Relentless focus as enabler and beneficiary
for ESG
• Accelerating investments (e.g., >$40M for
hydrogen)
• Demand for intelligent and connected
equipment to improve quality, reduce
downtime and waste
• IIoT market expected to grow at 12%
CAGR¹
Digitization
5
• Carbon neutrality
• Growth of renewable energy sources
• Growth in demand of fresh water
• Improving industrial health and safety
standards
Sustainability and Efficiency
• Rising living standards of growing middle
class and aging western populations
• Preference for organic and locally-sourced
foods
Quality of Life
Organic Growth Enablers
Megatrends
¹ Source: IDC, McKinsey
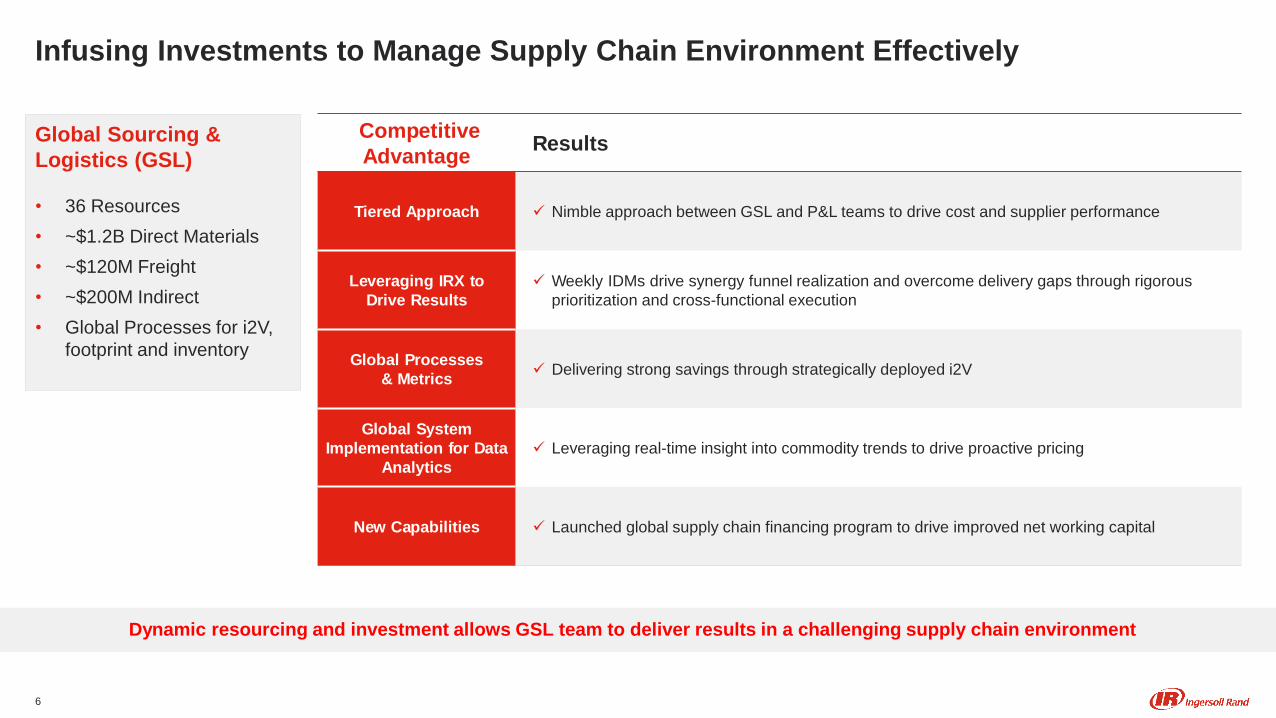
Competitive
AdvantageResults
Tiered Approach Nimble approach between GSL and P&L teams to drive cost and supplier performance
Leveraging IRX to
Drive Results
Weekly IDMs drive synergy funnel realization and overcome delivery gaps through rigorous
prioritization and cross-functional execution
Global Processes
& Metrics Delivering strong savings through strategically deployed i2V
Global System
Implementation for Data
Analytics
Leveraging real-time insight into commodity trends to drive proactive pricing
New Capabilities Launched global supply chain financing program to drive improved net working capital
Infusing Investments to Manage Supply Chain Environment Effectively
6
Global Sourcing &
Logistics (GSL)
• 36 Resources
• ~$1.2B Direct Materials
• ~$120M Freight
• ~$200M Indirect
• Global Processes for i2V,
footprint and inventory
Dynamic resourcing and investment allows GSL team to deliver results in a challenging supply chain environment
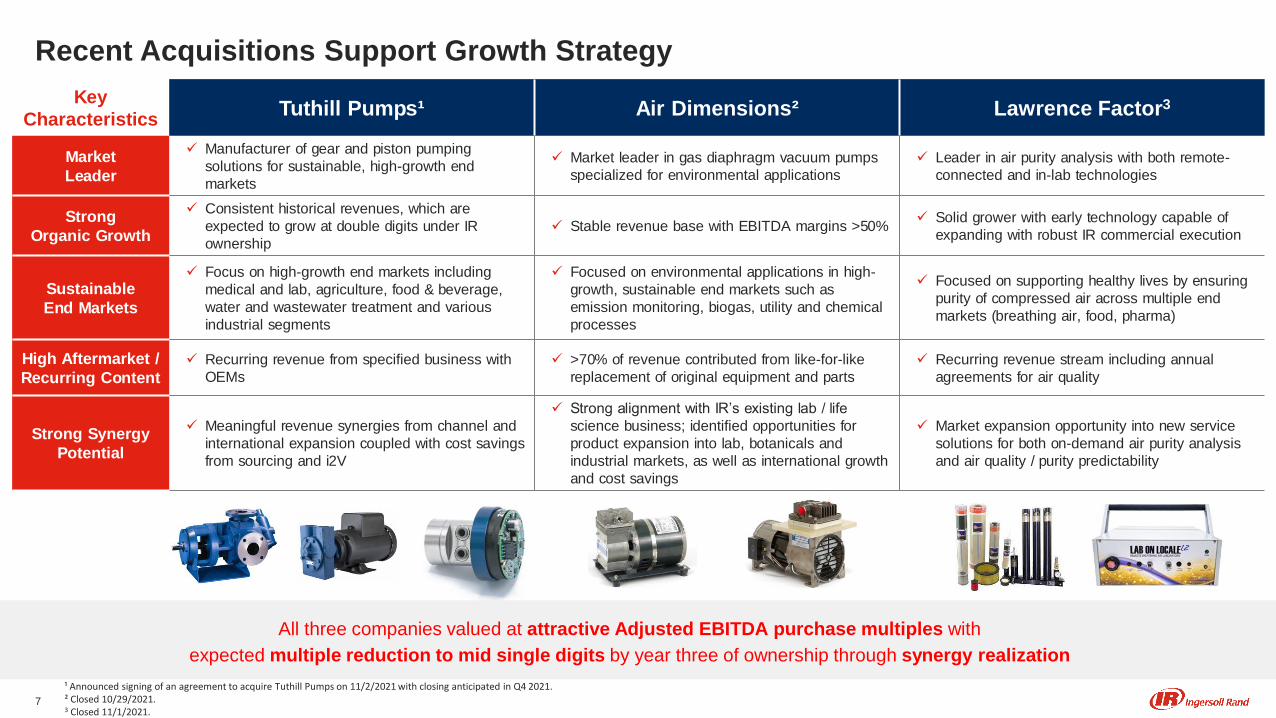
Recent Acquisitions Support Growth Strategy
7
Key
CharacteristicsTuthill Pumps¹ Air Dimensions² Lawrence Factor3
Market
Leader
Manufacturer of gear and piston pumping
solutions for sustainable, high-growth end
markets
Market leader in gas diaphragm vacuum pumps
specialized for environmental applications
Leader in air purity analysis with both remote-
connected and in-lab technologies
Strong
Organic Growth
Consistent historical revenues, which are
expected to grow at double digits under IR
ownership
Stable revenue base with EBITDA margins >50% Solid grower with early technology capable of
expanding with robust IR commercial execution
Sustainable
End Markets
Focus on high-growth end markets including
medical and lab, agriculture, food & beverage,
water and wastewater treatment and various
industrial segments
Focused on environmental applications in high-
growth, sustainable end markets such as
emission monitoring, biogas, utility and chemical
processes
Focused on supporting healthy lives by ensuring
purity of compressed air across multiple end
markets (breathing air, food, pharma)
High Aftermarket /
Recurring Content
Recurring revenue from specified business with
OEMs
>70% of revenue contributed from like-for-like
replacement of original equipment and parts
Recurring revenue stream including annual
agreements for air quality
Strong Synergy
Potential
Meaningful revenue synergies from channel and
international expansion coupled with cost savings
from sourcing and i2V
Strong alignment with IR’s existing lab / life
science business; identified opportunities for
product expansion into lab, botanicals and
industrial markets, as well as international growth
and cost savings
Market expansion opportunity into new service
solutions for both on-demand air purity analysis
and air quality / purity predictability
All three companies valued at attractive Adjusted EBITDA purchase multiples with
expected multiple reduction to mid single digits by year three of ownership through synergy realization
¹ Announced signing of an agreement to acquire Tuthill Pumps on 11/2/2021 with closing anticipated in Q4 2021. ² Closed 10/29/2021.3 Closed 11/1/2021.
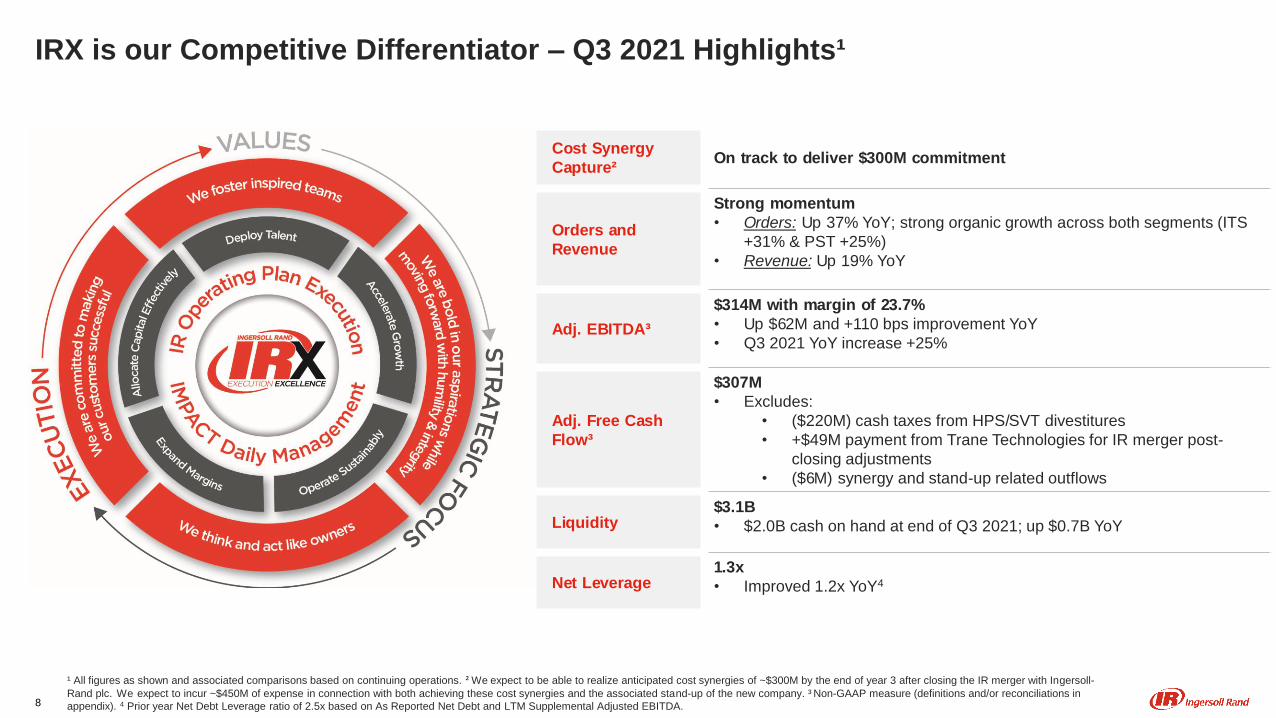
IRX is our Competitive Differentiator – Q3 2021 Highlights¹
Cost Synergy
Capture²On track to deliver $300M commitment
Orders and
Revenue
Strong momentum
• Orders: Up 37% YoY; strong organic growth across both segments (ITS
+31% & PST +25%)
• Revenue: Up 19% YoY
Adj. EBITDA³
$314M with margin of 23.7%
• Up $62M and +110 bps improvement YoY
• Q3 2021 YoY increase +25%
Adj. Free Cash
Flow³
$307M
• Excludes:
• ($220M) cash taxes from HPS/SVT divestitures
• +$49M payment from Trane Technologies for IR merger post-
closing adjustments
• ($6M) synergy and stand-up related outflows
Liquidity$3.1B
• $2.0B cash on hand at end of Q3 2021; up $0.7B YoY
Net Leverage1.3x
• Improved 1.2x YoY4
¹ All figures as shown and associated comparisons based on continuing operations. ² We expect to be able to realize anticipated cost synergies of ~$300M by the end of year 3 after closing the IR merger with Ingersoll-
Rand plc. We expect to incur ~$450M of expense in connection with both achieving these cost synergies and the associated stand-up of the new company. ³ Non-GAAP measure (definitions and/or reconciliations in
appendix). 4 Prior year Net Debt Leverage ratio of 2.5x based on As Reported Net Debt and LTM Supplemental Adjusted EBITDA.8
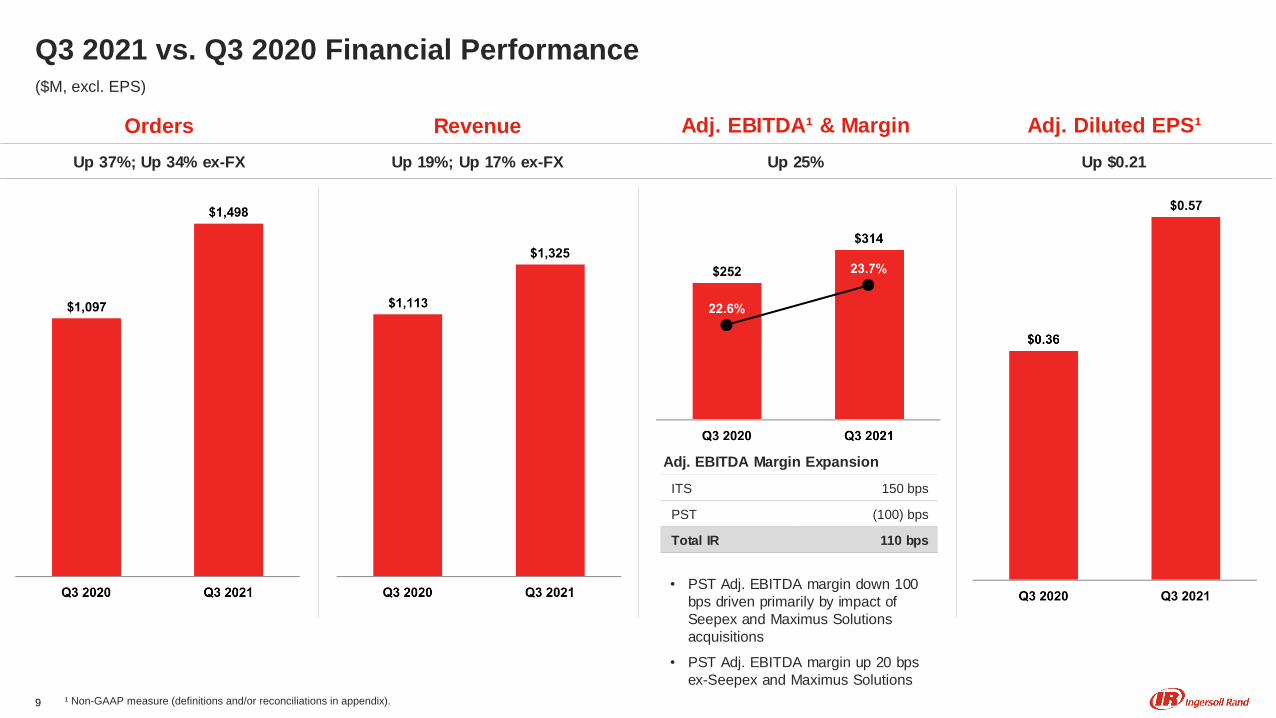
Q3 2021 vs. Q3 2020 Financial Performance
Orders Revenue Adj. EBITDA¹ & Margin Adj. Diluted EPS¹
Up 37%; Up 34% ex-FX Up 19%; Up 17% ex-FX Up 25% Up $0.21
($M, excl. EPS)
Adj. EBITDA Margin Expansion
ITS 150 bps
PST (100) bps
Total IR 110 bps
9
• PST Adj. EBITDA margin down 100
bps driven primarily by impact of
Seepex and Maximus Solutions
acquisitions
• PST Adj. EBITDA margin up 20 bps
ex-Seepex and Maximus Solutions
¹ Non-GAAP measure (definitions and/or reconciliations in appendix).
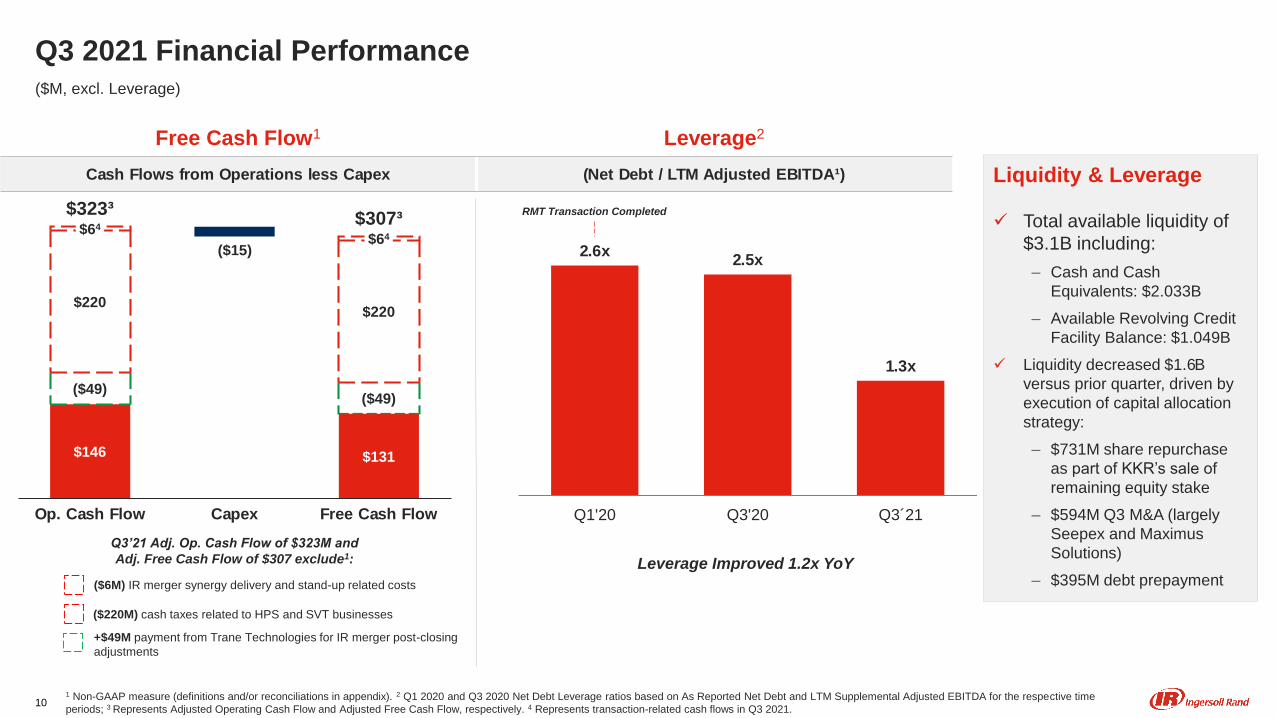
2.6x2.5x
1.3x
Q1'20 Q3'20 Q3´21
Q3 2021 Financial Performance($M, excl. Leverage)
Free Cash Flow1 Leverage2
Cash Flows from Operations less Capex (Net Debt / LTM Adjusted EBITDA¹)
Leverage Improved 1.2x YoY
Liquidity & Leverage
Total available liquidity of
$3.1B including:
‒ Cash and Cash
Equivalents: $2.033B
‒ Available Revolving Credit
Facility Balance: $1.049B
Liquidity decreased $1.6B
versus prior quarter, driven by
execution of capital allocation
strategy:
‒ $731M share repurchase
as part of KKR’s sale of
remaining equity stake
‒ $594M Q3 M&A (largely
Seepex and Maximus
Solutions)
‒ $395M debt prepayment($6M) IR merger synergy delivery and stand-up related costs
($220M) cash taxes related to HPS and SVT businesses
1 Non-GAAP measure (definitions and/or reconciliations in appendix). 2 Q1 2020 and Q3 2020 Net Debt Leverage ratios based on As Reported Net Debt and LTM Supplemental Adjusted EBITDA for the respective time
periods; 3 Represents Adjusted Operating Cash Flow and Adjusted Free Cash Flow, respectively. 4 Represents transaction-related cash flows in Q3 2021.
+$49M payment from Trane Technologies for IR merger post-closing
adjustments
$64
$220$220
($49)
Free Cash FlowOp. Cash Flow Capex
$64
($49)
$323³$307³
$131$146
($15)
RMT Transaction Completed
10
Q3’21 Adj. Op. Cash Flow of $323M and
Adj. Free Cash Flow of $307 exclude1:
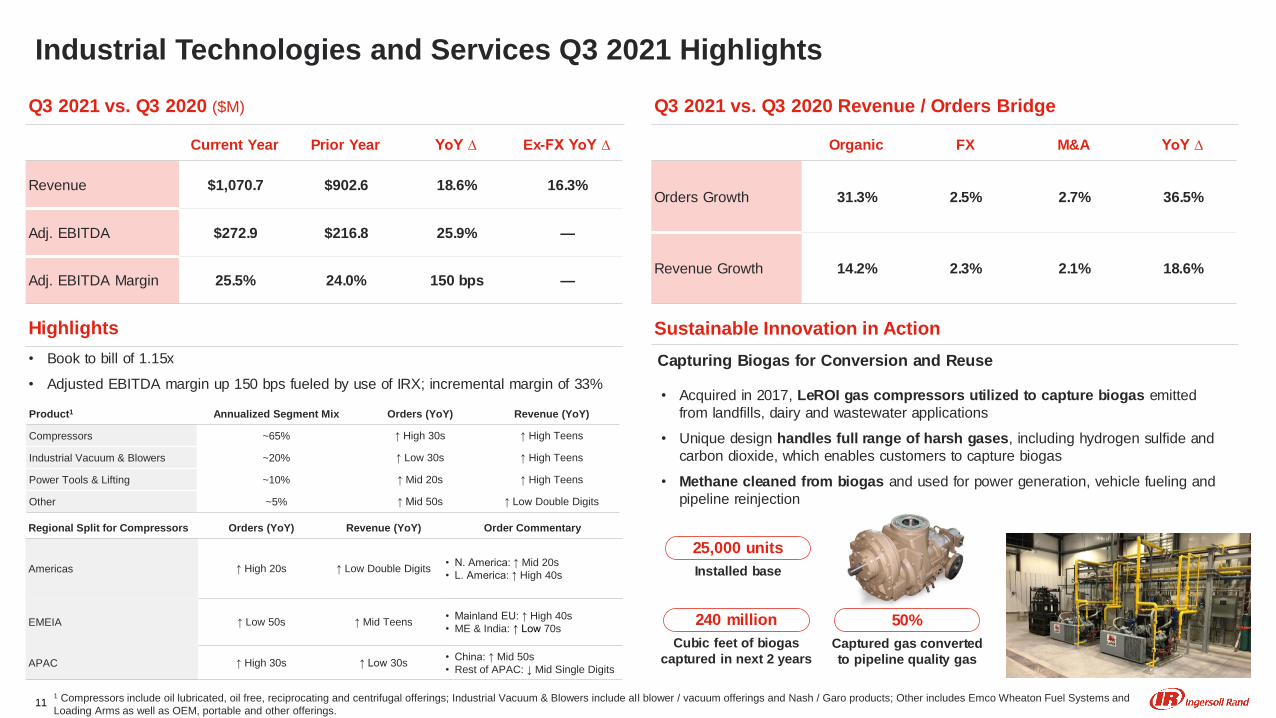
Industrial Technologies and Services Q3 2021 Highlights
Current Year Prior Year YoY ∆ Ex-FX YoY ∆
Revenue $1,070.7 $902.6 18.6% 16.3%
Adj. EBITDA $272.9 $216.8 25.9% —
Adj. EBITDA Margin 25.5% 24.0% 150 bps —
Q3 2021 vs. Q3 2020 Revenue / Orders Bridge
Organic FX M&A YoY ∆
Orders Growth 31.3% 2.5% 2.7% 36.5%
Revenue Growth 14.2% 2.3% 2.1% 18.6%
Q3 2021 vs. Q3 2020 ($M)
Highlights
• Book to bill of 1.15x
• Adjusted EBITDA margin up 150 bps fueled by use of IRX; incremental margin of 33%
Product1 Annualized Segment Mix Orders (YoY) Revenue (YoY)
Compressors ~65% ↑ High 30s ↑ High Teens
Industrial Vacuum & Blowers ~20% ↑ Low 30s ↑ High Teens
Power Tools & Lifting ~10% ↑ Mid 20s ↑ High Teens
Other ~5% ↑ Mid 50s ↑ Low Double Digits
1 Compressors include oil lubricated, oil free, reciprocating and centrifugal offerings; Industrial Vacuum & Blowers include all blower / vacuum offerings and Nash / Garo products; Other includes Emco Wheaton Fuel Systems and
Loading Arms as well as OEM, portable and other offerings.
Regional Split for Compressors Orders (YoY) Revenue (YoY) Order Commentary
Americas ↑ High 20s ↑ Low Double Digits• N. America: ↑ Mid 20s
• L. America: ↑ High 40s
EMEIA ↑ Low 50s ↑ Mid Teens• Mainland EU: ↑ High 40s
• ME & India: ↑ Low 70s
APAC ↑ High 30s ↑ Low 30s• China: ↑ Mid 50s
• Rest of APAC: ↓ Mid Single Digits
Sustainable Innovation in Action
Capturing Biogas for Conversion and Reuse
• Acquired in 2017, LeROI gas compressors utilized to capture biogas emitted
from landfills, dairy and wastewater applications
• Unique design handles full range of harsh gases, including hydrogen sulfide and
carbon dioxide, which enables customers to capture biogas
• Methane cleaned from biogas and used for power generation, vehicle fueling and
pipeline reinjection
240 million
Cubic feet of biogas
captured in next 2 years
50%
Captured gas converted
to pipeline quality gas
25,000 units
Installed base
11
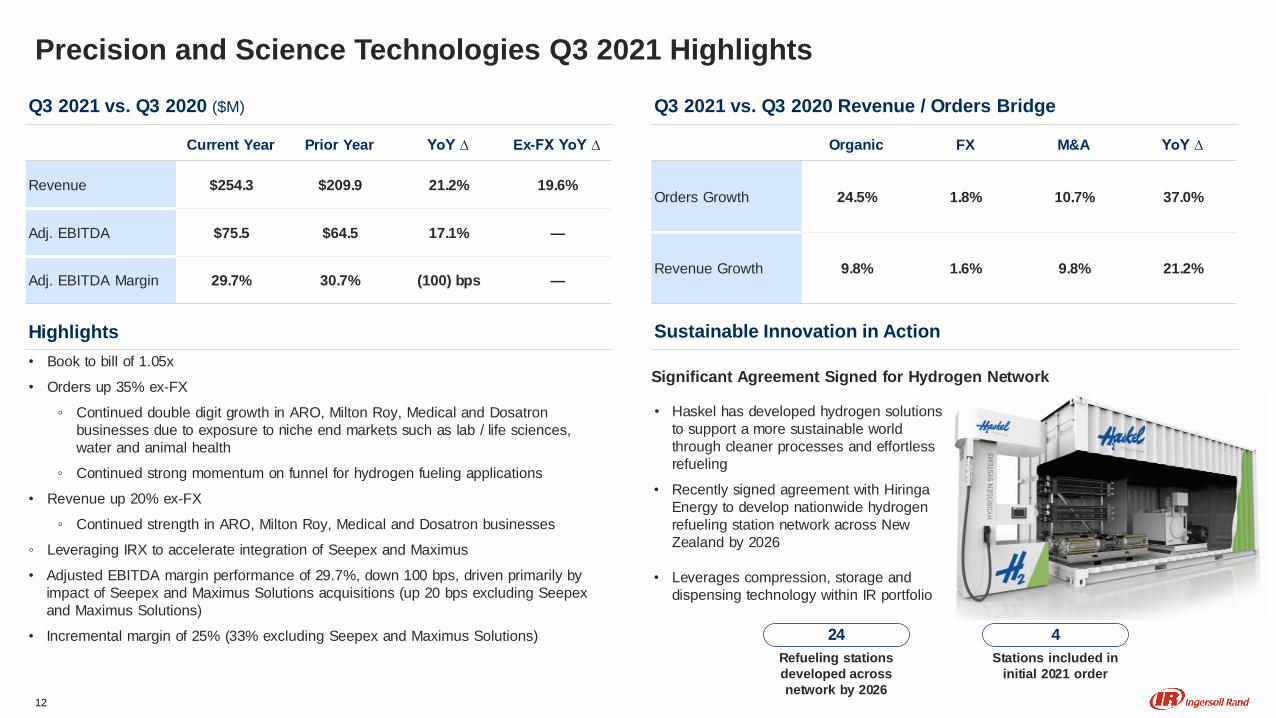
Precision and Science Technologies Q3 2021 Highlights
Current Year Prior Year YoY ∆ Ex-FX YoY ∆
Revenue $254.3 $209.9 21.2% 19.6%
Adj. EBITDA $75.5 $64.5 17.1% —
Adj. EBITDA Margin 29.7% 30.7% (100) bps —
Q3 2021 vs. Q3 2020 Revenue / Orders Bridge
Organic FX M&A YoY ∆
Orders Growth 24.5% 1.8% 10.7% 37.0%
Revenue Growth 9.8% 1.6% 9.8% 21.2%
Q3 2021 vs. Q3 2020 ($M)
Highlights
• Book to bill of 1.05x
• Orders up 35% ex-FX
◦ Continued double digit growth in ARO, Milton Roy, Medical and Dosatron
businesses due to exposure to niche end markets such as lab / life sciences,
water and animal health
◦ Continued strong momentum on funnel for hydrogen fueling applications
• Revenue up 20% ex-FX
◦ Continued strength in ARO, Milton Roy, Medical and Dosatron businesses
◦ Leveraging IRX to accelerate integration of Seepex and Maximus
• Adjusted EBITDA margin performance of 29.7%, down 100 bps, driven primarily by
impact of Seepex and Maximus Solutions acquisitions (up 20 bps excluding Seepex
and Maximus Solutions)
• Incremental margin of 25% (33% excluding Seepex and Maximus Solutions)
Sustainable Innovation in Action
4
Stations included in
initial 2021 order
• Haskel has developed hydrogen solutions
to support a more sustainable world
through cleaner processes and effortless
refueling
• Recently signed agreement with Hiringa
Energy to develop nationwide hydrogen
refueling station network across New
Zealand by 2026
• Leverages compression, storage and
dispensing technology within IR portfolio
Significant Agreement Signed for Hydrogen Network
24
Refueling stations
developed across
network by 202612

Prior (as of 7/29/21) Revised (as of 11/3/21)
Revenue
Growth1
Adjusted
EBITDA²
Revenue
Growth1
Adjusted
EBITDA²
Total Mid Teens $1,150M - $1,180M High Teens $1,175M - $1,195M
Organic
(Before FX & M&A):LDD - LDD -
Industrial Technologies
& ServicesLDD - LDD -
Precision & Science
TechnologiesLDD - LDD -
FX Impact3 LSD (~3%) - LSD (~3%) -
M&A4 ~$60M - ~$135M -
Raising 2021 Guidance
Increasing Guidance: Up ~100 bps Organic Revenue Growth; Up ~$20M Adj. EBITDA
1 All revenue outlook commentary expressed in percentages and based on growth as compared to 2020 (except where otherwise noted).2 Non-GAAP measure (definitions and/or reconciliations in appendix). 3 Based on June 2021 FX rates for prior guidance and September 2021 FX rates for revised guidance.4 Prior guidance includes Tuthill (M-D Kinney) only. Current guidance includes Tuthill (M-D Kinney), Maximus Solutions, Seepex, Air Dimensions and Lawrence Factor.
• Guidance does not include
divested businesses (HPS, SVT)
nor pending acquisition of Tuthill
Pumps
• Guidance does include following
acquisitions (acq. closing date):
• Tuthill (M-D Kinney) (1/31/21)
• Maximus Solutions (7/30/21)
• Seepex (8/31/21)
• Air Dimensions (10/29/21)
• Lawrence Factor (11/1/2021)
• Adj. FCF to Adj. Net Income
Conversion²: ≥ 100%
• Capex: ~1.5% of Revenue
• Adj. Tax Rate: Mid Teens
Other Assumptions
13

Virtual Investor Day
Save the Date
Thursday
November 18th
8:00 am – 12:00 pm ET
Link to calendar invite available at https://investors.irco.com/events-and-presentations/
14
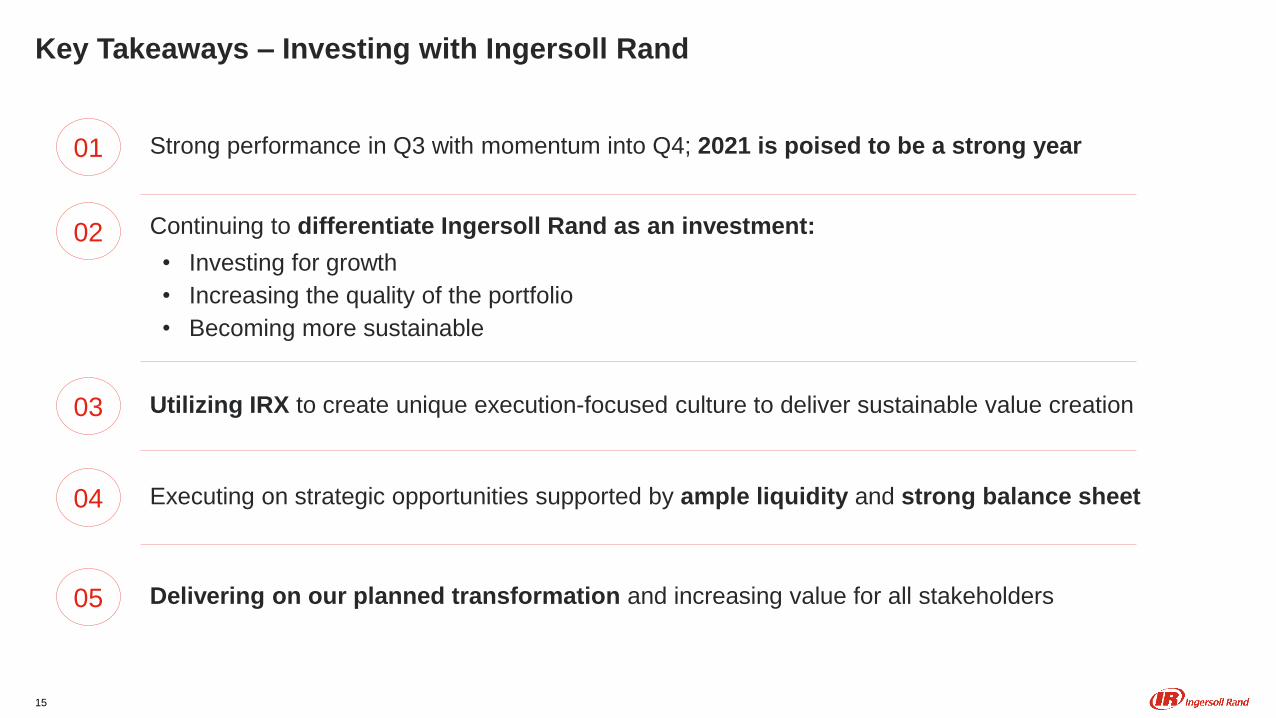
Key Takeaways – Investing with Ingersoll Rand
01 Strong performance in Q3 with momentum into Q4; 2021 is poised to be a strong year
02 Continuing to differentiate Ingersoll Rand as an investment:
• Investing for growth
• Increasing the quality of the portfolio
• Becoming more sustainable
05 Delivering on our planned transformation and increasing value for all stakeholders
03 Utilizing IRX to create unique execution-focused culture to deliver sustainable value creation
04 Executing on strategic opportunities supported by ample liquidity and strong balance sheet
15

Appendix
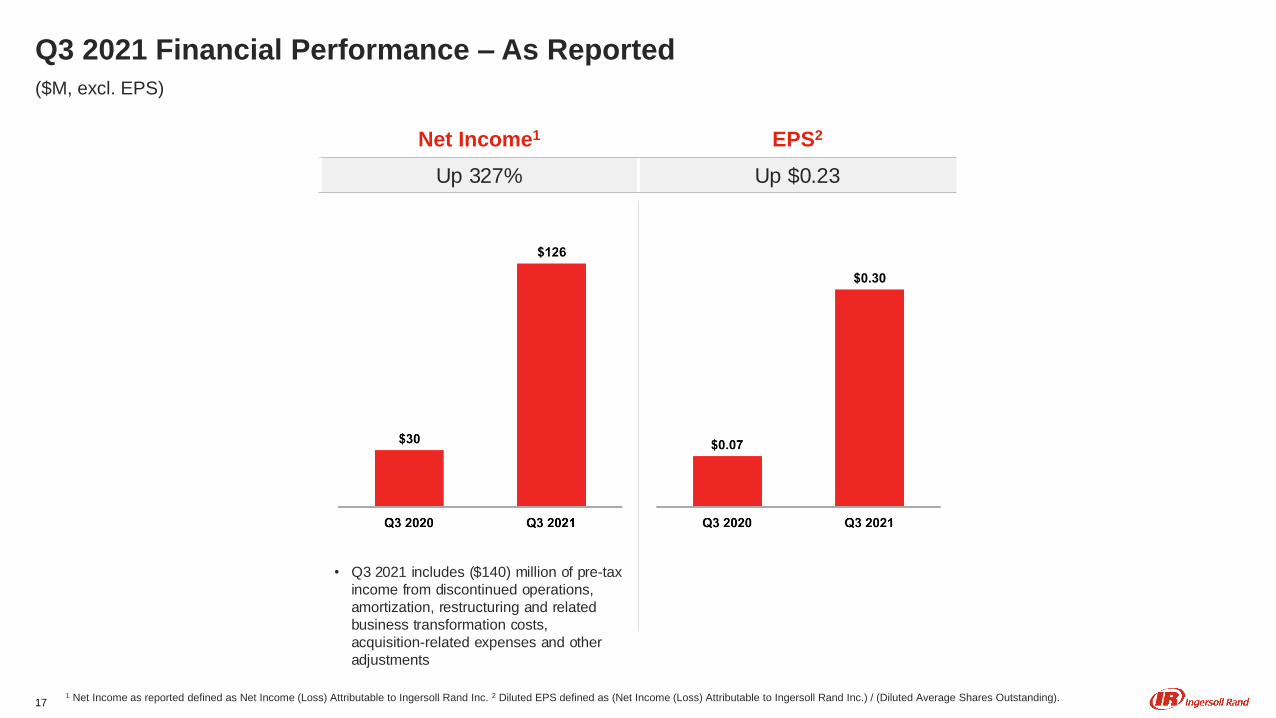
Q3 2021 Financial Performance – As Reported
Net Income1 EPS2
Up 327% Up $0.23
($M, excl. EPS)
• Q3 2021 includes ($140) million of pre-tax
income from discontinued operations,
amortization, restructuring and related
business transformation costs,
acquisition-related expenses and other
adjustments
1 Net Income as reported defined as Net Income (Loss) Attributable to Ingersoll Rand Inc. 2 Diluted EPS defined as (Net Income (Loss) Attributable to Ingersoll Rand Inc.) / (Diluted Average Shares Outstanding).17
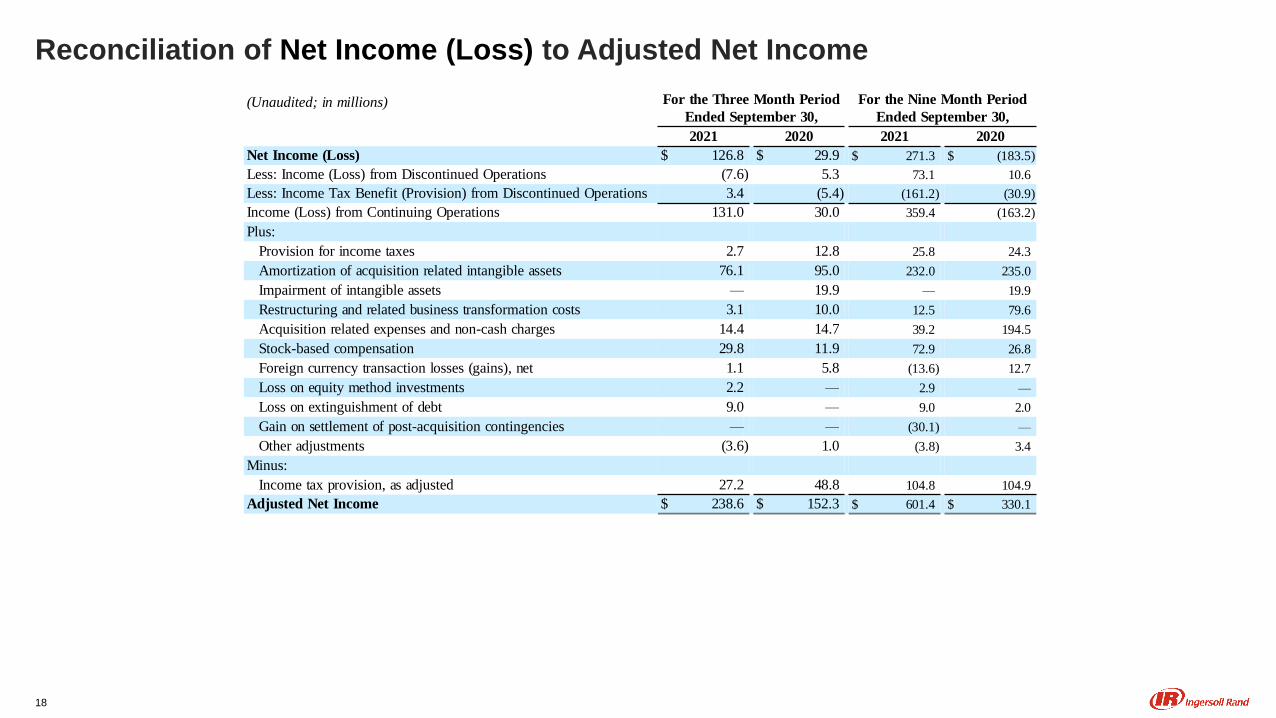
Reconciliation of Net Income (Loss) to Adjusted Net Income
(Unaudited; in millions) For the Three Month Period
Ended September 30,
For the Nine Month Period
Ended September 30,
2021 2020 2021 2020
Net Income (Loss) $ 126.8 $ 29.9 $ 271.3 $ (183.5)
Less: Income (Loss) from Discontinued Operations (7.6) 5.3 73.1 10.6
Less: Income Tax Benefit (Provision) from Discontinued Operations 3.4 (5.4) (161.2) (30.9)
Income (Loss) from Continuing Operations 131.0 30.0 359.4 (163.2)
Plus:
Provision for income taxes 2.7 12.8 25.8 24.3
Amortization of acquisition related intangible assets 76.1 95.0 232.0 235.0
Impairment of intangible assets — 19.9 — 19.9
Restructuring and related business transformation costs 3.1 10.0 12.5 79.6
Acquisition related expenses and non-cash charges 14.4 14.7 39.2 194.5
Stock-based compensation 29.8 11.9 72.9 26.8
Foreign currency transaction losses (gains), net 1.1 5.8 (13.6) 12.7
Loss on equity method investments 2.2 — 2.9 —
Loss on extinguishment of debt 9.0 — 9.0 2.0
Gain on settlement of post-acquisition contingencies — — (30.1) —
Other adjustments (3.6) 1.0 (3.8) 3.4
Minus:
Income tax provision, as adjusted 27.2 48.8 104.8 104.9
Adjusted Net Income $ 238.6 $ 152.3 $ 601.4 $ 330.1
18
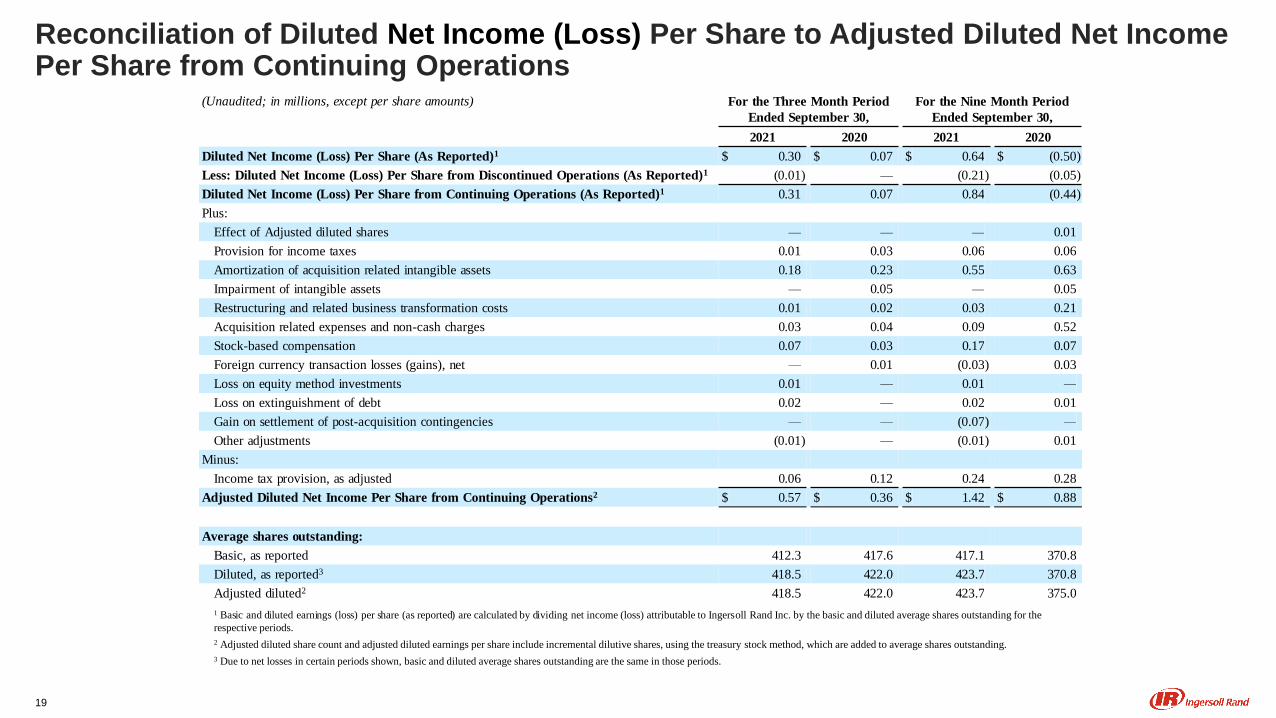
Reconciliation of Diluted Net Income (Loss) Per Share to Adjusted Diluted Net Income Per Share from Continuing Operations
(Unaudited; in millions, except per share amounts) For the Three Month Period
Ended September 30,
For the Nine Month Period
Ended September 30,
2021 2020 2021 2020
Diluted Net Income (Loss) Per Share (As Reported)1 $ 0.30 $ 0.07 $ 0.64 $ (0.50)
Less: Diluted Net Income (Loss) Per Share from Discontinued Operations (As Reported)1 (0.01) — (0.21) (0.05)
Diluted Net Income (Loss) Per Share from Continuing Operations (As Reported)1 0.31 0.07 0.84 (0.44)
Plus:
Effect of Adjusted diluted shares — — — 0.01
Provision for income taxes 0.01 0.03 0.06 0.06
Amortization of acquisition related intangible assets 0.18 0.23 0.55 0.63
Impairment of intangible assets — 0.05 — 0.05
Restructuring and related business transformation costs 0.01 0.02 0.03 0.21
Acquisition related expenses and non-cash charges 0.03 0.04 0.09 0.52
Stock-based compensation 0.07 0.03 0.17 0.07
Foreign currency transaction losses (gains), net — 0.01 (0.03) 0.03
Loss on equity method investments 0.01 — 0.01 —
Loss on extinguishment of debt 0.02 — 0.02 0.01
Gain on settlement of post-acquisition contingencies — — (0.07) —
Other adjustments (0.01) — (0.01) 0.01
Minus:
Income tax provision, as adjusted 0.06 0.12 0.24 0.28
Adjusted Diluted Net Income Per Share from Continuing Operations2 $ 0.57 $ 0.36 $ 1.42 $ 0.88
Average shares outstanding:
Basic, as reported 412.3 417.6 417.1 370.8
Diluted, as reported3 418.5 422.0 423.7 370.8
Adjusted diluted2 418.5 422.0 423.7 375.0
1 Basic and diluted earnings (loss) per share (as reported) are calculated by dividing net income (loss) attributable to Ingersoll Rand Inc. by the basic and diluted average shares outstanding for the
respective periods.
2 Adjusted diluted share count and adjusted diluted earnings per share include incremental dilutive shares, using the treasury stock method, which are added to average shares outstanding.
3 Due to net losses in certain periods shown, basic and diluted average shares outstanding are the same in those periods.
19
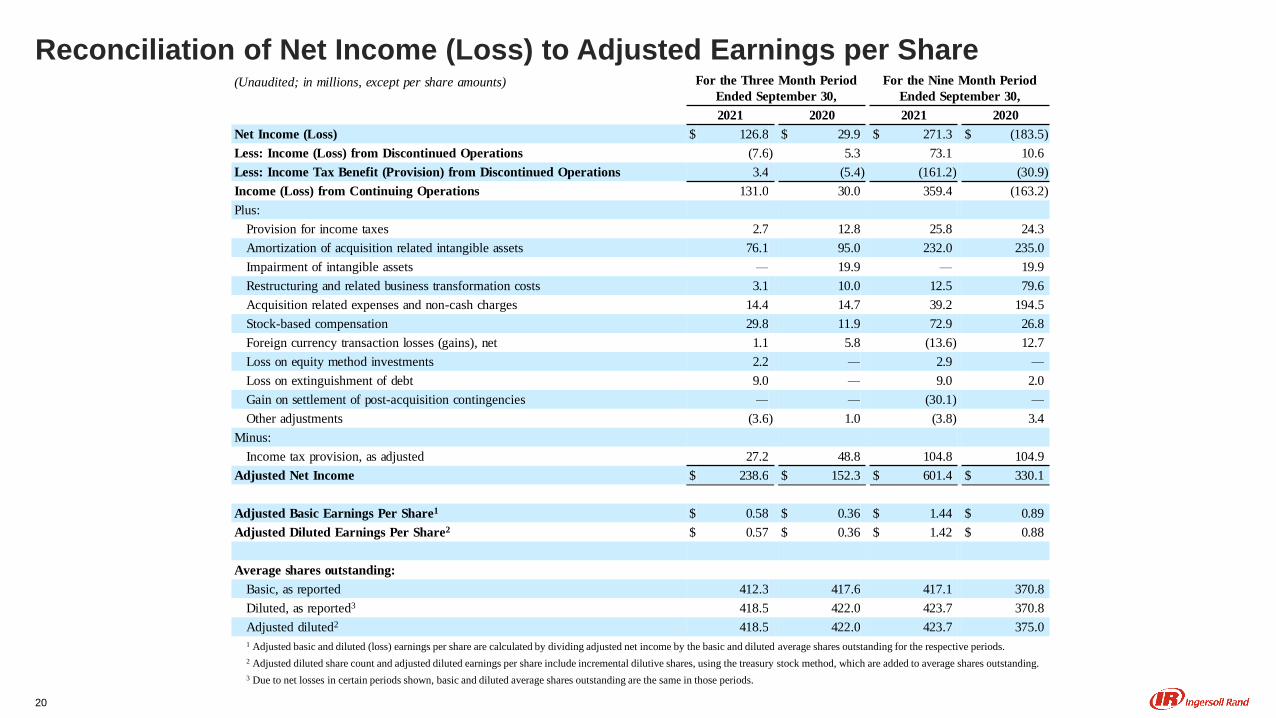
Reconciliation of Net Income (Loss) to Adjusted Earnings per Share(Unaudited; in millions, except per share amounts) For the Three Month Period
Ended September 30,
For the Nine Month Period
Ended September 30,
2021 2020 2021 2020
Net Income (Loss) $ 126.8 $ 29.9 $ 271.3 $ (183.5)
Less: Income (Loss) from Discontinued Operations (7.6) 5.3 73.1 10.6
Less: Income Tax Benefit (Provision) from Discontinued Operations 3.4 (5.4) (161.2) (30.9)
Income (Loss) from Continuing Operations 131.0 30.0 359.4 (163.2)
Plus:
Provision for income taxes 2.7 12.8 25.8 24.3
Amortization of acquisition related intangible assets 76.1 95.0 232.0 235.0
Impairment of intangible assets — 19.9 — 19.9
Restructuring and related business transformation costs 3.1 10.0 12.5 79.6
Acquisition related expenses and non-cash charges 14.4 14.7 39.2 194.5
Stock-based compensation 29.8 11.9 72.9 26.8
Foreign currency transaction losses (gains), net 1.1 5.8 (13.6) 12.7
Loss on equity method investments 2.2 — 2.9 —
Loss on extinguishment of debt 9.0 — 9.0 2.0
Gain on settlement of post-acquisition contingencies — — (30.1) —
Other adjustments (3.6) 1.0 (3.8) 3.4
Minus:
Income tax provision, as adjusted 27.2 48.8 104.8 104.9
Adjusted Net Income $ 238.6 $ 152.3 $ 601.4 $ 330.1
Adjusted Basic Earnings Per Share1 $ 0.58 $ 0.36 $ 1.44 $ 0.89
Adjusted Diluted Earnings Per Share2 $ 0.57 $ 0.36 $ 1.42 $ 0.88
Average shares outstanding:
Basic, as reported 412.3 417.6 417.1 370.8
Diluted, as reported3 418.5 422.0 423.7 370.8
Adjusted diluted2 418.5 422.0 423.7 375.0
1 Adjusted basic and diluted (loss) earnings per share are calculated by dividing adjusted net income by the basic and diluted average shares outstanding for the respective periods.
2 Adjusted diluted share count and adjusted diluted earnings per share include incremental dilutive shares, using the treasury stock method, which are added to average shares outstanding.
3 Due to net losses in certain periods shown, basic and diluted average shares outstanding are the same in those periods.
20
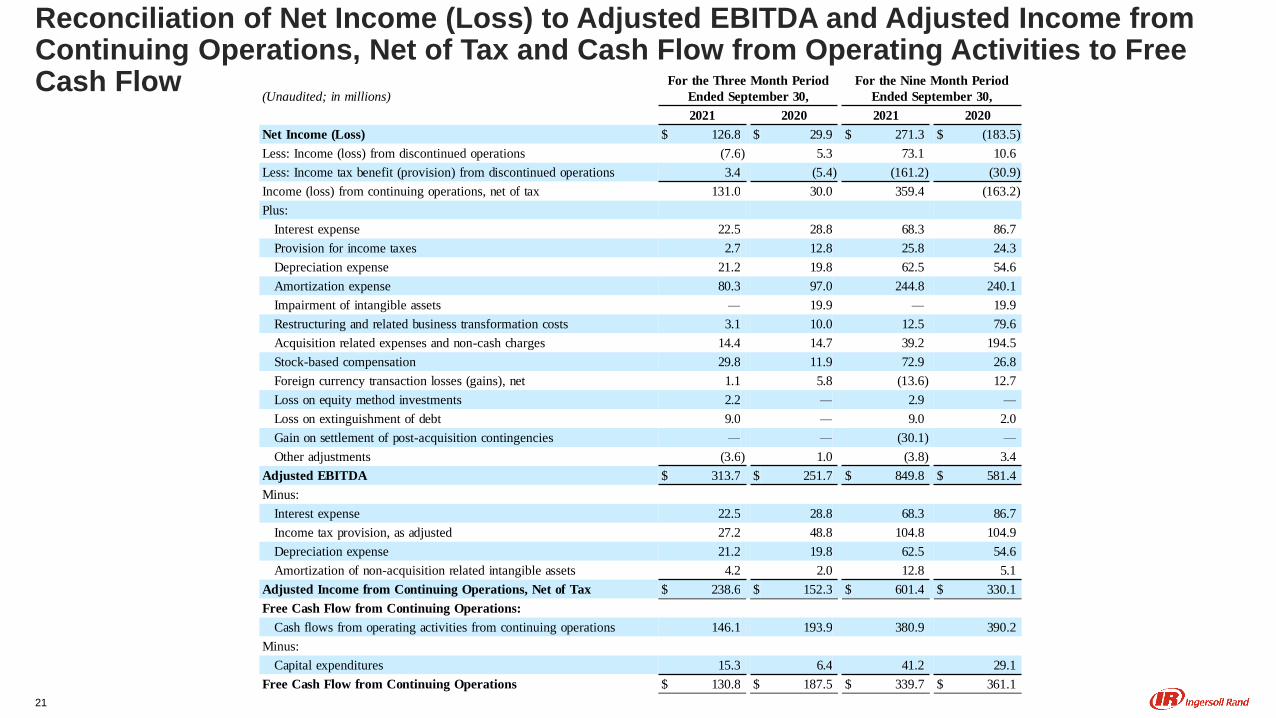
Reconciliation of Net Income (Loss) to Adjusted EBITDA and Adjusted Income from Continuing Operations, Net of Tax and Cash Flow from Operating Activities to Free Cash Flow
21
(Unaudited; in millions)
For the Three Month Period
Ended September 30,
For the Nine Month Period
Ended September 30,
2021 2020 2021 2020
Net Income (Loss) $ 126.8 $ 29.9 $ 271.3 $ (183.5)
Less: Income (loss) from discontinued operations (7.6) 5.3 73.1 10.6
Less: Income tax benefit (provision) from discontinued operations 3.4 (5.4) (161.2) (30.9)
Income (loss) from continuing operations, net of tax 131.0 30.0 359.4 (163.2)
Plus:
Interest expense 22.5 28.8 68.3 86.7
Provision for income taxes 2.7 12.8 25.8 24.3
Depreciation expense 21.2 19.8 62.5 54.6
Amortization expense 80.3 97.0 244.8 240.1
Impairment of intangible assets — 19.9 — 19.9
Restructuring and related business transformation costs 3.1 10.0 12.5 79.6
Acquisition related expenses and non-cash charges 14.4 14.7 39.2 194.5
Stock-based compensation 29.8 11.9 72.9 26.8
Foreign currency transaction losses (gains), net 1.1 5.8 (13.6) 12.7
Loss on equity method investments 2.2 — 2.9 —
Loss on extinguishment of debt 9.0 — 9.0 2.0
Gain on settlement of post-acquisition contingencies — — (30.1) —
Other adjustments (3.6) 1.0 (3.8) 3.4
Adjusted EBITDA $ 313.7 $ 251.7 $ 849.8 $ 581.4
Minus:
Interest expense 22.5 28.8 68.3 86.7
Income tax provision, as adjusted 27.2 48.8 104.8 104.9
Depreciation expense 21.2 19.8 62.5 54.6
Amortization of non-acquisition related intangible assets 4.2 2.0 12.8 5.1
Adjusted Income from Continuing Operations, Net of Tax $ 238.6 $ 152.3 $ 601.4 $ 330.1
Free Cash Flow from Continuing Operations:
Cash flows from operating activities from continuing operations 146.1 193.9 380.9 390.2
Minus:
Capital expenditures 15.3 6.4 41.2 29.1
Free Cash Flow from Continuing Operations $ 130.8 $ 187.5 $ 339.7 $ 361.1
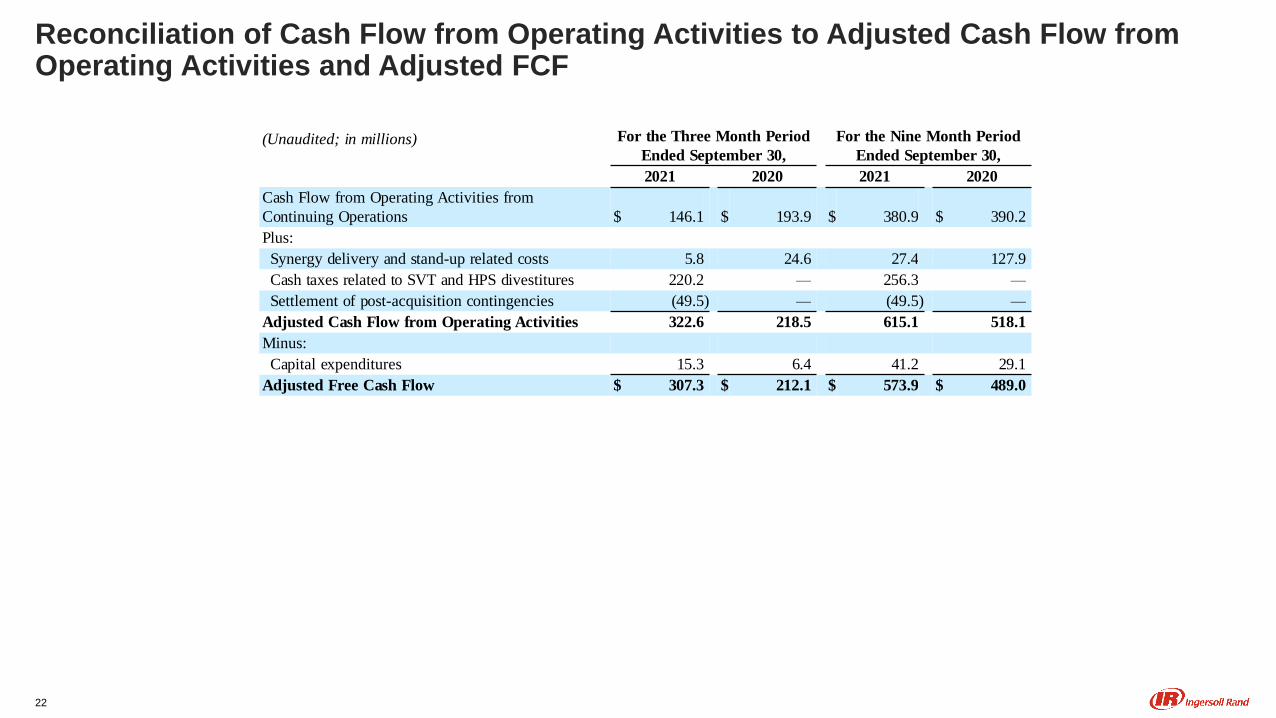
Reconciliation of Cash Flow from Operating Activities to Adjusted Cash Flow from Operating Activities and Adjusted FCF
22
(Unaudited; in millions) For the Three Month Period
Ended September 30,
For the Nine Month Period
Ended September 30,
2021 2020 2021 2020
Cash Flow from Operating Activities from
Continuing Operations $ 146.1 $ 193.9 $ 380.9 $ 390.2
Plus:
Synergy delivery and stand-up related costs 5.8 24.6 27.4 127.9
Cash taxes related to SVT and HPS divestitures 220.2 — 256.3 —
Settlement of post-acquisition contingencies (49.5) — (49.5) —
Adjusted Cash Flow from Operating Activities 322.6 218.5 615.1 518.1
Minus:
Capital expenditures 15.3 6.4 41.2 29.1
Adjusted Free Cash Flow $ 307.3 $ 212.1 $ 573.9 $ 489.0
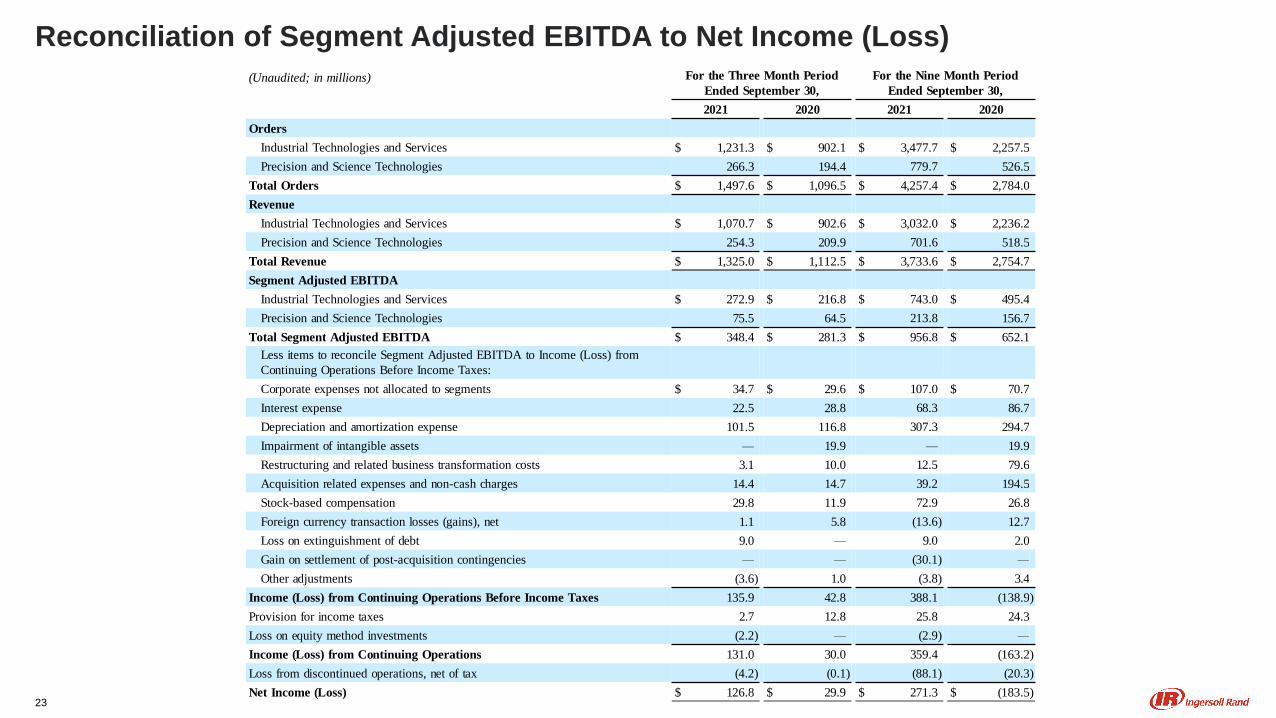
Reconciliation of Segment Adjusted EBITDA to Net Income (Loss)
23
(Unaudited; in millions) For the Three Month Period
Ended September 30,
For the Nine Month Period
Ended September 30,
2021 2020 2021 2020
Orders
Industrial Technologies and Services $ 1,231.3 $ 902.1 $ 3,477.7 $ 2,257.5
Precision and Science Technologies 266.3 194.4 779.7 526.5
Total Orders $ 1,497.6 $ 1,096.5 $ 4,257.4 $ 2,784.0
Revenue
Industrial Technologies and Services $ 1,070.7 $ 902.6 $ 3,032.0 $ 2,236.2
Precision and Science Technologies 254.3 209.9 701.6 518.5
Total Revenue $ 1,325.0 $ 1,112.5 $ 3,733.6 $ 2,754.7
Segment Adjusted EBITDA
Industrial Technologies and Services $ 272.9 $ 216.8 $ 743.0 $ 495.4
Precision and Science Technologies 75.5 64.5 213.8 156.7
Total Segment Adjusted EBITDA $ 348.4 $ 281.3 $ 956.8 $ 652.1
Less items to reconcile Segment Adjusted EBITDA to Income (Loss) from
Continuing Operations Before Income Taxes:
Corporate expenses not allocated to segments $ 34.7 $ 29.6 $ 107.0 $ 70.7
Interest expense 22.5 28.8 68.3 86.7
Depreciation and amortization expense 101.5 116.8 307.3 294.7
Impairment of intangible assets — 19.9 — 19.9
Restructuring and related business transformation costs 3.1 10.0 12.5 79.6
Acquisition related expenses and non-cash charges 14.4 14.7 39.2 194.5
Stock-based compensation 29.8 11.9 72.9 26.8
Foreign currency transaction losses (gains), net 1.1 5.8 (13.6) 12.7
Loss on extinguishment of debt 9.0 — 9.0 2.0
Gain on settlement of post-acquisition contingencies — — (30.1) —
Other adjustments (3.6) 1.0 (3.8) 3.4
Income (Loss) from Continuing Operations Before Income Taxes 135.9 42.8 388.1 (138.9)
Provision for income taxes 2.7 12.8 25.8 24.3
Loss on equity method investments (2.2) — (2.9) —
Income (Loss) from Continuing Operations 131.0 30.0 359.4 (163.2)
Loss from discontinued operations, net of tax (4.2) (0.1) (88.1) (20.3)
Net Income (Loss) $ 126.8 $ 29.9 $ 271.3 $ (183.5)
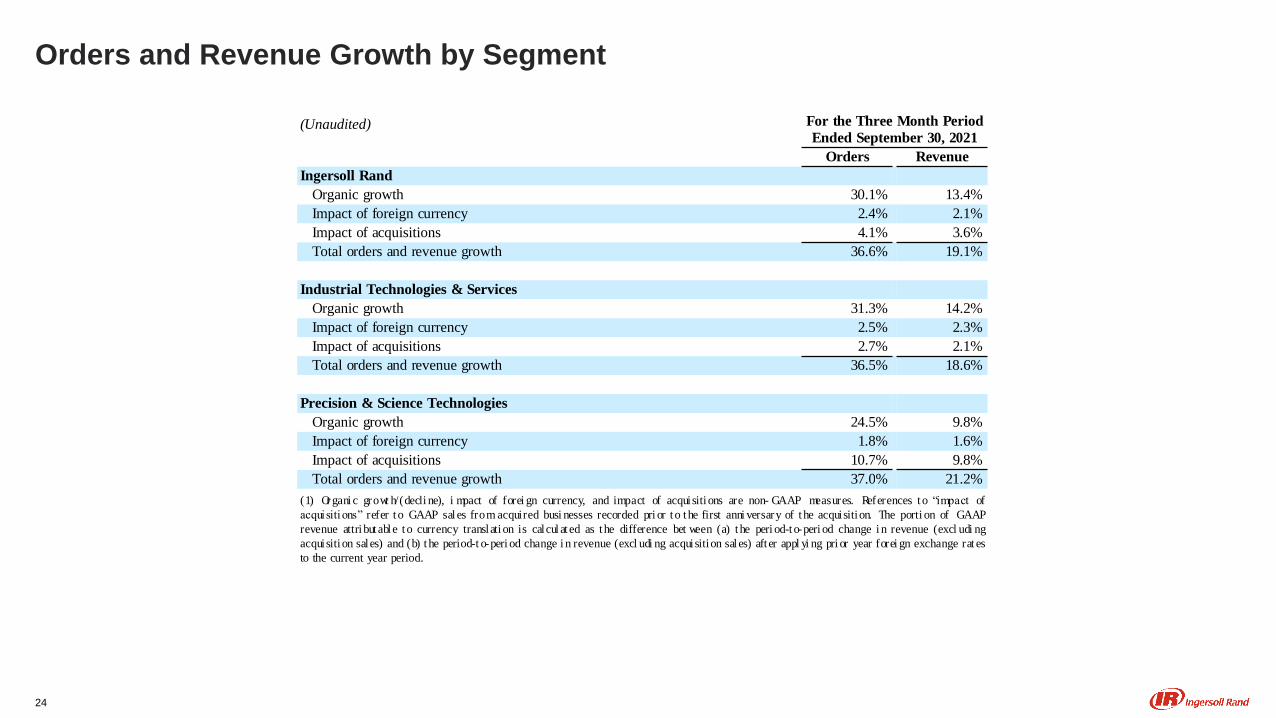
Orders and Revenue Growth by Segment
24
(Unaudited) For the Three Month Period
Ended September 30, 2021
Orders Revenue
Ingersoll Rand
Organic growth 30.1% 13.4%
Impact of foreign currency 2.4% 2.1%
Impact of acquisitions 4.1% 3.6%
Total orders and revenue growth 36.6% 19.1%
Industrial Technologies & Services
Organic growth 31.3% 14.2%
Impact of foreign currency 2.5% 2.3%
Impact of acquisitions 2.7% 2.1%
Total orders and revenue growth 36.5% 18.6%
Precision & Science Technologies
Organic growth 24.5% 9.8%
Impact of foreign currency 1.8% 1.6%
Impact of acquisitions 10.7% 9.8%
Total orders and revenue growth 37.0% 21.2%
(1) Or gani c growt h/(decli ne), i mpact of forei gn currency, and impact of acquisiti ons are non- GAAP measures. References to “impact of
acquisiti ons” refer to GAAP sales from acquired busi nesses recorded pri or to the first anni versary of the acquisition. The porti on of GAAP
revenue attri butable to currency translation is calcul at ed as the difference bet ween (a) the peri od-to-peri od change i n revenue (excl udi ng
acquisiti on sales) and (b) the period-t o-peri od change i n revenue (excl udi ng acquisition sal es) after appl yi ng pri or year forei gn exchange rat es
to the current year period.