High-speed spelling with a noninvasivebrain–computer interfaceXiaogang Chena,1, Yijun Wangb,c,1,2, Masaki Nakanishib, Xiaorong Gaoa,2, Tzyy-Ping Jungb, and Shangkai Gaoa
aDepartment of Biomedical Engineering, Tsinghua University, Beijing 100084, China; bSwartz Center for Computational Neuroscience, University ofCalifornia, San Diego, CA 92093; and cState Key Laboratory on Integrated Optoelectronics, Institute of Semiconductors, Chinese Academy of Sciences,Beijing 100083, China
Edited by Terrence J. Sejnowski, Salk Institute for Biological Studies, La Jolla, CA, and approved September 16, 2015 (received for review April 24, 2015)
The past 20 years have witnessed unprecedented progress in brain–computer interfaces (BCIs). However, low communication rates re-main key obstacles to BCI-based communication in humans. Thisstudy presents an electroencephalogram-based BCI speller that canachieve information transfer rates (ITRs) up to 5.32 bits per second,the highest ITRs reported in BCI spellers using either noninvasive orinvasive methods. Based on extremely high consistency of frequencyand phase observed between visual flickering signals and the elicitedsingle-trial steady-state visual evoked potentials, this study devel-oped a synchronous modulation and demodulation paradigm toimplement the speller. Specifically, this study proposed a new jointfrequency-phase modulation method to tag 40 characters with 0.5-s-long flickering signals and developed a user-specific target identi-fication algorithm using individual calibration data. The spellerachieved high ITRs in online spelling tasks. This study demonstratesthat BCIs can provide a truly naturalistic high-speed communicationchannel using noninvasively recorded brain activities.
brain–computer interface | electroencephalogram | steady-state visualevoked potentials | joint frequency-phase modulation
Brain–computer interfaces (BCIs), which can provide a newcommunication channel to humans, have received increasing
attention in recent years (1, 2). Among various applications, BCIspellers (3–9) are especially valuable because they can help pa-tients with severe motor disabilities (e.g., amyotrophic lateralsclerosis, stroke, and spinal cord injury) communicate with otherpeople. Currently, electroencephalogram (EEG) is the mostpopular method of implementing BCI spellers due to its non-invasiveness, simple operation, and relatively low cost. However,low signal-to-noise ratio (SNR) of the scalp-recorded EEG sig-nals and lack of computationally efficient solutions in EEGmodeling limit the information transfer rates (ITRs) of EEG-based BCI spellers to ∼1.0 bits per second (bps) (1, 4). For ex-ample, the well-known P300 speller proposed by Farwell andDonchin (5) can spell up to five letters per minute (∼0.5 bps).Until recently few studies using visual evoked potentials (VEPs)demonstrated higher ITRs of 1.7–2.4 bps (6, 7). In contrast, theinvasive BCI spellers in humans and monkeys show higher per-formance. For example, the P300 speller with electrocorticogramrecordings obtained a peak ITR of 1.9 bps in a human subject(8). A recent monkey study on keyboard neural prosthesis usingmultineuron recordings reported an ITR up to 3.5 bps (9). Al-though communication speed of the EEG-based spellers hasbeen significantly improved in the past decade (4), it still remainsa key obstacle to real-life applications in humans.Recently, the BCI speller using steady-state VEPs (SSVEPs)
has attracted increasing attention due to its high communicationrate and little user training (4, 10, 11). An SSVEP speller typi-cally uses SSVEPs to detect the user’s gaze direction to a targetcharacter (10). Although the SSVEP speller has achieved rela-tively high ITRs (e.g., 1.7 bps in ref. 6), the ultimate performancelimit still remains unknown. In principle, the theoretical per-formance limit of the SSVEP speller highly depends on temporalcoding precision in the visual pathway, which can be reflected by
visual latency in SSVEPs [i.e., apparent latency (12)]. Previousstudies show that grand-average SSVEPs can accurately encodethe frequency and phase of the stimulation signals, showing aconstant latency across different stimulation frequencies (12).However, visual latencies in single-trial SSVEPs, especially whenthe stimulation duration is short (e.g., 0.5 s), are generally dif-ficult to quantify due to the interference from spontaneous EEGactivities. Here we hypothesize that the visual latency of single-trial SSVEPs, which represent activities of neuronal populationsover the stimulation time, can be very stable across trials. If thisis true, frequency and phase of the stimulation signals can beprecisely encoded in single-trial SSVEPs. Much better perfor-mance can be expected in the SSVEP speller using a synchro-nous modulation and demodulation paradigm, which has beenwidely used in telecommunications (13).The goal of this study is to implement a high-speed BCI speller
using SSVEPs. Based on the assumption of a stable visual latencyin single-trial SSVEPs, this study proposed a new joint frequency-phase modulation (JFPM) method to enhance the discriminabilitybetween SSVEPs with a very narrow frequency range, the mostchallenging conditions in frequency coding (10). To address thedifficulty in parameter selection due to nonlinearity [i.e., SSVEPharmonics (14)], a data-driven grid-search method was developedto optimize stimulation duration and phase interval in the JFPMmethod. Considering individual difference of visual latency in targetidentification, this study adopted an improved user-specific decod-ing algorithm that incorporated individual SSVEP calibration datain feature extraction. In addition, a filter bank analysis method was
Significance
Brain–computer interface (BCI) technology provides a new com-munication channel. However, current applications have beenseverely limited by low communication speed. This study reportsa noninvasive brain speller that achieved a multifold increase ininformation transfer rate compared with other existing systems.Based on extremely precise coding of frequency and phase insingle-trial steady-state visual evoked potentials, this studydeveloped a new joint frequency-phase modulation methodand a user-specific decoding algorithm to implement syn-chronous modulation and demodulation of electroencephalo-grams. The resulting speller obtained high spelling rates up to 60characters (∼12 words) per minute. The proposedmethodologicalframework of high-speed BCI can lead to numerous applicationsin both patients with motor disabilities and healthy people.
Author contributions: Y.W. and X.G. designed research; X.C. and Y.W. performed re-search; X.C., Y.W., and M.N. analyzed data; and X.C., Y.W., M.N., X.G., T.-P.J., and S.G.wrote the paper.
The authors declare no conflict of interest.
This article is a PNAS Direct Submission.1X.C. and Y.W. contributed equally to this work.2To whom correspondence may be addressed. Email: [email protected] or [email protected].
This article contains supporting information online at www.pnas.org/lookup/suppl/doi:10.1073/pnas.1508080112/-/DCSupplemental.
E6058–E6067 | PNAS | Published online October 19, 2015 www.pnas.org/cgi/doi/10.1073/pnas.1508080112
developed to extract additional features from the harmonic SSVEPcomponents. Together, these methods resulted in a high-speed BCIspeller (up to 60 characters per minute) in multiple online spellingtasks. The methodological framework of the proposed high-speedBCI technology will potentially lead to a truly practical and natu-ralistic high-speed communication channel for patients with motordisabilities and healthy people.
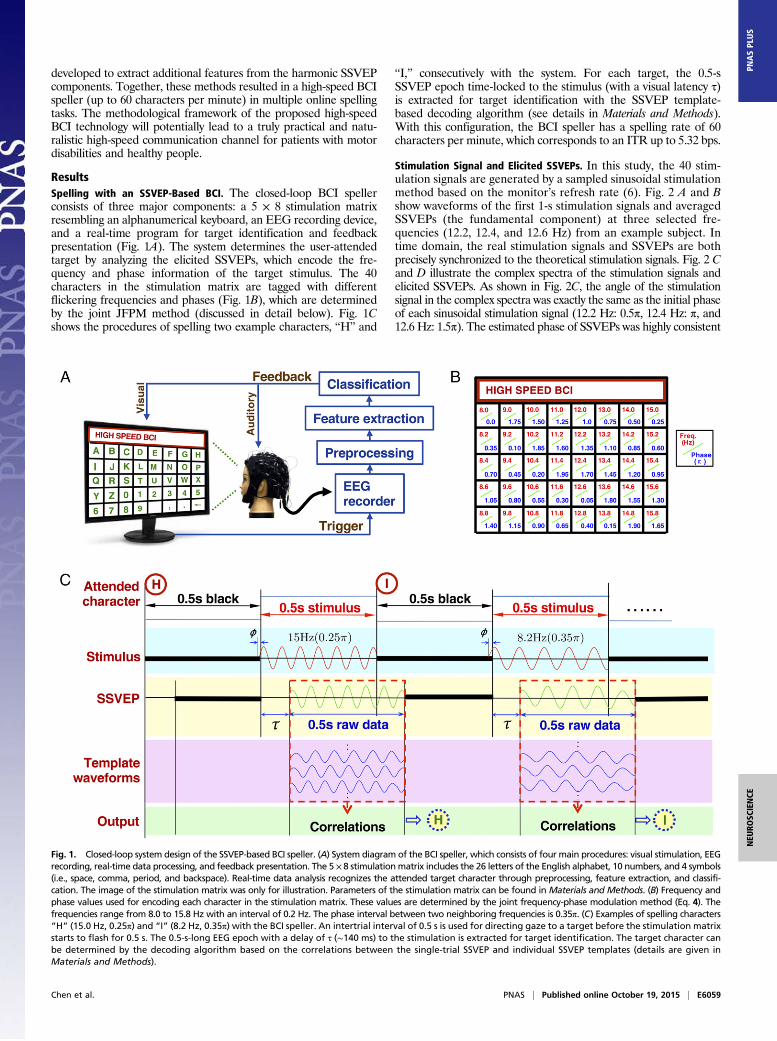
ResultsSpelling with an SSVEP-Based BCI. The closed-loop BCI spellerconsists of three major components: a 5 × 8 stimulation matrixresembling an alphanumerical keyboard, an EEG recording device,and a real-time program for target identification and feedbackpresentation (Fig. 1A). The system determines the user-attendedtarget by analyzing the elicited SSVEPs, which encode the fre-quency and phase information of the target stimulus. The 40characters in the stimulation matrix are tagged with differentflickering frequencies and phases (Fig. 1B), which are determinedby the joint JFPM method (discussed in detail below). Fig. 1Cshows the procedures of spelling two example characters, “H” and
“I,” consecutively with the system. For each target, the 0.5-sSSVEP epoch time-locked to the stimulus (with a visual latency τ)is extracted for target identification with the SSVEP template-based decoding algorithm (see details in Materials and Methods).With this configuration, the BCI speller has a spelling rate of 60characters per minute, which corresponds to an ITR up to 5.32 bps.
Stimulation Signal and Elicited SSVEPs. In this study, the 40 stim-ulation signals are generated by a sampled sinusoidal stimulationmethod based on the monitor’s refresh rate (6). Fig. 2 A and Bshow waveforms of the first 1-s stimulation signals and averagedSSVEPs (the fundamental component) at three selected fre-quencies (12.2, 12.4, and 12.6 Hz) from an example subject. Intime domain, the real stimulation signals and SSVEPs are bothprecisely synchronized to the theoretical stimulation signals. Fig. 2 Cand D illustrate the complex spectra of the stimulation signals andelicited SSVEPs. As shown in Fig. 2C, the angle of the stimulationsignal in the complex spectra was exactly the same as the initial phaseof each sinusoidal stimulation signal (12.2 Hz: 0.5π, 12.4 Hz: π, and12.6 Hz: 1.5π). The estimated phase of SSVEPs was highly consistent
Fig. 1. Closed-loop system design of the SSVEP-based BCI speller. (A) System diagram of the BCI speller, which consists of four main procedures: visual stimulation, EEGrecording, real-time data processing, and feedback presentation. The 5 × 8 stimulationmatrix includes the 26 letters of the English alphabet, 10 numbers, and 4 symbols(i.e., space, comma, period, and backspace). Real-time data analysis recognizes the attended target character through preprocessing, feature extraction, and classifi-cation. The image of the stimulation matrix was only for illustration. Parameters of the stimulation matrix can be found in Materials and Methods. (B) Frequency andphase values used for encoding each character in the stimulation matrix. These values are determined by the joint frequency-phase modulation method (Eq. 4). Thefrequencies range from 8.0 to 15.8 Hz with an interval of 0.2 Hz. The phase interval between two neighboring frequencies is 0.35π. (C) Examples of spelling characters“H” (15.0 Hz, 0.25π) and “I” (8.2 Hz, 0.35π) with the BCI speller. An intertrial interval of 0.5 s is used for directing gaze to a target before the stimulation matrixstarts to flash for 0.5 s. The 0.5-s-long EEG epoch with a delay of τ (∼140 ms) to the stimulation is extracted for target identification. The target character canbe determined by the decoding algorithm based on the correlations between the single-trial SSVEP and individual SSVEP templates (details are given inMaterials and Methods).
Chen et al. PNAS | Published online October 19, 2015 | E6059
NEU
ROSC
IENCE
PNASPL
US
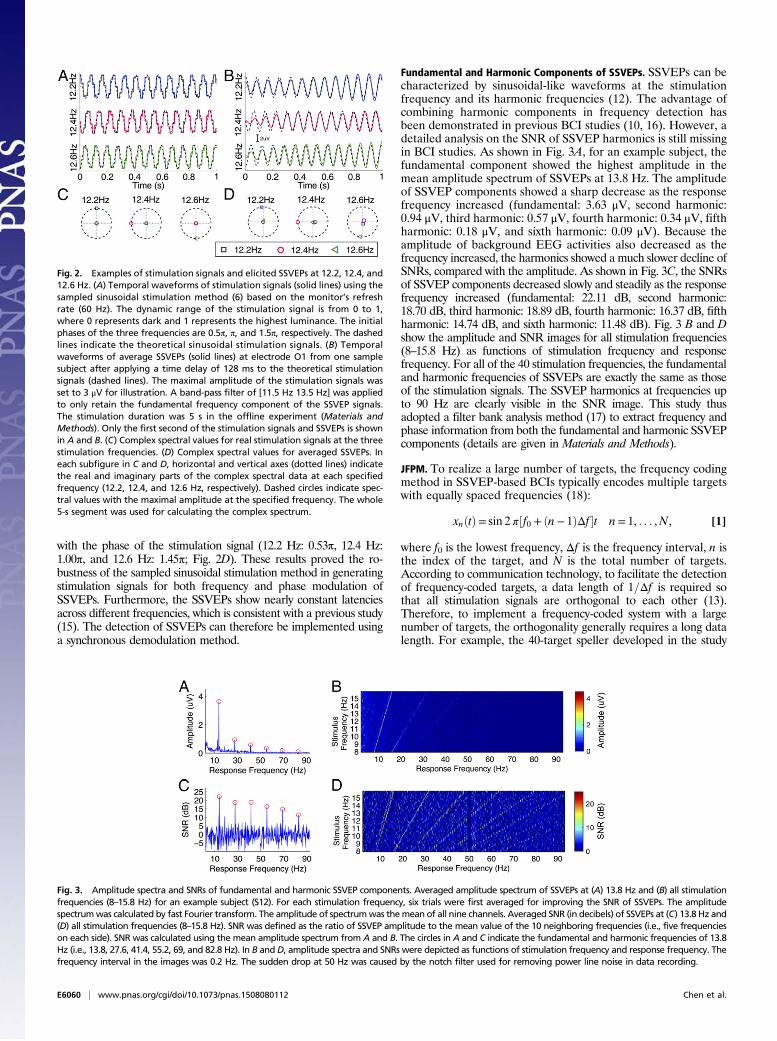
with the phase of the stimulation signal (12.2 Hz: 0.53π, 12.4 Hz:1.00π, and 12.6 Hz: 1.45π; Fig. 2D). These results proved the ro-bustness of the sampled sinusoidal stimulation method in generatingstimulation signals for both frequency and phase modulation ofSSVEPs. Furthermore, the SSVEPs show nearly constant latenciesacross different frequencies, which is consistent with a previous study(15). The detection of SSVEPs can therefore be implemented usinga synchronous demodulation method.
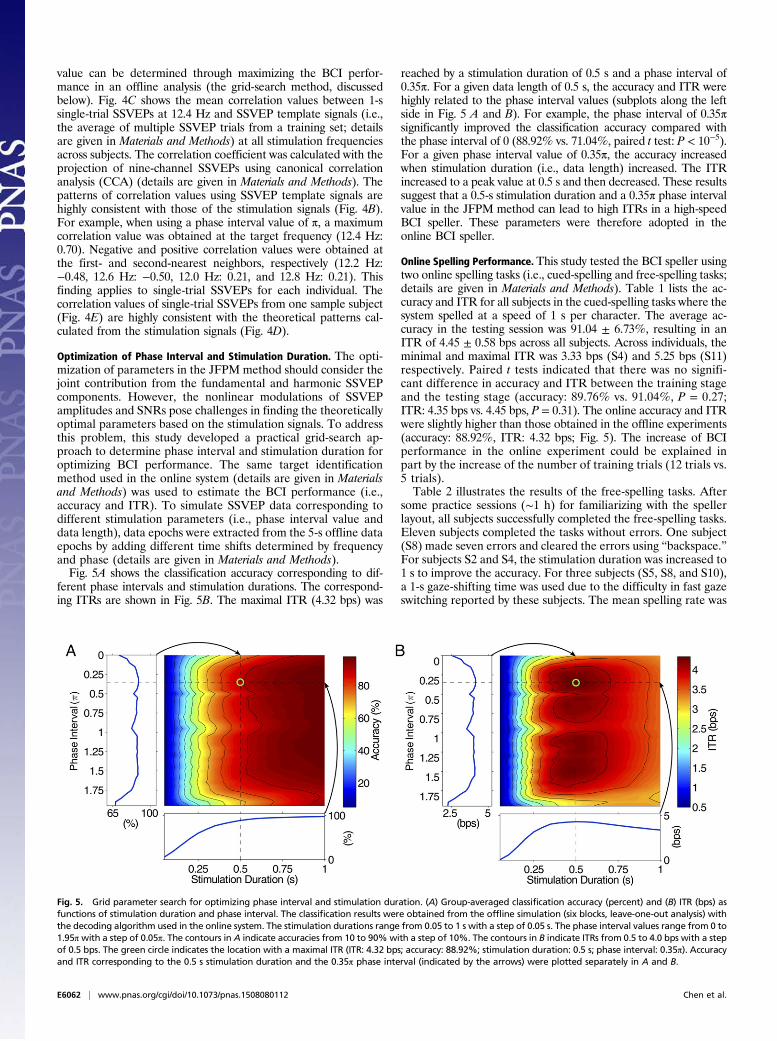
Fundamental and Harmonic Components of SSVEPs. SSVEPs can becharacterized by sinusoidal-like waveforms at the stimulationfrequency and its harmonic frequencies (12). The advantage ofcombining harmonic components in frequency detection hasbeen demonstrated in previous BCI studies (10, 16). However, adetailed analysis on the SNR of SSVEP harmonics is still missingin BCI studies. As shown in Fig. 3A, for an example subject, thefundamental component showed the highest amplitude in themean amplitude spectrum of SSVEPs at 13.8 Hz. The amplitudeof SSVEP components showed a sharp decrease as the responsefrequency increased (fundamental: 3.63 μV, second harmonic:0.94 μV, third harmonic: 0.57 μV, fourth harmonic: 0.34 μV, fifthharmonic: 0.18 μV, and sixth harmonic: 0.09 μV). Because theamplitude of background EEG activities also decreased as thefrequency increased, the harmonics showed a much slower decline ofSNRs, compared with the amplitude. As shown in Fig. 3C, the SNRsof SSVEP components decreased slowly and steadily as the responsefrequency increased (fundamental: 22.11 dB, second harmonic:18.70 dB, third harmonic: 18.89 dB, fourth harmonic: 16.37 dB, fifthharmonic: 14.74 dB, and sixth harmonic: 11.48 dB). Fig. 3 B and Dshow the amplitude and SNR images for all stimulation frequencies(8–15.8 Hz) as functions of stimulation frequency and responsefrequency. For all of the 40 stimulation frequencies, the fundamentaland harmonic frequencies of SSVEPs are exactly the same as thoseof the stimulation signals. The SSVEP harmonics at frequencies upto 90 Hz are clearly visible in the SNR image. This study thusadopted a filter bank analysis method (17) to extract frequency andphase information from both the fundamental and harmonic SSVEPcomponents (details are given in Materials and Methods).
JFPM. To realize a large number of targets, the frequency codingmethod in SSVEP-based BCIs typically encodes multiple targetswith equally spaced frequencies (18):
xnðtÞ= sin 2 π½ f0 + ðn− 1ÞΔf �t n= 1, . . . ,N, [1]
where f0 is the lowest frequency, Δf is the frequency interval, n isthe index of the target, and N is the total number of targets.According to communication technology, to facilitate the detectionof frequency-coded targets, a data length of 1=Δf is required sothat all stimulation signals are orthogonal to each other (13).Therefore, to implement a frequency-coded system with a largenumber of targets, the orthogonality generally requires a long datalength. For example, the 40-target speller developed in the study
Fig. 2. Examples of stimulation signals and elicited SSVEPs at 12.2, 12.4, and12.6 Hz. (A) Temporal waveforms of stimulation signals (solid lines) using thesampled sinusoidal stimulation method (6) based on the monitor’s refreshrate (60 Hz). The dynamic range of the stimulation signal is from 0 to 1,where 0 represents dark and 1 represents the highest luminance. The initialphases of the three frequencies are 0.5π, π, and 1.5π, respectively. The dashedlines indicate the theoretical sinusoidal stimulation signals. (B) Temporalwaveforms of average SSVEPs (solid lines) at electrode O1 from one samplesubject after applying a time delay of 128 ms to the theoretical stimulationsignals (dashed lines). The maximal amplitude of the stimulation signals wasset to 3 μV for illustration. A band-pass filter of [11.5 Hz 13.5 Hz] was appliedto only retain the fundamental frequency component of the SSVEP signals.The stimulation duration was 5 s in the offline experiment (Materials andMethods). Only the first second of the stimulation signals and SSVEPs is shownin A and B. (C) Complex spectral values for real stimulation signals at the threestimulation frequencies. (D) Complex spectral values for averaged SSVEPs. Ineach subfigure in C and D, horizontal and vertical axes (dotted lines) indicatethe real and imaginary parts of the complex spectral data at each specifiedfrequency (12.2, 12.4, and 12.6 Hz, respectively). Dashed circles indicate spec-tral values with the maximal amplitude at the specified frequency. The whole5-s segment was used for calculating the complex spectrum.
Fig. 3. Amplitude spectra and SNRs of fundamental and harmonic SSVEP components. Averaged amplitude spectrum of SSVEPs at (A) 13.8 Hz and (B) all stimulationfrequencies (8–15.8 Hz) for an example subject (S12). For each stimulation frequency, six trials were first averaged for improving the SNR of SSVEPs. The amplitudespectrumwas calculated by fast Fourier transform. The amplitude of spectrumwas themean of all nine channels. Averaged SNR (in decibels) of SSVEPs at (C) 13.8 Hz and(D) all stimulation frequencies (8–15.8 Hz). SNR was defined as the ratio of SSVEP amplitude to the mean value of the 10 neighboring frequencies (i.e., five frequencieson each side). SNR was calculated using the mean amplitude spectrum from A and B. The circles in A and C indicate the fundamental and harmonic frequencies of 13.8Hz (i.e., 13.8, 27.6, 41.4, 55.2, 69, and 82.8 Hz). In B and D, amplitude spectra and SNRs were depicted as functions of stimulation frequency and response frequency. Thefrequency interval in the images was 0.2 Hz. The sudden drop at 50 Hz was caused by the notch filter used for removing power line noise in data recording.
E6060 | www.pnas.org/cgi/doi/10.1073/pnas.1508080112 Chen et al.

requires a data length of 5 s (Δf = 0.2 Hz) to meet the orthogonalitycondition. However, toward a high ITR, a high-speed BCI spellercan only use a short data length (e.g., 0.5 s) for each target. In thiscase, the interference from the spontaneous background EEG ac-tivities makes it very difficult to recognize SSVEPs with the existingfrequency-detection methods (10).In Eq. 1, the phase information is ignored in target coding, and
therefore does not provide useful information for frequencydetection. This study proposed to incorporate phase coding intofrequency coding to realize a JFPM paradigm. Specifically, equallyspaced phases are introduced to enhance the differentiation be-tween frequency-coded targets:
xnðtÞ= sinf2π½f0 + ðn− 1ÞΔf �t+ ½0=0 + ðn− 1ÞΔ0=Þ�g n= 1, . . . ,N,[2]
where 0=0 is the initial phase of the target at f0 and Δ0= is the phaseinterval between two adjacent frequencies. For a data length lessthan 1=Δf , an optimal phase interval Δ0= can maximize the dif-ferentiation between SSVEP waveforms at the adjacent frequen-cies and thereby facilitate target identification. In practice, this
study aimed to minimize the correlation coefficient betweenSSVEPs at the adjacent frequencies (i.e., toward a negative cor-relation value of −1).Fig. 4A illustrates temporal waveforms of the theoretical 1-s
stimulation signals at 12.2, 12.4, and 12.6 Hz using four differentphase interval values (0, 0.5π, π, and 1.5π). Fig. 4B shows cor-relation coefficients of the stimulation signals between 12.4 Hzand all 40 stimulation frequencies. The four phase interval valuesresult in very different correlation patterns across all stimulationfrequencies. The correlation coefficients between 12.4 Hz and itsnearest neighbors (12.2 and 12.6 Hz) differ largely with differentphase interval values (0: 0.75 and 0.75, 0.5π: −0.55 and −0.54, π:−0.75 and −0.75, and 1.5π: 0.55 and 0.54). These results suggestthat the discriminability of SSVEPs can be significantly improvedby introducing an appropriate phase interval value (e.g., 0.5π or π)into the stimulation signals. The phase interval of 0.5π alsoresulted in negative correlation values at the second-nearestneighboring frequencies (12.0 Hz: −0.22 and 12.8 Hz: −0.22). Incontrast, positive correlations are obtained at the second-nearestneighboring frequencies (12.0 Hz: 0.22 and 12.8 Hz: 0.22) whenthe phase interval value is π. In practice, the optimal phase interval
Fig. 4. JFPM. (A) Temporal waveforms of 1-s sinusoidal stimulation signals at 12.2, 12.4, and 12.6 Hz corresponding to four different phase interval values (0, 0.5π,π, and 1.5π). (B) Correlation coefficients between the 12.4-Hz stimulation signal and the stimulation signals at all stimulation frequencies (8–15.8 Hz withan interval of 0.2 Hz, marked by circles). The dotted lines indicate the stimulation frequency at 12.4 Hz. (C ) Mean correlation coefficient between theresulting 1-s-long SSVEPs at 12.4 Hz and SSVEP template signals at all stimulation frequencies across trials and subjects. Correlation coefficient wascalculated with the projection of nine-channel SSVEPs using CCA-based spatial filtering. The error bars indicate SDs across subjects. (D) Correlation coefficientsbetween the stimulation signal at 12.4 Hz and the frequencies from 12 to 12.8 Hz (i.e., 12.4 Hz and four neighboring frequencies). Phase interval values range from0 to 2π. The markers indicate the phase interval values at 0, 0.5π, π, and 1.5π. Note that the two curves corresponding to the same frequency distance to 12.4 Hz onboth sides (12.2 and 12.6 Hz, 12 and 12.8 Hz) coincide with each other. (E) Correlation coefficients between single-trial SSVEPs at 12.4 Hz and SSVEP template signalsfrom 12 to 12.8 Hz for one sample subject with four phase interval values (0, 0.5π, π, and 1.5π). The dataset included six trials. The SSVEP template signals werecalculated using a leave-one-out method. The method to generate the data epochs with different phase interval values can be found in Materials and Methods.
Chen et al. PNAS | Published online October 19, 2015 | E6061
NEU
ROSC
IENCE
PNASPL
US
value can be determined through maximizing the BCI perfor-mance in an offline analysis (the grid-search method, discussedbelow). Fig. 4C shows the mean correlation values between 1-ssingle-trial SSVEPs at 12.4 Hz and SSVEP template signals (i.e.,the average of multiple SSVEP trials from a training set; detailsare given in Materials and Methods) at all stimulation frequenciesacross subjects. The correlation coefficient was calculated with theprojection of nine-channel SSVEPs using canonical correlationanalysis (CCA) (details are given in Materials and Methods). Thepatterns of correlation values using SSVEP template signals arehighly consistent with those of the stimulation signals (Fig. 4B).For example, when using a phase interval value of π, a maximumcorrelation value was obtained at the target frequency (12.4 Hz:0.70). Negative and positive correlation values were obtained atthe first- and second-nearest neighbors, respectively (12.2 Hz:−0.48, 12.6 Hz: −0.50, 12.0 Hz: 0.21, and 12.8 Hz: 0.21). Thisfinding applies to single-trial SSVEPs for each individual. Thecorrelation values of single-trial SSVEPs from one sample subject(Fig. 4E) are highly consistent with the theoretical patterns cal-culated from the stimulation signals (Fig. 4D).
Optimization of Phase Interval and Stimulation Duration. The opti-mization of parameters in the JFPM method should consider thejoint contribution from the fundamental and harmonic SSVEPcomponents. However, the nonlinear modulations of SSVEPamplitudes and SNRs pose challenges in finding the theoreticallyoptimal parameters based on the stimulation signals. To addressthis problem, this study developed a practical grid-search ap-proach to determine phase interval and stimulation duration foroptimizing BCI performance. The same target identificationmethod used in the online system (details are given in Materialsand Methods) was used to estimate the BCI performance (i.e.,accuracy and ITR). To simulate SSVEP data corresponding todifferent stimulation parameters (i.e., phase interval value anddata length), data epochs were extracted from the 5-s offline dataepochs by adding different time shifts determined by frequencyand phase (details are given in Materials and Methods).Fig. 5A shows the classification accuracy corresponding to dif-
ferent phase intervals and stimulation durations. The correspond-ing ITRs are shown in Fig. 5B. The maximal ITR (4.32 bps) was
reached by a stimulation duration of 0.5 s and a phase interval of0.35π. For a given data length of 0.5 s, the accuracy and ITR werehighly related to the phase interval values (subplots along the leftside in Fig. 5 A and B). For example, the phase interval of 0.35πsignificantly improved the classification accuracy compared withthe phase interval of 0 (88.92% vs. 71.04%, paired t test: P < 10−5).For a given phase interval value of 0.35π, the accuracy increasedwhen stimulation duration (i.e., data length) increased. The ITRincreased to a peak value at 0.5 s and then decreased. These resultssuggest that a 0.5-s stimulation duration and a 0.35π phase intervalvalue in the JFPM method can lead to high ITRs in a high-speedBCI speller. These parameters were therefore adopted in theonline BCI speller.
Online Spelling Performance. This study tested the BCI speller usingtwo online spelling tasks (i.e., cued-spelling and free-spelling tasks;details are given in Materials and Methods). Table 1 lists the ac-curacy and ITR for all subjects in the cued-spelling tasks where thesystem spelled at a speed of 1 s per character. The average ac-curacy in the testing session was 91.04 ± 6.73%, resulting in anITR of 4.45 ± 0.58 bps across all subjects. Across individuals, theminimal and maximal ITR was 3.33 bps (S4) and 5.25 bps (S11)respectively. Paired t tests indicated that there was no signifi-cant difference in accuracy and ITR between the training stageand the testing stage (accuracy: 89.76% vs. 91.04%, P = 0.27;ITR: 4.35 bps vs. 4.45 bps, P = 0.31). The online accuracy and ITRwere slightly higher than those obtained in the offline experiments(accuracy: 88.92%, ITR: 4.32 bps; Fig. 5). The increase of BCIperformance in the online experiment could be explained inpart by the increase of the number of training trials (12 trials vs.5 trials).Table 2 illustrates the results of the free-spelling tasks. After
some practice sessions (∼1 h) for familiarizing with the spellerlayout, all subjects successfully completed the free-spelling tasks.Eleven subjects completed the tasks without errors. One subject(S8) made seven errors and cleared the errors using “backspace.”For subjects S2 and S4, the stimulation duration was increased to1 s to improve the accuracy. For three subjects (S5, S8, and S10),a 1-s gaze-shifting time was used due to the difficulty in fast gazeswitching reported by these subjects. The mean spelling rate was
Fig. 5. Grid parameter search for optimizing phase interval and stimulation duration. (A) Group-averaged classification accuracy (percent) and (B) ITR (bps) asfunctions of stimulation duration and phase interval. The classification results were obtained from the offline simulation (six blocks, leave-one-out analysis) withthe decoding algorithm used in the online system. The stimulation durations range from 0.05 to 1 s with a step of 0.05 s. The phase interval values range from 0 to1.95π with a step of 0.05π. The contours in A indicate accuracies from 10 to 90%with a step of 10%. The contours in B indicate ITRs from 0.5 to 4.0 bps with a stepof 0.5 bps. The green circle indicates the location with a maximal ITR (ITR: 4.32 bps; accuracy: 88.92%; stimulation duration: 0.5 s; phase interval: 0.35π). Accuracyand ITR corresponding to the 0.5 s stimulation duration and the 0.35π phase interval (indicated by the arrows) were plotted separately in A and B.
E6062 | www.pnas.org/cgi/doi/10.1073/pnas.1508080112 Chen et al.
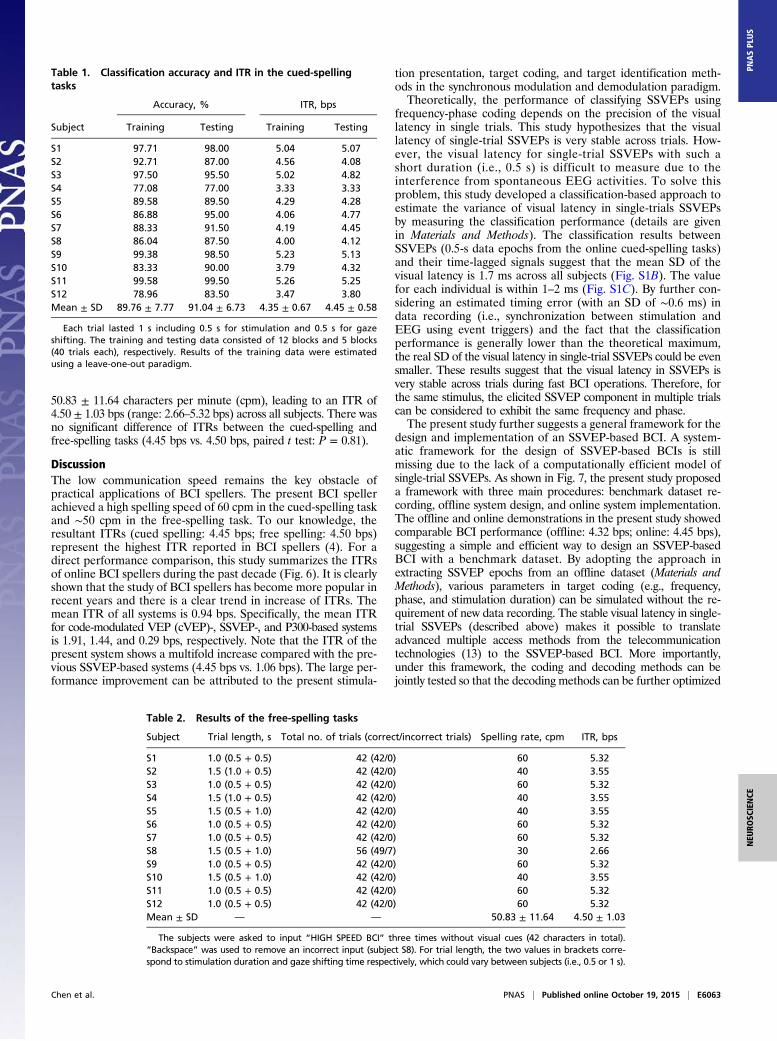
50.83 ± 11.64 characters per minute (cpm), leading to an ITR of4.50 ± 1.03 bps (range: 2.66–5.32 bps) across all subjects. There wasno significant difference of ITRs between the cued-spelling andfree-spelling tasks (4.45 bps vs. 4.50 bps, paired t test: P = 0.81).
DiscussionThe low communication speed remains the key obstacle ofpractical applications of BCI spellers. The present BCI spellerachieved a high spelling speed of 60 cpm in the cued-spelling taskand ∼50 cpm in the free-spelling task. To our knowledge, theresultant ITRs (cued spelling: 4.45 bps; free spelling: 4.50 bps)represent the highest ITR reported in BCI spellers (4). For adirect performance comparison, this study summarizes the ITRsof online BCI spellers during the past decade (Fig. 6). It is clearlyshown that the study of BCI spellers has become more popular inrecent years and there is a clear trend in increase of ITRs. Themean ITR of all systems is 0.94 bps. Specifically, the mean ITRfor code-modulated VEP (cVEP)-, SSVEP-, and P300-based systemsis 1.91, 1.44, and 0.29 bps, respectively. Note that the ITR of thepresent system shows a multifold increase compared with the pre-vious SSVEP-based systems (4.45 bps vs. 1.06 bps). The large per-formance improvement can be attributed to the present stimula-
tion presentation, target coding, and target identification meth-ods in the synchronous modulation and demodulation paradigm.Theoretically, the performance of classifying SSVEPs using
frequency-phase coding depends on the precision of the visuallatency in single trials. This study hypothesizes that the visuallatency of single-trial SSVEPs is very stable across trials. How-ever, the visual latency for single-trial SSVEPs with such ashort duration (i.e., 0.5 s) is difficult to measure due to theinterference from spontaneous EEG activities. To solve thisproblem, this study developed a classification-based approach toestimate the variance of visual latency in single-trials SSVEPsby measuring the classification performance (details are givenin Materials and Methods). The classification results betweenSSVEPs (0.5-s data epochs from the online cued-spelling tasks)and their time-lagged signals suggest that the mean SD of thevisual latency is 1.7 ms across all subjects (Fig. S1B). The valuefor each individual is within 1–2 ms (Fig. S1C). By further con-sidering an estimated timing error (with an SD of ∼0.6 ms) indata recording (i.e., synchronization between stimulation andEEG using event triggers) and the fact that the classificationperformance is generally lower than the theoretical maximum,the real SD of the visual latency in single-trial SSVEPs could be evensmaller. These results suggest that the visual latency in SSVEPs isvery stable across trials during fast BCI operations. Therefore, forthe same stimulus, the elicited SSVEP component in multiple trialscan be considered to exhibit the same frequency and phase.The present study further suggests a general framework for the
design and implementation of an SSVEP-based BCI. A system-atic framework for the design of SSVEP-based BCIs is stillmissing due to the lack of a computationally efficient model ofsingle-trial SSVEPs. As shown in Fig. 7, the present study proposeda framework with three main procedures: benchmark dataset re-cording, offline system design, and online system implementation.The offline and online demonstrations in the present study showedcomparable BCI performance (offline: 4.32 bps; online: 4.45 bps),suggesting a simple and efficient way to design an SSVEP-basedBCI with a benchmark dataset. By adopting the approach inextracting SSVEP epochs from an offline dataset (Materials andMethods), various parameters in target coding (e.g., frequency,phase, and stimulation duration) can be simulated without the re-quirement of new data recording. The stable visual latency in single-trial SSVEPs (described above) makes it possible to translateadvanced multiple access methods from the telecommunicationtechnologies (13) to the SSVEP-based BCI. More importantly,under this framework, the coding and decoding methods can bejointly tested so that the decoding methods can be further optimized
Table 1. Classification accuracy and ITR in the cued-spellingtasks
Subject
Accuracy, % ITR, bps
Training Testing Training Testing
S1 97.71 98.00 5.04 5.07S2 92.71 87.00 4.56 4.08S3 97.50 95.50 5.02 4.82S4 77.08 77.00 3.33 3.33S5 89.58 89.50 4.29 4.28S6 86.88 95.00 4.06 4.77S7 88.33 91.50 4.19 4.45S8 86.04 87.50 4.00 4.12S9 99.38 98.50 5.23 5.13S10 83.33 90.00 3.79 4.32S11 99.58 99.50 5.26 5.25S12 78.96 83.50 3.47 3.80Mean ± SD 89.76 ± 7.77 91.04 ± 6.73 4.35 ± 0.67 4.45 ± 0.58
Each trial lasted 1 s including 0.5 s for stimulation and 0.5 s for gazeshifting. The training and testing data consisted of 12 blocks and 5 blocks(40 trials each), respectively. Results of the training data were estimatedusing a leave-one-out paradigm.
Table 2. Results of the free-spelling tasks
Subject Trial length, s Total no. of trials (correct/incorrect trials) Spelling rate, cpm ITR, bps
S1 1.0 (0.5 + 0.5) 42 (42/0) 60 5.32S2 1.5 (1.0 + 0.5) 42 (42/0) 40 3.55S3 1.0 (0.5 + 0.5) 42 (42/0) 60 5.32S4 1.5 (1.0 + 0.5) 42 (42/0) 40 3.55S5 1.5 (0.5 + 1.0) 42 (42/0) 40 3.55S6 1.0 (0.5 + 0.5) 42 (42/0) 60 5.32S7 1.0 (0.5 + 0.5) 42 (42/0) 60 5.32S8 1.5 (0.5 + 1.0) 56 (49/7) 30 2.66S9 1.0 (0.5 + 0.5) 42 (42/0) 60 5.32S10 1.5 (0.5 + 1.0) 42 (42/0) 40 3.55S11 1.0 (0.5 + 0.5) 42 (42/0) 60 5.32S12 1.0 (0.5 + 0.5) 42 (42/0) 60 5.32Mean ± SD — — 50.83 ± 11.64 4.50 ± 1.03
The subjects were asked to input “HIGH SPEED BCI” three times without visual cues (42 characters in total).“Backspace” was used to remove an incorrect input (subject S8). For trial length, the two values in brackets corre-spond to stimulation duration and gaze shifting time respectively, which could vary between subjects (i.e., 0.5 or 1 s).
Chen et al. PNAS | Published online October 19, 2015 | E6063
NEU
ROSC
IENCE
PNASPL
US

for different coding methods. The customized stimulation and tar-get identification methods derived from offline system design can beeasily transferred to operate the online BCI system for practicalapplications. By simplifying the system design using offline simula-tions, this framework can significantly facilitate the design of a newSSVEP-based BCI.The present study shows a high-speed BCI speller that can
spell at a speed up to 60 cpm. Note that many of the subjects inthis study were experienced in using the SSVEP-based BCIspeller and familiar with the layout of the targets. The spellingspeed of 1 character per second seems close to the speed limit ofhuman gaze control. The 0.5-s intertrial interval includes thevisual latency (∼140 ms), online computation time (∼80 ms), andthe time required for gaze switching. However, the stimulationduration can be further reduced if the classification performancecan be improved. There are several directions to improve theclassification performance. First, the optimization of stimulationduration (Fig. 5) can be performed separately for each individ-ual. For example, the highest simulated ITR for single subjectsreached 6.51 bps with a 0.3-s stimulation duration (subject S10,phase interval: 0.7π). Second, increasing the number of subbands(e.g., five subbands) in the filter bank analysis can improve theclassification accuracy. Third, the robustness of the SSVEP tem-plates can be improved by increasing the number of trials in thetraining data (19). Fourth, the variation of visual latency in single-trial SSVEPs could be reduced (e.g., by reducing the timing errorin synchronization). Finally, there is still room for improving thecoding and decoding approaches. The proposed JFPM method,which uses fixed frequency and phase intervals, proves to be asimple and efficient way to combine frequency and phase modu-lation in target coding. However, the combination strategy mightbe further improved (e.g., using unfixed frequency and phase in-tervals). By addressing these problems, the spelling rate of thepresent BCI speller could be as fast as 0.8 s per character (e.g.,stimulation duration: 0.3 s and gaze shifting time: 0.5 s), whichcorresponds to a theoretical ITR up to 6.65 bps.In two recent studies, we demonstrated the prototype systems
of SSVEP-based BCI spellers with ITRs around 2.5 bps (17, 19).In ref. 17, a filter bank CCA algorithm was developed to imple-ment a BCI speller based on the frequency coding method. In ref.19, an offline BCI speller was proposed using a mixed frequency
and phase coding method. Compared with these studies, the pre-sent study achieved significant improvements in several aspects.First, the present study implemented a fully closed-loop onlinesystem and achieved much higher ITRs (4.45 bps vs. 2.52 bps in ref.17 and 2.76 bps in ref. 19) with cued-spelling and free-spellingtasks. Note that the data length for each trial in the present studywas largely reduced (0.5 s vs. 1.25 s in ref. 17 and 1 s in ref. 19),whereas the classification accuracy was comparable (91.04% vs.91.95% in ref. 17 and 91.35% in ref. 19). The new JFPM methodincorporated phase coding into frequency coding, leading to sig-nificantly enhanced discriminability between very close frequencies.The efficiency of phase coding was further optimized by a grid-search approach. In addition, the calibration data-based targetidentification method was significantly improved by integratingfilter bank analysis and a new feature of similarity between spatialfilters (Fig. S2). Second, as described above, the present studyproposed a new system framework based on a joint optimizationof coding and decoding methods. This system framework cansignificantly facilitate the design and implementation of SSVEP-based BCIs. Third, the present study further demonstrated thatthe visual latency of SSVEPs is stable across trials, providing theneurophysiological basis for introducing the synchronous modu-lation and demodulation technique from telecommunications toBCIs. Together, these important improvements resulted in thepresent high-speed BCI speller with record-breaking ITR.The spelling tasks in this study required fast switching between
different visual targets (i.e., 1 s per character), which might leadto a high workload in system use. In addition, the training pro-cedure in the online experiments might also increase the work-load. The leave-one-out classification of the six offline blocks(Fig. S3A) and 17 online blocks (Fig. S3B) indicated that the BCIperformance was stable across blocks. There was no clear drop ofclassification performance over time. These results suggest thatthe workload in the present system is within an acceptable range.This study demonstrated the visual latency is stable across 17blocks in the online experiments (Fig. S1C). However, the sta-bility of visual latency in long-time system use still remains un-known. Therefore, the feasibility of the high-speed speller inroutine use requires further investigation. To reduce mentalworkload, the spelling rate can be adjusted by increasing thestimulation duration and the gaze switching time. In addition,more comfortable stimulation parameters [e.g., high-frequencystimulation above 40 Hz (20)] can be used to reduce visual fatigue.
Fig. 7. A general framework for designing an SSVEP-based BCI. The designof a new SSVEP BCI can be simplified by three procedures: (i) data collectionfor a benchmark dataset with a group of subjects, (ii) offline simulation, and(iii) online implementation. In this framework, offline simulation plays an im-portant role in facilitating system design. Both coding and decoding methodscan be jointly evaluated by the offline analysis with the benchmark dataset. Thecustomized stimulation and target identification methods derived from offlinesystem design can then be transferred to implement an SSVEP-based BCI systemcomprising visual stimulator, brain pathway, and BCI controller.
Fig. 6. Information transfer rates of current BCI spellers. The data points in-dicate BCI studies characterized by “online” and “speller” from Thomson ReutersWeb of Science and the present study. To emphasize practicality, the studieswithout online spelling tasks were not included. The line shows a linear fit for alldata points, indicating a significant increase of ITR during the past decade (P <0.01, r = 0.53). ”mVEP” indicates motion VEP and ”hybrid” indicates systemsusing multiple EEG signals (e.g., SSVEP and P300).
E6064 | www.pnas.org/cgi/doi/10.1073/pnas.1508080112 Chen et al.

Furthermore, the calibration time for collecting training data can bereduced by adopting session-to-session transfer methods (21).The present high-speed BCI speller requires gaze control.
Conventional eye-tracking approaches have been widely used toimplement visual spellers (22). The reported typing speed of eye-tracking-based spellers has typically been from 5 to 10 words perminute. The BCI speller developed in this study achieved aspelling rate up to 60 cpm (i.e., ∼12 words per minute). Thisstudy therefore demonstrates that the communication speed ofBCI could be comparable to that of eye-tracking systems, pro-viding an alternative way for gaze tracking. In addition, the BCItechnology can be less restricted by user environment (e.g.,viewing distance and viewing angle). However, user comfort-ableness of the SSVEP-based BCIs requires further improve-ment toward practical applications. Owing to loss of gazecontrol, totally locked-in patients cannot use the present speller.For those patients, visual spellers need to be implemented withgaze-independent BCIs, which can be operated by covert atten-tion (23). For SSVEP, a gaze-independent BCI speller can berealized based on spatial attention (24) and feature attention (25).The coding and decoding approaches and the system designframework developed by the present study can still benefit thedesign and implementation of an independent SSVEP-based BCI.For example, the joint frequency and phase modulation methodand the template-based target identification method have poten-tial to improve the speed and accuracy of attention detection.
Materials and MethodsParticipants. Eighteen healthy subjects (10 females, aged 22–29 years, meanage25 years) with normal or corrected-to-normal vision participated in the ex-periment. This study designed an offline experiment and an online experimentusing the SSVEP-based BCI speller. Two groups of 12 subjects participated inthe two experiments respectively. Among all subjects, six participated in bothexperiments on two different days. Thirteen subjects had experience using theSSVEP-based BCI speller in previous studies. Five subjects in the online experi-ments (S3, S5, S6, S7, and S9) were naïve to the BCI speller. Each participant wasasked to read and sign an informed consent form approved by the ResearchEthics Committee of Tsinghua University before the experiment.
Visual Stimulus Presentation. This study used the sampled sinusoidal stimu-lation method (6) to present visual flickers coded by the proposed JFPMmethod on a liquid-crystal display monitor. In general, the stimulus sequencesðf , 0=, iÞ corresponding to frequency f and phase Ø can be generated bymodulating the luminance of the screen using the following equation:
sðf , 0=, iÞ= 12f1+ sin½2πfði=RefreshRateÞ+ 0=�g, [3]
where sinðÞ generates a sine wave and i indicates the frame index in thestimulus sequence. The dynamic range of the stimulation signal is from 0 to1, where 0 represents dark and 1 represents the highest luminance. Theo-retically, the stimulation signal at any frequency (up to half of the refreshrate) and phase can be realized using this method.
BCI Speller. This study designed a 40-target BCI speller using the proposedJFPM approach. As shown in Fig. 1A, the user interface is a 5 × 8 stimulationmatrix containing 40 characters (26 English alphabet letters, 10 digits, and 4other symbols). Specifically, 40 targets are tagged with linearly increasingfrequencies and phases, of which the increments are both proportional totarget index. The frequency and phase values for each target in the matrixcan be obtained by
f�kx ,ky
�= f0 +Δf ×
��ky − 1
�× 5+ ðkx − 1Þ�
0=�kx ,ky
�= 0=0 +Δ0=×
��ky − 1
�×5+ ðkx − 1Þ�, [4]
where kx and ky indicate the row (1–5) and column (1–8) index, respectively.In this study, f0 and Δf was 8 Hz and 0.2 Hz respectively. For the offline ex-periment, 0=0 and Δ0= were 0 and 0.5π, respectively. For the online experiment,ΔØwas set to 0.35π toward high ITRs (Fig. 5B). Fig. 1B illustrates the frequencyand phase values used for each character in the online experiment.
EEG Data Recording. EEG data were acquired using a Synamps2 system(Neuroscan, Inc.) at a sampling rate of 1,000 Hz. Nine electrodes over parietaland occipital areas (Pz, PO5, PO3, POz, PO4, PO6, O1, Oz, andO2)were used torecord SSVEPs. The reference electrode was placed at the vertex. Electrodeimpedances were kept below 10 kΩ. Event triggers generated by the stimulusprogram were sent from the parallel port of the computer to the EEG am-plifier and recorded on an event channel synchronized to the EEG data. Inthe online experiment, EEG data and trigger signals were recorded andanalyzed by the online data analysis program in real time. The online dataanalysis program was developed under MATLAB (MathWorks, Inc.).
The stimulation matrix was presented on a 23.6-inch liquid-crystal displayscreen with a resolution of 1,920 × 1,080 pixels and a refresh rate of 60 Hz.Each stimulus was rendered within a 140- × 140-pixel square. The characterwas presented within a 32- × 32-pixel square at the center of the stimulus.The vertical and horizontal distances between two neighboring stimuli were50 pixels. The stimulus program was developed under MATLAB using thePsychophysics Toolbox Version 3 (26). During the experiment, subjects wereseated in a comfortable chair in a dimly lit soundproof room at a viewingdistance of ∼70 cm from the monitor.
Offline BCI Experiment. The offline experiment consisted of six blocks. Eachblock contained 40 trials corresponding to all 40 characters indicated in arandom order. Each trial lasted 6 s. Each trial started with a visual cue (a redsquare) indicating a target stimulus. The cue appeared for 0.5 s on the screen.Subjects were asked to shift their gaze to the target as soon as possible withinthe cue duration. Following the cue offset, all stimuli started to flicker on thescreen concurrently and lasted 5 s. After stimulus offset, the screen was blankfor 0.5 s before the next trial began. To facilitate visual fixation, a red triangleappeared below the flickering target during the stimulation period. In eachblock, subjects were asked to avoid eye blinks during the stimulation period.To avoid visual fatigue, there was a rest for several minutes between twoconsecutive blocks.
Online BCI Experiment. In the online experiment, each trial only lasted 1 sincluding 0.5 s for visual stimulation and 0.5 s for gaze shifting. The onlineexperiment was divided into a training stage and a testing stage. The trainingstage consisted of 12 blocks, each including 40 trials. The training blocks wereused to derive SSVEP templates and spatial filters for each individual (detailsof the target identification method are given below). The testing stage in-cluded a cued-spelling and a free-spelling task. The cued-spelling task in-cluded five blocks (40 trials each). The cue for the next target appeared rightafter the stimulus offset. Visual and auditory feedbacks were provided to thesubjects in real time. A short beep was sounded after a target was correctlyidentified by the online data analysis program. At the same time, the targetcharacter was typed in the text input field on the top of the screen. The free-spelling task required subjects to input a 14-character sequence (“HIGHSPEED BCI”) without visual cues. The task was repeated three times for eachsubject. The auditory feedback in the cued-spelling task was replaced by avisual feedback (a red square at the location of the identified target). Therewas a 1-min break between two consecutive blocks.
Data Preprocessing. In offline and online experiments, data epochs com-prising nine-channel SSVEPs were extracted according to event triggersgenerated by the stimulus program. Considering a latency delay in the visualsystem (27), the data epochs for offline and online experiments wereextracted in [0.14 s 5.14 s] and [0.14 s 0.64 s], respectively (time 0 indicatedstimulus onset). In this study, the 140-ms delay was selected toward thehighest classification accuracy across all subjects. All epochs were first down-sampled to 250 Hz and then band-pass-filtered from 7 Hz to 70 Hz with aninfinite impulse response (IIR) filter. Zero-phase forward and reverse filteringwas implemented using the filtfilt() function in MATLAB.
CCA-Based Target Identification. CCA has been widely used to detect thefrequency of SSVEPs (28). CCA is a statistical way to measure the underlyingcorrelation between two multidimensional variables. Considering two multi-dimensional variable X, Y and their linear combinations x =XTWX andy =YTWY , CCA finds the weight vectors, WX and WY, which maximize thecorrelation between x and y by solving the following problem:
maxWX , WY
ρðx, yÞ= E�WT
XXYTWY
�ffiffiffiffiffiffiffiffiffiffiffiffiffiffiffiffiffiffiffiffiffiffiffiffiffiffiffiffiffiffiffiffiffiffiffiffiffiffiffiffiffiffiffiffiffiffiffiffiffiffiffiffiffiffiffiffiffiffiffiffiffiffiffiffiffiffiE�WT
XXXTWX
�E�WT
YYYTWY
�q . [5]
The maximum of ρ with respect to WX and WY is the maximum canonicalcorrelation. In frequency detection of SSVEPs, X indicates multichannel SSVEPs
Chen et al. PNAS | Published online October 19, 2015 | E6065
NEU
ROSC
IENCE
PNASPL
US
and Y refers to reference signals. To detect the frequency of SSVEPs in anunsupervised way, sinusoidal signals are used as the reference signals Y f (28):
Y f =
266664
sinð2π ftÞcosð2π ftÞ
..
.
sinð2πNh ftÞcosð2πNh ftÞ
377775 , [6]
where f is the stimulation frequency and Nh is the number of harmonics. Torecognize the frequency of SSVEPs, CCA calculates the canonical correlationbetween multichannel SSVEPs and the reference signals corresponding toeach stimulation frequency. The frequency of the reference signals with themaximal correlation is considered as the frequency of SSVEPs.
CCA with Individual Calibration Data. Recently, individual calibration datahave been incorporated into target identification approaches to improve theperformance of SSVEP-based BCIs (29–32). By incorporating individual dif-ference of SSVEPs in target identification, these methods all achieved signifi-cantly improved classification performance. This study adopted an improvedSSVEP template-based method to incorporate individual SSVEP calibrationdata in target identification (19). Fig. S2B shows the flowchart of the method.In addition to the standard CCA method, this method combined correlationanalysis between single-trial SSVEPs and SSVEP template signals in featureextraction. Furthermore, this study proposed a new type of feature thatmeasured the similarity between CCA-based spatial filters derived fromtraining and testing data. For the kth target, the training SSVEP templatesignals X̂k can be obtained by averaging multiple SSVEP trials in a training set.Correlation coefficients between projections of test set X and training SSVEPtemplate signals X̂k using CCA-based spatial filters can be used as features.Specifically, the following three weight vectors were used as spatial filters toenhance the SNR of SSVEPs: (i) WX ðXX̂kÞ between test set X and trainingSSVEP template signals X̂k, (ii), WX ðXY fk Þ between test set X and sine-cosinereference signals Y fk , and (iii) WX ðX̂kY fk Þ between training SSVEP templatesignals X̂k and sine-cosine reference signals Y fk . The similarity betweenWX ðXX̂kÞ and WX̂k
ðXX̂kÞ was indirectly measured by calculating the correla-tion coefficient between the projections of SSVEP templates (X̂
Tk Þ using the
two spatial filters. For the kth template signal, a correlation vector rk wasdefined as follows (Fig. S2B):
rk =
266664
rkð1Þrkð2Þrkð3Þrkð4Þrkð5Þ
377775=
26666666664
ρ�XTWX
�XY fk
�,YTWY
�XY fk
��
ρ�XTWX
�XX̂k
�, X̂
TkWX
�XX̂k
��
ρ�XTWX
�XY fk
�, X̂
TkWX
�XY fk
��
ρ�XTWX
�X̂kY fk
�, X̂
TkWX
�X̂kY fk
��
ρ�X̂
TkWX
�XX̂k
�, X̂
TkWX̂k
�XX̂k
��
37777777775, [7]
where ρða,bÞ indicated the correlation coefficient between a and b. In thestandard CCA method, the number of harmonics was set to five to include thefundamental and harmonic components of SSVEPs. The five correlation valuesdescribed in Eq. 7 were combined as the feature for target identification:
ρk =X5i=1
signðrkðiÞÞ · ðrkðiÞÞ2, [8]
where signðÞ was used to remain discriminative information from negativecorrelation coefficients between test set X and training SSVEP templatesignals X̂k. The training SSVEP template signal that maximized the weightedcorrelation value was selected as the SSVEP template signal correspondingto the target.
Filter Bank Analysis. The goal of filter bank analysis (33) is to decomposeSSVEPs into subband components so that independent information em-bedded in the harmonic components can be extracted more efficiently forenhancing the detection of SSVEPs. Fig. S2A shows the flowchart of theproposed method. The filter bank method consists of three major pro-cedures (17): (i) subband decomposition, (ii) feature extraction for eachsubband signal, and (iii) target identification. First, a filter bank analysisperformed subband decompositions with multiple filters that have differentpass bands. The frequency range within [7 Hz 70 Hz] was selected for thefilter bank. This study designed subbands covering multiple harmonic fre-quency bands with the same high cutoff frequency at the upper-bound fre-quency of SSVEP components (i.e., the nth subband started from thefrequency at n× 8 Hz and ended at 70 Hz). The band-pass filters for extracting
subband components (XðnÞ, n= 1,2, . . . ,N) from original EEG signals X werezero-phase Chebyshev Type I IIR filters. The filtering was implemented usingthe filtfilt() function in MATLAB. After the filter bank analysis, the featureextraction method (Eqs. 7 and 8) was applied to each of the subband com-ponents separately. A weighted sum of squares of the correlation valuescorresponding to all subband components (i.e., ρð1Þk , . . . , ρðNÞk ) was calculated asthe feature for target identification:
~ρk =XNn=1
wðnÞ ·�ρðnÞk
�2, [9]
where n was the index of the subband. According to the finding that theSNR of SSVEP harmonics decreases as the response frequency increases (Fig.3C), the weights for the subband components were defined as follows:
wðnÞ=n−a +b,n∈ ½1 N�, [10]
where a and b were constants that maximized the classification perfor-mance. In practice, a and b can be determined with a grid-search methodusing an offline analysis. In this study, the value of a and b was set to 1 and0 respectively. Finally, ~ρk corresponding to all stimulation frequencies (i.e.,~ρ1, . . . , ~ρ40) was used for determining the frequency of SSVEPs. The frequencyof the reference signals with the maximal ~ρk was considered as the fre-quency of SSVEPs. The offline analysis indicated that a larger number ofsubbands resulted in higher performance. However, to satisfy the requirementof real-time processing, only two subbands ( [8 Hz 70 Hz] and [16 Hz 70 Hz])were used in this study.
Simulation of Stimulation Duration and Phase Interval Value. To optimize BCIperformance for the speller, different phase intervals and stimulation du-rations were used to extract data epochs from the 5-s offline data epochs byadding different time shifts determined by frequency and phase. For eachstimulation frequency, the 5-s data epochs were first shifted circularly to theleft with a time shift to generate SSVEPs with a zero initial phase:
Xðfk , 0,nÞ=Xfk ,∅k ,n+
ð2π −∅kÞ× fs2π × fk
, [11]
where nwas the index of data sample and fs was the sampling rate. The timeshifts were obtained based on the stimulation frequency and the initialphase value described in Eq. 4. The zero-phase epochs were further shiftedcircularly with a time shift to generate simulated SSVEPs corresponding todifferent phase interval values:
X̂ðfk ,∅ k ,nÞ=Xfk , 0,n+
∅ k × fs2π × fk
, [12]
where∅ k was obtained by applying different phase interval (Δ∅) values in Eq. 4.
Performance Evaluation. Classification accuracy and ITR were calculated forthe offline and online experiments separately. Themethod for calculating ITR(in bits per second) was as follows (1):
ITR=log2M+ Plog2P + ð1− PÞlog2
�1− PM− 1
� T , [13]
where M is the number of classes (i.e., 40 in this study), P is the accuracy oftarget identification, and T (seconds per selection) is the average time for aselection. For the offline experiments, this study used a leave-one-out cross-validation to estimate simulated online BCI performance. Individual trainingSSVEP template signals were obtained from the training data in cross-vali-dation. To estimate the optimal BCI performance in the offline experiment,this study calculated accuracy and ITR with different stimulation durationand phase intervals (Fig. 5). For the online experiment, classification accuracyand ITR were calculated based on the results obtained from the online data-analysis program in the testing stage. For the estimation of ITR in offline andonline experiments, the gaze-shifting time was included in the calculation.
Estimation of the SD of Visual Latency in Single-Trial SSVEPs. The variation ofvisual latency in single-trial SSVEPs can be measured by phase differencebetween different trials. However, the SSVEPs in single trials are typicallyinterfered by strong spontaneous EEG activities, making it difficult tomeasure the phase of SSVEPs directly. This study developed a classification-based approach to estimate the variation of the visual latency in single-trialSSVEPs. The basic idea is to estimate the distribution of visual latencies byquantifying the classification accuracy between SSVEPs and their time-lagged
E6066 | www.pnas.org/cgi/doi/10.1073/pnas.1508080112 Chen et al.

signals. Suppose the visual latency follows a normal distribution, binary clas-sification accuracy between data samples from the distribution and its time-lagged distributions can reflect the stand deviation of the distribution (Fig.S1A). The classification accuracy increases when the time lag increases,resulting in a smaller overlap area between the two distributions. Therefore,given an accuracy curve with respect to different time lags, the SD of visuallatencies can be estimated. In practice, the accuracy curve can be calculated byclassifying single-trial SSVEPs and their time-lagged signals. This study used the0.5-s epochs from the cued-spelling tasks (17 blocks in total) and their time-lagged epochs as the two classes for estimating the classification accuracy (Fig.S1 B and C). The time lags ranged from 0 to 10 ms. To fully extract the in-formation of SSVEPs from single trials, the classification approach was the
same as the target identification method used in the BCI speller. Note that thetheoretical classification accuracy should be higher than the estimations due tothe interference from EEG background activities. Therefore, the real SD ofvisual latencies in single-trial SSVEPs should be smaller than the estimations.
ACKNOWLEDGMENTS. This work is supported by National Basic ResearchProgram (973) of China Grant 2011CB933204, National Natural Science Founda-tion of China Grants 61431007 and 91220301, National High-Tech R&D Program(863) of China Grant 2012AA011601, and the Recruitment Program for YoungProfessionals. This work was also supported in part by US Office of Naval Re-search Grant N00014-08-1215, Army Research Office Grant W911NF-09-1-0510,Army Research Laboratory Grant W911NF-10-2-0022, and Defense AdvancedResearch Projects Agency Grant USDI D11PC20183 (to Y.W., M.N., and T.-P.J.).
1. Wolpaw JR, Birbaumer N, McFarland DJ, Pfurtscheller G, Vaughan TM (2002) Brain-computer interfaces for communication and control. Clin Neurophysiol 113(6):767–791.
2. Lebedev MA, Nicolelis MA (2006) Brain-machine interfaces: Past, present and future.Trends Neurosci 29(9):536–546.
3. Cecotti H (2011) Spelling with non-invasive brain-computer interfaces—current andfuture trends. J Physiol Paris 105(1–3):106–114.
4. Gao S, Wang Y, Gao X, Hong B (2014) Visual and auditory brain-computer interfaces.IEEE Trans Biomed Eng 61(5):1436–1447.
5. Farwell LA, Donchin E (1988) Talking off the top of your head: Toward a mental pros-thesis utilizing event-related brain potentials. Electroencephalogr Clin Neurophysiol70(6):510–523.
6. Chen X, Chen Z, Gao S, Gao X (2014) A high-ITR SSVEP-based BCI speller. Brain-CompInterfaces 1(3–4):181–191.
7. Spüler M, Rosenstiel W, Bogdan M (2012) Online adaptation of a c-VEP brain-com-puter Interface (BCI) based on error-related potentials and unsupervised learning.PLoS One 7(12):e51077.
8. Brunner P, Ritaccio AL, Emrich JF, Bischof H, Schalk G (2011) Rapid communication with a‘P300’ matrix speller using electrocorticographic signals (ECoG). Front Neurosci 5:5.
9. Nuyujukian P, Fan JM, Kao JC, Ryu SI, Shenoy KV (2015) A high-performance keyboardneural prosthesis enabled by task optimization. IEEE Trans Biomed Eng 62(1):21–29.
10. Wang Y, Gao X, Hong B, Jia C, Gao S (2008) Brain-computer interfaces based on visualevoked potentials - Feasibility of practical system designs. IEEE EMB Mag 27(5):64–71.
11. Vialatte FB, Maurice M, Dauwels J, Cichocki A (2010) Steady-state visually evoked po-tentials: Focus on essential paradigms and future perspectives. Prog Neurobiol 90(4):418–438.
12. Regan D (1989) Human Brain Electrophysiology: Evoked Potentials and EvokedMagnetic Fields in Science and Medicine (Elsevier, New York).
13. Rappaport TS (2001) Wireless Communication, Principle and Practice (Prentice Hall,Upper Saddle River, NJ), 2nd Ed.
14. Herrmann CS (2001) Human EEG responses to 1-100 Hz flicker: Resonance phenomenain visual cortex and their potential correlation to cognitive phenomena. Exp Brain Res137(3–4):346–353.
15. Regan D (1966) Some characteristics of average steady-state and transient responsesevoked by modulated light. Electroencephalogr Clin Neurophysiol 20(3):238–248.
16. Müller-Putz GR, Scherer R, Brauneis C, Pfurtscheller G (2005) Steady-state visual evokedpotential (SSVEP)-based communication: Impact of harmonic frequency components.J Neural Eng 2(4):123–130.
17. Chen X, Wang Y, Gao S, Jung TP, Gao X (2015) Filter bank canonical correlation analysisfor implementing a high-speed SSVEP-based brain-computer interface. J Neural Eng12(4):046008.
18. Wang Y, Wang R, Gao X, Hong B, Gao S (2006) A practical VEP-based brain-computerinterface. IEEE Trans Neural Syst Rehabil Eng 14(2):234–239.
19. Nakanishi M, Wang Y, Wang YT, Mitsukura Y, Jung TP (2014) A high-speed brainspeller using steady-state visual evoked potentials. Int J Neural Syst 24(6):1450019.
20. Sakurada T, Kawase T, Komatsu T, Kansaku K (2015) Use of high-frequency visual stimuliabove the critical flicker frequency in a SSVEP-based BMI. Clin Neurophysiol 126(10):1972–1978.
21. Krauledat M, Tangermann M, Blankertz B, Müller KR (2008) Towards zero training forbrain-computer interfacing. PLoS One 3(8):e2967.
22. Majaranta P, Räihä KJ (2007) Text entry by gaze: utilizing eye-tracking. Text EntrySystems: Mobility, Accessibility, Universality, eds MacKenzie IS, Tanaka-Ishii K (Mor-gan Kaufmann, San Francisco), pp 175–187.
23. Treder MS, Blankertz B (2010) (C)overt attention and visual speller design in an ERP-based brain-computer interface. Behav Brain Funct 6:28.
24. Kelly SP, Lalor EC, Finucane C, McDarby G, Reilly RB (2005) Visual spatial attentioncontrol in an independent brain-computer interface. IEEE Trans Biomed Eng 52(9):1588–1596.
25. Zhang D, et al. (2010) An independent brain-computer interface using covert non-spatial visual selective attention. J Neural Eng 7(1):16010.
26. Brainard DH (1997) The psychophysics toolbox. Spat Vis 10(4):433–436.27. Di Russo F, Spinelli D (1999) Electrophysiological evidence for an early attentional
mechanism in visual processing in humans. Vision Res 39(18):2975–2985.28. Lin Z, Zhang C, Wu W, Gao X (2007) Frequency recognition based on canonical cor-
relation analysis for SSVEP-based BCIs. IEEE Trans Biomed Eng 54(6 Pt 2):1172–1176.29. Chen X, Wang Y, Nakanishi M, Jung TP, Gao X (2014) Hybrid frequency and phase
coding for a high-speed SSVEP-based BCI speller. Conf Proc IEEE Eng Med Biol Soc2014:3993–3996.
30. Zhang Y, Zhou G, Jin J, Wang X, Cichocki A (2015) SSVEP recognition using commonfeature analysis in brain-computer interface. J Neurosci Methods 244:8–15.
31. Zhang Y, Zhou G, Jin J, Wang X, Cichocki A (2014) Frequency recognition in SSVEP-basedBCI using multiset canonical correlation analysis. Int J Neural Syst 24(4):1450013.
32. Tong J, Zhu D (2015) Multi-phase cycle coding for SSVEP based brain-computer in-terfaces. Biomed Eng Online 14(5):5.
33. Vetterli M, Herley C (1992) Wavelets and filter banks: Theory and design. IEEE TransSignal Process 40(9):2207–2232.
Chen et al. PNAS | Published online October 19, 2015 | E6067
NEU
ROSC
IENCE
PNASPL
US