Global WarmingEnergy Challenges
CMAQ PresentationJanuary 9, 2006
Overview
• Greenhouse effect– Historic carbon emissions / CO2 rise
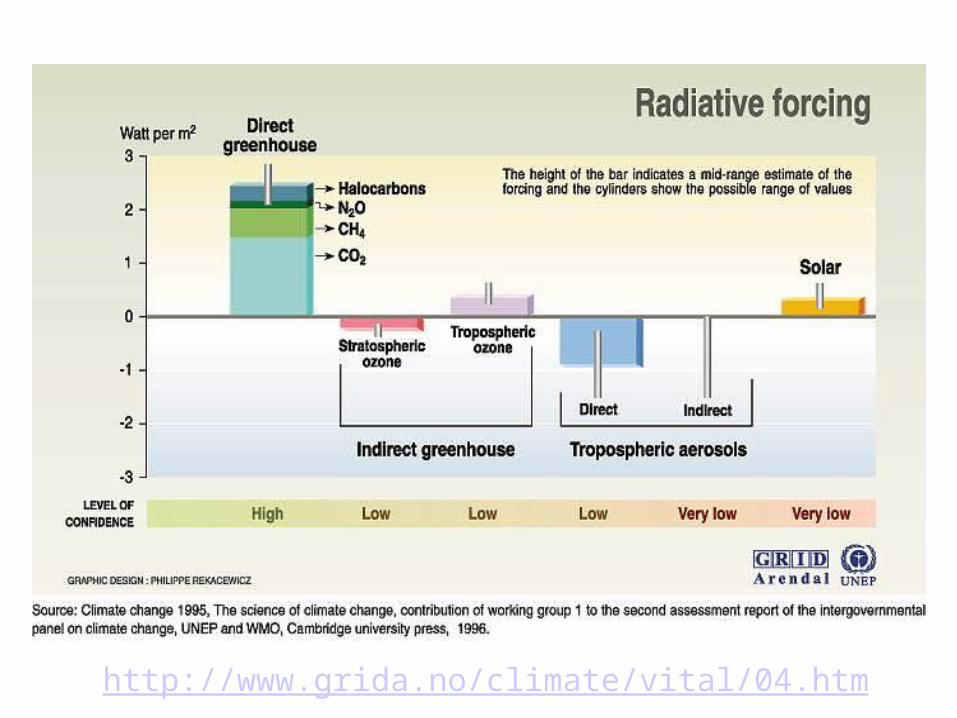
– Forcing models / temperature predictions
• Effect of a warming earth (1 degree F)
• Peak oil / Hubbert’s peak– Future and current energy challenges
• Energy equity – the road ahead
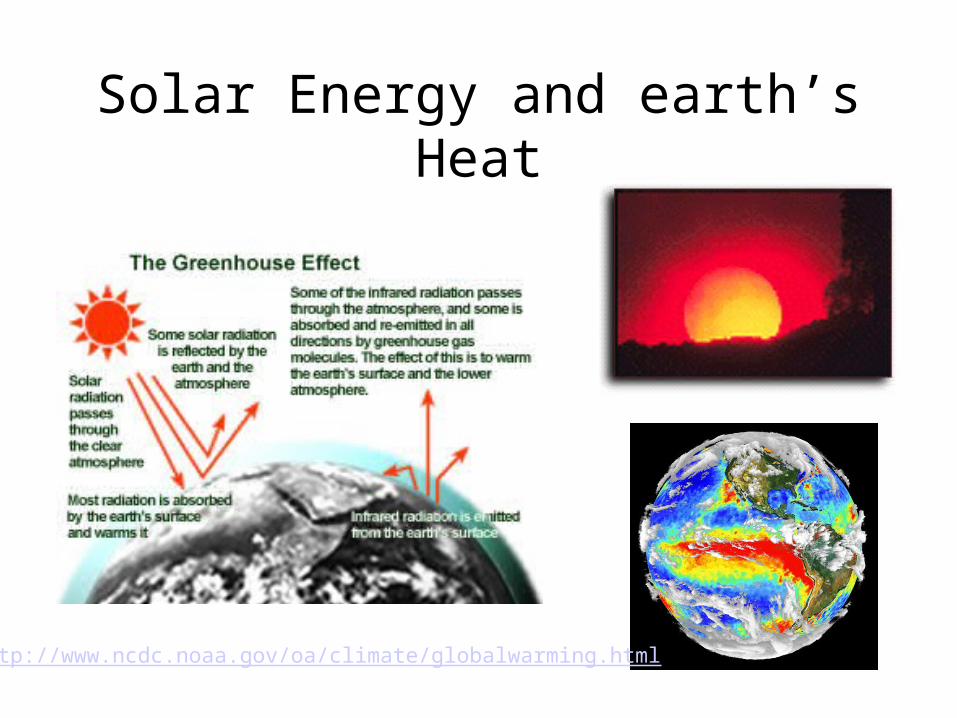
Solar Energy and earth’s Heat
http://www.ncdc.noaa.gov/oa/climate/globalwarming.html
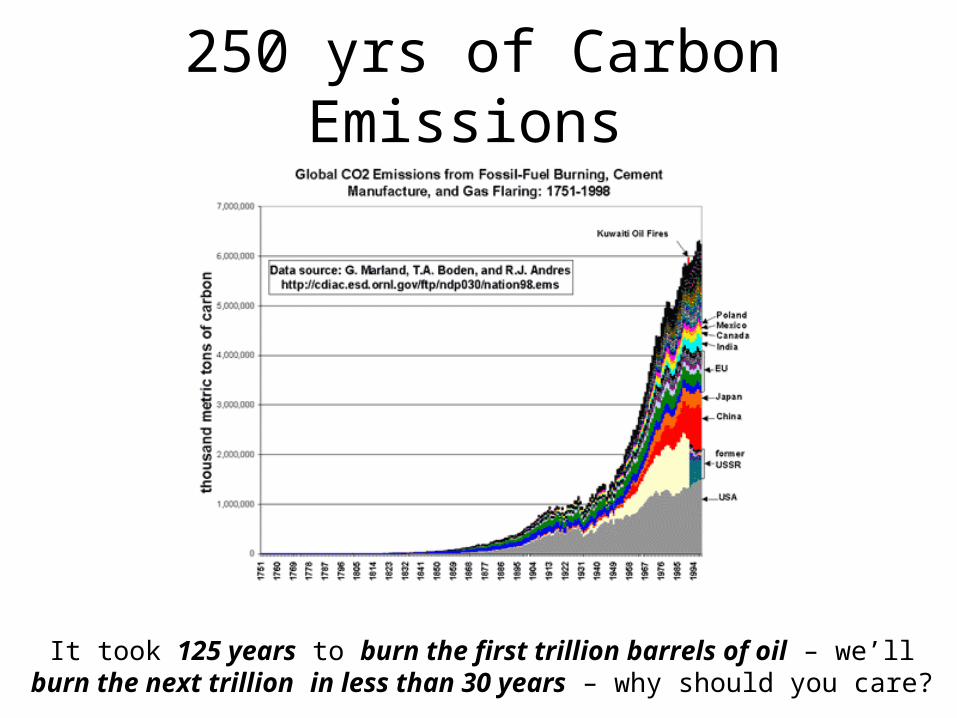
250 yrs of Carbon Emissions
It took 125 years to burn the first trillion barrels of oil – we’llburn the next trillion in less than 30 years – why should you care?
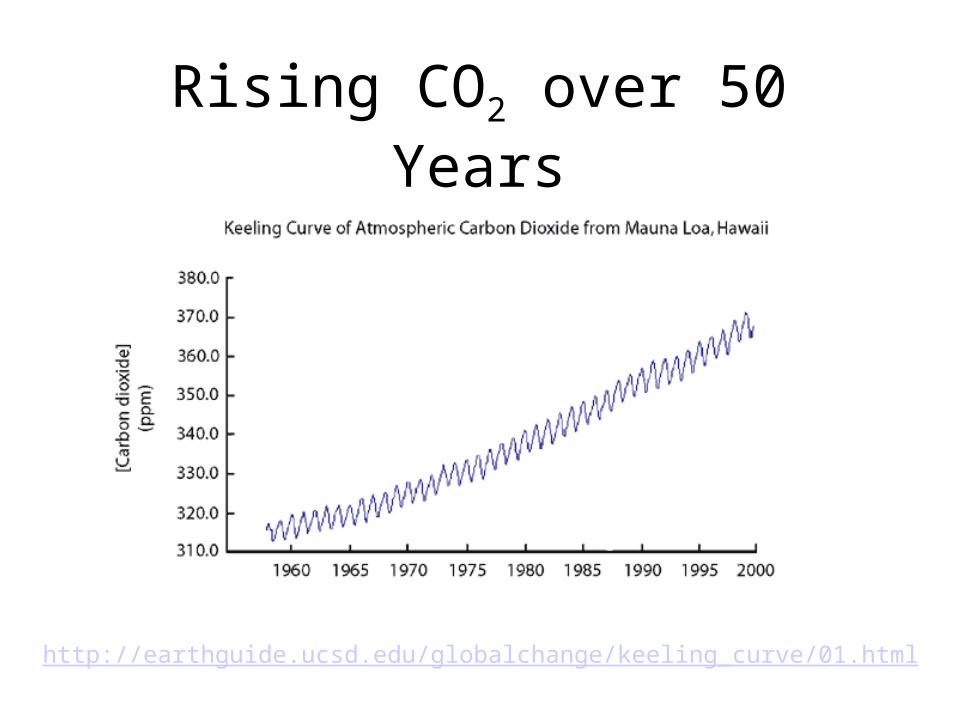
Rising CO2 over 50 Years
http://earthguide.ucsd.edu/globalchange/keeling_curve/01.html
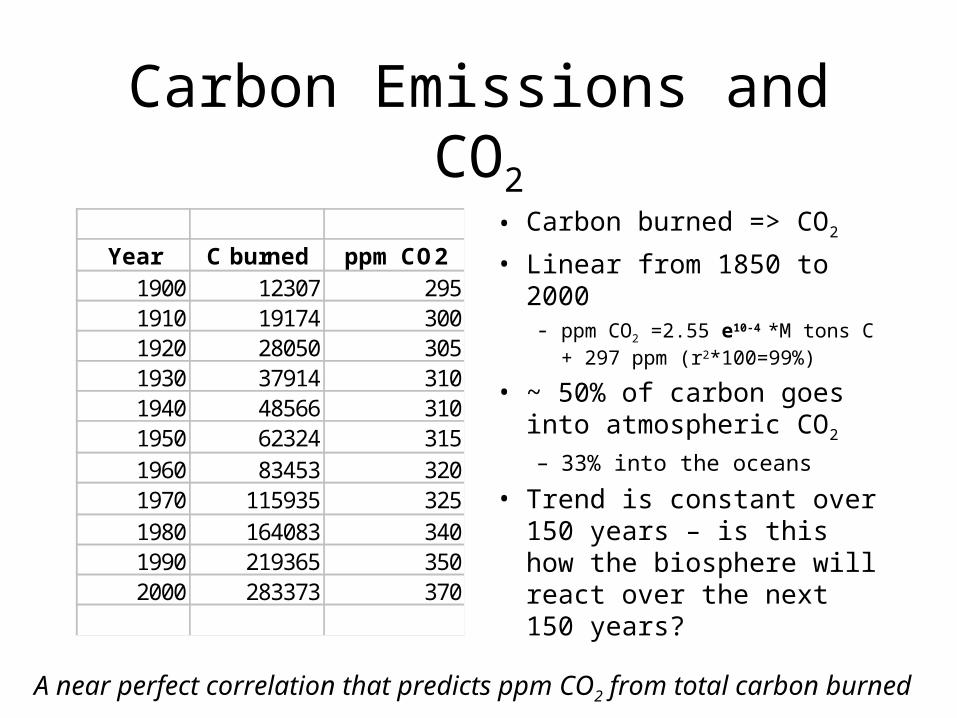
Carbon Emissions and CO2
• Carbon burned => CO2
• Linear from 1850 to 2000- ppm CO2 =2.55 e10-4 *M tons C
+ 297 ppm (r2*100=99%)
• ~ 50% of carbon goes into atmospheric CO2
– 33% into the oceans
• Trend is constant over 150 years – is this how the biosphere will react over the next 150 years?
Year C burned ppm CO21900 12307 2951910 19174 3001920 28050 3051930 37914 3101940 48566 3101950 62324 3151960 83453 3201970 115935 3251980 164083 3401990 219365 3502000 283373 370
A near perfect correlation that predicts ppm CO2 from total carbon burned
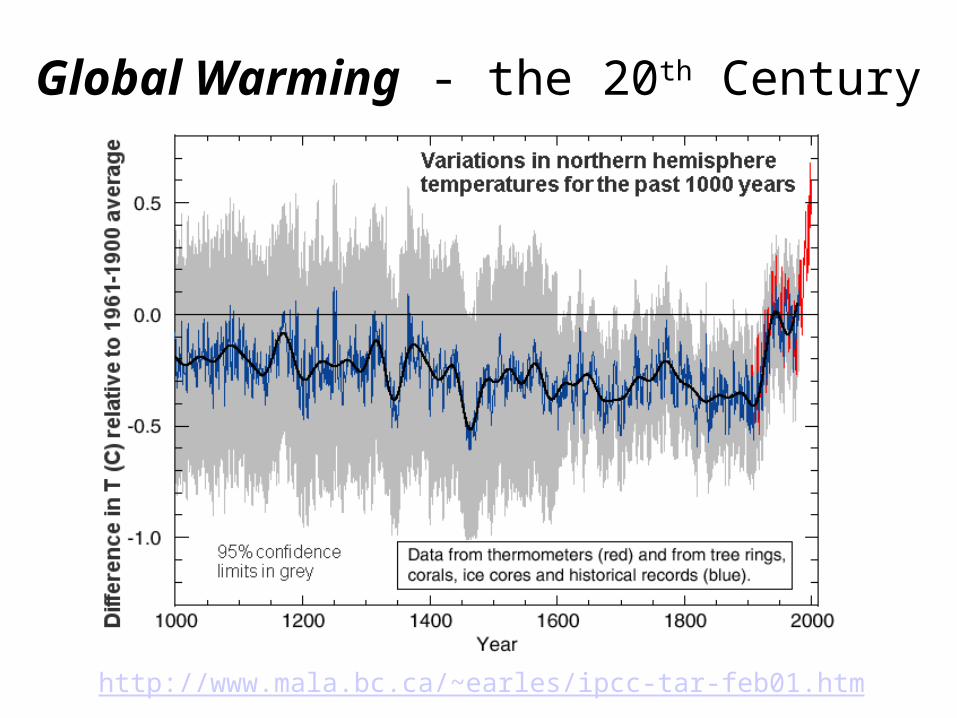
http://www.mala.bc.ca/~earles/ipcc-tar-feb01.htm
Global Warming - the 20th Century
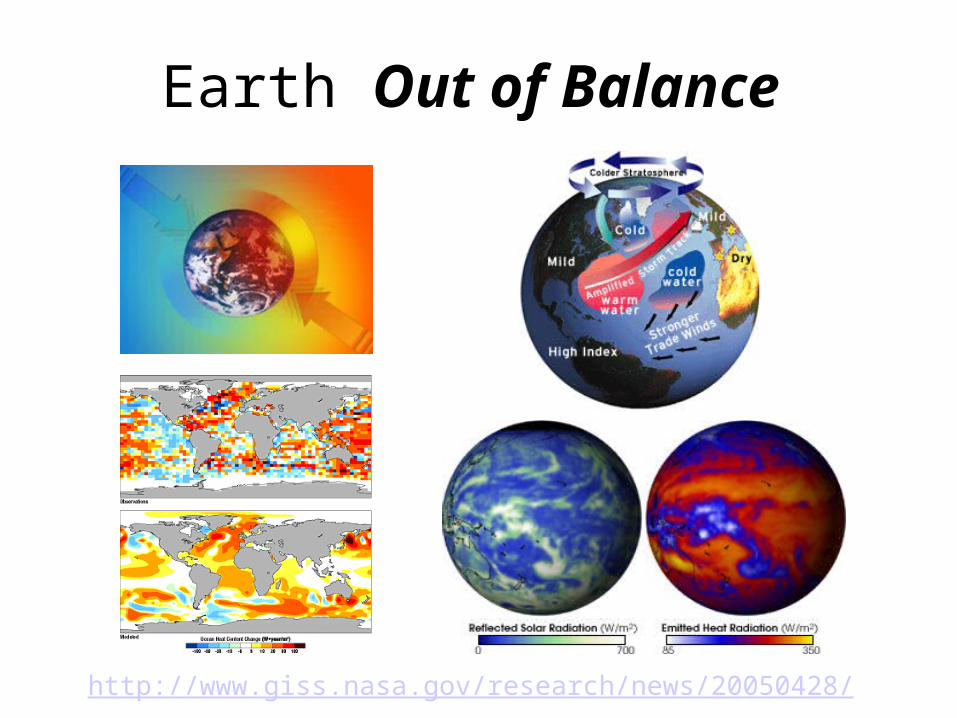
Earth Out of Balance
http://www.giss.nasa.gov/research/news/20050428/
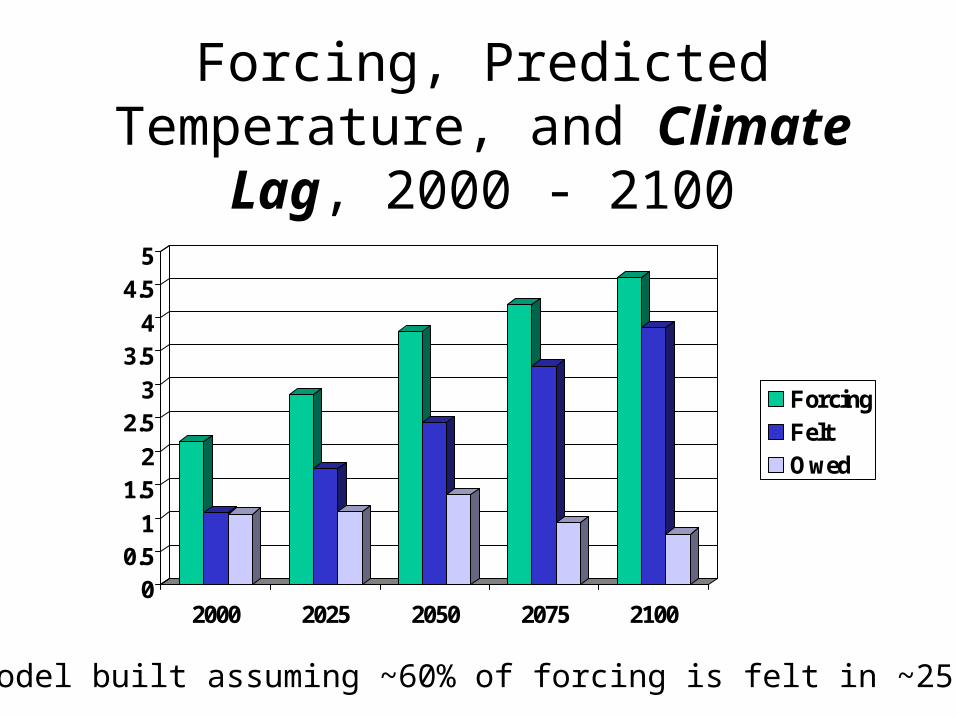
Forcing, Predicted Temperature, and Climate Lag, 2000 - 2100
00.51
1.52
2.53
3.54
4.55
2000 2025 2050 2075 2100
ForcingFeltOwed
0F - Model built assuming ~60% of forcing is felt in ~25 years
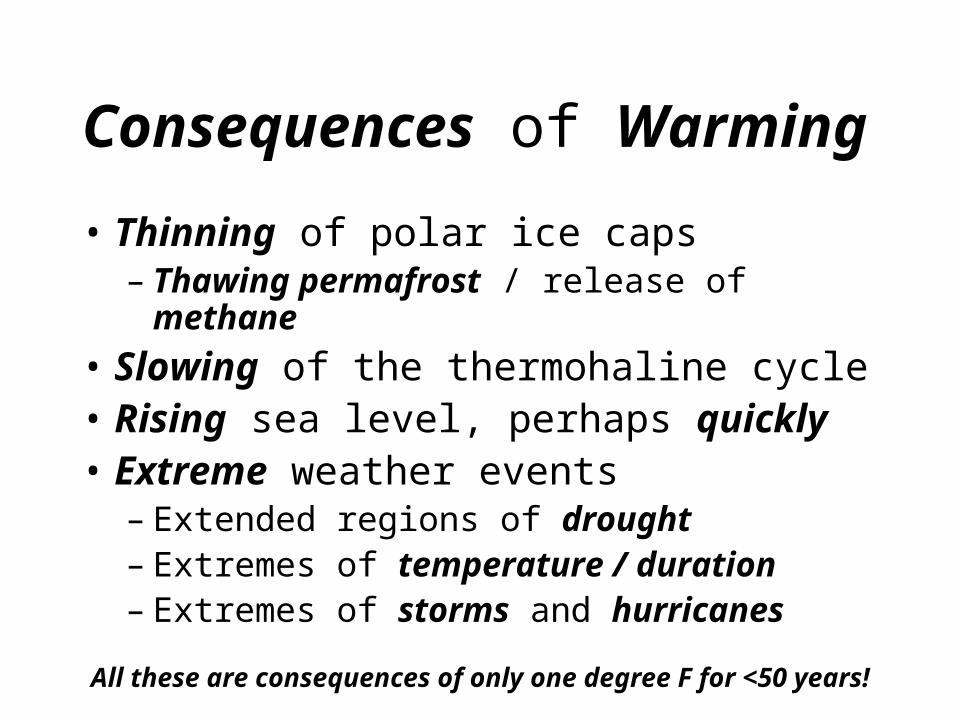
Consequences of Warming
• Thinning of polar ice caps– Thawing permafrost / release of methane
• Slowing of the thermohaline cycle• Rising sea level, perhaps quickly• Extreme weather events
– Extended regions of drought– Extremes of temperature / duration– Extremes of storms and hurricanes
All these are consequences of only one degree F for <50 years!
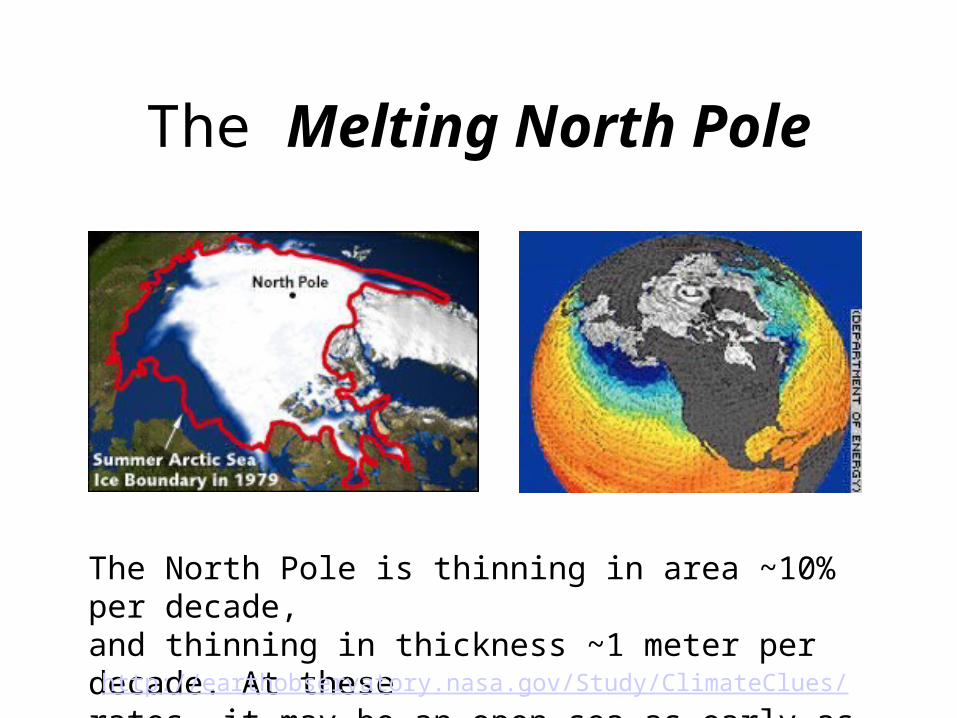
The Melting North Pole
The North Pole is thinning in area ~10% per decade,and thinning in thickness ~1 meter per decade. At theserates, it may be an open sea as early as 2030 – 2050.
http://earthobservatory.nasa.gov/Study/ClimateClues/
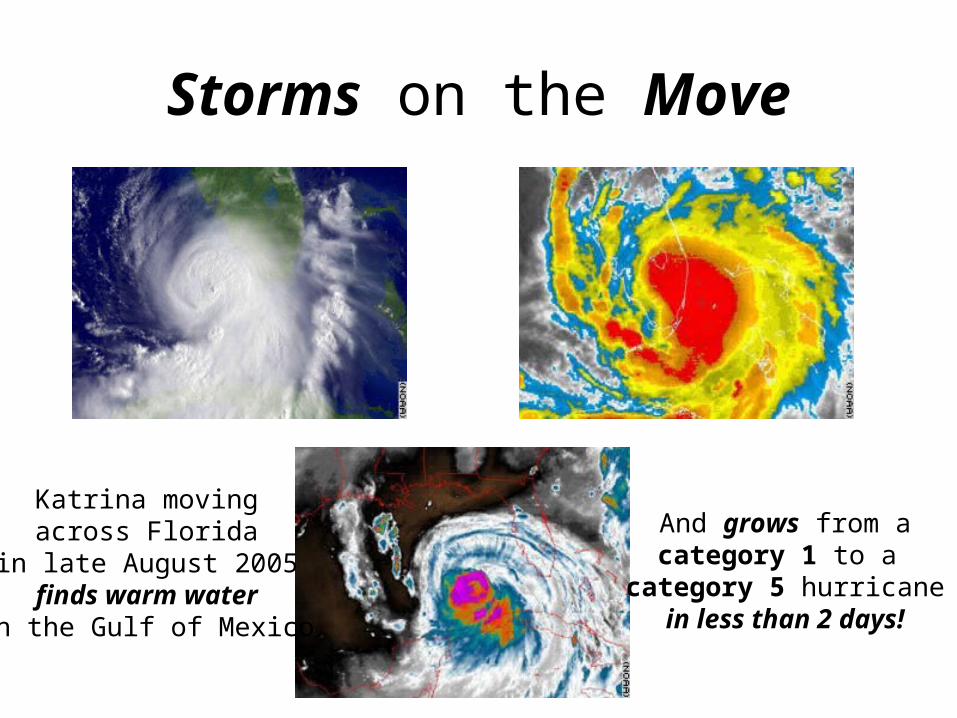
Storms on the Move
Katrina movingacross Florida
in late August 2005finds warm water
in the Gulf of Mexico
And grows from acategory 1 to a
category 5 hurricanein less than 2 days!
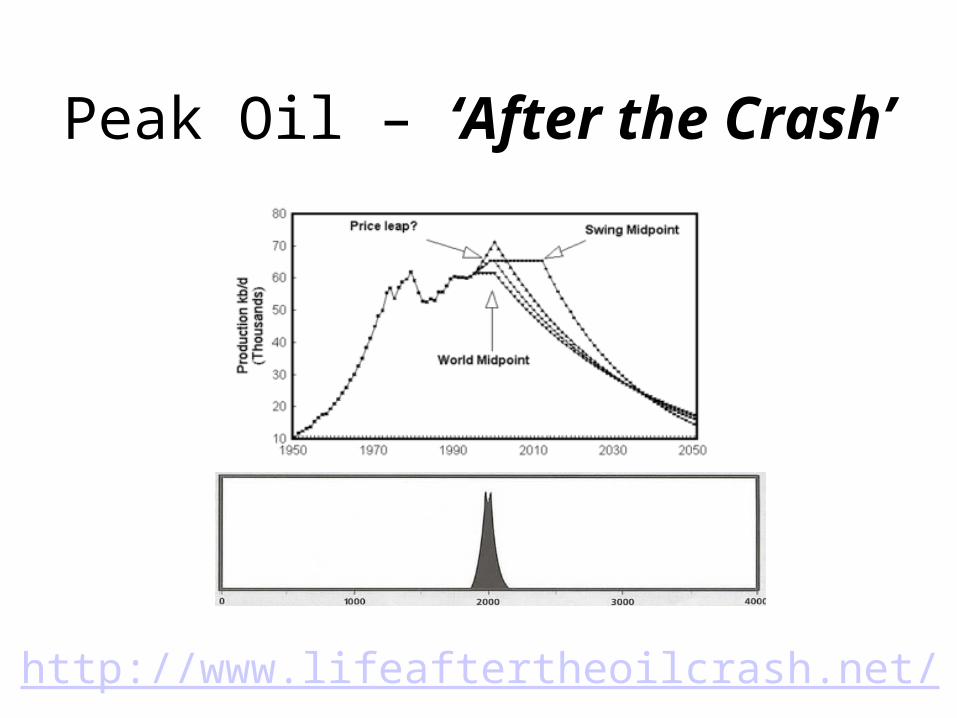
Peak Oil – ‘After the Crash’
http://www.lifeaftertheoilcrash.net/
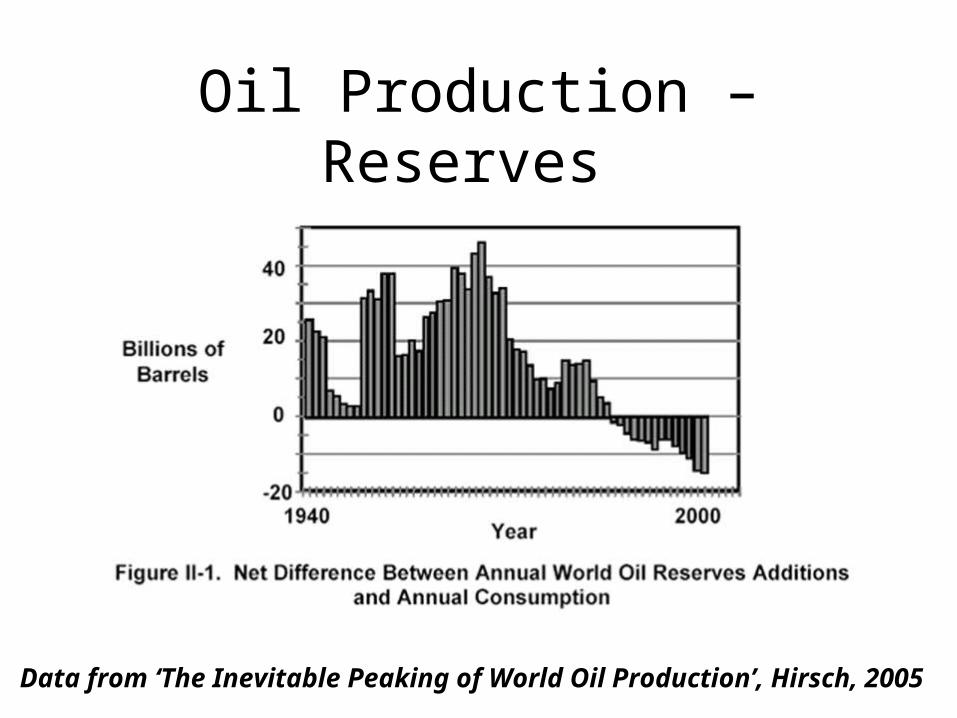
Oil Production – Reserves
Data from ‘The Inevitable Peaking of World Oil Production’, Hirsch, 2005
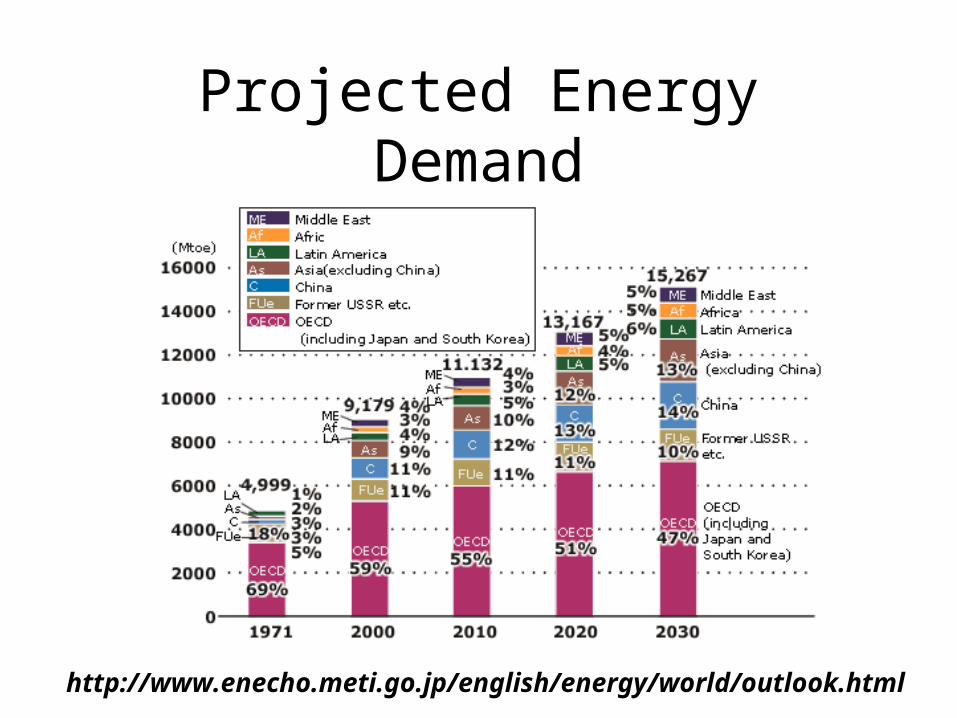
Projected Energy Demand
http://www.enecho.meti.go.jp/english/energy/world/outlook.html
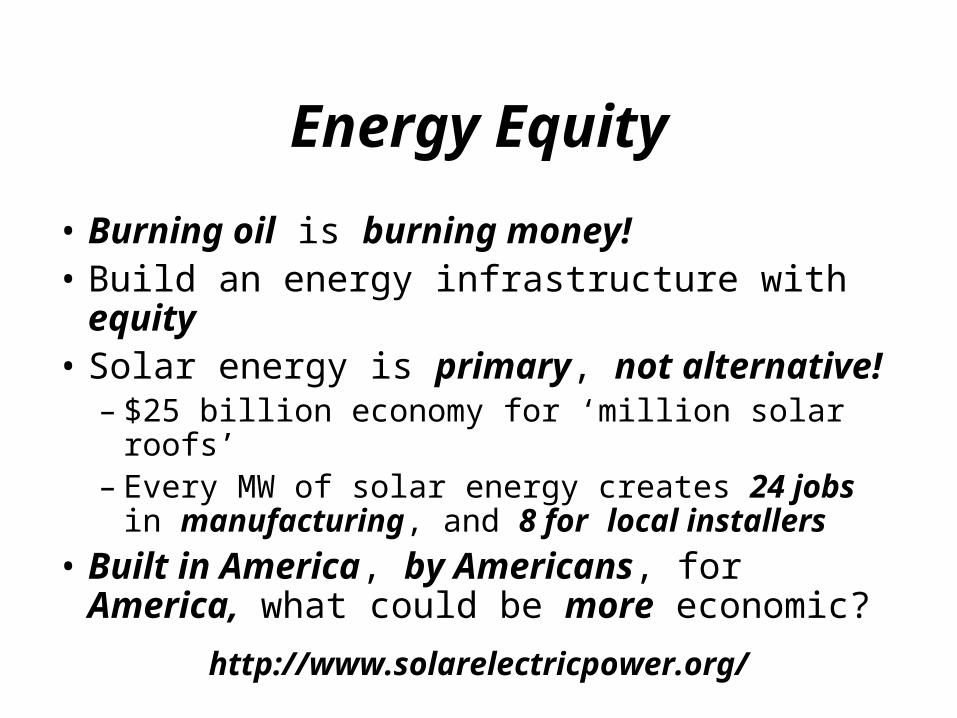
Energy Equity
• Burning oil is burning money!• Build an energy infrastructure with equity• Solar energy is primary, not alternative!
– $25 billion economy for ‘million solar roofs’– Every MW of solar energy creates 24 jobs in
manufacturing, and 8 for local installers
• Built in America, by Americans, for America, what could be more economic?
http://www.solarelectricpower.org/
Summary
• Greenhouse effect – carbon cycle
• Forcing models – temperature lag
• Effect of warming just one degree
• Peak oil – declining energy production
• Energy Equity – and the road ahead– Our single biggest challenge– Our single biggest opportunity
References
• http://www.realclimate.org/ • http://www.giss.nasa.gov/• http://www.sc.doe.gov/ober/CCRD/model.html• http://www.nersc.gov/projects/gcm_data/ • http://www.solarelectricpower.org/ • http://www.nrel.gov/• http://www.eia.doe.gov/ • http://en.wikipedia.org/wiki/Peak_oil