Mobile source air toxic emissions from direct injection spark ignitiongasoline and LPG passenger car under various in-use vehicle drivingmodes in Korea
Cha-Lee Myung a, Ahyun Ko a, Yunsung Lim b, Sunmoon Kim b, Jongtae Lee b, Kwanhee Choi a, Simsoo Park a,⁎a School of Mechanical Engineering, Korea University, 1, 5-Ga, Anam-dong, Sungbuk-gu, Seoul 136-701, Republic of Koreab Transportation Pollution Research Center, National Institute of Environmental Research, Gyeongseo-dong, Seo-gu, Incheon 404-704, Republic of Korea
a b s t r a c ta r t i c l e i n f o
Article history:Received 10 January 2013Received in revised form 22 October 2013Accepted 24 October 2013Available online 16 November 2013
Keywords:Mobile source air toxic emissionsLPG-direct injectionIn-use vehicle driving modeParticulate emissionsCarbonyl compoundsPolycyclic aromatic hydrocarbons
Mobile source air toxic (MSAT) emissions from a direct injection spark ignition (DISI) passenger vehicle fueledwith gasoline and liquid phase liquefied petroleum gas (LPG) were compared using a chassis dynamometerunder several in-use vehicle driving conditions. For operation of a dedicated LPG-DI engine, low-pressure fuelsystems were specially installed and various engine control parameters were recalibrated considering differentchemical properties of LPG. A series of the National Institute of Environmental Research (NIER) modes for deter-mining the emission factors of in-use vehicles in Korea were chosen to quantify not only the regulated emissionswith particles but also the unregulated emissions of carbonyls, BTEX, and PAHs from a DISI light-duty vehicle(LDV) with gasoline and LPG. The regulated and particle emissions of LPG-DI vehicles showed strong reduction,and the proportions of sub-23 nmparticleswere 32–35% in gasoline and 50–65% in LPG. The results revealed thatthe levels of theMSAT emissions from aDISI enginewere closely related to the driving patterns and the fuel prop-erties. A substantial reduction of regulated emissions, particulates, BTEX, and particle-bound PAH emissions wasachieved from a LPG-DI vehicle in real driving conditions. Carbonyl compounds acetaldehyde and acroleinshowed significant increment from a LPG-DI vehicle.
© 2013 Elsevier B.V. All rights reserved.
1. Introduction
The implementation of the carbon dioxide (CO2) regulations andfuel economy (FE) standards has encouraged the deployment of energyefficient power-trains, greenhouse gas reducing alternative fuels, andvehicle electrification technologies in the transportation sector [1–6].Advanced vehicle emission after-treatment technologies, meetingmore stringent future emission regulations, will also play an importantrole in abating the harmful emissions aroundmetropolitan areas and insignificantly improving urban air quality. However, steady growth inthe number of vehicles on the road for the past few decades hasbeen associated with a considerable increase in vehicle-related mo-bile source air toxic (MSAT) emissions that significantly adversely af-fect human health [7–12].
Depending on fuel types and driving conditions, vehicles on theroad emit various regulated and unregulated toxic componentssuch as hydrocarbon (HC), carbon monoxide (CO), nitrogen oxides(NOx), aerosol particulates, polycyclic aromatic hydrocarbons(PAHs), and volatile organic compounds (VOCs) [13–19]. Nowadays,the use of a three-way catalyst (TWC) with conventional port fuel
injection (PFI) gasoline and liquefied petroleum gas (LPG) enginescan effectively reduce the engine-out gaseous emissions and canclear the strict emission standards that are determined by theestablished vehicle certification modes [20–26].
The Ministry of Environment (MOE) in Korea has periodicallymonitored the emission inventories of the various fueled vehiclesto improve the urban air quality and enforce future emission regula-tions. To construct the relative emission factors for each fueled vehicle,the National Institute of Environmental Research (NIER) modes thatfully covered the driving patterns of vehicles nationwide were used.From the analysis of the air quality in metropolitan areas with real-world driving modes, the introduction of public transportation fuelsfor LPG passenger vehicles and compressed natural gas (CNG) buseshave led to a significant reduction in PM, NOx, and VOCs compared toconventional liquid fuels worldwide [27–31].
Although gasoline direct injection (GDI) engines with the TWChave the advantages of increased engine power and lower fuel con-sumption than PFI engines, the fuel wetting phenomena and heteroge-neous mixture formations during the transient operating conditionsproduce significant amounts of particulates compared to diesel particu-late filter (DPF)-equipped diesel engines. In particular, to meet the pro-posed particulate mass (PM) and nano-particle number (PN) emissionregulations for GDI vehicles, comprehensive approaches have been un-dertaken on the engine control strategy, combustion chamber design,
Fuel Processing Technology 119 (2014) 19–31
⁎ Corresponding author. Tel.: +82 2 3290 3368; fax: +82 2 926 9290.E-mail address: [email protected] (S. Park).
0378-3820/$ – see front matter © 2013 Elsevier B.V. All rights reserved.http://dx.doi.org/10.1016/j.fuproc.2013.10.013
Contents lists available at ScienceDirect
Fuel Processing Technology
j ourna l homepage: www.e lsev ie r .com/ locate / fuproc
high-pressure injection system, and gasoline particulate filter (GPF)in extreme cases [32–40]. In addition, many studies have reportedthat unregulated toxic exhaust emissions of VOCs are caused by par-tial oxidation during the combustion process or by evaporation ofautomotive fuels. The levels of MSATs are closely related with thefuel compositions and engine operating conditions in a spark-ignition engine [15–18,41–50].
Currently, LPG cars with PFI fuel supply systems (liquid phase orgas phase) occupy about 13.4% (2.4 million) of the total number ofin-use vehicles in Korea. As the LPG was injected in the intake portlocations, the volumetric efficiency was reduced owing to thedischarging the intake air by fast vaporization compared to gaso-line PFI engines [26,51–56]. When the liquid phase LPG fuel is di-rectly injected into the cylinders, more stable combustion andless particulate emissions as well as unregulated harmful emis-sions can be achieved through the homogeneous mixture forma-tion in the combustion process than in the GDI engine. Moreover,previous studies have shown that the engine performance of LPG-DI systems is comparable to that of the GDI engine owing to thehigher heating value of the liquid phase LPG [25,57–61]. In partic-ular, several challenging obstacles need to be overcome to developthe dedicated LPG-DI engine, fuel supply system, and engine con-trol strategy considering the chemical and physical LPG fuelproperties [24,25,42,51,58,59,62–64].
The goal of our study is to evaluate the MSAT emission character-istics from a state-of-the-art GDI and a dedicated LPG-DI passengervehicle. The vehicle driving conditions were selected as a series ofthe NIER modes that reflect real-world running patterns of vehiclesin Korea. To study the relative emission factors on the gasoline-and LPG-fueled vehicle, besides the regulated gaseous and size-resolved PM emissions, unregulated emission components that are
considered harmful species of substantially impact on human healthwere analyzed.
2. Experimental apparatus
2.1. Description of test vehicle and fuels
A year 2010 model 2.4 L GDI vehicle with a common-rail systemand side-mounted high-pressure injectors with a maximum injec-tion pressure of 150 bar was tested. A two-brick UCC combinedwith dual air gap exhaust manifold can meet the ultra-low emissionvehicle (ULEV) emission standards. The fuel supply systems and var-ious engine control parameters of the base GDI engineweremodifiedfor evaluating the exhaust emissions of the LPG-DI engine consider-ing the physical properties of the LPG fuel [25,34,40,51,58,59,62].
Fig. 1 shows a schematic diagram of the 2.4 L DI engine and fuelsupply system for gasoline and LPG fuels. The returnless-type low-pressure fuel supply system and high pressure pump for gasolinewas converted into a return-type system for the LPG fuel. Comparedto a direct current (DC) pump of 4.5 bar for the base GDI engine, abrushless direct current (BLDC) pump with a low-pressure regulatorof 7.0 bar was installed for the LPG operation to improve the build-up time of the high pressure fuel in the common-rail and to eliminatethe vapor-lock characteristics in the LPG fuel supply line. The gaso-line injection parameters of the injection pulse width and injectiontiming, which influence the engine performance during the startand aggressive transient operating conditions, were finelyrecalibrated for the dedicated LPG-DI transient vehicle operation[25,58,59,62]. When the vehicle was running with the LPG fuel, thefunction of a purge control solenoid valve (PCSV) installed between
Fig. 1. Schematic diagram of the 2.4 L DI engine and fuel supply system for gasoline and LPG fuels.
20 C.-L. Myung et al. / Fuel Processing Technology 119 (2014) 19–31
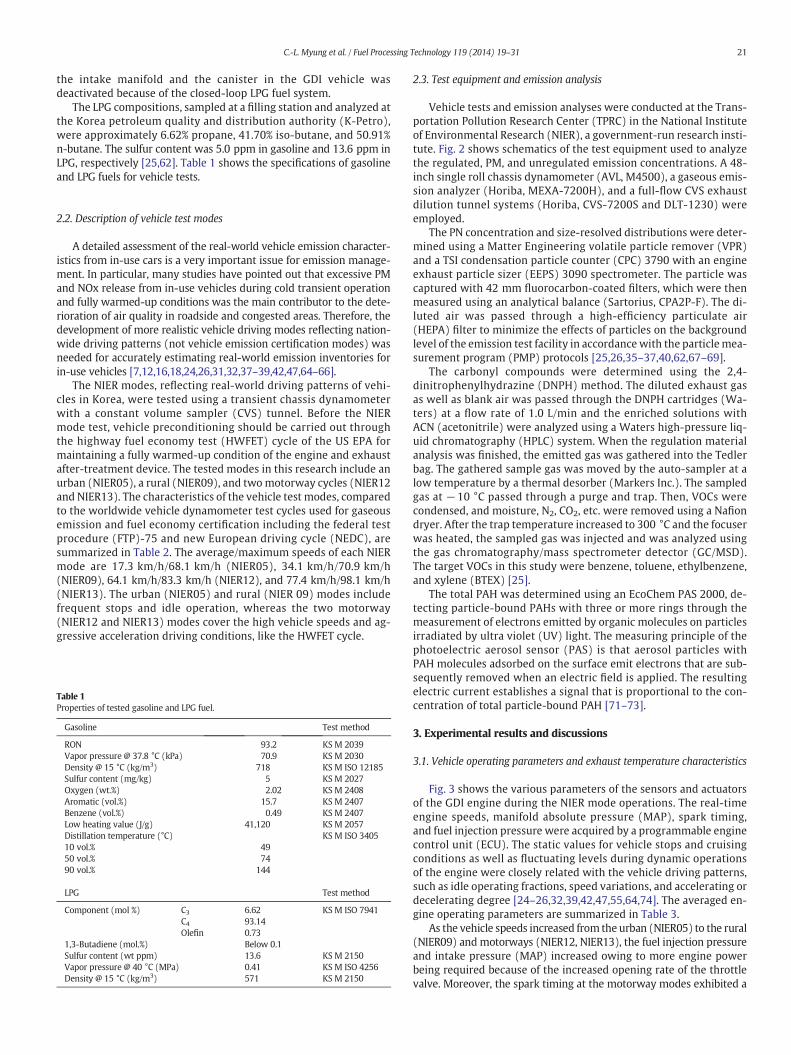
the intake manifold and the canister in the GDI vehicle wasdeactivated because of the closed-loop LPG fuel system.
The LPG compositions, sampled at a filling station and analyzed atthe Korea petroleum quality and distribution authority (K-Petro),were approximately 6.62% propane, 41.70% iso-butane, and 50.91%n-butane. The sulfur content was 5.0 ppm in gasoline and 13.6 ppm inLPG, respectively [25,62]. Table 1 shows the specifications of gasolineand LPG fuels for vehicle tests.
2.2. Description of vehicle test modes
A detailed assessment of the real-world vehicle emission character-istics from in-use cars is a very important issue for emission manage-ment. In particular, many studies have pointed out that excessive PMand NOx release from in-use vehicles during cold transient operationand fully warmed-up conditions was the main contributor to the dete-rioration of air quality in roadside and congested areas. Therefore, thedevelopment of more realistic vehicle driving modes reflecting nation-wide driving patterns (not vehicle emission certification modes) wasneeded for accurately estimating real-world emission inventories forin-use vehicles [7,12,16,18,24,26,31,32,37–39,42,47,64–66].
The NIER modes, reflecting real-world driving patterns of vehi-cles in Korea, were tested using a transient chassis dynamometerwith a constant volume sampler (CVS) tunnel. Before the NIERmode test, vehicle preconditioning should be carried out throughthe highway fuel economy test (HWFET) cycle of the US EPA formaintaining a fully warmed-up condition of the engine and exhaustafter-treatment device. The tested modes in this research include anurban (NIER05), a rural (NIER09), and twomotorway cycles (NIER12and NIER13). The characteristics of the vehicle test modes, comparedto the worldwide vehicle dynamometer test cycles used for gaseousemission and fuel economy certification including the federal testprocedure (FTP)-75 and new European driving cycle (NEDC), aresummarized in Table 2. The average/maximum speeds of each NIERmode are 17.3 km/h/68.1 km/h (NIER05), 34.1 km/h/70.9 km/h(NIER09), 64.1 km/h/83.3 km/h (NIER12), and 77.4 km/h/98.1 km/h(NIER13). The urban (NIER05) and rural (NIER 09) modes includefrequent stops and idle operation, whereas the two motorway(NIER12 and NIER13) modes cover the high vehicle speeds and ag-gressive acceleration driving conditions, like the HWFET cycle.
2.3. Test equipment and emission analysis
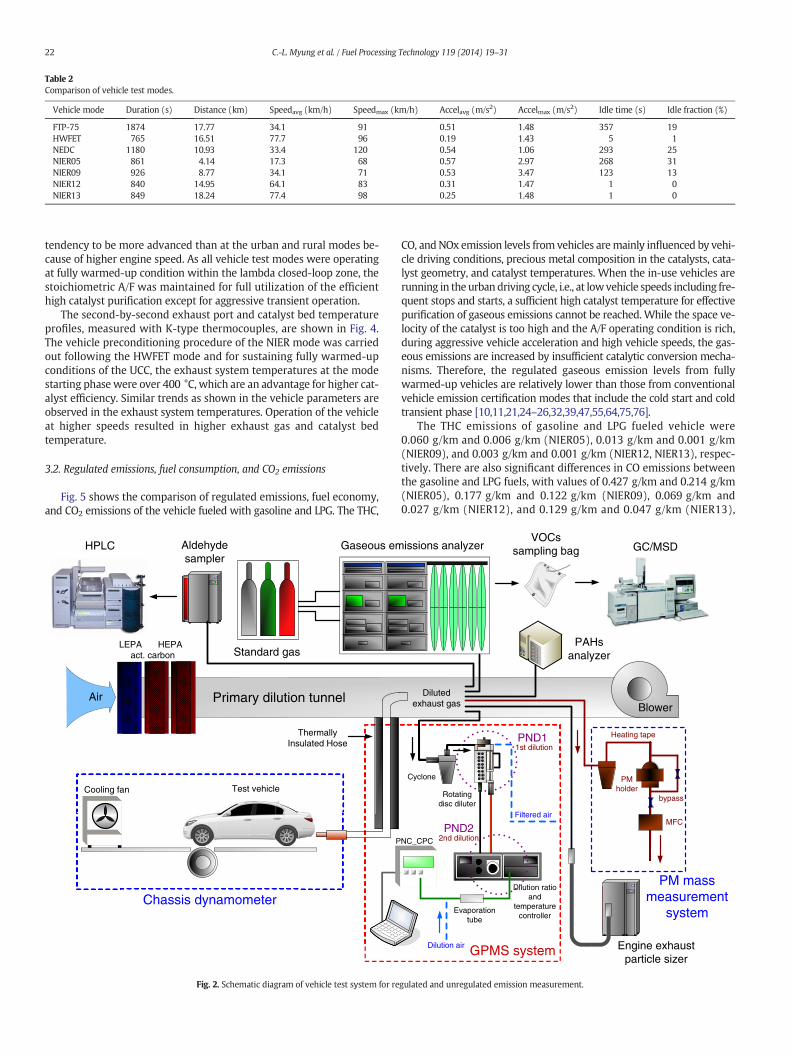
Vehicle tests and emission analyses were conducted at the Trans-portation Pollution Research Center (TPRC) in the National Instituteof Environmental Research (NIER), a government-run research insti-tute. Fig. 2 shows schematics of the test equipment used to analyzethe regulated, PM, and unregulated emission concentrations. A 48-inch single roll chassis dynamometer (AVL, M4500), a gaseous emis-sion analyzer (Horiba, MEXA-7200H), and a full-flow CVS exhaustdilution tunnel systems (Horiba, CVS-7200S and DLT-1230) wereemployed.
The PN concentration and size-resolved distributions were deter-mined using a Matter Engineering volatile particle remover (VPR)and a TSI condensation particle counter (CPC) 3790 with an engineexhaust particle sizer (EEPS) 3090 spectrometer. The particle wascaptured with 42 mm fluorocarbon-coated filters, which were thenmeasured using an analytical balance (Sartorius, CPA2P-F). The di-luted air was passed through a high-efficiency particulate air(HEPA) filter to minimize the effects of particles on the backgroundlevel of the emission test facility in accordancewith the particlemea-surement program (PMP) protocols [25,26,35–37,40,62,67–69].
The carbonyl compounds were determined using the 2,4-dinitrophenylhydrazine (DNPH) method. The diluted exhaust gasas well as blank air was passed through the DNPH cartridges (Wa-ters) at a flow rate of 1.0 L/min and the enriched solutions withACN (acetonitrile) were analyzed using a Waters high-pressure liq-uid chromatography (HPLC) system. When the regulation materialanalysis was finished, the emitted gas was gathered into the Tedlerbag. The gathered sample gas was moved by the auto-sampler at alow temperature by a thermal desorber (Markers Inc.). The sampledgas at −10 °C passed through a purge and trap. Then, VOCs werecondensed, and moisture, N2, CO2, etc. were removed using a Nafiondryer. After the trap temperature increased to 300 °C and the focuserwas heated, the sampled gas was injected and was analyzed usingthe gas chromatography/mass spectrometer detector (GC/MSD).The target VOCs in this study were benzene, toluene, ethylbenzene,and xylene (BTEX) [25].
The total PAH was determined using an EcoChem PAS 2000, de-tecting particle-bound PAHs with three or more rings through themeasurement of electrons emitted by organic molecules on particlesirradiated by ultra violet (UV) light. The measuring principle of thephotoelectric aerosol sensor (PAS) is that aerosol particles withPAH molecules adsorbed on the surface emit electrons that are sub-sequently removed when an electric field is applied. The resultingelectric current establishes a signal that is proportional to the con-centration of total particle-bound PAH [71–73].
3. Experimental results and discussions
3.1. Vehicle operating parameters and exhaust temperature characteristics
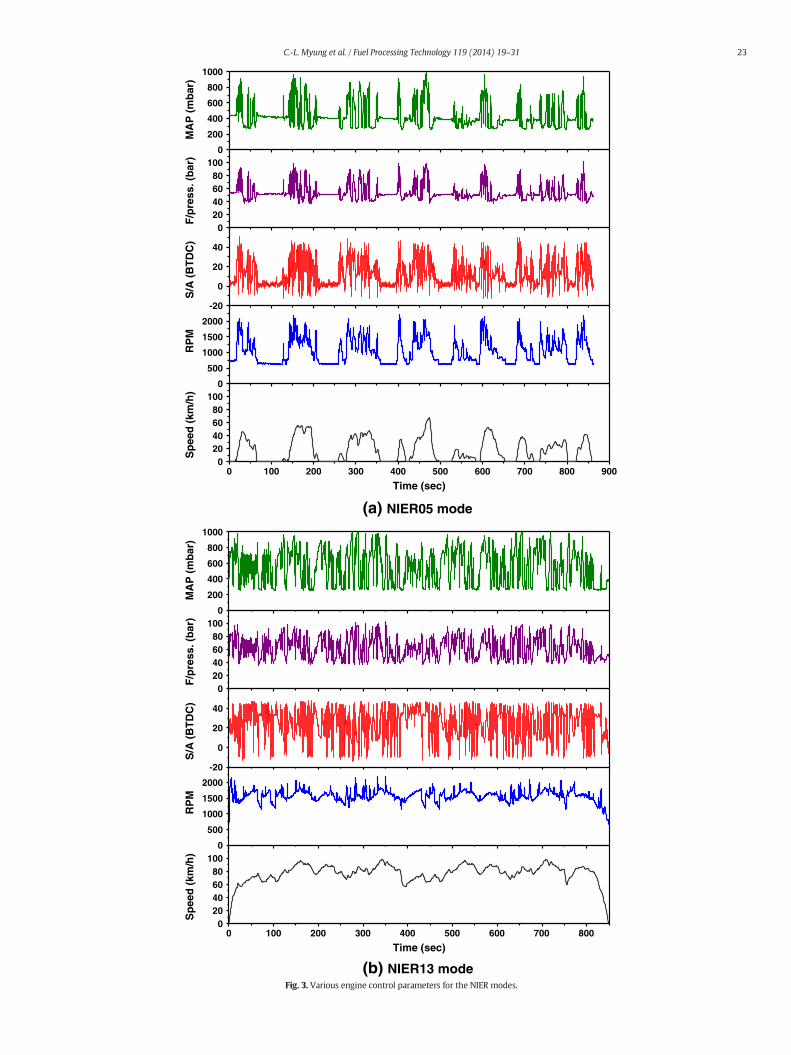
Fig. 3 shows the various parameters of the sensors and actuatorsof the GDI engine during the NIER mode operations. The real-timeengine speeds, manifold absolute pressure (MAP), spark timing,and fuel injection pressure were acquired by a programmable enginecontrol unit (ECU). The static values for vehicle stops and cruisingconditions as well as fluctuating levels during dynamic operationsof the engine were closely related with the vehicle driving patterns,such as idle operating fractions, speed variations, and accelerating ordecelerating degree [24–26,32,39,42,47,55,64,74]. The averaged en-gine operating parameters are summarized in Table 3.
As the vehicle speeds increased from the urban (NIER05) to the rural(NIER09) and motorways (NIER12, NIER13), the fuel injection pressureand intake pressure (MAP) increased owing to more engine powerbeing required because of the increased opening rate of the throttlevalve. Moreover, the spark timing at the motorway modes exhibited a
Table 1Properties of tested gasoline and LPG fuel.
Gasoline Test method
RON 93.2 KS M 2039Vapor pressure @ 37.8 °C (kPa) 70.9 KS M 2030Density @ 15 °C (kg/m3) 718 KS M ISO 12185Sulfur content (mg/kg) 5 KS M 2027Oxygen (wt.%) 2.02 KS M 2408Aromatic (vol.%) 15.7 KS M 2407Benzene (vol.%) 0.49 KS M 2407Low heating value (J/g) 41,120 KS M 2057Distillation temperature (°C) KS M ISO 340510 vol.% 4950 vol.% 7490 vol.% 144
LPG Test method
Component (mol %) C3 6.62 KS M ISO 7941C4 93.14Olefin 0.73
1,3-Butadiene (mol.%) Below 0.1Sulfur content (wt ppm) 13.6 KS M 2150Vapor pressure @ 40 °C (MPa) 0.41 KS M ISO 4256Density @ 15 °C (kg/m3) 571 KS M 2150
21C.-L. Myung et al. / Fuel Processing Technology 119 (2014) 19–31
tendency to be more advanced than at the urban and rural modes be-cause of higher engine speed. As all vehicle test modes were operatingat fully warmed-up condition within the lambda closed-loop zone, thestoichiometric A/F was maintained for full utilization of the efficienthigh catalyst purification except for aggressive transient operation.
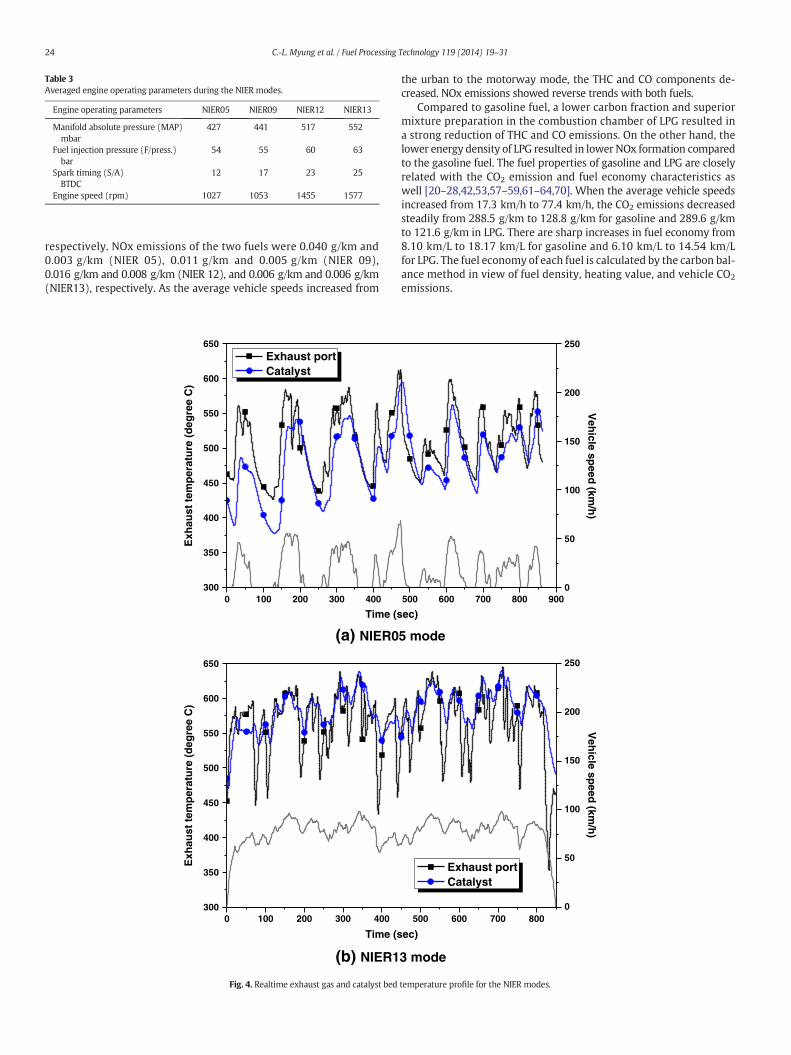
The second-by-second exhaust port and catalyst bed temperatureprofiles, measured with K-type thermocouples, are shown in Fig. 4.The vehicle preconditioning procedure of the NIER mode was carriedout following the HWFET mode and for sustaining fully warmed-upconditions of the UCC, the exhaust system temperatures at the modestarting phase were over 400 °C, which are an advantage for higher cat-alyst efficiency. Similar trends as shown in the vehicle parameters areobserved in the exhaust system temperatures. Operation of the vehicleat higher speeds resulted in higher exhaust gas and catalyst bedtemperature.
3.2. Regulated emissions, fuel consumption, and CO2 emissions
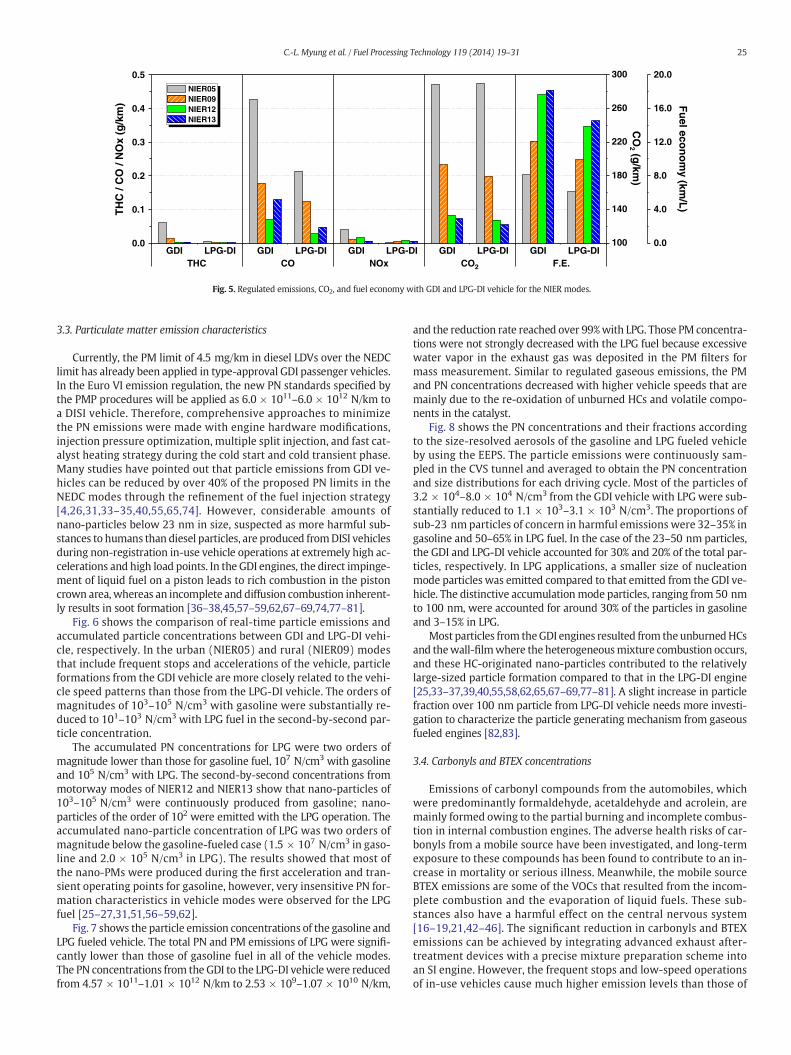
Fig. 5 shows the comparison of regulated emissions, fuel economy,and CO2 emissions of the vehicle fueled with gasoline and LPG. The THC,
CO, andNOx emission levels from vehicles aremainly influenced by vehi-cle driving conditions, precious metal composition in the catalysts, cata-lyst geometry, and catalyst temperatures. When the in-use vehicles arerunning in the urbandriving cycle, i.e., at lowvehicle speeds including fre-quent stops and starts, a sufficient high catalyst temperature for effectivepurification of gaseous emissions cannot be reached. While the space ve-locity of the catalyst is too high and the A/F operating condition is rich,during aggressive vehicle acceleration and high vehicle speeds, the gas-eous emissions are increased by insufficient catalytic conversion mecha-nisms. Therefore, the regulated gaseous emission levels from fullywarmed-up vehicles are relatively lower than those from conventionalvehicle emission certification modes that include the cold start and coldtransient phase [10,11,21,24–26,32,39,47,55,64,75,76].
The THC emissions of gasoline and LPG fueled vehicle were0.060 g/km and 0.006 g/km (NIER05), 0.013 g/km and 0.001 g/km(NIER09), and 0.003 g/km and 0.001 g/km (NIER12, NIER13), respec-tively. There are also significant differences in CO emissions betweenthe gasoline and LPG fuels, with values of 0.427 g/km and 0.214 g/km(NIER05), 0.177 g/km and 0.122 g/km (NIER09), 0.069 g/km and0.027 g/km (NIER12), and 0.129 g/km and 0.047 g/km (NIER13),
Table 2Comparison of vehicle test modes.
Vehicle mode Duration (s) Distance (km) Speedavg (km/h) Speedmax (km/h) Accelavg (m/s2) Accelmax (m/s2) Idle time (s) Idle fraction (%)
FTP-75 1874 17.77 34.1 91 0.51 1.48 357 19HWFET 765 16.51 77.7 96 0.19 1.43 5 1NEDC 1180 10.93 33.4 120 0.54 1.06 293 25NIER05 861 4.14 17.3 68 0.57 2.97 268 31NIER09 926 8.77 34.1 71 0.53 3.47 123 13NIER12 840 14.95 64.1 83 0.31 1.47 1 0NIER13 849 18.24 77.4 98 0.25 1.48 1 0
Test vehicle
ThermallyInsulated Hose
HEPA
Primary dilution tunnel
Standard gas
Air Dilutedexhaust gas
Cyclone
PND1
Dilution ratioand
temperaturecontroller
PNC_CPC
Rotatingdisc diluter
1st dilution
Evaporationtube
2nd dilution
Cooling fan
Engine exhaustparticle sizer
Gaseous emissions analyzer
MFC
PMholder
PM massmeasurement
system
GPMS system
Chassis dynamometer
PND2
LEPA
Filtered air
Dilution air
bypass
act. carbon
Heating tape
VOCssampling bag GC/MSDAldehyde
samplerHPLC
PAHsanalyzer
Blower
Fig. 2. Schematic diagram of vehicle test system for regulated and unregulated emission measurement.
22 C.-L. Myung et al. / Fuel Processing Technology 119 (2014) 19–31
0
200
400
600
800
1000
020406080
100
-20
0
20
40
0
500
1000
1500
2000
0 100 200 300 400 500 600 700 800 9000
20406080
100
MA
P (m
bar)
F/pr
ess.
(bar
)S
/A (B
TDC
)R
PM
Spe
ed (k
m/h
)
Time (sec)
(a) NIER05 mode
(b) NIER13 mode
0
200
400
600
800
1000
MA
P (m
bar)
020406080
100
F/pr
ess.
(bar
)
-20
0
20
40
S/A
(BTD
C)
0
500
1000
1500
2000
RP
M
0 100 200 300 400 500 600 700 8000
20406080
100
Spe
ed (k
m/h
)
Time (sec)
Fig. 3. Various engine control parameters for the NIER modes.
23C.-L. Myung et al. / Fuel Processing Technology 119 (2014) 19–31
respectively. NOx emissions of the two fuels were 0.040 g/km and0.003 g/km (NIER 05), 0.011 g/km and 0.005 g/km (NIER 09),0.016 g/km and 0.008 g/km (NIER 12), and 0.006 g/km and 0.006 g/km(NIER13), respectively. As the average vehicle speeds increased from
the urban to the motorway mode, the THC and CO components de-creased. NOx emissions showed reverse trends with both fuels.
Compared to gasoline fuel, a lower carbon fraction and superiormixture preparation in the combustion chamber of LPG resulted ina strong reduction of THC and CO emissions. On the other hand, thelower energy density of LPG resulted in lower NOx formation comparedto the gasoline fuel. The fuel properties of gasoline and LPG are closelyrelated with the CO2 emission and fuel economy characteristics aswell [20–28,42,53,57–59,61–64,70]. When the average vehicle speedsincreased from 17.3 km/h to 77.4 km/h, the CO2 emissions decreasedsteadily from 288.5 g/km to 128.8 g/km for gasoline and 289.6 g/kmto 121.6 g/km in LPG. There are sharp increases in fuel economy from8.10 km/L to 18.17 km/L for gasoline and 6.10 km/L to 14.54 km/Lfor LPG. The fuel economy of each fuel is calculated by the carbon bal-ance method in view of fuel density, heating value, and vehicle CO2
emissions.
Table 3Averaged engine operating parameters during the NIER modes.
Engine operating parameters NIER05 NIER09 NIER12 NIER13
Manifold absolute pressure (MAP)mbar
427 441 517 552
Fuel injection pressure (F/press.)bar
54 55 60 63
Spark timing (S/A)BTDC
12 17 23 25
Engine speed (rpm) 1027 1053 1455 1577
0 100 200 300 400 500 600 700 800 900300
350
400
450
500
550
600
650
Exh
aust
tem
pera
ture
(deg
ree
C)
Exh
aust
tem
pera
ture
(deg
ree
C)
Time (sec)
Exhaust portCatalyst
0
50
100
150
200
250
Vehicle speed (km
/h)
(a) NIER05 mode
0 100 200 300 400 500 600 700 800300
350
400
450
500
550
600
650
Time (sec)
Exhaust portCatalyst
0
50
100
150
200
250
Vehicle speed (km
/h)
(b) NIER13 mode
Fig. 4. Realtime exhaust gas and catalyst bed temperature profile for the NIER modes.
24 C.-L. Myung et al. / Fuel Processing Technology 119 (2014) 19–31
3.3. Particulate matter emission characteristics
Currently, the PM limit of 4.5 mg/km in diesel LDVs over the NEDClimit has already been applied in type-approval GDI passenger vehicles.In the Euro VI emission regulation, the new PN standards specified bythe PMP procedures will be applied as 6.0 × 10¹¹–6.0 × 10¹² N/km toa DISI vehicle. Therefore, comprehensive approaches to minimizethe PN emissions were made with engine hardware modifications,injection pressure optimization, multiple split injection, and fast cat-alyst heating strategy during the cold start and cold transient phase.Many studies have pointed out that particle emissions from GDI ve-hicles can be reduced by over 40% of the proposed PN limits in theNEDC modes through the refinement of the fuel injection strategy[4,26,31,33–35,40,55,65,74]. However, considerable amounts ofnano-particles below 23 nm in size, suspected as more harmful sub-stances to humans than diesel particles, are produced fromDISI vehiclesduring non-registration in-use vehicle operations at extremely high ac-celerations and high load points. In the GDI engines, the direct impinge-ment of liquid fuel on a piston leads to rich combustion in the pistoncrown area, whereas an incomplete and diffusion combustion inherent-ly results in soot formation [36–38,45,57–59,62,67–69,74,77–81].
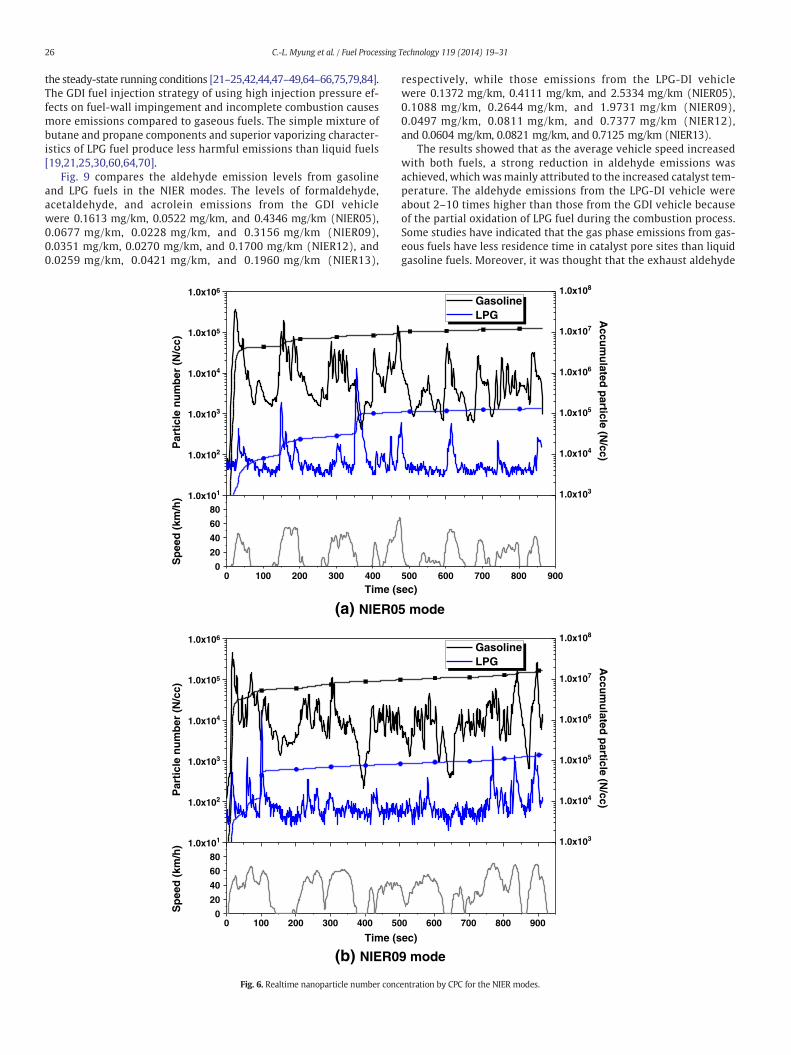
Fig. 6 shows the comparison of real-time particle emissions andaccumulated particle concentrations between GDI and LPG-DI vehi-cle, respectively. In the urban (NIER05) and rural (NIER09) modesthat include frequent stops and accelerations of the vehicle, particleformations from the GDI vehicle are more closely related to the vehi-cle speed patterns than those from the LPG-DI vehicle. The orders ofmagnitudes of 103–105 N/cm3 with gasoline were substantially re-duced to 101–103 N/cm3 with LPG fuel in the second-by-second par-ticle concentration.
The accumulated PN concentrations for LPG were two orders ofmagnitude lower than those for gasoline fuel, 107 N/cm3 with gasolineand 105 N/cm3 with LPG. The second-by-second concentrations frommotorway modes of NIER12 and NIER13 show that nano-particles of103–105 N/cm3 were continuously produced from gasoline; nano-particles of the order of 102 were emitted with the LPG operation. Theaccumulated nano-particle concentration of LPG was two orders ofmagnitude below the gasoline-fueled case (1.5 × 10⁷ N/cm3 in gaso-line and 2.0 × 10⁵ N/cm3 in LPG). The results showed that most ofthe nano-PMs were produced during the first acceleration and tran-sient operating points for gasoline, however, very insensitive PN for-mation characteristics in vehicle modes were observed for the LPGfuel [25–27,31,51,56–59,62].
Fig. 7 shows the particle emission concentrations of the gasoline andLPG fueled vehicle. The total PN and PM emissions of LPG were signifi-cantly lower than those of gasoline fuel in all of the vehicle modes.The PN concentrations from the GDI to the LPG-DI vehicle were reducedfrom 4.57 × 10¹¹–1.01 × 10¹² N/km to 2.53 × 10⁹–1.07 × 10¹⁰ N/km,
and the reduction rate reached over 99%with LPG. Those PM concentra-tions were not strongly decreased with the LPG fuel because excessivewater vapor in the exhaust gas was deposited in the PM filters formass measurement. Similar to regulated gaseous emissions, the PMand PN concentrations decreased with higher vehicle speeds that aremainly due to the re-oxidation of unburned HCs and volatile compo-nents in the catalyst.
Fig. 8 shows the PN concentrations and their fractions accordingto the size-resolved aerosols of the gasoline and LPG fueled vehicleby using the EEPS. The particle emissions were continuously sam-pled in the CVS tunnel and averaged to obtain the PN concentrationand size distributions for each driving cycle. Most of the particles of3.2 × 104–8.0 × 10⁴ N/cm3 from the GDI vehicle with LPG were sub-stantially reduced to 1.1 × 10³–3.1 × 10³ N/cm3. The proportions ofsub-23 nm particles of concern in harmful emissions were 32–35% ingasoline and 50–65% in LPG fuel. In the case of the 23–50 nm particles,the GDI and LPG-DI vehicle accounted for 30% and 20% of the total par-ticles, respectively. In LPG applications, a smaller size of nucleationmode particles was emitted compared to that emitted from the GDI ve-hicle. The distinctive accumulationmode particles, ranging from 50 nmto 100 nm, were accounted for around 30% of the particles in gasolineand 3–15% in LPG.
Most particles from theGDI engines resulted from the unburnedHCsand thewall-filmwhere the heterogeneousmixture combustion occurs,and these HC-originated nano-particles contributed to the relativelylarge-sized particle formation compared to that in the LPG-DI engine[25,33–37,39,40,55,58,62,65,67–69,77–81]. A slight increase in particlefraction over 100 nm particle from LPG-DI vehicle needs more investi-gation to characterize the particle generating mechanism from gaseousfueled engines [82,83].
3.4. Carbonyls and BTEX concentrations
Emissions of carbonyl compounds from the automobiles, whichwere predominantly formaldehyde, acetaldehyde and acrolein, aremainly formed owing to the partial burning and incomplete combus-tion in internal combustion engines. The adverse health risks of car-bonyls from a mobile source have been investigated, and long-termexposure to these compounds has been found to contribute to an in-crease in mortality or serious illness. Meanwhile, the mobile sourceBTEX emissions are some of the VOCs that resulted from the incom-plete combustion and the evaporation of liquid fuels. These sub-stances also have a harmful effect on the central nervous system[16–19,21,42–46]. The significant reduction in carbonyls and BTEXemissions can be achieved by integrating advanced exhaust after-treatment devices with a precise mixture preparation scheme intoan SI engine. However, the frequent stops and low-speed operationsof in-use vehicles cause much higher emission levels than those of
GDI LPG-DI GDI LPG-DI GDI LPG-DI GDI LPG-DI GDI LPG-DI0.0
0.1
0.2
0.3
0.4
0.5
CO2NOxCO
THC
/ C
O /
NO
x (g
/km
)
NIER05NIER09NIER12NIER13
THC
100
140
180
220
260
300
F.E.
CO
2 (g/km)
0.0
4.0
8.0
12.0
16.0
20.0
Fuel economy (km
/L)
Fig. 5. Regulated emissions, CO2, and fuel economy with GDI and LPG-DI vehicle for the NIER modes.
25C.-L. Myung et al. / Fuel Processing Technology 119 (2014) 19–31
the steady-state running conditions [21–25,42,44,47–49,64–66,75,79,84].The GDI fuel injection strategy of using high injection pressure ef-fects on fuel-wall impingement and incomplete combustion causesmore emissions compared to gaseous fuels. The simple mixture ofbutane and propane components and superior vaporizing character-istics of LPG fuel produce less harmful emissions than liquid fuels[19,21,25,30,60,64,70].
Fig. 9 compares the aldehyde emission levels from gasolineand LPG fuels in the NIER modes. The levels of formaldehyde,acetaldehyde, and acrolein emissions from the GDI vehiclewere 0.1613 mg/km, 0.0522 mg/km, and 0.4346 mg/km (NIER05),0.0677 mg/km, 0.0228 mg/km, and 0.3156 mg/km (NIER09),0.0351 mg/km, 0.0270 mg/km, and 0.1700 mg/km (NIER12), and0.0259 mg/km, 0.0421 mg/km, and 0.1960 mg/km (NIER13),
respectively, while those emissions from the LPG-DI vehiclewere 0.1372 mg/km, 0.4111 mg/km, and 2.5334 mg/km (NIER05),0.1088 mg/km, 0.2644 mg/km, and 1.9731 mg/km (NIER09),0.0497 mg/km, 0.0811 mg/km, and 0.7377 mg/km (NIER12),and 0.0604 mg/km, 0.0821 mg/km, and 0.7125 mg/km (NIER13).
The results showed that as the average vehicle speed increasedwith both fuels, a strong reduction in aldehyde emissions wasachieved, which wasmainly attributed to the increased catalyst tem-perature. The aldehyde emissions from the LPG-DI vehicle wereabout 2–10 times higher than those from the GDI vehicle becauseof the partial oxidation of LPG fuel during the combustion process.Some studies have indicated that the gas phase emissions from gas-eous fuels have less residence time in catalyst pore sites than liquidgasoline fuels. Moreover, it was thought that the exhaust aldehyde
1.0x101
1.0x10²
1.0x10³
1.0x10⁴
1.0x10⁵
1.0x10⁶
Par
ticle
num
ber
(N/c
c)
GasolineLPG
0 100 200 300 400 500 600 700 800 9000
20406080
Spe
ed (k
m/h
)
1.0x101
1.0x10²
1.0x10³
1.0x10⁴
1.0x10⁵
1.0x10⁶
Par
ticle
num
ber
(N/c
c)
020406080
Spe
ed (k
m/h
)
Time (sec)
1.0x10³
1.0x10⁴
1.0x10⁵
1.0x10⁶
1.0x10⁷
1.0x10⁸
Accum
ulated particle (N/cc)
1.0x10³
1.0x10⁴
1.0x10⁵
1.0x10⁶
1.0x10⁷
1.0x10⁸
Accum
ulated particle (N/cc)
(a) NIER05 mode
0 100 200 300 400 500 600 700 800 900
GasolineLPG
Time (sec)
(b) NIER09 mode
Fig. 6. Realtime nanoparticle number concentration by CPC for the NIER modes.
26 C.-L. Myung et al. / Fuel Processing Technology 119 (2014) 19–31

emissions with gaseous fuels were not effectively oxidized throughthe gasoline catalytic converters during the low-speed and transientvehicle operation [24–27,42,51–54,56,59,60,64]. Further investiga-tion on catalyst formulation technology on precious metal composi-tion for a dedicated LPG-DI vehicle is required.
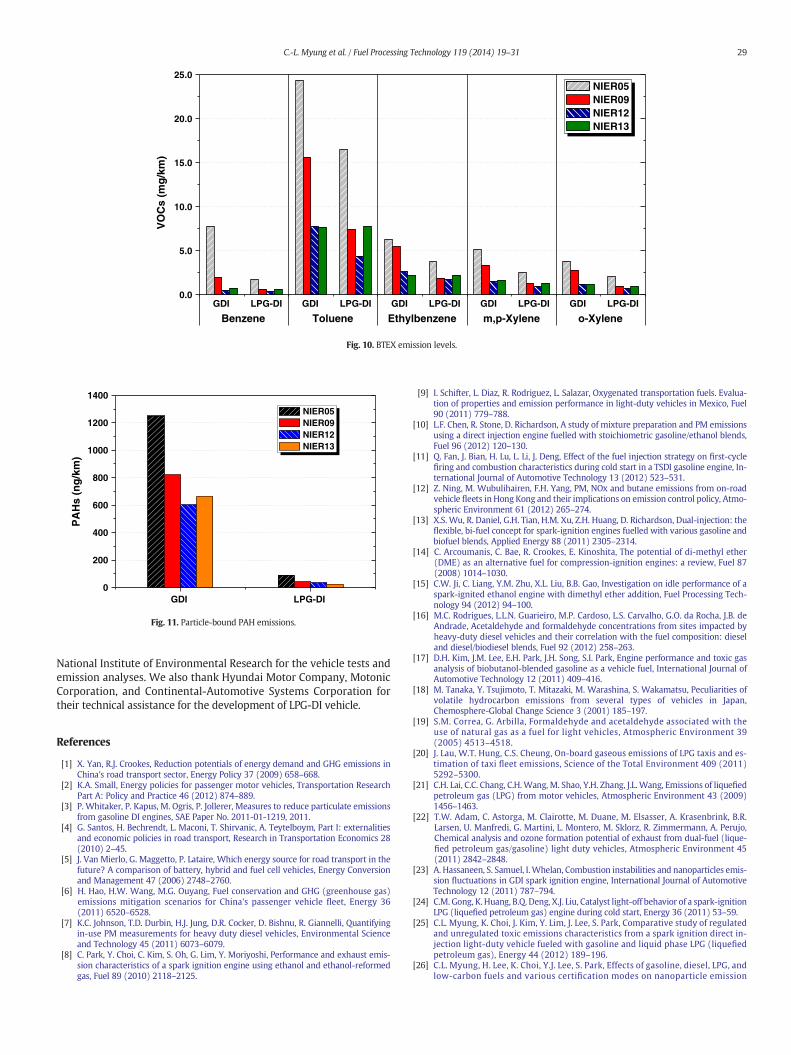
The comparison of the BTEX emissions is shown in Fig. 10. TheBTEX emission rates of the GDI (LPG-DI) vehicle varied from 3.8311(1.6843) mg/km to 24.3456 (16.4544) mg/km for NIER05, from1.9772 to 15.6085 (0.6554–7.3856) mg/km for NIER09, from 0.4579to 7.7462 (0.3182–4.3938) mg/km for NIER12, and from 0.7465 to7.7005 (0.6260–7.7643) mg/km for NIER13 modes. Except for NIER13mode, emissions of benzene, toluene, ethylbenzene, m,p-xylene, ando-xylene from the GDI vehicle were reduced by 30–78%, 32–52%,
34–65%, 37–63%, and 41–65%, respectively, with LPG as the fuel. Sim-ilar to carbonyl compound emissions, vehicle speed patterns signifi-cantly affected the BTEX formation in GDI vehicle, whereas thevehicle mode was not a critical factor for MSAT emissions in theLPG application.
3.5. Particle-bound PAH concentrations
The PAHs, numerous mixtures of hydrocarbon compounds, areclassified as semi-volatile organic compounds and other groupsadsorbed on PM. Although gasoline PFI vehicles with catalytic con-verters emit very low levels of PM, exhaust gases from a DISI engineare known to contain many toxic PAHs in fine particulate form. The
1.0x101
1.0x10²
1.0x10³
1.0x10⁴
1.0x10⁵
1.0x10⁶
Par
ticle
num
ber
(N/c
c)
020406080
Spe
ed (k
m/h
)
1.0x101
1.0x10²
1.0x10³
1.0x10⁴
1.0x10⁵
1.0x10⁶
Par
ticle
num
ber
(N/c
c)
020406080
Spe
ed (k
m/h
)
1.0x10³
1.0x10⁴
1.0x10⁵
1.0x10⁶
1.0x10⁷
1.0x10⁸
Accum
ulated particle (N/cc)
1.0x10³
1.0x10⁴
1.0x10⁵
1.0x10⁶
1.0x10⁷
1.0x10⁸
Accum
ulated particle (N/cc)
0 100 200 300 400 500 600 700 800
GasolineLPG
Time (sec)
(c) NIER12 mode
0 100 200 300 400 500 600 700 800
GasolineLPG
Time (sec)
(d) NIER13 mode
Fig. 6 (continued).
27C.-L. Myung et al. / Fuel Processing Technology 119 (2014) 19–31

PAHs in SI engines are strongly dependent on the combustion pro-cess, exhaust temperature, and chemical composition of the fuels.Some studies have indicated that the aromatic compounds in fueland lubricant from gasoline engines can significantly lead to parti-cle-bound PAHs. The PAH sources from LPG vehicles might originatefrom the combustion of lubricant oil and high molecular weight ad-ditives [18,21,41,43,66–70,77,82–86].
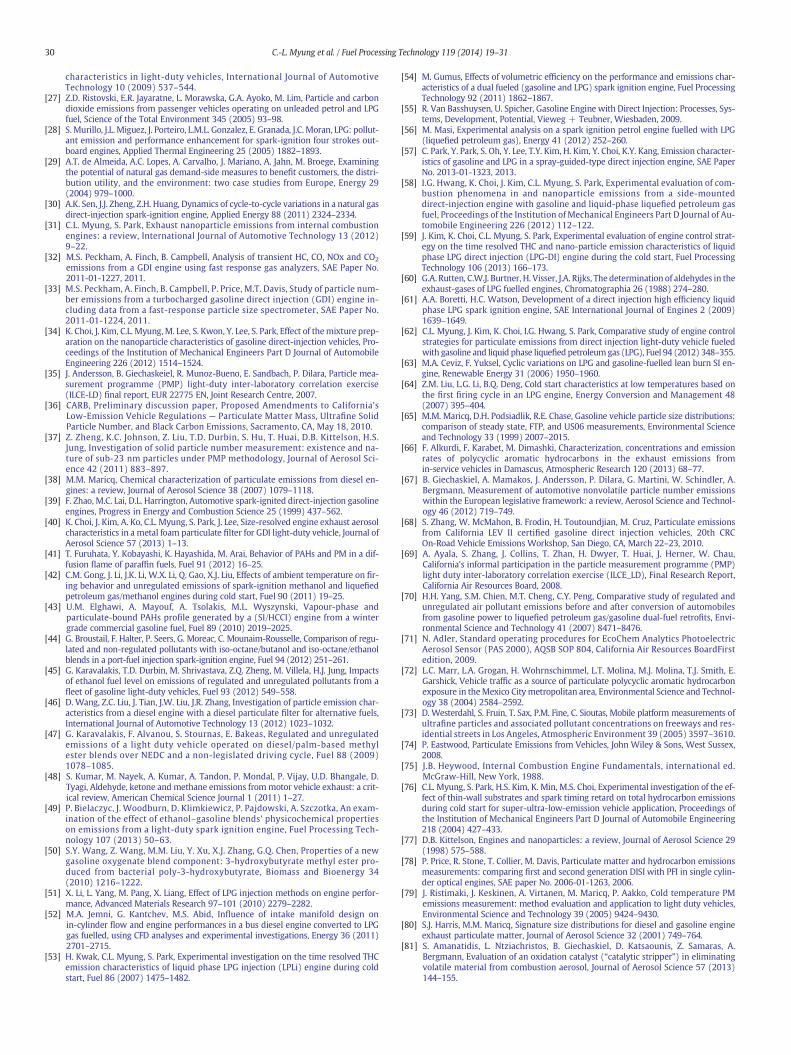
Concentrations of particle-bound PAHs according to the averagevehicle speed and fuel type are compared in Fig. 11. More PAHswere measured in urban and rural modes (NIER05 and NIER09),which include the frequent vehicle stops and idle operating condi-tions, than in motorwaymodes (NIER12 and NIER13). This can be ex-plained by the incomplete oxidation of unburned fuel and lowcatalyst temperature at idle and during low torque operation having
resulted in higher PAHs in both fuels. Because LPG fuel compositionis a very simple HC mixture, PAH concentrations showed extremelylow levels compared to gasoline. The PAH emissions of the GDI(LPG-DI) vehicle varied from 602 to 1250 (26–91) ng/km and the re-duction percentages with LPG fuel were 93%, 95%, 94%, and 96% forNIER05, NIER09, NIER12, and NIER13, respectively.
4. Conclusion
The comparative MSAT emission characteristics from a GDI anddedicated LPG-DI light-duty passenger vehicle were investigated.The fuel supply system and injection control scheme of the baseGDI engine were modified for the dedicated LPG-DI vehicle opera-tion. The various in-use vehicle test modes, reflecting real-worlddriving conditions, were chosen for determining the regulated andunregulated emission factors before and after LPG conversion. Theregulated and unregulated gaseous emissions of THC, NOx, PM, PN,and PAHs from the LPG-DI vehicle showed significantly lower emis-sion factors than the GDI vehicle. The low carbon fraction and lowheating value in LPG fuel decreased the CO2 emissions and fuel econ-omy by approximately 4–6% and 20%, respectively, compared withthose of the GDI vehicle.
The superior vaporization characteristics of LPG fuel in a combustionchamber reduced the fuel-wall impingement and the locally fuel richregion than the gasoline fuel, which resulted in a strong reduction inthe PN concentration of over 99% in real-world vehicle driving condi-tions and the proportions of sub-23 nm particles were 32–35% ingasoline and 50–65% in LPG.
The carbonyl levels with LPG applications were significantly in-creased by 2–10 times compared to gasoline, mainly because of thepartial oxidation of LPG fuel during the combustion process and thedifferent purificationmechanism of exhaust gases through a gasolinecatalytic converter. In particular, the particle-bound PAHs from theLPG-DI vehicle showed significantly lower emission concentrationover GDI vehicles, with reduction of 95%. Most of the MSAT emis-sions from an in-use vehicle were closely influenced by the drivingpatterns, exhaust system temperatures, and chemical properties ofthe fuels in a DISI passenger vehicle.
Acknowledgments
This study was supported by the CEFV (Center for EnvironmentallyFriendly Vehicle) as Global-Top Project of KMOE (Ministry of Envi-ronment, Korea) and Korea University Grant. The authors gratefullyacknowledge the Transportation Pollution Research Center in the
GDI LPG-DI GDI LPG-DI1E9
1E10
1E11
1E12
Par
ticle
num
ber
(N/k
m)
NIER05NIER09NIER12NIER13
0.0
1.0
2.0
3.0
Particle mass
Particle m
ass (mg/km
)
Particle number
Fig. 7. Particle emission concentrations of GDI and LPG-DI vehicle for the NIER modes.
Gas
olin
e
LPG
Gas
olin
e
LPG
Gas
olin
e
LPG
Gas
olin
e
LPG1.0x102
1.0x10³
1.0x10⁴
1.0x10⁵
NIER 13NIER 12NIER 09
Par
ticle
num
ber,
N/c
c
6-23nm 23-50nm 50-100nm 100-524nmNIER 05
0
20
40
60
80
100
Con
trib
utio
n (%
)
Fig. 8. Size resolved particle number concentration by EEPS from gasoline and LPG fueledvehicle.
GDI LPG-DI GDI LPG-DI GDI LPG-DI0.0
0.5
1.0
1.5
2.0
2.5
3.0
AcroleinAcetaldehyde
Ald
ehyd
es (g
/km
)
NIER05NIER09NIER12NIER13
Formaldehyde
Fig. 9. Formaldehyde, acetaldehyde, and acrolein emission levels.
28 C.-L. Myung et al. / Fuel Processing Technology 119 (2014) 19–31
National Institute of Environmental Research for the vehicle tests andemission analyses. We also thank Hyundai Motor Company, MotonicCorporation, and Continental-Automotive Systems Corporation fortheir technical assistance for the development of LPG-DI vehicle.
References
[1] X. Yan, R.J. Crookes, Reduction potentials of energy demand and GHG emissions inChina's road transport sector, Energy Policy 37 (2009) 658–668.
[2] K.A. Small, Energy policies for passenger motor vehicles, Transportation ResearchPart A: Policy and Practice 46 (2012) 874–889.
[3] P. Whitaker, P. Kapus, M. Ogris, P. Jollerer, Measures to reduce particulate emissionsfrom gasoline DI engines, SAE Paper No. 2011-01-1219, 2011.
[4] G. Santos, H. Bechrendt, L. Maconi, T. Shirvanic, A. Teytelboym, Part I: externalitiesand economic policies in road transport, Research in Transportation Economics 28(2010) 2–45.
[5] J. Van Mierlo, G. Maggetto, P. Lataire, Which energy source for road transport in thefuture? A comparison of battery, hybrid and fuel cell vehicles, Energy Conversionand Management 47 (2006) 2748–2760.
[6] H. Hao, H.W. Wang, M.G. Ouyang, Fuel conservation and GHG (greenhouse gas)emissions mitigation scenarios for China's passenger vehicle fleet, Energy 36(2011) 6520–6528.
[7] K.C. Johnson, T.D. Durbin, H.J. Jung, D.R. Cocker, D. Bishnu, R. Giannelli, Quantifyingin-use PM measurements for heavy duty diesel vehicles, Environmental Scienceand Technology 45 (2011) 6073–6079.
[8] C. Park, Y. Choi, C. Kim, S. Oh, G. Lim, Y. Moriyoshi, Performance and exhaust emis-sion characteristics of a spark ignition engine using ethanol and ethanol-reformedgas, Fuel 89 (2010) 2118–2125.
[9] I. Schifter, L. Diaz, R. Rodriguez, L. Salazar, Oxygenated transportation fuels. Evalua-tion of properties and emission performance in light-duty vehicles in Mexico, Fuel90 (2011) 779–788.
[10] L.F. Chen, R. Stone, D. Richardson, A study of mixture preparation and PM emissionsusing a direct injection engine fuelled with stoichiometric gasoline/ethanol blends,Fuel 96 (2012) 120–130.
[11] Q. Fan, J. Bian, H. Lu, L. Li, J. Deng, Effect of the fuel injection strategy on first-cyclefiring and combustion characteristics during cold start in a TSDI gasoline engine, In-ternational Journal of Automotive Technology 13 (2012) 523–531.
[12] Z. Ning, M. Wubulihairen, F.H. Yang, PM, NOx and butane emissions from on-roadvehicle fleets in Hong Kong and their implications on emission control policy, Atmo-spheric Environment 61 (2012) 265–274.
[13] X.S. Wu, R. Daniel, G.H. Tian, H.M. Xu, Z.H. Huang, D. Richardson, Dual-injection: theflexible, bi-fuel concept for spark-ignition engines fuelled with various gasoline andbiofuel blends, Applied Energy 88 (2011) 2305–2314.
[14] C. Arcoumanis, C. Bae, R. Crookes, E. Kinoshita, The potential of di-methyl ether(DME) as an alternative fuel for compression-ignition engines: a review, Fuel 87(2008) 1014–1030.
[15] C.W. Ji, C. Liang, Y.M. Zhu, X.L. Liu, B.B. Gao, Investigation on idle performance of aspark-ignited ethanol engine with dimethyl ether addition, Fuel Processing Tech-nology 94 (2012) 94–100.
[16] M.C. Rodrigues, L.L.N. Guarieiro, M.P. Cardoso, L.S. Carvalho, G.O. da Rocha, J.B. deAndrade, Acetaldehyde and formaldehyde concentrations from sites impacted byheavy-duty diesel vehicles and their correlation with the fuel composition: dieseland diesel/biodiesel blends, Fuel 92 (2012) 258–263.
[17] D.H. Kim, J.M. Lee, E.H. Park, J.H. Song, S.I. Park, Engine performance and toxic gasanalysis of biobutanol-blended gasoline as a vehicle fuel, International Journal ofAutomotive Technology 12 (2011) 409–416.
[18] M. Tanaka, Y. Tsujimoto, T. Mitazaki, M. Warashina, S. Wakamatsu, Peculiarities ofvolatile hydrocarbon emissions from several types of vehicles in Japan,Chemosphere-Global Change Science 3 (2001) 185–197.
[19] S.M. Correa, G. Arbilla, Formaldehyde and acetaldehyde associated with theuse of natural gas as a fuel for light vehicles, Atmospheric Environment 39(2005) 4513–4518.
[20] J. Lau, W.T. Hung, C.S. Cheung, On-board gaseous emissions of LPG taxis and es-timation of taxi fleet emissions, Science of the Total Environment 409 (2011)5292–5300.
[21] C.H. Lai, C.C. Chang, C.H. Wang, M. Shao, Y.H. Zhang, J.L. Wang, Emissions of liquefiedpetroleum gas (LPG) from motor vehicles, Atmospheric Environment 43 (2009)1456–1463.
[22] T.W. Adam, C. Astorga, M. Clairotte, M. Duane, M. Elsasser, A. Krasenbrink, B.R.Larsen, U. Manfredi, G. Martini, L. Montero, M. Sklorz, R. Zimmermann, A. Perujo,Chemical analysis and ozone formation potential of exhaust from dual-fuel (lique-fied petroleum gas/gasoline) light duty vehicles, Atmospheric Environment 45(2011) 2842–2848.
[23] A. Hassaneen, S. Samuel, I.Whelan, Combustion instabilities and nanoparticles emis-sion fluctuations in GDI spark ignition engine, International Journal of AutomotiveTechnology 12 (2011) 787–794.
[24] C.M. Gong, K. Huang, B.Q. Deng, X.J. Liu, Catalyst light-off behavior of a spark-ignitionLPG (liquefied petroleum gas) engine during cold start, Energy 36 (2011) 53–59.
[25] C.L. Myung, K. Choi, J. Kim, Y. Lim, J. Lee, S. Park, Comparative study of regulatedand unregulated toxic emissions characteristics from a spark ignition direct in-jection light-duty vehicle fueled with gasoline and liquid phase LPG (liquefiedpetroleum gas), Energy 44 (2012) 189–196.
[26] C.L. Myung, H. Lee, K. Choi, Y.J. Lee, S. Park, Effects of gasoline, diesel, LPG, andlow-carbon fuels and various certification modes on nanoparticle emission
GDI LPG-DI GDI LPG-DI GDI LPG-DI GDI LPG-DI GDI LPG-DI0.0
5.0
10.0
15.0
20.0
25.0
o-Xylenem,p-XyleneEthylbenzeneToluene
VO
Cs
(mg/
km)
NIER05NIER09NIER12NIER13
Benzene
Fig. 10. BTEX emission levels.
GDI LPG-DI0
200
400
600
800
1000
1200
1400
PA
Hs
(ng/
km)
NIER05NIER09NIER12NIER13
Fig. 11. Particle-bound PAH emissions.
29C.-L. Myung et al. / Fuel Processing Technology 119 (2014) 19–31
characteristics in light-duty vehicles, International Journal of AutomotiveTechnology 10 (2009) 537–544.
[27] Z.D. Ristovski, E.R. Jayaratne, L. Morawska, G.A. Ayoko, M. Lim, Particle and carbondioxide emissions from passenger vehicles operating on unleaded petrol and LPGfuel, Science of the Total Environment 345 (2005) 93–98.
[28] S. Murillo, J.L. Miguez, J. Porteiro, L.M.L. Gonzalez, E. Granada, J.C. Moran, LPG: pollut-ant emission and performance enhancement for spark-ignition four strokes out-board engines, Applied Thermal Engineering 25 (2005) 1882–1893.
[29] A.T. de Almeida, A.C. Lopes, A. Carvalho, J. Mariano, A. Jahn, M. Broege, Examiningthe potential of natural gas demand-side measures to benefit customers, the distri-bution utility, and the environment: two case studies from Europe, Energy 29(2004) 979–1000.
[30] A.K. Sen, J.J. Zheng, Z.H. Huang, Dynamics of cycle-to-cycle variations in a natural gasdirect-injection spark-ignition engine, Applied Energy 88 (2011) 2324–2334.
[31] C.L. Myung, S. Park, Exhaust nanoparticle emissions from internal combustionengines: a review, International Journal of Automotive Technology 13 (2012)9–22.
[32] M.S. Peckham, A. Finch, B. Campbell, Analysis of transient HC, CO, NOx and CO2
emissions from a GDI engine using fast response gas analyzers, SAE Paper No.2011-01-1227, 2011.
[33] M.S. Peckham, A. Finch, B. Campbell, P. Price, M.T. Davis, Study of particle num-ber emissions from a turbocharged gasoline direct injection (GDI) engine in-cluding data from a fast-response particle size spectrometer, SAE Paper No.2011-01-1224, 2011.
[34] K. Choi, J. Kim, C.L. Myung, M. Lee, S. Kwon, Y. Lee, S. Park, Effect of themixture prep-aration on the nanoparticle characteristics of gasoline direct-injection vehicles, Pro-ceedings of the Institution of Mechanical Engineers Part D Journal of AutomobileEngineering 226 (2012) 1514–1524.
[35] J. Andersson, B. Giechaskeiel, R. Munoz-Bueno, E. Sandbach, P. Dilara, Particle mea-surement programme (PMP) light-duty inter-laboratory correlation exercise(ILCE-LD) final report, EUR 22775 EN, Joint Research Centre, 2007.
[36] CARB, Preliminary discussion paper, Proposed Amendments to California'sLow-Emission Vehicle Regulations — Particulate Matter Mass, Ultrafine SolidParticle Number, and Black Carbon Emissions, Sacramento, CA, May 18, 2010.
[37] Z. Zheng, K.C. Johnson, Z. Liu, T.D. Durbin, S. Hu, T. Huai, D.B. Kittelson, H.S.Jung, Investigation of solid particle number measurement: existence and na-ture of sub-23 nm particles under PMP methodology, Journal of Aerosol Sci-ence 42 (2011) 883–897.
[38] M.M. Maricq, Chemical characterization of particulate emissions from diesel en-gines: a review, Journal of Aerosol Science 38 (2007) 1079–1118.
[39] F. Zhao, M.C. Lai, D.L. Harrington, Automotive spark-ignited direct-injection gasolineengines, Progress in Energy and Combustion Science 25 (1999) 437–562.
[40] K. Choi, J. Kim, A. Ko, C.L. Myung, S. Park, J. Lee, Size-resolved engine exhaust aerosolcharacteristics in a metal foam particulate filter for GDI light-duty vehicle, Journal ofAerosol Science 57 (2013) 1–13.
[41] T. Furuhata, Y. Kobayashi, K. Hayashida, M. Arai, Behavior of PAHs and PM in a dif-fusion flame of paraffin fuels, Fuel 91 (2012) 16–25.
[42] C.M. Gong, J. Li, J.K. Li, W.X. Li, Q. Gao, X.J. Liu, Effects of ambient temperature on fir-ing behavior and unregulated emissions of spark-ignition methanol and liquefiedpetroleum gas/methanol engines during cold start, Fuel 90 (2011) 19–25.
[43] U.M. Elghawi, A. Mayouf, A. Tsolakis, M.L. Wyszynski, Vapour-phase andparticulate-bound PAHs profile generated by a (SI/HCCI) engine from a wintergrade commercial gasoline fuel, Fuel 89 (2010) 2019–2025.
[44] G. Broustail, F. Halter, P. Seers, G. Moreac, C. Mounaim-Rousselle, Comparison of regu-lated and non-regulated pollutants with iso-octane/butanol and iso-octane/ethanolblends in a port-fuel injection spark-ignition engine, Fuel 94 (2012) 251–261.
[45] G. Karavalakis, T.D. Durbin, M. Shrivastava, Z.Q. Zheng, M. Villela, H.J. Jung, Impactsof ethanol fuel level on emissions of regulated and unregulated pollutants from afleet of gasoline light-duty vehicles, Fuel 93 (2012) 549–558.
[46] D. Wang, Z.C. Liu, J. Tian, J.W. Liu, J.R. Zhang, Investigation of particle emission char-acteristics from a diesel engine with a diesel particulate filter for alternative fuels,International Journal of Automotive Technology 13 (2012) 1023–1032.
[47] G. Karavalakis, F. Alvanou, S. Stournas, E. Bakeas, Regulated and unregulatedemissions of a light duty vehicle operated on diesel/palm-based methylester blends over NEDC and a non-legislated driving cycle, Fuel 88 (2009)1078–1085.
[48] S. Kumar, M. Nayek, A. Kumar, A. Tandon, P. Mondal, P. Vijay, U.D. Bhangale, D.Tyagi, Aldehyde, ketone and methane emissions frommotor vehicle exhaust: a crit-ical review, American Chemical Science Journal 1 (2011) 1–27.
[49] P. Bielaczyc, J. Woodburn, D. Klimkiewicz, P. Pajdowski, A. Szczotka, An exam-ination of the effect of ethanol–gasoline blends' physicochemical propertieson emissions from a light-duty spark ignition engine, Fuel Processing Tech-nology 107 (2013) 50–63.
[50] S.Y. Wang, Z. Wang, M.M. Liu, Y. Xu, X.J. Zhang, G.Q. Chen, Properties of a newgasoline oxygenate blend component: 3-hydroxybutyrate methyl ester pro-duced from bacterial poly-3-hydroxybutyrate, Biomass and Bioenergy 34(2010) 1216–1222.
[51] X. Li, L. Yang, M. Pang, X. Liang, Effect of LPG injection methods on engine perfor-mance, Advanced Materials Research 97–101 (2010) 2279–2282.
[52] M.A. Jemni, G. Kantchev, M.S. Abid, Influence of intake manifold design onin-cylinder flow and engine performances in a bus diesel engine converted to LPGgas fuelled, using CFD analyses and experimental investigations, Energy 36 (2011)2701–2715.
[53] H. Kwak, C.L. Myung, S. Park, Experimental investigation on the time resolved THCemission characteristics of liquid phase LPG injection (LPLi) engine during coldstart, Fuel 86 (2007) 1475–1482.
[54] M. Gumus, Effects of volumetric efficiency on the performance and emissions char-acteristics of a dual fueled (gasoline and LPG) spark ignition engine, Fuel ProcessingTechnology 92 (2011) 1862–1867.
[55] R. Van Basshuysen, U. Spicher, Gasoline Engine with Direct Injection: Processes, Sys-tems, Development, Potential, Vieweg + Teubner, Wiesbaden, 2009.
[56] M. Masi, Experimental analysis on a spark ignition petrol engine fuelled with LPG(liquefied petroleum gas), Energy 41 (2012) 252–260.
[57] C. Park, Y. Park, S. Oh, Y. Lee, T.Y. Kim, H. Kim, Y. Choi, K.Y. Kang, Emission character-istics of gasoline and LPG in a spray-guided-type direct injection engine, SAE PaperNo. 2013-01-1323, 2013.
[58] I.G. Hwang, K. Choi, J. Kim, C.L. Myung, S. Park, Experimental evaluation of com-bustion phenomena in and nanoparticle emissions from a side-mounteddirect-injection engine with gasoline and liquid-phase liquefied petroleum gasfuel, Proceedings of the Institution of Mechanical Engineers Part D Journal of Au-tomobile Engineering 226 (2012) 112–122.
[59] J. Kim, K. Choi, C.L. Myung, S. Park, Experimental evaluation of engine control strat-egy on the time resolved THC and nano-particle emission characteristics of liquidphase LPG direct injection (LPG-DI) engine during the cold start, Fuel ProcessingTechnology 106 (2013) 166–173.
[60] G.A. Rutten, C.W.J. Burtner, H. Visser, J.A. Rijks, The determination of aldehydes in theexhaust-gases of LPG fuelled engines, Chromatographia 26 (1988) 274–280.
[61] A.A. Boretti, H.C. Watson, Development of a direct injection high efficiency liquidphase LPG spark ignition engine, SAE International Journal of Engines 2 (2009)1639–1649.
[62] C.L. Myung, J. Kim, K. Choi, I.G. Hwang, S. Park, Comparative study of engine controlstrategies for particulate emissions from direct injection light-duty vehicle fueledwith gasoline and liquid phase liquefied petroleumgas (LPG), Fuel 94 (2012) 348–355.
[63] M.A. Ceviz, F. Yuksel, Cyclic variations on LPG and gasoline-fuelled lean burn SI en-gine, Renewable Energy 31 (2006) 1950–1960.
[64] Z.M. Liu, L.G. Li, B.Q. Deng, Cold start characteristics at low temperatures based onthe first firing cycle in an LPG engine, Energy Conversion and Management 48(2007) 395–404.
[65] M.M. Maricq, D.H. Podsiadlik, R.E. Chase, Gasoline vehicle particle size distributions:comparison of steady state, FTP, and US06 measurements, Environmental Scienceand Technology 33 (1999) 2007–2015.
[66] F. Alkurdi, F. Karabet, M. Dimashki, Characterization, concentrations and emissionrates of polycyclic aromatic hydrocarbons in the exhaust emissions fromin-service vehicles in Damascus, Atmospheric Research 120 (2013) 68–77.
[67] B. Giechaskiel, A. Mamakos, J. Andersson, P. Dilara, G. Martini, W. Schindler, A.Bergmann, Measurement of automotive nonvolatile particle number emissionswithin the European legislative framework: a review, Aerosol Science and Technol-ogy 46 (2012) 719–749.
[68] S. Zhang, W. McMahon, B. Frodin, H. Toutoundjian, M. Cruz, Particulate emissionsfrom California LEV II certified gasoline direct injection vehicles, 20th CRCOn-Road Vehicle Emissions Workshop, San Diego, CA, March 22–23, 2010.
[69] A. Ayala, S. Zhang, J. Collins, T. Zhan, H. Dwyer, T. Huai, J. Herner, W. Chau,California's informal participation in the particle measurement programme (PMP)light duty inter-laboratory correlation exercise (ILCE_LD), Final Research Report,California Air Resources Board, 2008.
[70] H.H. Yang, S.M. Chien, M.T. Cheng, C.Y. Peng, Comparative study of regulated andunregulated air pollutant emissions before and after conversion of automobilesfrom gasoline power to liquefied petroleum gas/gasoline dual-fuel retrofits, Envi-ronmental Science and Technology 41 (2007) 8471–8476.
[71] N. Adler, Standard operating procedures for EcoChem Analytics PhotoelectricAerosol Sensor (PAS 2000), AQSB SOP 804, California Air Resources BoardFirstedition, 2009.
[72] L.C. Marr, L.A. Grogan, H. Wohrnschimmel, L.T. Molina, M.J. Molina, T.J. Smith, E.Garshick, Vehicle traffic as a source of particulate polycyclic aromatic hydrocarbonexposure in theMexico Citymetropolitan area, Environmental Science and Technol-ogy 38 (2004) 2584–2592.
[73] D. Westerdahl, S. Fruin, T. Sax, P.M. Fine, C. Sioutas, Mobile platform measurements ofultrafine particles and associated pollutant concentrations on freeways and res-idential streets in Los Angeles, Atmospheric Environment 39 (2005) 3597–3610.
[74] P. Eastwood, Particulate Emissions from Vehicles, John Wiley & Sons, West Sussex,2008.
[75] J.B. Heywood, Internal Combustion Engine Fundamentals, international ed.McGraw-Hill, New York, 1988.
[76] C.L. Myung, S. Park, H.S. Kim, K. Min, M.S. Choi, Experimental investigation of the ef-fect of thin-wall substrates and spark timing retard on total hydrocarbon emissionsduring cold start for super-ultra-low-emission vehicle application, Proceedings ofthe Institution of Mechanical Engineers Part D Journal of Automobile Engineering218 (2004) 427–433.
[77] D.B. Kittelson, Engines and nanoparticles: a review, Journal of Aerosol Science 29(1998) 575–588.
[78] P. Price, R. Stone, T. Collier, M. Davis, Particulate matter and hydrocarbon emissionsmeasurements: comparing first and second generation DISI with PFI in single cylin-der optical engines, SAE paper No. 2006-01-1263, 2006.
[79] J. Ristimaki, J. Keskinen, A. Virtanen, M. Maricq, P. Aakko, Cold temperature PMemissions measurement: method evaluation and application to light duty vehicles,Environmental Science and Technology 39 (2005) 9424–9430.
[80] S.J. Harris, M.M. Maricq, Signature size distributions for diesel and gasoline engineexhaust particulate matter, Journal of Aerosol Science 32 (2001) 749–764.
[81] S. Amanatidis, L. Ntziachristos, B. Giechaskiel, D. Katsaounis, Z. Samaras, A.Bergmann, Evaluation of an oxidation catalyst (“catalytic stripper”) in eliminatingvolatile material from combustion aerosol, Journal of Aerosol Science 57 (2013)144–155.
30 C.-L. Myung et al. / Fuel Processing Technology 119 (2014) 19–31

[82] L.H. Dong, G.Q. Shu, X.Y. Liang, Effect of lubricating oil on the particle size distribu-tion and total number concentration in a diesel engine, Fuel Processing Technology109 (2013) 78–83.
[83] H. Jung, D.B. Kittelson, M.R. Zachariah, The influence of engine lubricating oil on dieselnanoparticle emissions and kinetics of oxidation, SAE paper No. 2003-01-3170, 2003.
[84] P. Stones, E. Sandbach, J. Norris, The effects of emerging vehicle technologies on cer-tain vehicle emissions not currently regulated, CFV Project Reference No. S0426/T4,Millbrook Proving Ground Ltd., 2006.
[85] L. Morawska, Z. Ristovski, E.R. Jayaratne, D.U. Keogh, X. Ling, Ambient nano and ul-trafine particles from motor vehicle emissions: characteristics, ambient processingand implications on human exposure, Atmospheric Environment 42 (2008)8113–8138.
[86] J.N. Carroll, I.A. Khalek, L.R. Smith, E. Fujita, B. Zielinska, Collaborative lubricatingoil study on emissions (CLOSE), final report, NREL Subcontract NumberAEV-7-66409-01, CRC Project Number AVFL-14, SwRI Project Nos. 03.13012and 03.13029, Southwest Research Institute, 2011.
31C.-L. Myung et al. / Fuel Processing Technology 119 (2014) 19–31