F I N A L R E P O R T
Understanding District-Charter Collaboration Grants
August 30, 2016
Christina Tuttle
Moira McCullough
Scott Richman
Kevin Booker
Alyson Burnett
Betsy Keating
Michael Cavanaugh
Submitted to: Bill & Melinda Gates Foundation
500 Fifth Ave. North
Seattle, WA 98102
Project Officer: Ebony Lee
Contract Number: 4993/23749 (20)
Submitted by: Mathematica Policy Research
1100 1st Street, NE
12th Floor
Washington, DC 20002-4221
Telephone: (202) 484-9220
Facsimile: (202) 863-1763
Project Director: Christina Clark Tuttle
Reference Number: 40224

This page has been left blank for double-sided copying.

DCC FINAL REPORT MATHEMATICA POLICY RESEARCH
iii
CONTENTS
I. INTRODUCTION .............................................................................................................................. 1
A. Background on collaboration grants and study design ................................................................... 1
II. GRANT IMPLEMENTATION ........................................................................................................... 7
A. Characteristics of participating districts and schools ...................................................................... 7
B. Description of grantee activities ...................................................................................................... 9
III. LESSONS LEARNED FROM THE DISTRICT-CHARTER COLLABORATION GRANTS IMPLEMENTATION ....................................................................................................................... 13
Key Finding #1: Cross-sector collaboration can and did occur and was viewed as facilitating the transfer of effective practices. ................................................................................................. 13
Key Finding #2: Participants perceived the grant activities as helping to build their cross-sector professional networks. ....................................................................................................... 16
Key Finding #3: The grant activities were seen as having a positive impact, but the scope of the impact was on a small-scale and generally confined to those directly participating in the activities. ................................................................................................................................. 17
Key Finding #4: Perceived structural factors, rather than a lack of interest, inhibited cross-sector collaboration—and without formal opportunities, cross-sector collaboration may not have occurred to the extent it did. .......................................................................................... 19
Key Finding #5: Although there is variation across cities, most had a general climate that was not closed to cross-sector collaboration, although some negative perceptions of the opposite sector remain. ................................................................................................................ 23
IV. COLLABORATION GRANT-FUNDED LEADERSHIP DEVELOPMENT PROGRAMS: A CASE STUDY ................................................................................................................................ 27
Funding and other supports: How are intensive leadership programs sustained? What sources of funding or other support are required for successful implementation? ....................... 32
Most promising components for replication: What are the most successful components of these programs from the perspectives of participants and program administrators? To what extent are the most successful components consistent across programs? ........................ 33
Program impacts: What are the perceived impacts of these programs on their cities? How do the programs influence cross-sector collaboration in particular? Is the inclusion of participants from multiple sectors perceived as a critical component in these programs? .......... 36
Challenges and lessons learned: What implementation challenges do leadership programs face? What changes have the programs made to address these challenges and improve implementation? ........................................................................................................................... 40
V. IMPLICATIONS FOR FUNDERS, PROGRAM OPERATORS, AND EDUCATION LEADERS ...................................................................................................................................... 47
APPENDIX A: DETAIL ON LEADERSHIP DEVELOPMENT PARTICIPANT SELECTION AND TRAINING ............................................................................................................................. A.1
DCC FINAL REPORT MATHEMATICA POLICY RESEARCH
iv
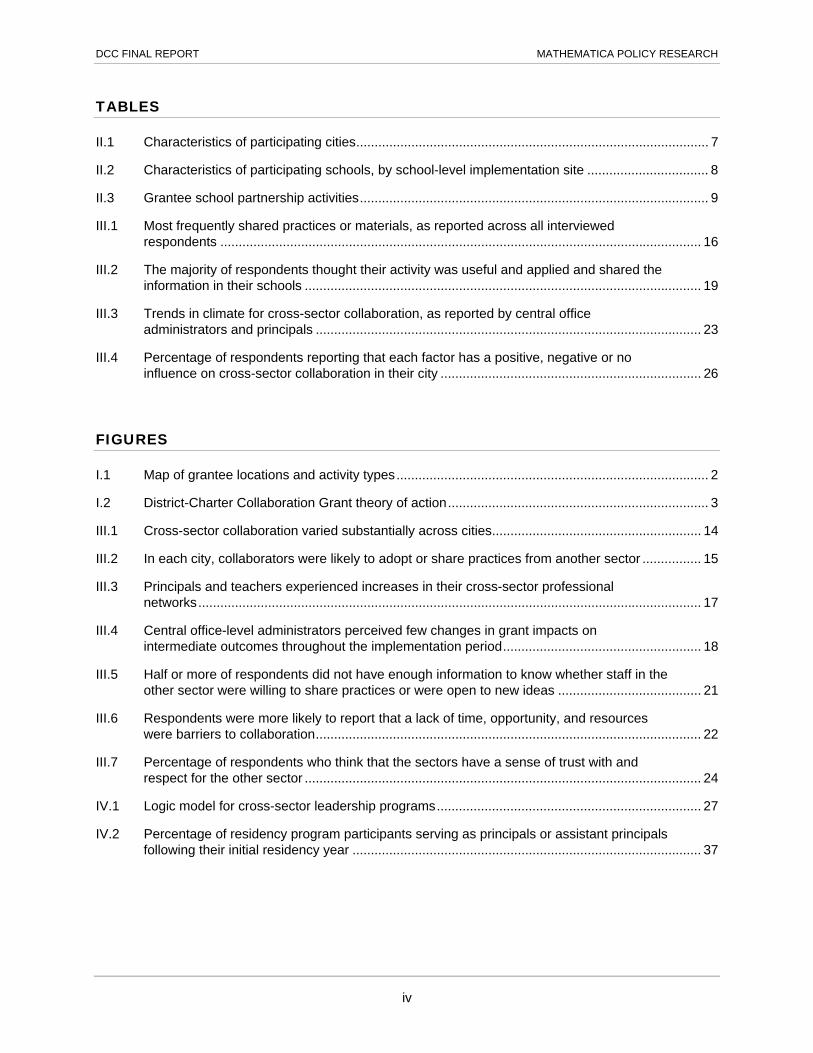
TABLES
II.1 Characteristics of participating cities ................................................................................................ 7
II.2 Characteristics of participating schools, by school-level implementation site ................................. 8
II.3 Grantee school partnership activities ............................................................................................... 9
III.1 Most frequently shared practices or materials, as reported across all interviewed respondents ................................................................................................................................... 16
III.2 The majority of respondents thought their activity was useful and applied and shared the information in their schools ............................................................................................................ 19
III.3 Trends in climate for cross-sector collaboration, as reported by central office administrators and principals ......................................................................................................... 23
III.4 Percentage of respondents reporting that each factor has a positive, negative or no influence on cross-sector collaboration in their city ....................................................................... 26
FIGURES
I.1 Map of grantee locations and activity types ..................................................................................... 2
I.2 District-Charter Collaboration Grant theory of action ....................................................................... 3
III.1 Cross-sector collaboration varied substantially across cities ......................................................... 14
III.2 In each city, collaborators were likely to adopt or share practices from another sector ................ 15
III.3 Principals and teachers experienced increases in their cross-sector professional networks ......................................................................................................................................... 17
III.4 Central office-level administrators perceived few changes in grant impacts on intermediate outcomes throughout the implementation period ...................................................... 18
III.5 Half or more of respondents did not have enough information to know whether staff in the other sector were willing to share practices or were open to new ideas ....................................... 21
III.6 Respondents were more likely to report that a lack of time, opportunity, and resources were barriers to collaboration ......................................................................................................... 22
III.7 Percentage of respondents who think that the sectors have a sense of trust with and respect for the other sector ............................................................................................................ 24
IV.1 Logic model for cross-sector leadership programs ........................................................................ 27
IV.2 Percentage of residency program participants serving as principals or assistant principals following their initial residency year ............................................................................................... 37
DCC FINAL REPORT MATHEMATICA POLICY RESEARCH
1
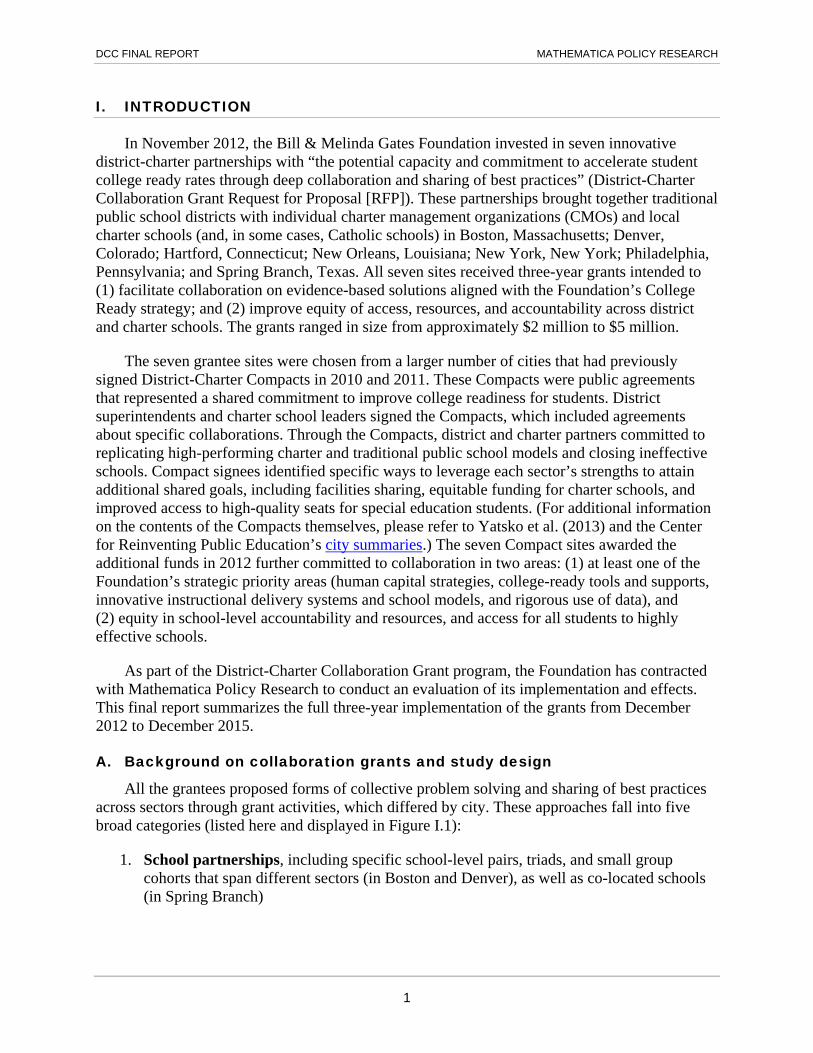
I. INTRODUCTION
In November 2012, the Bill & Melinda Gates Foundation invested in seven innovative district-charter partnerships with “the potential capacity and commitment to accelerate student college ready rates through deep collaboration and sharing of best practices” (District-Charter Collaboration Grant Request for Proposal [RFP]). These partnerships brought together traditional public school districts with individual charter management organizations (CMOs) and local charter schools (and, in some cases, Catholic schools) in Boston, Massachusetts; Denver, Colorado; Hartford, Connecticut; New Orleans, Louisiana; New York, New York; Philadelphia, Pennsylvania; and Spring Branch, Texas. All seven sites received three-year grants intended to (1) facilitate collaboration on evidence-based solutions aligned with the Foundation’s College Ready strategy; and (2) improve equity of access, resources, and accountability across district and charter schools. The grants ranged in size from approximately $2 million to $5 million.
The seven grantee sites were chosen from a larger number of cities that had previously signed District-Charter Compacts in 2010 and 2011. These Compacts were public agreements that represented a shared commitment to improve college readiness for students. District superintendents and charter school leaders signed the Compacts, which included agreements about specific collaborations. Through the Compacts, district and charter partners committed to replicating high-performing charter and traditional public school models and closing ineffective schools. Compact signees identified specific ways to leverage each sector’s strengths to attain additional shared goals, including facilities sharing, equitable funding for charter schools, and improved access to high-quality seats for special education students. (For additional information on the contents of the Compacts themselves, please refer to Yatsko et al. (2013) and the Center for Reinventing Public Education’s city summaries.) The seven Compact sites awarded the additional funds in 2012 further committed to collaboration in two areas: (1) at least one of the Foundation’s strategic priority areas (human capital strategies, college-ready tools and supports, innovative instructional delivery systems and school models, and rigorous use of data), and (2) equity in school-level accountability and resources, and access for all students to highly effective schools.
As part of the District-Charter Collaboration Grant program, the Foundation has contracted with Mathematica Policy Research to conduct an evaluation of its implementation and effects. This final report summarizes the full three-year implementation of the grants from December 2012 to December 2015.
A. Background on collaboration grants and study design
All the grantees proposed forms of collective problem solving and sharing of best practices across sectors through grant activities, which differed by city. These approaches fall into five broad categories (listed here and displayed in Figure I.1):
1. School partnerships, including specific school-level pairs, triads, and small group cohorts that span different sectors (in Boston and Denver), as well as co-located schools (in Spring Branch)

DCC FINAL REPORT MATHEMATICA POLICY RESEARCH
2
2. Leadership development, including cross-sector aspiring leader residency programs (in Hartford and Philadelphia) and cross-sector training for current and aspiring leaders (in Boston, New York City, and Spring Branch)
3. Common Core State Standards (CCSS) transitions, a cross-sector, collective approach to increasing readiness for Common Core implementation, including shared professional development (PD) and collaborative development, and sharing of curriculum and assessment materials related to Common Core implementation (in Hartford, New Orleans, New York City, and Philadelphia)
4. Teacher coaching, including shared PD not specific to the Common Core (in Boston), as well as district participation in charter coaching or adoption of charter coaching models (in Hartford, Philadelphia, and Spring Branch)
5. Community outreach, in which the New York City Collaborative Council sponsored school study tours to share best practices across sectors, conducted workshops for staff in both sectors, and implemented a public relations campaign on successful co-locations of charter and district schools (in New York only).
Figure I.1. Map of grantee locations and activity types
The goals of the District-Charter Collaboration Grants were ambitious. The Foundation outlined a theory of action for the grants (Figure I.2), whereby the successful implementation of collaborative activities—including sharing of effective school-level instructional practices and sharing of effective teaching practices across sectors—would lead to change in city-wide outcomes, including:
Improvement in teacher quality and human capital practices in existing schools
Greater transparency of school effectiveness information

DCC FINAL REPORT MATHEMATICA POLICY RESEARCH
3
Increase in financial and regulatory sustainability for charters
Increase in the percentage of special needs and English language learner (ELL) students attending effective schools
Opening of new schools that use effective teaching and human capital practices
Closure of ineffective schools
In turn, achieving these intermediate outcomes would then increase the supply of effective schools within the city, leading to an increase in student achievement (and college readiness).
Figure I.2. District-Charter Collaboration Grant theory of action
Source: RFP

DCC FINAL REPORT MATHEMATICA POLICY RESEARCH
4
Most of the grant activities aimed to improve the quality of teachers, principals, and classroom instruction through coaching, training, school partnerships, or sharing practices across sectors. The grant activities in general did not directly address the other immediate goals outlined in the theory of action. Consequently, we proposed three mechanisms to help in thinking about how the specific grant collaboration activities might have broader impacts:
1. Participants as emissaries: “They’re not as bad as you think.” District and charter participants in grant activities, who may initially have been wary or ill-informed about the other sector(s), end up playing roles as communicators and interpreters of the other sector(s) first, and then they fill the roles of bridge builders and collaborators on more substantial collaborations. Early participants may “recruit” others from their schools or organizations to participate, increasing the extent of collaboration.
2. Observational effect of collaboration: “Different sectors can work together.” As collaboration activities are implemented, other individuals who are not direct participants—other educators, as well as parents, citizens, and politicians—may see that cooperation is possible. They may begin to moderate their view that charters and traditional public school systems are engaged in a zero sum battle to increase their “market share” of students. These changes in perception could result in a more hospitable environment for additional or deeper collaboration.
3. Demonstration effect: “Collaboration can actually help.” In schools that grant activities directly target, teacher and school performance may improve. As evidence of positive results is generated and spread to others, additional schools may implement these lessons learned and adopt the same effective strategies.
Our three-year study of grant implementation examined the extent to which any of these pathways might be leading to broader cross-sector collaboration in the grantee sites. This report synthesizes findings across multiple data collection sources (see box) and offers broad findings from across the three-year grant period. These broad findings motivate a case study of leadership training programs, a component that participants overwhelmingly cited as successful, (Chapter IV) and policy implications for future funders, grantees, and participants in cross-sector collaboration activities (Chapter V). Specifically, this report addresses four sets of research questions:
1. How many people participated in grant activities? What were the characteristics of schools and students served by grant activities? (Chapter II)
2. What broader lessons about grant implementation and cross-sector collaboration can be drawn from our analysis across the grant period? (Chapter III)
3. How were school leadership training programs implemented? What aspects of the programs were particularly successful, and what challenges did the programs face? (Chapter IV)
4. What are the policy implications of this study’s three-year findings on district-charter collaboration? How can the findings inform future funding or programming decisions? (Chapter V)

DCC FINAL REPORT MATHEMATICA POLICY RESEARCH
5
This report addresses successes, challenges, and lessons learned across the full grant period to help guide future decisions regarding programming and funding of cross-sector collaboration activities. (The report does not attempt to analyze the grants’ full impact in the seven cities.) For the remainder of this report, we do not identify individual grantees, to protect the anonymity of respondents. As a result, the report looks broadly across all the seven grantee cities, without attributing specific findings to individual grantee cities.
Data collection and methods
To address the research questions, we collected and analyzed data from central office administrators, principals, and teachers in all seven grantee sites throughout the implementation period (from late 2013 through late 2015).
Data collection: Our study samples included traditional public and charter school respondents in Denver, Hartford, New York City, and Spring Branch, and traditional public, charter, and parochial school respondents in Boston and Philadelphia. In New Orleans, all school partners in the Compact were charter schools; although the Recovery School District (RSD) was a partner, no traditional public schools were named as partners, nor was the Orleans Parish School Board. Therefore, we collected data from charter school administrators, principals, and teachers, along with RSD administrators.
Interviews. We collected qualitative data from central office administrators, principals, and teachers in all seven grantee sites in two rounds: during early implementation (December 2013 through April 2014) and near the end of implementation (September to November 2015). We conducted one-hour, semi-structured interviews with 37 central office administrators in 2013–2014 and 38 in 2015. Administrator respondents were selected via purposeful sampling in each site to gather perspectives from four to five administrators closely involved with the Compact and from one or two administrators less active in the Compact. In 2013–2014, we conducted 48 one-hour, semi-structured interviews with school leaders (principals) through site visits and telephone calls. Likewise, in 2015 we conducted 37 interviews with school leaders. We also conducted in-person and telephone focus groups and interviews with 68 teachers in 2013–2014 and 68 teachers in 2015. To identify school leaders and teachers for interviews, we collected individual participant lists for all collaboration activities implemented through the Compact or collaboration grant in each site. We drew random samples of participants within each collaboration activity-school sector combination. We also randomly selected alternate respondents, who were recruited to participate when the selected participants declined to participate or were unresponsive after repeated contact. Rates of refusal were similar across sectors. Finally, we completed additional interviews in March 2016 with program participants and administrators in a subset of sites for a deeper investigation into the school leadership training programs.
Observations. From February to April 2014, we completed 15 observations of collaboration activities.
Surveys. We fielded a 25-minute, web-based survey of principals and teachers between April and August 2015. We attempted to administer the survey to all principal and teacher participants from all grant activities implemented in each city. The samples for the survey and for the qualitative interviews with school leaders and teachers were drawn from a similar pool of participants. The overall survey response rate was 62 percent, with response rates from individual grantee cities ranging from 52 to 71 percent. In total, 642 individuals (156 principals and 486 teachers) completed the survey.
Administrative data. To describe the number and type of participants, schools, and students involved in grant activities, we used data from the U.S. Department of Education’s National Center for Education Statistics, Common Core of Data (CCD) annual data sets. In addition, we collected participant lists and activity descriptions from all seven grantees.
DCC FINAL REPORT MATHEMATICA POLICY RESEARCH
6
Data collection and methods (continued)
Analytic methods: For Chapter II, we completed descriptive analyses on the characteristics of the participating districts and schools using the CCD data. All qualitative data (used in Chapters III and IV) were coded using ATLAS.ti by trained coders. Interviews were coded by multiple coders at several points during the coding process to check inter-rater reliability. After completing coding, the study team examined the data to identify common themes and categories related to collaboration, contextual factors, perceived grant impacts, and implementation successes and challenges. We conducted descriptive analyses of the quantitative survey data, such as means and percentages, to show the responses at the city level. We also report subgroup results by respondent type (teachers and principals) and respondent sector (district and charter schools). In addition, we conducted the appropriate significance tests when making comparisons across cities or respondent subgroups.
We use “traditional public school” to encompass all noncharter and nonprivate school types,
including pilot and innovation schools. In our analysis of New Orleans data, “cross-sector” collaboration refers to collaboration among charter school partners, because each charter school has operational autonomy and no traditional public schools operate under RSD.
For more information on the data collection and analyses methods for the two rounds of qualitative data collection, see McCullough et al. (2015) and McCullough et al. (2016). For more information on the survey data collection and analysis, see Richman et al. (2016).
DCC FINAL REPORT MATHEMATICA POLICY RESEARCH
7
II. GRANT IMPLEMENTATION
Grant implementation varied widely across cities. This evaluation focused on the collaboration activities that targeted specific staff participants, rather than on broader policy changes (such as common enrollment systems or the provision of facilities). The Foundation suggested several forms of collaboration that might occur across sectors: (1) the traditional public school district and charter partners jointly tackle specific challenges, (2) high performers—one sector or specific schools within a sector—share expertise with lower-performing peers on raising students’ achievement, and (3) the traditional public and charter sectors exchange resources or expertise in a fair exchange. As discussed in Chapter I, the collaboration activities differed by site (see Figure I.1) but fall into five broad categories:
1. School partnerships
2. Leadership development
3. CCSS transitions
4. Teacher coaching
5. Community outreach (specific to New York City)
The implementation of cross-sector activities by cities was somewhat limited in scope, both by design and in some instances due to fewer participants, cohorts, and activities than originally anticipated. Below, we present the characteristics of the participating schools, and describe in more detail the different activities that each city implemented.
A. Characteristics of participating districts and schools
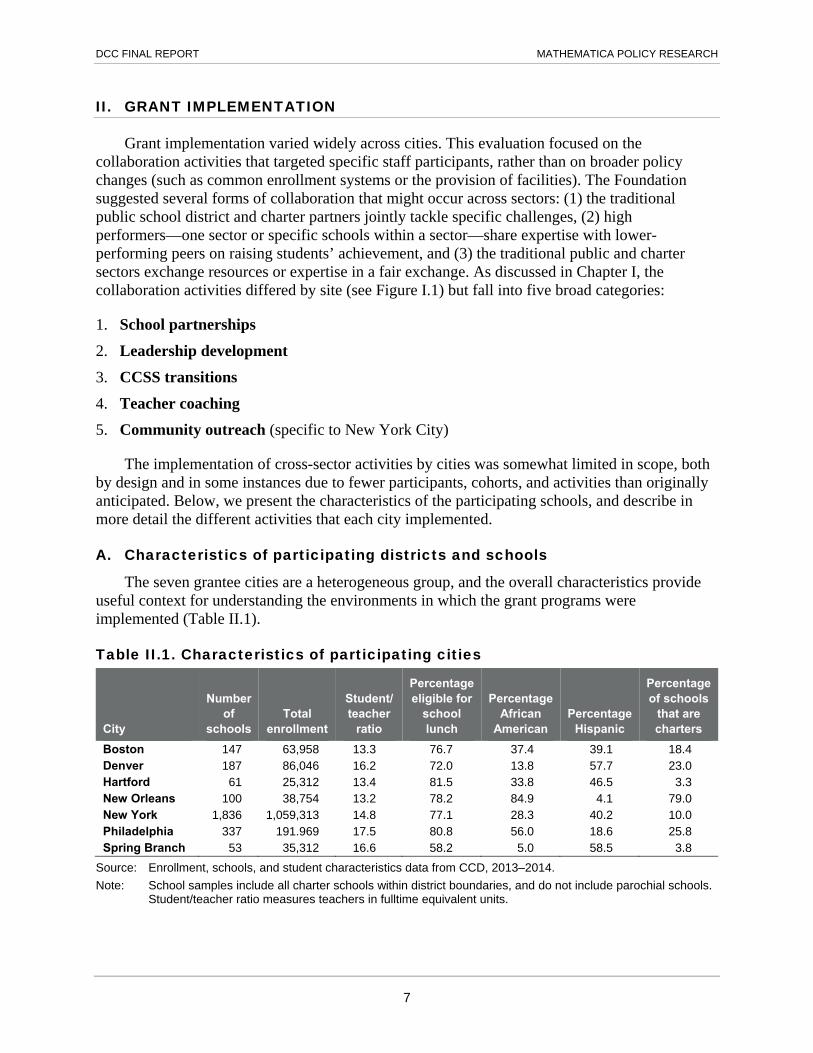
The seven grantee cities are a heterogeneous group, and the overall characteristics provide useful context for understanding the environments in which the grant programs were implemented (Table II.1).
Table II.1. Characteristics of participating cities
City
Number of
schools Total
enrollment
Student/teacher
ratio
Percentage eligible for
school lunch
Percentage African
American Percentage
Hispanic
Percentage of schools
that are charters
Boston 147 63,958 13.3 76.7 37.4 39.1 18.4Denver 187 86,046 16.2 72.0 13.8 57.7 23.0Hartford 61 25,312 13.4 81.5 33.8 46.5 3.3New Orleans 100 38,754 13.2 78.2 84.9 4.1 79.0New York 1,836 1,059,313 14.8 77.1 28.3 40.2 10.0Philadelphia 337 191.969 17.5 80.8 56.0 18.6 25.8Spring Branch 53 35,312 16.6 58.2 5.0 58.5 3.8
Source: Enrollment, schools, and student characteristics data from CCD, 2013–2014.
Note: School samples include all charter schools within district boundaries, and do not include parochial schools. Student/teacher ratio measures teachers in fulltime equivalent units.

DCC FINAL REPORT MATHEMATICA POLICY RESEARCH
8
Looking across the seven grantee sites, size varies widely, from smaller sites like Hartford and Spring Branch with fewer than 70 schools, to larger sites like Boston, Denver, and Philadelphia, with New York City by far the largest with over 1,800 schools. Total student enrollment also varies, and student/teacher ratio ranges from a low of 13.2 in New Orleans to a high of 17.5 in Philadelphia. The percentage of schools that are charter schools also varies widely, with Hartford and Spring Branch having the fewest charter schools, and New Orleans by far the most, where almost 80 percent of the schools were charter schools as of 2013–2014.
In terms of student characteristics, all of the sites have a majority of students eligible for free or reduced price lunch, ranging from 58 percent in Spring Branch to 81 percent in Hartford. In every site at least half of students are African American or Hispanic, with some sites predominantly African American (New Orleans, Philadelphia), some predominantly Hispanic (Denver, Spring Branch), and the others more evenly distributed.
Also of interest are the characteristics of the specific schools that participated in targeted grantee activities. Three cities implemented programs in their schools as part of the collaboration grant and these are referred to as “school-level implementation sites”. (The other four cities offered individual-level activities and are referred to as “participant-level implementation sites”.) In the three school-level implementation sites—Boston, Denver, and Spring Branch—there were well-defined samples of schools participating in targeted activities (Table II.2). Comparing schools that participated in targeted activities with the overall site populations for these three grantees, participating schools were more likely to be charter schools, and tended to have slightly lower enrollments and student-teacher ratios. Among participating schools, the percentage of students eligible for free or reduced price lunch was higher in Denver and Spring Branch, and about the same in Boston. In terms of race/ethnicity, participating schools had a higher percentage of minorities (African American and Hispanic combined) than the overall city for all three locations.
Table II.2. Characteristics of participating schools, by school-level implementation site
City
Number of
schools Total
enrollment
Student/teacher
ratio
Percentage eligible for
school lunch
Percentage African
American Percentage
Hispanic
Percentage of schools
that are charters
Boston 16 6,236 12.7 76.1 44.9 34.9 37.5
Denver 25 9,807 15.8 77.4 15.8 61.9 44.0
Spring Branch 6 4,518 16.8 65.8 3.3 68.4 33.3
Source: Enrollment, schools, and student characteristics data from CCD, 2013–2014.
Note: Student/teacher ratio measures teachers in fulltime equivalent units.

DCC FINAL REPORT MATHEMATICA POLICY RESEARCH
9
B. Description of grantee activities
The first category of grantee activity is school partnerships. These include partnerships between two or more schools spanning different sectors, co-located schools sharing the same facility, and partnerships between schools and CMOs. Four grantees implemented school partnerships: Boston, Denver, Hartford, and Spring Branch (Table II.3).
Table II.3. Grantee school partnership activities
City Activities Number of Schools
Boston School performance partnerships: District-charter-Catholic school partnerships focusing on specific areas, such as embedding study skills or using arts for teaching students with disabilities
6
Denver Peer-to-peer learning labs: School partnerships and cohort groups within and across sectors, often in the form of teacher and/or leader coaching, focusing on specific areas for improvement such as interpreting and using data
25
Hartford Jumoke Academy at Milner: District partnership with Jumoke/Fuse 180 CMO to manage a district turnaround school (discontinued)
n.a.
Spring Branch School-within-a-school model: YES Prep middle school located within a Spring Branch Integrated School District (SBISD) middle school; KIPP middle school located within another SBISD middle school; YES Prep high school located within a SBISD high school. Teachers participate in some shared PD sessions
4
Note: n.a. = not applicable
The partnership activities were implemented at different levels. Whereas Boston and Denver’s activities allowed teachers across sectors to interact and share best practices, Spring Branch’s school-within-a-school model allowed interactions to occur at both the teacher and student levels. Denver’s partnership activity was the widest reaching of any city, covering 25 schools.
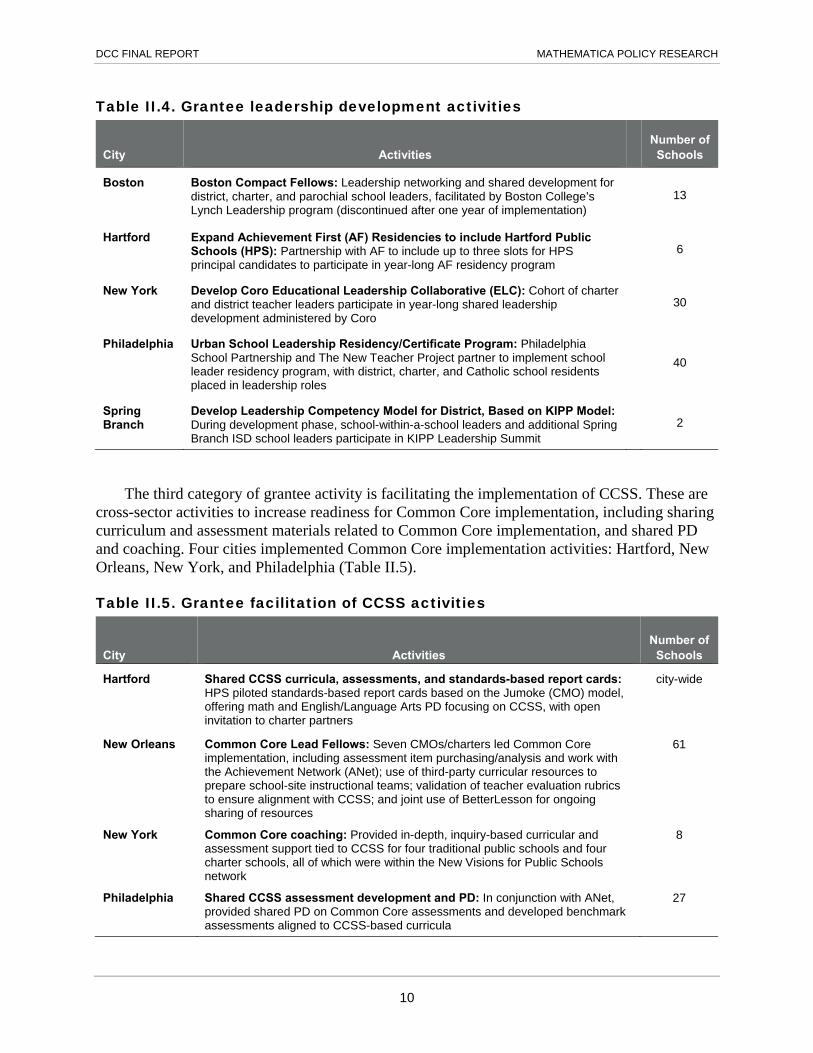
The second category of grantee activity is leadership development. This includes cross-sector residency programs for aspiring school leaders, as well as cross-sector training for current and aspiring leaders. Five cities implemented activities in leadership development: Boston, Hartford, New York, Philadelphia, and Spring Branch (Table II.4).
Leadership activities varied in both intensity and target participants. The most intensive type of leadership activity occurred in the form of a residency in which leader candidates typically spent a school year taking on responsibilities that they would have in their future role but with the mentoring and support of a more experienced leader. As a resident, they might take on a role such as dean or instructional coach. Hartford and Philadelphia both implemented residency program models to equip emerging leaders for future school leadership positions. Other leadership programs (in Boston, New York, and Spring Branch) provided opportunities for leaders to come together to network, learn, and share best practices. While most of these activities were targeted toward emerging or existing school principals and other administrators, New York’s Coro program also targeted teachers with leadership potential.
DCC FINAL REPORT MATHEMATICA POLICY RESEARCH
10
Table II.4. Grantee leadership development activities
City Activities Number of Schools
Boston Boston Compact Fellows: Leadership networking and shared development for district, charter, and parochial school leaders, facilitated by Boston College’s Lynch Leadership program (discontinued after one year of implementation)
13
Hartford Expand Achievement First (AF) Residencies to include Hartford Public Schools (HPS): Partnership with AF to include up to three slots for HPS principal candidates to participate in year-long AF residency program
6
New York Develop Coro Educational Leadership Collaborative (ELC): Cohort of charter and district teacher leaders participate in year-long shared leadership development administered by Coro
30
Philadelphia Urban School Leadership Residency/Certificate Program: Philadelphia School Partnership and The New Teacher Project partner to implement school leader residency program, with district, charter, and Catholic school residents placed in leadership roles
40
Spring Branch
Develop Leadership Competency Model for District, Based on KIPP Model: During development phase, school-within-a-school leaders and additional Spring Branch ISD school leaders participate in KIPP Leadership Summit
2
The third category of grantee activity is facilitating the implementation of CCSS. These are cross-sector activities to increase readiness for Common Core implementation, including sharing curriculum and assessment materials related to Common Core implementation, and shared PD and coaching. Four cities implemented Common Core implementation activities: Hartford, New Orleans, New York, and Philadelphia (Table II.5).
Table II.5. Grantee facilitation of CCSS activities
City Activities Number of
Schools
Hartford Shared CCSS curricula, assessments, and standards-based report cards: HPS piloted standards-based report cards based on the Jumoke (CMO) model, offering math and English/Language Arts PD focusing on CCSS, with open invitation to charter partners
city-wide
New Orleans Common Core Lead Fellows: Seven CMOs/charters led Common Core implementation, including assessment item purchasing/analysis and work with the Achievement Network (ANet); use of third-party curricular resources to prepare school-site instructional teams; validation of teacher evaluation rubrics to ensure alignment with CCSS; and joint use of BetterLesson for ongoing sharing of resources
61
New York Common Core coaching: Provided in-depth, inquiry-based curricular and assessment support tied to CCSS for four traditional public schools and four charter schools, all of which were within the New Visions for Public Schools network
8
Philadelphia Shared CCSS assessment development and PD: In conjunction with ANet, provided shared PD on Common Core assessments and developed benchmark assessments aligned to CCSS-based curricula
27

DCC FINAL REPORT MATHEMATICA POLICY RESEARCH
11
The most common strategies for preparing for the CCSS included the sharing of assessments (four cities), curricula (three cities), PD (three cities), and assessment analysis tools and report cards (two cities). Participants in New Orleans, who undertook the most CCSS-related activities, also validated their teacher evaluation rubrics to better align them with the standards. These initiatives were far-reaching in three of the four cities, as they were implemented citywide in both Hartford and Philadelphia and in 61 schools in New Orleans.
The fourth category of grantee activity is teacher coaching. This included shared PD and district participation in charter coaching or the adoption of charter coaching models. Five cities implemented cross-sector teacher coaching activities: Boston, Hartford, New Orleans, Philadelphia, and Spring Branch (Table II.6).
Table II.6. Grantee teacher coaching activities
City Activities Number of Schools
Boston Quality Teaching for English Learners: Shared PD (administered by WestEd) on teaching ELLs, for teachers from district, charter, and parochial schools
11
African-American and Hispanic boys school best practice sharing: Sharing of best practices in teaching literacy to African-American and Hispanic boys by exemplary elementary schools across sectors; originally implemented as peer-to-peer PD but restructured as broader knowledge sharing of best practices
5
Hartford Implement teacher coaching and evaluation initiative in HPS based on AF model: High-level input from AF; coaching consultant hired from AF to help oversee peer coaching initiatives in several district schools
districtwide
New Orleans Expand Match Charter Public School (Match) teacher training program: Third-party vendor provides intensive teacher coaching and training of teachers as coaches
Launch Center for Transformative Teacher Training (CT3): CT3 trains teacher leaders to be coaches
Incubate local CMO teacher training organizations: CMO residencies at KIPP and Collegiate Academies for 24 early career teachers in 2013–2014
citywide
Philadelphia Scale up Mastery’s Teacher Effectiveness Institute: Year-long training of instructional coaches via Mastery’s “train-the-trainer” program; placed in select district schools in December 2013
2
Spring Branch Develop teacher training model for district based on YES Prep model: During development phase, noncertified SBISD Teach for America teachers participate in YES Prep Teaching Excellence program with YES Prep first-year teachers
citywide
Of the five cities that implemented teacher coaching activities, one city (Boston) implemented shared PD; three cities (Hartford, New Orleans, and Philadelphia) implemented coaching, training for coaches, or the adoption of new coaching models; and one city (Spring Branch) implemented a teacher training program that incorporated both PD and coaching. New Orleans and Spring Branch implemented coaching activities citywide, whereas Philadelphia and Boston implemented within a subset of targeted schools.

DCC FINAL REPORT MATHEMATICA POLICY RESEARCH
12
The fifth category of grantee activity is community outreach, a category that is specific to New York City. The New York City Collaborative Council sponsored school study tours for staff to observe schools from other sectors and share best practices, conducted workshops for district and charter staff, convened a collaborative council of charter and district leaders, and implemented a broader public relations campaign. The purpose of the campaign was to debunk popular myths about charter schools and co-location through white papers, fact sheets, TV commercials, print ads, and a website.
In sum, cities implemented a wide range of activities in order to facilitate cross-sector learning and sharing of best practices. Across cities, the most common types of activities were those focused on improving the skills of school leaders and teachers; five cities implemented leadership training activities and five implemented teacher coaching activities (four cities implemented both types). These leader and teacher development activities were implemented through hands-on experiences that offered feedback and support in the form of residencies and coaching and with PD sessions that allowed teachers and leaders to network and come together for shared learning. CCSS activities and school partnerships were also common activities, each implemented in four cities in varying forms. The only city to incorporate formal community outreach as a grant objective was New York City, whose activities included school study tours, a public relations campaign, and a Collaboration Council.
DCC FINAL REPORT MATHEMATICA POLICY RESEARCH
13
III. LESSONS LEARNED FROM THE DISTRICT-CHARTER COLLABORATION GRANTS IMPLEMENTATION
Over the course of the three-year study that examined the implementation of the District-Charter Collaboration Grants, our previous reports addressed three main research questions:
1. How do educators perceive the implementation and usefulness of the grant activity in which they participated, and how do the different types of grantee activities compare on implementation and usefulness ratings?
2. To what extent did cross-sector collaboration and the transfer of practices occur among educators in the seven grantee cities?
3. How do educators describe the climate for collaboration in their cities, and what contextual factors helped facilitate or impede cross-sector collaboration?
In this chapter, we integrate the key findings across these questions and focus on the broader lessons learned across the grant period. These main themes also serve to motivate our case study of leadership development programs (Chapter IV) and broader policy implications for grantees, funders, and participants (Chapter V).
Key Finding #1: Cross-sector collaboration can and did occur and was viewed as facilitating the transfer of effective practices.
While there was variation across cities, many of the participants in grant activities (i.e., central office-level administrators, principals, and teachers) engaged in cross-sector collaboration and transferring practices with the opposite sector. Cross-sector collaboration included instances of working with another sector on specific tasks, such as observing classrooms, aligning operations (e.g., transportation and bell times), developing curriculum materials or instructional activities, or participating in formal events with educators from another sector. Survey results showed that an average of 49 percent of principals and teachers in cities with school-level activity implementation reported collaborating at least once in the prior year, with cities ranging from 33 percent to 81 percent (Figure III.1).1 Seventy-nine percent of those in cities with participant-level activity implementation reported collaborating at least once during the past year with educators from the opposite sector, with cities ranging from 69 percent to 91 percent. It is important to note that any differences in the collaboration rates between participant-level implementation cities and school-level implementation cities could reflect differences in the sampling approach. During interviews, central office-level administrators in most cities also
1 As mentioned in Chapter II, three cities implemented programs in their schools as part of the collaboration
grant, and a sample of teachers were selected within these schools, and these are referred to as school-level implementation sites. The other four cities offered individual-level activities (and are referred to as participant-level implementation sites), and survey responses were sought from all of these program participants. Cross-sector collaboration rates in participant-level implementation cities may be relatively higher simply because all of the survey respondents participated in grant activities, which may not necessarily be true of all respondents in the school-level implementation cities where some staff may not have known their school was participating in a grant activity. Thus, the collaboration rate differences between participant-level implementation cities and school-level implementation cities could reflect differences in the sampling approach.

DCC FINAL REPORT MATHEMATICA POLICY RESEARCH
14
reported seeing substantially increased levels of cross-sector collaboration relative to pre-grant levels.
Figure III.1. Cross-sector collaboration varied substantially across cities
Source: District-Charter Collaboration Evaluation Survey.
Note: We calculated individual city estimates using “within-city” weights and all school-level cities, and calculated all participant-level cities estimates using “between-city” weights so that each city had an equal weight on
the overall average.2
*Significantly different from the city group average at the .05 level, two-tailed test.
A fundamental premise behind the District-Charter Collaboration Grants is that participating in cross-sector collaboration would facilitate the transfer of best practices across sectors, and there is quantitative and qualitative evidence that this occurred as part of the grants program.3 The survey results showed that 33 percent of respondents in school-level implementation cities and 63 percent of respondents in participant-level implementation cities reported sharing or adopting practices across sectors. Among respondents who actually collaborated across sectors, most (63 percent in school-level implementation cities and 78 percent in participant-level implementation cities) stated that they adopted practices from or shared practices with educators from the opposite sector (Figure III.2).4 The patterns related to the school-level implementation
2 We used within-city weights for generating estimates within a single city. These weights reflected the probability of selection into the sample (for school-based activities) and nonresponse adjustments for principals and teachers within the city, the activity in which they participated, and the sector. When grouping cities together for aggregate analyses, we also applied between-city weights that weighted each city equally in the final estimates.
3 Discussed further in Chapter IV and in previous reports, specific types of grantee activities (e.g., principal leadership programs) were seen as being relatively more successful in facilitating cross-sector collaboration and transfer of practices across sectors.
4 Across all school-level implementation cities, 4 percent of respondents who did not collaborate reported adopting or sharing practices. The rate of adopting or sharing practices was 8 percent among those in participant-level
33% 33%*
81%*
49%
69%*
91%*
74%80% 79%
22%
6%*
56%*
27%31%*
54%48%
67%*
48%
0%
10%
20%
30%
40%
50%
60%
70%
80%
90%
100%
GranteeCity 2
GranteeCity 3
GranteeCity 5
All GranteeCity 1
GranteeCity 4
GranteeCity 6
GranteeCity 7
All
School-level implementation cities Participant-level implementation cities
Collaborated at least once in the previous year
Collaborated at least once per month in the previous year

DCC FINAL REPORT MATHEMATICA POLICY RESEARCH
15
cities is particularly important given that not all surveyed respondents explicitly volunteered to participate in a grant activity; they were exposed to it by being a staff member at the school. Yet even among this group, most respondents who reported collaborating with the opposite sector also stated that they transferred practices across sectors. During interviews, respondents credited cross-sector collaboration grant activities with increasing the transfer of practices. One traditional public school teacher reported that the collaboration grant activity “gave me a lot of opportunities to learn from charter schools, both from the people that I was in the program with, who were from the charter world, and [through] inter-visitation. So, I actually got to go and visit some charter schools, [and share instructional practices].”
Figure III.2. In each city, collaborators were likely to adopt or share practices from another sector
Source: District-Charter Collaboration Evaluation Survey.
Note: We calculated individual city estimates using within-city weights and all school-level cities, and calculated all participant-level cities estimates using between-city weights so that each city had an equal weight on the overall average.
*Significantly different from the city group average at the .05 level, two-tailed test.
implementation cities who reported not collaborating. It is possible that the few teachers and principals who did not collaborate but reported adopting or sharing practices from other sectors learned the practices from colleagues who participated in cross-sector collaboration.
33%
13%*
60%*
33%
53%*
77%*
55%
63% 63%
91%*
39%
69%63%
77%
84%
67%
80% 78%
0%
10%
20%
30%
40%
50%
60%
70%
80%
90%
100%
GranteeCity 2
GranteeCity 3
GranteeCity 5
All GranteeCity 1
GranteeCity 4
GranteeCity 6
GranteeCity 7
All
School-level implementation cities Participant-level implementation cities
All Respondents Respondents who collaborated

DCC FINAL REPORT MATHEMATICA POLICY RESEARCH
16
Respondents discussed the specific practices that were most commonly shared across sectors. Charter school staff most frequently reported learning about or borrowing content-specific instructional strategies (e.g., guided reading and small group instructional approaches) from traditional public school staff (Table III.1). Charter respondents also noted that practices and accommodations for ELLs and special education students, at both the district-wide and school-level, were transferred across sectors. Traditional public school staff respondents described borrowing or learning about school culture and discipline strategies from the charter sector. They also reported borrowing resources or approaches related to interim assessments and teacher coaching models.
Table III.1. Most frequently shared practices or materials, as reported across all interviewed respondents
Practices most shared from traditional public sector to charter sector (reported by charter sector
respondents)
Practices most shared from charter sector to traditional public sector (reported by traditional
public sector respondents) Content-specific instructional strategies Approaches for serving ELLs and special
education students Incorporating technology in the classroom Discipline strategies
School culture and behavior systems Interim assessments Teacher coaching models Specific instructional strategies or practices
Source: District-Charter Collaboration Interviews (September to November 2015).
Key Finding #2: Participants perceived the grant activities as helping to build their cross-sector professional networks.
In addition to facilitating the transfer of practices across sectors, the grant activities were also seen as fostering and growing cross-sector networks. Across the interviews, 68 percent of principals and teachers described seeing their professional networks increase in size over the prior two years as a result of the structured opportunities to collaborate with those from the opposite sector. Principals reported having an average of seven cross-sector contacts, while teachers reporting having a mean average of 18 contacts (and a similar median of 20 contacts) from the opposite sector (Figure III.3).5 In describing how the grant activities helped broaden his/her professional network, one participant stated, “[I now have] a network where I'm definitely going to keep in touch with…and reach out [to] frequently—whether it's a text or a phone call or an email—that will definitely be accessible to me for a lifetime.” Among the surveyed principals and teachers, 43 percent reported that they stayed in touch with opposite-sector colleagues who participated in their collaboration grant activity.6
5 These analyses do not include New Orleans respondents because networks across the district and charter sectors within each site were the main focus.
6 A large proportion of respondents (33 percent) did not identify any grant activity in which they participated, even though they were identified for the survey because they or their schools participated in a grant activity. As a result, we were not able to ask these respondents about whether they stayed in contact with others from their activity.
“[I now have] a network where I'm definitely going to keep in touch with…and reach out [to] frequently—whether it’s a text or a phone call or an email—that will definitely be accessible to me for a lifetime.”

DCC FINAL REPORT MATHEMATICA POLICY RESEARCH
17
Figure III.3. Principals and teachers experienced increases in their cross-sector professional networks
Source: District-Charter Collaboration Interviews (September to November 2015).
Note: Averages based on responses from 4 to 10 school staff respondents in each grantee city. The average for all grantee cities weights each grantee city equally.
Key Finding #3: The grant activities were seen as having a positive impact, but the scope of the impact was on a small-scale and generally confined to those directly participating in the activities.
Although respondents credited the grant activities for bolstering collaboration, transferring practices, and building cross-sector networks, the scope of these outcomes did not generally extend beyond those directly participating in the grant activities nor produce systemic change within the grant period. Many respondents, both in central offices and in schools, noted that the scope of grant implementation was not large enough to produce large-scale impacts because it generally involved only a small number schools and staff in each city. Rather, many interviewed respondents in each city perceived that the grant impacts were confined to those in the principal- or teacher-facing grant activities themselves. For example, one charter respondent stated, “[The grant activity] definitely created relationships and begun conversations and broken down some walls [but] I just don’t know that it’s made a large scale impact.”
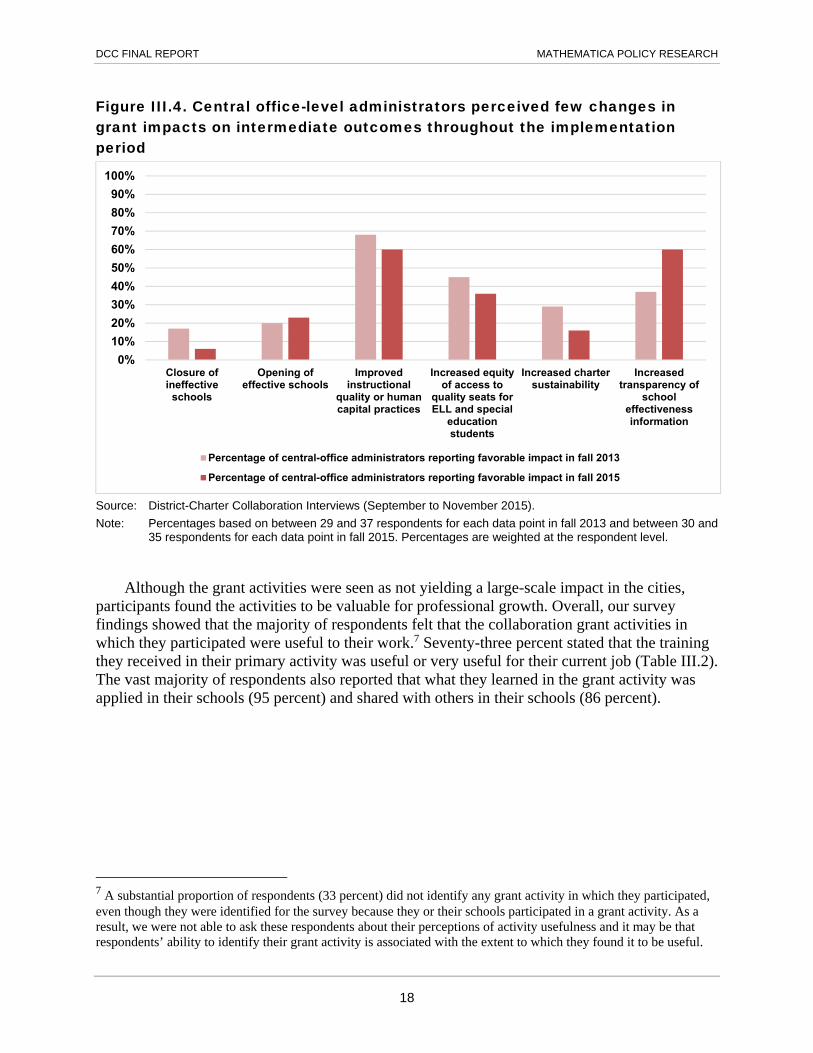
The modest scale of grant activities may explain why most central-office staff across the district, charter, and Catholic school sectors did not perceive them as affecting some of the intermediate outcomes, such as increased charter sustainability, the closure of ineffective schools, or the opening of effective schools. Despite the small scale, however, substantial percentages of central office staff believed the grant activities had favorable effects on instructional quality or human capital practices, transparency of school effectiveness information, and increasing equity of access to quality seats for ELL and special education students (Figure III.4). Respondents attributed these impacts to cities having activities focused on advancing instructional practices and increasing the capacity of effective CMOs to serve special education students and ELLs. They also felt that cross-sector collaboration increased schools’ openness to sharing their strengths and weaknesses more broadly and, as a result, improved the transparency of school effectiveness information—the percentage of respondents who agreed increased from 37 to 60 percent from early to later in the grant period. However, only a minority of central office-level administrators believed that the collaboration grants had positive impacts on the closure of ineffective schools, opening of effective schools, and increased charter sustainability.
DCC FINAL REPORT MATHEMATICA POLICY RESEARCH
18
Figure III.4. Central office-level administrators perceived few changes in grant impacts on intermediate outcomes throughout the implementation period
Source: District-Charter Collaboration Interviews (September to November 2015).
Note: Percentages based on between 29 and 37 respondents for each data point in fall 2013 and between 30 and 35 respondents for each data point in fall 2015. Percentages are weighted at the respondent level.
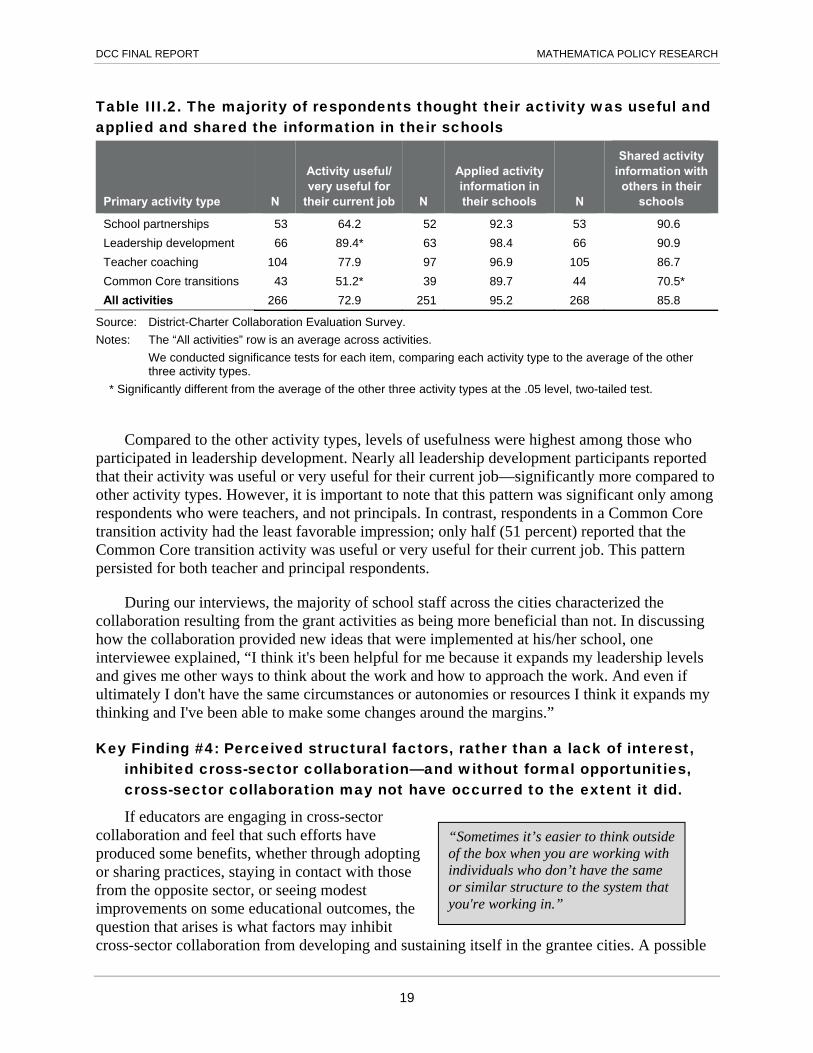
Although the grant activities were seen as not yielding a large-scale impact in the cities, participants found the activities to be valuable for professional growth. Overall, our survey findings showed that the majority of respondents felt that the collaboration grant activities in which they participated were useful to their work.7 Seventy-three percent stated that the training they received in their primary activity was useful or very useful for their current job (Table III.2). The vast majority of respondents also reported that what they learned in the grant activity was applied in their schools (95 percent) and shared with others in their schools (86 percent).
7 A substantial proportion of respondents (33 percent) did not identify any grant activity in which they participated, even though they were identified for the survey because they or their schools participated in a grant activity. As a result, we were not able to ask these respondents about their perceptions of activity usefulness and it may be that respondents’ ability to identify their grant activity is associated with the extent to which they found it to be useful.
0%
10%
20%
30%
40%
50%
60%
70%
80%
90%
100%
Closure ofineffective
schools
Opening ofeffective schools
Improvedinstructional
quality or humancapital practices
Increased equityof access to
quality seats forELL and special
educationstudents
Increased chartersustainability
Increasedtransparency of
schooleffectivenessinformation
Percentage of central-office administrators reporting favorable impact in fall 2013
Percentage of central-office administrators reporting favorable impact in fall 2015
DCC FINAL REPORT MATHEMATICA POLICY RESEARCH
19
Table III.2. The majority of respondents thought their activity was useful and applied and shared the information in their schools
Primary activity type N
Activity useful/ very useful for
their current job N
Applied activity information in their schools N
Shared activity information with others in their
schools
School partnerships 53 64.2 52 92.3 53 90.6
Leadership development 66 89.4* 63 98.4 66 90.9
Teacher coaching 104 77.9 97 96.9 105 86.7
Common Core transitions 43 51.2* 39 89.7 44 70.5*
All activities 266 72.9 251 95.2 268 85.8
Source: District-Charter Collaboration Evaluation Survey.
Notes: The “All activities” row is an average across activities.
We conducted significance tests for each item, comparing each activity type to the average of the other three activity types.
* Significantly different from the average of the other three activity types at the .05 level, two-tailed test.
Compared to the other activity types, levels of usefulness were highest among those who participated in leadership development. Nearly all leadership development participants reported that their activity was useful or very useful for their current job—significantly more compared to other activity types. However, it is important to note that this pattern was significant only among respondents who were teachers, and not principals. In contrast, respondents in a Common Core transition activity had the least favorable impression; only half (51 percent) reported that the Common Core transition activity was useful or very useful for their current job. This pattern persisted for both teacher and principal respondents.
During our interviews, the majority of school staff across the cities characterized the collaboration resulting from the grant activities as being more beneficial than not. In discussing how the collaboration provided new ideas that were implemented at his/her school, one interviewee explained, “I think it's been helpful for me because it expands my leadership levels and gives me other ways to think about the work and how to approach the work. And even if ultimately I don't have the same circumstances or autonomies or resources I think it expands my thinking and I've been able to make some changes around the margins.”
Key Finding #4: Perceived structural factors, rather than a lack of interest, inhibited cross-sector collaboration—and without formal opportunities, cross-sector collaboration may not have occurred to the extent it did.
If educators are engaging in cross-sector collaboration and feel that such efforts have produced some benefits, whether through adopting or sharing practices, staying in contact with those from the opposite sector, or seeing modest improvements on some educational outcomes, the question that arises is what factors may inhibit cross-sector collaboration from developing and sustaining itself in the grantee cities. A possible
“Sometimes it’s easier to think outside of the box when you are working with individuals who don’t have the same or similar structure to the system that you're working in.”

DCC FINAL REPORT MATHEMATICA POLICY RESEARCH
20
explanation is that educators from the different sectors are simply not interested in participating in cross-sector collaboration, but our survey and interview data suggest this was not the case. On the survey, only 31 percent of respondents reported that their lack of personal interest was a barrier for them in engaging in cross-sector collaboration. This pattern was consistent regardless of whether the survey respondent had even engaged in cross-sector collaboration: 33 percent of cross-sector collaborators versus 28 percent of non-collaborators indicated that their lack of interest inhibited them from participating in cross-sector collaboration. Our interviews with principals and teachers also showed that a majority of respondents in each city highly regarded the cross-sector collaboration experiences they had. Interviewees spoke of the value of cross-sector collaboration, noting that the benefits of “fresh ideas” or “fresh perspectives” outweighed any costs associated with working across sectors. One respondent noted that, “sometimes it's easier to think outside of the box when you are working with individuals who don’t have the same or similar structure to the system that you're working in.”
In addition to speaking about their own personal interest, respondents also perceived such interest occurring more generally in each city. In six of the seven grantees, respondents were more likely to characterize the sectors as receptive to adopting practices from the other sector than not (and most respondents in the seventh grantee thought the sectors had mixed levels of receptivity to the other sector’s practices). On the survey (Figure III.5), approximately one-third of respondents agreed that staff in the other sector were willing to share practices (32 percent) and were open to new ideas (30 percent). This was not because most respondents thought the opposite sector was unreceptive, but because the largest group of respondents felt they did not have enough information about staff in the opposite sector to know how receptive they would be to sharing practices or hearing new ideas. Those reporting that they did not have enough information ranged from 14 percent to 34 percent in cities with participant-level implementation, and 34 percent to 75 percent in cities with school-level implementation. Additionally, district respondents and teachers were more likely to report not having enough information, compared with charter respondents and principals.

DCC FINAL REPORT MATHEMATICA POLICY RESEARCH
21
Figure III.5. Half or more of respondents did not have enough information to know whether staff in the other sector were willing to share practices or were open to new ideas
Source: District-Charter Collaboration Evaluation Survey.
Note: We calculated results using between-city weights so that each city had an equal weight.
Rather than a lack of desire to work with the other sector, survey and interview respondents stated that structural factors made it difficult to collaborate across sectors. Many of the interviewed teachers discussed how they lacked the contacts, opportunities, and time, to easily
work with the other sector prior to the collaboration grants. A lack of time was the most commonly cited barrier to collaboration, with one teacher explaining, “It’s really hard to make time to collaborate. If it’s not within your school day, it’s not happening.” Another traditional public school principal shared a similar sentiment stating that, “we don't have a lot of opportunity to really interact with each other. I mean, we have some universal meetings
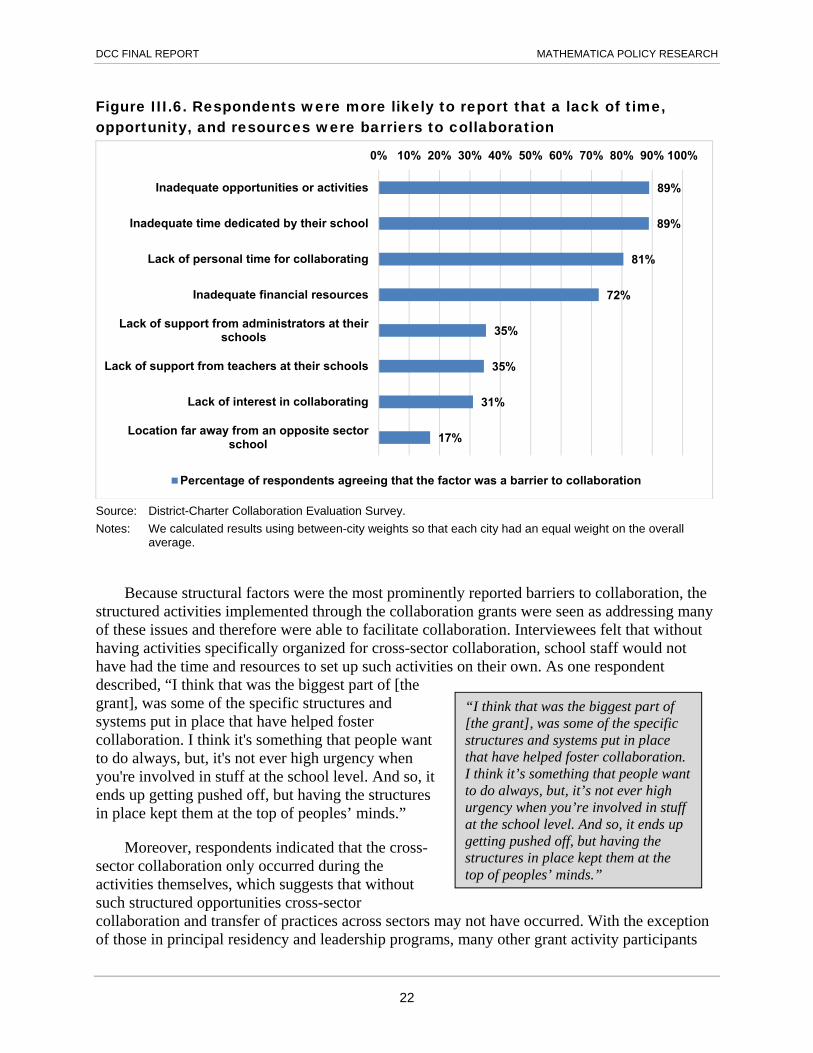
where everybody comes, but largely charters and traditional schools operate separately." The survey data yielded similar findings, as the vast majority of respondents indicated that inadequate opportunities or activities, time dedicated by their school, personal time, and financial resources were the primary barriers to collaboration (Figure III.6).
50%41%
58%
18%
14%
12%
32%
45%
30%
0%
10%
20%
30%
40%
50%
60%
70%
80%
90%
100%
Staff are willing to share practices(n = 388)
Staff are partners and colleagues(n = 386)
Staff are open to new ideas(n = 387)
Not enough information Disagree Agree
“We don’t have a lot of opportunity to really interact with each other. I mean, we have some universal meetings where everybody comes, but largely charters and traditional schools operate separately.”
DCC FINAL REPORT MATHEMATICA POLICY RESEARCH
22
Figure III.6. Respondents were more likely to report that a lack of time, opportunity, and resources were barriers to collaboration
Source: District-Charter Collaboration Evaluation Survey.
Notes: We calculated results using between-city weights so that each city had an equal weight on the overall average.
Because structural factors were the most prominently reported barriers to collaboration, the structured activities implemented through the collaboration grants were seen as addressing many of these issues and therefore were able to facilitate collaboration. Interviewees felt that without having activities specifically organized for cross-sector collaboration, school staff would not have had the time and resources to set up such activities on their own. As one respondent described, “I think that was the biggest part of [the grant], was some of the specific structures and systems put in place that have helped foster collaboration. I think it's something that people want to do always, but, it's not ever high urgency when you're involved in stuff at the school level. And so, it ends up getting pushed off, but having the structures in place kept them at the top of peoples’ minds.”
Moreover, respondents indicated that the cross-sector collaboration only occurred during the activities themselves, which suggests that without such structured opportunities cross-sector collaboration and transfer of practices across sectors may not have occurred. With the exception of those in principal residency and leadership programs, many other grant activity participants
89%
89%
81%
72%
35%
35%
31%
17%
0% 10% 20% 30% 40% 50% 60% 70% 80% 90% 100%
Inadequate opportunities or activities
Inadequate time dedicated by their school
Lack of personal time for collaborating
Inadequate financial resources
Lack of support from administrators at theirschools
Lack of support from teachers at their schools
Lack of interest in collaborating
Location far away from an opposite sectorschool
Percentage of respondents agreeing that the factor was a barrier to collaboration
“I think that was the biggest part of [the grant], was some of the specific structures and systems put in place that have helped foster collaboration. I think it’s something that people want to do always, but, it’s not ever high urgency when you’re involved in stuff at the school level. And so, it ends up getting pushed off, but having the structures in place kept them at the top of peoples’ minds.”

DCC FINAL REPORT MATHEMATICA POLICY RESEARCH
23
reported sharing practices only during scheduled formal opportunities to work together around specific content areas. One traditional public school teacher noted, “[The collaboration grant activity] gave me a lot of opportunities to learn from charter schools, both from the people that I was in the program with, who were from the charter world, and [through] inter-visitation. So, I actually got to go and visit some charter schools [and share instructional practices].”
Key Finding #5: Although there is variation across cities, most had a general climate that was not closed to cross-sector collaboration, although some negative perceptions of the opposite sector remain.
Although each grantee had a unique local context for collaboration, none of the cities had broader climates characterized as being resistant to collaboration or having sectors with largely negative perceptions of each other, according to respondents. At the end of the grant program period, the interviewed central office and school leader respondents across all seven grantees most often described the climate for collaboration in their city as neutral, in that it neither helped nor prevented collaboration from occurring (Table III.3). One traditional public school respondent shared that the climate has become more positive “but it needs to be better,” while a charter school respondent noted, “[the climate is] still challenging, but I would say it’s easier.” Early in the grant period, the climate was described as having improved over what it was before the grant. Nearer the end of the grant, these improvements may have been somewhat mitigated, as there was no evidence that the climate was any better in 2015 than in 2013–2014, but still more positive than it was prior to the grant period, in the view of respondents.
Table III.3. Trends in climate for cross-sector collaboration, as reported by central office administrators and principals
Source: District-Charter Collaboration Interviews (September to November 2015).
Note: For each grantee city, climate categories are based on responses from between two and eight central office administrators and school leaders in each sector.
* Climate ratings for the pre-Compact period and 2013–2014 were reported in the first interim report and were measured in interviews with central office administrators and school leaders in 2013–2014.
Traditional Public Respondents Charter Respondents
Pre-Compact climate for
collaboration* Climate in
2013–2014* Climate in
2015
Pre-Compact climate for
collaboration* Climate in
2013–2014* Climate in
2015 Grantee City 1 Negative Negative-
Neutral Negative-Neutral
Negative Neutral Neutral
Grantee City 2 Negative Neutral-Positive
Neutral-Positive
Negative-Neutral
Positive Neutral-Positive
Grantee City 3 Negative Neutral Negative-Neutral
Negative Neutral Neutral
Grantee City 4 Neutral-Positive
Positive Positive Neutral-Positive
Positive Neutral-Positive
Grantee City 5 Negative Positive Positive Negative-Neutral
Neutral-Positive
Neutral
Grantee City 6 Negative Negative-Neutral
Negative-Neutral
Negative Negative Neutral
Grantee City 7 Negative Negative-Neutral
Negative Negative Negative-Neutral
Negative-Neutral
DCC FINAL REPORT MATHEMATICA POLICY RESEARCH
24
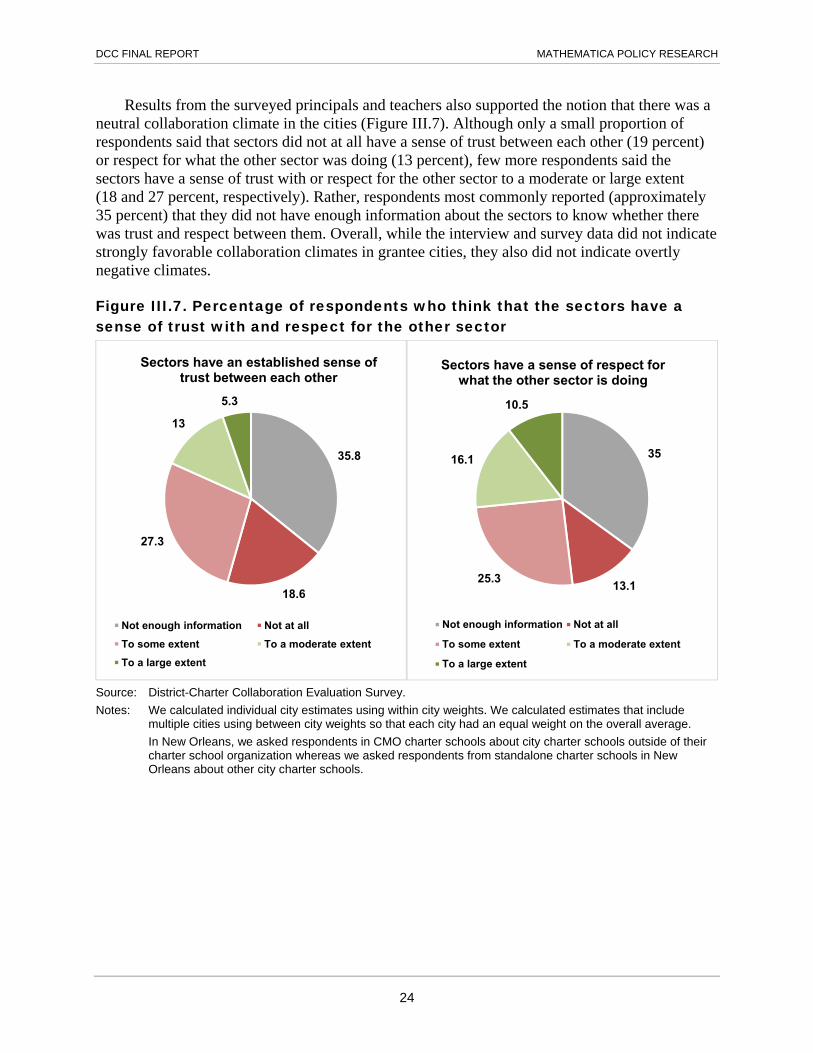
Results from the surveyed principals and teachers also supported the notion that there was a neutral collaboration climate in the cities (Figure III.7). Although only a small proportion of respondents said that sectors did not at all have a sense of trust between each other (19 percent) or respect for what the other sector was doing (13 percent), few more respondents said the sectors have a sense of trust with or respect for the other sector to a moderate or large extent (18 and 27 percent, respectively). Rather, respondents most commonly reported (approximately 35 percent) that they did not have enough information about the sectors to know whether there was trust and respect between them. Overall, while the interview and survey data did not indicate strongly favorable collaboration climates in grantee cities, they also did not indicate overtly negative climates.
Figure III.7. Percentage of respondents who think that the sectors have a sense of trust with and respect for the other sector
Source: District-Charter Collaboration Evaluation Survey.
Notes: We calculated individual city estimates using within city weights. We calculated estimates that include multiple cities using between city weights so that each city had an equal weight on the overall average.
In New Orleans, we asked respondents in CMO charter schools about city charter schools outside of their charter school organization whereas we asked respondents from standalone charter schools in New Orleans about other city charter schools.
35.8
18.6
27.3
13
5.3
Sectors have an established sense of trust between each other
Not enough information Not at all
To some extent To a moderate extent
To a large extent
35
13.125.3
16.1
10.5
Sectors have a sense of respect for what the other sector is doing
Not enough information Not at all
To some extent To a moderate extent
To a large extent

DCC FINAL REPORT MATHEMATICA POLICY RESEARCH
25
Even though most respondents did not view the climate for collaboration as especially negative, many noted the pervasiveness of negative stereotypes about the opposite sectors that may hinder the willingness of their colleagues to engage in cross-sector collaboration. When teachers, school leaders, and administrators see the other sector as fundamentally different from their own, cross-sector collaboration may seem unhelpful or unnecessary.. For example, during interviews, traditional public respondents described charter schools as generally serving higher-achieving student populations with few ELLs or special education students. The survey results displayed a similar pattern, with 56 percent of district respondents agreeing that “schools in the opposite sector serve a different student population” compared to just 21 percent of charter school respondents. In turn, charter interview respondents also noted some negative perceptions of traditional public staff including that traditional public staff lack autonomy and have more constraints than do charter staff.
The perception of competition between the sectors was one of the most notable barriers to collaboration across both the interview and survey data. Interviewees felt that the sectors were competing for finite resources, facilities, and students, which hindered the sectors from seeing each other as potential partners for collaboration. One traditional public school respondent explained, “Every single system that we have pits us against each other in terms of competition,” with another respondent stating that the sectors “perceive themselves to be rivals when in actuality they are struggling with the same stuff.” These findings were generally consistent with survey results. Fifty-one percent of respondents, with no significant differences between traditional public schools and charter schools, reported that cross-sector competition had a negative influence on cross-sector collaboration.
There were numerous external factors that were seen as influencing perceptions of the other sectors and the extent to which they collaborated. Across the interviews and surveys, perceived teacher union resistance and cross-sector competition were the most often cited barriers to collaboration. Interviewees discussed how teacher unions’ anti-charter messaging created a negative climate for collaboration and presented logistical obstacles (related to, for example, contractual hours or compensation for time in shared PD) that created difficulties for implementing grant activities. On the survey, 46 percent of principals and teachers noted that the teachers’ union had a negative influence on cross-sector collaboration in their city compared to just 12 percent of respondents who thought that unions had a positive one (Table III.4). These patterns were similar for both traditional public school and charter school respondents.
Several interviewees described how their participation in the collaboration grant activities diminished some of the negative perceptions they initially had about the opposite sector. By interacting and building relationships with staff from the opposite sector, participants were able to identify commonalities and let go of the initial assumptions they had about the other sector. In discussing how participating in grant activities help dispel some preconceived notions about the opposite sector, one interviewee stated, “it was only through [the grant activities] that I was able to come to terms with the fact that we’re all serving kids. Let’s put politics aside and really think about how we can best design schools toward kids that are working, and supporting them in their growth as young people.”

DCC FINAL REPORT MATHEMATICA POLICY RESEARCH
26
Table III.4. Percentage of respondents reporting that each factor has a positive, negative or no influence on cross-sector collaboration in their city
Factors N
Average influence “score”
Positive influence
No influence
Negative influence
Local foundations 246 0.44 50.9 42.2 6.9 Local businesses 236 0.36 42.7 51.0 6.3 Parent/community groups 248 0.26 42.1 41.5 16.4 Charter networks/management orgs. 251 0.17 44.6 28.1 27.3 District office/partnership org. 262 0.17 39.9 37.3 22.8 Community racial/ethnic relations 236 0.06 34.1 38.3 27.6 School board 231 0.01 30.5 39.9 29.7 Local media 253 -0.07 30.1 33.2 36.8 Competing views on college/career preparation 237 -0.09 23.4 43.8 32.8 Mayor’s office/local government 219 -0.10 20.9 47.8 31.4 State funding/regulatory action 256 -0.24 29.2 18.1 52.7 Non-education political divisions 237 -0.31 16.1 36.8 47.2 Teachers’ union 234 -0.34 12.2 41.8 46.0 Cross-sector competition 239 -0.34 16.7 32.4 50.9
Source: District-Charter Collaboration Evaluation Survey.
Notes: We calculated the estimates using between city weights so that each city had an equal weight on the overall average.
We calculated the influence score by averaging the positive influence (1), no influence (0), and negative influence (-1) responses. We excluded those responding “not applicable”.

DCC FINAL REPORT MATHEMATICA POLICY RESEARCH
27
IV. COLLABORATION GRANT-FUNDED LEADERSHIP DEVELOPMENT PROGRAMS: A CASE STUDY
Across all seven grantee sites, cross-sector principal residency and aspiring leader programs were the most consistently praised and highlighted as collaboration grant successes by school- and central office-level interview and survey respondents from all sectors. Specifically, these programs stood out from other grant initiatives for their perceived effectiveness in generating meaningful cross-sector professional learning communities and best practice sharing that in turn directly improved human capital in schools, consistent with the Foundation’s original theory of action (Figure IV.1). Participants in these programs found their experiences invaluable for their personal growth and effectiveness as school leaders; nearly all attributed their current positions and success in those positions to their participation in the grant program.
Figure IV.1. Logic model for cross-sector leadership programs
Districts
Charters
Improvement in teacher quality in
existing schools
Increase in supply of effective schools within district
Increase in student
achievement across district
Strategic Collaboration Activities
Sharing of effective school‐level instructional practices across sectors
Standardization of data systems across sectors
Sharing of effective teaching practices across sectors
Collaborative activities and policies to ensure greater equity for
schools and students
Activities and policies that equalize financial and regulatory opportunities for charter schools
Policies that equalize access to charters for special needs and ELL students
Policies that equalize accountability standards between districts and charters
Activities
Improvement in human capital
practices in existing schools
Closure of ineffective schools
Opening of new schools that use
effective teaching and human capital
practices
Increase in percentage of special needs
and ELL students attending
effective schools
Increase in financial and regulatory
sustainability for charters
Greater transparency of
school effectiveness information
Intermediate outcomes
District‐level outcomes
Cross‐sector leadership programs
To learn more about the implementation of these leadership development programs, including promising program components and potential solutions to common challenges, the study team conducted a case study. This case study examined three intensive year-long school leader programs that were successfully implemented for at least two years using grant funding:

DCC FINAL REPORT MATHEMATICA POLICY RESEARCH
28
(1) the Achievement First principal residency program in Hartford, (2) the PhillyPLUS residency program in Philadelphia, and (3) the Coro Education Leadership Collaborative in New York. (See boxes for descriptions of each program.) Interviews with program participants and central office administrators in all three sites indicated that these programs were successful not only in building pipelines of strong, well-prepared school leaders but also in breaking down tensions and misperceptions across school types and facilitating the sharing of effective practices across sectors.
Findings from the case study are useful not only for the Gates Foundation in determining future investments but also for other Compact cities in deciding whether and how to implement such programs. In addition, this case study contributes to the existing literature base on collaborative principal preparation programs—which typically comprise partnerships between universities and districts—by providing valuable insights on the implementation of leadership development collaborations that involve both districts and charter organizations as well as, in some cases, third-party and Catholic school organizations (Orr 2012; Orr et al. 2010).
The case study addresses the following research questions:
1. Funding and other supports required for implementation: How are intensive leadership programs sustained? What sources of funding or other support are required for successful implementation?
2. Most promising components for replication: What are the most successful components of these programs from the perspectives of participants and program administrators? To what extent are the most successful components consistent across programs?
3. Program impacts: What are the perceived impacts of these programs on their cities? How do the programs influence cross-sector collaboration in particular? Is the inclusion of participants from multiple sectors perceived as a critical component in these programs?
4. Challenges and lessons learned: What implementation challenges do leadership programs face? What changes have the programs made to address these challenges and improve implementation?
In addition, Appendix A addresses the recruitment and selection processes for the three programs, as well as the specific types of training, coaching, and other support participants received throughout the programs and subsequent to the programs.
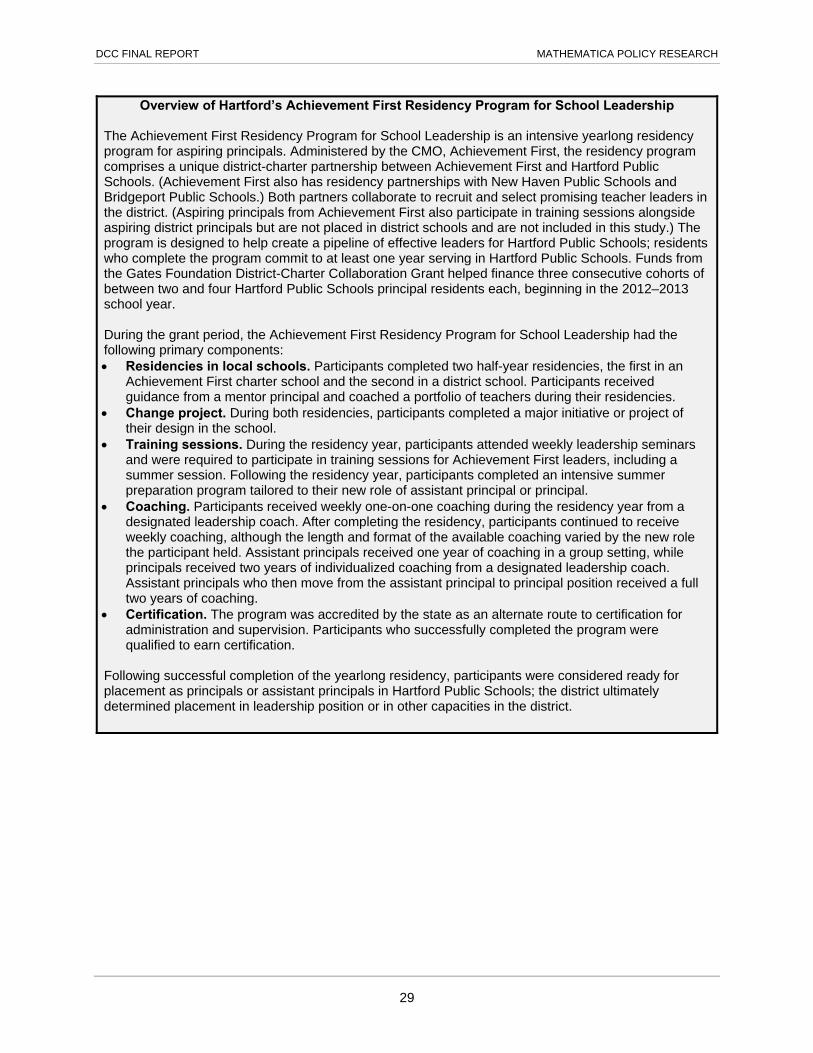
DCC FINAL REPORT MATHEMATICA POLICY RESEARCH
29
Overview of Hartford’s Achievement First Residency Program for School Leadership
The Achievement First Residency Program for School Leadership is an intensive yearlong residency program for aspiring principals. Administered by the CMO, Achievement First, the residency program comprises a unique district-charter partnership between Achievement First and Hartford Public Schools. (Achievement First also has residency partnerships with New Haven Public Schools and Bridgeport Public Schools.) Both partners collaborate to recruit and select promising teacher leaders in the district. (Aspiring principals from Achievement First also participate in training sessions alongside aspiring district principals but are not placed in district schools and are not included in this study.) The program is designed to help create a pipeline of effective leaders for Hartford Public Schools; residents who complete the program commit to at least one year serving in Hartford Public Schools. Funds from the Gates Foundation District-Charter Collaboration Grant helped finance three consecutive cohorts of between two and four Hartford Public Schools principal residents each, beginning in the 2012–2013 school year. During the grant period, the Achievement First Residency Program for School Leadership had the following primary components: Residencies in local schools. Participants completed two half-year residencies, the first in an
Achievement First charter school and the second in a district school. Participants received guidance from a mentor principal and coached a portfolio of teachers during their residencies.
Change project. During both residencies, participants completed a major initiative or project of their design in the school.
Training sessions. During the residency year, participants attended weekly leadership seminars and were required to participate in training sessions for Achievement First leaders, including a summer session. Following the residency year, participants completed an intensive summer preparation program tailored to their new role of assistant principal or principal.
Coaching. Participants received weekly one-on-one coaching during the residency year from a designated leadership coach. After completing the residency, participants continued to receive weekly coaching, although the length and format of the available coaching varied by the new role the participant held. Assistant principals received one year of coaching in a group setting, while principals received two years of individualized coaching from a designated leadership coach. Assistant principals who then move from the assistant principal to principal position received a full two years of coaching.
Certification. The program was accredited by the state as an alternate route to certification for administration and supervision. Participants who successfully completed the program were qualified to earn certification.
Following successful completion of the yearlong residency, participants were considered ready for placement as principals or assistant principals in Hartford Public Schools; the district ultimately determined placement in leadership position or in other capacities in the district.
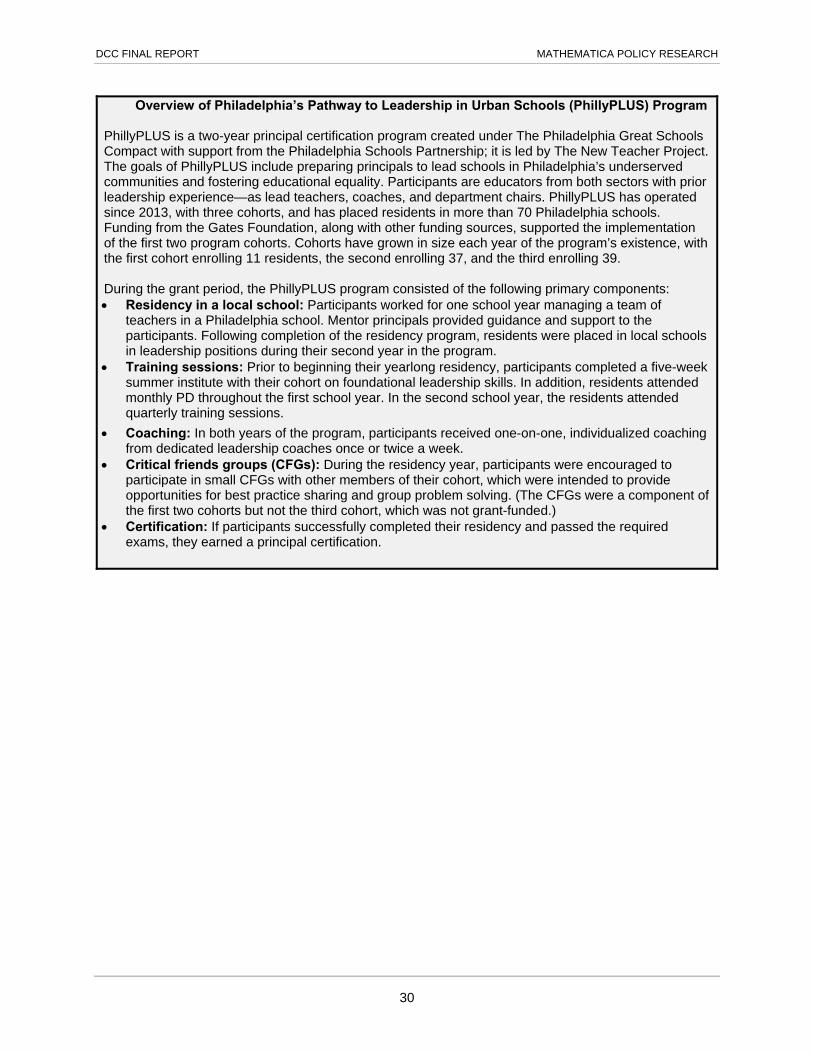
DCC FINAL REPORT MATHEMATICA POLICY RESEARCH
30
Overview of Philadelphia’s Pathway to Leadership in Urban Schools (PhillyPLUS) Program
PhillyPLUS is a two-year principal certification program created under The Philadelphia Great Schools Compact with support from the Philadelphia Schools Partnership; it is led by The New Teacher Project. The goals of PhillyPLUS include preparing principals to lead schools in Philadelphia’s underserved communities and fostering educational equality. Participants are educators from both sectors with prior leadership experience—as lead teachers, coaches, and department chairs. PhillyPLUS has operated since 2013, with three cohorts, and has placed residents in more than 70 Philadelphia schools. Funding from the Gates Foundation, along with other funding sources, supported the implementation of the first two program cohorts. Cohorts have grown in size each year of the program’s existence, with the first cohort enrolling 11 residents, the second enrolling 37, and the third enrolling 39.
During the grant period, the PhillyPLUS program consisted of the following primary components: Residency in a local school: Participants worked for one school year managing a team of
teachers in a Philadelphia school. Mentor principals provided guidance and support to the participants. Following completion of the residency program, residents were placed in local schools in leadership positions during their second year in the program.
Training sessions: Prior to beginning their yearlong residency, participants completed a five-week summer institute with their cohort on foundational leadership skills. In addition, residents attended monthly PD throughout the first school year. In the second school year, the residents attended quarterly training sessions.
Coaching: In both years of the program, participants received one-on-one, individualized coaching from dedicated leadership coaches once or twice a week.
Critical friends groups (CFGs): During the residency year, participants were encouraged to participate in small CFGs with other members of their cohort, which were intended to provide opportunities for best practice sharing and group problem solving. (The CFGs were a component of the first two cohorts but not the third cohort, which was not grant-funded.)
Certification: If participants successfully completed their residency and passed the required exams, they earned a principal certification.
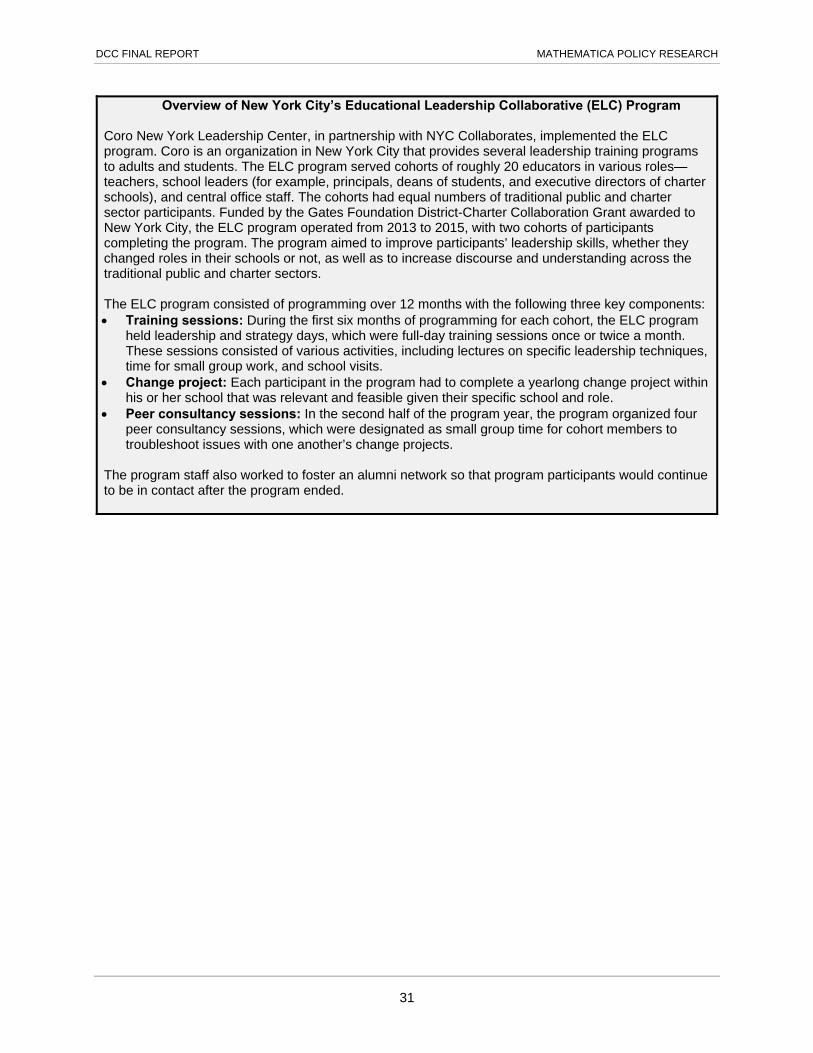
DCC FINAL REPORT MATHEMATICA POLICY RESEARCH
31
Overview of New York City’s Educational Leadership Collaborative (ELC) Program
Coro New York Leadership Center, in partnership with NYC Collaborates, implemented the ELC program. Coro is an organization in New York City that provides several leadership training programs to adults and students. The ELC program served cohorts of roughly 20 educators in various roles—teachers, school leaders (for example, principals, deans of students, and executive directors of charter schools), and central office staff. The cohorts had equal numbers of traditional public and charter sector participants. Funded by the Gates Foundation District-Charter Collaboration Grant awarded to New York City, the ELC program operated from 2013 to 2015, with two cohorts of participants completing the program. The program aimed to improve participants’ leadership skills, whether they changed roles in their schools or not, as well as to increase discourse and understanding across the traditional public and charter sectors.
The ELC program consisted of programming over 12 months with the following three key components: Training sessions: During the first six months of programming for each cohort, the ELC program
held leadership and strategy days, which were full-day training sessions once or twice a month. These sessions consisted of various activities, including lectures on specific leadership techniques, time for small group work, and school visits.
Change project: Each participant in the program had to complete a yearlong change project within his or her school that was relevant and feasible given their specific school and role.
Peer consultancy sessions: In the second half of the program year, the program organized four peer consultancy sessions, which were designated as small group time for cohort members to troubleshoot issues with one another’s change projects.
The program staff also worked to foster an alumni network so that program participants would continue to be in contact after the program ended.

DCC FINAL REPORT MATHEMATICA POLICY RESEARCH
32
Data collection and methods
To address the research questions, we examined data from three sources. First, we used data on the leadership programs previously collected for two interim reports. These data included one-hour to 90-minute semi-structured interviews and focus groups conducted in early spring 2014 and fall 2015 with 44 participants (25 traditional public school participants, 18 charter school participants, and one Catholic school participant) and 8 mentor principals (5 charter and 3 traditional public) across the three programs. Second, in March 2016, we conducted one-hour, semi-structured interviews with two administrators (directors and leadership coaches) from each of the three leadership training programs examined in the case study. Finally, we collected participant-level outcome data from each program: post-program job placement information from two programs and anonymous participant survey data on program satisfaction and current job positions from a third program.
We coded interview and focus group data using ATLAS.ti in April 2016. After coding, the study team examined the data to identify common themes in program implementation.
Funding and other supports: How are intensive leadership programs sustained? What sources of funding or other support are required for successful implementation?
This section describes program administrator and participant perspectives on resources and support—including funding—crucial to successful program implementation.
Financial resources and school leader buy-in were regarded as two of the most important supports for program implementation.
Among the three leadership programs, two were sustained and fully funded by the Gates Foundation for the duration of the grant period, while a third program partnered with the Gates Foundation as well as a local partner. All of the programs sought to secure funding beyond the life of the grant and two were successful in that endeavor. To secure funding, programs sought out additional grants, negotiated additional funding with existing partners, and/or conducted fundraisers. Program administrators noted the difficulties associated with securing funding beyond the life of the grant including soliciting and attracting the interest of potential funders within a short timeframe. Sourcing additional funding via district sources for a cross-sector program was a particular challenge in one site with divisive district-charter relations and a district administration perceived as hostile to charter schools. Regarding the prospects for the long-term sustainability of the ongoing programs, program administrators expressed some uncertainty given budgetary constraints of the cities involved. Citywide budgetary crises limited districts’ ability to provide positions and compensation to incoming residents.
Program participants and program administrators across sites, sectors, and roles cited the importance of the support of current school leaders to serve as mentors. Program participants expressed the importance of open-minded principals and other supervisors who are willing to invest time in cross sector collaborations and intensive leadership programs. One participant explained, “I'm lucky to have a principal who's very personally invested in me and in supporting me, and so when I applied to [program name] it was very much with his support and he wanted me to do this. So when I needed a day off to go to a strategy day on a Thursday he was totally fine with it and not all principals are going to be.” Participants across sites indicated that the support of school leaders varied widely among cohort members, depending on residency

DCC FINAL REPORT MATHEMATICA POLICY RESEARCH
33
placement. Respondents relayed that the openness of school administration to implementing strategies and practices learned in residency was important, with one participant stating, “So I think there have been some really helpful strategies [learned via the program]. As far as them working, it’s about your administration and how supportive they’re going to be and how willing they’re going to be to try something.” Another participant echoed these sentiments but felt that acceptance of collaboration and practices that emerge across sectors is something that is growing at the highest levels of central-office administration but has yet to be fully realized at the school leader level.
Leadership program size was informed by the perceived benefits of small cohorts and the quality of the applicant pool, as well as by the number of available residency school placements.
Intensive residency program administrators across sites described the importance and impact of cohort size. More specifically, program administrators noted that small cohort sizes (under 35) align better with specific programmatic goals, which often entail fostering a sense of community and trust among program participants whether through small groups, PD, coaching, summer institutes, or other training activities. One program administrator stated that, “20 is a real sweet spot where people actually get to know each other…I’m sure it could [be scaled up] but the whole program would have to be redesigned. And I think you’d lose this ability to build those relationships where people still are in contact today and active on their list-servs, sharing out what they’re doing.” The potential for creating lasting relationships among program participants in order to facilitate networks of communication within and across sectors was one reported benefit of small scale programs. Further, one administrator noted that the small scale allows program administrators to be nimble and responsive to feedback from those involved in program activities.
Administrators of both principal residency programs also described the number of qualified applicants as a key factor determining cohort size. Intensive residency programs have explicit standards that target like-minded leaders with a specific set of principles, skills, and goals. A common sentiment among program administrators was, “We’re not going to lower our standards. We would rather take a smaller cohort.” In addition, residency programs were limited by budgetary constraints, as larger programs require more funding. Budgetary crises across cities coupled with a limited number of available positions for residents also impacted the scale of existing programs, with one program administrator stating, “We’ve had to be really scrappy to secure jobs for the leaders in training. The program design was such that people should be in an assistant principal position during the training. So it’s on the school budget. But the problem is the launch of our program coincide[d] with a budget crisis…So there are very few second mid-level leaders [assistant principal positions] in schools.”
Most promising components for replication: What are the most successful components of these programs from the perspectives of participants and program administrators? To what extent are the most successful components consistent across programs?
Across sectors, roles, and sites, the feedback on the programs was overwhelmingly positive, with most respondents expressing great appreciation and praise for the programs. In the two
DCC FINAL REPORT MATHEMATICA POLICY RESEARCH
34
programs with school residencies, several participants stated that the program prepared them well to become a principal, and they could not have had success in their principal role without the knowledge, skills, and experience they gained through the programs.
Program administrators and participants highlighted leadership development sessions, coaching, and small group activities as particularly successful components of the programs.
Program administrators and participants across all locations cited leadership development sessions as a particularly successful component of their programs (please see the appendix for additional details on the leadership PD sessions provided by the programs). Program administrators felt these sessions taught participants skills and knowledge necessary for them to grow as leaders. Likewise, participants in all sites stated that they felt the leadership development sessions were directly applicable to their current roles and helped prepare them for future leadership roles. Participants specifically appreciated learning about how to identify and engage stakeholders in their schools, establish a growth mindset, and apply better listening skills. One district participant explained that these sessions also provided time for sharing practices across sectors and discussions of how to apply charter practices within a traditional public school. In addition, one site’s leadership development sessions provided a broader lens on the local education agencies within the city. For example, one program’s sessions included spending time with leaders at the district office, which the program director felt were “some of our most eye-opening” activities as participants could better understand how district-level decisions were developed.
In the two programs with intensive coaching—between two and three hours per week of one-on-one coaching, all program staff and many participants identified coaching as a highly effective component of the program. Program administrators stated that the programs’ dedicated leadership coaches were able to set goals for growing specific skills with the participants, and provided personalized feedback, holding participants accountability for meeting their goals. One program administrator noted, “I think the highest impact thing we do is coaching. That’s really where we feel like we see the most transformative growth in people.” Coaching served multiple purposes—not only “technical skill building,” but also “cognitive coaching, kind of getting into people's underlying assumptions and beliefs and having them really explore where those are serving them and where they’re getting in their way.” Coaching increased participants’ self-awareness “about the habits of mind and the beliefs that they need to have to be strong leaders.” As part of this approach, coaches encouraged participants to use emotional intelligence in their leadership decisions and to create a vision and mission for their school that was shared by both school leaders and other staff, including teachers. In the other site, a program administrator stressed the importance of the intertwined nature of the leadership development sessions and the individual coaching provided to participants, as both types of activities would cover the same basic concepts. This administrator explained: “I honestly believe that the marriage between the professional development and coaching make for the greatest impact. We really see coaching as an extension of the core content that we introduce in the professional development.” One district participant in this site praised the program’s coaching, “I think that the coaching is the missing piece in so many principal prep programs… You know I think that that’s just invaluable just to be able to have that type of support. I think that’s what really makes the program different than anything else.” This participant indicated that conducting classroom observations and teacher

DCC FINAL REPORT MATHEMATICA POLICY RESEARCH
35
coaching in the participant’s residency school with a coach was particularly important for the participant’s development, as the coach was able to provide real-time guidance and assistance as needed.
For the two programs with formal small group activities, respondents frequently mentioned the small groups as a successful component of the program. Program staff in each site gave a specific protocol for participants to follow during their small group work, and many times program staff themselves were present during small group sessions to model how to use the protocol. One program administrator noted that the small groups were less successful after the first year of the program because the cohort grew in size and program staff were no longer able to attend every small group session to support the participants’ use of the protocol. A few participants in each site noted that the small group protocols helped guide their discussions and facilitated sharing practices. One charter participant elaborated, “We were meeting like every two weeks to talk about what’s going on in school, so we’ll unpack the problems in protocol. And you leave that session with just a different way of looking at the same issue, a little perspective. And you get to share too...I share my curriculum. I share with them everything.” Through these groups, cohort members often built strong bonds with each other. Multiple participants expressed a desire to continue meeting with their small groups even after the programs ended. Participants also noted that, even when no formal meetings were occurring, they knew they could call or email their fellow cohort members anytime for advice or help.
Program staff successfully fostered trust and a sense of community among participants.
All three programs were particularly successful in building trust among program participants, mainly because program staff were purposeful in using mechanisms to foster trust within the cohorts. For example, careful participant selection created cohesive cohorts of people who shared similar goals and vision. One charter participant shared that the program “had vetted us for…really being invested in our schools, and so this was a network that I really trusted.” Echoed a district participant from the same program, “there’s just a philosophical assumption here right from day one that we were all here with a set of shared values and goals.” Because participants saw their cohort as sharing a vision and passion for education, they were able to work well together, even across sectors. In addition, all the programs started with intensive early activities: in two sites, the program began with a two- or three-day retreat, whereas the third started with a five-week summer institute. Program staff incorporated team building exercises and opportunities for participants to learn about each other during these initial meetings. These activities early in the program were perceived to immediately set up a sense of camaraderie and shared purpose among the participants, which set the tone for later activities that required participants to be open and honest with one another.
Following the selection process for like-minded individuals and initial trust-building activities, program administrators continued to focus on building trust within the cohorts as the programs progressed. For instance, small group activities were intended to encourage close relationships and rapport among participants. During these activities, participants became comfortable sharing problems and successes with each other. One district participant commented that the small groups had a shared “commonality,” which “brings us together, and it’s just great to talk with people. We have this trust we build…if we have some type of issue or something that we need to hash out, we’re going to each other first, you know what I mean, because we just

DCC FINAL REPORT MATHEMATICA POLICY RESEARCH
36
found that within the cohort…the intelligence level and drive and people’s different experiences and talents are so great…” Finally, in one of the programs, program staff strategically did not identify participants’ sectors until well into the program; this approach allowed the group to forge a bond without being influenced by stereotypes or misperceptions of staff in other sectors. As one of the program administrators explained, the program explicitly did not provide “formal space” for participants to “engage in dialogue around perceptions and beliefs about district and charter school systems and ways of being” until most of the leadership development sessions had already been completed. The administrator continued, “We wanted to wait until they really had relationships and knew each other before they talked about whatever they believed about each of the systems.” Another administrator in this program echoed this sentiment, stating that the “secret sauce” of the program was “that we were able to create the kind of collaboration partnership and exchange and community that we did because we didn’t start with the politically polarized topics. We started with building community.” Overall, participants across programs were overwhelmingly positive about the level of trust they felt within their cohorts, and program administrators noted that the program models emphasized building trust.
Program impacts: What are the perceived impacts of these programs on their cities? How do the programs influence cross-sector collaboration in particular? Is the inclusion of participants from multiple sectors perceived as a critical component in these programs?
All three leadership programs were perceived to have had a substantial impact on personal leadership growth for participants and, in turn, a positive impact on the schools in which participants and alumni were serving. The residency programs in particular were viewed as successful school leader pipelines for district, charter, and parochial partners. This section discusses the perceived impacts of the three leadership programs in more detail as well as the role of cross-sector collaboration in the programs’ success.
All three leadership programs, and particularly the principal residencies, have been used as school leadership pipelines by district, charter, and parochial partners.
Both principal residency programs were intended to produce a pool of high-quality principal candidates for the districts, charter organizations, and parochial organizations that partnered with the administering entities. Information on the current job positions of program alumni indicates that the programs have been successful in that mission. Across both residency programs, more than two-thirds of the participants who began the residency year were serving as principals or assistant principals at the time of data collection in March and April 2016 (Figure IV.2). The first residency program funded three cohorts using the District-Charter Collaboration Grant: 2012–2013 (two participants), 2013–2014 (four participants), and 2014–2015 (three participants). Among the nine alumni who had participated in the residency program, six were placed as principals in the district within two years of beginning the program, two were serving as a dean or assistant principal in the district, and one was in a leadership position in the district central office. The second residency program supported two cohorts of participants using grant funds: 2013–2014 and 2014–2015. Nine of the 11 initial participants in the 2013–2014 cohort successfully completed the residency year and were certified. Four were currently serving as principals (two in traditional public schools and two in parochial schools) and four were currently in assistant principal positions in charter schools. (The remaining alumnus left the field

DCC FINAL REPORT MATHEMATICA POLICY RESEARCH
37
of education.) Twenty-six of the 37 initial participants in the 2014–2015 cohort successfully completed the residency year and were certified. Ten were currently serving as principals (8 in traditional public schools and 2 in charter schools) and 15 were currently in assistant principal positions (2 in traditional public schools, 11 in charter schools, and 2 in parochial schools). (The remaining participant left the program during the second year.)
Figure IV.2. Percentage of residency program participants serving as principals or assistant principals following their initial residency year
Source: Based on job placement information provided by residency programs in March and April 2016. Sample includes nine participants from Program A and 48 participants from Program B.
The third leadership program was designed not to train aspiring principals but to focus more broadly on leadership development for educators in a wide range of positions within schools. Nonetheless, more than half of the alumni surveyed from the first cohort (9 of 17 responding alumni) reported that the program had contributed to an upward job trajectory. More than a quarter of alumni respondents (29 percent) indicated that their participation in the program had been a factor in their promotion to an assistant principal or dean position. Another 12 percent of alumni respondents reported that they had enrolled in principal preparation programs as a result of their participation in the program, and an additional 12 percent credited their participation in the program for subsequent promotions to a teacher leader position.
Program administrators, central-office administrators from district and parochial partners, and participants also reported that the leadership programs had influenced hiring and leadership development practices across partnering districts, charter organizations, and parochial schools.
In addition to generating a strong pool of principal candidates, the residency programs in particular were reported to have influenced conceptions of effective school leadership more broadly in their cities. Program administrators believed that partnering organizations—districts, CMOs, and parochial school organizations—view residency program alumni as high quality principal candidates. Indeed, the principal and assistant principal placement rates for program alumni reported earlier demonstrate that local education agencies viewed the programs as viable school leader pipelines. One program administrator noted that half of the new principals hired in the local district prior to the current school year were program participants and alumni. Across both programs, administrators also reported changes in district policies around developing and hiring school leaders as a result of the district partnerships with the residency programs. One district shifted its hiring timeline at the suggestion of program administrators to be able to
78% from Residency Program A
69% from Residency Program B

DCC FINAL REPORT MATHEMATICA POLICY RESEARCH
38
compete with the charter sector for leadership talent. Both districts were also at various stages of collaborating with program coaches and incorporating elements of the programs’ leadership development into their own approaches to supporting and training district school leaders.
All three programs were perceived to have had positive intermediate impacts on principal and teacher leader quality.
Participants in all three leadership development programs found their experiences invaluable for their personal growth as leaders. Nearly all responding participants credited the programs with making them more capable as school leaders; one traditional public school principal was among many who stated “To be honest with you…I would not be here if I didn't go through that program. I really wouldn't.” While the provision of a free route to principal certification via some programs was certainly a benefit, the training in leadership strategies and mindsets was widely cited as an invaluable component of effective programs, along with the development of instructional leadership and teacher coaching skills not perceived to be readily provided by other principal certification programs. One traditional public school principal explained, “I guess the easiest way for me to sum it up is that I got my principal certification through a traditional program before…Had I not done [the collaboration grant leadership training program] I would not have been ready. The focus on instruction, the focus on strategically thinking about things, I would say through all of the different masters and teacher preparation or education preparation programs that I’ve done, [the collaboration grant] was the most impact and most purposeful.”
The professional networks generated by the leadership programs were also perceived to have a positive impact on program alumni. Participants in one program in particular described their connections to their cohort members as long-lasting and reported continued regular communication, including sharing of practices and career opportunities, beyond completion of the program. Having a trusted professional “sounding board” was regarded by respondents as an essential element in their success and sustainability as leaders. One program alumnus and current charter principal noted, “I was in connection with other principals [via the collaboration grant program]…They say as a principal the job is so lonely, you feel like you're on an island. So I never felt alone. I always felt supported. I still feel supported. I felt like at any point in time I could reach out and contact someone.” The experience of working across sectors in particular “inspired” participants to “be more open to pulling techniques” from another sector and exposed them to a greater range of effective practices.
Although the pathway from improving school leader quality to improving student achievement is arguably long and indirect, program administrators expressed disappointment that they had yet to observe substantial impacts on student achievement in schools where alumni were serving as principals. One program administrator noted that program alumni “have been perceived as relatively successful, compared to other new principals” in the district. Yet when compared to “suburban schools…and some of the higher-performing magnet schools in their district, they were still significantly below.” At the same time, program administrators acknowledged that program alumni had perhaps not had sufficient time to make an impact on their schools. “It’s still pretty early in the turnaround process,” noted one program administrator. At the time of data collection, it had still been less than three years since the first resident cohort in either residency program had completed the residency year. Although focused on exploring additional program improvements that might ultimately yield more sizeable impacts on student

DCC FINAL REPORT MATHEMATICA POLICY RESEARCH
39
achievement, program administrators were still encouraged by what they perceived as promising intermediate gains in principal and teacher quality as a result of the programs.
The cross-sector designs of the leadership programs were perceived as beneficial but also presented unique challenges.
All leadership program participants reported that their cross-sector social networks and sharing of practices with staff in different school types had increased as a result of their participation in the programs. The shared experiences and frequent interactions helped participants break down stereotypes and perceptions across sectors and increase trust, building beneficial professional relationships. One traditional public school participant explained, “my experience really told me that the demographics of folks and their concerns, and their worries, and their joys are very similar across sectors; and that people have consistent challenges throughout; and that sometimes the structure is organized to support them as an educator, and sometimes the structure is not organized as well as it could be to support them; and that the people involved are by and large interchangeable…from what I've seen we're really all in the same boat and we generally don't realize it.” Sustaining these cross-sector networks was regarded as a challenge however, and respondents had yet to see whether the networks might have any long-term impacts.
Beyond breaking down stereotypes, one cross-sector residency program might have facilitated increased movement of leadership talent across sectors. A program administrator noted that many participants who completed their program residency in one sector then moved into positions in other sectors. The respondent speculated that these moves reflected the similar mindsets of program participants and their exposure to other school types through the program: “People have not stayed in the sector that they came from…We’re seeing a pretty even trade around the city [across sectors] based on people's experience in the cohort, their connection back to the values that bring them to the work, and then the type of school they choose to lead having been exposed to a real variety during their time in the cohort.” Participants in another leadership program also reported some movement of program alumni across sectors as well as the hiring of charter teachers for a teacher training program coordinated by the district as a result of connections within the program cohort.
The perceived impacts of the leadership programs on cross-sector relations—breaking down stereotypes, increased practice sharing, social network expansion—were regarded as mainly small in scale and limited only to program participants. Program administrators noted that they struggled to engage even mentor principals in cross-sector collaboration. However, several changes cited by program administrators, participants, and district administrators in the cities where the programs were implemented—and described above—indicated that a transfer of effective practices across sectors was occurring on a wider scale as a result of the program. In one city, for example, systems for coaching teachers implemented in a CMO were being adopted more broadly in the district’s approach to teacher coaching. The strengthened relationship between the CMO and the district as a result of the program led to some sharing of practices around coaching. In addition, alumni from the program were implementing the coaching systems as school principals in the district and described sharing these systems with other schools. District central-office administrators also reported implementing aspects of the coaching model
DCC FINAL REPORT MATHEMATICA POLICY RESEARCH
40
more widely across the district. In another city, the district had adopted a hiring timeline aligned with local CMOs at the suggestion of program administrators.
Program administrators and participants from all three programs perceived the programs’ cross-sector design to be beneficial. Indeed, the essential purpose of one program as described by a program administrator was to “build community and break down boundaries.” The program helped participants become “more aware and politically savvy” to work within the broader education community in the city to facilitate change. For another program, the cross-sector approach was a critical component because it helped shelter the program politically in a context with a high level of tension across sectors. Involving multiple sectors helped position the program “in a very safeguarded spot at a time when nobody is getting along about anything.” Leaders across all sectors “really trust the program, and I don't think that we would have experienced that had we been more aligned with one sector than another.”
Despite these perceived benefits, implementing leadership programs that spanned multiple sectors also presented unique challenges for program administrators. One program in particular reported struggling to engage deeply with partnering entities across sectors and to effectively tailor the program for each specific sector context. (In other cities where the program works only with a district, for example, program administrators have been able to involve the district more closely in the selection and recruitment process and ensure that the program reflects district hiring and evaluation systems.) Tailoring the program to a specific context has not been an issue for another of the three leadership programs evaluated, however; this program is not implemented by a third party but represents a unique partnership between a CMO and a district that have worked closely together to build the program.
Challenges and lessons learned: What implementation challenges do leadership programs face? What changes have the programs made to address these challenges and improve implementation?
The three leadership programs examined faced similar implementation challenges ranging from finding initial residency placements (for principal residency programs) to sustaining alumni networks following program completion. Program administrators reported exploring a range of strategies to address these challenges, with varying degrees of success.
Sustaining an active alumni network and maintaining relationships both within cohorts and between alumni and mentor principals was a key challenge for the principal residency programs.
All three leadership training programs reported a common goal of developing and sustaining strong relationships among participating aspiring leaders that could outlast program participation and serve as a supportive professional network for alumni during their careers in education. One program administrator explained that, “It's essential to create a learning community. It's essential for members to build relationships and, ideally, trust with each other so that they'll take risks so that they'll be vulnerable and be learners, which is tough for adults. It's also very tough for educators who are used to sometimes having to be the experts and having all the answers.” Both program administrators and participants concurred that the cohorts became professional learning communities in which participants relied on other members in their cohorts to share ideas and brainstorm solutions to problems of practice.
DCC FINAL REPORT MATHEMATICA POLICY RESEARCH
41
Sustaining the professional networks cultivated during program participation, however, was a key challenge reported across all three programs. The principal residency programs in particular struggled to keep alumni engaged, with program administrators reporting low attendance at events to which alumni were invited and participants reporting declines in communication within their cohorts following their programs. Most participants pointed to a lack of time as the main impediment to sustaining relationships with their cohorts and participating in alumni activities. Program alumni were typically moving into principal and other school leadership positions and felt overwhelmed with their new responsibilities. One program administrator noted that the program’s primary ongoing challenge has been that following the residency year “People are still pretty bought in to coaching, but not so bought in to professional development. They really don't want to leave their building at that point and don't view it as a high leverage means to impact their development.” A majority of residency program alumni also reported that they and their cohort members had not sustained relationships with mentor principals, often due to high turnover in school leadership in the residency cities.
Program administrators and participants suggested a few strategies to maintain the cohort networks and were exploring additional solutions. One program found particular success with its cohort listserv; program alumni reported within-cohort email activity occurring two to three times monthly as alumni sent emails to the listserv to ask for input on problems of practice, invite other program alumni and their students to participate in events, and share job postings. Another program had filled a role to oversee alumni engagement and post-program placement and reported conducting focus groups to identify needs in those areas. A program alumnus expressed a strong desire to continue cohort meetings after graduation from the program and receipt of job assignments: “It doesn't have to be once a month. Maybe it's a check in once every two months and that's the day we set and everyone comes in and we continue doing the work. I just think that would strengthen [the program] overall.”
One program administrator also speculated that more effort could be made to build trust and integrate small group activities during the program to better facilitate lasting alumni networks. The program found participants relying extensively on their coaches for support, whereas the program intended to provide participants with a lasting network of peers for critical feedback and support because “the coach is not forever.”
Determining how to measure program outcomes and what expectations to set for student achievement in schools led by alumni was also a common challenge.
All three leadership programs similarly struggled with measuring participant outcomes during and after program participation. The challenges faced by the programs are similar to those faced by districts determining how to evaluate principals and seeking to isolate principal impacts from other factors. One program focused primarily on personal leadership growth and found that participants often struggled when they were required to define outcome measures for themselves, particularly around school change projects. The program also found it difficult to quantify the impacts of growth in leadership competencies for potential funders. Both residency programs were very invested in measuring participant impacts on their schools during residency and post-program placement but encountered several obstacles. One of the programs found that obtaining data to measure student achievement outcomes in residents’ schools was a major impediment. Program administrators also reported difficulties finding a way to account for school context

DCC FINAL REPORT MATHEMATICA POLICY RESEARCH
42
both during and after program participation, as it varied widely across participants. One program administrator explained, “I would say there are a few challenges at the heart of it. The thing we struggle with the most is this piece around how to measure our leaders' impact on their students. Anecdotally and based on school assessments we could point to a lot of gains that are happening because of the instructional leadership of our residents, but we want to be able to package that in a way we can share it publicly and be confident that it's going to be predictive of future impact in our schools. We haven't figured that out there yet…I think a second challenge has been really making a distinction between a leader's performance and the impact that their school context has on their performance. Again, we're placing in such a huge range of schools.” The challenge of measuring outcomes was complicated by the cross-sector nature of the programs. Administrators from one residency program noted that attempts to implement a standard benchmark assessment across all of the different residency school types were not successful, and thus there was no common benchmark assessment to compare student growth across all of the residents’ schools.
Alumni from both principal residency programs were frequently placed as principals in turnaround schools, and program administrators found setting expectations for outcomes for such schools particularly problematic. Administrators from both programs noted the lack of a reliable standard for how much time a highly effective principal should need to turn around a failing school, particularly a traditional public school with a mostly highly disadvantaged student population. At one residency program, administrators disappointed that they had yet to see substantial impacts on student achievement in schools where alumni were placed as principals reported pursuing multiple strategies to better position traditional public school alumni for success in turnaround schools. These strategies included seeking traditional neighborhood schools with replicable turnaround success models to visit and increasing emphasis on data rather than processes when evaluating participants during the program—for example, evaluating teacher coaching competency not simply based on regularity of observations and meetings and the use of particular protocols but also based on changes in observed teacher practices and student outcomes tracked by participants.
Both residency programs faced difficulties with many components of residency placement, including finding a sufficient number of host schools available and engaging the mentor principals in resident development.
A year-long principal residency—completed in a single school in one program and split between two schools in the other program—is a key component of two of the leadership programs and also presents a key implementation challenge. Both programs reported being constrained in part by the lack of schools available to accommodate leaders-in-residence. In one site, budget constraints limited district placements in particular, and in the other site, a limited number of charter schools that sometimes needed to prioritize other initiatives over residencies likewise limited the number of available positions for residents. Program administrators described the need to employ creative strategies to source residency placements or adapt quickly to issues with residency placements by placing multiple residents in a single school or moving residents from one school to another.
Clearly defining and conveying the role of mentor principals in the residency schools was also regarded as an occasional challenge for both residency programs. One program administrator noted that some mentor principals seemed to view the residency program as a
DCC FINAL REPORT MATHEMATICA POLICY RESEARCH
43
means of “outsourcing all of [the residents’] development and training” and saw no need to play a role in mentoring and developing the residents in their schools. However, the program expected principals to play a role in on-the-job training of residents, and the administrator feared that the program had not put sufficient effort into “communicating that message strongly enough.” Across both programs, a handful of mentor principals themselves reported sometimes being unclear as to their role in the residency programs. One mentor principal explained, “I think communication between the program and the mentor principal has not been great…it’s been tough to tell whether I’m the third party that they’re trying to keep happy or I’m partnering with the program.”
One potential approach to clarifying the role of mentor principals was demonstrated by one residency program: administrators from the program sought to regularly engage with mentor principals to ensure their assistance in resident development. Leadership coaches from the program reportedly met with mentor principals once every two weeks to check in and engaged the mentor principals in discussions about growth areas identified for residents and specific plans for activities residents should undertake to attain their goals. The program relied on mentor principal support to implement those learning plans, including assigning residents certain tasks and observing residents’ work to provide feedback.
To varying extents, depending on their school placements, participants struggled to implement shared practices and meet program requirements.
Participants in both principal residency programs—and, to a lesser extent, participants in the third leadership program—frequently expressed frustration with what they perceived as a lack of cohesiveness between the program’s expectations and their experiences in their residency schools. This frustration was particularly pronounced in one city experiencing a financial crisis, where principal residents in district schools were originally intended to serve as assistant principals during their residency year but had to be placed in other roles due to budget cuts. As a result, residents were not part of the administrators’ union and had no leverage to meet with teachers or collect data from teachers, as they were required to do as part of the program. Participants reported some lessening of this problem during the program’s second year, as the program was responsive in ensuring that residents be part of the administrators’ union. Still, as one participant described, residents were often expected to do too much: “I don’t feel like they advocate enough for the residents [to have dedicated time for their leadership roles]…There are several residents who are teacher leaders now and teaching five classes, four classes a day. I was in a role where I taught four classes a day and I didn’t feel like [the program] advocated for me to be effective as an instructional leader because I was teaching for most of it.”
Participants in one program also reported that program deliverables—for example, student learning objectives for teachers in the resident’s school or other types of data reporting—did not always align with similar deliverables specific to the participant’s context in the district or in a specific CMO. As a result, participants were tasked with a substantial amount of extra work replicating deliverables in slightly different forms. However, participants noted that the program had been very responsive to feedback on this issue in particular, changing requirements around the deliverables to ease the burden on participants. Program administrators also reported that they had begun assigning coaches specific to individual partner organizations—for example, the district or a CMO—to help tailor program content and deliverables for different contexts.
DCC FINAL REPORT MATHEMATICA POLICY RESEARCH
44
Across both residency programs, several participants described facing resistance from their mentor principals to participants’ suggestions and to their program requirements. Most often, participants in both programs found that any suggested practices or strategies were ignored or explicitly rejected by school leaders. For example, one resident described an issue with a teacher facing a challenging classroom situation, which the resident had shared with fellow cohort members. The cohort members “gave some really great feedback…we action planned for it and problem solved it. And when I brought it back and talked to my principal about it, nothing changed…It was an example of problem solving that was just not even considered.” A former resident from another program reported a similar experience, receiving a response of “we don’t do that here” to any suggested practices. The resident and fellow cohort members felt that “we had the door open [for sharing], but they [the principals] did not.” In addition, a handful of residents from one program noted that their school principals did not want them to leave their buildings for school visitations or other training sessions that were part of the residency program.
The programs were perceived as most successful when participants’ residency schools were willing to demonstrate some flexibility in working with the program administrators and supporting resident development. However, some schools appeared more flexible than others, and the context in each individual residency school could play a substantial role in a participant’s experience in the program. One mentor principal explained, “One of the things that we grapple with is having the goals of the program dovetail with the goals of the school…In order for the partnership to work I think there’s got to be some flexibility on both ends. I definitely wanted to create room for [the resident] to operationalize some of those things [learned in the program]…I don’t know how it’s worked in other schools. I would argue that it’s worked better here than most places because of some of those bureaucratic issues … that exist in other schools.”
Some respondents perceived their residency program as too narrowly focused on instructional leadership.
Across both residency programs, a small number of alumni and mentor principals expressed concerns that the residency programs did not adequately prepare participants for the administrative challenges and responsibilities inherent to a principal position, especially in an urban setting. Several participants and mentor principals found what they perceived as a narrow focus on instructional leadership in one residency program in particular to be a limitation in developing effective principals. One former resident currently serving in a district principal position explained that, thinking about it “now from the perspective of being a current administrator and some of the hoops I have to go through to get certain things; I didn’t learn that in [the residency program]…If [the residency program] was my only prep program for administration, I would have been totally unprepared for this. I would have been awesome in the classroom…but that's a small fraction of my day.” Echoed a mentor principal, “It seemed like it was almost entirely instructional leadership training and I didn't feel like that there was enough operational systems stuff and I think that they took that for granted. [The program] was really, really, really instructional leadership heavy which is great because that's what's gonna move schools. But last week we were on lockdown, and the SWAT team was here, and you have to be able to prepare for that. You have to be able to build a budget that supports your instructional initiatives, and there are other things, like creating a safety plan and a deployment plan for your staff; those are skill sets that everybody just doesn't have. And I'm not saying that you have to
DCC FINAL REPORT MATHEMATICA POLICY RESEARCH
45
devote the same amount of time to it but I felt like there should have been more and I think even the residents may have felt that way, too.”
For a few residents, a very specific focus on instructional leadership and outcomes explicitly tied to instructional leadership led to the feeling of having to lead in a very specific way, being “in a box” and “almost robotic.” “I felt like I couldn't find my own style…I felt stifled in that I didn't feel like I could be myself as a leader,” explained one former resident. Respondents also noted a tension between the program’s expectations for residents’ impacts on their schools’ teaching staffs and instructional quality and the confines of a traditional public school setting, particularly politically. One former resident noted, “If I was engaged in some of the tactics that they wanted me to engage in; being in almost like a big political town, that's really shooting yourself in the foot. And so I wasn't comfortable with those things.” The respondent described feeling uncomfortable with the residency program’s expectations for improving the quality of their schools’ teachers and pushing for immediate achievement gains when placed in a failing school that might need initial substantial changes in culture and a longer timeline for improvements in achievement.
One residency program has worked to prepare residents for a district setting via a close involvement with the district central office and district leadership coaches, who also attend program training sessions and work with residents. The program has also sought to tailor coaching for each individual to focus on specific areas for improvement. For example, one resident with strong instructional knowledge and experience coaching teachers received support and coaching more focused on areas for growth: managing student discipline, speaking to large audiences, and communicating with parents. A program administrator explained that the program’s leadership coaches add value via differentiated support, developing “individual learning plans for each resident,” which are “a way that we go much deeper into things that we identify as important growth areas for them... [A typical resident] has not been principal, but everyone has some kind of previous leadership experience, so they have strengths and weaknesses.”

DCC FINAL REPORT MATHEMATICA POLICY RESEARCH
46
Lessons learned and suggestions from program administrators and participants
Provide opportunities for sitting principals to participate. Cities in which the residency programs are implemented might face limitations in the number of residency and post-program placements available as well as resistance to using the program as a pipeline for hiring. Faced with such constraints, program administrators might need to explore how to influence or improve leadership in other ways. One residency program reported plans to adapt its model to include an additional option for sitting principals to participate. This "executive residency" is expected to include all of the same general components as the current residency—including one-on-one coaching, regular leadership development sessions, school visitations, and a school-based change project—but will be open to participation by principals continuing to sit in a principal position.
Impacts of leadership development may not be easily measurable or immediate; however, programs should not neglect focus on quantifiable intermediate outcomes. All three programs struggled with setting expectations and measuring outcomes for participants, not only for internal purposes but also for presenting to potential funders. Administrators of the program that was focused primarily on personal leadership (not on principal preparation) found outcome measurement a particular challenge, as potential funders most often sought quantifiable impacts on student achievement as evidence of success. Administrators from all three programs, which had at most graduated just three cohorts of leaders from their programs by the end of the grant period, believed that the full impacts of their programs remained to be seen. Promising professional networks were still being developed, and alumni were still relatively new principals. One program administrator explained the need for both funders and developers of intensive cross-sector leadership development programs to take a long-term view while still expecting to see impacts on student achievement: “I think that there is a need to push that this [type of program] has to be outcomes oriented. We need to see results in [partner] schools, not just anecdotal reports that ‘we like this program,’ but we need to see real, big student achievement gains come about as a result of this. At the same time, there needs to be an understanding of what the timeframe may look like for that.” To assess intermediate outcomes, programs might collect evaluation ratings of alumni placed as principals or surveys of teachers—such as the Vanderbilt Assessment of Leadership in Education teacher survey—in schools led by program alumni.
Start small, and limit the pace of expansion. All three programs began with a small number of participants in each cohort; however, one program expanded in size more rapidly whereas the other two programs kept cohort size relatively fixed. Program administrators, participants, and alumni all emphasized the need to begin with very limited cohort sizes and cautioned against rapid expansion. Small cohort sizes ensured the inclusion of only the most qualified participants, facilitated effective and supportive residency placements, and helped maintain a high level of trust and close relationships within cohorts. In addition, program administrators found that limiting expansion better positioned them to respond to participant feedback and improve and refine the program as needed.
Provide more structured and sustained support for alumni. Sustained support for program alumni, particularly alumni of the principal residency programs, was highly desired by alumni respondents. Program alumni, most often principals, repeatedly expressed their wish for additional years of coaching, cohort meetings, and leadership development beyond the existing program lengths. One residency program already offered resident alumni coaching for two years after placement as principals; the other was currently piloting sustained coaching or school evaluation for alumni who were in a principal position. Responses from program alumni regarding extended coaching not only reflect the quality of the coaching provided by the programs—which all participants described as being of the highest quality—but may also provide a broader lesson about the need for more comprehensive support for principals outside of these programs from their districts and charter and parochial school organizations.

DCC FINAL REPORT MATHEMATICA POLICY RESEARCH
47
V. IMPLICATIONS FOR FUNDERS, PROGRAM OPERATORS, AND EDUCATION LEADERS
The implementation of District-Charter Collaboration Grants in seven cities has implications for multiple stakeholders. The lessons learned from the successes and challenges in Boston, Denver, Hartford, New Orleans, New York, Philadelphia, and Spring Branch can inform the work of existing partnerships, other cities considering formal district-charter collaborations, and funding partners.
One overarching implication of our findings is the importance of clear goals and project scope—specifically in the number of participants and the time period for the activities. The theory of action for district-charter collaboration leading to systemic change is ambitious (see Figure I.1). Respondents in both sectors felt that this three-year grant implementation period was not only too short for grant activities to make a substantial difference in building cross-sector coalitions but also too short to generate enough of an impact to attract the interest and funding needed to sustain the initiatives. Collaboration program leaders may be able to improve sustainability and success of program activities by setting and communicating clear targets for intermediate outcomes. However, expectations of measuring any direct impact on longer-term outcomes like equity and student achievement, in the context of other reform efforts occurring simultaneously, should be moderated. There is a long causal chain from any of the collaboration activities to improvements in student outcomes, particularly city-wide student outcomes—so even though improving student outcomes is the ultimate goal, it cannot happen quickly. Yet funders need a way to assess whether the activities are working in ways that can plausibly improve student outcomes in the future. This is why identifying and measuring intermediate outcomes is critical.
Below, we summarize some primary implications for district-charter collaboration work targeting intermediate outcomes, both for existing and prospective collaborators.
Recommendations for Collaboration Activity Participants
Program implementers (including partner districts and schools) provide structures and incentives for cross-sector collaboration
Limited school staff time has been a crucial obstacle impeding cross-sector collaboration. Teachers suggested using the summer for institutes or think tanks focusing on specific areas and marketing those opportunities to teachers.
Participants indicated that the cross-sector collaboration only occurred during the activities themselves. Even with expanded network sizes, educators still need formal opportunities to utilize these networks for collaboration.
Program funders invest in support for implementation
Participants across sites repeatedly recommended a heavy investment in support for implementing shared best practices—for example, via coaches, peer observer, or school leader oversight; otherwise, collaboration would have “diminishing returns.”
Participants involve students in cross-sector collaboration
Several participants, especially in sites with relatively smaller charter sectors, noted that tensions across sectors were not limited to school staff but also included students. Participants suggested partnering with schools on student-based activities.
Program leaders double down on success
Across sites, central office and school staff cited a need to better measure and identify success, then publicize and invest in successful forms of collaboration.
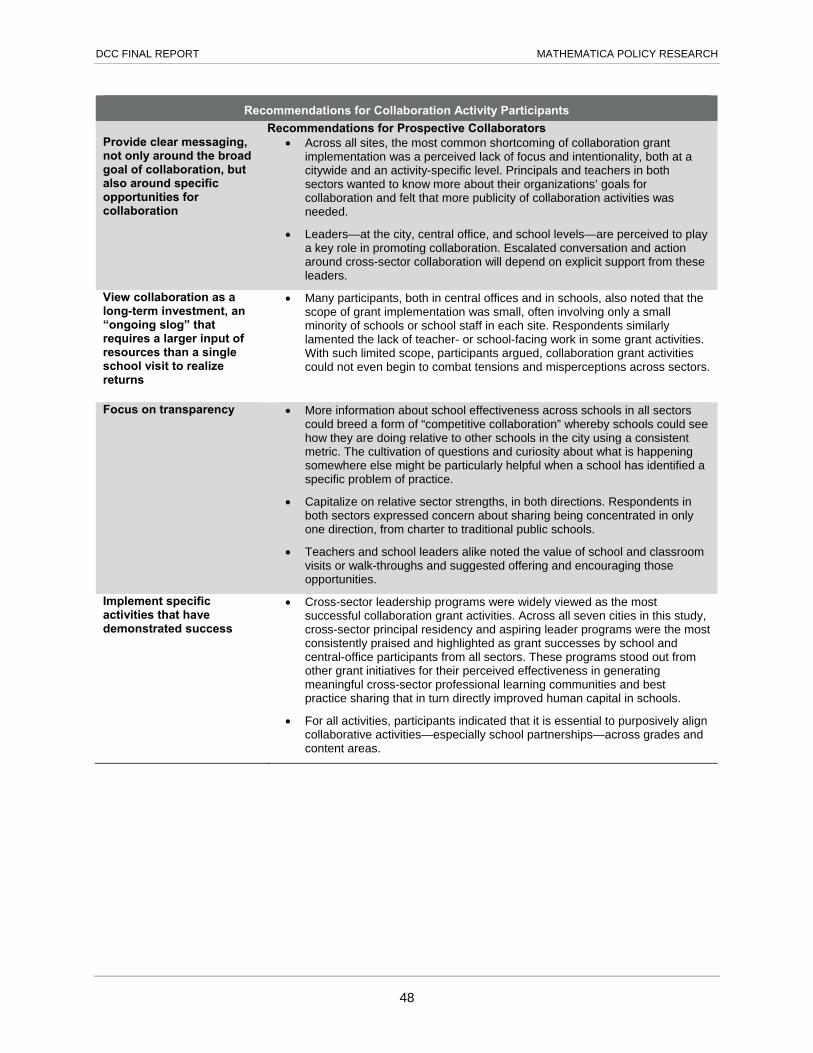
DCC FINAL REPORT MATHEMATICA POLICY RESEARCH
48
Recommendations for Collaboration Activity Participants
Recommendations for Prospective Collaborators Provide clear messaging, not only around the broad goal of collaboration, but also around specific opportunities for collaboration
Across all sites, the most common shortcoming of collaboration grant implementation was a perceived lack of focus and intentionality, both at a citywide and an activity-specific level. Principals and teachers in both sectors wanted to know more about their organizations’ goals for collaboration and felt that more publicity of collaboration activities was needed.
Leaders—at the city, central office, and school levels—are perceived to play a key role in promoting collaboration. Escalated conversation and action around cross-sector collaboration will depend on explicit support from these leaders.
View collaboration as a long-term investment, an “ongoing slog” that requires a larger input of resources than a single school visit to realize returns
Many participants, both in central offices and in schools, also noted that the scope of grant implementation was small, often involving only a small minority of schools or school staff in each site. Respondents similarly lamented the lack of teacher- or school-facing work in some grant activities. With such limited scope, participants argued, collaboration grant activities could not even begin to combat tensions and misperceptions across sectors.
Focus on transparency More information about school effectiveness across schools in all sectors could breed a form of “competitive collaboration” whereby schools could see how they are doing relative to other schools in the city using a consistent metric. The cultivation of questions and curiosity about what is happening somewhere else might be particularly helpful when a school has identified a specific problem of practice.
Capitalize on relative sector strengths, in both directions. Respondents in both sectors expressed concern about sharing being concentrated in only one direction, from charter to traditional public schools.
Teachers and school leaders alike noted the value of school and classroom visits or walk-throughs and suggested offering and encouraging those opportunities.
Implement specific activities that have demonstrated success
Cross-sector leadership programs were widely viewed as the most successful collaboration grant activities. Across all seven cities in this study, cross-sector principal residency and aspiring leader programs were the most consistently praised and highlighted as grant successes by school and central-office participants from all sectors. These programs stood out from other grant initiatives for their perceived effectiveness in generating meaningful cross-sector professional learning communities and best practice sharing that in turn directly improved human capital in schools.
For all activities, participants indicated that it is essential to purposively align collaborative activities—especially school partnerships—across grades and content areas.

APPENDIX A:
DETAIL ON LEADERSHIP DEVELOPMENT PARTICIPANT SELECTION AND TRAINING

This page has been left blank for double-sided copying.

APPENDIX A MATHEMATICA POLICY RESEARCH
A.3
All three leadership programs were intensive and required dedicated participants willing to devote time and energy to completing the programs. Program staff carefully vetted applicants to select participants. The programs, which all lasted at least one school year, were multi-faceted, combining activities like training, coaching, small group work, and school-based projects (including residency placements). This appendix describes the processes through which the programs recruited and selected participants as well as the activities entailed in each site.
Application and Selection Processes
Participants typically were introduced to the programs via personal or professional contacts and chose to apply to the programs to build their leadership skills.
Participants reported learning of the leadership programs in a variety of ways. In all sites, participants most often were referred to the programs by their own principal, other colleagues, or friends. In two sites, several participants were introduced to the programs through their connections with program alumni, who vouched for the programs and encouraged the respondents to apply. A small number of participants reported learning about their programs on their own or through an email that included program information. A few other participants indicated that they were contacted directly by district office staff to refer them to the program.
Participants across all sites and sectors most frequently reported choosing to apply to their programs because they were seeking new leadership roles and wanted to become better leaders. Charter respondents in one site also frequently mentioned applying to their program because they wanted access to specific program features, such as coaching and training sessions. In another site, many participants from both sectors stated that they applied to their programs because they wanted the opportunity to learn with a cohort of passionate people. A few other charter respondents in this site noted that they joined the program because their work as leaders in their schools was busy and isolating, and the program was an opportunity to get out of their own schools and dedicate the time to think about broader education issues in the city.
All three programs had rigorous application processes to screen potential participants.
The types of educators eligible for the program depended on the program model. The two residency programs targeted individuals aspiring to principal positions. As such, participants typically were already holding some type of leadership position within their schools—for example, grade level chair or teacher coach. In the third site, educators in any role were eligible, and participants’ positions could vary widely, from classroom teacher to dean to central office staff. All three programs required that applicants have at least three or four years of experience in education. This requirement was particularly important for the two residency programs that were avenues to principal certification, as eligible applicants had to meet statewide requirements for such certification. (Some participants in these cities already held principal certification.)
All three programs employed thorough application processes to conduct an initial screening of applicants. Each site required applicants to submit a written application with two to six essay questions, and one site also required applicants to submit video-recorded feedback to a video recording of a teacher providing instruction as part of their written application. Following the initial application process, two programs then conducted in-person interviews that included role-play scenarios about challenging situations with teachers or parents and modeling how they
APPENDIX A MATHEMATICA POLICY RESEARCH
A.4
would coach teachers. One program also included a data analysis exercise in which applicants were asked to formulate recommendations for school improvement based on provided data.
The rigorous application processes reportedly resulted in highly selective programs. One residency program reported an acceptance rate ranging from 8 percent in its first year to 9.5 percent in its third year.
In selecting participants, all three programs prioritized creating a like-minded cohort of passionate educators.
Each program was very deliberate in selecting which applicants would be invited to participate. In each site, program staff, including coaches, were involved in making selection decisions. One program also included other stakeholders—central-office staff from the partner district, and traditional public school and charter principals—in participant selection. The other two programs consulted their partners for additional information or suggestions, but the operating organization made the final decisions on participant selection. While decisions were primarily driven by the characteristics of the individual candidate, program staff also considered cohort size when determining whom to accept to the program. The two residency programs needed available placements for each participant; therefore, the programs could only accept as many applicants as there were placement slots available.
When assessing each applicant, staff from all three programs sought individuals who would be good fits—those who were willing to commit to the program model and who possessed the experience and skills to contribute to a strong cohort of future leaders. Specifically, all three programs looked for applicants who displayed self-reflection and self-awareness. Applicants with those attributes were perceived to be able to identify correctly their own strengths and growth areas, and thereby better use and apply the coaching and other support offered through the programs. In addition, program administrators sought passionate individuals who were already going “above and beyond” to serve their students. Two programs reported seeking candidates who demonstrated a commitment and concern for the communities they would be serving as well as a commitment to their own continued learning. These two programs also wanted candidates who were outcomes-oriented and were comfortable with accountability measures in which their own outcomes would be tied to student achievement outcomes. However, staff from one of these programs noted they struggled to find applicants with the desired comfort with accountability for outcomes, particularly among traditional public school staff. Finally, both programs also looked for applicants with demonstrated instructional expertise, although again one site had difficulty finding many candidates in their city with a sufficient level of expertise.

APPENDIX A MATHEMATICA POLICY RESEARCH
A.5
Program Activities
All three leadership programs required participation in multiple intensive activities.
The programs offered intensive programming that occurred over the course of one school year. All three programs shared the following components:
Leadership development sessions. All three programs included leadership development sessions, which occurred weekly in one program and monthly in the two others. One of the residency programs also included a full-day, five-week summer institute prior to the beginning of the residency year. The other two programs began with a multi-day retreat—one of which was a weeklong summer retreat—that aimed to build connections and bonds within the cohorts. In general, training sessions addressed specific leadership skills and were designed to prepare participants for new leadership roles. For example, sessions covered topics such as communication styles and methods, how to build credibility quickly as a new leader, or setting up systems and processes within a school, including systems for teacher development. Training sessions also often included role-playing activities during which participants practiced how to handle challenging situations as a leader. All three sites also incorporated into leadership development sessions formalized school visits or walk-throughs at participants’ schools. These school visits were used, for example, to highlight a particular best practice that other participants could potentially use at their own schools or to observe a particular problem or issue the school was having, with participants using a specific protocol to provide feedback.
School-based training. Each program incorporated school-based activities for applying leadership skills using either a residency placement and/or a change project. Two programs involved a yearlong residency as a school leader in training. In one of the sites, each participant served as a resident leader at the same school for the full school year, whereas in the other site each participant spent half the year as a resident in a charter school and half the year as a resident in a district school. Both programs expected the principals leading the schools where residents were placed to serve as mentor principals for the residents. The third program did not have a residency program but required participants to complete yearlong change projects in their schools as a practical application of their leadership skills. Examples of the types of change projects included increasing parent engagement, improving special education programs, and creating a leadership program for African-American and Hispanic male students. In one of the two residency programs, participants similarly had to complete a change initiative in each of their placement schools. Participants were solely responsible for identifying a problem in the school and conceiving and overseeing an initiative to address the problem—for example, addressing bus behavior issues via a student bus monitor system.
Coaching. The two residency programs also included intensive individual coaching from program staff for approximately two or three hours per week. In one site, coaches met with residents in-person each week, and in the other site, coaches were onsite at residents’ schools every other week and conducted coaching over the phone during alternate weeks. Coaches for both programs were described as providing individualized guidance that was highly tailored to the particular needs and goals of each resident. Although the third program did not include formalized coaching, program staff modeled how to provide coaching to

APPENDIX A MATHEMATICA POLICY RESEARCH
A.6
teachers or other peers during monthly training sessions and encouraged participants to learn how to coach each other as peers.
Small group activities. Two of the programs incorporated formal small group activities, referred to as “critical friends groups” in one program and “peer consultancy” in the other. The small groups were designed to include participants from multiple school types within each group. (The third program did not have formal small group activities; program administrators noted that the cohorts were small enough that the weekly cohort training sessions served the same purpose.) The small groups typically comprised between three and five people and met for ninety minutes to two hours per session. In one program, the formal small group meetings occurred roughly once a month in the second half of the school year, after the formal training sessions had finished. The other program held the small group sessions twice per month throughout the school year. Both programs provided formal protocols to guide the small group sessions. Participants brought a challenge or problem of practice they were facing in their schools and received advice and feedback from the other participants on how to address the problem. Program staff attended the small group meetings to help facilitate sharing and make sure the group understood how to use the protocol. (In one site, the program staff only attended the small group meetings in the first cohort; due to the increased size of the cohort in the second year, program staff were no longer able to attend each small group meeting and noted that as a result the small groups were less successful.)
Across each program, most activities occurred during a single year for a given cohort, although some activities continued into additional years. One program had one meeting in the following school year during which participants shared the results of their change projects, but did not have any other formal activities beyond the first year. In the two residency programs, most program activities continued beyond the participants’ residency year, albeit at a lesser intensity. For instance, both programs continued coaching for at least another year following the residency. In one site, the dosage (two to three hours per week) and level of coaching were the same during the residency year and the subsequent year. In the other site, the dosage of coaching remained the same, but the level and duration of coaching subsequent to the residency depended on the role to which the resident had transitioned. Residents who became assistant principals in the next year received one additional year of coaching in groups; residents who became principals in the next year received two more years of individualized coaching. (Residents who began as assistant principals and transitioned into a principal role were also provided with an additional two years of one-on-one coaching in their principal positions.) Both programs provided some additional PD after the residency program as well. Specifically, they held summer institutes to prepare residents for their new roles as assistant principals or principals. One program additionally provided quarterly all-day training sessions. Informal meetings with small groups or mentor principals could also continue beyond the residency year, depending on interest and availability.
Program staff held participants accountable for their performance.
Program staff in all three sites closely monitored the progress of participants to ensure they met program requirements and achieved a high level of performance. One program described a rigorous evaluation system that evaluated performance through (1) participants’ own progress and growth, measured via self-assessments, mentor principal assessments, and coach
APPENDIX A MATHEMATICA POLICY RESEARCH
A.7
assessments; (2) the effectiveness of the teachers within the resident’s school, measured based on resident tracking of teachers’ progress toward PD goals and whether the resident had established differential retention goals for low performing and high performing teachers; and (3) student outcomes within the resident’s school, measured through student test outcomes and observations by program staff to assess which teachers coached by the residents were implementing a goal-setting process in their classrooms. Staff assessed participants’ progress on the measures three times throughout the residency year. Program administrators from a second site reported that the leadership coach and mentor principal would meet with the resident quarterly to provide formalized feedback and discuss the resident’s growth. The meetings were also used to develop individualized goals for the next six-week period to help ensure readiness to serve as a principal during the following year. In the final site, participants completed mid-year review calls with program staff to assess progress on their change projects and goals. After the program year, the full cohort of participants reconvened, and each participant presented on the implementation and impact of their change projects within their schools.

Mathematica® is a registered trademark of Mathematica Policy Research, Inc.
www.mathematica-mpr.com
Improving public well-being by conducting high quality, objective research and data collection PRINCETON, NJ ■ ANN ARBOR, MI ■ CAMBRIDGE, MA ■ CHICAGO, IL ■ OAKLAND, CA ■ TUCSON, AZ ■ WASHINGTON, DC