ELCO MLP Separately Managed Account ProgramJanuary 2014
ELCO MLP Separately Managed Account ProgramJanuary 2014
“The U.S. Energy Boom will be like the Internet of the 1990’s.” – Jack Welch
*See legal disclaimer page 17*See legal disclaimer page 17

2
ELCO Management OverviewFocus and Expertise
ELCO Management OverviewFocus and Expertise
ELCO is an Energy and Infrastructure focused investment manager founded in 1995.
• Managers have a combined total of 100+ years of experience researching and investing in the energy sector, 60+ years directly focused on MLPs
• ELCO employs a fundamental research driven process and utilizes a strict and comprehensive risk management approach
• Current investment opportunities offered by ELCO include two energy funds and actively managed MLP separately managed account strategy (slide 9) , which can be tailored to clients risk and income requirements.
• One Hedge Fund managed by ELCO has been consistently recognized as a top-ten energy focused fund by Barclays Managed Fund Report
• Assets under management are currently $275 million
• SEC Registered

What is a Master Limited Partnership (MLP)?What is a Master Limited Partnership (MLP)?
An MLP is a partnership whose shares (units) are traded on public exchanges.
MLPs are yield oriented vehicles comparable to utilities and REITS.
Similar to REITs, MLPs are tax efficient corporate structures. MLPs pass all income, gains, losses, and tax deductions to limited partner investors (LPs). MLP distributions (dividends) are typically 70-90% tax deferred and can offer estate planning benefits.
To qualify as an MLP, more than 90% of a company’s revenue must be derived from the extraction, transportation, processing, storage or distribution of a natural resource. These assets are typically long-lived and produce stable free cash flow.
Master Limited Partnerships (MLPs) are at the leading edge of building, acquiring, maintaining, and managing the core energy infrastructure in North America
There are more than 100 MLPs. A majority of MLP’s operate in the pipeline sector and MLPs operate almost half of US pipeline miles
Over the past decade, MLPs have provided superior returns with lower risk compared to stocks and bonds
3
ELCO MLP SMA S&P 500 Index15.57% 5.78%
Compound Annual Growth Rate Since Inception

4
MLP OutlookMLP Outlook
• MLPs have abundant organic growth opportunities. In the past five years alone, MLPs have invested ~$100 billion in new infrastructure—impressive relative to their current market capitalization of ~$400billion.
• MLPs are well positioned to benefit from the significant infrastructure needs associated with emerging shale gas resources
• Unconventional gas resources are forecast to grow from 8.0 Tcf in 2008 to between 16.1 and 22.4 in 2030• Shale developments occurring in non-traditional locations requiring new pipelines• Expanding need for natural gas storage in new production basins• Growing need for natural gas processing capacity
• Further opportunity exists in capacity additions in the intrastate pipeline network. An estimated $20 billion of investment is needed in the next two years if all 180 proposed projects move forward. INGAA, the US pipeline trade group, estimates $130-$210 billion of investment is required to meet demand growth over the next 20 years.
• With an average yield of 6.00% and estimated high single-digit distribution growth, MLPs are poised to provide continued attractive total returns.
Source: Wells Fargo Bloomberg
12.4%
6.0%
6.4%
3-Year Distribution Growth Estimate Total Return Potential
+ =
Current Yield

5
Outlook: Energy Trends Lead to Increased Growth for MLPs
Outlook: Energy Trends Lead to Increased Growth for MLPs
Fundamental changes in the U.S. energy industry are creating significant opportunities to invest in North American energy infrastructure as new shale plays are typically in regions with little or no take-away or processing infrastructure
• Shifting North American supply basins – Oil and Natural Gas Shale plays, Canadian oil sands, Rocky Mountains & LNG- all present growth opportunities for energy infrastructure players
• Shale “haves and haves not” - market has bifurcated companies that have significant exposure to shale
• Companies in hotter plays have out-performed (Eagleford, Marcellus, Permian, Bakken)
• IOCs and Majors have made sizeable investments (JV’s – Chevron, Exxon, Reliance, CNOC)
• M&A heating up – Kinder Morgan/El Paso, Energy Transfer/Southern Union & Sunoco, Statoil/Brigham, Exxon/XTO, BHP/Petrohawk
• Political backdrop - Washington encouraging more development of domestic energy to support job growth and national security

MLP OverviewThe MLP universe has grown substantially in the past 15 years; from a small number of niche investments to
over 100 companies and over $400 billion of market capitalization rivaling the US utility sector in size
6
MLP Risk Profile
MLPs have several subsectors that offer varied growth and risk profiles making stock selection and portfolio management significantly more consequential
N a t u ra l G a s P i p e l in e s &
S t o ra g e
P e t ro l u e m P i p e l i n e s &
T e r m i n a l li n g
M id s t r e a m G a t h e ri n g &
P i p e l in e sP ro p a n e E x p lo r a ti o n &
P r o d u c t i o nR e fi n i n g
L ea s t C o m m o d it y S en s iti v e M o s t C o m m o d it y S en s iti v e
Predominantly Fee-Based Business Hedging Mitigates Risk
Current Energy MLP Landscape
Midstream , 40%
Propane, 2%
Exploration & Production, 12%
Refining, 8%
Wholesale Distribution, 8%
Shipping, 6%
Fertilizer, 4%
Coal, 8%
General Partner/Holding
Co, 6%
Other, 6%

Current Landscape in the MLP SectorCurrent Landscape in the MLP Sector
• “Exceptionally low levels for the federal funds rate at least through 2015” – Fed Chairman Ben Bernanke
• MLPs refinancing debt and improving their cost of capital
• Low interest rate environment - investors seeking higher yielding opportunities
Institutional Ownership Fed Policy
Source: FactSet, Wells Fargo
• Emergence of institutional investment vehicles designed for pension funds and IRA capital
• Improved Liquidity
• Sticky money
• ELCO has a similar customized product not subject to UBTI for Pension and IRA funds
7
Estimated Public Pension Fund MLP Allocation Per Year
$410$886
$3,011$2,556
710
24 23
$0$500
$1,000$1,500$2,000$2,500$3,000$3,500$4,000$4,500
2010 2011 2012 2013 TD0369121518212427
Allocation to MLPs Per Year # of Funds Per Year

8
Recent Performance of an ELCO MLP Account*
Recent Performance of an ELCO MLP Account*
*ELCO MLP Program inception was on February 4, 2004. The monthly performance has been provided by Advent Accounting and Portfolio Management system and represent an existing long only account, which
includes a 1.5% management fee, results are not audited. Prior to January 2013 the management fee was 1.4% Past performance is not indicative of future results of the program.
2.462.462014
35.703.182.192.701.83-1.961.152.57-1.391.675.733.829.932013
9.79-1.06-0.88-0.304.134.475.571.90-8.471.49-3.074.931.572012
JAN FEB MAR APR MAY JUN JUL AUG SEP OCT NOV DEC YTD
2011 2.09 6.45 0.95 3.82 -5.08 0.53 -2.50 -2.14 -4.79 8.01 0.89 6.12 15.80
2010 0.74 4.62 4.40 1.40 -4.76 9.04 5.37 -2.06 7.32 4.63 3.78 4.27 44.78
2009 16.08 -4.68 1.61 11.44 12.87 -2.06 14.64 -3.04 6.20 2.81 8.52 9.24 99.27
Recent performance has benefited from the significant growth opportunities surrounding the various shale plays and demand for infrastructure associated with those plays.
Investors have emphasized high yielding securities , MLPs average yield of 6% with average distribution growth on ~6-8% offers a compelling total return potential
M&A activity – Energy Transfer/Southern Union, Kinder Morgan/El Paso, Energy Transfer/Sunoco, Kinder Morgan/Copano, Inergy/Crestwood, Regency/PVR

Active Management Active Management At ELCO, the preferred method of investing in MLPs is through an actively managed
separate account
The chart above displays the disparate range of performance of just a few of the investment vehicles in the MLP space. The Alerian MLP Index (in italics), is the industry benchmark, where the top six MLP
positions comprise almost 50% of the total Index (see below). Most MLP investment options are structured to track the Alerian Index. Performance of these investment vehicles suffered as some of
larger allocations unperformed in 2013, especially Kinder Morgan.
9
*ELCO MLP Program inception was on February 4, 2004. The monthly performance has been provided by Advent Accounting and Portfolio Management system and represent an existing long only account, which
includes a 1.5% management fee, results are not audited. Prior to January 2013 the management fee was 1.4% Past performance is not indicative of future results of the program.
Fund Name 2013 PerformanceELCO MLP SMA* 35.70%Alerian MLP Index 27.58%JP Morgan Alerian MLP (ETN) 26.45%Alerian MLP (ETF) 18.55%Clearbridge Energy MLP Opportunity Fund (closed-end fund) 18.46%FAMCO Advisory MLP & Energy Fund (open-end mutual fund) 15.34%
Enterprise Products Partners LP 15.48%Kinder Morgan Energy Partners LP 9.64%Plains All American Pipeline LP 6.90%Energy Transfer Equity LP 6.22%Magellan Midstream Partners LP 5.68%Markwest Energy Partners LP 4.00%

10
Organizational Structure
Paul Elliot, CFAFounder & CEO
Daniel Tulis, CFAChief Investment Officer
James Elliot, CFASenior Portfolio Manager
Mayra SantosOperations/Client Relations
Paul DoranAnalyst/Trader
Marianne SpedaleOffice Manager
Michael Stolzar, EsqOutside Legal Counsel
William MazeStrategist/Portfolio Manager
James Elliot, CFASenior Portfolio Manager
“Cycle-tested” Team With Demonstrated Performance

11
Management TeamManagement TeamEnergy Value-Chain Experience Creates the
Competitive AdvantagePaul Elliot, CFA Founder and CEO
• More than 30 Years of Research and Asset Management Experience
• Expertise in Energy Infrastructure, Electrical Equipment, Master Limited Partnerships (MLPs)
• Served as Senior Research Analyst, Portfolio Manager and Partner at Cowen & Co. for 20 years
• CFA Designation 1972
Daniel Tulis, CFA Chief Investment Officer
• More than 30 Years Research Experience
• First Research Analyst Covering Energy Master Limited Partnerships (MLPs)
• Headed the Electric Power, Natural Gas, MLP Research as Senior Managing Director at Banc of America, S. Barney & Shearson Lehman
• Ranked as an All Star for 10 years by Institutional Investor Magazine (#1 in 1994)
• Expertise in Electric and Natural Gas Utilities, Oil and Gas Exploration/Production, Energy Infrastructure, MLPs, Energy Technology, and Special Situations
• CFA Designation 1968
James Elliot, CFA Portfolio Manager and Senior Analyst
• More than 10 Years Research and Portfolio Management Experience
• Cowen Asset Management, Portfolio Manager, Research Analyst, Trader
• Co-Managed a $1 Billion Large Cap Core Portfolio - Invested Sectors: Financial, Technology, Consumer Staples, Consumer Discretional, Health Care, etc.
• Expertise in Power Technology, Alternative Energy and MLPs,
• CFA Designation 1995
William Maze, Strategist and Portfolio Manager
• More than 18 Years Research and Portfolio Management Experience
• Co-Managed $1.7 Billion energy-infrastructure and utility portfolio for Ecofin Ltd. Headed Neuberger Berman’s Utility, MLP, Coal and Energy Technology research.
• Consistently recognized for his research, valuation and stock selection skills in leading institutional research polls and was ranked by The Wall Street Journal as the number-one stock picker in his sector
• Expertise in Power, Natural Gas and MLPs,
Paul Doran, Analyst, Trader, Risk Officer
• More than 7 years Research, Trading, and Risk Management
• Expertise in Oil and Gas Exploration/Production, Energy Services, Energy Infrastructure, MLPs
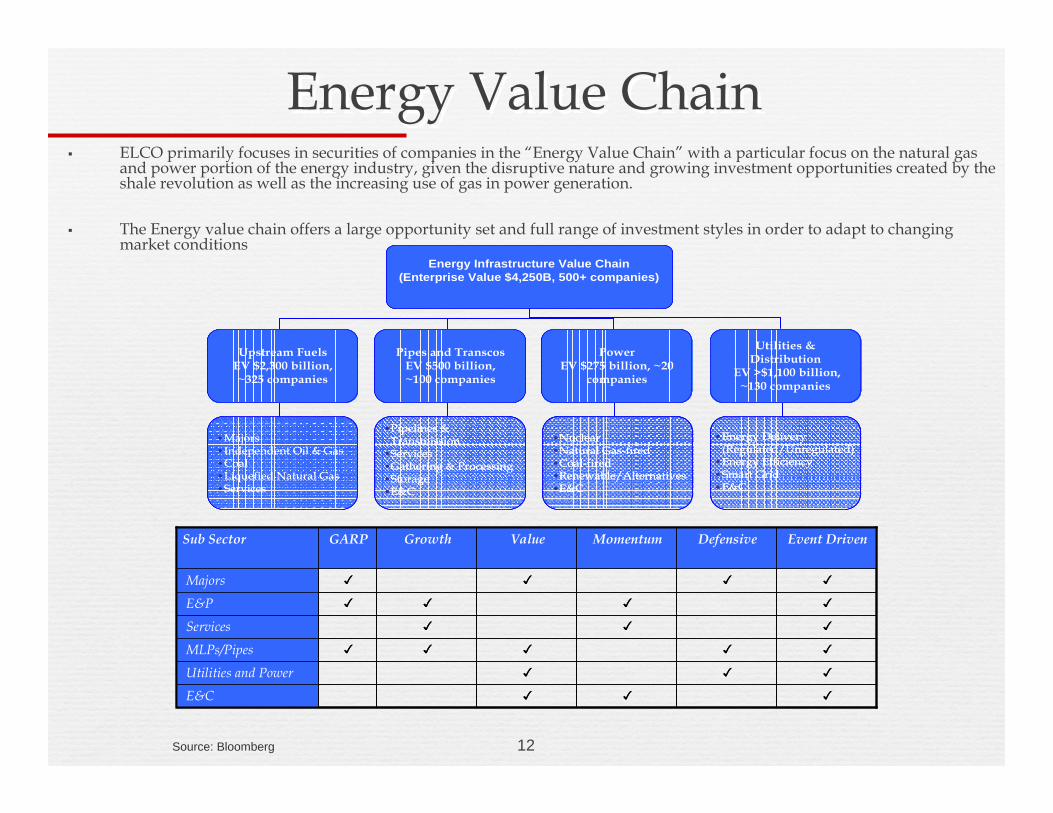
Energy Value ChainEnergy Value ChainELCO primarily focuses in securities of companies in the “Energy Value Chain” with a particular focus on the natural gas and power portion of the energy industry, given the disruptive nature and growing investment opportunities created by the shale revolution as well as the increasing use of gas in power generation.
The Energy value chain offers a large opportunity set and full range of investment styles in order to adapt to changing market conditions
Source: Bloomberg
Sub Sector GARP Growth Value Momentum Defensive Event Driven
Majors ✓ ✓ ✓ ✓
E&P ✓ ✓ ✓ ✓
Services ✓ ✓ ✓
MLPs/Pipes ✓ ✓ ✓ ✓ ✓
Utilities and Power ✓ ✓ ✓
E&C ✓ ✓ ✓
Sub Sector GARP Growth Value Momentum Defensive Event Driven
Majors ✓ ✓ ✓ ✓
E&P ✓ ✓ ✓ ✓
Services ✓ ✓ ✓
MLPs/Pipes ✓ ✓ ✓ ✓ ✓
Utilities and Power ✓ ✓ ✓
E&C ✓ ✓ ✓
Energy Infrastructure Value Chain (Enterprise Value $4,250B, 500+ companies)
Upstream Fuels EV $2,300 billion, ~325 companies
Pipes and TranscosEV $500 billion, ~100 companies
Power EV $275 billion, ~20
companies
• Majors • Independent Oil & Gas• Coal• Liquefied Natural Gas• Services
•Pipelines & Transmission
•Services •Gathering & Processing•Storage•E&C
•Nuclear•Natural Gas-fired•Coal-fired•Renewable/Alternatives•E&C
Utilities & Distribution
EV >$1,100 billion, ~130 companies
• Energy Delivery (Regulated/Unregulated)
• Energy Efficiency• Smart Grid• E&C
Energy Infrastructure Value Chain (Enterprise Value $4,250B, 500+ companies)
Energy Infrastructure Value Chain (Enterprise Value $4,250B, 500+ companies)
Upstream Fuels EV $2,300 billion, ~325 companies
Upstream Fuels EV $2,300 billion, ~325 companies
Pipes and TranscosEV $500 billion, ~100 companies
Pipes and TranscosEV $500 billion, ~100 companies
Power EV $275 billion, ~20
companies
Power EV $275 billion, ~20
companies
• Majors • Independent Oil & Gas• Coal• Liquefied Natural Gas• Services
• Majors • Independent Oil & Gas• Coal• Liquefied Natural Gas• Services
•Pipelines & Transmission
•Services •Gathering & Processing•Storage•E&C
•Pipelines & Transmission
•Services •Gathering & Processing•Storage•E&C
•Nuclear•Natural Gas-fired•Coal-fired•Renewable/Alternatives•E&C
•Nuclear•Natural Gas-fired•Coal-fired•Renewable/Alternatives•E&C
Utilities & Distribution
EV >$1,100 billion, ~130 companies
Utilities & Distribution
EV >$1,100 billion, ~130 companies
• Energy Delivery (Regulated/Unregulated)
• Energy Efficiency• Smart Grid• E&C
• Energy Delivery (Regulated/Unregulated)
• Energy Efficiency• Smart Grid• E&C
12

13
Investment StrategyInvestment Strategy• To maximize the risk/return ratio. Positions are actively managed to maximize total return
potential
• To capitalize on the longer-term investment horizon unique to energy value chain assets– a capital intensive industry providing essential services
• Take advantage of shorter term themes through a discipline approach within a relative value framework
• Capitalize on event driven opportunities
• The investment strategy is managed for all market environments, emphasizing both top-down macro analysis and bottom-up fundamental research
• Total return focus with an emphasis on current income in a risk controlled framework

Investment ProcessInvestment Process• ELCO employs sector expertise and an intensive bottom-up fundamental
research driven process
• Top down themes are developed by analyzing current industry trends
• Positions are modeled and selected on several criteria including:
Earnings leverage to broader themes
Strength of management
Potential upside to fundamental price target
Earnings stability and growth potential
Free cash flow growth potential
Dividend/distribution coverage ratio and quality of cash flow
14

Risk ManagementRisk Management
• We screen for fundamental, macro or political issues
• We sell when a change in the fundamentals place earnings at risk
• We keep the portfolio diversified to avoid concentration or systemic risks
• We reassess, then typically trim as a position nears its fundamental price target
• We employ relative downside targets
• We average down when the stock price is negatively affected by drivers which do not compromise earnings (market sentiment for instance)
15

16
Portfolio Structure
Portfolio TermsLong only YesLeverage NoneLiquidity DailyPosition Level Transparency Real-timeLock-ups, gates, suspensions, etc NoOwnership of assets by investor YesPower to revoke a manager’s trading authority at any moment YesSegregation of assets YesContractual investment covenants YesFlexibility to make intra-month re-allocations YesMinimum Subscription: $250,000Management Fee: 1.5%Commissions: NoneSubscriptions/Redemptions: DailyCustodian Bank: J.P. Morgan
Portfolio MetricsTurnover 60%Average Number of Positions ~25Average Portfolio Yield 6.0%
Current Assets Under ManagementTotal Assets (Strategy): $100,000,000Total Assets (Firm): $275,000,000

17
LEGAL DISCLAIMER
This presentation is being furnished on a confidential basis and serves as preliminary executive summary for information regarding an investment in ELCO Management Co., Separately Managed Account Programs (SMAP), and may not be used or reproduced for any other purpose. This presentation does not constitute an offer to sell nor a solicitation of an offer to purchase interests in any investment vehicle managed by ELCO Management Co., LLC. All security transactions involve substantial risk of loss. Products may involve above average risk and past performance is not necessarily indicative of future performance. All material is compiled from sources believed to be reliable, but accuracy cannot be guaranteed.