Social Networks xxx (2005) xxx–xxx
Egocentric, sociocentric, or dyadic?Identifying the appropriate level of analysis in the
study of organizational networks
Mark S. Mizruchia,∗, Christopher Marquisb
a Department of Sociology, University of Michigan, Ann Arbor, MI 48104, USAb Organizational Behavior Unit, Harvard Business School, Harvard University, Boston, MA 02163, USA
Abstract
This paper examines the use of individual, dyadic and system-level analyses in the study of relationaldata in organizational networks. We argue that dyadic analyses are particularly appropriate when thedependent variable is quantitative and/or involves multiple behaviors. We show that system-levelanalyses, by aggregating potentially significant information, provide a less grounded account of therelations across networks than do dyadic analyses. Using examples from a study of corporate politicalbehavior, we contrast dyadic analyses with those at both the individual and system-levels. Variablesmeasured in raw dyadic form consistently perform better in accounting for similarity of corporatepolitical behavior than do variables measured by taking system-level properties into account. Ourfindings suggest that although individual and system-level analyses are useful in a number of situations,dyadic analyses are a flexible means to examine the effects of multiple networks at multiple levels.© 2005 Elsevier B.V. All rights reserved.
Keywords:Network measurement; Dyads; Level of analysis
A central tenet of social network theory is the view that the structure of social relations inwhich actors are embedded affects their behavior. These effects are assumed to operate at theindividual, organizational and even national level. To demonstrate these effects, researchershave tried to show that network ties have behavioral consequences. In the organizationsfield, where much of this work has appeared, a number of studies have involved showing
∗ Corresponding author. Tel.: +1 734 764 7444; fax: +1 734 763 6887.E-mail address:[email protected] (M.S. Mizruchi).
0378-8733/$ – see front matter © 2005 Elsevier B.V. All rights reserved.doi:10.1016/j.socnet.2005.06.002
SON-481; No. of Pages 22
2 M.S. Mizruchi, C. Marquis / Social Networks xxx (2005) xxx–xxx
that firms adopt behavior that has been previously adopted by firms with which they arein some manner connected. Two classic examples include a work byDavis (1991), whoshowed that firms’ decisions to adopt takeover defense policies known as “poison pills” wereinfluenced by whether firms with which they had director interlocks had previously adopted,andHaunschild (1993), who showed that firms whose officers sat on the boards of otherfirms that had recently engaged in acquisitions were more likely to engage in acquisitionsthemselves. At the individual level,Burt (1992)has shown that corporate managers whosepersonal networks were sparse – that is, the individuals to which they were tied tendednot to be tied to one another – experienced more rapid upward mobility than did managerswhose networks were dense.
Although all three of these authors focused on the effects of network ties on behavior, allof them operated at the individual level of analysis. Davis and Haunschild focused on firmswhile Burt focused on individuals, but in all three cases, the network effects were examinedfrom the perspective of individual actors. Davis and Haunschild measured network ties interms of a firm’s director links to other firms. Burt measured network structures, but theywere egocentric—centered around an individual actor. Although there is nothing wrongwith either of these approaches, neither deals with the structure of the larger network withinwhich the actors are embedded.1 The question is whether the incorporation of this largerstructure would have had an effect on the above analyses.
In this paper, we address the question of whether the level of analysis of an investigator’snetwork matters. In particular, we examine the benefits that might occur for understandingsocial behavior were we to focus on network structures that transcend individual actors.Our focus is on questions that operate at the supra-individual level of analysis, in which ourendogenous as well as exogenous variables are relational. For such situations, we argue thatthe most appropriate unit of analysis is neither the individual nor the entire social structurebut the dyad. We draw on data from a study of firm political behavior to illustrate thesepoints.
1. Individual behavior, or similarity of behavior?
Davis (1991)was concerned with a firm’s decision to adopt a particular policy—a poisonpill.2 His hypothesis was that a firm would adopt the same behavior as a firm with whichit was socially tied. In this case, the focus of interest was clearly on the individual firm’sdecision to adopt. One could extend the analysis, as several researchers have done, byexamining the degree to which the firm is affected by firms with which it is structurallyequivalent (Lorrain and White, 1971). This latter issue requires consideration of the entiresocial structure of firms, and thus creates an exogenous variable at a more macro levelof analysis, but the unit of interest is still the individual firm. There are two alternativeissues to consider, however. First, how would one handle a situation in which one wasinterested in a large number of behaviors? Second, how would one handle a situation in
1 Davis does take into account the effect of actors’ centrality in the larger network of firms.2 Poison pills were statutes invoked by firm managers in the U.S. during the 1980s as a means of warding off
takeover threats.

M.S. Mizruchi, C. Marquis / Social Networks xxx (2005) xxx–xxx 3
which the concern is with the similarity of a single behavior, but the behavior is not a discreteevent?
We argue that in both of these cases, our concern is a relational one—that is, a comparisonbetween the behaviors of two or more actors. We shall illustrate this with two examples.First, we discuss a study of firms’ uses of debt financing, in which our concern is the extentto which firms engage in similar levels of borrowing. Second, we discuss and analyze datafrom a study of firms’ contributions to political candidates, in which our concern is theextent to which firms contribute to the same candidates. These examples represent twodifferent situations that, we argue, yield the same solution.
2. Studies using dyads
Organizational researchers have typically been interested in either the behavior of indi-vidual actors inside organizations or the behavior of organizations themselves. As notedabove, both types of studies lend themselves to the use of individuals as units of analy-sis. Since the mid-1980s, organizational researchers have become increasingly interestedin relations between organizations. In some cases, the questions address whether a pair oforganizations forms some kind of tie. Two topics in particular have lent themselves to dyadicanalysis: the study of interfirm alliances (Gulati, 1995; Gulati and Gargiulo, 1999) and thestudy of firms’ choices of business partners (Podolny, 1994; Keister, 2001; Sorenson andStuart, 2001). In the study of alliances, dyads are not necessary if one’s concern is firms’propensity to participate in alliances. When one’s concern is with which particular firmswill ally with one another, however, then one is asking an explicitly dyadic question: giventwo firms, what is the probability that they will form an alliance? The same question holdsfor firm market relations. One might look, for example, at whether a venture capital firmchooses to invest in a particular startup firm (Sorenson and Stuart, 2001), whether pairs ofinvestment banks serve together on particular bond issues (Podolny, 1994), or whether firmsengage in lending or trade relations (Keister, 2001). What makes the dyadic level useful inthese analyses is that researchers are often interested in the extent to which a property of therelation between organizations affects the likelihood that the firms will form another typeof relation. Is there something about the prior relations between two firms, for example, thatwould increase the probability that they would establish a business transaction or an alliance?
There are other situations in which the use of dyads is less obvious, however, especiallythose involving diffusion. In the studies byDavis (1991)andHaunschild (1993), the variableof interest was a firm’s decision to adopt a particular, discrete form of behavior, in thesecases adoption of a poison pill or making an acquisition. These are firm-level decisions, andfirm-level variables, such as the firm’s size, industry, profitability and debt structure mightbe expected to account for these outcomes. In addition to organizational-level factors, firmsmay be influenced by their relations with other firms. As long as the outcome of interestis a single, discrete, firm-level decision, then the interfirm relation can be treated as anadditional firm-level variable. In these studies, the variables were whether a firm’s interlockpartner had previously adopted a poison pill and whether the firm’s CEO sat on the board ofanother firm that had recently engaged in an acquisition. Such variables, although reflectiveof an interfirm relation, can be easily modeled at the firm level of analysis.
4 M.S. Mizruchi, C. Marquis / Social Networks xxx (2005) xxx–xxx
What happens, however, when the behavior of interest is not a specific action, but ratherthe extent to which actors behave similarly? Although the adoption of poison pills, theuse of golden parachutes, or engagement in acquisitions are variables of clear substantiveinterest, there are other variables that are potentially significant but do not in themselveshave clear intrinsic meaning. Our substantive goal in such cases may be to know whetherfirms do the same (or nearly the same) thing, regardless of what the particular behavioris. Consider a firm’s capital structure. For finance economists, a firm’s level of debt maybe an important substantive variable, something that is of theoretical interest and can bepredicted by a range of firm variables. For organizational theorists, a firm’s level of debtis of limited theoretical interest. Although a firm’s level of capital dependence figures intosome important organizational debates, the variable itself is not of central concern in thediscipline. What is of interest, in both organizational analysis and economic sociology, iswhether a firm’s economic and financial decisions can be accounted for in part by the socialstructures and cultural conceptions under which the firms operate. To the extent that suchbehavior has a social component, it becomes a substantively and theoretically interestingissue. The question is, what exactly about it is interesting?
In an earlier study,Mizruchi and Stearns (1994)developed a model of corporate financingin which they attempted to incorporate social structural and cultural factors to account forthis seemingly “economic” issue. Among their key arguments was that firms’ use of debtwould be affected by their embeddedness in interfirm networks. The implication was thatfirms would look to their peers with whom they shared social ties and would be influencedby their behavior. But the fact that firms are influenced by their peers tells us nothing aboutexactly how that influence manifests itself. A firm could be tied to another firm that took ona high level of debt, and the firm could then borrow heavily in response. Another firm couldbe tied to another firm that eschewed high levels of debt, and the firm could then refrainfrom borrowing in response to its peer. The upshot of these two examples is that even if afirm’s use of debt is affected by its social relations, those relations would have no necessaryassociation with how much borrowing in which the firm engaged.
Mizruchi and Stearns ultimately modeled their network effect by hypothesizing thatfirms whose boards included officers of banks would have higher levels of borrowing thanwould firms without such officers. This was obviously an inadequate solution, because (1)it ignored the fact that bankers might not recommend high levels of debt for all firms and(2) it failed to address the central question of whether firms’ decisions were influenced bythe behavior of theirpeers. The problem for Mizruchi and Stearns was that their dependentvariable was a firm’s level of borrowing, a firm-level phenomenon. Their interest, however,was actually in whether the firm’s level of borrowing was affected by that of its networkpeers, regardless of what that level was. One possible response to this dilemma is to considerthe Davis–Haunschild situation. Just as adoption of a poison pill or engaging in acquisitionscan be affected by a firm’s network partners, why not financing? The difficulty here isthat a firm’s level of borrowing is not a discrete event, but rather a quantitative outcomemeasured on a continuous scale. One cannot construct a variable equivalent to “the firm’sinterlock partner adopted” for the level of financing, unless one wanted to create an extremelycrude qualitative indicator computed by collapsing the partners’ behavior (and the outcomevariable) into categories such as “high” or “low” levels of borrowing. The Davis–Haunschildsolution will therefore not work.
M.S. Mizruchi, C. Marquis / Social Networks xxx (2005) xxx–xxx 5
It is possible to model this network effect at the firm level, using network autocorrelationmodels (Marsden and Friedkin, 1993; Leenders, 2002). In these models, the firm remainsthe unit of analysis, and individual-level variables remain as predictors, but the networkeffects are measured through the insertion of one or more square firm-by-firm matricescontaining the ties between the firms. These parameters are then estimated in a way similarto the computation of the cross-sectional autocorrelation statistic in spatial autocorrelationmodels (Doreian, 1981).
The network autocorrelation model is a perfectly reasonable alternative to the use ofdyads. The question is whether it is the most logical approach to use when one’s variablesof interest are relational. If the primary question is, “Does the social connection between firmA and firm B make them likely to behave more similarly than do firms C and D, which shareno such connection?” then a dyadic level of analysis is logically the most feasible. Whena mix of firm and network-level factors are expected to affect a firm’s behavior, and thatbehavior is of intrinsic theoretical and substantive interest, then a network autocorrelationmodel might make more sense (Mizruchi et al., 2005). The key issue is the extent to whichthe firm-level variables are substantively important. If they are not, they can be handled ascontrols even within dyad-level analyses.
3. Similarity of multiple events
There are some situations in which the behavior of interest is a series of discrete events,such as a firm’s contributions to charitable organizations (Galaskiewicz, 1985) or politicalcandidates (Mizruchi, 1992). Recall that the decision to adopt a poison pill is not only dis-crete, but a single event. A decision to contribute to Senator McCain’s re-election campaignis also a discrete event that could be modeled in the same way as Davis’s analysis of poisonpills. But what if one’s interest was not simply in whether the firm’s contribution to McCainwas affected by its interfirm relations, but whether the firm’s entire constellation of, say,100 contributions was so affected? The only way to handle this problem at the firm level ofanalysis would be to compute a separate regression equation for each of the potential candi-dates to whom a firm could contribute. In recent years, that number has typically exceeded2000.
Imagine, though, that instead of examining each individual contribution, we developed acomposite measure of all of the firm’s contributions. One could code the party or ideologyof the candidates and develop an overall “proportion Republican” or political ideologyscore for each firm. Then one could predict these values using a network autocorrelationmodel. Substantively, however, although the firms’ ideological and party preferences maybe interesting (and in fact have been effectively studied; seeBurris, 1987; Clawson andNeustadtl, 1989), firms’ decisions to contribute to a candidate typically involve much morethan ideology or party. In the political sociology literature, debates over interfirm unityhave been prominent for decades. One (although not the only) possible indicator of unity issimilarity of behavior. If one is interested in the level of unity, then, one is now conceivingof the issue at an interfirm level. The most basic unit of inter-actor relations is the dyad.
Once we consider interfirm unity in terms of similarity of behavior, we can devisean indicator that takes into account the firms’ entire profile of contributions. Rather than
6 M.S. Mizruchi, C. Marquis / Social Networks xxx (2005) xxx–xxx
examining whether if firm A’s interlock partner contributes to McCain, firm A will alsocontribute, one can examine whether A’s interlock partner has a contribution profile moresimilar to A than non-interlocked firms C and D have to one another. At this point, a rangeof measures of similarity of behavior are possible.
4. But what about system-level effects?
The preceding discussion of the value of dyadic analysis may come as little surprise tothose who are familiar with the works cited above. There are at least three situations forwhich the dyadic level seems especially appropriate: those in which the concern is businesstransactions or alliances between organizations; cases in which researchers are interestedin similarity of behavior in which the behavior being examined is measured quantitatively,rather than as a discrete event; and cases in which researchers are interested in the similarityof behavior across a large number of discrete events.
Even if one accepts the value of dyadic analysis under the above conditions, there isanother issue that must be addressed: the issue of system-wide effects. Organizationalresearch has for decades been concerned with the behavior of groups. As attention hasturned to interorganizational relations, researchers have been concerned with the behaviorof groups of organizations as well. The reason that this is relevant to the issue of dyads isthat some of the key issues that dyads have been designed to address have originated assystem-level questions.
One system-level question might be whether a group with a high degree of social cohesionis more effective in solving problems than is a less-cohesive group. In this type of case, theunit of analysis is actually the group, and as long as we can treat groups as observations, thenwe in effect would be conducting an individual-level analysis. Even if we were interestedin group-level questions, however, a case could be made that a dyadic analysis is prefer-able, especially if our primary concerns are relational, which they often are in group-levelstudies.
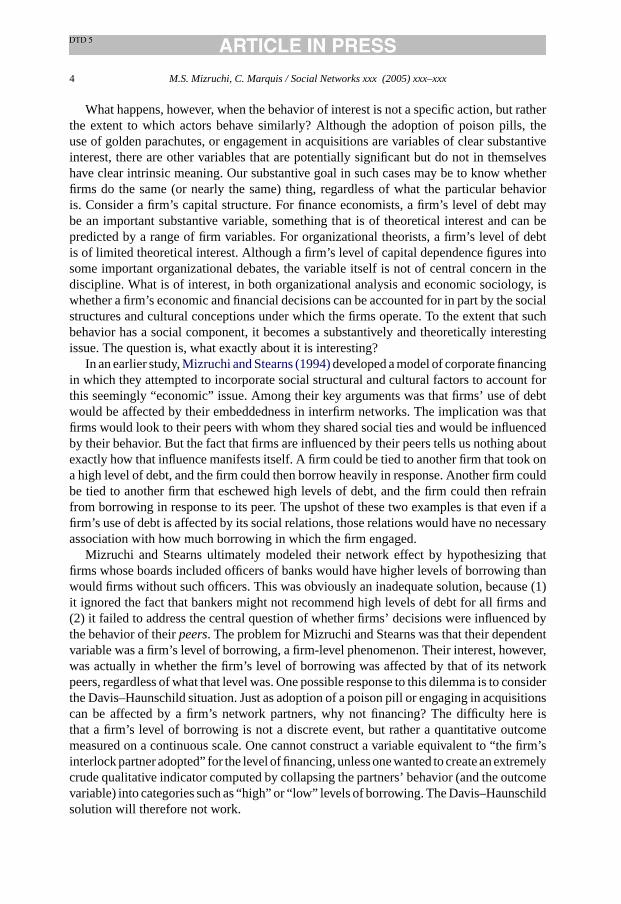
An example will illustrate this. Imagine that our dependent variable is similarity of behav-ior and our independent variable is cohesive relations. At the system-level, our hypothesismight be that the cohesion of the group will be positively associated with its degree ofsimilarity of behavior. Consider two 5-firm groups (each of which by definition has 10possible relations). Group A has 6 of 10 possible social ties for a cohesion score (thenetwork definition of density) of .6. Group B has 3 of 10 possible social ties for a scoreof .3. Assume for the purposes of discussion that each pair of firms can be either highor low on similarity of behavior. Group A has four similar behavior ties while Group Bhas two such ties. We therefore have two groups, one of which has high cohesion and ahigh level of similarity while the second has low cohesion and a low level of similarity.That would appear to support our hypothesis of a positive relation between cohesion andsimilarity.
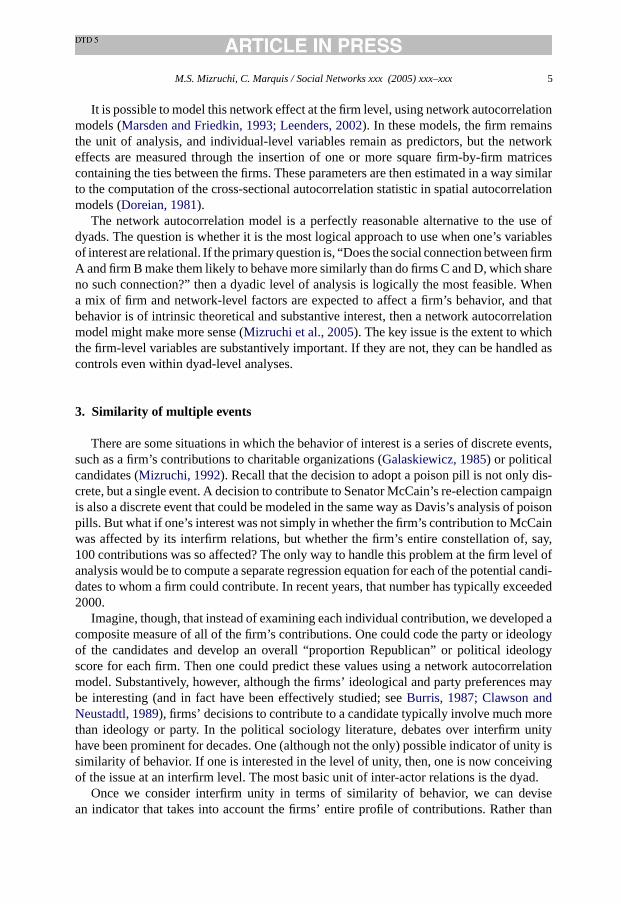
The specific placement of the cohesive and similar behavior pairs could vary widely inboth cases, however. AsFig. 1 illustrates, it is possible that the four similar behavior tiesin Group A correspond to the four non-social cohesion ties. This may be unlikely but itis theoretically possible. Meanwhile, as shown inFig. 2, it is possible that the two similar
M.S. Mizruchi, C. Marquis / Social Networks xxx (2005) xxx–xxx 7
Fig. 1. Relations between social cohesion and similarity of behavior among dyads, I.
behavior ties of Group B represent two of the three social cohesion ties. For Group A (inFig. 1), regressing similarity of behavior on cohesion among the dyads yields a correlation of−1. There is thus a perfectly negative association between a social tie and similar behavior.In Group B (Fig. 2), regressing similarity of behavior on cohesion yields a correlation of.764. There is thus a very high positive association between the two.
It can easily be shown that any number of combinations is possible in either of thetwo groups. The problem with analyzing networks at an aggregate level is that all of thisvariation is missed. If one is concerned about identifying as closely as possible the directrelation between social ties and similarity of behavior, each dyad must be investigatedindividually.
Fig. 2. Relation between social cohesion and similarity of behavior among dyads, II.
8 M.S. Mizruchi, C. Marquis / Social Networks xxx (2005) xxx–xxx
5. Dyadic versus system-level analysis: an examination
One possible criticism of the above example is that it assumes that what happens in adyad is independent of the larger context within which the dyads exist. As Simmel noted,the character of a dyadic relation may change significantly once we take into account theeffects of third and additional parties. Might dyadic effects therefore be either spuriousconsequences of larger network structures, or at least contingent on the nature of thosestructures? This is not an easy question to address without data on a large number ofnetworks. We can begin to address it by comparing the ability of dyadic and system-levelvariables to account for an outcome variable. To do this, we shall apply data from the studyof corporate political behavior (Mizruchi, 1992) described above.
5.1. Data
The data for this illustration come from a study of the political behavior of 57 largeU.S. corporations in 1980. The year 1980 was a particularly significant year in Americanpolitics because there were an unusually large number of closely contested elections, anincumbent Democratic president was replaced by a Republican, and the Senate, which hadbeen controlled by Democrats since 1955, was captured by the Republicans. In addition,corporations, which had engaged primarily in pragmatic strategies in prior years (contribut-ing mainly to incumbents regardless of their ideology), began increasingly to contributeto candidates based on ideological predilection, even if it meant challenging a previouslystrong incumbent.
The 57 corporations were selected by identifying the three largest firms whose primaryoperations were in each of 19 two-digit (broad) industries and that maintained a politi-cal action committee (PAC) in the election cycle prior to the study. Virtually all of thelargest U.S. corporations had established PACs by that point. A small number of indus-tries were represented by either more than or fewer than three firms. Details on the dataare available inMizruchi (1992), and the data themselves are available athttp://www-personal.umich.edu/∼mizruchi/.
The primary goal of the study was to examine the extent to which economic interde-pendence and social connections between firms affected their political unity, defined interms of similarity of behavior. Because the dependent variable (similarity of behavior) andthe independent variables (interdependence, common institutional stockholders, direct andindirect interlocks and several others, plus a series of controls) were relational, most of theanalyses involved dyads, for the reasons discussed in the previous section. The concernwas with questions such as whether pairs of firms that operated in heavily interdependentindustries (with high levels of sales and purchases) were more likely to engage in similarpolitical behavior than were pairs of firms in less interdependent industries. A group of 57actors has 1596 possible dyadic relations. These 1596 dyads were the units of analysis formost components of the study.
Although the study included several dependent variables, our focus for this illustrationwill be on the extent to which firms contributed to the same political candidates. This measurewas computed by the formulaSij =cij /(ci × cj)1/2, whereSij is the similarity of behavior offirmsi andj,cij is the number of candidates to whom bothi andj simultaneously contributed,
M.S. Mizruchi, C. Marquis / Social Networks xxx (2005) xxx–xxx 9
andci andcj are the total number of candidates to whom firmsi and j contributed (usedso that the similarity score was not a mere consequence of firms making a large number oftotal contributions).
For the current analysis, we shall examine only the four primary network variables.The analyses in the original study included several additional variables. The findings thatwe report here were robust across specifications that included controls that are not pre-sented here. The four network variables are market constraint (our measure of economicinterdependence), common stockholders, direct interlocks, and indirect interlocks. Marketconstraint, a concept developed byBurt (1983), is an indicator of the level of dependenceof one industry on another for either sales and/or purchases, weighted by the concentrationof the industry. Industry A will exercise a high level of market constraint over industry B tothe extent that A is either a major customer or supplier of B and A is highly concentrated(meaning that B has few alternative firms within A with which to conduct business). Becauseinput–output data are publicly available only at the industry level, Burt was forced to exam-ine constraint at the industry level. Researchers in three subsequent studies (Galaskiewiczet al., 1985; Palmer et al., 1986; Burt, 1987) developed interfirm-level adaptations of Burt’smeasure.Mizruchi (1992)constructed a composite of these three measures by extracting thefirst principal component and using the resulting factor scores. We shall use that measurehere. Common stockholders was measured by identifying the number of institutions thatsimultaneously held at least .5% of the stock of firmsi andj. Direct interlocks representedthe number of individuals who sat on the boards of directors of both firms. Indirect inter-locks were computed by taking the number of the top 50 commercial banks and insurancecompanies with which firmsi andj were simultaneously interlocked.
6. Analysis
There are three components to our analysis. In the first, we perform a simple dyadicanalysis of the effect of the four network variables on similarity of behavior. We thenconduct two system-level analyses. In the first, we identify clusters of firms for each of thefive networks (the four exogenous and one endogenous variables) and then examine, at thedyadic level, whether joint membership in particular independent variable clusters predictsjoint membership in the similarity of behavior network clusters. In the second system-levelanalysis, we examine the centrality of each firm in the five networks and then see if a firm’scentrality in particular independent variable networks predicts its centrality in the dependentvariable network.
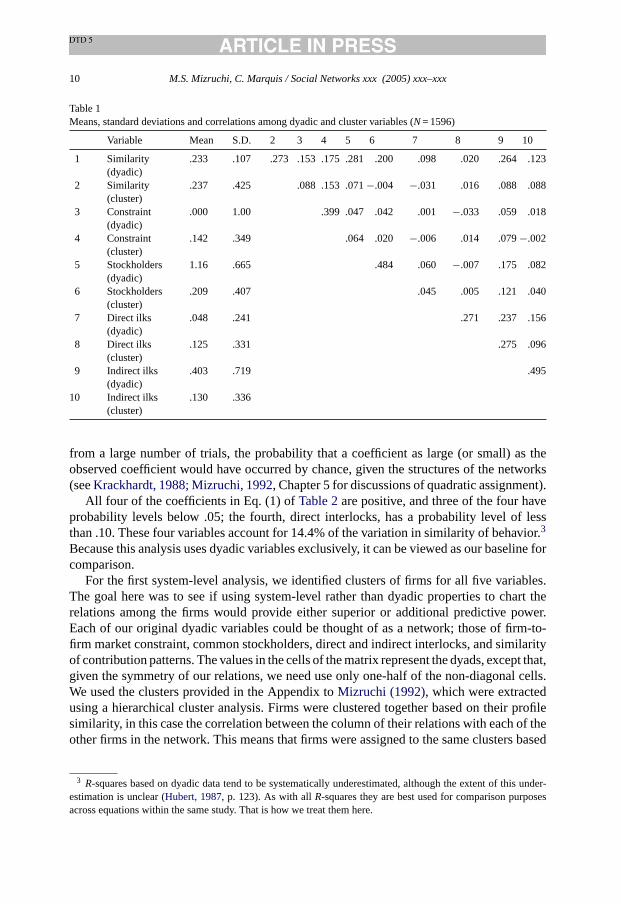
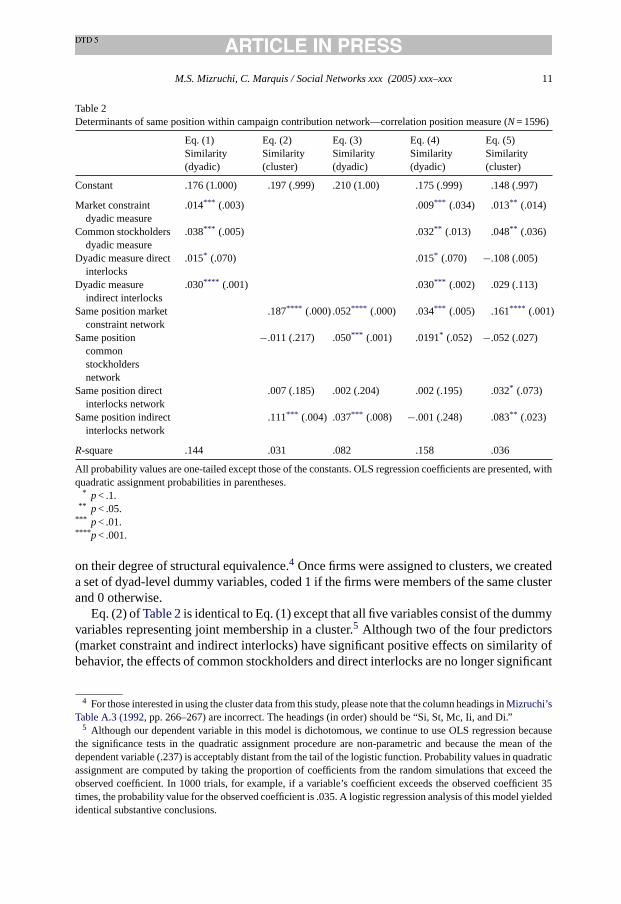
Table 1presents a correlation matrix among all of the dyadic variables in the first twoanalyses. For the purpose of our initial analysis, only the odd-numbered variables in the tableare of interest. Eq. (1) ofTable 2presents the effects of the four dyadic network variableson the similarity of political behavior. All of the effects were hypothesized to be positive.The dyads drawn from a group of actors are not statistically independent because eachindividual actor is represented multiple times. This problem can lead to an underestimationof standard errors, increasing the probability of Type I error. There are a number of ways tohandle this issue. In these analyses, we use quadratic assignment, an approach that uses OLSregression but adjusts the probability values of the individual coefficients by computing,
10 M.S. Mizruchi, C. Marquis / Social Networks xxx (2005) xxx–xxx
Table 1Means, standard deviations and correlations among dyadic and cluster variables (N= 1596)
Variable Mean S.D. 2 3 4 5 6 7 8 9 10
1 Similarity(dyadic)
.233 .107 .273 .153 .175 .281 .200 .098 .020 .264 .123
2 Similarity(cluster)
.237 .425 .088 .153 .071−.004 −.031 .016 .088 .088
3 Constraint(dyadic)
.000 1.00 .399 .047 .042 .001 −.033 .059 .018
4 Constraint(cluster)
.142 .349 .064 .020 −.006 .014 .079−.002
5 Stockholders(dyadic)
1.16 .665 .484 .060 −.007 .175 .082
6 Stockholders(cluster)
.209 .407 .045 .005 .121 .040
7 Direct ilks(dyadic)
.048 .241 .271 .237 .156
8 Direct ilks(cluster)
.125 .331 .275 .096
9 Indirect ilks(dyadic)
.403 .719 .495
10 Indirect ilks(cluster)
.130 .336
from a large number of trials, the probability that a coefficient as large (or small) as theobserved coefficient would have occurred by chance, given the structures of the networks(seeKrackhardt, 1988; Mizruchi, 1992, Chapter 5 for discussions of quadratic assignment).
All four of the coefficients in Eq. (1) ofTable 2are positive, and three of the four haveprobability levels below .05; the fourth, direct interlocks, has a probability level of lessthan .10. These four variables account for 14.4% of the variation in similarity of behavior.3
Because this analysis uses dyadic variables exclusively, it can be viewed as our baseline forcomparison.
For the first system-level analysis, we identified clusters of firms for all five variables.The goal here was to see if using system-level rather than dyadic properties to chart therelations among the firms would provide either superior or additional predictive power.Each of our original dyadic variables could be thought of as a network; those of firm-to-firm market constraint, common stockholders, direct and indirect interlocks, and similarityof contribution patterns. The values in the cells of the matrix represent the dyads, except that,given the symmetry of our relations, we need use only one-half of the non-diagonal cells.We used the clusters provided in the Appendix toMizruchi (1992), which were extractedusing a hierarchical cluster analysis. Firms were clustered together based on their profilesimilarity, in this case the correlation between the column of their relations with each of theother firms in the network. This means that firms were assigned to the same clusters based
3 R-squares based on dyadic data tend to be systematically underestimated, although the extent of this under-estimation is unclear (Hubert, 1987, p. 123). As with allR-squares they are best used for comparison purposesacross equations within the same study. That is how we treat them here.
M.S. Mizruchi, C. Marquis / Social Networks xxx (2005) xxx–xxx 11
Table 2Determinants of same position within campaign contribution network—correlation position measure (N= 1596)
Eq. (1) Eq. (2) Eq. (3) Eq. (4) Eq. (5)Similarity(dyadic)
Similarity(cluster)
Similarity(dyadic)
Similarity(dyadic)
Similarity(cluster)
Constant .176 (1.000) .197 (.999) .210 (1.00) .175 (.999) .148 (.997)
Market constraintdyadic measure
.014*** (.003) .009*** (.034) .013** (.014)
Common stockholdersdyadic measure
.038*** (.005) .032** (.013) .048** (.036)
Dyadic measure directinterlocks
.015* (.070) .015* (.070) −.108 (.005)
Dyadic measureindirect interlocks
.030**** (.001) .030*** (.002) .029 (.113)
Same position marketconstraint network
.187**** (.000) .052**** (.000) .034*** (.005) .161**** (.001)
Same positioncommonstockholdersnetwork
−.011 (.217) .050*** (.001) .0191* (.052) −.052 (.027)
Same position directinterlocks network
.007 (.185) .002 (.204) .002 (.195) .032* (.073)
Same position indirectinterlocks network
.111*** (.004) .037*** (.008) −.001 (.248) .083** (.023)
R-square .144 .031 .082 .158 .036
All probability values are one-tailed except those of the constants. OLS regression coefficients are presented, withquadratic assignment probabilities in parentheses.
* p< .1.** p< .05.
*** p< .01.**** p< .001.
on their degree of structural equivalence.4 Once firms were assigned to clusters, we createda set of dyad-level dummy variables, coded 1 if the firms were members of the same clusterand 0 otherwise.
Eq. (2) ofTable 2is identical to Eq. (1) except that all five variables consist of the dummyvariables representing joint membership in a cluster.5 Although two of the four predictors(market constraint and indirect interlocks) have significant positive effects on similarity ofbehavior, the effects of common stockholders and direct interlocks are no longer significant
4 For those interested in using the cluster data from this study, please note that the column headings inMizruchi’sTable A.3 (1992, pp. 266–267) are incorrect. The headings (in order) should be “Si, St, Mc, Ii, and Di.”
5 Although our dependent variable in this model is dichotomous, we continue to use OLS regression becausethe significance tests in the quadratic assignment procedure are non-parametric and because the mean of thedependent variable (.237) is acceptably distant from the tail of the logistic function. Probability values in quadraticassignment are computed by taking the proportion of coefficients from the random simulations that exceed theobserved coefficient. In 1000 trials, for example, if a variable’s coefficient exceeds the observed coefficient 35times, the probability value for the observed coefficient is .035. A logistic regression analysis of this model yieldedidentical substantive conclusions.
12 M.S. Mizruchi, C. Marquis / Social Networks xxx (2005) xxx–xxx
(the former even has a negative coefficient) and the modelR-square is far lower. In Eq.(3), we include the same cluster independent variables but use them to predict the dyadicsimilarity of behavior measure. Interestingly, the cluster membership independent variablesdo a better job of predicting the raw dyadic similarity of behavior measure than they dothe same similarity of behavior cluster membership. Not only do the market constraintand indirect interlock variables remain significant, but the common stockholders variablereturns to significance as well, and the modelR-square increases from .031 to .082.
In Eqs. (4) and (5) ofTable 2, we combine the dyadic and cluster-level variables into thesame models. In Eq. (4) our dependent variable is the dyadic similarity of behavior. In Eq.(5) the dependent variable is membership in the same similarity of behavior cluster. All ofthe variables from Eq. (1) remain significant in Eq. (4) if we use a .10 significance level,although the probability level of the direct interlocks effect remains above .05. In contrast,among the same cluster variables, only market constraint is significant at a level below .05,with a probability value that is actually lower than that of the dyadic constraint variable.The common stockholders variable has a probability level of slightly greater than .05. Notealso, however, that the coefficient of determination for Eq. (4) is .158. This means that theaddition of the cluster variables adds only 1.4% to the explained variance in the equationcontaining the raw dyadic variables.
One possible reason for the greater power of the raw dyadic variables in Eq. (4) is that thedependent variable is also in raw dyadic units. Perhaps were we to use membership in thesame similarity of behavior cluster as our dependent variable, the cluster variables wouldhave greater relative power. As Eq. (5) indicates, this is true, but only because the power ofthe model as a whole declines. Three of the four network variables of both the raw dyadicand the same cluster measures have probability levels below .10 in this model, and two ofthe four are below .05, but overall, the model explains only 3.6% of the variance. Clearly,the models using the raw dyadic variables perform better than those using the commoncluster variables.
One could argue that these analyses are stacked toward finding a stronger effect forthe raw dyadic variables, in that presence in the same cluster is a discrete variable that bydefinition involves collapsing a considerable amount of quantitative information into a moregeneral indicator. Because the analysis itself is dyadic, it may therefore not be surprisingthat the measures that take the full range of values into account perform better than those thatinvolve at least partially arbitrary classifications into clusters. The point is, the classificationinto clusters, defined at the system level, does not improve our understanding of the effectsof various interfirm relations on similarity of political behavior beyond that already availablefrom our raw dyadic measures.
7. Centrality
An alternative way to take system-level information into account is to examine the effectof a firm’s centrality in the larger network. The concept of structural equivalence, discussedabove, was originally designed to identify actors that play similar roles in a network. Struc-tural equivalence is highly restrictive, however, because equivalence is defined in terms ofactors’ ties to the same third parties. Yet there are situations in which actors are in similar
M.S. Mizruchi, C. Marquis / Social Networks xxx (2005) xxx–xxx 13
structural positions and/or have similar kinds of ties, but the ties are not to the same alters.As Winship (1988)noted, two fathers would be structurally equivalent only if they had thesame children. There have been a number of attempts to conceptualize and measure thisbroader form of equivalence, which has been referred to by such terms as role, regular andautomorphic equivalence.6 We shall use the term role equivalence here.
As with structural equivalence, role equivalence is a dyadic property that can only beknown by looking at the entire network of actors. Researchers have had limited successshowing empirically that role equivalent actors behave similarly. One possible reason forthis, suggested in an earlier study byMizruchi (1993), is that role equivalence may operatedifferently at different parts of a network. This can be illustrated by considering the role ofnetwork centrality. In the 1993 paper, Mizruchi found that pairs of firms that had high levelsof centrality had relatively high levels of similarity of political behavior, even controllingfor whether they had direct ties to one another. Pairs of firms with simultaneously lowlevels of centrality tended to have low similarity of behavior. From this finding, Mizruchisuggested a distinction between what he called “central” and “peripheral” role equivalence.Simultaneously high centrality, he argued, might represent a social role that could lead tosimilar behavior.
Centrality is actually an individual-level variable, associated with a particular actor. It canonly be computed by taking the entire network into account, however. Common centralitybetween actors is a dyadic variable, but one that is also based on system-level properties.In this section we examine the effect of firm centrality on similarity of political behavior,using two different approaches. In the first, we treat joint centrality as a dyadic variable andinclude it, in various ways, in a dyadic analysis. In the second, we examine the effects of afirm’s centrality in our four independent variable networks on its centrality in the similarityof behavior network.
We usedBonacich’s (1972)original eigenvector approach to computing centrality. Thismeasure is computed by the formulaCi = 1/λ�(rij ×Cj), whereCi equals the centrality ofactori, rij equals the strength of the association between actori and a given alterj (in ourcase, the strength of the association is simply the value of the particular dyadic variable),Cjequals actorj’s centrality andλ equals the eigenvalue of the first eigenvector of the matrixof associations between eachi andj.
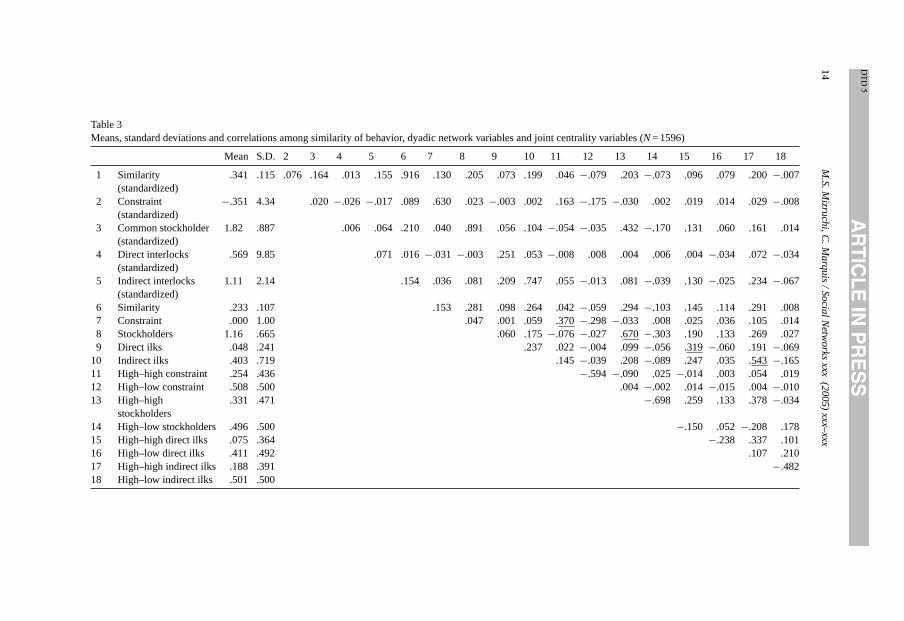
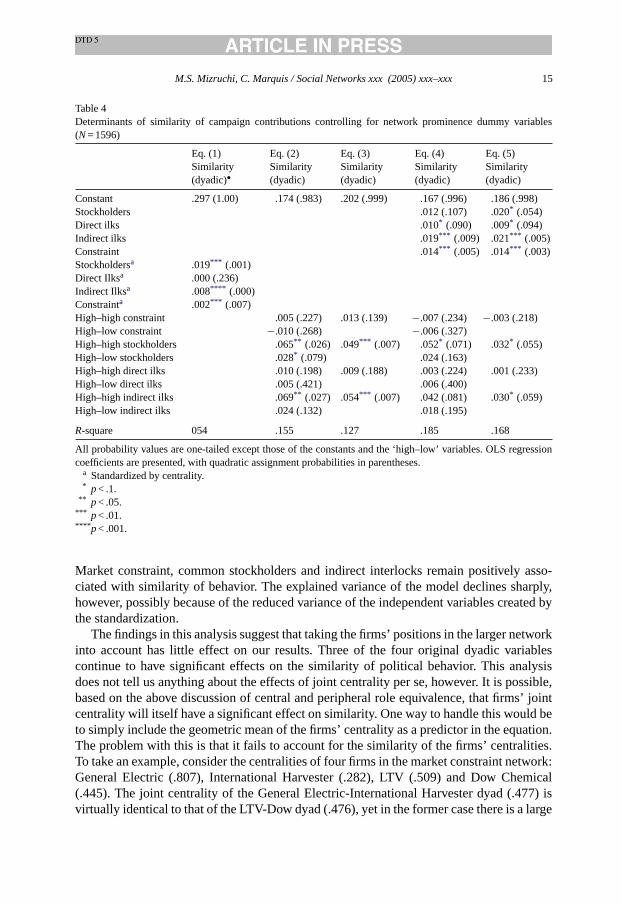
In the first examination of the effects of joint actor centrality, we took our raw dyadic mea-sures and standardized them based on the firms’ centrality. To do this, we divided the valueof each variable by the geometric mean of the two firms’ individual centralities (Ci ×Cj)1/2.We computed this value for common stockholders and direct and indirect interlocks. It wasnot necessary to adjust the value for market constraint because the constraint variable bydefinition already takes into account the actors’ joint centrality. The results of this analysisare presented in Eq. (1) ofTable 4. Descriptive statistics and correlations among the vari-ables in this analysis are presented in the first five rows and columns ofTable 3. As Eq.(1) of Table 4indicates, the effects of our four primary variables, controlling for the firms’network centrality, are very similar to those based on the raw dyadic measures, except forthe effect of direct interlocks, which does not even approach statistical significance here.
6 These different terms are distinct, both conceptually and operationally. They are all designed to identify actorsthat play similar social roles, however.
14M.S.M
izruchi,C
.Marquis/SocialNetworks
xxx(2005)xxx–
xxx
Table 3Means, standard deviations and correlations among similarity of behavior, dyadic network variables and joint centrality variables (N= 1596)
Mean S.D. 2 3 4 5 6 7 8 9 10 11 12 13 14 15 16 17 18
1 Similarity(standardized)
.341 .115 .076 .164 .013 .155 .916 .130 .205 .073 .199 .046−.079 .203−.073 .096 .079 .200−.007
2 Constraint(standardized)
−.351 4.34 .020−.026 −.017 .089 .630 .023−.003 .002 .163−.175 −.030 .002 .019 .014 .029−.008
3 Common stockholder(standardized)
1.82 .887 .006 .064 .210 .040 .891 .056 .104−.054 −.035 .432−.170 .131 .060 .161 .014
4 Direct interlocks(standardized)
.569 9.85 .071 .016−.031 −.003 .251 .053−.008 .008 .004 .006 .004−.034 .072−.034
5 Indirect interlocks(standardized)
1.11 2.14 .154 .036 .081 .209 .747 .055−.013 .081−.039 .130−.025 .234−.067
6 Similarity .233 .107 .153 .281 .098 .264 .042−.059 .294−.103 .145 .114 .291 .0087 Constraint .000 1.00 .047 .001 .059 .370−.298 −.033 .008 .025 .036 .105 .0148 Stockholders 1.16 .665 .060 .175−.076 −.027 .670−.303 .190 .133 .269 .0279 Direct ilks .048 .241 .237 .022−.004 .099−.056 .319−.060 .191−.069
10 Indirect ilks .403 .719 .145−.039 .208−.089 .247 .035 .543−.16511 High–high constraint .254 .436 −.594 −.090 .025−.014 .003 .054 .01912 High–low constraint .508 .500 .004 −.002 .014−.015 .004−.01013 High–high
stockholders.331 .471 −.698 .259 .133 .378−.034
14 High–low stockholders .496 .500 −.150 .052−.208 .17815 High–high direct ilks .075 .364 −.238 .337 .10116 High–low direct ilks .411 .492 .107 .21017 High–high indirect ilks .188 .391 −.48218 High–low indirect ilks .501 .500
M.S. Mizruchi, C. Marquis / Social Networks xxx (2005) xxx–xxx 15
Table 4Determinants of similarity of campaign contributions controlling for network prominence dummy variables(N= 1596)
Eq. (1) Eq. (2) Eq. (3) Eq. (4) Eq. (5)Similarity(dyadic)•
Similarity(dyadic)
Similarity(dyadic)
Similarity(dyadic)
Similarity(dyadic)
Constant .297 (1.00) .174 (.983) .202 (.999) .167 (.996) .186 (.998)Stockholders .012 (.107) .020* (.054)Direct ilks .010* (.090) .009* (.094)Indirect ilks .019*** (.009) .021*** (.005)Constraint .014*** (.005) .014*** (.003)Stockholdersa .019*** (.001)Direct Ilksa .000 (.236)Indirect Ilksa .008**** (.000)Constrainta .002*** (.007)High–high constraint .005 (.227) .013 (.139) −.007 (.234) −.003 (.218)High–low constraint −.010 (.268) −.006 (.327)High–high stockholders .065** (.026) .049*** (.007) .052* (.071) .032* (.055)High–low stockholders .028* (.079) .024 (.163)High–high direct ilks .010 (.198) .009 (.188) .003 (.224) .001 (.233)High–low direct ilks .005 (.421) .006 (.400)High–high indirect ilks .069** (.027) .054*** (.007) .042 (.081) .030* (.059)High–low indirect ilks .024 (.132) .018 (.195)
R-square 054 .155 .127 .185 .168
All probability values are one-tailed except those of the constants and the ‘high–low’ variables. OLS regressioncoefficients are presented, with quadratic assignment probabilities in parentheses.
a Standardized by centrality.* p< .1.
** p< .05.*** p< .01.**** p< .001.
Market constraint, common stockholders and indirect interlocks remain positively asso-ciated with similarity of behavior. The explained variance of the model declines sharply,however, possibly because of the reduced variance of the independent variables created bythe standardization.
The findings in this analysis suggest that taking the firms’ positions in the larger networkinto account has little effect on our results. Three of the four original dyadic variablescontinue to have significant effects on the similarity of political behavior. This analysisdoes not tell us anything about the effects of joint centrality per se, however. It is possible,based on the above discussion of central and peripheral role equivalence, that firms’ jointcentrality will itself have a significant effect on similarity. One way to handle this would beto simply include the geometric mean of the firms’ centrality as a predictor in the equation.The problem with this is that it fails to account for the similarity of the firms’ centralities.To take an example, consider the centralities of four firms in the market constraint network:General Electric (.807), International Harvester (.282), LTV (.509) and Dow Chemical(.445). The joint centrality of the General Electric-International Harvester dyad (.477) isvirtually identical to that of the LTV-Dow dyad (.476), yet in the former case there is a large
16 M.S. Mizruchi, C. Marquis / Social Networks xxx (2005) xxx–xxx
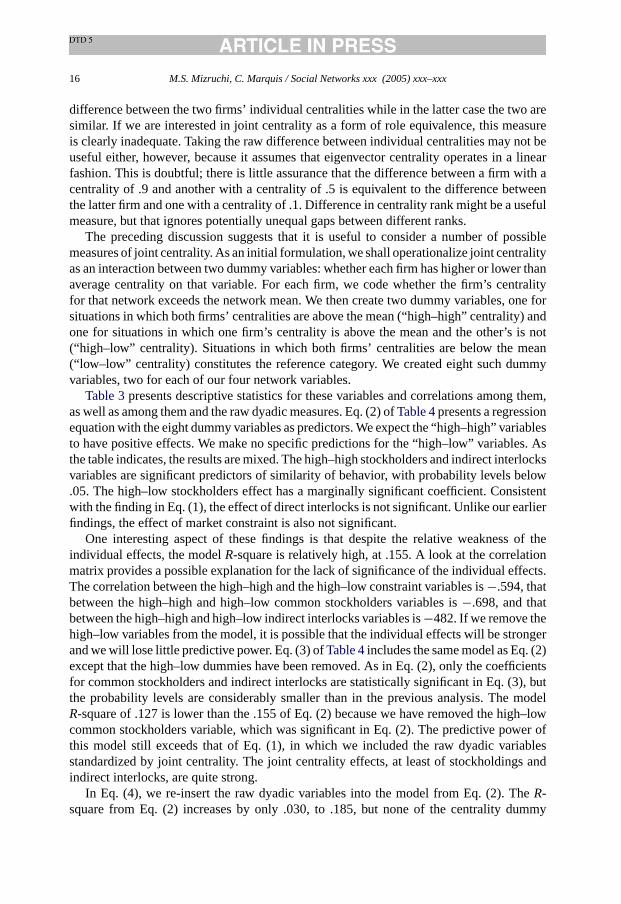
difference between the two firms’ individual centralities while in the latter case the two aresimilar. If we are interested in joint centrality as a form of role equivalence, this measureis clearly inadequate. Taking the raw difference between individual centralities may not beuseful either, however, because it assumes that eigenvector centrality operates in a linearfashion. This is doubtful; there is little assurance that the difference between a firm with acentrality of .9 and another with a centrality of .5 is equivalent to the difference betweenthe latter firm and one with a centrality of .1. Difference in centrality rank might be a usefulmeasure, but that ignores potentially unequal gaps between different ranks.
The preceding discussion suggests that it is useful to consider a number of possiblemeasures of joint centrality. As an initial formulation, we shall operationalize joint centralityas an interaction between two dummy variables: whether each firm has higher or lower thanaverage centrality on that variable. For each firm, we code whether the firm’s centralityfor that network exceeds the network mean. We then create two dummy variables, one forsituations in which both firms’ centralities are above the mean (“high–high” centrality) andone for situations in which one firm’s centrality is above the mean and the other’s is not(“high–low” centrality). Situations in which both firms’ centralities are below the mean(“low–low” centrality) constitutes the reference category. We created eight such dummyvariables, two for each of our four network variables.
Table 3presents descriptive statistics for these variables and correlations among them,as well as among them and the raw dyadic measures. Eq. (2) ofTable 4presents a regressionequation with the eight dummy variables as predictors. We expect the “high–high” variablesto have positive effects. We make no specific predictions for the “high–low” variables. Asthe table indicates, the results are mixed. The high–high stockholders and indirect interlocksvariables are significant predictors of similarity of behavior, with probability levels below.05. The high–low stockholders effect has a marginally significant coefficient. Consistentwith the finding in Eq. (1), the effect of direct interlocks is not significant. Unlike our earlierfindings, the effect of market constraint is also not significant.
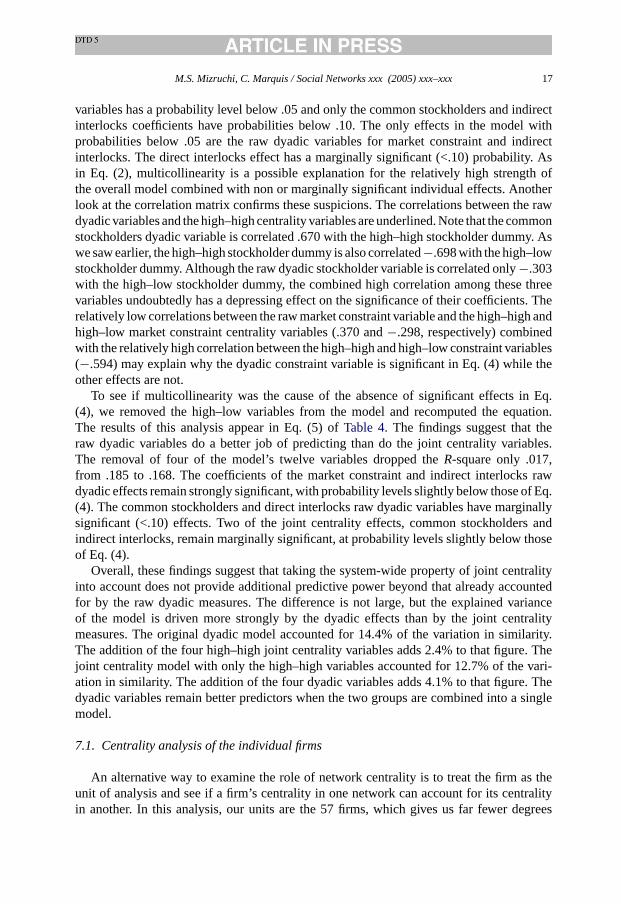
One interesting aspect of these findings is that despite the relative weakness of theindividual effects, the modelR-square is relatively high, at .155. A look at the correlationmatrix provides a possible explanation for the lack of significance of the individual effects.The correlation between the high–high and the high–low constraint variables is−.594, thatbetween the high–high and high–low common stockholders variables is−.698, and thatbetween the high–high and high–low indirect interlocks variables is−482. If we remove thehigh–low variables from the model, it is possible that the individual effects will be strongerand we will lose little predictive power. Eq. (3) ofTable 4includes the same model as Eq. (2)except that the high–low dummies have been removed. As in Eq. (2), only the coefficientsfor common stockholders and indirect interlocks are statistically significant in Eq. (3), butthe probability levels are considerably smaller than in the previous analysis. The modelR-square of .127 is lower than the .155 of Eq. (2) because we have removed the high–lowcommon stockholders variable, which was significant in Eq. (2). The predictive power ofthis model still exceeds that of Eq. (1), in which we included the raw dyadic variablesstandardized by joint centrality. The joint centrality effects, at least of stockholdings andindirect interlocks, are quite strong.
In Eq. (4), we re-insert the raw dyadic variables into the model from Eq. (2). TheR-square from Eq. (2) increases by only .030, to .185, but none of the centrality dummy
M.S. Mizruchi, C. Marquis / Social Networks xxx (2005) xxx–xxx 17
variables has a probability level below .05 and only the common stockholders and indirectinterlocks coefficients have probabilities below .10. The only effects in the model withprobabilities below .05 are the raw dyadic variables for market constraint and indirectinterlocks. The direct interlocks effect has a marginally significant (<.10) probability. Asin Eq. (2), multicollinearity is a possible explanation for the relatively high strength ofthe overall model combined with non or marginally significant individual effects. Anotherlook at the correlation matrix confirms these suspicions. The correlations between the rawdyadic variables and the high–high centrality variables are underlined. Note that the commonstockholders dyadic variable is correlated .670 with the high–high stockholder dummy. Aswe saw earlier, the high–high stockholder dummy is also correlated−.698 with the high–lowstockholder dummy. Although the raw dyadic stockholder variable is correlated only−.303with the high–low stockholder dummy, the combined high correlation among these threevariables undoubtedly has a depressing effect on the significance of their coefficients. Therelatively low correlations between the raw market constraint variable and the high–high andhigh–low market constraint centrality variables (.370 and−.298, respectively) combinedwith the relatively high correlation between the high–high and high–low constraint variables(−.594) may explain why the dyadic constraint variable is significant in Eq. (4) while theother effects are not.
To see if multicollinearity was the cause of the absence of significant effects in Eq.(4), we removed the high–low variables from the model and recomputed the equation.The results of this analysis appear in Eq. (5) ofTable 4. The findings suggest that theraw dyadic variables do a better job of predicting than do the joint centrality variables.The removal of four of the model’s twelve variables dropped theR-square only .017,from .185 to .168. The coefficients of the market constraint and indirect interlocks rawdyadic effects remain strongly significant, with probability levels slightly below those of Eq.(4). The common stockholders and direct interlocks raw dyadic variables have marginallysignificant (<.10) effects. Two of the joint centrality effects, common stockholders andindirect interlocks, remain marginally significant, at probability levels slightly below thoseof Eq. (4).
Overall, these findings suggest that taking the system-wide property of joint centralityinto account does not provide additional predictive power beyond that already accountedfor by the raw dyadic measures. The difference is not large, but the explained varianceof the model is driven more strongly by the dyadic effects than by the joint centralitymeasures. The original dyadic model accounted for 14.4% of the variation in similarity.The addition of the four high–high joint centrality variables adds 2.4% to that figure. Thejoint centrality model with only the high–high variables accounted for 12.7% of the vari-ation in similarity. The addition of the four dyadic variables adds 4.1% to that figure. Thedyadic variables remain better predictors when the two groups are combined into a singlemodel.
7.1. Centrality analysis of the individual firms
An alternative way to examine the role of network centrality is to treat the firm as theunit of analysis and see if a firm’s centrality in one network can account for its centralityin another. In this analysis, our units are the 57 firms, which gives us far fewer degrees
18 M.S. Mizruchi, C. Marquis / Social Networks xxx (2005) xxx–xxx
Table 5Means, standard deviations and correlations among firm centrality variables (N= 57)
Mean S.D. 2 3 4 5
1. Similarity .671 .181 .108 .383 .328 .4342. Constraint .495 .225 −.083 .172 .2583. Stockholders .612 .206 .249 .3234. Direct interlocks .157 .221 .5425. Indirect interlocks .308 .257
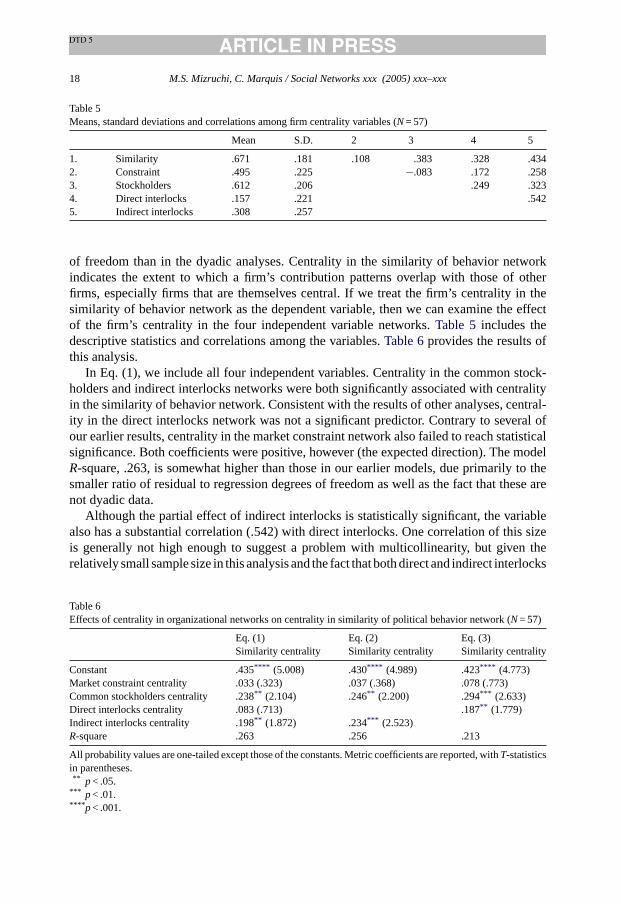
of freedom than in the dyadic analyses. Centrality in the similarity of behavior networkindicates the extent to which a firm’s contribution patterns overlap with those of otherfirms, especially firms that are themselves central. If we treat the firm’s centrality in thesimilarity of behavior network as the dependent variable, then we can examine the effectof the firm’s centrality in the four independent variable networks.Table 5includes thedescriptive statistics and correlations among the variables.Table 6provides the results ofthis analysis.
In Eq. (1), we include all four independent variables. Centrality in the common stock-holders and indirect interlocks networks were both significantly associated with centralityin the similarity of behavior network. Consistent with the results of other analyses, central-ity in the direct interlocks network was not a significant predictor. Contrary to several ofour earlier results, centrality in the market constraint network also failed to reach statisticalsignificance. Both coefficients were positive, however (the expected direction). The modelR-square, .263, is somewhat higher than those in our earlier models, due primarily to thesmaller ratio of residual to regression degrees of freedom as well as the fact that these arenot dyadic data.
Although the partial effect of indirect interlocks is statistically significant, the variablealso has a substantial correlation (.542) with direct interlocks. One correlation of this sizeis generally not high enough to suggest a problem with multicollinearity, but given therelatively small sample size in this analysis and the fact that both direct and indirect interlocks
Table 6Effects of centrality in organizational networks on centrality in similarity of political behavior network (N= 57)
Eq. (1) Eq. (2) Eq. (3)Similarity centrality Similarity centrality Similarity centrality
Constant .435**** (5.008) .430**** (4.989) .423**** (4.773)Market constraint centrality .033 (.323) .037 (.368) .078 (.773)Common stockholders centrality .238** (2.104) .246** (2.200) .294*** (2.633)Direct interlocks centrality .083 (.713) .187** (1.779)Indirect interlocks centrality .198** (1.872) .234*** (2.523)R-square .263 .256 .213
All probability values are one-tailed except those of the constants. Metric coefficients are reported, withT-statisticsin parentheses.** p< .05.
*** p< .01.**** p< .001.

M.S. Mizruchi, C. Marquis / Social Networks xxx (2005) xxx–xxx 19
had sizeable simple correlations with similarity of behavior, we decided to remove eachvariable separately and re-run the model.
Eq. (2) presents the analysis with centrality in the direct interlocks network removed. Eq.(3) presents the analysis with centrality in the indirect interlocks network removed. It is notsurprising that the indirect interlocks variable remains significant in Eq. (2). The removal ofdirect interlocks had virtually no impact on the modelR-square, however, dropping it from.263 to .256. Meanwhile, theT-statistic for the indirect interlocks variable increased from1.872 to 2.523. Interestingly, when we re-inserted the direct interlocks variable into theequation and removed indirect interlocks, the former also reached statistical significance,with aT-statistic of 1.779, compared to .713 in Eq. (1). The coefficient for direct interlocksmore than doubled, from .083 to .187. TheR-square for the model substituting direct forindirect interlocks was considerably lower, however: .213 versus .256. Most important,considering our dyadic analyses, is the fact that market constraint was not a significantpredictor in any of these equations. The model based on the raw dyadic measures of boththe dependent and independent variables provides the most consistent and strongest supportfor our hypotheses.
8. Discussion
The results of the preceding illustration suggest that when our concern is with the relationsamong actors, the dyad is the most appropriate unit of analysis. This may not always be thecase. Whether it is depends on the nature of our dependent variable. If we are studying aparticular outcome that represents a discrete event, such as the adoption of an innovation, anindividual-level analysis with a built-in variable for network effects may be more feasible.If we have a quantitative outcome variable but our predictors are primarily individual-levelvariables, then a network effect may be handled with a network autocorrelation model, inwhich case we would also operate at the individual level.
There are two conditions under which a dyadic-level analysis is clearly preferable to anindividual-level one, we believe. The first is in situations in which our dependent variableis quantitative and our predictors are relational variables. The second is in cases in whichour dependent variable is a composite of a large number of individual events. We illustratedthese points by applying data from a study of corporate political behavior. Corporate politicalaction committees tend to contribute to a large number of candidates. Had we treated eachindividual decision to contribute as a discrete event, it would have required more than 2000regression equations. Because we were concerned substantively with the extent to whichpairs of firms behaved similarly, these individual decisions, taken separately, were not ofinterest. In this situation, it was preferable to use a measure of similarity that was a compositeof a pair of firms’ entire constellation of decisions.
One criticism that has been raised against dyadic analyses is that they fail to take intoaccount system-level factors. This criticism dates back to Simmel’s discussion of the differ-ences between dyads and triads. By reducing relations to those between pairs of actors, thecriticism goes, researchers ignore the extent to which dyadic relations are affected by largersystem properties. We addressed this issue in two ways, first logically and then empirically.Logically, we showed that using one set of system-level properties to predict another such

20 M.S. Mizruchi, C. Marquis / Social Networks xxx (2005) xxx–xxx
set fails to account for whether the specific within-group relations on one set of propertiescorresponds to the specific within-group relations on the second set of properties. AsFig. 1demonstrated, it is possible to observe a high correlation between group cohesion and sim-ilarity of behavior across groups, even if the relation between the two variables at the levelof inter-actor ties is negative. Only by breaking down the relations between actors into theirindividual parts is it possible to see whether one type of tie between actors is associatedwith another type of tie.
It is also possible to examine dyadic relations while taking the structure of the largersystem into account. To illustrate this, we used data from a study of corporate politicalbehavior and constructed equations with both raw dyadic variables and variables drawnfrom system-level properties. Using similarity of political contributions as our dependentvariable, we examined the effects of four relational variables: market constraint, com-mon stockholders, direct interlocks and indirect interlocks. We then performed a seriesof modifications of these variables, all of which incorporated the firms’ positions withinthe full network. We created clusters of structurally equivalent actors and examined theextent to which joint membership in clusters of our four independent variables predictedjoint cluster membership on our dependent variable. We standardized our dyadic vari-ables to take into account the firms’ centrality in each of the five networks. We createda measure of “central role equivalence,” based on the idea that two highly central actorswill behave similarly regardless of whether they have direct ties with either one anotheror with the same third parties, and we used that to predict similarity of behavior. Andfinally, we looked at the firms themselves and examined whether their centrality in thefour independent variable networks predicted their centrality in the dependent variablenetwork.
Although many of the results using these alternative variables yielded significant predic-tors of similar political behavior, the raw dyadic measures remained the most consistentlystrong. Once we took the raw dyadic variables into account, the variables adjusted forsystem-level effects added little to our explanatory power. We acknowledge that this exam-ple may be “stacked” toward finding relatively strong dyadic effects. The study was designedwith dyads in mind, and each variable that took system-level effects into account containedlost information. The cluster variables, for example, were binary, meaning that two firmswere either in the same cluster or not. There was no provision for specifically how similarthey were. In an analysis not shown here, however, we found that even raw quantitativemeasures of structural equivalence (the basis for common cluster membership) did not pre-dict similarity of behavior as strongly as did the raw dyadic measures. This is only one case,of course, and it is possible that a different study might yield different findings. We haveshown, however, that dyadic analysis can be a powerful approach to handling relationaldata.
9. Conclusion
Although the formation of social networks has received increased attention in recentyears, the staple of network theory remains the effect of network structures on behavior.Exactly how these structures influence behavior has been the source of intense controversy

M.S. Mizruchi, C. Marquis / Social Networks xxx (2005) xxx–xxx 21
for the past two decades. Much of the debate has revolved around the mechanism by whichsocial influence occurs, in particular whether behavior spreads by direct influence (cohesion)or indirect influence/competition (structural equivalence). Although this debate is in parta disagreement about the level at which network effects occur, it has generally not beencouched in such terms. Do network effects occur primarily at the interpersonal or systemlevel, and how are they best captured? We have argued that dyadic analysis is a flexiblemeans by which researchers can examine multiple network effects at multiple levels. Theydo not involve the network per se as an independent variable; instead, they involve a relationbetween actors as both independent and dependent variables. We have argued that dyadsprovide more grounded information about network effects than do system-level data, andthat they have the flexibility to take system-level factors into account.
We are not suggesting that individual or system-level analyses are never superior todyadic-level ones. We have described situations under which dyads are preferable toindividual-level data, and vice versa. We do want to close by mentioning an additionalreason that network-level analyses will be difficult to conduct. In an early study (Mizruchi,1982), the first author examined changes in the American corporate network at seven timepoints over a 70-year period. This involved a detailed analysis of seven different networksof 167 firms each, yet the historical comparisons were made across what in effect wereseven observations. We do not want to denigrate this study, or other panel network studies.We want to point out, however, how difficult it is to operate with the network itself as theunit of analysis. It is possible to generate larger numbers of networks in studies of smallgroups, or when researchers are examining subsets of a larger network, such as local tieswithin a national interlock network (Marquis, 2003), and the use of computer simulationshas greatly increased our ability to examine the effects of structures on individual outcomes(seeMizruchi and Potts, 1998, for an example). Even these studies could benefit from amore detailed examination of the individual relations within the networks, however. Wehave no intention of discouraging researchers from conducting system-level studies. Weonly want to raise the caution that not only are the costs often prohibitive, but system-levelanalyses, by themselves, may leave certain important information unexamined.
Acknowledgements
An earlier version of this paper was presented at a symposium on “Network Structure asan Independent Variable” at the Annual Meeting of the Academy of Management, Denver,August 2002. Data collection was supported by the National Science Foundation, grantsSES-8619230 and Presidential Young Investigator Award SES-8858669. We thank JoelBaum and Woody Powell for their comments and suggestions.
References
Bonacich, P., 1972. Technique for analyzing overlapping memberships. Sociological Methodology 2, 176–185.Burris, V., 1987. The political partisanship of American business: a study of corporate political action committees.
American Sociological Review 52, 732–744.
22 M.S. Mizruchi, C. Marquis / Social Networks xxx (2005) xxx–xxx
Burt, R.S., 1983. Corporate Profits and Cooptation. Academic Press, New York.Burt, R.S., 1987. Broken ties and corporate markets. Unpublished manuscript, Department of Sociology, Columbia
University.Burt, R.S., 1992. Structural Holes. Harvard University Press, Cambridge.Clawson, D., Neustadtl, A., 1989. Interlocks, PACs, and corporate conservatism. American Journal of Sociology
94, 749–773.Davis, G.F., 1991. Agents without principles? The spread of the poison pill through the intercorporate network.
Administrative Science Quarterly 36, 583–613.Doreian, P., 1981. Estimating linear models with spatially distributed data. Sociological Methodology 11, 359–388.Galaskiewicz, J., 1985. Social Organization of an Urban Grants Economy. Academic Press, Orlando.Galaskiewicz, J., Wasserman, S., Rauschenbach, B., Bielefeld, W., Mullaney, P., 1985. The influence of corporate
power, social status, and market position on corporate interlocks in a regional network. Social Forces 64,403–431.
Gulati, R., 1995. The social structure of alliance formation patterns. Administrative Science Quarterly 40, 619–652.Gulati, R., Gargiulo, M., 1999. Where do organizational networks come from? American Journal of Sociology
104, 1439–1493.Haunschild, P.R., 1993. Interorganizational imitation: the impact of interlocks on corporate acquisition activity.
Administrative Science Quarterly 38, 564–592.Hubert, L.J., 1987. Assignment Methods in Combinatorial Data Analysis. Marcel Dekker, New York.Keister, L.A., 2001. Exchange structures in transition: lending and trade relations in Chinese business groups.
American Sociological Review 66, 336–360.Krackhardt, D., 1988. Predicting with networks: nonparametric multiple regression analysis of dyadic data. Social
Networks 10, 359–381.Leenders, R.Th.A.J., 2002. Modeling social influence through network autocorrelation: constructing the weight
matrix. Social Networks 24, 21–47.Lorrain, F., White, H.C., 1971. Structural equivalence of individuals in social networks. Journal of Mathematical
Sociology 1, 49–80.Marquis, C., 2003. The pressure of the past: network imprinting in intercorporate networks. Administrative Science
Quarterly 48, 655–689.Marsden, P.V., Friedkin, N.E., 1993. Network studies of social influence. Sociological Methods and Research 22,
127–151.Mizruchi, M.S., 1982. The American Corporate Network, 1904–1974. Sage, Beverly Hills.Mizruchi, M.S., 1992. The Structure of Corporate Political Action. Harvard University Press, Cambridge.Mizruchi, M.S., 1993. Cohesion, equivalence, and similarity of behavior: a theoretical and empirical assessment.
Social Networks 15, 275–307.Mizruchi, M.S., Potts, B.B., 1998. Centrality and power revisited: actor success in group decision making. Social
Networks 20, 353–387.Mizruchi, M.S., Stearns, L.B., 1994. A longitudinal study of borrowing by large American corporations. Admin-
istrative Science Quarterly 39, 118–140.Mizruchi, M.S., Stearns, L.B., Marquis, C., 2005. The conditional nature of embeddedness: a study of borrowing
by large U.S. firms, 1973–1994. Unpublished manuscript, Department of Sociology, University of Michigan.Palmer, D., Friedland, R., Singh, J.V., 1986. The ties that bind: organizational and class bases of stability in a
corporate interlock network. American Sociological Review 51, 781–796.Podolny, J.M., 1994. Market uncertainty and the social character of economic exchange. Administrative Science
Quarterly 39, 458–483.Sorenson, O., Stuart, T.E., 2001. Syndication networks and the spatial distribution of venture capital investment.
American Journal of Sociology 106, 1546–1588.Winship, C., 1988. Thoughts about roles and relations: an old document revisited. Social Networks 10, 209–231.