1
Effect of image downsampling on steganographic
securityJan Kodovský, Member, IEEE and Jessica Fridrich, Member, IEEE
Abstract—The accuracy of steganalysis in digital im-ages primarily depends on the statistical properties ofneighboring pixels, which are strongly affected by theimage acquisition pipeline as well as any processingapplied to the image. In this paper, we study how thedetectability of embedding changes is affected when thecover image is downsampled prior to embedding. Thistopic is important for practitioners because the vastmajority of images posted on websites, image sharingportals, or attached to e-mails are downsampled. It isalso relevant to researchers as the security of stegano-graphic algorithms is commonly evaluated on databasesof downsampled images. In the first part of this paper,we investigate empirically how the steganalysis resultsdepend on the parameters of the resizing algorithm –the choice of the interpolation kernel, the scaling factor(resize ratio), anti-aliasing, and the downsampled pixelgrid alignment. We report on several novel phenomenathat appear valid universally across the tested coversources, steganographic methods, and the steganalysisfeatures. The paper continues with a theoretical analy-sis of the simplest interpolation kernel – the box kernel.By fitting a Markov chain model to pixel rows, weanalytically compute the Fisher information rate forany mutually independent embedding operation andderive the proper scaling of the secure payload withresizing. For LSB matching and a limited range ofdownscaling, the theory fits experiments rather well,which indicates the existence of a new scaling lawexpressing the length of the secure payload when thecover size is modified by subsampling.
I. Introduction
Steganography is the art of hiding secret messages incover objects. When the object is a digital media file, themessage is typically embedded by slightly changing theindividual cover elements.1
The work on this paper was supported by the Air Force Office ofScientific Research under the research grant FA9550-12-1-0124. TheU.S. Government is authorized to reproduce and distribute reprintsfor Governmental purposes notwithstanding any copyright notationthere on. The views and conclusions contained herein are those of theauthors and should not be interpreted as necessarily representing theofficial policies, either expressed or implied of AFOSR or the U.S.Government.
Jan Kodovský is currently with Facebook, Inc. His work on thispaper has been done while he was with the Department of Electri-cal and Computer Engineering, Binghamton University, NY, USA.Email: [email protected].
Jessica Fridrich is with the Department of Electrical andComputer Engineering, Binghamton University, NY, USA. Email:[email protected].
Copyright (c) 2013 IEEE. Personal use of this material is permit-ted. However, permission to use this material for any other purposesmust be obtained from the IEEE by sending a request to [email protected].
1This embedding paradigm is known as steganography by covermodification (see, e.g., Chapter 4 in [6]).
In this paper, we deal with covers in the form of digitalimages represented in the spatial domain. The statisticaldetectability of steganographic embedding changes pri-marily depends on the strength and type of dependenciesamong neighboring pixels, which in turn depend on the im-age acquisition pipeline as well as any processing appliedto the image prior to embedding. It is, for example, wellrecognized that embedding changes are very difficult todetect in scans of analogue photographs due to the strongnoise typically present (see, e.g., the results on the NRCSdatabase in [13]). On the other hand, previous JPEGcompression (and low-pass filtering in general) removes thehigh spatial frequency components of the image content(noise), which allows for more accurate steganalysis [8],[2], [10], [17], [13], [21]. The final bit depth representationof the cover image also has a very strong effect on ste-ganalysis [7]. Even simple point-wise operations, such ascontrast/brightness adjustment and gamma correction canhave a very strong impact because of their potential to in-troduce spikes in the first-order statistic of pixel values [3],[25]. The effect of local image variance and saturationon the error of structural steganalyzers appeared in [2].Finally, the impact of the image size on steganalysis isaddressed by the Square Root Law (SRL) of imperfectsteganography [5], [15]. Note that this law pertains to thecase when the cover size is changed by removing/addingcover elements from the same distribution (which is ap-proximately valid when cropping or concatenating imageswhen creating a panorama) and does not address imageresizing, which changes the statistical properties of thecover source.
The main goal of this article is to study the effect ofdownsampling on the detectability of steganographic em-bedding changes. We consider this an important topic forseveral reasons. Full-resolution images are rarely used onthe Internet, and image downscaling is commonly adoptedby many popular high-traffic websites, including socialnetworking websites (Facebook), on-line stores (Amazon,eBay), news websites (CNN, MSNBC), etc. Most of theimage-sharing portals (Picasa Web Albums, Photobucket,Flickr) also utilize image downsampling and some of themallow downloading several different downscaled versions ofa given image.2 Email attachments and presentation slidesare yet another two examples of communication channelswhere resized images are commonly used.
Additionally, for the purpose of benchmarking steganog-
2Many portals also apply lossy JPEG compression to the resizedimages. We note that in this paper we do not study the case whenthe cover images are resized and subsequently JPEG compressed.

2
raphy and steganalysis, the steganographic communityadopted several image databases that contain resizedimages. Among the most often used databases are theBOSSbase3 and BOWS2.4 BOSSbase was originally usedfor the Break Our Steganographic System (BOSS) com-petition [1] aimed at attacking the content-adaptiveembedding scheme called HUGO (Highly UndetectablesteGO) [24]. Both BOSSbase and BOWS2 images areall downsampled (and cropped) versions of their RAWoriginals. As will be shown in this paper, the outcomeof steganalysis can vary quite dramatically based on thedownscaling algorithm and its parameters. Understandingthese implications is important since practitioners oftentake the steganalysis results obtained on these databasesas an absolute measure of security of a steganographicalgorithm.
In summary, given the proliferation of imagery sub-jected to downscaling, it is rather surprising that, to thebest knowledge of the authors, the effect of resizing onsteganographic security has not yet been methodologicallyaddressed. The only prior art the authors are aware ofis the early conference version of this paper published atIEEE ICASSP in 2013 [18]. Here is the summary of themain differences between [18] and this paper:
1) This manuscript includes experiments on three dif-ferent camera sources while in [18], only a singlesource was used. Furthermore, all images used inthis manuscript are publicly available in their RAWformat to facilitate reproducibility.
2) Instead of steganalysis features constructed using asingle kernel originally proposed in [14], state-of-the-art rich features [9] and SPAM features [23] are usedhere.
3) Besides LSB matching used in [18], we added astate-of-the-art content-adaptive steganographic al-gorithm WOW [12].
4) We include a much more comprehensive study of theeffects of anti-aliasing and kernel-shifting.
We start the next section with a motivational experi-ment showing strikingly different results of steganalysisof HUGO [24] depending on the choice of the resizingkernel used to downsample the original full-resolutionimages forming the BOSSbase. In Section III, we formallyintroduce the process of image downsampling and describeits parameters. We also introduce the common core of allsubsequent experiments in this paper. The first part of themain results of this paper appears in Section IV, wherewe empirically study the effect of the interpolation kernel,downsampling factor, anti-aliasing, and the downsampledgrid alignment on statistical detectability. We point outsome interesting phenomena that appear to hold univer-sally across the tested sources, steganography methods,and steganalysis features. In Section V, we provide atheoretical analysis of the impact of downsampling usingthe nearest neighbor resizing algorithm by adopting a
3http://exile.felk.cvut.cz/boss4http://bows2.ec-lille.fr
Markov chain model for the cover source. For this type ofthe cover source and the resizing algorithm, there existsa closed-form expression for the steganographic Fisherinformation rate for any mutually independent embeddingoperation, which allows us to determine the size of thesecure payload that leads to the same level of statisticaldetectability. The paper is concluded in Section VI.
II. Illustrative experiment on BOSSbase
The BOSSbase image database (version 1.01) consistsof 10,000 grayscale images of size 512 × 512 pixels ob-tained from full-resolution RAW images (coming fromseven different cameras) by executing the following four-step procedure:
1) Image demosaicking (Color Filter Array interpola-tion);
2) Conversion to 8-bit grayscale;3) Downsampling so that the smaller side is 512 pixels;4) Central-cropping to 512 × 512 pixels.
Image demosaicking was performed using UFRaw,5 whilethe remaining steps were carried out using the ImageMag-ick’s convert command-line tool with all parameters keptat their default values. The actual script for creatingBOSSbase images is available at the BOSS organizers’website [1].
In order to motivate our study, we modified the scriptand prepared four different versions of BOSSbase. Every-thing else being equal, the four databases differed onlyin the choice of the interpolation kernel in the convert’simage resizing algorithm: box, Lanczos [11] (default), tri-angle, and cubic.6 Figure 1 (right) shows the four interpo-lation kernels.
Figure 1 (left) depicts the results of steganalyzingHUGO implemented with σ = γ = 1 and the thresh-old T = 255 on all four databases. For every payload,a steganalysis detector was constructed by training theensemble classifier [19] when representing the images usingthe 12,753-dimensional spatial rich model SRMQ1 (calledQ1 in [9]). Half of the images were used for training and theother half for testing, while the performance was measuredin terms of the minimal total detection error under equalpriors,
PE = minPFA
(PFA + PMD)/2, (1)
where PFA and PMD are the false-alarm and missed-detection rates achieved on the testing set. By P E wedenote the testing error averaged over ten random splitsof the database into two halves.
The differences between the error rates achieved ondifferent versions of BOSSbase are rather striking. Forexample, at the relative payload 0.2 bpp (bits per pixel),the detection error dropped from 0.27 with the default
5http://ufraw.sourceforge.net/6This was achieved by modifying a single line in the original
resizing script.

3
0 0.1 0.2 0.3 0.40
0.10
0.20
0.30
0.40
0.50
Relative payload (bpp)
TestingerrorP
E
Box
Lanczos
Triangle
Cubic
−3 −2 −1 0 1 2 3
0
0.5
1 Box
Lanczos
Triangle
Cubic
Figure 1. Steganalysis of HUGO on BOSSbase 1.01 images created with four different interpolation kernels implemented in ImageMagick’scommand-line tool convert. Left: Mean testing error P E; Right: Individual kernel functions.
Lanczos kernel to an almost perfect detectability (error0.02) with bicubic interpolation.
In summary, the choice of the interpolation parameterssignificantly affects the steganographic security, and thusa deeper understanding of this phenomenon is of a greatimportance for steganalysis. In particular, the outcomeof the BOSS competition and HUGO’s security wouldbe viewed in a very different light had the organizersinadvertently chosen a different interpolation algorithmfor resizing. This experiment also points out the danger ofinterpreting the detection errors obtained on BOSSbase asan absolute measure of algorithm’s security.
III. Notation, preliminaries, and experimental
setup
In this section, we formalize the process of image down-sampling and introduce the experimental setup for allsubsequent experiments.
A. Image acquisition
A digital image X captured by an imaging sensor is aquantized sampled portion of the natural scene, which canbe represented as a two-dimensional real function f : R2 →R (the “reality”). Formally,
X(x, y) = Q (CΘ(x, y) · f(x, y)) , (2)
where Q denotes a scalar quantizer with a finite set ofcentroids I and CΘ(x, y) is a discrete sampling function
CΘ(x, y) =
M−1∑
k=0
N−1∑
l=0
δ(x − x0 − k∆)δ(y − y0 − l∆) (3)
parametrized by the vector Θ = (x0, y0, ∆, M, N); δ(x) isdefined as
δ(x) =
{
1 if x = 0,
0 otherwise.(4)
Equation (2) allows us to represent X as a matrix X ∈IM×N , whose elements correspond to the natural scene fat M ×N equally-spaced locations arranged in a rectangle
that is uniquely defined by the parameter vector Θ. Theset of quantizer centroids, I, depends on the bit depth atwhich X is represented. For example, for 8-bit grayscaleimages, I = {0, 1, . . . , 255}.
B. Image resizing
The output of an image resizing algorithm,parametrized by the downsampling factor7 k, is commonlydefined as
X(k)(x, y) = Q
(
CΘ(k) (x, y) · f̂(x, y))
, (5)
where
Θ(k) = (x(k)0 , y
(k)0 , ∆/k, ⌊M/k⌋ , ⌊N/k⌋) (6)
denotes the parameter vector of the resized image and
f̂(x, y) = (X ∗ ϕ)(x, y) (7)
is an approximation of reality obtained as a convolutionof the original image X with an interpolation kernel ϕ :R
2 → R. The kernel function ϕ needs to satisfyˆ
R2
ϕ(x, y)dxdy = 1. (8)
In general, the starting point of the grid of the resizedimage (x
(k)0 , y
(k)0 ) can be different from the starting point
of the original image (x0, y0), i.e., the first pixel of theresized image X
(k) does not have to coincide with the firstpixel of the original image X. In fact, many downsamplingalgorithms define the point (x
(k)0 , y
(k)0 ) as
x(k)0 = y
(k)0 = (k + 1)/2, (9)
which corresponds to centering the sampling points of X(k)
within the grid of the original image X. In Section IV-C,we will show that the position of the point (x
(k)0 , y
(k)0 ) plays
an important role in steganalysis.For simplicity, in the rest of the paper we assume that
M = N , x(k)0 = y
(k)0 for all k, and ϕ(x, y) = ϕ(x)ϕ(y). The
variable k will exclusively denote the resizing factor.
7Downsampling factor k corresponds to the image of relative size1/k w.r.t. the original image size, e.g., k = 2 denotes downsamplingby 50%.

4
Table IList of individual camera models in BOSSbase 1.01 sorted by
their native resolution.
Camera model # Full resolution Mpix
Leica M9 2,758 3472 × 5216 18.1Canon EOS 7D 1,354 5202 × 3465 18.0
Pentax K20D 1,398 3124 × 4688 14.6Canon EOS Rebel XSi 2,042 2856 × 4290 12.3
Canon EOS 400D 1,354 2602 × 3906 10.2Canon EOS 40D 61 2602 × 3908 10.2
Nikon D70 1,033 2014 × 3039 6.1
C. Controlled image database
BOSSbase is a collection of images coming from sevendifferent cameras with different original resolutions, rang-ing from 6 to 18 megapixels (see Table I). Therefore, whendownsampling to 512×512 pixels, individual cameras wereresized with different resizing factors. For instance, LeicaM9 was downsampled with k = 6.78, Pentax K20D withk = 6.10, and Canon EOS 400D with k = 5.08. Sincedifferent scaling factors introduce qualitatively differentdependencies among pixels, in order to isolate the subtleeffects of interpolation, we need to study individual cameramodels separately.
In the rest of the paper, we consider only the follow-ing three camera models: Leica M9 (LEI), Pentax K20D(PEN), and Canon EOS 400D (CAN). These three models(highlighted in Table I) were selected as examples ofcameras coming from different camera manufacturers andare equipped with three different sensors.
From every camera model considered, we randomly se-lected 1, 000 raw images, demosaicked them using UFRaw(with the setup used during the BOSS competition), andconverted to 8-bit grayscale. The resulting databases ofnever compressed (and not resized) images are the motherdatabases for all our subsequent experiments.8
D. Image downsampling in Matlab
The command-line utility convert is not transparentand its image resizing algorithm seems to incorporateseveral image-enhancing techniques (for example post-sharpening). Therefore, from now on we will solely usethe Matlab’s function imresize, as it follows the image-resizing procedure outlined in Section III-B exactly. Fur-thermore, it is easy to supply the function imresize
with custom interpolation kernels, which will prove to beadvantageous later in Section IV.
We consider the following built-in kernel functions ofimresize:
8Fixing the image-processing pipeline, including the demosaickingalgorithm, allowed us to isolate the effects of image downsamplingand its parameters.
−3 −2 −1 0 1 2 3
0
0.5
1 Lanczos (convert)
Cubic (convert)
Cubic (imresize)
Figure 2. Cubic interpolation kernel as implemented in ImageMag-ick’s convert and Matlab’s imresize.
ϕb(x) =
{
1 if − 12 ≤ x < 1
2
0 otherwise(10)
ϕt(x) =
{
1 − |x| if |x| ≤ 1
0 otherwise(11)
ϕc(x) =
32 |x|3 − 5
2 |x|2 + 1 if |x| ≤ 1
− 12 |x|3 + 5
2 |x|2 − 4|x| + 2 if 1 < |x| ≤ 2
0 otherwise
(12)
which correspond to the nearest neighbor (box), bilinear(triangle), and bicubic (cubic [16]) interpolation, respec-tively. While the box and triangle kernels, ϕb and ϕt, areidentical to the ones in convert, the bicubic interpolationis implemented differently. In Figure 2, we compare thecubic kernels of both software tools. We can see thatthe Matlab’s implementation of the bicubic interpolationbears more similarity to the convert’s Lanczos kernelrather than its cubic counterpart. This observation willlater explain the qualitatively different results of bicubicinterpolation than the ones observed in Section II (Fig-ure 1 left). It is also the reason why we omit the Matlab’sLanczos built-in kernels from our experiments.
E. Steganography and steganalysis
In the rest of the paper we attack the following twosteganographic algorithms: LSB Matching (LSBM) andWOW [12]. The LSBM stego images were created bychanging a pseudo-randomly and uniformly selected rel-ative portion β of pixels (the change rate) by eitherincreasing or decreasing their values by 1, equiprobably.For creating WOW stego images, we used the WOWembedding simulator.9 Note that while LSBM spreadsembedding changes uniformly over the image, WOW is acontent-adaptive scheme whose changes are concentratedin noisy and textured areas. Therefore, these two choicescover two qualitatively different embedding paradigms.
9http://dde.binghamton.edu/download/

5
1 1.2 1.4 1.6 1.8 2 2.2 2.4 2.60
0.1
0.2
0.3
0.4
0.5
Resizing factor k
TestingerrorP
E
SPAM (686)
SRMQ1 (12,753)
ϕb - box kernel
LSBM
1 1.2 1.4 1.6 1.8 2 2.2 2.4 2.60
0.1
0.2
0.3
0.4
0.5
Resizing factor k
TestingerrorP
E
SPAM (686)
SRMQ1 (12,753)
ϕt - triangle kernel
LSBM
1 1.2 1.4 1.6 1.8 2 2.2 2.4 2.60
0.1
0.2
0.3
0.4
0.5
Resizing factor k
TestingerrorP
E
SPAM (686)
SRMQ1 (12,753)
ϕc - cubic kernel
LSBM
Figure 3. Steganalysis of LSBM with the change rate fixed at β = 0.05 in images from three cameras resized by three different interpolationkernels defined by formulas (10)–(12). Feature sets: SPAM (black), SRMQ1 (gray). The three different curves represent individual cameras(LEI, PEN, CAN).
Detection is executed using two different featurespaces: the 686-dimensional SPAM [23] and the 12, 753-dimensional rich feature space SRMQ1 [9]. While theSRMQ1 represents state-of-the-art steganalysis, includingthe low-dimensional SPAM feature set brings a qualita-tively different detector. For both feature-space represen-tations, we always train the ensemble classifier [19] andevaluate the performance in the same way as described inSection II – half of the images are used for training and theother half for testing, and the performance is measured interms of P E, the minimal total detection error defined byEquation 1 averaged over 10 different database splits.
In order to compare the steganographic security atdifferent scaling factors, we always central-crop the result-ing resized image X
(k) (the output of the interpolationformula (5)) to the 512 × 512 pixel region. This way, thestatistical properties of pixels are preserved and the effectof the SRL on security is eliminated.
IV. Experimental results
In this section, we present a series of steganalysis experi-ments showing the effects of several different interpolationparameters on the steganographic security. In particular,we address the influence of the interpolation kernel, thedownsampling factor k, anti-aliasing, and the spatial align-ment of the resized grid of pixels. As will be shown, eachof these factors can significantly affect the outcome ofsteganalysis.
A. Interpolation kernel
We start our investigation by fixing the change rate βof LSBM embedding and monitoring the change in theaverage testing error P E with increasing downsamplingfactor k. The experiment was repeated for all three cameramodels (LEI, PEN, CAN), both feature spaces (SPAM,SRMQ1), and the three interpolation kernels defined byformulas (10)–(12). This can be achieved, for example,by calling the Matlab’s function imresize with kernels’box’, ’triangle’, and ’cubic’, and turning the anti-aliasingoff (the effect of anti-aliasing is studied in Section IV-B).The observed error rates are shown in Figure 3; the error
1
1.5
.75.25 .25
.75 .75.25 .25
.75
ϕt (k = 1.5)
original image
resized image
1
2
.5 .5 .5 .5 .5 .5
ϕt (k = 2)
original image
resized image
Figure 4. Explaining the sudden drops in P E: Downsampling withthe triangle kernel ϕt and two different choices of k. Anti-aliasingturned off. See details in the text.
bars correspond to the standard deviation of PE over tendifferent database splits.
Generally, the testing error grows with increasing k.This is to be expected since the interpolation kernels havea fixed width while the spatial distance between the neigh-boring pixels of the resized image increases. Consequently,the strength of the dependencies among pixels decreases,which makes steganalysis more difficult.
There are differences among individual kernels, however.For the box kernel, the error monotonously increases asmore and more pixels of the original image are being“skipped” during the process of downsampling – the boxkernel with the anti-aliasing turned off is equivalent to thenearest-neighbor interpolation. This breaks after k > 2when none of the pairs of neighbors from the originalimage are preserved any more and at least one pixel fromthe original grid is always skipped. While the rich featurespace performs consistently better, both feature spacesexhibit qualitatively similar behavior.
The situation becomes more interesting (and less trivial)for the other two kernels whose width is greater than oneand thus the pixel values in the resized image are interpo-lated as certain linear combinations of the original pixelvalues. While the testing error P E generally still increaseswith growing k, its progress is not always monotonous. Inparticular, there are several noticeable sharp drops in theerror rate for certain values of k. These sudden drops are

6
1 1.2 1.4 1.6 1.8 2 2.2 2.4 2.60
0.1
0.2
0.3
0.4
0.5
Resizing factor k
TestingerrorP
E
SPAM (686)
SRMQ1 (12,753)
ϕb - box kernel
WOW
1 1.2 1.4 1.6 1.8 2 2.2 2.4 2.60
0.1
0.2
0.3
0.4
0.5
Resizing factor k
TestingerrorP
E
SPAM (686)
SRMQ1 (12,753)
ϕt - triangle kernel
WOW
1 1.2 1.4 1.6 1.8 2 2.2 2.4 2.60
0.1
0.2
0.3
0.4
0.5
Resizing factor k
TestingerrorP
E
SPAM (686)
SRMQ1 (12,753)
ϕc - cubic kernel
WOW
Figure 5. Steganalysis of WOW at a fixed payload of 0.3 bpp (bits per pixel) in images from three cameras resized by three differentinterpolation kernels defined by formulas (10)–(12). Feature sets: SPAM (black), SRMQ1 (gray). The three different curves representindividual cameras (LEI, PEN, CAN).
caused by a temporary synchronization of both pixel grids,which substantially strengthens pixel dependencies in theresized image.
Consider, for example, the case of downsampling withthe triangle kernel and k = 1.5 (downsizing by 33%) wherethe testing error suddenly drops by 15% for the SPAMfeatures and by 10% for the SRMQ1 features (see Figure 3middle). This downsampling scenario is illustrated in fulldetail in the top diagram of Figure 4. As can be seen, fork = 1.5 the pixel positions in the resized image always fallbetween two neighboring pixels from the original grid inthe way that the split ratio is 1:3. Consequently, all pixelsof the resized image are formed as the same convex com-bination (i.e., [1/4, 3/4]) of two neighboring pixels from theoriginal image. In other words, the interpolation formulastays the same across the whole image. This would notbe true any more if the value of k was slightly increased(or decreased), in which case the coefficients of the linearcombination change across the image. Consequently, anystatistical features formed as sample joint probabilitiesof neighboring pixels (or their residuals) are essentiallyaggregates of a wide range of weaker statistics extractedfrom differently filtered image regions, which makes themless powerful for steganalysis.
A similar situation occurs for k = 2 shown in thebottom diagram of Figure 4. Now, the distance betweentwo pixels of the resized image is 2 and they are alwayscentered between two pixels from the original grid, whichessentially amounts to pixel averaging.10 As with k = 1.5,both grids of pixels are synchronized and the interpolationformula thus stays the same across the image, makingthe subsequently extracted features more sensitive tosteganography.
Note that if the pixel grid of the resized image wasslightly shifted, i.e., the position of the first resized pixel(x
(k)0 , y
(k)0 ) was determined differently than through the
formula (9), both diagrams in Figure 4 could have lookedquite differently and the overall steganalysis results could
10This can be seen as a simple denoising operator that increaseslocal correlations among pixels and thus makes steganalysis moreaccurate.
have differed as well. We will inspect this in more detailin Section IV-C.
Before we proceed to the next section, we would liketo make a few more comments. First, as can be seenin Figure 3 (right), the cubic kernel exhibits even moresudden drops in the testing error P E for certain (rational)values of k when the grids exhibit a certain level of syn-chronization. This is likely because of the larger support ofthe cubic kernel which not only causes more pixel values tobe combined together but it also creates a larger overlapbetween neighboring kernels and thus offers more spacefor synchronization.
Second, compared to the nearest neighbor interpolation(the box kernel), the difference between the performance ofthe SPAM features and the rich SRMQ1 features in case ofthe triangle and the cubic kernel seems to be larger. This ismore pronounced for smaller values of k when the neigh-boring interpolation functions overlap and thus a singlepixel from the original image can affect multiple pixels ofthe resized image (compare both diagrams in Figure 4 – fork = 1.5, one half of the original pixels contributes to tworesized pixels). This creates complex dependencies amongthe pixels of the resized image that can be better exploitedby the “richer” feature space SRMQ1 rather than theSPAM feature space. Another supporting evidence for thisargument is the initial strong drop of error when k isonly slightly larger than one, see Figure 3 (middle andright). This sudden misalignment of the pixel grids at bothresolution levels causes some (if not all) pixels from theoriginal image to start immediately contributing to morethan one pixel of the resized image. While the SRMQ1 canutilize this strengthened dependence among pixels quitewell, there is no drop of error for the SPAM features.
Finally, note that for larger values of k, the differencesamong all three considered kernels diminish and the errorrates seem to saturate at similar values. This is likelybecause of the low-gradient portions of images (e.g., thesky) where pixel dependencies remain almost unaffectedby downsampling. Furthermore, at the odd resolutionlevels k = 3, 5, 7, . . . and, trivially at k = 1, the pixellocations of the resized image always coincide with certain

7
1 1.2 1.4 1.6 1.8 2 2.2 2.4 2.60
0.1
0.2
0.3
0.4
0.5
Resizing factor k
TestingerrorP
E
anti-aliasing OFF
anti-aliasing ON
ϕb - box kernel
LSBM
1 1.2 1.4 1.6 1.8 2 2.2 2.4 2.60
0.1
0.2
0.3
0.4
0.5
Resizing factor k
TestingerrorP
E
anti-aliasing OFF
anti-aliasing ON
ϕt - triangle kernel
LSBM
1 1.2 1.4 1.6 1.8 2 2.2 2.4 2.60
0.1
0.2
0.3
0.4
0.5
Resizing factor k
TestingerrorP
E
anti-aliasing OFF
anti-aliasing ON
ϕc - cubic kernel
LSBM
1 1.2 1.4 1.6 1.8 2 2.2 2.4 2.60
0.1
0.2
0.3
0.4
0.5
Resizing factor k
TestingerrorP
E
anti-aliasing OFF
anti-aliasing ON
ϕb - box kernel
WOW
1 1.2 1.4 1.6 1.8 2 2.2 2.4 2.60
0.1
0.2
0.3
0.4
0.5
Resizing factor k
TestingerrorP
E
anti-aliasing OFF
anti-aliasing ON
ϕt - triangle kernel
WOW
1 1.2 1.4 1.6 1.8 2 2.2 2.4 2.60
0.1
0.2
0.3
0.4
0.5
Resizing factor k
TestingerrorP
E
anti-aliasing OFF
anti-aliasing ON
ϕc - cubic kernel
WOW
Figure 6. Steganalysis of LSBM (top) and WOW (bottom) using SRMQ1 features in images resized by factor k with anti-aliasing turnedoff (gray) versus on (black). The three different curves represent individual cameras (LEI, PEN, CAN).
pixels from the original grid. Since all three kernels arezero at integer values, this perfect alignment makes all thedownsampled images identical.
The goal of the thorough discussion and interpretationof the results in this section was to bring more insightinto the inner workings of image downsampling and itseffects on steganalysis. To make the picture more com-plete, we repeated the same steganalysis experiment withthe content-adaptive algorithm WOW. These results areshown in Figure 5. Even though WOW is based on afundamentally different embedding paradigm, the progressof its error rates is qualitatively consistent with the non-adaptive LSB matching (compare to Figure 3).
B. Anti-aliasing
Anti-aliasing is a common image pre-processing tech-nique whose goal is to suppress higher spatial frequenciesin the image prior to resizing in order to eliminate disturb-ing visual artifacts around edges (for example Moiré pat-terns). In Matlab (and in other image processing tools aswell), anti-aliasing is executed at the same time as resizing,simply by widening the interpolation kernel. Formally, thekernel function ϕ(x) at resolution k is modified as follows
ϕ(x) →1
kϕ
(x
k
)
. (13)
The larger the value of the resizing factor k is, the widerthe support of the kernel becomes. Since this makes theresized image smoother, one can expect the steganalysisto be easier, compared to the situation with the anti-aliasing is turned off (all previous experiments). Note that
it is far from obvious whether the overall effect of imagedownsampling will favor steganography or steganalysis –whether the smoothing effects will overcome the weakerdependencies due to content downsampling.
In Figure 6, we compare the results of steganalysis forthe cases when the anti-aliasing is turned off and on. Weperformed the experiment for both the LSBM (changerate β = 0.05) and WOW (payload α = 0.3 bpp), forthe three considered kernels, and all three camera sources.This time, we opted only for the state-of-the-art steganal-ysis using SRMQ1 features rather than covering bothfeature spaces. Note that for a fixed kernel, the testingerror P E behaves consistently across both steganographicalgorithms and all three cameras.
When the anti-aliasing is turned on, the width of thebox kernel at the downscaling factor k is equal to k, whichmeans that now all pixels from the original image arealways utilized during interpolation. For small values of k,however, the situation is not much different from the casewhen the kernel width was fixed to one (anti-aliasing wasturned off) because the majority of the resized pixels havethe value equal to their nearest neighbor. But as the valueof k increases, more and more resized pixels are created asan average of their neighbors and the obtained errors forboth scenarios start to differ. For k > 2, all resized pixelsare formed as averages of the neighboring pixels, whichmakes the downsized image smoother and consequentlyeasier to steganalyze.
The situation is quite different for the other two kernelswhere the difference between both scenarios (anti-aliasingon/off) is much more profound. We attribute the stronger

8
TestingerrorP
E
0 0.2 0.4 0.6 0.8 1
0.15
0.20
0.25
ϕt - triangle kernel (k = 1.5)
LSBM
0 0.2 0.4 0.6 0.8 1
0.15
0.20
0.25
Shifting parameter ∆
WOW
TestingerrorP
E
0 0.2 0.4 0.6 0.8 1
0.30
0.35
0.40
ϕt - triangle kernel (k = 2)
LSBM
0 0.2 0.4 0.6 0.8 1
0.30
0.35
0.40
Shifting parameter ∆
WOW
TestingerrorP
E
0 0.2 0.4 0.6 0.8 10.10
0.15
0.20
ϕc - cubic kernel (k = 1.4)
LSBM
0 0.2 0.4 0.6 0.8 10.15
0.20
0.25
0.30
Shifting parameter ∆
WOW
Figure 8. Steganalysis of LSBM at change rate β = 0.05 (top) and WOW at payload α = 0.3 bpp (bottom) in resized images as a function ofthe grid-shifting parameter ∆. Anti-aliasing was turned off. Used feature space: SRMQ1. The three different curves represent the individualcameras (LEI, PEN, CAN).
1
2
.375 .375.125 .125
ϕt (k = 2)
original image
resized image
Figure 7. Effect of turning the anti-aliasing on with the trianglekernel ϕt and k = 2. Note the wider kernel width in comparisonwhen the anti-aliasing is off (Fig. 4).
effect of anti-aliasing to the fact that both triangle andcubic kernel have their original support larger than one,hence with the increasing value of k the kernels getproportionally wider and their mutual overlap (not presentfor the box kernel) increases. We demonstrate this for thespecific choice of the triangle kernel ϕt and k = 2 inFigure 7. As can be seen, not only is each resized pixela combination of four neighboring pixels from the originalresolution, but every pixel from the original image nowaffects two neighboring downsampled pixels – compare tothe bottom diagram in Figure 4 where the same situationis depicted with the anti-aliasing turned off. Therefore, itshould not be surprising that anti-aliasing affects widerinterpolation kernels stronger.
Note that despite the strong smoothing effects of bothkernels, downsampling still favors steganography evenwhen the anti-aliasing is turned on, i.e., steganalysis getsmore difficult as the value of k increases (apart fromthe initial drop of performance due to sudden desyn-chronization discussed in the previous section). In otherwords, for the considered range of k, the loss of interpixeldependencies due to resolution content is still strongerthan the gain due to the smoothing effects. This conclusionholds for both steganographic methods and across all threetested camera sources.
C. Downsampled grid position (alignment)
For most interpolation algorithms, the position of thegrid of the downsampled image is centered within the gridof the original image, which is achieved by setting the val-ues of (x
(k)0 , y
(k)0 ) according to Equation (9). As discussed
in Section IV-A, this makes both grids at certain rational
values of k synchronized, which strengthens the statisticalvalue of extracted features and consequently aids steganal-ysis. However, some implementations of downsamplingmay position the downsized grid differently, for exampleby aligning the first pixels of both grids. As will becomeapparent in this section, this initial grid alignment mayalso have a strong effect on steganalysis.
The effect of the grid alignment depends on numerousfactors, such as the downsampling factor k, the interpo-lation kernel, and likely even the in-camera processing,which prevent us from providing a truly comprehensivepicture in this paper. Instead, we opted for demonstratingthe effect of grid alignment on selected cases to givethe reader an idea of the extent to which steganalysisperformance can vary in practice.
We start by introducing a kernel shift parameter 0 ≤∆ < 1 into (9):
x(k)0 = y
(k)0 = (k + 1)/2 + ∆, (14)
Setting ∆ = 0 trivially leads to the original formula (9)while ∆ = 1 corresponds to the grid shifted by one pixelwith respect to the original grid.
We start our investigation by steganalyzing LSBM andWOW in images resized by the triangle kernel ϕt atk = 1.5. Recall that this setup corresponds to a sharp dropin the testing error due to sudden synchronization of bothgrids when ∆ = 0, see Figure 3 (middle). Everything elsebeing equal, we repeated this experiment with differentchoices of the shift ∆. The resulting error rates, againfor all three camera sources, are shown in Figure 8 (left).Similarly as in the previous section, we restricted ourselvesto the state-of-the-art rich features rather than coveringboth feature spaces.
First, note the two “lobes” symmetrical along ∆ = 0.25and ∆ = 0.75. This is due to the fact that the shifts ∆and ∆′ = 0.5 − ∆ result in the same convex combinationsduring the interpolation, which is caused by the factthat the distance between two neighboring pixels afterdownsizing is 1.5, see Figure 4 (top).
As ∆ > 0 increases, the images at both resolutionsbecome desynchronized which weakens steganalysis perfor-mance and causes the detection error to increase. For the
9
mid-range shifts 0.1 . ∆ . 0.3 (full desynchronization),the testing errors P E are back at the values as if there wasno drop in Figure 3.
In the second experiment, we fix k = 2. The results areshown in Figure 8 (middle). Since the distance betweentwo resized pixels is now 2, the symmetry is only along∆ = 0.5, and the shifts ∆ and ∆′ = 1 − ∆ yield thesame interpolation formulas. A quick glance at Figure 4(bottom) reveals that for k = 2 changing the shift ∆does not affect the “degree of synchronization” betweenthe two grids but rather changes the values of linearcoefficients during interpolation (the weighted average) –it determines the weight of “odd pixels” and “even pixels”from the original image. For ∆ = 0.5, the triangle kernelsare perfectly centered at even pixels of the original imageand thus the downsampled image is just a sub-sampledversion of the original image (and identical to the onewe would obtain with the box kernel). Since every otherpixel is skipped, the pixels of the downsampled image areless correlated, and we see higher error rates. For ∆ = 0,on the other hand, the kernels are positioned exactly inbetween of the pixels from the original grid and thusthe downsampled pixels are averages of the correspondingneighboring pixels, which strengthens dependencies andhelps steganalysis.
Finally, in addition to the previous two experiments, inFigure 8 (right) we show the results of steganalysis withthe cubic kernel and the resizing factor fixed at k = 1.4.In this case, the interference between both grids oscillateswith a higher frequency than in the previous two scenariosresulting in a periodic progress of the testing error as afunction of the kernel shift ∆, with peaks correspondingto desynchronized grids and valleys to the (to the certaindegree) synchronized grids. Similarly to the previous twocases, all three camera models exhibit qualitatively similarbehavior, even though the actual error rates among themcan differ by 10% or more.11 The observed trends seem tobe robust w.r.t. the choice of the steganographic method.
V. Secure payload scaling w.r.t. image
resolution
A. Image model
In this section we study the effects of image resizingon steganalysis analytically. To this end, we need toselect a cover model that considers dependencies amongneighboring pixels. One of the simplest models is the first-order Markov chain (MC). A substantial advantage of thismodel is that there exists a closed-form expression betweenthe cover MC and the stego hidden MC for any mutually-independent embedding operation [4], which will allow usto compute the scaling of secure payload that leads toconstant statistical detectability across the downsamplingfactor. The disadvantage of this cover model is that we
11This should not be surprising as the three sources of images differin their original resolution and in-camera processing.
0.2 0.3 0.4 0.5 0.6 0.7
0.45
0.5
0.55
Parameter τ
Param
eter
γ
PentaxLeica
Canon
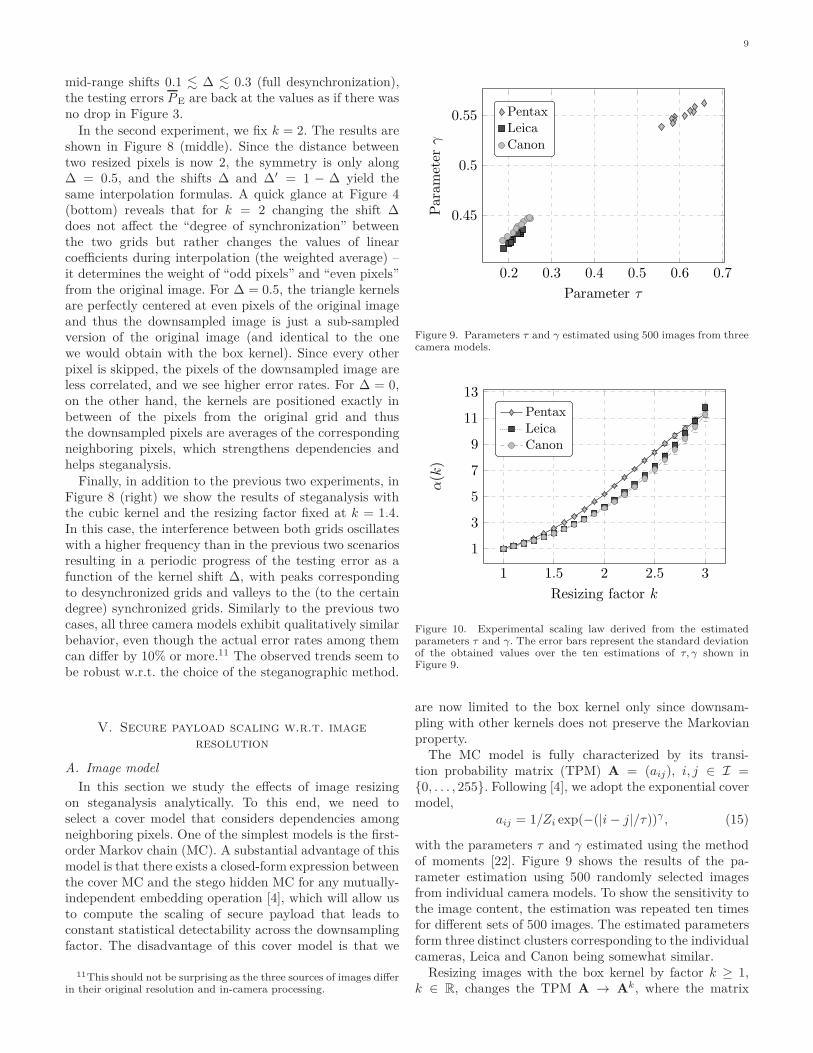
Figure 9. Parameters τ and γ estimated using 500 images from threecamera models.
1 1.5 2 2.5 3
1
3
5
7
9
11
13
Resizing factor k
α(k)
Pentax
LeicaCanon
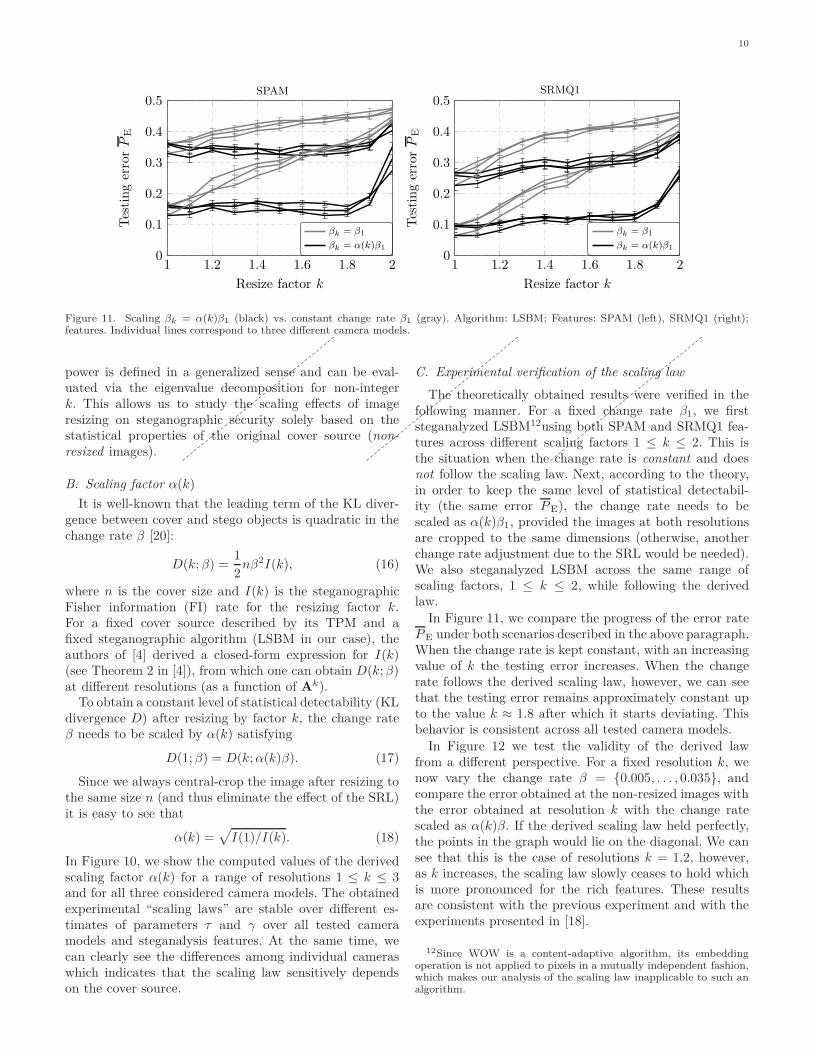
Figure 10. Experimental scaling law derived from the estimatedparameters τ and γ. The error bars represent the standard deviationof the obtained values over the ten estimations of τ, γ shown inFigure 9.
are now limited to the box kernel only since downsam-pling with other kernels does not preserve the Markovianproperty.
The MC model is fully characterized by its transi-tion probability matrix (TPM) A = (aij), i, j ∈ I ={0, . . . , 255}. Following [4], we adopt the exponential covermodel,
aij = 1/Zi exp(−(|i − j|/τ))γ , (15)
with the parameters τ and γ estimated using the methodof moments [22]. Figure 9 shows the results of the pa-rameter estimation using 500 randomly selected imagesfrom individual camera models. To show the sensitivity tothe image content, the estimation was repeated ten timesfor different sets of 500 images. The estimated parametersform three distinct clusters corresponding to the individualcameras, Leica and Canon being somewhat similar.
Resizing images with the box kernel by factor k ≥ 1,k ∈ R, changes the TPM A → A
k, where the matrix
10
1 1.2 1.4 1.6 1.8 20
0.1
0.2
0.3
0.4
0.5
Resize factor k
TestingerrorP
E
βk = β1
βk = α(k)β1
SPAM
1 1.2 1.4 1.6 1.8 20
0.1
0.2
0.3
0.4
0.5
Resize factor k
TestingerrorP
E
βk = β1
βk = α(k)β1
SRMQ1
Figure 11. Scaling βk = α(k)β1 (black) vs. constant change rate β1 (gray). Algorithm: LSBM; Features: SPAM (left), SRMQ1 (right);features. Individual lines correspond to three different camera models.
power is defined in a generalized sense and can be eval-uated via the eigenvalue decomposition for non-integerk. This allows us to study the scaling effects of imageresizing on steganographic security solely based on thestatistical properties of the original cover source (non-resized images).
B. Scaling factor α(k)
It is well-known that the leading term of the KL diver-gence between cover and stego objects is quadratic in thechange rate β [20]:
D(k; β) =1
2nβ2I(k), (16)
where n is the cover size and I(k) is the steganographicFisher information (FI) rate for the resizing factor k.For a fixed cover source described by its TPM and afixed steganographic algorithm (LSBM in our case), theauthors of [4] derived a closed-form expression for I(k)(see Theorem 2 in [4]), from which one can obtain D(k; β)at different resolutions (as a function of A
k).To obtain a constant level of statistical detectability (KL
divergence D) after resizing by factor k, the change rateβ needs to be scaled by α(k) satisfying
D(1; β) = D(k; α(k)β). (17)
Since we always central-crop the image after resizing tothe same size n (and thus eliminate the effect of the SRL)it is easy to see that
α(k) =√
I(1)/I(k). (18)
In Figure 10, we show the computed values of the derivedscaling factor α(k) for a range of resolutions 1 ≤ k ≤ 3and for all three considered camera models. The obtainedexperimental “scaling laws” are stable over different es-timates of parameters τ and γ over all tested cameramodels and steganalysis features. At the same time, wecan clearly see the differences among individual cameraswhich indicates that the scaling law sensitively dependson the cover source.
C. Experimental verification of the scaling law
The theoretically obtained results were verified in thefollowing manner. For a fixed change rate β1, we firststeganalyzed LSBM12using both SPAM and SRMQ1 fea-tures across different scaling factors 1 ≤ k ≤ 2. This isthe situation when the change rate is constant and doesnot follow the scaling law. Next, according to the theory,in order to keep the same level of statistical detectabil-ity (the same error P E), the change rate needs to bescaled as α(k)β1, provided the images at both resolutionsare cropped to the same dimensions (otherwise, anotherchange rate adjustment due to the SRL would be needed).We also steganalyzed LSBM across the same range ofscaling factors, 1 ≤ k ≤ 2, while following the derivedlaw.
In Figure 11, we compare the progress of the error rateP E under both scenarios described in the above paragraph.When the change rate is kept constant, with an increasingvalue of k the testing error increases. When the changerate follows the derived scaling law, however, we can seethat the testing error remains approximately constant upto the value k ≈ 1.8 after which it starts deviating. Thisbehavior is consistent across all tested camera models.
In Figure 12 we test the validity of the derived lawfrom a different perspective. For a fixed resolution k, wenow vary the change rate β = {0.005, . . . , 0.035}, andcompare the error obtained at the non-resized images withthe error obtained at resolution k with the change ratescaled as α(k)β. If the derived scaling law held perfectly,the points in the graph would lie on the diagonal. We cansee that this is the case of resolutions k = 1.2, however,as k increases, the scaling law slowly ceases to hold whichis more pronounced for the rich features. These resultsare consistent with the previous experiment and with theexperiments presented in [18].
12Since WOW is a content-adaptive algorithm, its embeddingoperation is not applied to pixels in a mutually independent fashion,which makes our analysis of the scaling law inapplicable to such analgorithm.

11
0 0.1 0.2 0.3 0.4 0.50
0.1
0.2
0.3
0.4
0.5
PE (k = 1)
PE(k)
SPAMSRMQ1
smaller
changerates
k = 1.2
0 0.1 0.2 0.3 0.4 0.50
0.1
0.2
0.3
0.4
0.5
PE (k = 1)
SPAMSRMQ1
smaller
changerates
k = 1.5
0 0.1 0.2 0.3 0.4 0.50
0.1
0.2
0.3
0.4
0.5
PE (k = 1)
SPAMSRMQ1
smaller
changerates
k = 1.9
Figure 12. Predicted vs. measured error rate for three different resizing factors and two steganalysis feature spaces. The individual pointscome from three different camera models and a range of different change rates.
Despite the simplicity of the cover model (15) and thefact that we use a machine-learning based detector, a goodmatch between theory and practice is observed for smallervalues of k. The formula (18) does not seem to provide thecorrect scaling for larger k, especially when k & 1.8. Thisis likely due to the limited extent the Markov chain modeldescribes natural images. Moreover, we remind that thescaling was derived under the assumption of small changerates, which becomes violated for large values of k.
VI. Conclusions
Today, downscaled images are ubiquitous. They appear,for example, on image-sharing portals, social network-ing websites, in e-mail attachments, at news websites,and in on-line stores. It is thus natural to assume thatsuch images will be used for steganography in practice.Since downsampling changes the strength and characterof dependencies among adjacent image pixels, it alsoaffects steganalysis. The lower image resolution decreasesthe strength of pixel dependencies due to more rapidchanges in the image content. Depending on the imagedownsampling algorithm, on the other hand, the strengthof pixel dependencies may increase due to interpolation(averaging). Consequently, it is generally rather difficultto predict whether steganalysis will be easier or moredifficult in images created by a particular resizing al-gorithm and with a particular choice of its parameters.The main contribution of this paper is explaining howand why empirical steganographic security varies with thedownsizing algorithm and its settings.
We study the effect of the downsampling factor, theinterpolation kernel, anti-aliasing, and the position of theresampled grid on the empirical steganographic security.The universality of our conclusions is supported withexperiments on three different camera sources, two qual-itatively different steganographic algorithms, LSBM andWOW, and two different steganalyzers built using SPAMand the state-of-the-art spatial rich model (SRM).
We also describe a new form of a scaling law, whichexpresses how one should scale the payload with respect to
image resolution to keep a constant statistical detectabil-ity. Note that while downsampling changes the number ofpixels, it also changes their statistical properties, and thusthe scaling of the secure payload w.r.t. downsampling isnot covered by the square root law of imperfect steganog-raphy. To derive the proper scaling law analytically, weadopted the first-order Markov chain for image pixels andmade an assumption that the embedding is realized using amutually independent operation. This restricted our studyto algorithms that are not content-adaptive (LSBM) andthe box kernel, which is the only kernel that preservesthe Markovian property of the cover source under resizing.The general validity of the results (for small values of theresize factor k) is supported with experiments on threedifferent sources and two steganalysis features (SPAM andSRM).
The work in this paper is of interest to both practi-tioners and researchers. Practitioners need to be informedof the potential strong effect image downscaling mayhave on the security of their secretly embedded messages.Researchers need to be aware of this effect in order tosupply all necessary details pertaining to preparing theirimage databases for tests. Last but not least, the detectionaccuracy on BOSSbase (or other databases containingresized images) should not be perceived as an absolutemeasure of a steganographic algorithm’s security.
References
[1] P. Bas, T. Filler, and T. Pevný. Break our steganographicsystem – the ins and outs of organizing BOSS. In T. Filler,T. Pevný, A. Ker, and S. Craver, editors, Information Hiding,13th International Workshop, volume 6958 of Lecture Notes inComputer Science, pages 59–70, Prague, Czech Republic, May18–20, 2011.
[2] R. Böhme. Weighted stego-image steganalysis for JPEG covers.In K. Solanki, K. Sullivan, and U. Madhow, editors, InformationHiding, 10th International Workshop, volume 5284 of LectureNotes in Computer Science, pages 178–194, Santa Barbara, CA,June 19–21, 2007. Springer-Verlag, New York.
[3] G. Cancelli, G. Doërr, I. J. Cox, and M. Barni. A comparativestudy of ±1 steganalyzers. In Proceedings IEEE InternationalWorkshop on Multimedia Signal Processing, pages 791–796,Cairns, Australia, October 8–10, 2008.

12
[4] T. Filler and J. Fridrich. Fisher information determines ca-pacity of ǫ-secure steganography. In S. Katzenbeisser and A.-R. Sadeghi, editors, Information Hiding, 11th InternationalWorkshop, volume 5806 of Lecture Notes in Computer Science,pages 31–47, Darmstadt, Germany, June 7–10, 2009. Springer-Verlag, New York.
[5] T. Filler, A. D. Ker, and J. Fridrich. The Square Root Law ofsteganographic capacity for Markov covers. In N. D. Memon,E. J. Delp, P. W. Wong, and J. Dittmann, editors, ProceedingsSPIE, Electronic Imaging, Media Forensics and Security, vol-ume 7254, pages 08 1–11, San Jose, CA, January 18–21, 2009.
[6] J. Fridrich. Steganography in Digital Media: Principles, Algo-rithms, and Applications. Cambridge University Press, 2009.
[7] J. Fridrich. Effect of cover quantization on steganographicFisher information. IEEE Transactions on Information Foren-sics and Security, 8(2):361–373, February 2013.
[8] J. Fridrich, M. Goljan, and R. Du. Steganalysis based on JPEGcompatibility. In A. G. Tescher, editor, Special Session onTheoretical and Practical Issues in Digital Watermarking andData Hiding, SPIE Multimedia Systems and Applications IV,volume 4518, pages 275–280, Denver, CO, August 20–24, 2001.
[9] J. Fridrich and J. Kodovský. Rich models for steganalysis ofdigital images. IEEE Transactions on Information Forensicsand Security, 7(3):868–882, June 2012.
[10] J. Fridrich and J. Kodovský. Steganalysis of LSB replacementusing parity-aware features. In M. Kirchner and D. Ghosal,editors, Information Hiding, 14th International Workshop, vol-ume 7692 of Lecture Notes in Computer Science, pages 31–45,Berkeley, CA, May 15–18, 2012.
[11] A. S. Glasser. Graphics Gems. Morgan Kaufman, 1990.[12] V. Holub and J. Fridrich. Designing steganographic distortion
using directional filters. In Fourth IEEE International Work-shop on Information Forensics and Security, Tenerife, Spain,December 2–5, 2012.
[13] V. Holub and J. Fridrich. Optimizing pixel predictors for ste-ganalysis. In A. Alattar, N. D. Memon, and E. J. Delp, editors,Proceedings SPIE, Electronic Imaging, Media Watermarking,Security, and Forensics 2012, volume 8303, pages 09 1–13, SanFrancisco, CA, January 22–26, 2012.
[14] A. D. Ker and R. Böhme. Revisiting weighted stego-imagesteganalysis. In E. J. Delp, P. W. Wong, J. Dittmann, andN. D. Memon, editors, Proceedings SPIE, Electronic Imaging,Security, Forensics, Steganography, and Watermarking of Mul-timedia Contents X, volume 6819, pages 5 1–5 17, San Jose, CA,January 27–31, 2008.
[15] A. D. Ker, T. Pevný, J. Kodovský, and J. Fridrich. TheSquare Root Law of steganographic capacity. In A. D. Ker,J. Dittmann, and J. Fridrich, editors, Proceedings of the 10thACM Multimedia & Security Workshop, pages 107–116, Oxford,UK, September 22–23, 2008.
[16] R. G. Keys. Cubic convolution interpolation for digital imageprocessing. IEEE Transactions on Acoustics, Speech, and SignalProcessing, ASSP-29(6):1153–1160, December 1981.
[17] J. Kodovský and J. Fridrich. JPEG-compatibility steganalysisusing block-histogram of recompression artifacts. In M. Kirch-ner and D. Ghosal, editors, Information Hiding, 14th Interna-tional Workshop, volume 7692 of Lecture Notes in ComputerScience, pages 78–93, Berkeley, CA, May 15–18, 2012.
[18] J. Kodovský and J. Fridrich. Steganalysis in resized images.In Proceedings IEEE, International Conference on Acoustics,Speech, and Signal Processing, Vancouver, Canada, May 26–31,2013.
[19] J. Kodovský, J. Fridrich, and V. Holub. Ensemble classifiers forsteganalysis of digital media. IEEE Transactions on Informa-tion Forensics and Security, 7(2):432–444, April 2012.
[20] S. Kullback. Information theory and statistics. John Wiley andSons., New York, 1959.
[21] W. Luo, Y. Wang, and J. Huang. Security analysis on spatial±1 steganography for JPEG decompressed images. IEEE SignalProcessing Letters, 18(1):39–42, 2011.
[22] S. Meignen and H. Meignen. On the modeling of small sampledistributions with generalized gaussian density in a maximumlikelihood framework. IEEE Transactions on Image Processing,15(6):1647–1652, 2006.
[23] T. Pevný, P. Bas, and J. Fridrich. Steganalysis by subtractivepixel adjacency matrix. IEEE Transactions on InformationForensics and Security, 5(2):215–224, June 2010.
[24] T. Pevný, T. Filler, and P. Bas. Using high-dimensional im-age models to perform highly undetectable steganography. InR. Böhme and R. Safavi-Naini, editors, Information Hiding,12th International Workshop, volume 6387 of Lecture Notes inComputer Science, pages 161–177, Calgary, Canada, June 28–30, 2010. Springer-Verlag, New York.
[25] M. C. Stamm. Digital Multimedia Forensics and Anti-Forensics.PhD thesis, Dept. of Electrical and Computer Engineering,University of Maryland, College Park, MD, 2012.
Jessica Fridrich holds the position of Pro-fessor of Electrical and Computer Engineeringat Binghamton University (SUNY). She hasreceived her PhD in Systems Science fromBinghamton University in 1995 and MS inApplied Mathematics from Czech TechnicalUniversity in Prague in 1987. Her main inter-ests are in steganography, steganalysis, digitalwatermarking, and digital image forensic. Dr.Fridrich’s research work has been generouslysupported by the US Air Force and AFOSR.
Since 1995, she received 19 research grants totaling over $9 mil forprojects on data embedding and steganalysis that lead to more than160 papers and 7 US patents. Dr. Fridrich is a member of IEEE andACM.
Jan Kodovský holds the position of Soft-ware Engineer at Facebook, Inc. He receivedhis Ph.D. degree in Electrical Engineeringfrom Binghamton University in 2012 and M.S.degree in Mathematical Modeling from theCzech Technical University in Prague in 2006.His professional interests include steganalysis,steganography, and applied machine learning.The work performed by Jan Kodovský on thispaper has been done while he was a Postdoc-toral Associate at Binghamton University.
![Steganographic Watermarking for Documents - CNC · Steganographic Watermarking for Documents Benjamín Barán, Santiago Gómez and Víctor Bogarín Email: [bbaran, vbogarin]@cnc.una.py](https://static.cupdf.com/doc/110x72/5b48ed9b7f8b9aa4148dcad3/steganographic-watermarking-for-documents-steganographic-watermarking-for.jpg)