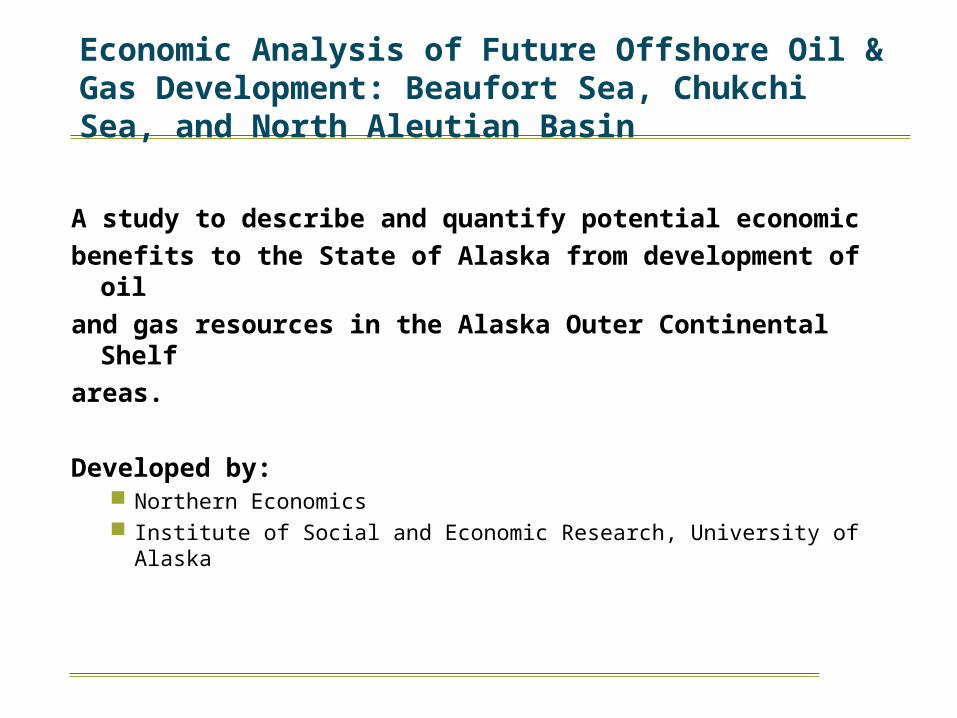
Economic Analysis of Future Offshore Oil & Gas Development: Beaufort Sea, Chukchi Sea, and North Aleutian Basin
A study to describe and quantify potential economic
benefits to the State of Alaska from development of oil
and gas resources in the Alaska Outer Continental Shelf
areas.
Developed by: Northern Economics Institute of Social and Economic Research, University of Alaska
Trans-AlaskaTrans-AlaskaPipelinePipeline
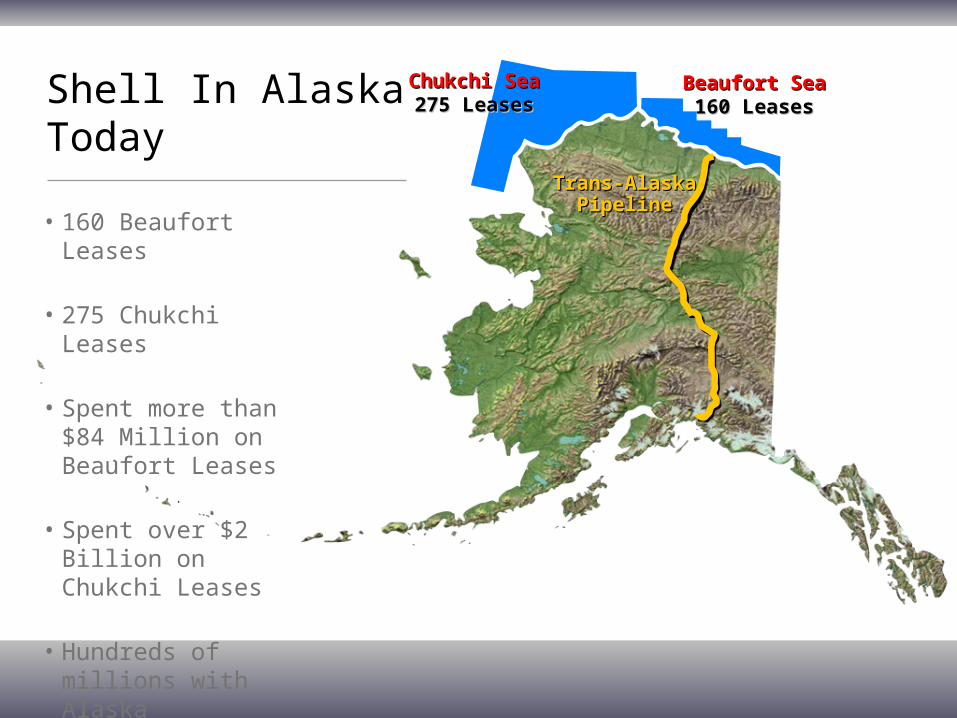
Shell In Alaska Today
• 160 Beaufort Leases
• 275 Chukchi Leases
• Spent more than $84 Million on Beaufort Leases
• Spent over $2 Billion on Chukchi Leases
• Hundreds of millions with Alaska contractors
Beaufort SeaBeaufort Sea160 Leases160 Leases
Chukchi SeaChukchi Sea275 Leases275 Leases
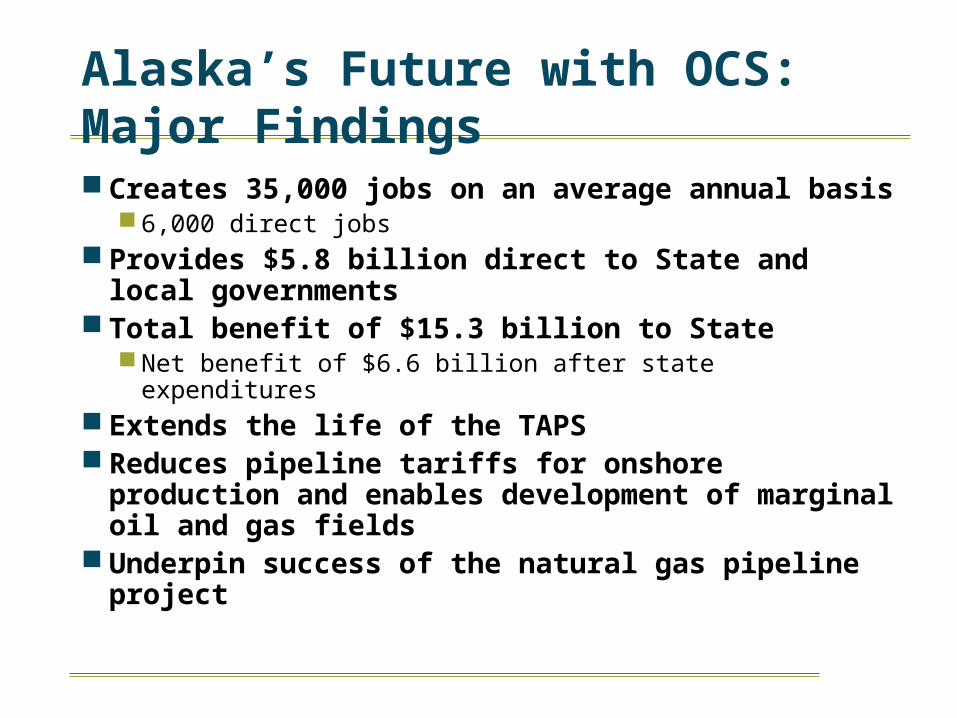
Alaska’s Future with OCS: Major Findings
Creates 35,000 jobs on an average annual basis 6,000 direct jobs
Provides $5.8 billion direct to State and local governments
Total benefit of $15.3 billion to State Net benefit of $6.6 billion after state expenditures
Extends the life of the TAPS Reduces pipeline tariffs for onshore production and
enables development of marginal oil and gas fields Underpin success of the natural gas pipeline project
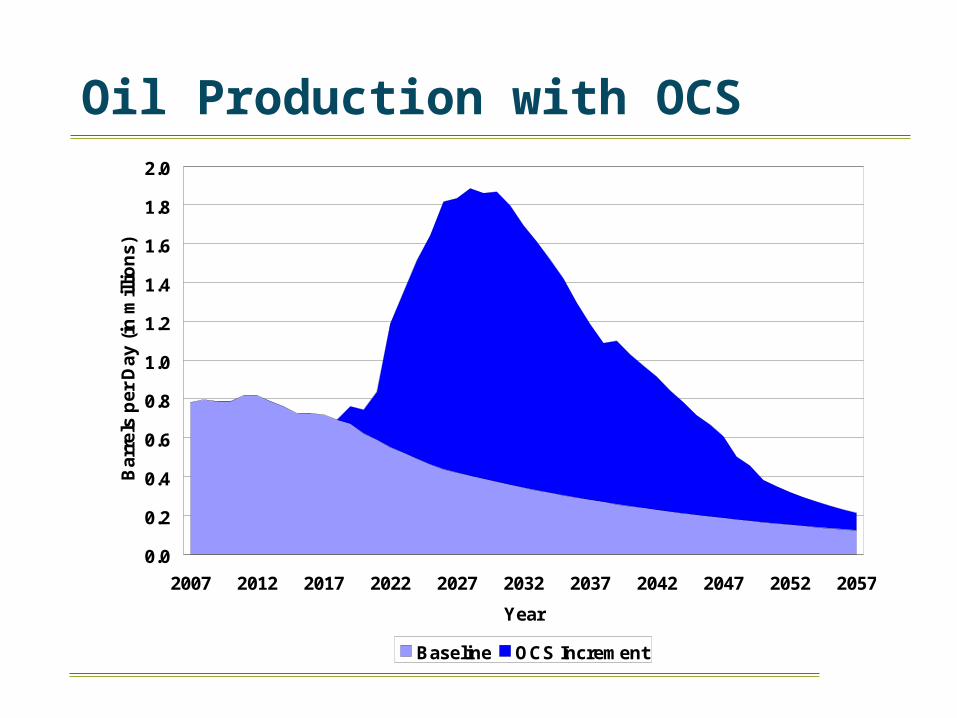
Oil Production with OCS
0.0
0.2
0.4
0.6
0.8
1.0
1.2
1.4
1.6
1.8
2.0
2007 2012 2017 2022 2027 2032 2037 2042 2047 2052 2057
Year
Bar
rels
per
Day
(in
mill
ion
s)
Baseline OCS Increment
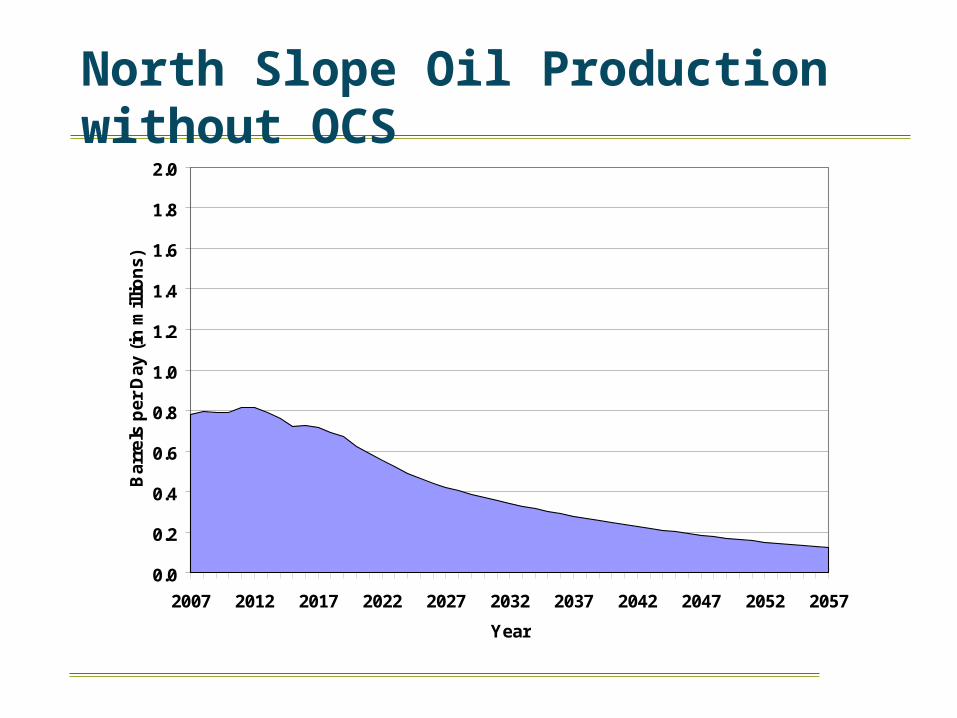
North Slope Oil Production without OCS
0.0
0.2
0.4
0.6
0.8
1.0
1.2
1.4
1.6
1.8
2.0
2007 2012 2017 2022 2027 2032 2037 2042 2047 2052 2057
Year
Bar
rels
per
Day
(in
mill
ion
s)
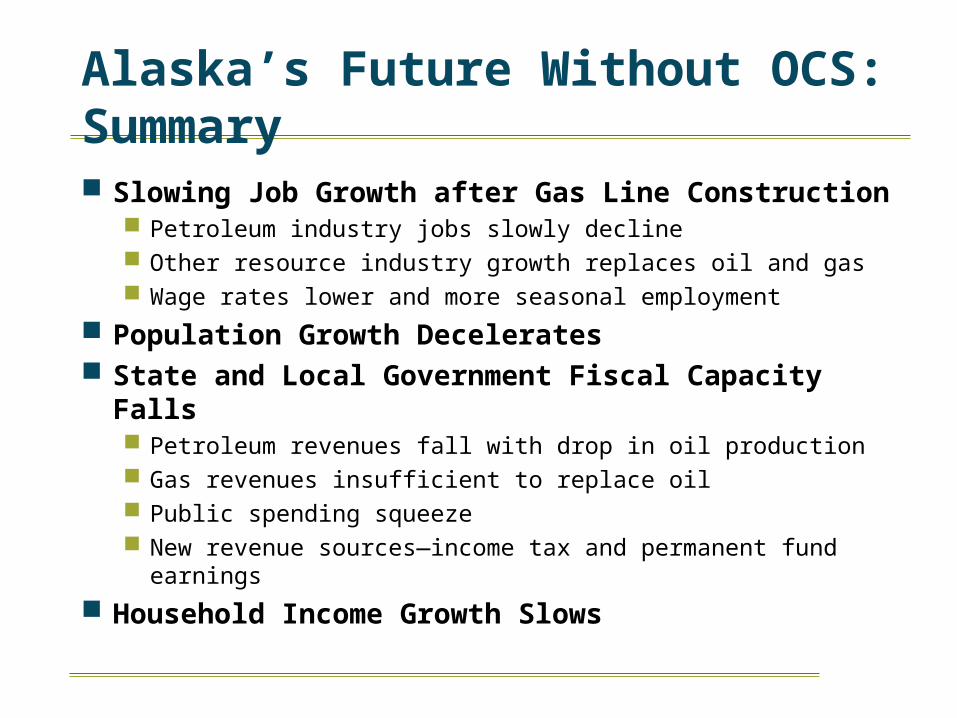
Alaska’s Future Without OCS: Summary
Slowing Job Growth after Gas Line Construction Petroleum industry jobs slowly decline Other resource industry growth replaces oil and gas Wage rates lower and more seasonal employment
Population Growth Decelerates State and Local Government Fiscal Capacity Falls
Petroleum revenues fall with drop in oil production Gas revenues insufficient to replace oil Public spending squeeze New revenue sources—income tax and permanent fund earnings
Household Income Growth Slows
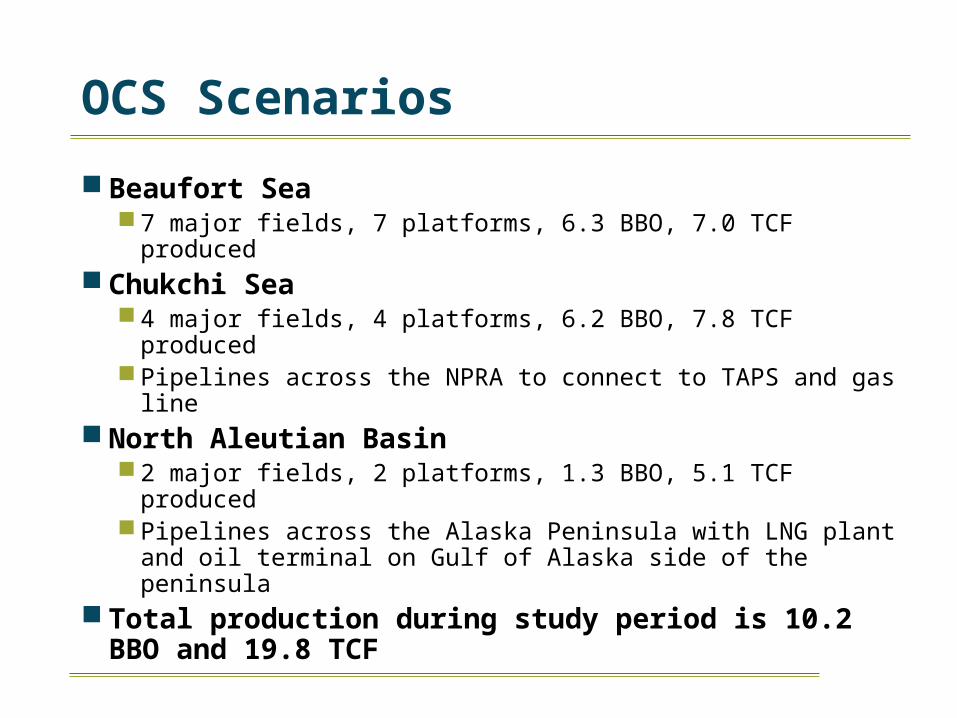
OCS Scenarios
Beaufort Sea 7 major fields, 7 platforms, 6.3 BBO, 7.0 TCF produced
Chukchi Sea 4 major fields, 4 platforms, 6.2 BBO, 7.8 TCF produced Pipelines across the NPRA to connect to TAPS and gas line
North Aleutian Basin 2 major fields, 2 platforms, 1.3 BBO, 5.1 TCF produced Pipelines across the Alaska Peninsula with LNG plant and oil
terminal on Gulf of Alaska side of the peninsula Total production during study period is 10.2 BBO and
19.8 TCF
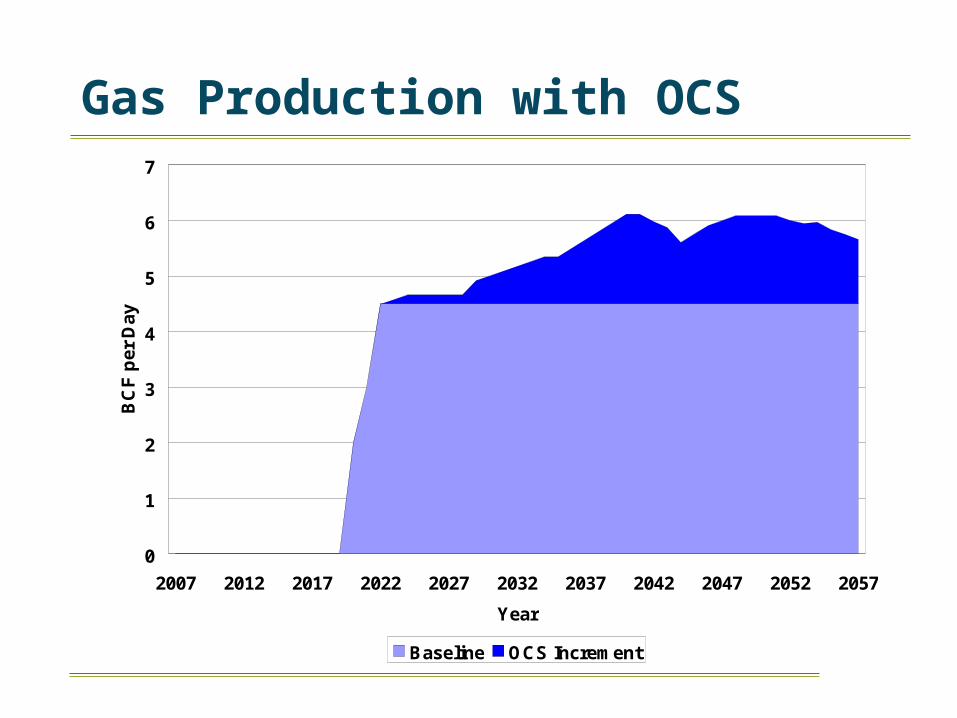
Gas Production with OCS
0
1
2
3
4
5
6
7
2007 2012 2017 2022 2027 2032 2037 2042 2047 2052 2057
Year
BC
F p
er D
ay
Baseline OCS Increment
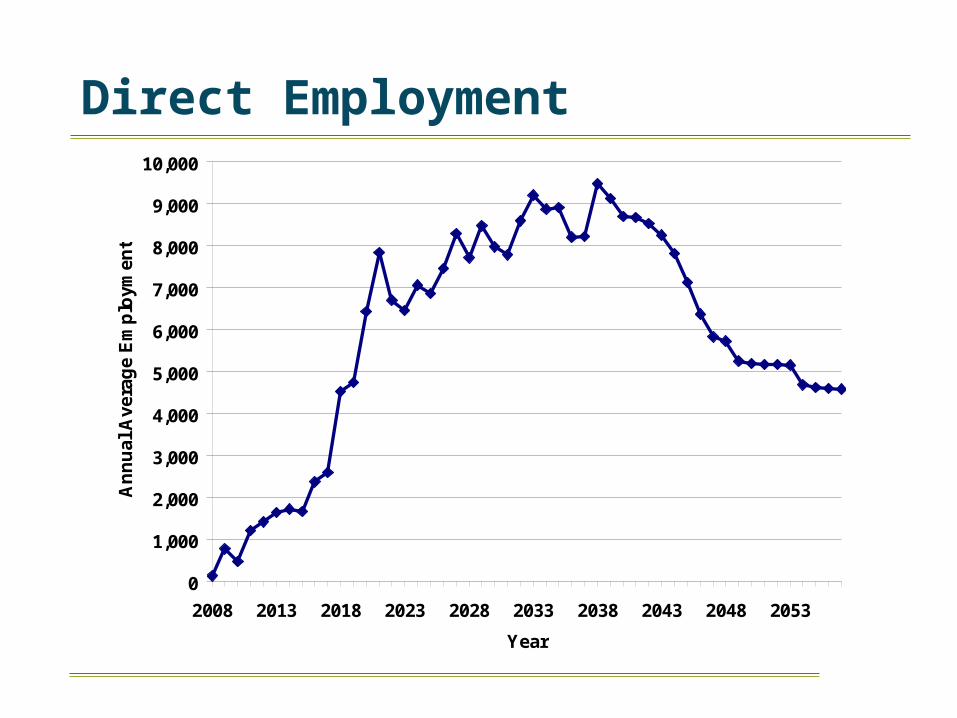
Direct Employment
0
1,000
2,000
3,000
4,000
5,000
6,000
7,000
8,000
9,000
10,000
2008 2013 2018 2023 2028 2033 2038 2043 2048 2053
Year
An
nu
al A
vera
ge
Em
plo
ymen
t
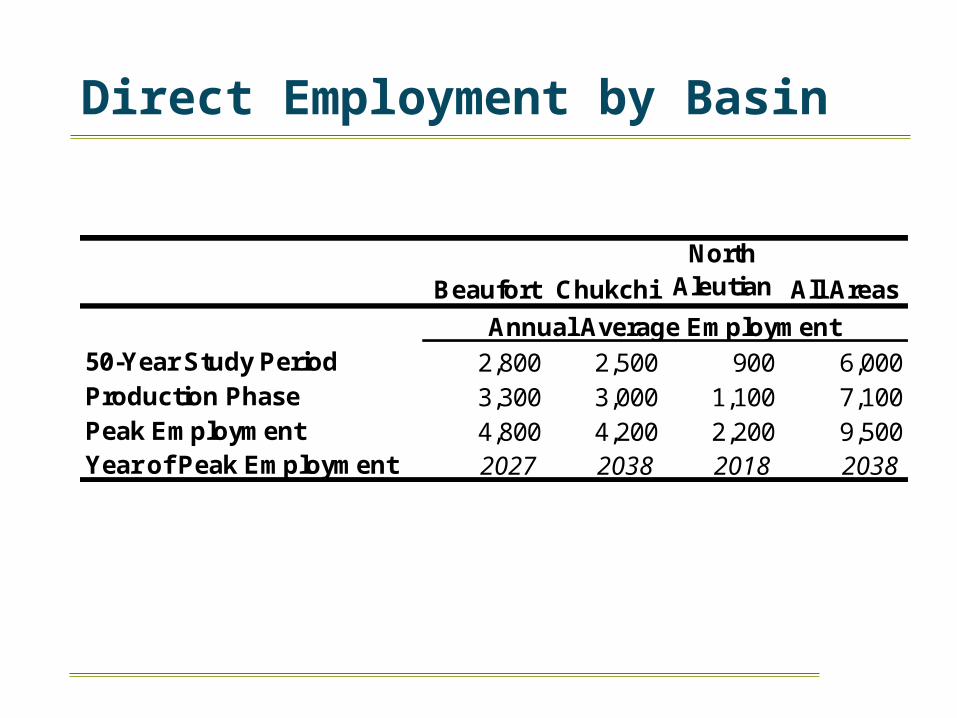
Direct Employment by Basin
Beaufort Chukchi
North Aleutian All Areas
50-Year Study Period 2,800 2,500 900 6,000Production Phase 3,300 3,000 1,100 7,100Peak Employment 4,800 4,200 2,200 9,500Year of Peak Employment 2027 2038 2018 2038
Annual Average Employment
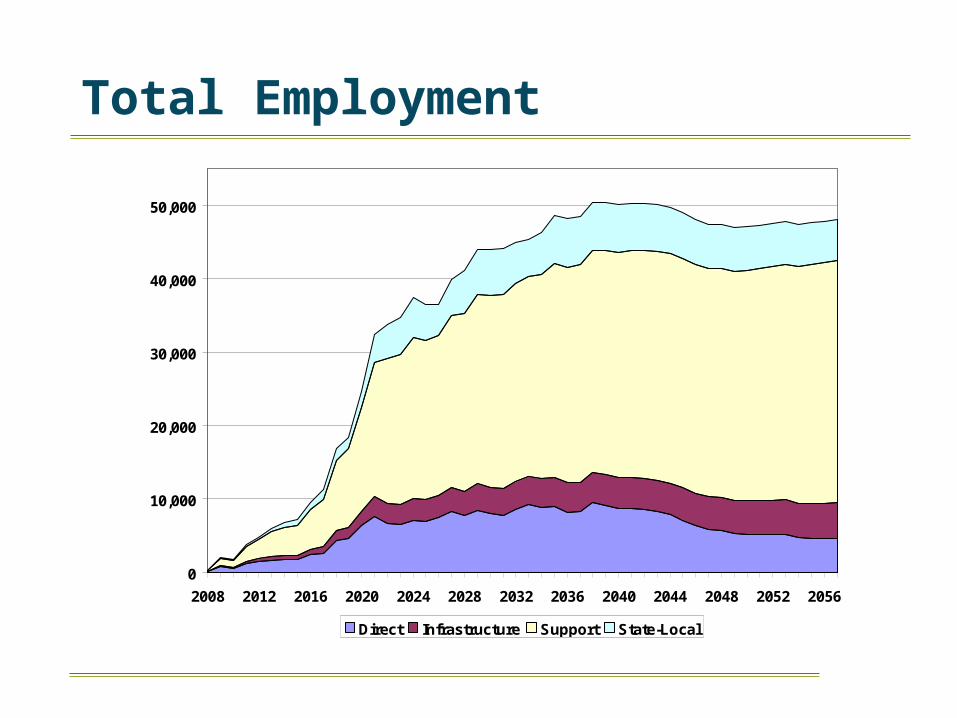
Total Employment
0
10,000
20,000
30,000
40,000
50,000
2008 2012 2016 2020 2024 2028 2032 2036 2040 2044 2048 2052 2056
Direct Infrastructure Support State-Local
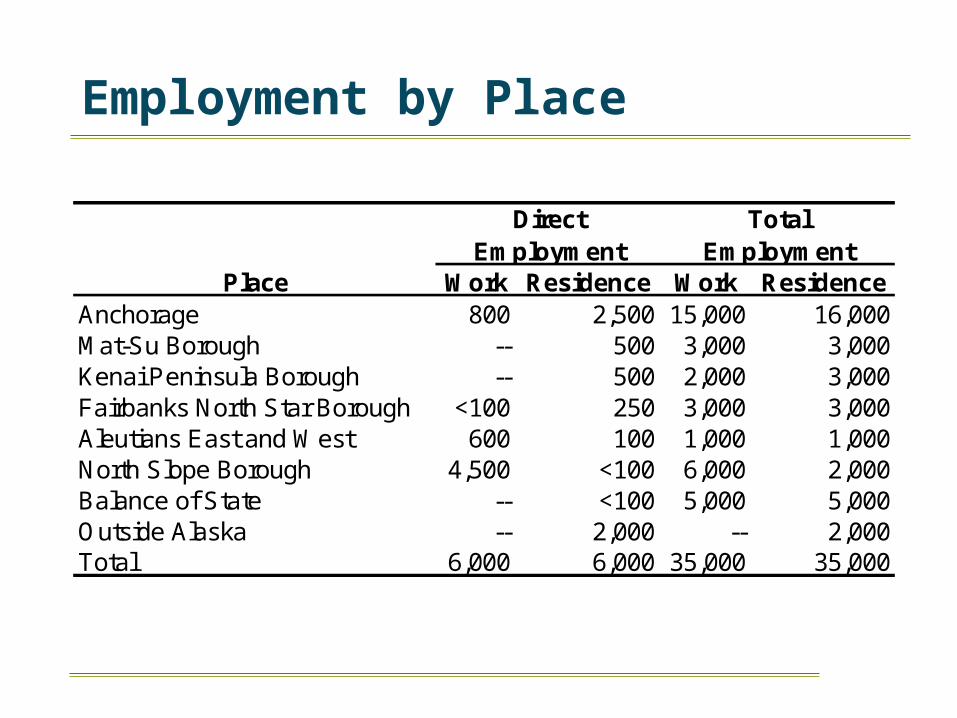
Employment by Place
Work Residence Work ResidenceAnchorage 800 2,500 15,000 16,000Mat-Su Borough -- 500 3,000 3,000Kenai Peninsula Borough -- 500 2,000 3,000Fairbanks North Star Borough <100 250 3,000 3,000Aleutians East and West 600 100 1,000 1,000North Slope Borough 4,500 <100 6,000 2,000Balance of State -- <100 5,000 5,000Outside Alaska -- 2,000 -- 2,000Total 6,000 6,000 35,000 35,000
Place
DirectEmployment
Total Employment
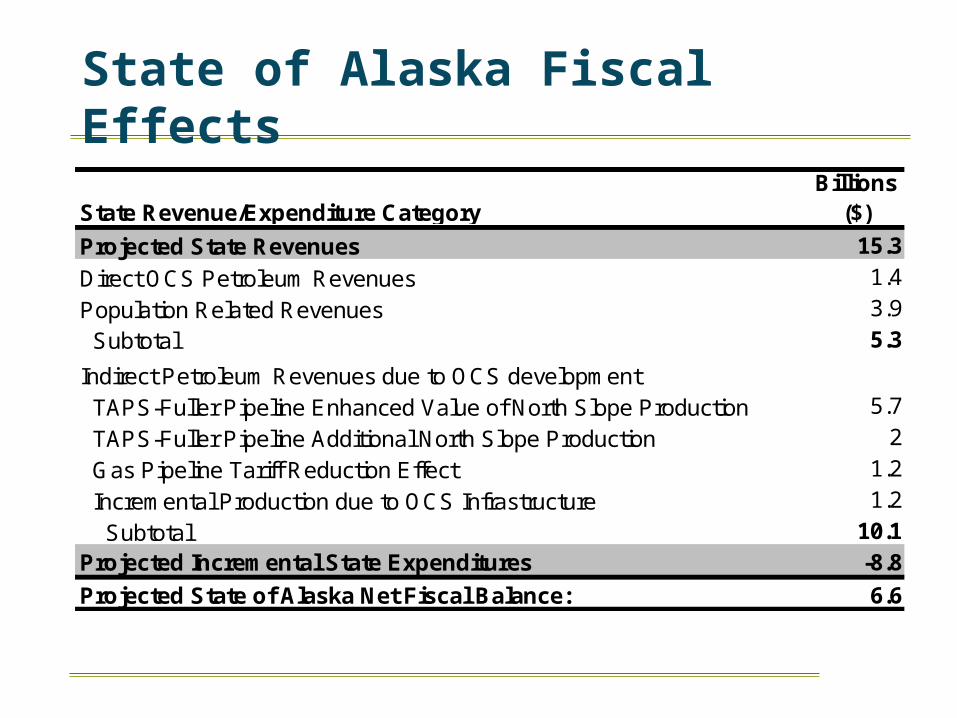
State of Alaska Fiscal Effects
Projected State Revenues 15.3
Direct OCS Petroleum Revenues 1.4
Population Related Revenues 3.9
Subtotal 5.3
Indirect Petroleum Revenues due to OCS development TAPS-Fuller Pipeline Enhanced Value of North Slope Production 5.7
TAPS-Fuller Pipeline Additional North Slope Production 2
Gas Pipeline Tariff Reduction Effect 1.2
Incremental Production due to OCS Infrastructure 1.2
Subtotal 10.1Projected Incremental State Expenditures -8.8
Projected State of Alaska Net Fiscal Balance: 6.6
State Revenue/Expenditure CategoryBillions
($)
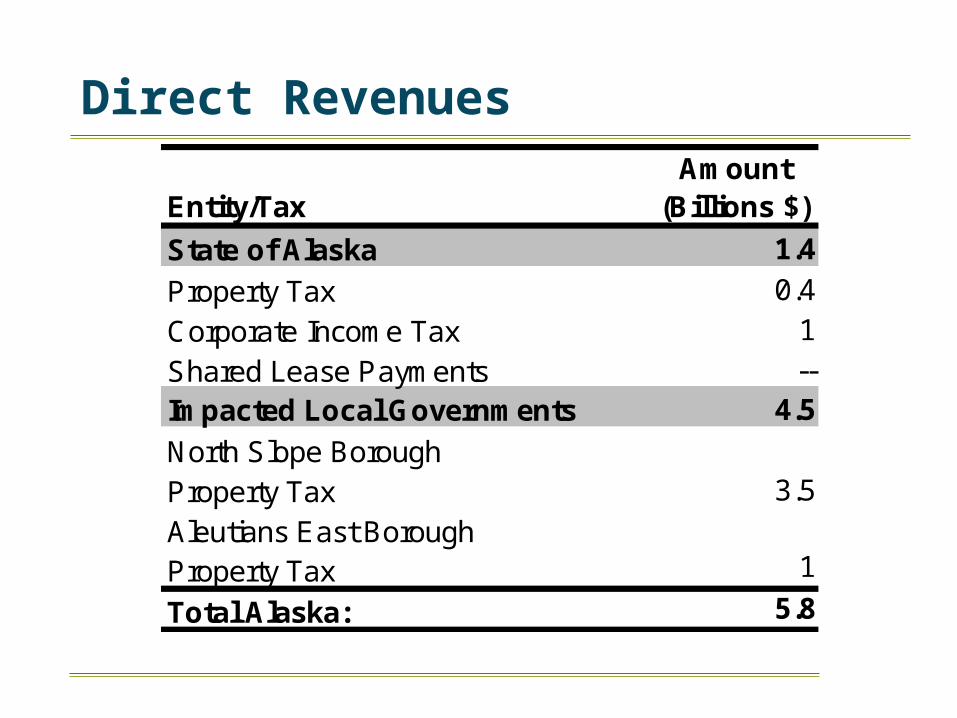
Direct Revenues
Entity/TaxAmount
(Billions $)
State of Alaska 1.4
Property Tax 0.4
Corporate Income Tax 1
Shared Lease Payments --Impacted Local Governments 4.5
North Slope BoroughProperty Tax 3.5
Aleutians East BoroughProperty Tax 1
Total Alaska: 5.8
Questions & Comments
Economic Study Report can be viewed at:
www.shell.com/us/alaska

Major Findings OCS development could generate an annual average of 35,000 jobs over
the next 50 years. These jobs represent a total payroll of $72 billion (2007$) over the 50-year
period. OCS-related employment growth could great a generation of jobs in
Alaska. Opportunities would be created throughout the state in both high paying,
long-term, year-round jobs and in seasonal and short-term jobs. Of the 6,000 oil and gas sector jobs, about 3,900 would be long-term, year-round jobs.
The growth in jobs resulting from OCS development would lead to a five percent increase in statewide population. Most of the growth would be concentrated in Alaska’s population centers, but directly impacted regions would experience a much greater percent increase
The potential cumulative direct petroleum revenues to Alaska would be $5.8 billion (2007$) with most revenues going to directly impacted local governments from property taxes on onshore petroleum facilities.