Differences in Genetic and EnvironmentalInfluences on the Human Cerebral CortexAssociated With Development During
Childhood and Adolescence
Rhoshel K. Lenroot,1* James E. Schmitt,2 Sarah J. Ordaz,1,3 Gregory L. Wallace,1
Michael C. Neale,2 Jason P. Lerch,4 Kenneth S. Kendler,2
Alan C. Evans,5 and Jay N. Giedd1
1Child Psychiatry Branch, National Institute of Mental Health, National Institutes of Health, Bethesda, MD, USA2Virginia Institute of Psychiatric and Behavioral Genetics, Virginia Commonwealth University, Richmond VA, USA
3Laboratory of Neurocognitive Development, University of Pittsburgh, Pittsburgh, PA, USA4Mouse Imaging Centre, The Hospital for Sick Children, Toronto, Ontario, Canada
5McConnell Brain Imaging Center, Montreal Neurological Institute, McGill University, Montreal, Quebec, Canada
Abstract: In this report, we present the first regional quantitative analysis of age-related differences inthe heritability of cortical thickness using anatomic MRI with a large pediatric sample of twins, twinsiblings, and singletons (n 5 600, mean age 11.1 years, range 5–19). Regions of primary sensory andmotor cortex, which develop earlier, both phylogenetically and ontologically, show relatively greatergenetic effects earlier in childhood. Later developing regions within the dorsal prefrontal cortex andtemporal lobes conversely show increasingly prominent genetic effects with maturation. The observa-tion that regions associated with complex cognitive processes such as language, tool use, and executivefunction are more heritable in adolescents than children is consistent with previous studies showingthat IQ becomes increasingly heritable with maturity(Plomin et al. [1997]: Psychol Sci 8:442–447). Theseresults suggest that both the specific cortical region and the age of the population should be taken intoaccount when using cortical thickness as an intermediate phenotype to link genes, environment, andbehavior. Hum Brain Mapp 30:163–174, 2009. VVC 2007 Wiley-Liss, Inc.
Key words: brain; twin study; genetics; growth and development; child; adolescent; magnetic reso-nance imaging
INTRODUCTION
Debates over the relative influence of genetic factors ver-sus environmental influences in determining the course ofan individual’s developmental trajectory have given wayto acceptance that brain structure and function is createdthrough complex interactions, which change over the lifeof an individual [Rutter et al., 2006]. Identifying factorswhich most strongly affect brain development at a giventime is important to our understanding of what drives de-
Additional Supporting Information may be found in the onlineversion of this article.
Contract grant sponsor: NIH; Contract grant numbers: MH-20030,MH-65322.
*Correspondence to: Rhoshel K. Lenroot, MD, Child PsychiatryBranch, NIMH/CHP 10 Center Drive, Room 4C110, MSC 1367,Bethesda, Maryland 20892-9692. E-mail: [email protected]
Received for publication 9 May 2007; Accepted 31 August 2007
DOI: 10.1002/hbm.20494Published online 27 November 2007 in Wiley InterScience (www.interscience.wiley.com).
VVC 2007 Wiley-Liss, Inc.
r Human Brain Mapping 30:163–174 (2009) r
velopmental trajectories to unfold in a particular way.Quantitative genetics provides a method of estimating therelative contributions of genetic and nongenetic sources ingenerating individual differences in traits. Quantification ispossible by examining covariance patterns between familymembers of different levels of genetic relatedness, suchbetween as monozygotic and dizygotic twins. Heritabilityis the proportion of the variance in a trait due to geneticfactors. It has been known for over a decade that brainsize in adults is highly heritable [Baare et al., 2001; Gesch-wind et al., 2002; Posthuma et al., 2000; Reveley et al.,1984; Tramo et al., 1998; White et al., 2002]. More recentstudies have demonstrated that differences in brain sizebetween children are also strongly influenced by geneticfactors [Pennington et al., 2000] and that heritability ofgray and white matter volumes changes over childhoodand adolescence [Wallace et al., 2006].Cortical thickness is of interest as a measure of brain
anatomy potentially sensitive to a variety of developmentaland functional differences between cortical regions [Rolandand Zilles, 1998]. The thickness of the cortical sheet isdetermined by cytoarchitectural characteristics such aslaminar structure and cellular size and density [Rakicet al., 2004]. Until recently, technical challenges in mea-surement of the geometrically complex cortex have limitedquantitative analyses of the heritability of regional corticalthickness. Wright et al. measured heritability of averagecortical thickness in 92 cortical regions in 10 pairs ofmonozygotic and 10 pairs of dizygotic healthy adult twins.This study found the strongest genetic effects (heritabilitiesgreater than 0.50) in areas within the frontal, temporal,and superior parietal lobes [Wright et al., 2002]. In the firststudy at the voxel level of resolution, Thompson et al.[2001] measured cortical density in 10 MZ and 10 DZ adulttwin pairs. They found evidence of significant heritabilityin bilateral frontal and superior temporal regions, withgreater values in language-associated areas of the lefthemisphere. Hulshoff Pol et al. [2006] found evidence forsignificant heritability of gray and white matter densitywithin several brain regions in a twin study of 258 adultsubjects. There have been no previous studies of develop-mental changes in heritability of cortical features inhumans, despite evidence of developmental changes inpostnatal cortical structure [Gogtay et al., 2004] and post-natal gene expression [Plomin and Craig, 1997; Sun et al.,2005].The present study extends our understanding of
genetic and environmental influences on brain develop-ment by using magnetic resonance imaging (MRI) toexamine the heritability of cerebral cortical thickness in alarge pediatric sample of twin, twin sibling, and singletonsubjects. We also explore changes in heritability over thecourse of childhood and adolescence using two differentmethods: first by modeling the interaction of heritabilityand age, and second through direct comparison of esti-mated variance components between older and youngergroups.
MATERIALS AND METHODS
Subjects
Six-hundred normally developing same-sex monozygotic(MZ) and dizygotic (DZ) twins, siblings of twins, and unre-lated singletons were recruited as part of an ongoing longi-tudinal brain imaging project being conducted at the ChildPsychiatry Branch of the National Institute of Mental Health(NIMH) (see Tables I and II for demographic characteris-tics). Heritability of brain volumes was previously reportedfrom a subset of this sample [Wallace et al., 2006] (MRIdata from 86 of the MZ twin pairs, 37 of the DZ twin pair,and 153 of the singletons reported here were included inthe previous study). Parents of prospective participantswere interviewed by phone and asked to report their child’shealth, developmental, and educational history. Duringtheir visit to the NIMH, subjects underwent a clinical inter-view and physical examination. Subjects were excluded ifthey had taken psychiatric medications, had been diagnosedwith a psychiatric disorder, had undergone brain trauma,or had any condition known to affect gross brain develop-ment. Inclusion criteria were a minimum gestational age of29 weeks and a minimum birth weight of 1,500 g for bothmembers of each twin pair. Approximately 80% of familiesresponding to the ads met inclusion criteria. Socio-economicstatus was rated using the Hollingshead scale [Hollingsheadand Redlich, 1958]. Zygosity was determined by DNA anal-ysis of buccal cheek swabs using 9–21 unlinked short tan-dem repeat loci for a minimum certainty of 99%, by BRTLaboratories and Proactive Genetics. We obtained verbal orwritten assent from the child and written consent from theparents for their participation in the study. The NIMH Insti-tutional Review Board approved the protocol.
MRI Acquisition
All MRI images were acquired on the same GeneralElectric 1.5 Tesla Signa Scanner located at the NationalInstitutes of Health Clinical Center in Bethesda, Maryland.A three-dimensional spoiled gradient recalled echosequence in the steady state sequence, designed to opti-mize discrimination between gray matter, white matter,and cerebrospinal fluid, was used to acquire 124 contigu-ous 1.5-mm thick slices in the axial plane (TE/TR 5 5/24ms; flip angle 5 45 degrees, matrix 5 256 3 192, NEX 5 1,FOV 5 24 cm, acquisition time 9.9 min). A Fast SpinEcho/Proton Density weighted imaging sequence was alsoacquired for clinical evaluation.
Image Analysis
The native MRI scans were registered into standardizedstereotaxic space using a linear transformation [Collins et al.,1994] and corrected for nonuniformity artifacts [Sled et al.,1998]. The registered and corrected volumes were segmentedinto white matter, gray matter, cerebrospinal fluid, and back-ground using a neural net classifier [Zijdenbos et al., 2002].
r Lenroot et al. r
r 164 r
The white and gray matter surfaces were fitted using deform-able surface-mesh models and nonlinearly aligned toward astandard template surface [Kim et al., 2005; MacDonald et al.,2000; Robbins et al., 2004]. The white and gray matter surfa-ces were resampled into native space, and cortical thicknesswas measured in native-space millimeters using the linkeddistance between the white and pial surfaces at each of40,962 cortical points throughout the cortex [Lerch andEvans, 2005; MacDonald et al., 2000]. To improve the abilityto compare populations, each subject’s cortical thickness mapwas blurred using a 30-mm surface-based diffusion blurringkernel, chosen to maximize statistical power while minimiz-ing false positives [Lerch and Evans, 2005]. Cortical pointswere assigned to specific regions using a probabilistic atlas[Collins et al., 1999]. These methods have been validatedusing both manual measurements [Kabani et al., 2001] and apopulation simulation [Lerch and Evans, 2005], and havebeen used in studies of Alzheimer’s disease [Lerch et al.,2005] and normal development [Shaw et al., 2005], amongothers. Statistical results from structural equation modelinganalyses of cortical thickness at each point (see StatisticalAnalysis section below) were projected upon the smoothedbrain template using in-house software developed by theMontreal Neurological Institute.
Statistical Analysis
Since MZ twins are genetically identical, while on aver-age only one-half of the genes in DZ twins are identical bydescent (IBD), the classical twin design allows for the pars-ing of observed variability in phenotype into additivegenetic factors (A), environmental factors shared betweenfamily members (C), and nongenetic factors unique toindividuals (E) (Fig. 1A) [Neale et al., 1992]. The additionof single-birth siblings (including siblings of twins and alarge number of siblings of families with no twins), half ofwhose genes are IBD to those of their twin and nontwinsiblings, provides substantially increased power to detectgenetic signal due to a greater number of observed covari-
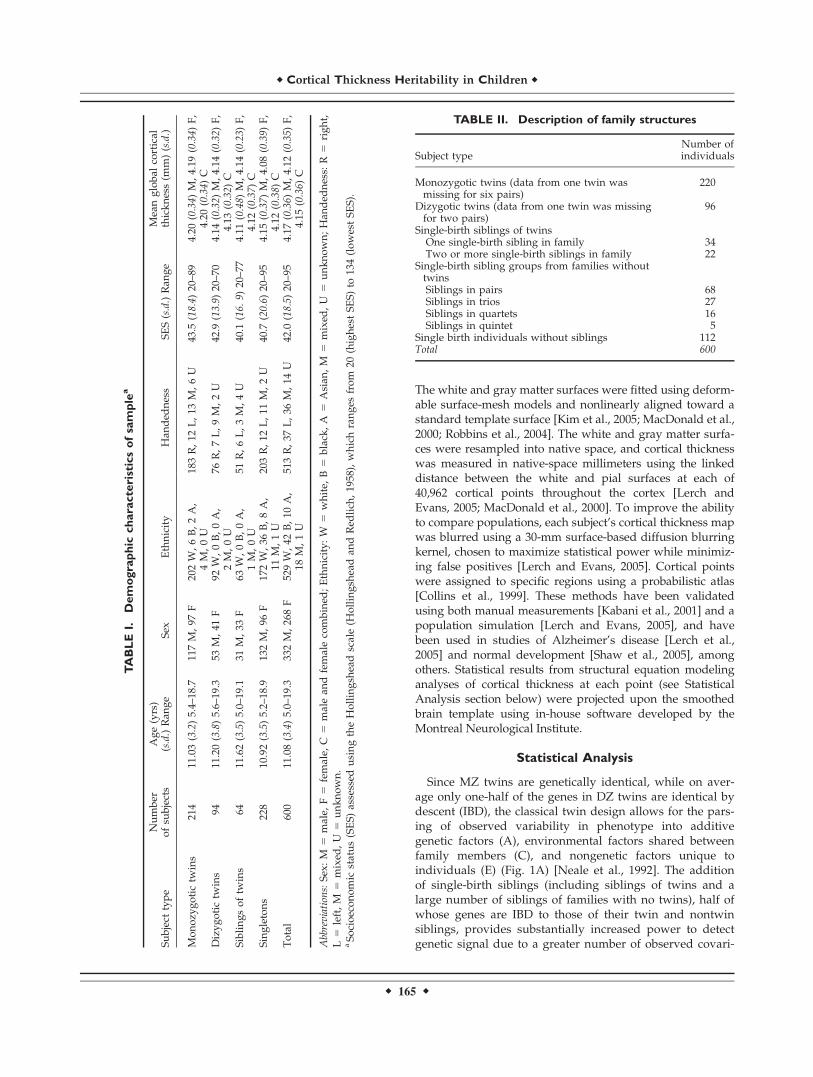
TABLEI.
Demographic
characteristicsofsample
a
Subject
type
Number
ofsu
bjects
Age(yrs)
(s.d.)Ran
ge
Sex
Ethnicity
Han
ded
ness
SES(s.d.)Ran
ge
Meanglobal
cortical
thickness(m
m)(s.d.)
Monozy
gotictw
ins
214
11.03(3.2)5.4–
18.7
117M,97
F20
2W
,6B,2A,
4M,0U
183R,12
L,13
M,6U
43.5
(18.4)
20–8
94.20
(0.34)
M,4.19
(0.34)
F,
4.20
(0.34)
CDizygotic
twins
9411
.20(3.8)5.6–
19.3
53M,41
F92
W,0B,0A,
2M,0U
76R,7L,9M,2U
42.9
(13.9)
20–7
04.14
(0.32)
M,4.14
(0.32)
F,
4.13
(0.32)
CSiblingsoftw
ins
6411
.62(3.5)5.0–
19.1
31M,33
F63
W,0B,0A,
1M,0U
51R,6L,3M,4U
40.1
(16.
9)20
–77
4.11
(0.48)
M,4.14
(0.23)
F,
4.12
(0.37)
CSingletons
228
10.92(3.5)5.2–
18.9
132M,96
F17
2W
,36
B,8A,
11M,1U
203R,12
L,11
M,2U
40.7
(20.6)
20–9
54.15
(0.37)
M,4.08
(0.39)
F,
4.12
(0.38)
CTotal
600
11.08(3.4)5.0–
19.3
332M,26
8F
529W
,42
B,10
A,
18M,1U
513R,37
L,36
M,14
U42
.0(18.5)
20–9
54.17
(0.36)
M,4.12
(0.35)
F,
4.15
(0.36)
C
Abbreviations:Sex:
M5
male,
F5
female,
C5
malean
dfemalecombined
;Ethnicity:W
5white,
B5
black,A
5Asian
,M
5mixed
,U
5unknown;Han
ded
ness:
R5
right,
L5
left,M
5mixed
,U
5unknown.
aSo
cioeconom
icstatus(SES)
assessed
usingtheHollingsh
eadscale(H
ollingsh
eadan
dRed
lich
,19
58),whichranges
from
20(highestSE
S)to
134(lowestSE
S).
TABLE II. Description of family structures
Subject typeNumber ofindividuals
Monozygotic twins (data from one twin wasmissing for six pairs)
220
Dizygotic twins (data from one twin was missingfor two pairs)
96
Single-birth siblings of twinsOne single-birth sibling in family 34Two or more single-birth siblings in family 22
Single-birth sibling groups from families withouttwinsSiblings in pairs 68Siblings in trios 27Siblings in quartets 16Siblings in quintet 5
Single birth individuals without siblings 112Total 600
r Cortical Thickness Heritability in Children r
r 165 r

ance statistics [Posthuma and Boomsma, 2000; Posthumaet al., 2000]. This ‘‘extended twin design’’ assumes that theshared environment operates similarly in both twins andsingleton births with respect to the phenotype of interest(Fig. 1B). In our sample, families contained either a twinpair and up to three additional siblings, or no twins andup to five nontwin siblings.We constructed structural equation models of expected
variance–covariance matrices for each cortical point in aniterative fashion using Mx, a statistical package designedfor the analysis of genetically-informative multi-group data[Neale et al., 1999]. Three variance components parameterswere estimated that quantified the relationship between A,C, E, and the observed cortical thickness measures. Theproportion of variance due to each component was thenderived (a2, c2, and e2) by dividing each variance compo-nent by the total variance. The model also contained pa-rameters to account for the effects of age and sex on meancortical thickness, which were estimated concurrently withthe variance components. Sex effects were estimated usinga linear model, and age was estimated using a cubic modelbased on prior evidence of age interactions with corticalthickness [Lenroot et al., 2005]. Optimum model fit wasdetermined using maximum likelihood [Edwards, 1972],which produces unbiased parameter estimates and allowsthe identification of statistically significant parameters inthe model [Neale and Miller, 1997]. Statistical significanceof variance components was determined by comparing thelikelihood from models with or without the parameter; the
difference in 22 times the log likelihood (22LL) asymptoti-cally follows a 50:50 mixture of zero and v2 distributionwith one degree of freedom. The model-fitting procedurewas iterated for all positions in the brain using the R statis-tical package [R Development Core Team, 2006], which gen-erated a dataset for a given spatial location and subse-quently initiated Mx statistical analysis. Effects of handed-ness were assessed by dividing the population into right-handed and nonright-handed individuals and comparingvariance components in the two groups. To determinewhether heritability estimates were biased by scaling issuesrelated to differences in mean cortical thickness, variancecomponents were converted to coefficients of variation andage interactions modeled on both measures for comparison.The relationship of age to heritability was explored both
by modeling age as a continuous variable and by dichoto-mizing the sample into younger and older groups [Purcell,2002]. We limited this division to two groups to maximizepower to detect variance components within each group.The younger sample consisted of children under 12, andthe older sample of children and adolescents 12 or moreyears of age (see Table III for demographic characteristicsand comparison of the two groups). The age cut-off waschosen as an approximate division between childhood andadolescence. For a classical twin model, the usual ap-proach would be to run two sets of univariate models inparallel and calculate parameter estimates separately forthe two groups. However, the use of the extended twinmodel complicates the analytic design, since nontwin sib-
Figure 1.Path diagram of genetic models. Panels A and C depict the classi-cal ACE twin model and an AE twin age-moderated model,respectively, while panels B and D depict the extensions to thesemodels used in the present study to accommodate between zeroand three additional subjects per family. Panels A and B: Latent fac-tors A, C, and E are allowed to influence the observed causalpaths a, c, and e, with latent shared environmental factors corre-
lated at unity, but additive genetic correlations correlated 1 or [1/2] depending on familial relationship. Panels C and D: In the mod-erated model, parameter estimates are allowed to vary based onindividual subject ages. For both models, age and sex regressionson mean CT are not shown for the sake of simplicity, though theseparameters were estimated simultaneously with the variance com-ponents. S 5 Subject number (1–5), vi 5 CT for the ith vertex.
r Lenroot et al. r
r 166 r
lings do not have identical ages, and as a result any twosiblings of a particular family might not belong to thesame age group.To overcome this problem, we combined an extended
twin design with moderator models for the examination ofgene by age interaction [Purcell, 2002]. Path diagrams forthis model are shown in Figure 1C,D; since our originalmodels found no evidence for a significant shared environ-mental contribution to cortical thickness (CT) variability, itwas not modeled to increase the power to detect geneticeffects. Each subject was dummy coded 0 or 1 dependingon whether age was below or above the age threshold,respectively. Two additional free parameters (x and z)were included in the model that allowed for the magni-tude of each variance component to change depending onage grouping. For the ith vertex, the estimation of herit-ability was calculated as
a2ijn !"#ai $ xi% 3 agejn&
2
"#ai $ xi% 3 agejn&2 $ "#ei $ zi% 3 agejn&
2
where agejn represents the dichotomized age value for nthfamily member of the jth family. From this equation, theheritability for the younger (Y) and older (O) age groupswere calculated as
a2iY ! a2ia2i $ e2i
and a2iO ! #ai $ xi%2
#ai $ xi%2 $ #ei $ zi%2
To test whether heritability differed between groups, wetested submodels that constrained a2Y ! a2O for each vertex.Under the null hypothesis of no heritability differencebetween groups, this simplification was expected to pro-duce a difference in 22LL following a v2 distribution withone degree of freedom, which was confirmed via simula-tion of 1,000 datasets with identical sample size and familystructure compared to the present study.The resultant output for all models consisted of maxi-
mum likelihood variance components parameter estimatesfor all cortical points as well as P-values of the statisticalsignificance of A and C. Brain maps were reconstructedfrom these data to visualize the maximum likelihood esti-mates of variance components owed to additive genetic(A), shared environmental (C), and unique environmental(E) factors and of proportional variability for each of thesefactors (a2, c2, and e2). Probability maps also were con-structed to assess the significance of genetic factors onindividual differences in cortical thickness. An a <0.05was set as the threshold for statistical significance. A falsediscovery rate (FDR) adjustment was applied to control forType I error [Genovese et al., 2002]. Unless otherwisespecified, FDR was set to allow for a 5% chance of falsepositives. A likelihood-ratio v2 test was used to test thestatistical significance of age interactions by comparinghow well a model incorporating the age interaction fit thedata compared with a model that did not include the ageinteraction. For the moderator models with dichotomizedage variables, difference maps also were constructed bysubtracting a2Yfrom a2O to estimate how heritability changedbetween early and late childhood.
RESULTS
Cross-Sectional Analysis
Cross-sectional analysis showed heritability estimates atindividual cortical points ranging from 0 to 0.61. Valuesover 0.50 were found in regions of the frontal lobes, tempo-ral lobes, postcentral gyri, and supramarginal gyri. Areas inwhich genetic effects were statistically significant includedthe frontal pole, dorsolateral and orbital prefrontal cortices,prefrontal gyrus, angular and superior temporal gyri, andthe superior parietal region (see Figs. 2 and 3 for maps ofheritability values and statistical significance, and Table IVfor numerical ranges of values in individual cortical re-gions). Unique environmental factors and other elementswithin E were the primary determinants of variance in the
TABLE III. Demographic characteristicsof younger and older subsamples
Younger (s.d.) Older (s.d.) Differences
Groups P 5 0.59MZ 134 80DZ 62 32Siblings 36 29Singletons 143 84
Age 8.88 (2.00) 14.72 (0.82) P < 0.0001
Sex P 5 0.10Male 198 91Female 177 135
Ethnicity P 5 0.67White 333 197Black 26 16Asian 6 4Mixed 10 8Unknown 0 1
Handedness P 5 0.82Right 322 192Mixed 21 15Left 22 15Unknown 10 4
SESa 42.63 (18.54) 40.93 (18.39) P 5 0.29Mean cortical thicknessb 4.17 (.38) 4.11 (.31) P 5 0.03
Total number of younger subsamples is 375, and the total numberof older subsamples is 226.a Socioeconomic status (SES) assessed using the Hollingshead scale(Hollingshead and Redlich, 1958), which ranges from 20 (highestSES) to 134 (lowest SES).bUnequal variances between groups; results are reported usingone-way ANOVA for consistency; Welch ANOVA provides a sim-ilar outcome.
r Cortical Thickness Heritability in Children r
r 167 r
remaining regions. Shared environmental effects (C) rangingin value up to 0.25 were seen in regions including the leftprefrontal cortex, right superior medial gyrus, right superiorposterior gyrus, bilateral inferior postcentral gyrus, left pos-terior medial temporal gyrus, left insular, bilateral medialcingulate regions, and bilateral occipital lobes, but did notreach significance in any cortical region, consistent withwhat has been reported elsewhere [Pennington et al., 2000;Wright et al., 2002]. Heritability estimates were not signifi-cantly affected by sex or handedness. There were no differ-ences in heritability values modeled after variance compo-nents were converted to coefficients of variation.
Differences in Heritability AssociatedWith Development
In the first part of the analysis of effects of developmentupon heritability, in which age was considered as a contin-uous variable, we found that developmental changes inheritability during the age range of our sample (5–18)were markedly different across the brain (see Fig. 4). Herit-
ability decreased with age in dorsal regions of primarymotor and somatosensory cortex in the pre- and post-cen-tral gyri, posterior temporal and inferior parietal regions,and occipital regions. Heritability increased over the sameperiod in other regions, most markedly in dorsolateral pre-frontal cortex, superior parietal cortex, and temporal cor-tex, and in language-related regions in the left hemisphereincluding Broca and Wernicke’s areas. Inferior regions ofprimary motor and sensory cortex in the prefrontal andpostgyral cortices that are associated with function withinthe facial region also showed increased heritability withage. Estimated heritability values at age 18 increased togreater than 0.90 in regions of the prefrontal cortex, supe-rior parietal cortex, temporal cortex, and left inferior pre-and post-central gyri and left angular gyrus.Changes in heritability were driven by regionally spe-
cific alterations of both the genetic and environmentalcomponents (Supplemental Fig. 1). The total variance aver-aged across the brain decreased with age. Regions ofincreasing heritability were typically characterized by sta-ble genetic variance in the presence of a decreasing envi-ronmental component, although in some regions increasesin absolute genetic variance also contributed, particularlywithin the anterior frontal and dorsal parietal regions. Theareas of decreasing heritability within the superior medialfrontal gyrus, primary motor, and somatosensory corticesshowed decreases in the genetic component. Environmen-tal variance increased in the primary somatosensoryregions, decreased within the superior medial frontalgyrus, and decreased or stayed stable in other areas of thebrain.We further explored developmental effects on heritabil-
ity by dividing the sample into an older and youngergroup and comparing variance components between thetwo groups. Shared environmental factors were againremoved from the model because they had not shown asignificant effect in the cross-sectional analyses. Figure 5shows areas in which the proportion of variance due togenetic factors is statistically significant for the younger
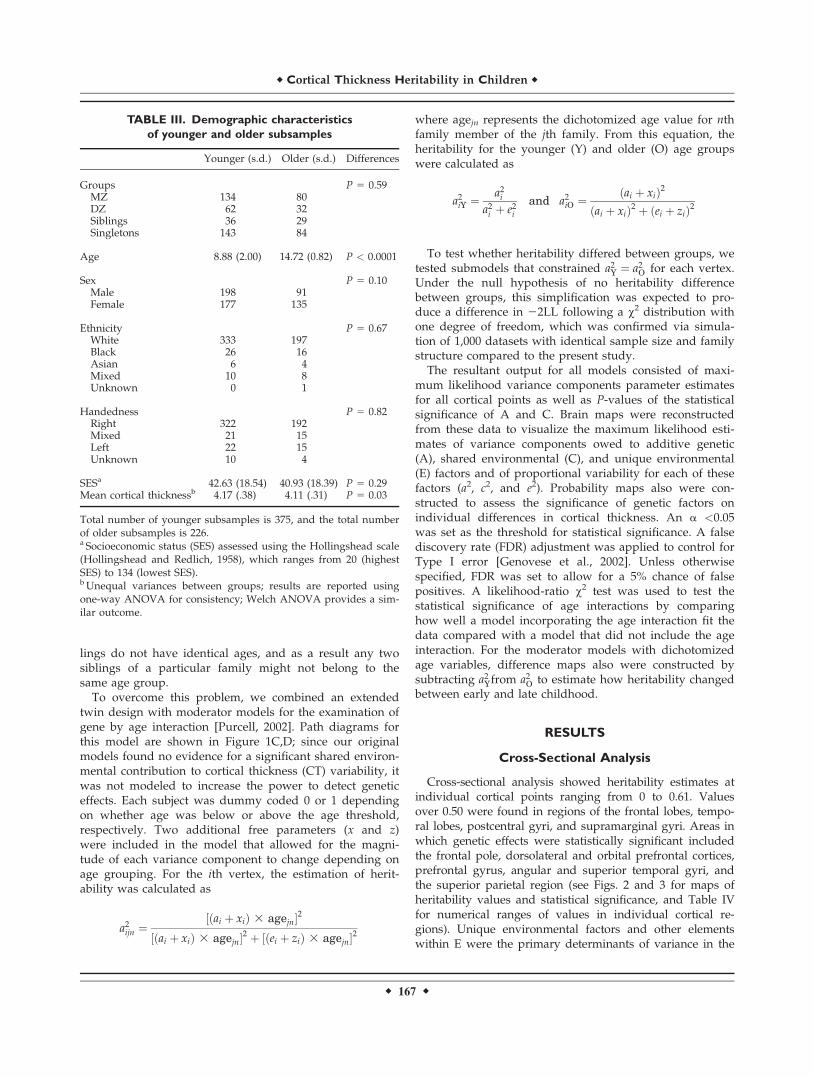
Figure 2.Estimated proportional variance components. The proportionsof total variance due to genetic (a2), shared environmental (c2),and unique environmental (e2) variance are shown at voxels cor-responding to each cortical vertex.
Figure 3.Regions of significant heritability. Voxels are color-coded for levelof significance following application of FDR threshold. Red voxelsare significant at P ' 0.05; green 5 0.05–0.10; blue 5 0.10–0.15(corresponding to uncorrected P values of 0.002, 0.016, and0.042, respectively).
r Lenroot et al. r
r 168 r

and older age groups and the differences in heritabilitybetween the two groups. Younger children showed herit-ability in the pre- and post-central sulcus, cingulate gyri,
left superior temporal gyrus and right inferior temporalgyrus, which was not present in the older group. Areasthat were heritable in the older but not younger groups
TABLE IV. Maximum likelihood parameter estimates and P-values from hypothesis testingof univariate ACE models
Variance components (95% CI) Hypothesis test (P-values*)
a2 c2 e2 A C A and C
Superior Frontal Gyrus -R 0.45 (0.20, 0.60) 0.00 (0.00, 0.15) 0.55 (0.40, 0.72) 0.004 1.000 0.00Superior Frontal Gyrus -L 0.51 (0.24, 0.64) 0.00 (0.00, 0.17) 0.49 (0.36, 0.65) 0.002 1.000 0.00Middle Frontal Gyrus -R 0.43 (0.21, 0.59) 0.00 (0.00, 0.10) 0.57 (0.41, 0.76) 0.002 1.000 0.00Middle Frontal Gyrus -L 0.38 (0.05, 0.52) 0.00 (0.00, 0.21) 0.62 (0.48, 0.80) 0.027 1.000 0.00Inferior Frontal Gyrus -R 0.52 (0.32, 0.66) 0.00 (0.00, 0.09) 0.48 (0.34, 0.67) 0.000 1.000 0.00Inferior Frontal Gyrus -L 0.44 (0.15, 0.58) 0.00 (0.00, 0.19) 0.56 (0.42, 0.73) 0.007 1.000 0.00Precentral Gyrus -R 0.43 (0.20, 0.58) 0.00 (0.00, 0.13) 0.57 (0.42, 0.75) 0.004 1.000 0.00Precentral Gyrus -L 0.52 (0.27, 0.65) 0.00 (0.00, 0.15) 0.48 (0.35, 0.65) 0.001 1.000 0.00Lateral Orbitofrontal Gyrus -R 0.38 (0.12, 0.54) 0.00 (0.00, 0.15) 0.62 (0.46, 0.81) 0.010 1.000 0.00Lateral Orbitofrontal Gyrus -L 0.34 (0.03, 0.49) 0.00 (0.00, 0.19) 0.66 (0.51, 0.84) 0.037 1.000 0.00Medial Orbitofrontal Gyrus -R 0.22 (0.00, 0.38) 0.00 (0.00, 0.17) 0.78 (0.62, 0.96) 0.099 1.000 0.05Medial Orbitofrontal Gyrus -L 0.27 (0.00, 0.43) 0.00 (0.00, 0.21) 0.73 (0.57, 0.91) 0.087 1.000 0.01Cingulate -R 0.36 (0.16, 0.53) 0.00 (0.00, 0.09) 0.64 (0.47, 0.83) 0.003 1.000 0.00Cingulate -L 0.40 (0.18, 0.56) 0.00 (0.00, 0.10) 0.60 (0.44, 0.80) 0.003 1.000 0.00Medial Frontal Gyrus -R 0.38 (0.10, 0.54) 0.00 (0.00, 0.17) 0.62 (0.46, 0.80) 0.016 1.000 0.00Medial Frontal Gyrus -L 0.50 (0.27, 0.64) 0.00 (0.00, 0.13) 0.50 (0.31, 0.68) 0.001 1.000 0.00Superior Parietal Gyrus -R 0.44 (0.20, 0.59) 0.00 (0.00, 0.13) 0.56 (0.41, 0.76) 0.004 1.000 0.00Superior Parietal Gyrus -L 0.30 (0.04, 0.47) 0.00 (0.00, 0.15) 0.70 (0.54, 0.89) 0.032 1.000 0.01Supramarginal Gyrus -R 0.39 (0.00, 0.53) 0.00 (0.00, 0.28) 0.61 (0.47, 0.79) 0.056 1.000 0.00Supramarginal Gyrus -L 0.51 (0.22, 0.63) 0.00 (0.00, 0.21) 0.49 (0.37, 0.64) 0.003 1.000 0.00Angular Gyrus -R 0.20 (0.00, 0.39) 0.00 (0.00, 0.18) 0.80 (0.61, 0.99) 0.171 1.000 0.12Angular Gyrus -L 0.24 (0.00, 0.41) 0.00 (0.00, 0.18) 0.76 (0.59, 0.95) 0.113 1.000 0.04Precuneus -R 0.19 (0.00, 0.36) 0.00 (0.00, 0.21) 0.81 (0.64, 0.98) 0.227 1.000 0.09Precuneus -L 0.12 (0.00, 0.28) 0.00 (0.00, 0.16) 0.88 (0.72, 1.00) 0.367 1.000 0.32Postcentral Gyrus -R 0.57 (0.36, 0.68) 0.00 (0.00, 0.13) 0.43 (0.32, 0.58) 0.000 1.000 0.00Postcentral Gyrus -L 0.48 (0.25, 0.61) 0.00 (0.00, 0.14) 0.52 (0.39, 0.68) 0.001 1.000 0.00Superior Temporal Gyrus -R 0.41 (0.13, 0.56) 0.00 (0.00, 0.17) 0.59 (0.44, 0.77) 0.010 1.000 0.00Superior Temporal Gyrus -L 0.40 (0.14, 0.55) 0.00 (0.00, 0.16) 0.60 (0.45, 0.77) 0.007 1.000 0.00Middle Temporal Gyrus -R 0.33 (0.00, 0.49) 0.00 (0.00, 0.21) 0.67 (0.51, 0.86) 0.047 1.000 0.00Middle Temporal Gyrus -L 0.39 (0.04, 0.54) 0.00 (0.00, 0.22) 0.61 (0.46, 0.80) 0.031 1.000 0.00Inferior Temporal Gyrus -R 0.38 (0.17, 0.53) 0.00 (0.00, 0.12) 0.62 (0.47, 0.70) 0.003 1.000 0.00Inferior Temporal Gyrus -L 0.47 (0.18, 0.60) 0.00 (0.00, 0.20) 0.53 (0.40, 0.69) 0.004 1.000 0.00Uncus -R 0.01 (0.00, 0.16) 0.00 (0.00, 0.09) 0.99 (0.84, 1.00) 1.000 1.000 1.00Uncus -L 0.05 (0.00, 0.24) 0.00 (0.00, 0.10) 0.95 (0.76, 1.00) 0.584 1.000 0.86Medial Occipitotemporal Gyrus -R 0.31 (0.00, 0.47) 0.01 (0.00, 0.30) 0.68 (0.53, 0.87) 0.196 0.938 0.00Medial Occipitotemporal Gyrus -L 0.26 (0.00, 0.42) 0.00 (0.00, 0.22) 0.74 (0.59, 0.92) 0.128 1.000 0.01Lateral Occipitotemporal Gyrus -R 0.33 (0.00, 0.48) 0.00 (0.00, 0.22) 0.67 (0.52, 0.85) 0.052 1.000 0.00Lateral Occipitotemporal Gyrus -L 0.28 (0.00, 0.44) 0.00 (0.00, 0.20) 0.72 (0.56, 0.90) 0.074 1.000 0.01Parahippocampal Gyrus -R 0.06 (0.00, 0.24) 0.01 (0.00, 0.16) 0.93 (0.76, 1.00) 0.808 0.929 0.61Parahippocampal Gyrus -L 0.10 (0.00, 0.33) 0.06 (0.00, 0.25) 0.84 (0.67, 0.98) 0.651 0.705 0.07Occipital Pole -R 0.30 (0.00, 0.50) 0.05 (0.00, 0.32) 0.65 (0.50, 0.84) 0.183 0.764 0.00Occipital Pole -L 0.47 (0.09, 0.60) 0.00 (0.00, 0.27) 0.53 (0.40, 0.70) 0.018 1.000 0.00Superior Occipital Gyrus -R 0.37 (0.01, 0.52) 0.00 (0.00, 0.24) 0.63 (0.48, 0.81) 0.045 1.000 0.00Superior Occipital Gyrus -L 0.31 (0.00, 0.48) 0.00 (0.00, 0.30) 0.69 (0.52, 0.91) 0.216 1.000 0.01Middle Occipital Gyrus -R 0.26 (0.00, 0.43) 0.00 (0.00, 0.22) 0.74 (0.57, 0.94) 0.136 1.000 0.02Middle Occipital Gyrus -L 0.33 (0.04, 0.51) 0.00 (0.00, 0.16) 0.67 (0.49, 0.87) 0.032 1.000 0.01Inferior Occipital Gyrus -R 0.23 (0.00, 0.40) 0.00 (0.00, 0.21) 0.77 (0.60, 0.96) 0.193 1.000 0.04Inferior Occipital Gyrus -L 0.12 (0.00, 0.49) 0.21 (0.00, 0.39) 0.67 (0.50, 0.83) 0.580 0.200 0.00Cuneus -R 0.35 (0.02, 0.50) 0.00 (0.00, 0.22) 0.65 (0.50, 0.83) 0.039 1.000 0.00Cuneus -L 0.15 (0.00, 0.32) 0.00 (0.00, 0.19) 0.85 (0.68, 1.00) 0.307 1.000 0.25Lingual Gyrus -R 0.01 (0.00, 0.33) 0.13 (0.00, 0.25) 0.86 (0.67, 0.98) 1.000 0.349 0.06Lingual Gyrus -L 0.22 (0.00, 0.39) 0.00 (0.00, 0.24) 0.78 (0.61, 0.97) 0.325 1.000 0.06Insula -R 0.30 (0.00, 0.46) 0.00 (0.00, 0.20) 0.70 (0.54, 0.88) 0.059 1.000 0.01Insula -L 0.26 (0.00, 0.43) 0.00 (0.00, 0.20) 0.74 (0.57, 0.95) 0.120 1.000 0.03
*P-values test the hypotheses of no genetic (A), shared environmental (C), or familial (A and C) effects on phenotypic variance; statisti-cally significant effects (at an a50.05) are shown in boldface.
r Cortical Thickness Heritability in Children r
r 169 r
included bilateral areas of the dorsal prefrontal cortex,orbitofrontal cortex, bilateral superior parietal cortex, infe-rior occipital cortex, and left inferior temporal gyri (seeSupplemental Fig. 2 for differences in variance componentsbetween the two age groups).
DISCUSSION
In this report, we have demonstrated for the first timethat heritability of cortical thickness shows both regionaland age-related variation in children and adolescents. Thesensitivity of brain structures to genetic or environmentalfactors is a topic of intense current interest as it may pro-vide a means to link genetic or environmental causes withdownstream behavioral and cognitive function. For exam-ple, regions that show significant heritability may be use-ful as intermediate phenotypes in the search for the genesresponsible for neuropsychiatric disorders [Boomsmaet al., 2002; Glahn et al., 2007]. Regions that instead showsignificant plasticity in response to environmental factors
may represent areas with the potential for adaptiveresponse.In the cross-sectional analyses, we found regions within
the dorsal frontal and temporal cortices to be significantlyheritable, consistent with previous studies (Figs. 2 and 3)[Hulshoff Pol et al., 2006; Thompson et al., 2001]. Howeverwe additionally found areas of significant heritability inthe orbitofrontal cortex, superior parietal regions, and infe-rior surfaces of the temporal lobes, possibly related to
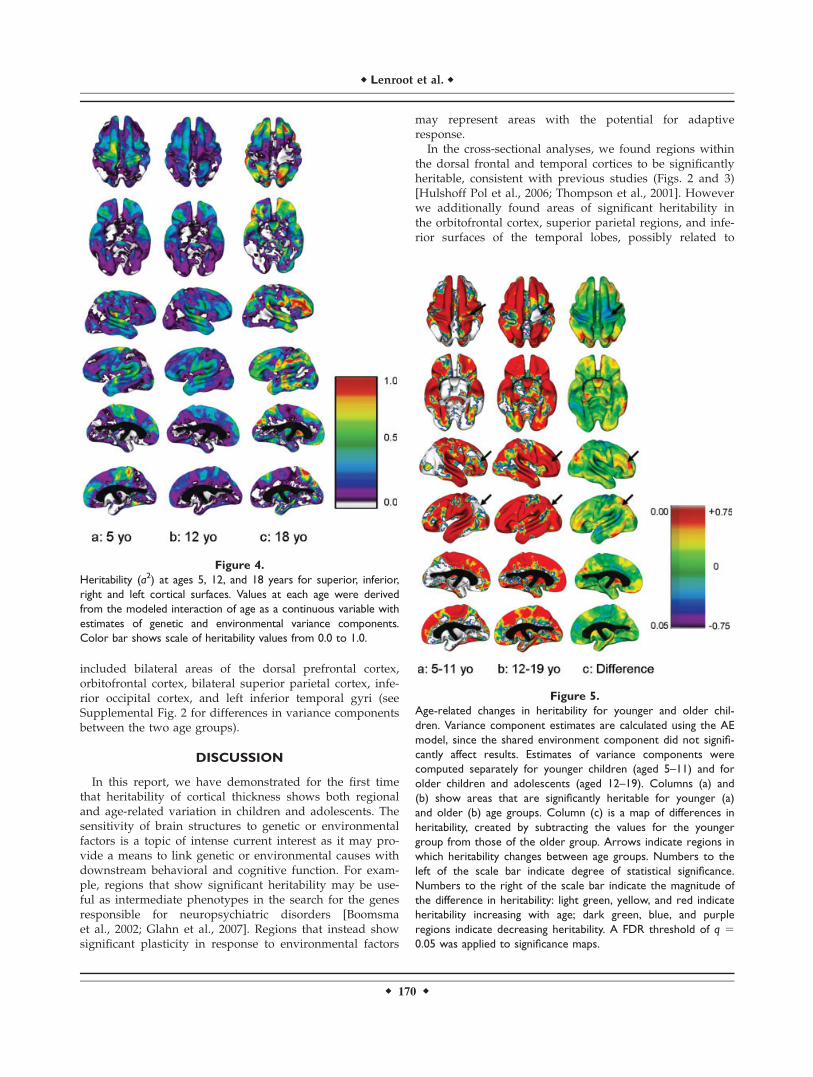
Figure 5.Age-related changes in heritability for younger and older chil-dren. Variance component estimates are calculated using the AEmodel, since the shared environment component did not signifi-cantly affect results. Estimates of variance components werecomputed separately for younger children (aged 5–11) and forolder children and adolescents (aged 12–19). Columns (a) and(b) show areas that are significantly heritable for younger (a)and older (b) age groups. Column (c) is a map of differences inheritability, created by subtracting the values for the youngergroup from those of the older group. Arrows indicate regions inwhich heritability changes between age groups. Numbers to theleft of the scale bar indicate degree of statistical significance.Numbers to the right of the scale bar indicate the magnitude ofthe difference in heritability: light green, yellow, and red indicateheritability increasing with age; dark green, blue, and purpleregions indicate decreasing heritability. A FDR threshold of q 50.05 was applied to significance maps.
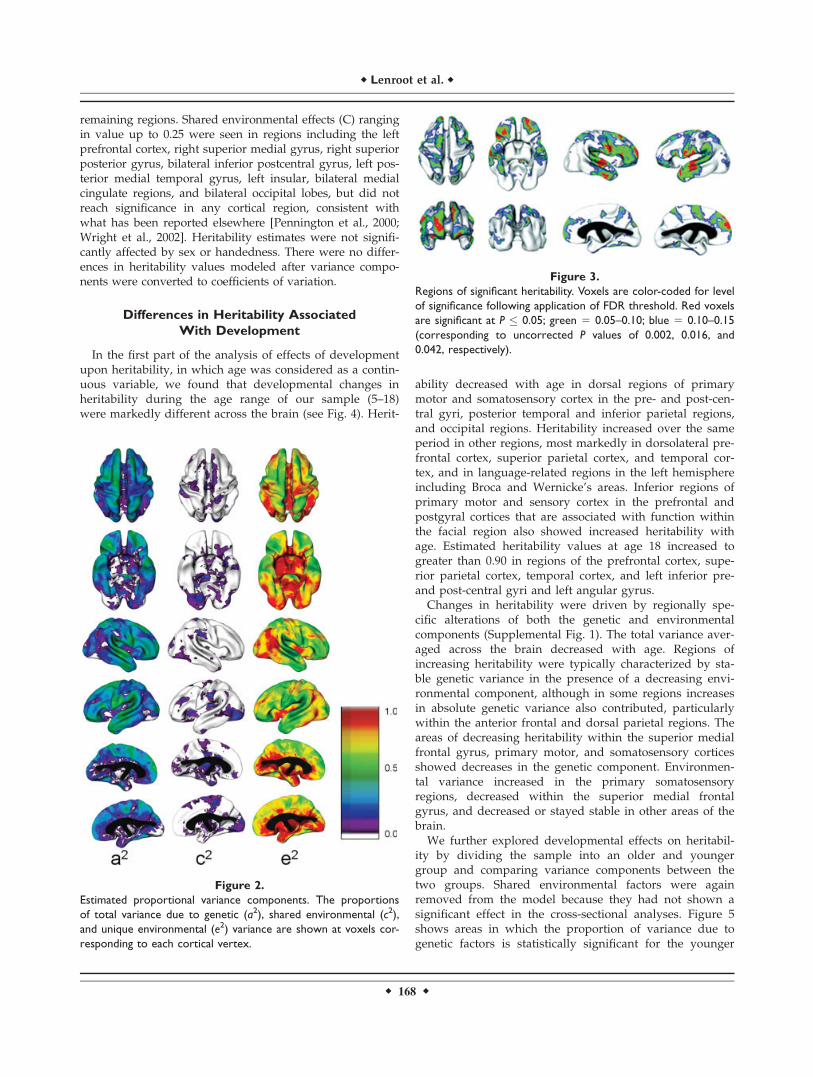
Figure 4.Heritability (a2) at ages 5, 12, and 18 years for superior, inferior,right and left cortical surfaces. Values at each age were derivedfrom the modeled interaction of age as a continuous variable withestimates of genetic and environmental variance components.Color bar shows scale of heritability values from 0.0 to 1.0.
r Lenroot et al. r
r 170 r
increased power afforded by the larger sample size, or todynamic effects of age as discussed in more detail below.It is noteworthy that many of the gyri with the highest
heritability estimates have well-documented roles in cogni-tion, speech, sociality, and language; functions thought tohave developed or been enhanced in humans relativelyrecently in evolutionary time [Fisher and Marcus, 2006].Comparative anatomic studies have demonstrated thatmany of the most prominent anatomic differences betweenhumans and nonhuman primates lie within these regionsas well, including the gyri encompassing Brodmann’sareas 9, 10, and 11 (prefrontal and orbitofrontal cortices),44 and 45 (Broca’s area), and areas 21, 22, 37, 39, and 40(superior temporal and supramarginal cortex) [Carroll,2003]. Though studies in animal models clearly demon-strate the universal importance of genes in the patterningof all brain regions [Grove and Fukuchi-Shimogori, 2003;Monuki and Walsh, 2001], the present findings show thatgenetically-mediated variance is topologically variable, atleast with respect to cortical thickness.An ongoing evolutionary process might also explain
why high genetic variability persists in relatively novelcortical regions, but not in others, as genes influencingevolutionarily ‘‘older’’ regions have had more time toreach allelic fixation (i.e., an elimination of genetic varianceat relevant loci over time due to natural selection, geneticdrift, or other evolutionary processes). An alternate, albeitrelated, explanation would be that regions with lowgenetic variance have greater functional constraints ontheir determinants of cortical thickness, such that geneticmutations influencing these regions will typically be elimi-nated quickly from the population through purifying selec-tion. Comparative genomic experiments have shown that asubset of neurally-expressed genes have evolved more rap-idly in humans than in other primates [ChimpanzeeSequencing and Analysis Consortium, 2005; Dorus et al.,2004; Khaitovich et al., 2005]; both gene expressionchanges and protein sequence modification have acceler-ated in humans relative to nonhuman primates [Cacereset al., 2003; Enard et al., 2002; Gu and Gu, 2003; Hsiehet al., 2003; Uddin et al., 2004]. The findings of increasedgenetic variance in evolutionarily recent structures mayrepresent a remnant of these rapid neurogenetic changesthat accompanied our divergence from other primates.The ACE model allows separation of familial similarity
due to shared environment (C) from that due to geneticfactors (A). In the few available studies of heritability ofbrain volumes which employed an ACE model, only thelateral ventricles have demonstrated significant contribu-tions from shared environmental factors [Baare et al., 2001;Wallace et al., 2006]. A previous study using ACE model-ing together with VBM to measure heritability of gray andwhite matter density in a sample of adult twins foundcommon environmental factors to have limited effectswithin small regions of the left amygdala, left anterior cor-pus callosum, right optic radiation, and right corticospinaltract [Hulshoff Pol et al., 2006]. In the present study, we
found that shared environmental factors had minimaleffect on cortical thickness (see Fig. 2). It has been demon-strated that a large sample is necessary to detect C [Post-huma and Boomsma, 2000], and the present study maylack sufficient power. Studies of heritability of cognitionhave found that there is a gene 3 environment interactionsuch that shared environmental factors become moreprominent relative to genetic factors as socioeconomic con-ditions worsen [Harden et al., 2007; Turkheimer et al.,2003]. The subjects in the current study came primarilyfrom middle to high socioeconomic settings. It is possiblethat if twins were recruited from across a broader range ofenvironmental conditions, shared environmental effectswould also show stronger influence on brain structure.Areas in which nongenetic factors were the chief con-
tributors to variance were extensive. It is not possible withthis study design to separate true unique environmentalinfluences from other nongenetic sources of variance,including measurement error, making interpretation moredifficult. However, it is intriguing that these areas includedthose regions associated with primary motor and sensoryfunctions, whereas stronger genetic effects were seen moreprominently in regions of association cortex. One interpre-tation may be that increased plasticity within these regionsreflects their relatively more direct interaction with theexternal environment.The discussion of the cross-sectional findings given
above should be considered in light of the other conclusionof this study, which is that heritability of brain regions dur-ing development in children and adolescents is a movingtarget. Age effects showed a similar pattern regardless ofwhether changes were modeled using age as a continuousvariable or if heritability values were calculated separatelyin younger and older children. Regions in the dorsolateralprefrontal cortex, orbitofrontal cortex, inferior postcentralgyrus, bilateral anterior and lateral superior temporal lobes,and left inferior temporal lobe showed greater heritabilityin older children, whereas regions of the superior pre- andpostcentral gyrus, medial frontal lobe, anterior cingulate,posterior superior temporal lobes, and right inferior tempo-ral lobe showed greater heritability in younger children.The modeled heritability at the oldest ages appear strik-ingly similar to those reported in the previously describedvoxel-based study in adults [Thompson et al., 2001].Current theories describe the creation of cortical areas as
occurring through the establishment of a series of geneti-cally controlled anchor points, which serve as loci for over-lapping gradients of growth factors [Grove and Fukuchi-Shimogori, 2003]. Characteristics of specific cortical areasdevelop over time in response to the local combination ofgrowth factors and activation. It has been argued that pri-mary motor and sensory cortices may serve as core anchorregions, which develop early in ontogeny through clear,strongly genetically-mediated steps [Rosa and Tweedale,2005]. The pattern observed here of genetic effects predom-inating in these core regions early in childhood may beconsistent with their relatively early development.
r Cortical Thickness Heritability in Children r
r 171 r
Conversely, later maturing areas such as the prefrontalcortex, superior temporal gyri, and superior parietal lobestend to become increasingly heritable during development.Increased heritability over childhood and adolescence hasbeen observed in cognitive traits such as IQ [Plomin et al.,1997] and prosocial behavior [Knafo and Plomin, 2006].One likely contributor to changing heritability is age-dependent gene expression [Plomin et al., 1997; Sun et al.,2005; Weickert et al., 2007]. Another potential factor isgene-environment correlation, which occurs when thesame genes affect both a trait and relevant features of theenvironment, and also acts to increase heritability values[Kendler and Baker, 2007; Scarr and McCartney, 1983].This effect may become stronger during adolescence, aschildren become more independent and able to chooseenvironments based on their genetic predispositions.Total variance decreased over much of the cortex, and in
many areas increasing heritability was due to a stablegenetic contribution in the presence of decreasing environ-mental variance. One potential explanation for the decreas-ing variance is that it represents an example of canaliza-tion, the frequently observed robustness of phenotypesagainst minor genetic or environmental perturbations[Flatt, 2005 ; Schmalhausen, 1949; Tanner, 1963; Wadding-ton, 1942]. Gene-environment interactions have been pro-posed as a mechanism by which variation can bedecreased over the course of development. Genetic deter-minants of plasticity in response to the environment mayconstrain structures to develop along a heritable trajectoryfrom an undifferentiated beginning to a genetically deter-mined mature state [Garlick, 2002]. Repetitive patterns ofactivity may also sculpt plastic developing structures. Zel-ditch et al. [2004] found that variance in murine skull mor-phometry decreased during early postnatal development.They hypothesized that high initial variance was due tothe random stresses placed on skull tissues from relativelyunorganized muscular activity early in life, and that var-iance decreased as patterns of activity took on the predict-able characteristics of maturity [Zelditch et al., 2004]. Sucha process could be relevant to activity-dependent changesin the cerebral cortex.Another constraint upon phenotypic variation is through
morphological integration. Components of complex struc-tures that are closely spatially or functionally connectedtend to show increased covariance. In a previous study ofa subset of this population, we found that variancedecreased and strength of intracortical correlationsincreased in several of the same association areas, whichdemonstrate increasing heritability in the current study[Lerch et al., 2006]. It is tempting to speculate that theseobservations may be related to the increasing functionalintegration of these areas in maturing cortical networks.The contrast between findings of increased heritability of
cortical thickness with age seen here and decreased herit-ability of lobar gray matter volumes reported in a subsetof this population [Wallace et al., 2006] appears to bedriven chiefly by differences in the interaction of environ-
mental variance with age. In the earlier report, uniqueenvironmental variance increased more than was the casefor additive genetic variance, leading to a proportionaldecrease of genetic variance and thus of heritability. In thepresent study, the effects of unique environmental factorson average decreased, causing an increase in the propor-tion of variance explained by genetic factors.Cortical gray matter volume is affected both by the
thickness of the cortex and its surface area. Cortical surfacearea shows much more variation both between and withinspecies than cortical thickness. The thickness of the cortexand its area are determined by different types of cell divi-sion during the original formation of the cortex [Rakic,1988], suggesting that cortical thickness and area may beaffected by different factors during both evolution andindividual development [Rakic, 1995]. Although develop-mental changes in both cortical thickness and surface to-pology during childhood and adolescence have beenreported [Gogtay et al., 2004; Sowell et al., 2002], little isknown about how longitudinal changes in these measure-ments may relate to each other. These findings suggestthat variations in cortical thickness and lobar volumes maybe controlled by different factors, and that caution shouldbe observed in interpreting gray matter volume and thick-ness as equivalent measures.We used a completely automated method to assess corti-
cal thickness. An advantage of an automated method isthat rater error is not a factor. A limitation common to cur-rent structural neuroimaging techniques is that the locationof specific cytoarchitecturally unique regions is estimatedbased on sulcal and gyral landmarks. It has been shownthat the actual placement of Brodmann’s areas with respectto cortical topological landmarks shows only partial over-lap between individuals [Uylings et al., 2005]. This impliesthat when brain MRIs are coregistered to a common tem-plate using surface topology, the alignment of cytoarchitec-turally similar regions between individuals is necessarilyincomplete, and consequently that heritability values forcortical thickness also reflect variation in the location ofthe boundaries of these regions.In summary, cross-sectional analysis showed that more
recently evolved regions such as the dorsal prefrontal cor-tex and orbitofrontal cortex, temporal lobes, and superiorparietal lobes showed stronger genetic influences thanphylogenetically older and earlier developing areas of thecortex. However, an exploration of age effects found thatheritability values in these areas were affected by develop-ment. The regions which developed earlier also showedstronger genetic influences earlier. Conversely, later-devel-oping regions associated with complex cognitive functionsbecame more heritable with maturation, consistent withprevious studies showing that cognitive abilities such asIQ become more heritable with maturity [Plomin et al.,1997]. These findings suggest that some areas of the cortexare likely to be more useful as intermediate phenotypesfor relating genes with behavioral features, and that stud-ies of the effects of specific genes or environmental influ-
r Lenroot et al. r
r 172 r
ences on cortical structure may be influenced by the age ofthe population under study.
REFERENCES
Chimpanzee Sequencing and Analysis Consortium (2005): Initialsequence of the chimpanzee genome and comparison with thehuman genome. Nature 437:69–87.
Baare WF, Hulshoff Pol HE, Boomsma DI, Posthuma D, de GeusEJ, Schnack HG, van Haren NE, van Oel CJ, Kahn RS (2001):Quantitative genetic modeling of variation in human brainmorphology. Cereb Cortex 11:816–824.
Boomsma D, Busjahn A, Peltonen L (2002): Classical twin studiesand beyond. Nat Rev Genet 3:872–82.
Caceres M, Lachuer J, Zapala MA, Redmond JC, Kudo L, Gesch-wind DH, Lockhart DJ, Preuss TM, Barlow C (2003): Elevatedgene expression levels distinguish human from non-humanprimate brains. Proc Natl Acad Sci USA 100:13030–13035.
Carroll SB (2003): Genetics and the making of Homo sapiens. Na-ture 422:849–857.
Collins DL, Neelin P, Peters TM, Evans AC (1994): Automatic 3Dintersubject registration of MR volumetric data in standardizedTalairach space. J Comput Assist Tomogr 18:192–205.
Collins DL, Zijdenbos AP, Baare WFC, Evans AC (1999): ANIMAL-INSECT: Improved Cortical Structure Segmentation. Proceedingsof the Annual Conference on Information Processing in MedicalImaging (IPMI). Visegrad, Hungary: Springer. pp 210–223.
Dorus S, Vallender EJ, Evans PD, Anderson JR, Gilbert SL, Maho-wald M, Wyckoff GJ, Malcom CM, Lahn BT (2004): Acceleratedevolution of nervous system genes in the origin of Homo sapi-ens. Cell 119:1027–1040.
Edwards AWF. 1972. Likelihood; an account of the statistical con-cept of likelihood and its application to scientific inference.Cambridge [Eng.]: University Press. xv, 235 pp.
Enard W, Khaitovich P, Klose J, Zollner S, Heissig F, Giavalisco P,Nieselt-Struwe K, Muchmore E, Varki A, Ravid R, DoxiadisGM, Bontrop RE, Paabo S (2002): Intra- and interspecific varia-tion in primate gene expression patterns. Science 296:340–343.
Fisher SE, Marcus GF (2006): The eloquent ape: Genes, brains andthe evolution of language. Nat Rev Genet 7:9–20.
Flatt T (2005): The evolutionary genetics of canalization. Q RevBiol 80:287–316.
Garlick D (2002): Understanding the nature of the general factor ofintelligence: The role of individual differences in neural plastic-ity as an explanatory mechanism. Psychol Rev 109:116–136.
Genovese CR, Lazar NA, Nichols T (2002): Thresholding of statis-tical maps in functional neuroimaging using the false discoveryrate. Neuroimage 15:870–878.
Geschwind DH, Miller BL, DeCarli C, Carmelli D (2002): Heritabil-ity of lobar brain volumes in twins supports genetic models ofcerebral laterality and handedness. Proc Natl Acad Sci USA99:3176–3181.
Glahn DC, Thompson PM, Blangero J (2007): Neuroimaging endo-phenotypes: Strategies for finding genes influencing brainstructure and function. Hum Brain Mapp 28:488–501.
Gogtay N, Giedd JN, Lusk L, Hayashi KM, Greenstein D, VaituzisAC, Nugent TF 3rd, Herman DH, Clasen LS, Toga AW, Rapo-port JL, Thompson PM (2004): Dynamic mapping of humancortical development during childhood through early adult-hood. Proc Natl Acad Sci USA 101:8174–8179.
Grove EA, Fukuchi-Shimogori T (2003): Generating the cerebralcortical area map. Annu Rev Neurosci 26:355–380.
Gu J, Gu X (2003): Induced gene expression in human brain afterthe split from chimpanzee. Trends Genet 19:63–65.
Harden KP, Turkheimer E, Loehlin JC (2007): Genotype by envi-ronment interaction in adolescents’ cognitive aptitude. BehavGenet 37:273–283.
Hollingshead AdB, Redlich FC (1958): Social Class and Mental Ill-ness; A Community Study. New York: Wiley. ix, 442 p.
Hsieh WP, Chu TM, Wolfinger RD, Gibson G (2003): Mixed-modelreanalysis of primate data suggests tissue and species biases inoligonucleotide-based gene expression profiles. Genetics 165:747–757.
Hulshoff Pol HE, Schnack HG, Posthuma D, Mandl RC, BaareWF, van Oel C, van Haren NE, Collins DL, Evans AC, AmuntsK, Burgel U, Zilles K, de Geus E, Boomsma DI, Kahn RS(2006): Genetic contributions to human brain morphology andintelligence. J Neurosci 26:10235–10242.
Kabani N, Le Goualher G, MacDonald D, Evans AC (2001): Mea-surement of cortical thickness using an automated 3-D algo-rithm: A validation study. Neuroimage 13:375–380.
Kendler KS, Baker JH (2007): Genetic influences on measures ofthe environment: A systematic review. Psychol Med 37:615–626.
Khaitovich P, Hellmann I, Enard W, Nowick K, Leinweber M,Franz H, Weiss G, Lachmann M, Paabo S (2005): Parallel pat-terns of evolution in the genomes and transcriptomes ofhumans and chimpanzees. Science 309:1850–1854.
Kim JS, Singh V, Lee JK, Lerch J, Ad-Dab’bagh Y, MacDonald D,Lee JM, Kim SI, Evans AC (2005): Automated 3-D extractionand evaluation of the inner and outer cortical surfaces using aLaplacian map and partial volume effect classification. Neuro-image 27:210–221.
Knafo A, Plomin R (2006): Prosocial behavior from early to middlechildhood: Genetic and environmental influences on stabilityand change. Dev Psychol 42:771–786.
Lenroot RK, Gogtay N, Greenstein D, Molloy E, Wallace GL, Vai-tuzis AC, Clasen LS, Blumenthal J, Lerch J, van Zijdenbos A,Evans AC, Thompson PM, Giedd JN (2005): Sexual dimor-phism of brain developmental trajectories during childhoodand adolescence. NeuroImage, published online, April 6, 2007,doi: 10.1016/j.neuroimage.2007.03/053.
Lerch JP, Evans AC (2005): Cortical thickness analysis examinedthrough power analysis and a population simulation. Neuro-image 24:163–173.
Lerch JP, Pruessner JC, Zijdenbos A, Hampel H, Teipel SJ, EvansAC (2005): Focal decline of cortical thickness in Alzheimer’sdisease identified by computational neuroanatomy. Cereb Cor-tex 15:995–1001.
Lerch JP, Worsley K, Shaw WP, Greenstein DK, Lenroot RK,Giedd J, Evans AC (2006): Mapping anatomical correlationsacross cerebral cortex (MACACC) using cortical thickness fromMRI. Neuroimage 31:993–1003.
MacDonald D, Kabani N, Avis D, Evans AC (2000): Automated 3-D extraction of inner and outer surfaces of cerebral cortex fromMRI. Neuroimage 12:340–356.
Monuki ES, Walsh CA (2001): Mechanisms of cerebral cortical pat-terning in mice and humans. Nat Neurosci 4 (Suppl):1199-1206.
Neale MC, Boker SM, Xie G, Maes HH (1999): Statistical Modeling,5th ed. Richmond, VA: Department of Psychiatry, VirginiaCommonwealth University.
Neale MC, Cardon LR, North Atlantic Treaty Organization. Scien-tific Affairs Division (1992): Methodology for Genetic Studiesof Twins and Families. Dordrecht, The Netherlands: Kluwer.xxv, 496 pp.
r Cortical Thickness Heritability in Children r
r 173 r
Neale MC, Miller MB (1997): The use of likelihood-based confi-dence intervals in genetic models. Behav Genet 27:113–120.
Pennington BF, Filipek PA, Lefly D, Chhabildas N, Kennedy DN,Simon JH, Filley CM, Galaburda A, DeFries JC (2000): A twinMRI study of size variations in human brain. J Cogn Neurosci12:223–232.
Plomin R, Craig I (1997): Human behavioural genetics of cognitiveabilities and disabilities. Bioessays 19:1117–1124.
Plomin R, Fulker D, Corley R, DeFries J (1997): Nature, nurture,and cognitive development from 1 to 16 years: A parent-off-spring adoption study. Psychol Sci 8:442–447.
Posthuma D, Boomsma DI (2000): A note on the statistical powerin extended twin designs. Behav Genet 30:147–158.
Posthuma D, De Geus EJ, Neale MC, Hulshoff Pol HE, Baare WEC,Kahn RS, Boomsma D (2000): Multivariate genetic analysis of brainstructure in an extended twin design. Behav Genet 30:311–319.
Purcell S (2002): Variance components models for gene-environ-ment interaction in twin analysis. Twin Res 5:554–571.
R Development Core Team (2006): R: A language and environ-ment for statistical computing. Vienna, Austria: R Foundationfor Statistical Computing.
Rakic P (1988): Specification of cerebral cortical areas. Science 241:170–176.
Rakic P (1995): A small step for the cell, a giant leap for mankind:A hypothesis of neocortical expansion during evolution.Trends Neurosci 18:383–388.
Rakic P, Ang E, Breunig J. 2004. Setting the stage for cognition:genesis of the primate cerebral cortex. In: Gazzaniga MS, editor.The Cognitive Neurosciences, 3rd ed. Cambridge, Massachu-setts: MIT Press. pp 33–49.
Reveley AM, Reveley MA, Chitkara B, Clifford C (1984): The geneticbasis of cerebral ventricular volume. Psychiatry Res 13:261–266.
Robbins S, Evans AC, Collins DL, Whitesides S (2004): Tuning andcomparing spatial normalization methods. Med Image Anal 8:311–323.
Roland PE, Zilles K (1998): Structural divisions and functionalfields in the human cerebral cortex. Brain Res Brain Res Rev26(2/3):87–105.
Rosa MG, Tweedale R (2005): Brain maps, great and small: Les-sons from comparative studies of primate visual cortical orga-nization. Philos Trans R Soc Lond B Biol Sci 360:665–691.
Rutter M, Moffitt TE, Caspi A (2006): Gene-environment interplayand psychopathology: Multiple varieties but real effects.J Child Psychol Psychiatry 47(3/4):226-261.
Scarr S, McCartney K (1983): How people make their own envi-ronments: A theory of genotype greater than environmenteffects. Child Dev 54:424–435.
Schmalhausen II (1949): Factors of evolution: The Theory of Stabi-lizing Selection. Chicago: University of Chicago Press.
Shaw P, Greenstein D, Lerch J, Clasen L, Lenroot RK, Gogtay N,Evans A, Rapoport JL, Giedd J (2006): Intellectual ability and corti-cal development in children and adolescents. Nature 440:676–679.
Sled JG, Zijdenbos AP, Evans AC (1998): A nonparametric methodfor automatic correction of intensity nonuniformity in MRIdata. IEEE Trans Med Imaging 17:87–97.
Sowell ER, Thompson PM, Rex D, Kornsand D, Tessner KD,Jernigan TL, Toga AW (2002): Mapping sulcal pattern asym-metry and local cortical surface gray matter distributionin vivo: Maturation in perisylvian cortices. Cereb Cortex 12:17–26.
Sun T, Patoine C, Abu-Khalil A, Visvader J, Sum E, Cherry TJ,Orkin SH, Geschwind DH, Walsh CA (2005): Early asymmetryof gene transcription in embryonic human left and right cere-bral cortex. Science 308:1794–1798.
Tanner JM (1963): The regulation of human growth. Child Dev34:817–847.
Thompson PM, Cannon TD, Narr KL, van Erp T, Poutanen VP,Huttunen M, Lonnqvist J, Standertskjold-Nordenstam CG,Kaprio J, Khaledy M, Dail R, Zoumalan CI, Toga AW (2001):Genetic influences on brain structure. Nat Neurosci 4:1253–1258.
Tramo MJ, Loftus WC, Stukel TA, Green RL, Weaver JB, Gazza-niga MS (1998): Brain size, head size, and intelligence quotientin monozygotic twins. Neurology 50:1246–1252.
Turkheimer E, Haley A, Waldron M, D’Onofrio B, Gottesman, II(2003): Socioeconomic status modifies heritability of IQ inyoung children. Psychol Sci 14:623–628.
Uddin M, Wildman DE, Liu G, Xu W, Johnson RM, Hof PR, Kapa-tos G, Grossman LI, Goodman M (2004): Sister grouping ofchimpanzees and humans as revealed by genome-wide phylo-genetic analysis of brain gene expression profiles. Proc NatlAcad Sci USA 101:2957–2962.
Uylings HB, Rajkowska G, Sanz-Arigita E, Amunts K, Zilles K(2005): Consequences of large interindividual variability forhuman brain atlases: Converging macroscopical imaging andmicroscopical neuroanatomy. Anat Embryol (Berl) 210(5/6):423–431.
Waddington CH (1942): Canalization of development and the in-heritance of acquired characters. Nature 150:563–565.
Wallace GL, Schmitt JE, Lenroot RK, Viding E, Ordaz S, RosenthalMA, Molloy E, Clasen L, Kendler KS, Neale MC, Giedd JN(2006): A pediatric twin study of brain morphometry. Journalof Child Psychology and Psychiatry 47:987–993.
Weickert CS, Webster MJ, Gondipalli P, Rothmond D, Fatula RJ,Herman MM, Kleinman JE, Akil M (2007): Postnatal alterationsin dopaminergic markers in the human prefrontal cortex. Neu-roscience 144:1109–1119.
White T, Andreasen NC, Nopoulos P (2002): Brain volumes andsurface morphology in monozygotic twins. Cereb Cortex12:486–493.
Wright IC, Sham P, Murray RM, Weinberger DR, Bullmore ET(2002): Genetic contributions to regional variability in humanbrain structure: Methods and preliminary results. Neuroimage17:256–271.
Zelditch ML, Lundrigan BL, Garland T Jr (2004): Developmentalregulation of skull morphology. I. Ontogenetic dynamics ofvariance. Evol Dev 6:194–206.
Zijdenbos AP, Forghani R, Evans AC (2002): Automatic ‘‘pipeline’’analysis of 3-D MRI data for clinical trials: Application to mul-tiple sclerosis. IEEE Trans Med Imaging 21:1280–1291.
r Lenroot et al. r
r 174 r