BioOne sees sustainable scholarly publishing as an inherently collaborative enterprise connecting authors, nonprofit publishers, academic institutions,research libraries, and research funders in the common goal of maximizing access to critical research.
Carbon and Water Fluxes in an Exotic Buffelgrass SavannaAuthor(s): César Hinojo-Hinojo, Alejandro E. Castellanos, Julio César Rodriguez, Josué Delgado-Balbuena, José R. Romo-León, Hernán Celaya-Michel, Travis E. HuxmanSource: Rangeland Ecology & Management, 69(5):334-341.Published By: Society for Range ManagementURL: http://www.bioone.org/doi/full/10.1016/j.rama.2016.04.002
BioOne (www.bioone.org) is a nonprofit, online aggregation of core research in the biological, ecological,and environmental sciences. BioOne provides a sustainable online platform for over 170 journals and bookspublished by nonprofit societies, associations, museums, institutions, and presses.
Your use of this PDF, the BioOne Web site, and all posted and associated content indicates your acceptance ofBioOne’s Terms of Use, available at www.bioone.org/page/terms_of_use.
Usage of BioOne content is strictly limited to personal, educational, and non-commercial use. Commercialinquiries or rights and permissions requests should be directed to the individual publisher as copyright holder.
Carbon and Water Fluxes in an Exotic Buffelgrass Savanna☆
César Hinojo-Hinojo a, Alejandro E. Castellanos b,⁎, Julio César Rodriguez c, Josué Delgado-Balbuena d,José R. Romo-León b, Hernán Celaya-Michel b,c, Travis E. Huxman e
a PhD student, BioSciences Graduate Program, Universidad de Sonora (DICTUS), Blvd. L.D. Colosio y Reforma, Hermosillo, Sonora 83000, Méxicob Research Professor Department Investigaciones Científicas Tecnológicas, Universidad de Sonora (DICTUS), Blvd. L.D. Colosio y Reforma, Hermosillo, Sonora 83000, Méxicoc Research Professor, Department Agricultura y Ganadería, Universidad de Sonora, Blvd. L. Encinas y Rosales, Hermosillo, Sonora 83000, Méxicod Research Professor, División de Ciencias Ambientales, Instituto Potosino de Investigación Científica y Tecnológica A. C., Camino a la Presa San José 2055, San Luis Potosí, S.L.P. 78216, Mexicoe Research Professor Ecology and Evolutionary Biology, Center for Environmental Biology, University of California—Irvine, Irvine, CA 92629, USA.
a b s t r a c ta r t i c l e i n f o
Article history:Received 6 October 2015Received in revised form 1 April 2016Accepted 19 April 2016
Key Words:arid lands transformationbuffelgrassCenchrus ciliariseddy covarianceevapotranspirationnet ecosystem exchange
Buffelgrass savanna is becoming widespread in aridland ecosystems around the world following invasion ordeliberate land conversion for cattle forage. There is still a gap of information regarding functional andecohydrological aspects such as carbon, water, and greenhouse gas exchanges in these highly productive novelecosystems where buffelgrass is an exotic species. Wemeasured net ecosystem CO2 exchange (NEE), ecosystemrespiration (Reco), gross primary production (GPP), and evapotranspiration (ET) with eddy covariance tech-niques over a buffelgrass savanna established for cattle grazing, approximately 30 yr ago within the SonoranDesert. The savanna was a net carbon sink (NEE −230 g C/m2/yr) during both a year with above average andone with below-average precipitation (NEE −84 g C/m2/yr). Water loss through evapotranspiration (ET) wassimilar to total annual rainfall input. Up to 62% of the annual fixed carbon and 75% of ET occurred during thesummer monsoon season, when 72−86% of annual rainfall occurred and buffelgrass was active. ET fromsummer months explained 73% of variation in NEE, with an average ET of 50 mm H2O/month needed toturn the ecosystem into a net carbon sink during this season. Other seasons in the year, when buffelgrasswas dormant, contributed with up to 48% of annual fixed carbon but with higher water use efficiency(−NEE/ET).Wediscuss the importance of the seasonal variability in Reco, GPP, and ET processes and the phenologyof native plant species for the net carbon uptake through the year for this managed novel ecosystem.
© 2016 The Society for Range Management. Published by Elsevier Inc. All rights reserved
Introduction
Aridland ecosystems represent close to 50% of the earth’s surface, andmore thanhalf of those have seen changes in vegetation that could impactecosystemgoods and services (Reynolds and Stafford-Smith, 2002). Shiftsin land use and cover are the second most important components ofglobal change in arid and semiarid lands worldwide (Lal, 2001; Hassanet al., 2005), following rangeland degradation for cattle production(Walker, 1979; Lambin et al., 2003). Since the middle of the past century,ecosystems dominated by perennial African grasses have been inten-tionally established in aridlands worldwide in order to increase vegeta-tion cover, forage, and cattle production following arid rangelanddegradation (Cox et al., 1988; Williams and Baruch, 2000; Belnap
et al., 2012). Understanding what governs the structure and functionof these novel, widespread ecosystems is a key management concern.
Buffelgrass (Cenchrus ciliaris L.) was one of those grasses successfullyintroduced worldwide (Herbel, 1979; Cox et al., 1988). Buffelgrass-dominated ecosystems are intentionally established through landclearing of native vegetation and seeding cover from this grass. Thisresults in savanna-like ecosystems when some native woody plantsare maintained for shade or have recolonized the area. Extensive trans-formations to buffelgrass savannas have happened in the past 3 decades,especially in Australia and North America, where expansive buffelgrasssavannas are now common (Arriaga et al., 2004; Miller et al., 2010;Marshall et al., 2012). In northwestern Mexico alone, it is estimatedthat between 1 and 1.8 million hectares of historically arid/semiaridshrublands and tropical deciduous forests have been transformed tobuffelgrass savanna (Burquez et al., 1998; Castellanos et al., 2002;Bravo-Peña and Castellanos, 2013).
Most research on exotic buffelgrass-dominated ecosystems hasfocused on describing biodiversity implications of its establishmentand its characteristics as invasive species (see Marshall et al., 2012).Regarding this, studies have described how buffelgrass accelerates thefire-return intervals (D’Antonio and Vitousek, 1992; Butler and Fairfax,
Rangeland Ecology & Management 69 (2016) 334–341
☆ No funding source was involved in publishing this paper. C.H.H. and H.C.M. thankCONACYT for support as a scholarship to Posgrado en Biociencias at DICTUS and A.E.C.V.for grant support to this project (CB61865 and INF2012/1-188387). A.E.C.V. benefittedfrom Universidad de Sonora, PIFI-SEP support to set the eddy flux tower.⁎ Correspondence: Alejandro E. Castellanos, Dept Investigaciones Científicas
Tecnológicas, Universidad de Sonora (DICTUS), Blvd. L.D. Colosio y Reforma, Hermosillo,Sonora 83000, México. Tel.: +52 662 2592169; fax: +52 662 2592197.
E-mail addresses: [email protected], [email protected] (A.E. Castellanos).
http://dx.doi.org/10.1016/j.rama.2016.04.0021550-7424/© 2016 The Society for Range Management. Published by Elsevier Inc. All rights reserved
Contents lists available at ScienceDirect
Rangeland Ecology & Management
j ourna l homepage: ht tp: / /www.e lsev ie r .com/ locate/ rama
2003; McDonald andMcPherson, 2011), reduces plant species diversity(Saucedo-Monarque et al., 1997), intensifies competition (Eilts andHuxman, 2013), or suppresses regeneration (Morales-Romero andMolina-Freaner, 2008). However, there is still a gap of information re-garding functional and ecohydrological aspects such as carbon, water,and greenhouse gas exchanges in these widespread buffelgrass-dominated ecosystems (Wilcox et al., 2012).
Estimates of biomass production in exotic buffelgrass savannasrange from b 465 and up to 3,045 kg/ha (Martin et al., 1995; Rao et al.,1996). Many factorsmay be contributing to such variation in productiv-ity, such as management schemes, seed viability and abundance, seed-ling establishment success, nutrient and water availability and use,and microclimatic conditions (Martín et al., 1999; Castellanos et al.,2002; Celaya-Michel et al., 2015). While biomass production is impor-tant in the context of range management and forage production, otherproduction estimates such as whole ecosystem carbon dioxide (CO2)flux and water use efficiency (the amount of carbon fixed per unit ofwater loss through evapotranspiration [ET]) can provide insight intoecosystem function. In northwestern Mexico and the southwesternUnited States, whole ecosystem fluxes may be influenced by itsbiseasonal rainfall pattern, where most annual rainfall occurs insummer months due to monsoon storms and from late fall and winterrains (Brito-Castillo et al., 2010). Given the range of values in the litera-ture and the uncertainty associated with how environmental and bio-logical variables drive productivity in buffelgrass savannas, continuousmeasurements of ecosystem carbon and water exchange may achievesubstantial understanding to guide decision makers, especially wherethere are implications of carbon sequestration.
The eddy covariance (EC) technique provides a continuous measureof ecosystem productivity by estimating CO2, water (H2O), and energyfluxes between the land-surface and surrounding atmosphere(Baldocchi, 2003) and has been used at multiple ecosystems acrossthe world (Baldocchi et al., 2001). In this study, we document carbon(CO2 net ecosystem exchange [NEE], gross primary productivity, andecosystem respiration) and water (ET) flux dynamics of an exoticbuffelgrass savanna established through the transformation of an aridshrubland within the Sonoran Desert. We used EC technique to answerthe following questions: 1) What are the dynamics of CO2 and waterfluxes in an exotic buffelgrass savanna? 2) How does the biseasonal
rainfall pattern from the Sonoran Desert region drive those CO2 andwater fluxes? and 3) How big are interannual seasonal differences incarbon and water fluxes? Data that address these questions will allowus to understand a baseline response of buffelgrass savanna bio-sphere/atmosphere exchanges in the context of seasonal and interan-nual environmental variability.
Materials and Methods
Study Site
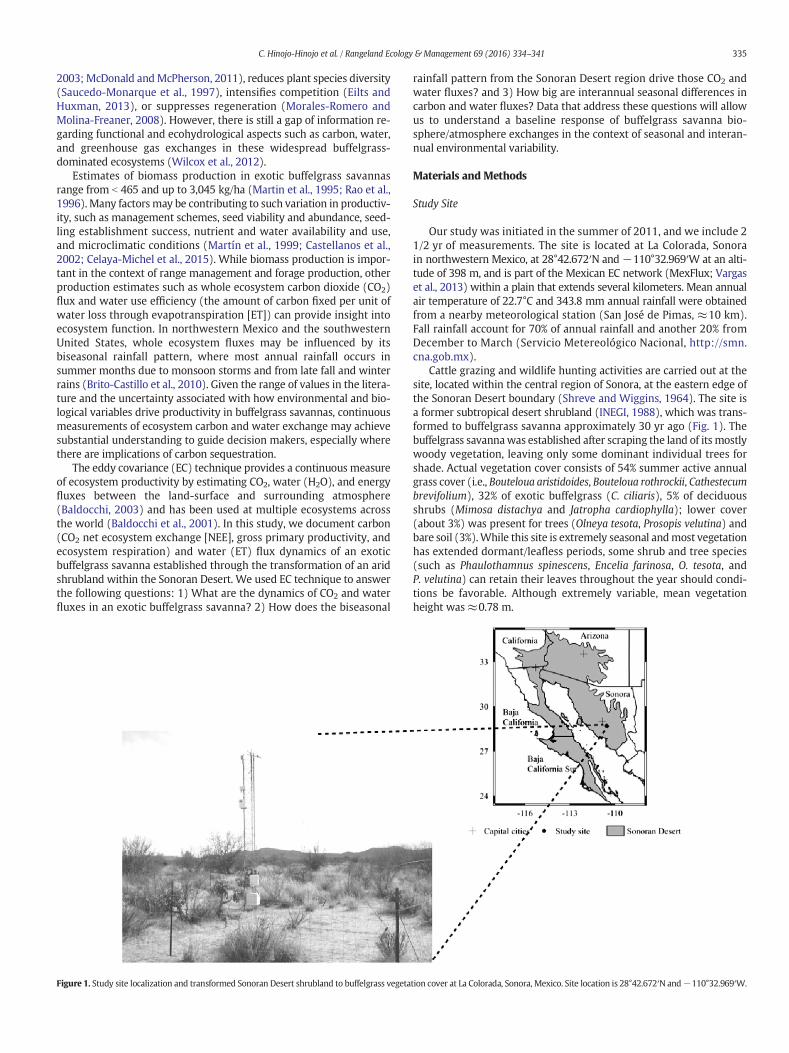
Our study was initiated in the summer of 2011, and we include 21/2 yr of measurements. The site is located at La Colorada, Sonorain northwestern Mexico, at 28°42.672′N and −110°32.969′W at an alti-tude of 398 m, and is part of the Mexican EC network (MexFlux; Vargaset al., 2013) within a plain that extends several kilometers. Mean annualair temperature of 22.7°C and 343.8 mm annual rainfall were obtainedfrom a nearby meteorological station (San José de Pimas, ≈10 km).Fall rainfall account for 70% of annual rainfall and another 20% fromDecember to March (Servicio Metereológico Nacional, http://smn.cna.gob.mx).
Cattle grazing and wildlife hunting activities are carried out at thesite, located within the central region of Sonora, at the eastern edge ofthe Sonoran Desert boundary (Shreve and Wiggins, 1964). The site isa former subtropical desert shrubland (INEGI, 1988), which was trans-formed to buffelgrass savanna approximately 30 yr ago (Fig. 1). Thebuffelgrass savannawas established after scraping the land of its mostlywoody vegetation, leaving only some dominant individual trees forshade. Actual vegetation cover consists of 54% summer active annualgrass cover (i.e., Bouteloua aristidoides, Bouteloua rothrockii, Cathestecumbrevifolium), 32% of exotic buffelgrass (C. ciliaris), 5% of deciduousshrubs (Mimosa distachya and Jatropha cardiophylla); lower cover(about 3%) was present for trees (Olneya tesota, Prosopis velutina) andbare soil (3%).While this site is extremely seasonal andmost vegetationhas extended dormant/leafless periods, some shrub and tree species(such as Phaulothamnus spinescens, Encelia farinosa, O. tesota, andP. velutina) can retain their leaves throughout the year should condi-tions be favorable. Although extremely variable, mean vegetationheight was≈0.78 m.
Figure 1. Study site localization and transformed Sonoran Desert shrubland to buffelgrass vegetation cover at La Colorada, Sonora, Mexico. Site location is 28°42.672′N and−110°32.969′W.
335C. Hinojo-Hinojo et al. / Rangeland Ecology & Management 69 (2016) 334–341
Measurement of CO2, Water Fluxes, and Other Environmental Variables
A 6-m-high EC tower was installed at the site, and CO2 and waterfluxes were monitored from August 2011 until the end of 2013. Thetower stands in the middle of the buffelgrass savanna with homogenousvegetation cover present in a 1-km radius, with the longer extentof consistent vegetation occurring in the southwest direction, whichalsowas the direction of the prevailingwinds. The flux tower is equippedwith a three-dimensional sonic anemometer (CSAT-3, CampbellScientific, Logan, UT) and a CO2 and H2O infrared gas analyzer (LI-7500,LI-COR Biosciences, Lincoln, NE) at the top (at 6-m height), both orientedto the direction of the prevailingwinds (see Fig. 1). The top of the tower isinstrumentedwith relative humidity and temperature sensors (HMP45C,Vaisala Inc., Vantaa, Finland) and a net radiometer (NR-Lite, Kippand Zonen, Delft, The Netherlands). Near the base and at 10 cm depth,four soil heat flux plates (HFP01-L50, Campbell Scientific) and twothermocouples (TCAV, Campbell Scientific), as well as two mois-ture sensors (CS-616, Campbell Scientific), were distributed underintercanopy and buffelgrass soil conditions. Precipitationwasmeasuredwith a TR-525USW-R3 (Texas Electronics, Dallas, TX) rain gauge. Sonicanemometer and gas analyzer data were recorded at a 10-Hz frequen-cy; relative humidity, air temperature, and net radiometer were record-ed every minute, while soil temperature, heat flux and moisture, andprecipitation every 15 minutes using a CR3000 datalogger (CampbellScientific).
With the 10-Hz frequency data, fluxes of NEE, ET, latent (LE), andsensible heat (H) were calculated in 30-minute blocks using EddyPro4.0 (LI-COR Biosciences). Raw data were processed to assess theirstatistical quality including spike removal, amplitude resolution, anddrop-outs, using parameters similar to Vickers and Mahrt (1997).Corrections performed on raw data included double axis rotation forsonic anemometer tilt correction and covariance maximization withcircular correlation for time lag compensation between sonic ane-mometer and gas analyzer measurement (Wilczak et al., 2001). Fluxesobtained were then corrected for high- and low-frequency spectralattenuations (Moncrieff et al., 1997, 2004) and humidity effects onsonic temperature (van Dijk et al., 2004) and then compensated forair density fluctuations (Webb et al., 1980). The storage term for theNEE was determined with only CO2 measurements at the top of thetower, as they provide a reasonable estimate for such term (Finnigan,2006), using the already mentioned software.
We used the Mauder and Foken (2011) method for quality assess-ment of flux data. According to this method, values of 0 and 1 haveacceptable quality, while values of 2 have bad quality and are eliminated,resulting in data gaps. Threshold values for friction velocity were deter-mined to filter lower data using the online tool developed by the MaxPlanck Institute for Biogeochemistry (available at http://www.bgc-jena.mpg.de/~MDIwork/eddyproc/index.php). Flux data with acceptablequality represented 43.1%, 73.8%, and 74.2% for NEE, LE, and H data forthe study period in 2011; 51.7%, 91.7%, and 91.8% for 2012; and 59.6%,92.1%, and 92.1% for 2013. Data gap filling was performed with thesame online tool following Reichstein et al. (2005) using net radiation,air temperature, and water vapor deficit data. NEE was partitioned inecosystem respiration (Reco) and gross primary productivity (GPP)using the Lloyd and Taylor (1994) regression model, available withinthe same online tool that uses an improved algorithm (Reichstein et al.,2005). We express CO2 and H2O fluxes from the atmosphere to theecosystem (carbon uptake) as negative values, while fluxes from theecosystem toward the atmosphere (carbon losses) are positive values.Thisway, GPPwill always appear as negative, while Reco and evapotrans-piration (ET) appear as positive values.
Phenological changeswere described for the site using the normalizeddifference vegetation index (NDVI). Data were obtained for 25 pixels(≈1.5 km2)within the buffelgrass savanna from 16-day composite satel-lite images from MODIS Land Product Subsets from Oak Ridge NationalLaboratory Distributed Archive Center (ORNL DAAC) at http://daac.ornl.
gov/MODIS/. Higher NDVI values indicate higher greenness and thereforehigher ecosystem metabolic activity, while lower values represent areduction in greenness and senescence of vegetation. NDVI may beinfluenced by phenological phases, primary productivity, and chlorophylldensity (Huete et al., 2011). Additionally, species leaf phenology wastracked for dominant species (N 0.5% cover) in 10 individuals at differenttimes during the year. A species was considered to have green leaveswhen N 60% of its individuals had some leaves present.
Data Analysis
Thirty-minute average CO2 andevapotranspirationfluxdatawere inte-grated to obtain daily values, and thosewere added to assessmonthly, sea-sonal, and annual performance. Ecosystem water-use efficiency (WUEe)was obtained frommonthly, seasonal, and annual NEE-to-ET ratio:
WUEe ¼ −NEE=ET ð1Þ
Daily NEE, Reco, GPP, ET, andWUEewere compared between differentmonths throughout the year using the Tukey HSD test. We obtainedmean diurnal course values for every month to obtain a visualization ofthe seasonal responses driving diel patterns of GPP, Reco, and ET overthe study period. Energy budget closure for the site was assessed tovalidate flux measurements using daily data (Burba, 2013).
Results
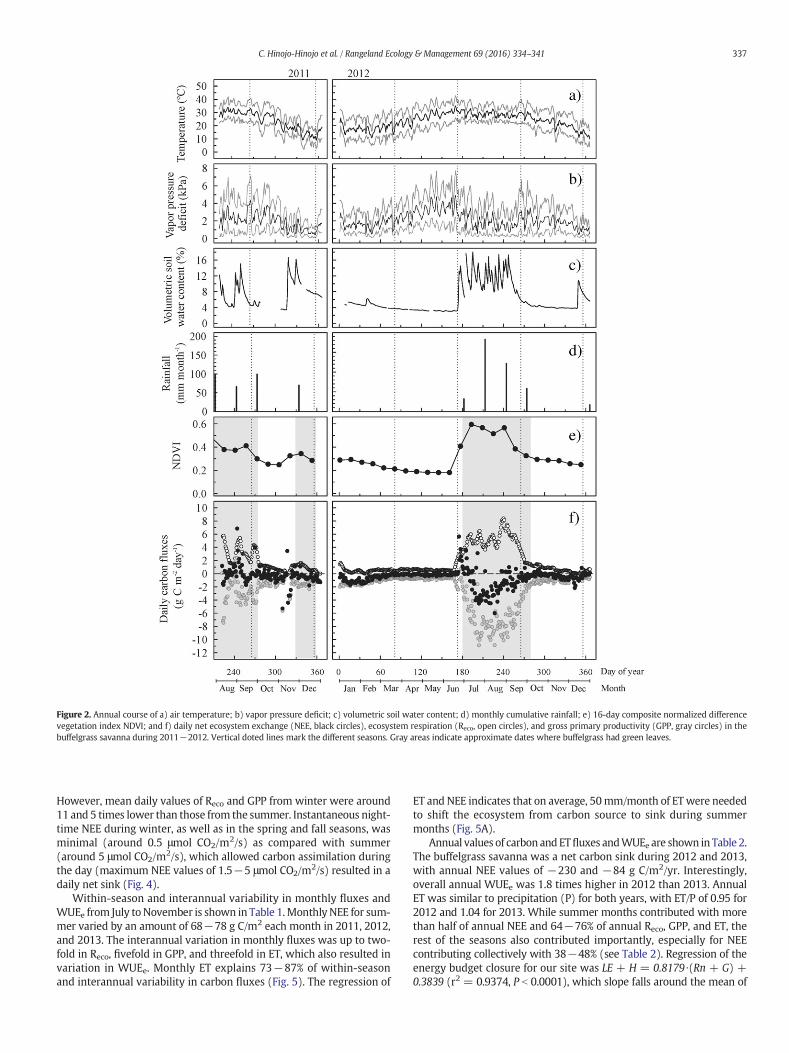
During the study, annual rainfall at the site varied from belowaverage (in 2011 and 2013 with 259 and 253 mm, respectively) toabove the historic mean (in 2012 with 420 mm). Before the start ofour flux measurements, the site had experienced an extended periodof 9 months with no measurable rainfall (from September 2010 toJune 2011). A large percentage of annual rainfall, 72−86%, was relatedto the summermonsoon (July to September; Fig. 2d),which varied from190 to 200 mm in 2011 and 2013 and 364 mm in 2012.
The annual course of meteorological conditions is illustrated withdata from 2012 (Fig. 2a−2d). The highest air temperatures (meanand maximum temperatures around 30°C and 37°C, respectively) ofthe year occurred in May and June and were associated with theforesummer dry period before the summer rainfall season and in lateSeptember with the drop in soil water content after the rainy season.The highest vapor pressure deficits (above 6 kPa) coincided with thehighest peaks in air temperature. The lowest air temperatures andvapor pressure deficits of the year occurred during winter (meantemperature of 17°C and maximum vapor pressure deficit of 2.7 kPa).
The annual course of daily carbon fluxes is also illustrated with datafrom2012 (Fig. 2f).During summer, a peak of net C efflux occurredwiththe start of the summer rains and initial canopy development, whichlasted around 2 wk. After this peak, NEE was mostly negative through-out the summer but varied from +3 to −6 g C/m2/day with both pos-itive and negative peaks corresponding to changes in soil water content(Fig. 2c and 2f). Coincident with this period of net carbon uptake duringsummer, a peak of canopy development occurred (NDVI above 0.4)where all species were active, and the highest GPP and Reco of the year(up to −11 and 8 g C/m2/day, respectively). During the rest of theyear NEE was relatively low with an interquartile range of −0.1 to−0.6 g C/m2/day while soil water was generally below 6%, althoughnet carbon uptake of up to −1.5 g C/m2/day occurred during winter.According to our leaf phenology data, buffelgrass was mostly dormantfrom October to June while species such as Encelia farinosa retainedgreen leaves until April and O. tesota, P. velutina, and P. spinescensthroughout the whole year. The savanna was a carbon sink duringmost of the year (85% or 313 of days had negative NEE during 2012,and 71% or 261 days during 2013).
Mean daily values of NEE during a winter when prior late-fall rainsoccurred were comparable with those of the summer months (Fig. 3).
336 C. Hinojo-Hinojo et al. / Rangeland Ecology & Management 69 (2016) 334–341
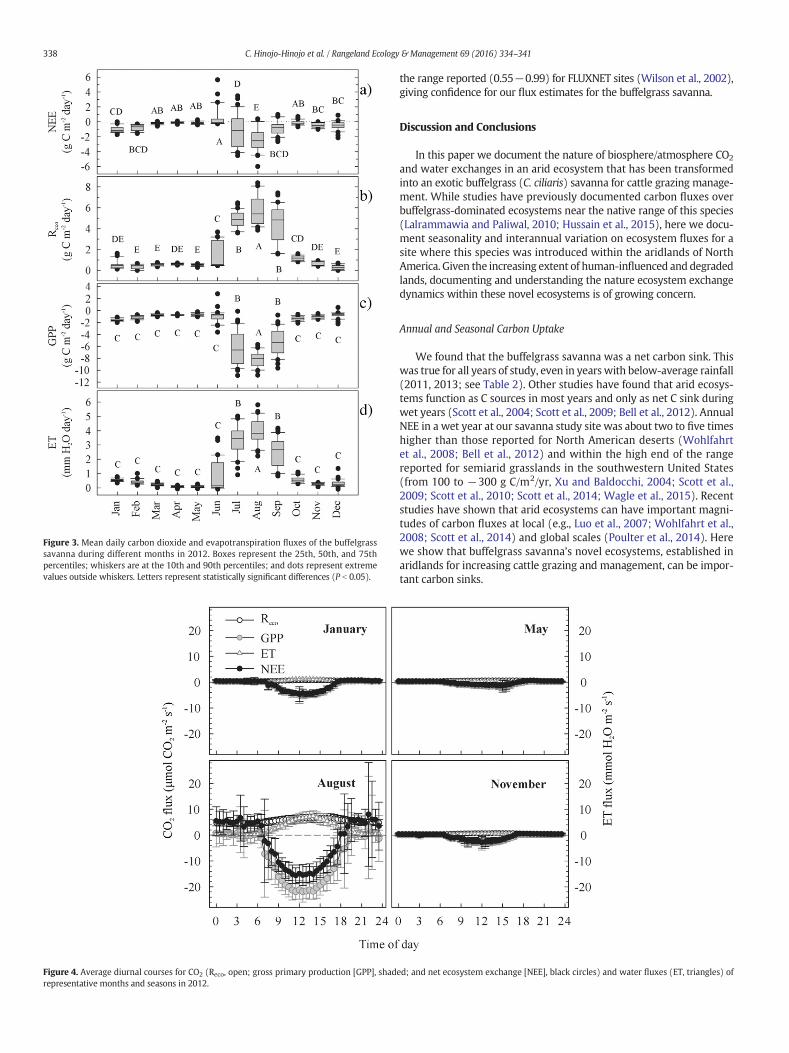
However, mean daily values of Reco and GPP from winter were around11 and 5 times lower than those from the summer. Instantaneous night-time NEE during winter, as well as in the spring and fall seasons, wasminimal (around 0.5 μmol CO2/m2/s) as compared with summer(around 5 μmol CO2/m2/s), which allowed carbon assimilation duringthe day (maximum NEE values of 1.5−5 μmol CO2/m2/s) resulted in adaily net sink (Fig. 4).
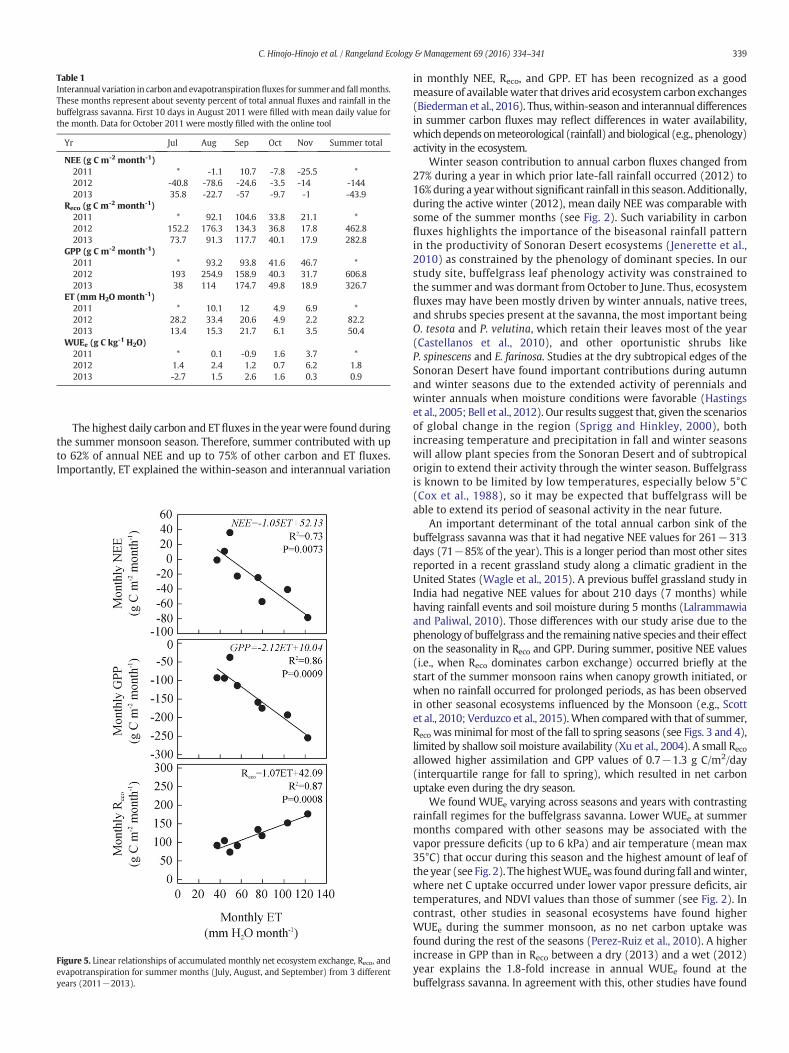
Within-season and interannual variability in monthly fluxes andWUEe from July to November is shown in Table 1.Monthly NEE for sum-mer varied by an amount of 68−78 g C/m2 each month in 2011, 2012,and 2013. The interannual variation in monthly fluxes was up to two-fold in Reco, fivefold in GPP, and threefold in ET, which also resulted invariation in WUEe. Monthly ET explains 73−87% of within-seasonand interannual variability in carbon fluxes (Fig. 5). The regression of
ET and NEE indicates that on average, 50mm/month of ET were neededto shift the ecosystem from carbon source to sink during summermonths (Fig. 5A).
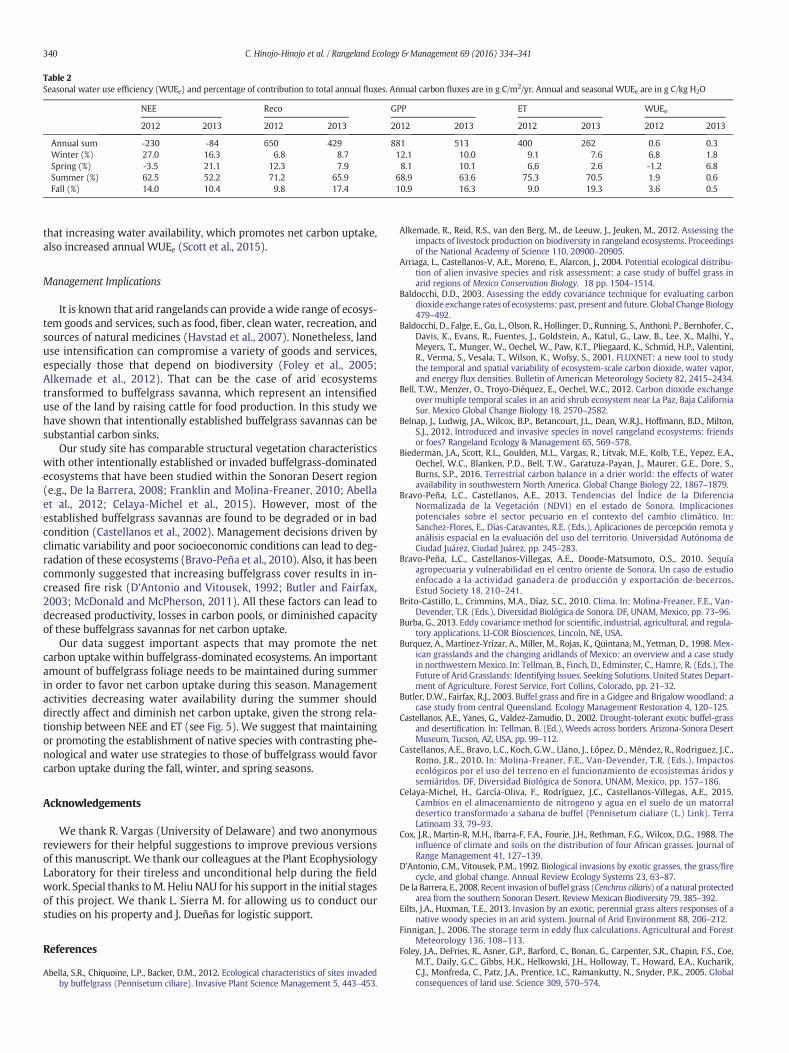
Annual values of carbon andETfluxes andWUEe are shown in Table 2.The buffelgrass savanna was a net carbon sink during 2012 and 2013,with annual NEE values of −230 and −84 g C/m2/yr. Interestingly,overall annual WUEe was 1.8 times higher in 2012 than 2013. AnnualET was similar to precipitation (P) for both years, with ET/P of 0.95 for2012 and 1.04 for 2013. While summer months contributed with morethan half of annual NEE and 64−76% of annual Reco, GPP, and ET, therest of the seasons also contributed importantly, especially for NEEcontributing collectively with 38−48% (see Table 2). Regression of theenergy budget closure for our site was LE + H = 0.8179 ⋅(Rn + G) +0.3839 (r2 = 0.9374, P b 0.0001), which slope falls around the mean of
Figure 2. Annual course of a) air temperature; b) vapor pressure deficit; c) volumetric soil water content; d) monthly cumulative rainfall; e) 16-day composite normalized differencevegetation index NDVI; and f) daily net ecosystem exchange (NEE, black circles), ecosystem respiration (Reco, open circles), and gross primary productivity (GPP, gray circles) in thebuffelgrass savanna during 2011−2012. Vertical doted lines mark the different seasons. Gray areas indicate approximate dates where buffelgrass had green leaves.
337C. Hinojo-Hinojo et al. / Rangeland Ecology & Management 69 (2016) 334–341
the range reported (0.55−0.99) for FLUXNET sites (Wilson et al., 2002),giving confidence for our flux estimates for the buffelgrass savanna.
Discussion and Conclusions
In this paper we document the nature of biosphere/atmosphere CO2
and water exchanges in an arid ecosystem that has been transformedinto an exotic buffelgrass (C. ciliaris) savanna for cattle grazing manage-ment. While studies have previously documented carbon fluxes overbuffelgrass-dominated ecosystems near the native range of this species(Lalrammawia and Paliwal, 2010; Hussain et al., 2015), here we docu-ment seasonality and interannual variation on ecosystem fluxes for asite where this species was introduced within the aridlands of NorthAmerica. Given the increasing extent of human-influenced and degradedlands, documenting and understanding the nature ecosystem exchangedynamics within these novel ecosystems is of growing concern.
Annual and Seasonal Carbon Uptake
We found that the buffelgrass savanna was a net carbon sink. Thiswas true for all years of study, even in years with below-average rainfall(2011, 2013; see Table 2). Other studies have found that arid ecosys-tems function as C sources in most years and only as net C sink duringwet years (Scott et al., 2004; Scott et al., 2009; Bell et al., 2012). AnnualNEE in a wet year at our savanna study site was about two to five timeshigher than those reported for North American deserts (Wohlfahrtet al., 2008; Bell et al., 2012) and within the high end of the rangereported for semiarid grasslands in the southwestern United States(from 100 to −300 g C/m2/yr, Xu and Baldocchi, 2004; Scott et al.,2009; Scott et al., 2010; Scott et al., 2014; Wagle et al., 2015). Recentstudies have shown that arid ecosystems can have important magni-tudes of carbon fluxes at local (e.g., Luo et al., 2007; Wohlfahrt et al.,2008; Scott et al., 2014) and global scales (Poulter et al., 2014). Herewe show that buffelgrass savanna’s novel ecosystems, established inaridlands for increasing cattle grazing and management, can be impor-tant carbon sinks.
Figure 3. Mean daily carbon dioxide and evapotranspiration fluxes of the buffelgrasssavanna during different months in 2012. Boxes represent the 25th, 50th, and 75thpercentiles; whiskers are at the 10th and 90th percentiles; and dots represent extremevalues outside whiskers. Letters represent statistically significant differences (P b 0.05).
Figure 4. Average diurnal courses for CO2 (Reco, open; gross primary production [GPP], shaded; and net ecosystem exchange [NEE], black circles) and water fluxes (ET, triangles) ofrepresentative months and seasons in 2012.
338 C. Hinojo-Hinojo et al. / Rangeland Ecology & Management 69 (2016) 334–341
The highest daily carbon and ET fluxes in the yearwere foundduringthe summer monsoon season. Therefore, summer contributed with upto 62% of annual NEE and up to 75% of other carbon and ET fluxes.Importantly, ET explained the within-season and interannual variation
in monthly NEE, Reco, and GPP. ET has been recognized as a goodmeasure of availablewater that drives arid ecosystem carbon exchanges(Biederman et al., 2016). Thus, within-season and interannual differencesin summer carbon fluxes may reflect differences in water availability,whichdependsonmeteorological (rainfall) andbiological (e.g., phenology)activity in the ecosystem.
Winter season contribution to annual carbon fluxes changed from27% during a year in which prior late-fall rainfall occurred (2012) to16% during a yearwithout significant rainfall in this season. Additionally,during the active winter (2012), mean daily NEE was comparable withsome of the summer months (see Fig. 2). Such variability in carbonfluxes highlights the importance of the biseasonal rainfall patternin the productivity of Sonoran Desert ecosystems (Jenerette et al.,2010) as constrained by the phenology of dominant species. In ourstudy site, buffelgrass leaf phenology activity was constrained tothe summer and was dormant from October to June. Thus, ecosystemfluxes may have been mostly driven by winter annuals, native trees,and shrubs species present at the savanna, the most important beingO. tesota and P. velutina, which retain their leaves most of the year(Castellanos et al., 2010), and other oportunistic shrubs likeP. spinescens and E. farinosa. Studies at the dry subtropical edges of theSonoran Desert have found important contributions during autumnand winter seasons due to the extended activity of perennials andwinter annuals when moisture conditions were favorable (Hastingset al., 2005; Bell et al., 2012). Our results suggest that, given the scenariosof global change in the region (Sprigg and Hinkley, 2000), bothincreasing temperature and precipitation in fall and winter seasonswill allow plant species from the Sonoran Desert and of subtropicalorigin to extend their activity through the winter season. Buffelgrassis known to be limited by low temperatures, especially below 5°C(Cox et al., 1988), so it may be expected that buffelgrass will beable to extend its period of seasonal activity in the near future.
An important determinant of the total annual carbon sink of thebuffelgrass savanna was that it had negative NEE values for 261−313days (71−85% of the year). This is a longer period than most other sitesreported in a recent grassland study along a climatic gradient in theUnited States (Wagle et al., 2015). A previous buffel grassland study inIndia had negative NEE values for about 210 days (7 months) whilehaving rainfall events and soil moisture during 5 months (Lalrammawiaand Paliwal, 2010). Those differences with our study arise due to thephenology of buffelgrass and the remaining native species and their effecton the seasonality in Reco and GPP. During summer, positive NEE values(i.e., when Reco dominates carbon exchange) occurred briefly at thestart of the summer monsoon rains when canopy growth initiated, orwhen no rainfall occurred for prolonged periods, as has been observedin other seasonal ecosystems influenced by the Monsoon (e.g., Scottet al., 2010; Verduzco et al., 2015).When comparedwith that of summer,Reco wasminimal for most of the fall to spring seasons (see Figs. 3 and 4),limited by shallow soil moisture availability (Xu et al., 2004). A small Recoallowed higher assimilation and GPP values of 0.7−1.3 g C/m2/day(interquartile range for fall to spring), which resulted in net carbonuptake even during the dry season.
We found WUEe varying across seasons and years with contrastingrainfall regimes for the buffelgrass savanna. Lower WUEe at summermonths compared with other seasons may be associated with thevapor pressure deficits (up to 6 kPa) and air temperature (mean max35°C) that occur during this season and the highest amount of leaf ofthe year (see Fig. 2). The highestWUEewas foundduring fall andwinter,where net C uptake occurred under lower vapor pressure deficits, airtemperatures, and NDVI values than those of summer (see Fig. 2). Incontrast, other studies in seasonal ecosystems have found higherWUEe during the summer monsoon, as no net carbon uptake wasfound during the rest of the seasons (Perez-Ruiz et al., 2010). A higherincrease in GPP than in Reco between a dry (2013) and a wet (2012)year explains the 1.8-fold increase in annual WUEe found at thebuffelgrass savanna. In agreement with this, other studies have found
Table 1Interannual variation in carbonand evapotranspirationfluxes for summer and fallmonths.These months represent about seventy percent of total annual fluxes and rainfall in thebuffelgrass savanna. First 10 days in August 2011 were filled with mean daily value forthe month. Data for October 2011 were mostly filled with the online tool
Yr Jul Aug Sep Oct Nov Summer total
NEE (g C m-2 month-1)2011 * -1.1 10.7 -7.8 -25.5 *2012 -40.8 -78.6 -24.6 -3.5 -14 -1442013 35.8 -22.7 -57 -9.7 -1 -43.9
Reco (g C m-2 month-1)2011 * 92.1 104.6 33.8 21.1 *2012 152.2 176.3 134.3 36.8 17.8 462.82013 73.7 91.3 117.7 40.1 17.9 282.8
GPP (g C m-2 month-1)2011 * 93.2 93.8 41.6 46.7 *2012 193 254.9 158.9 40.3 31.7 606.82013 38 114 174.7 49.8 18.9 326.7
ET (mm H2O month-1)2011 * 10.1 12 4.9 6.9 *2012 28.2 33.4 20.6 4.9 2.2 82.22013 13.4 15.3 21.7 6.1 3.5 50.4
WUEe (g C kg-1 H2O)2011 * 0.1 -0.9 1.6 3.7 *2012 1.4 2.4 1.2 0.7 6.2 1.82013 -2.7 1.5 2.6 1.6 0.3 0.9
Figure 5. Linear relationships of accumulated monthly net ecosystem exchange, Reco, andevapotranspiration for summer months (July, August, and September) from 3 differentyears (2011−2013).
339C. Hinojo-Hinojo et al. / Rangeland Ecology & Management 69 (2016) 334–341
that increasing water availability, which promotes net carbon uptake,also increased annual WUEe (Scott et al., 2015).
Management Implications
It is known that arid rangelands can provide a wide range of ecosys-tem goods and services, such as food, fiber, clean water, recreation, andsources of natural medicines (Havstad et al., 2007). Nonetheless, landuse intensification can compromise a variety of goods and services,especially those that depend on biodiversity (Foley et al., 2005;Alkemade et al., 2012). That can be the case of arid ecosystemstransformed to buffelgrass savanna, which represent an intensifieduse of the land by raising cattle for food production. In this study wehave shown that intentionally established buffelgrass savannas can besubstantial carbon sinks.
Our study site has comparable structural vegetation characteristicswith other intentionally established or invaded buffelgrass-dominatedecosystems that have been studied within the Sonoran Desert region(e.g., De la Barrera, 2008; Franklin and Molina-Freaner, 2010; Abellaet al., 2012; Celaya-Michel et al., 2015). However, most of theestablished buffelgrass savannas are found to be degraded or in badcondition (Castellanos et al., 2002). Management decisions driven byclimatic variability and poor socioeconomic conditions can lead to deg-radation of these ecosystems (Bravo-Peña et al., 2010). Also, it has beencommonly suggested that increasing buffelgrass cover results in in-creased fire risk (D’Antonio and Vitousek, 1992; Butler and Fairfax,2003; McDonald and McPherson, 2011). All these factors can lead todecreased productivity, losses in carbon pools, or diminished capacityof these buffelgrass savannas for net carbon uptake.
Our data suggest important aspects that may promote the netcarbon uptake within buffelgrass-dominated ecosystems. An importantamount of buffelgrass foliage needs to be maintained during summerin order to favor net carbon uptake during this season. Managementactivities decreasing water availability during the summer shoulddirectly affect and diminish net carbon uptake, given the strong rela-tionship between NEE and ET (see Fig. 5). We suggest that maintainingor promoting the establishment of native species with contrasting phe-nological and water use strategies to those of buffelgrass would favorcarbon uptake during the fall, winter, and spring seasons.
Acknowledgements
We thank R. Vargas (University of Delaware) and two anonymousreviewers for their helpful suggestions to improve previous versionsof this manuscript. We thank our colleagues at the Plant EcophysiologyLaboratory for their tireless and unconditional help during the fieldwork. Special thanks toM. Heliu NAU for his support in the initial stagesof this project. We thank L. Sierra M. for allowing us to conduct ourstudies on his property and J. Dueñas for logistic support.
References
Abella, S.R., Chiquoine, L.P., Backer, D.M., 2012. Ecological characteristics of sites invadedby buffelgrass (Pennisetum ciliare). Invasive Plant Science Management 5, 443–453.
Alkemade, R., Reid, R.S., van den Berg, M., de Leeuw, J., Jeuken, M., 2012. Assessing theimpacts of livestock production on biodiversity in rangeland ecosystems. Proceedingsof the National Academy of Science 110, 20900–20905.
Arriaga, L., Castellanos-V, A.E., Moreno, E., Alarcon, J., 2004. Potential ecological distribu-tion of alien invasive species and risk assessment: a case study of buffel grass inarid regions of Mexico Conservation Biology. 18 pp. 1504–1514.
Baldocchi, D.D., 2003. Assessing the eddy covariance technique for evaluating carbondioxide exchange rates of ecosystems: past, present and future.Global ChangeBiology479–492.
Baldocchi, D., Falge, E., Gu, L., Olson, R., Hollinger, D., Running, S., Anthoni, P., Bernhofer, C.,Davis, K., Evans, R., Fuentes, J., Goldstein, A., Katul, G., Law, B., Lee, X., Malhi, Y.,Meyers, T., Munger, W., Oechel, W., Paw, K.T., Pliegaard, K., Schmid, H.P., Valentini,R., Verma, S., Vesala, T., Wilson, K., Wofsy, S., 2001. FLUXNET: a new tool to studythe temporal and spatial variability of ecosystem-scale carbon dioxide, water vapor,and energy flux densities. Bulletin of American Meteorology Society 82, 2415–2434.
Bell, T.W., Menzer, O., Troyo-Diéquez, E., Oechel, W.C., 2012. Carbon dioxide exchangeover multiple temporal scales in an arid shrub ecosystem near La Paz, Baja CaliforniaSur. Mexico Global Change Biology 18, 2570–2582.
Belnap, J., Ludwig, J.A., Wilcox, B.P., Betancourt, J.L., Dean, W.R.J., Hoffmann, B.D., Milton,S.J., 2012. Introduced and invasive species in novel rangeland ecosystems: friendsor foes? Rangeland Ecology & Management 65, 569–578.
Biederman, J.A., Scott, R.L., Goulden, M.L., Vargas, R., Litvak, M.E., Kolb, T.E., Yepez, E.A.,Oechel, W.C., Blanken, P.D., Bell, T.W., Garatuza-Payan, J., Maurer, G.E., Dore, S.,Burns, S.P., 2016. Terrestrial carbon balance in a drier world: the effects of wateravailability in southwestern North America. Global Change Biology 22, 1867–1879.
Bravo-Peña, L.C., Castellanos, A.E., 2013. Tendencias del Índice de la DiferenciaNormalizada de la Vegetación (NDVI) en el estado de Sonora. Implicacionespotenciales sobre el sector pecuario en el contexto del cambio climático. In:Sanchez-Flores, E., Días-Caravantes, R.E. (Eds.), Aplicaciones de percepción remota yanálisis espacial en la evaluación del uso del territorio. Universidad Autónoma deCiudad Juárez, Ciudad Juárez, pp. 245–283.
Bravo-Peña, L.C., Castellanos-Villegas, A.E., Doode-Matsumoto, O.S., 2010. Sequíaagropecuaria y vulnerabilidad en el centro oriente de Sonora. Un caso de estudioenfocado a la actividad ganadera de producción y exportación de becerros.Estud Society 18, 210–241.
Brito-Castillo, L., Crimmins, M.A., Díaz, S.C., 2010. Clima. In: Molina-Freaner, F.E., Van-Devender, T.R. (Eds.), Diversidad Biológica de Sonora. DF, UNAM, Mexico, pp. 73–96.
Burba, G., 2013. Eddy covariancemethod for scientific, industrial, agricultural, and regula-tory applications. LI-COR Biosciences, Lincoln, NE, USA.
Burquez, A., Martínez-Yrízar, A., Miller, M., Rojas, K., Quintana, M., Yetman, D., 1998. Mex-ican grasslands and the changing aridlands of Mexico: an overview and a case studyin northwestern Mexico. In: Tellman, B., Finch, D., Edminster, C., Hamre, R. (Eds.), TheFuture of Arid Grasslands: Identifying Issues. Seeking Solutions. United States Depart-ment of Agriculture, Forest Service, Fort Collins, Colorado, pp. 21–32.
Butler, D.W., Fairfax, R.J., 2003. Buffel grass and fire in a Gidgee and Brigalow woodland: acase study from central Queensland. Ecology Management Restoration 4, 120–125.
Castellanos, A.E., Yanes, G., Valdez-Zamudio, D., 2002. Drought-tolerant exotic buffel-grassand desertification. In: Tellman, B. (Ed.), Weeds across borders. Arizona-Sonora DesertMuseum, Tucson, AZ, USA, pp. 99–112.
Castellanos, A.E., Bravo, L.C., Koch, G.W., Llano, J., López, D., Méndez, R., Rodriguez, J.C.,Romo, J.R., 2010. In: Molina-Freaner, F.E., Van-Devender, T.R. (Eds.), Impactosecológicos por el uso del terreno en el funcionamiento de ecosistemas áridos ysemiáridos. DF, Diversidad Biológica de Sonora, UNAM, Mexico, pp. 157–186.
Celaya-Michel, H., García-Oliva, F., Rodríguez, J.C., Castellanos-Villegas, A.E., 2015.Cambios en el almacenamiento de nitrogeno y agua en el suelo de un matorraldesertico transformado a sabana de buffel (Pennisetum cialiare (L.) Link). TerraLatinoam 33, 79–93.
Cox, J.R., Martin-R, M.H., Ibarra-F, F.A., Fourie, J.H., Rethman, F.G., Wilcox, D.G., 1988. Theinfluence of climate and soils on the distribution of four African grasses. Journal ofRange Management 41, 127–139.
D’Antonio, C.M., Vitousek, P.M., 1992. Biological invasions by exotic grasses, the grass/firecycle, and global change. Annual Review Ecology Systems 23, 63–87.
De la Barrera, E., 2008. Recent invasion of buffel grass (Cenchrus ciliaris) of a natural protectedarea from the southern Sonoran Desert. Review Mexican Biodiversity 79, 385–392.
Eilts, J.A., Huxman, T.E., 2013. Invasion by an exotic, perennial grass alters responses of anative woody species in an arid system. Journal of Arid Environment 88, 206–212.
Finnigan, J., 2006. The storage term in eddy flux calculations. Agricultural and ForestMeteorology 136, 108–113.
Foley, J.A., DeFries, R., Asner, G.P., Barford, C., Bonan, G., Carpenter, S.R., Chapin, F.S., Coe,M.T., Daily, G.C., Gibbs, H.K., Helkowski, J.H., Holloway, T., Howard, E.A., Kucharik,C.J., Monfreda, C., Patz, J.A., Prentice, I.C., Ramankutty, N., Snyder, P.K., 2005. Globalconsequences of land use. Science 309, 570–574.
Table 2Seasonal water use efficiency (WUEe) and percentage of contribution to total annual fluxes. Annual carbon fluxes are in g C/m2/yr. Annual and seasonal WUEe are in g C/kg H2O
NEE Reco GPP ET WUEe
2012 2013 2012 2013 2012 2013 2012 2013 2012 2013
Annual sum -230 -84 650 429 881 513 400 262 0.6 0.3Winter (%) 27.0 16.3 6.8 8.7 12.1 10.0 9.1 7.6 6.8 1.8Spring (%) -3.5 21.1 12.3 7.9 8.1 10.1 6.6 2.6 -1.2 6.8Summer (%) 62.5 52.2 71.2 65.9 68.9 63.6 75.3 70.5 1.9 0.6Fall (%) 14.0 10.4 9.8 17.4 10.9 16.3 9.0 19.3 3.6 0.5
340 C. Hinojo-Hinojo et al. / Rangeland Ecology & Management 69 (2016) 334–341
Franklin, K., Molina-Freaner, F., 2010. Consequences of buffelgrass pasture developmentfor primary productivity, perennial plant richness, and vegetation structure in thedrylands of Sonora, Mexico. Conservation Biology 24, 1664–1673.
Hassan, R., Scholes, R., Ash, N. (Eds.), 2005. Ecosystems and human well-being: currentstate and trends vol 1. Island Press, Washington, DC, USA.
Hastings, S.J., Oechel, W.C., Muhlia-Melo, A., 2005. Diurnal, seasonal and annual variationin the net ecosystem CO2 exchange of a desert shrub community (sarcocaulescent) inBaja California, Mexico. Global Change Biology 11, 927–939.
Havstad, K.M., Peters, D.P.C., Skaggs, R., Brown, J., Bestelmeyer, B., Fredrickson, E., Herrick,J., Wright, J., 2007. Ecological services to and from rangelands of the United States.Ecological Economics 64, 261–268.
Herbel, C.H., 1979. Utilization of grass- and shrublands of the south-western United States.In: Walker, B. (Ed.), Management of semi-arid ecosystems. Elsevier, Amsterdam,pp. 161–203.
Huete, A., Didan, K., Leeuwen, Van,W., Miura, T., Glenn, E., 2011. MODIS vegetation indices.In: Ramachandran, B., Justice, C.O., Abrams, M.J. (Eds.), Land remote sensing and globalenvironmental change, remote sensing and digital image processing. Springer,New York, NY, USA, pp. 579–602.
Hussain, M.Z., Saraswathi, G., Lalrammawia, C., Otieno, D., Paliwal, K., Tenhunen, J., 2015.Leaf and ecosystem gas exchange responses of buffel grass-dominated grassland tosummer precipitation. Pedosphere 25, 112–123.
INEGI, 1988. Carta de uso del suelo. Atlas edn. INEGI Instituto Nacional de Geografía eInformática. D. F, México.
Jenerette, G.D., Scott, R.L., Huete, A.R., 2010. Functional differences between summer andwinter season rain assessed with MODIS-derived phenology in a semi-arid region.Journal of Vegetation Science 21, 16–30.
Lal, R., 2001. Potential of desertification control to sequester carbon and mitigate thegreenhouse effect. Climate Change 51, 35–72.
Lalrammawia, C., Paliwal, K., 2010. Seasonal changes in net ecosystem exchange of CO2
and respiration of Cenchrus ciliaris L. grassland ecosystem in semi-arid tropics: aneddy covariance measurement. Current Science 98, 1211–1218.
Lambin, E.F., Geist, H.J., Lepers, E., 2003. Dynamics of land-use and land-cover change intropical regions. Annual Review Environmental Resources 28, 205–241.
Lloyd, J., Taylor, J.A., 1994. On the temperature dependence of soil respiration. FunctionalEcology 8, 315–323.
Luo, H., Oechel, W.C., Hastings, S.J., Zulueta, R., Qian, Y., Kwon, H., 2007. Mature semiaridchaparral ecosystems can be a significant sink for atmospheric carbon dioxide. GlobalChange Biology 13, 386–396.
Marshall, V.M., Lewis, M.M., Ostendorf, B., 2012. Buffel grass (Cenchrus ciliaris) as aninvader and threat to biodiversity in arid environments: a review. Journal ofArid Environment 78, 1–12.
Martin, M.H., Cox, J.R., Ibarra, F., 1995. Climatic effects on buffelgrass productivity in Sono-ran Desert. Journal of Rangeland Management 48, 60–63.
Martín, M., Cox, J.R., Ibarra, F., Alston, D.G., Banner, R.E., Malecheck, J.C., 1999. Spittlebugand buffelgrass responses to summer fires in Mexico. Journal of Range Management52, 621–625.
Mauder, M., Foken, T., 2011. Documentation and instruction manual of the eddy covariancesoftware package TK2. Universität Bayreuth, Abteilung Mikrometeorologie, Bayreuth,Germany.
McDonald, C.J., McPherson, G.R., 2011. Fire behavior characteristics of buffelgrass-fueledfires and native plant community composition in invaded patches. Journal ofArid Environment 75, 1147–1154.
Miller, G., Friedel, M., Adam, P., Chewings, V., 2010. Ecological impacts of buffel grass(Cenchrus ciliaris L.) invasion in central Australia–does field evidence support afire-invasion feedback? The Rangeland Journal 32, 353–365.
Moncrieff, J.B., Massheder, J.M., de Bruin, H., Elbers, J., Friborg, T., Heusinkveld, B., Kabat, P.,Scott, S., Soegaard, H., Verhoef, A., 1997. A system to measure surface fluxes ofmomentum, sensible heat, water vapour and carbon dioxide. Journal of Hydrology188–189, 589–611.
Moncrieff, J., Clement, R., Finnigan, J., Meyers, T., 2004. Averaging, detrending, and filteringof eddy covariance time series. In: Lee, X., Massman, W., Law, B. (Eds.), Handbook ofmicrometeorology. Kluwer Academic, Dordrecht, The Netherlands, pp. 7–31.
Morales-Romero, D., Molina-Freaner, F., 2008. Influence of buffelgrass pasture conversionon the regeneration and reproduction of the columnar cactus, Pachycereus pecten-aboriginum, in northwestern Mexico. Journal of Arid Environments 72, 228–237.
Perez-Ruiz, E.R., Garatuza-Payan, J., Watts, C.J., Rodriguez, J.C., Yepez, E.A., Scott, R.L., 2010.Carbon dioxide and water vapour exchange in a tropical dry forest as influenced bythe North American Monsoon System (NAMS). Journal of Arid Environments 74,556–563.
Poulter, B., Frank, D., Ciais, P., Myneni, R.B., Andela, N., Bi, J., Broquet, G., Canadell, J.G.,Chevallier, F., Liu, Y.Y., Running, S.W., Sitch, S., van der Werf, G.R., 2014. Contributionof semi-arid ecosystems to interannual variability of the global carbon cycle. Nature.509, 600–603.
Rao, A.S., Singh, K.C., Wight, J.R., 1996. Productivity of Cenchrus ciliaris in relation torainfall and fertilization. Journal of Rangeland Management 49, 143–146.
Reichstein, M., Falge, E., Baldocchi, D., Papale, D., Aubinet, M., Berbigier, P., Bernhofer, C.,Buchmann, N., Gilmanov, T., Granier, A., Grunwald, T., Havrankova, K., Ilvesniemi,H., Janous, D., Knohl, A., Laurila, T., Lohila, A., Loustau, D., Matteucci, G., Meyers, T.,Miglietta, F., Ourcival, J.-M., Pumpanen, J., Rambal, S., Rotenberg, E., Sanz, M.,Tenhunen, J., Seufert, G., Vaccari, F., Vesala, T., Yakir, D., Valentini, R., 2005. On theseparation of net ecosystem exchange into assimilation and ecosystem respiration:review and improved algorithm. Global Change Biology 11, 1424–1439.
Reynolds, J.F., Stafford-Smith, D.M. (Eds.), 2002. Global desertification: do humans causedeserts?Dahlem University Press, Berlin, Germany
Saucedo-Monarque, E., García-Moya, E., Castellanos-Villegas, A.E., Flores-Flores, J.L., 1997.La riqueza, una variable de respuesta de la vegetación a la introducción del zacatebuffel. Agrociencia 31, 83–90.
Scott, R.L., Edwards, E.A., Shuttleworth, W.J., Huxman, T.E., Watts, C., Goodrich, D.C., 2004.Interannual and seasonal variation in fluxes of water and carbon dioxide from a ripar-ian woodland ecosystem. Agricultural and Forest Meteorology 122, 65–84.
Scott, R.L., Jenerette, G.D., Potts, D.L., Huxman, T.E., 2009. Effects of seasonal drought onnet carbon dioxide exchange from a woody-plant-encroached semiarid grassland.Journal of Geophysical Research 114, G04004.
Scott, R.L., Hamerlynck, E.P., Jenerette, G.D., Moran, M.S., Barron-Gafford, G.A., 2010. Car-bon dioxide exchange in a semidesert grassland through drought-induced vegetationchange. Journal of Geophysical Research 115, :G03026.
Scott, R.L., Huxman, T.E., Barron-Gafford, G.A., Janerette, G.D., Young, J.M., Hamerlynck,E.P., 2014. When vegetation change alters ecosystem water availability. GlobalChange Biology 20, 2198–2210.
Scott, R.L., Biederman, J.A., Hamerlynck, E.P., Barron‐Gafford, G.A., 2015. The carbon bal-ance pivot point of southwestern US semiarid ecosystems: Insights from the 21stcentury drought. Journal of Geophysical Research: Biogeosciences 120, 2612–2624.
Shreve, F., Wiggins, I.L., 1964. Vegetation and flora of the Sonoran Desert. vol. I. StanfordUniversity Press, Stanford, CT, USA.
Sprigg, W.A., Hinkley, T., 2000. Preparing for a changing climate. The potential conse-quences of climate variability and change. NOAA, ISPE, USGS, Tucson, AZ, USA,p. 60.
van Dijk, A., Moene, A.F., de Bruin, H.A.R., 2004. The principles of surface flux physics: the-ory, practice and description of the ECPACK Library. Internal Rep, Wageningen, TheNederlands.
Vargas, R., Yepez, E.A., Andrade, J.L., Ángeles, G., Arredondo, T., Castellanos, A.E., Delgado,J., Garatuza-Payan, J., González del Castillo, E., Oechel, W.C., Sánchez-Azofeifa, A.,Velasco, E., Vivoni, E.R., Watts, C., 2013. Progress and opportunities for water andgreenhouse gases fluxmeasurements in Mexican ecosystems: The MexFlux network.Atmósfera 26, 325–336.
Verduzco, V.S., Garatuza-Payán, J., Yépez, E.A.,Watts, C.J., Rodríguez, J.C., Robles-Morua, A.,Vivoni, E.R., 2015. Variations of net ecosystem production due to seasonal precipita-tion differences in a tropical dry forest of northwest Mexico. Journal of GeophysicalResearch Biogeosciences 120, 2081–2094.
Vickers, D., Mahrt, L., 1997. Quality control and flux sampling problems for tower andaircraft data. Journal of Atmospheric Ocean Technology 14, 512–526.
Wagle, P., Xiao, X., Scott, R.L., Kolb, T.E., Cook, D.R., Brunsell, N., Baldocchi, D.D., Basara, J.,Matamala, R., Zhou, Y., Bajgain, R., 2015. Biophysical controls on carbon and watervapor fluxes across a grassland climatic gradient in the United States. AgricultureForest Meteorology 214–215, 293–305.
Walker, B. (Ed.), 1979. Management of semi-arid ecosystems. Elsevier, Amsterdam.Webb, E.K., Pearman, G.I., Leuning, R., 1980. Correction of flux measurements for density
effects due to heat and water vapour transfer. Quarterly Journal of the RoyalMereorological Society 106, 85–100.
Wilcox, B.P., Turnbull, L., Young, M.H., Williams, C.J., Ravi, S., Seyfried, M.S., Bowling, D.R.,Scott, R.L., Germino, M.J., Caldwell, T.G., Wainwright, J., 2012. Invasion of shrublandsby exotic grasses: ecohydrological consequences in cold versus warm deserts.Ecohydrology 5, 160–173.
Wilczak, J.M., Oncley, S.P., Stage, S.A., 2001. Sonic anemometer tilt correction algorithms.Boundary-Layer Meteorology 99, 127–150.
Williams, D.G., Baruch, Z., 2000. African grass invasion in the Americas: ecosystem conse-quences and the role of ecophysiology. Biology Invasions 2, 123–140.
Wilson, K., Goldstein, A., Falge, E., Aubinet, M., Baldocchi, D., Berbigier, P., Bernhofer, C.,Ceulemans, R., Dolman, H., Field, C., Grelle, A., Ibrom, A., Law, B.E., Kowalski, A.,Meyers, T., Moncrieff, J., Monson, R., Oechel, W., Tenhunen, J., Valentini, R., Verma,S., 2002. Energy balance closure at FLUXNET sites. Agriculture Forestry Meteorology113, 223–243.
Wohlfahrt, G., Fenstermaker, L.F., Arnone III, J.A., 2008. Large annual net ecosystem CO2
uptake of a Mojave Desert ecosystem. Global Change Biology 14, 1475–1487.Xu, L., Baldocchi, D.D., 2004. Seasonal variation in carbon dioxide exchange over a
Mediterranean annual grassland in California. Agriculture Forestry Meteorology123, 79–96.
Xu, L., Baldocchi, D.D., Tang, J., 2004. How soil moisture, rain pulses, and growth alter theresponse of ecosystem respiration to temperature. Global Biogeochemical Cycles 18,GB4002.
341C. Hinojo-Hinojo et al. / Rangeland Ecology & Management 69 (2016) 334–341