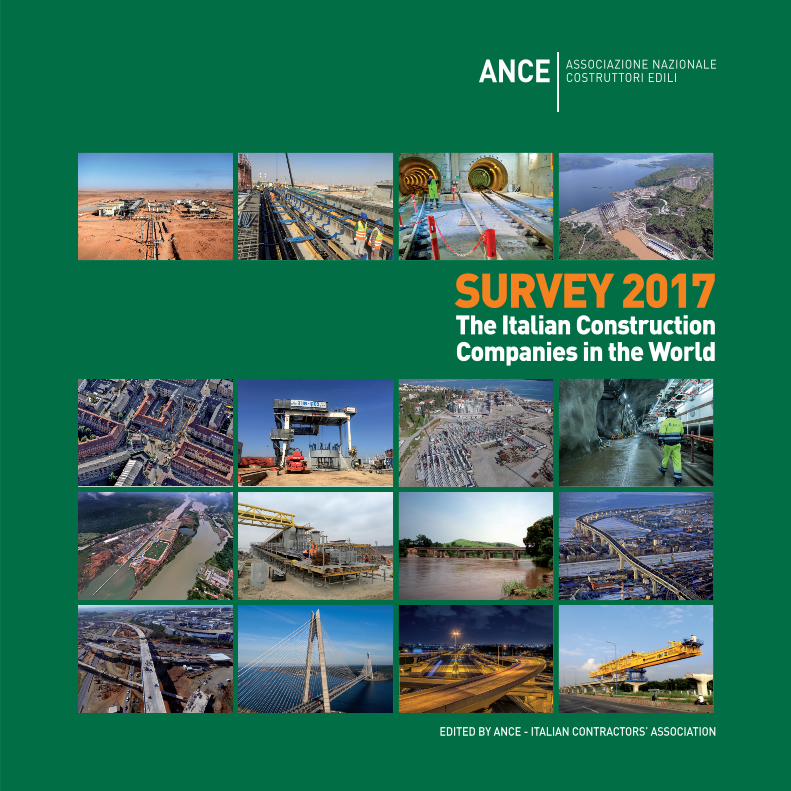
SURVEY 2017 The Italian ConstructionCompanies in the World
EDITED BY ANCE - ITALIAN CONTRACTORS’ ASSOCIATION

Twelve years ofinternational growth The international turnover of the ItalianConstruction Companies taking part toANCE’s Annual Survey has grown almostfivefold: from € 3.1 Billion in 2004 to € 14.1Billion in 2016 (with an average annualgrowth of 13.5%). Their international production in 2016recorded a solid 17.8% increase YoY.The value of new contracts topped € 20.8Billion in 2016.Overall, 686 construction sites with totalcontract value of € 90.8 Billion and abacklog of € 52.6 Billion were active in 2016.The Italian Construction Companies are trulyinternational: in 2016, they were operating in90 Countries in the 5 Continents with morethan 300 companies incorporated underlocal law.Over the past decade there has been apositioning of the portfolio towards the mostcompetitive markets.Their core business is the achievement ofcomplex infrastructures, such as roads,bridges, hydroelectric plants, railways,subways, pipelines, power stations,hydraulic works. The constant flow ofinvestments, the R&D in state of the arttechnologies, coupled with their worldwideexperience in planning and executing themost challenging infrastructure projects,contribute to position the Italianconstruction companies among the leadingones in the world.
Rank Firm International Total New Contracts2016 Revenues 2016 Revenues 2016 2016
Top Italian International Contractors (million euro)
1 Salini Impregilo 5,585.0 6,124.5 6,254.1
2 Astaldi 2,524.7 3,004.3 2,368.0
3 Condotte 803.0 1,315.0 547.6
4 Rizzani De Eccher 778.1 917.8 336.8
5 Bonatti 662.0 798.0 682.8
6 CMC 580.8 1,063.2 918.6
7 Trevi 568.9 616.9 454.7
8 Sicim 509.5 512.7 687.5
9 Pizzarotti 500.7 780.4 1,257.4
10 Ghella 407.0 620.0 233.5
11 Cimolai 261.0 539.0 399.4
12 ICM 194.8 340.3 367.0
13 Grandi Lavori Fincosit 165.0 457.0 168.8
14 Renco 152.0 187.0 162.3
15 GCF 128.3 358.2 -
16 Salcef 42.0 268.2 8.4
17 Europea 92 42.0 44.0 21.3
18 Cipa 36.3 68.1 70.3
19 I.CO.P 35.1 81.9 -
20 I.B.I 29.0 31.3 -
21 Toto 27.4 178.3 26.0
22 SEAS 20.8 26.9 177.8
23 CLF 18.8 161.5 0.6
24 PAC 13.0 58.3 80.0
25 Sedir 11.0 21.0 -
26 Bottoli 8.8 24.4 4.8
27 Cogeis 7.3 51.5 -
28 Mont-Ele 7.0 14.0 1.0
29 Pellegrini 5.6 43.3 13.8
30 Edilmac 4.6 20.0 7.2

0100020003000400050006000700080009000
1000011000120001300014000
3,102.03,717.9
4,818.45,549.4
6,462.57,260.5 7,444.6 7,877.8
8,753.89,504.5
10,469.5
11,990.5
14,127.4
2004 2005
mill
ion eu
ro
2006 2007 2008 2009 2010 2011 2012 2013 2014 2015 2016
The 2016 international turnover of the Italian construction companieshas reached € 14.1 billion.
International activities have increased for almost all sizesof companies.
Company Size in terms % of International % of International of Total Revenues (million euro) Turnover in 2004 Turnover in 2016
UP TO 50 8.3% 41.8%
51-100 19.8% 28.9%
101-250 54.8% 29.0%
251-500 32.7% 29.4%
OVER 500 28.4% 80.9%
TOTAL 31.4% 72.7%
International Turnover (2004-2016)
20
60
100
140
180
220
260
300
340
380
420
460
2004 2005 2006 2007 2008 2009 2010 2011 2012 2013 2014 2015 2016
INTERNATIONAL TURNOVER
NATIONAL TURNOVER
2004
= 10
0
International Turnover has been growing significantly.
0
2000
4000
6000
8000
10000
12000
14000
16000
18000
20000
2004 2005 2006 2007 2008 2009 2010 2011 2012 2013 2014 2015 2016
3,102.0 3,717.9 4,818.4 5,549.46,462.5 7,260.5 7,444.6 7,877.8 8,753.8
6,786.1 6,300.16,172.1
6,321.26,824.0 6,176.0 6,308.3
6,751.7 6,279.5
9,504.5 10,469.5
6,299.65,854.5
11,990.5
5,137.3
14,127.4
5,269.9INTERNATIONAL TURNOVERNATIONAL TURNOVER
mill
ioni e
uro
The International turnover represents almost the 73% of the total turnover.
National and International Turnover (2004-2016)
National v/s International Turnover (2004-2016)
Company Size: International Turnover compared to Total Revenues

ConcessionsARGENTINAAUSTRALIACHILECOLOMBIACOSTA RICANETHERLANDSPERURUSSIATURKEYUGANDAUNITED KINGDOM
Distribution by Range of Contracts’ Amount (million euro)
SUB-SAHARIAN AFRICA 13.5%
NORTH AFRICA 9.1%
MIDDLE EAST 16.6%
ASIA 5.0%
SOUTH AMERICA 15.0%
EUROPE EXTRA UE 16.0%
EUROPEAN UNION 12.8%
NORTH AMERICA 9.9%
CENTRAL AMERICA 0.6% OCEANIA 1.5%
GeographicDistribution ofContracts
› 1.000TURKEYQATARUNITED STATESETHIOPIAVENEZUELAALGERIAFRANCESAUDI ARABIARUSSIALYBIAKUWAITGREECEPERUCHILESWITZERLANDDENMARKCOLOMBIATAJIKISTAN*ARGENTINANIGERIA POLANDAUSTRALIACANADASOUTH AFRICAMEXICOROMANIAKENYA
500,1-1.000NORWAYUNITED ARAB EMIRATESKAZAKHSTANMALAYSIACONGO (REP)BRASILLAOSIRAQ
100,1-500EGYPTISRAELGEORGIAPANAMASWEDENNAMIBIAMOZAMBIQUELUXEMBOURG*UGANDASLOVAKIAUKRAINEMOROCCOVIETNAMALBANIAANGOLAMONTENEGRO
TUNISIASINGAPORELEBANONBULGARIANEPALGREATER ANTILLESPAKISTAN *ZAMBIAZIMBABWEPHILIPPINES
50,1-100INDIACOSTA RICABOTSWANA*LESOTHOCZECH REP.IRELAND*SIERRA LEONENETHERLANDS*LESSER ANTILLES*BELGIUMCROATIA
‹ 50CHINAOMANSERBIAMOLDOVASYRIAHONDURAS*JORDANHONG KONG (P.R.C.)BOSNIA AND HERZEGOVINACAPE VERDETANZANIANICARAGUA*MALTAHUNGARYTAIWANUNITED KINGDOM GUYANA*ARMENIA
* New Countries in 2016
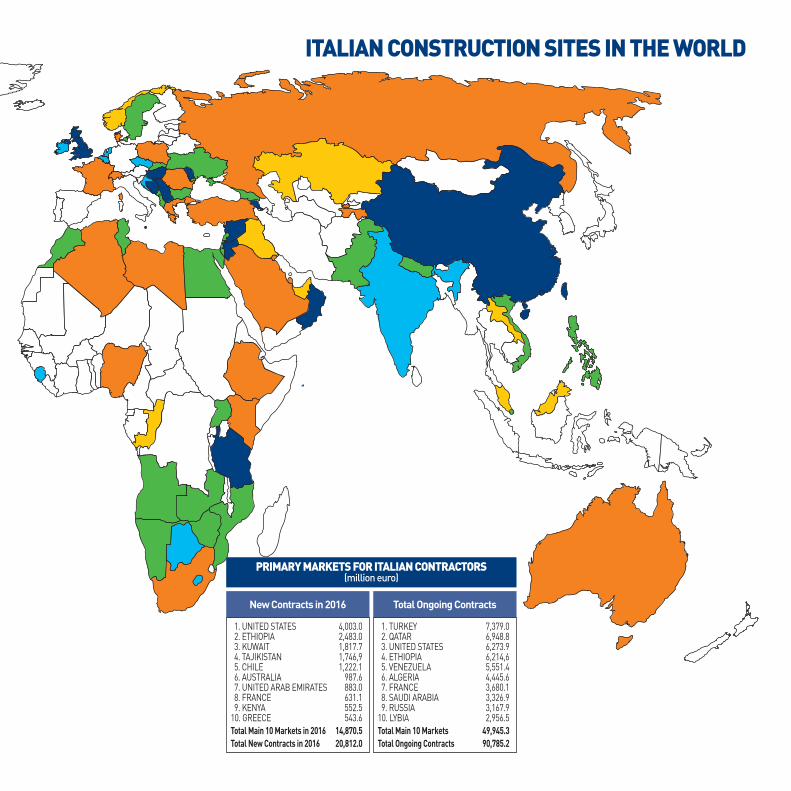
ITALIAN CONSTRUCTION SITES IN THE WORLD
New Contracts in 2016
PRIMARY MARKETS FOR ITALIAN CONTRACTORS (million euro)
1. UNITED STATES 4,003.02. ETHIOPIA 2,483.03. KUWAIT 1,817.74. TAJIKISTAN 1,746,95. CHILE 1,222.16. AUSTRALIA 987.67. UNITED ARAB EMIRATES 883.08. FRANCE 631.19. KENYA 552.5
10. GREECE 543.6Total Main 10 Markets in 2016 14,870.5Total New Contracts in 2016 20,812.0
Total Ongoing Contracts
1. TURKEY 7,379.02. QATAR 6,948.83. UNITED STATES 6,273.94. ETHIOPIA 6,214,65. VENEZUELA 5,551.46. ALGERIA 4,445.67. FRANCE 3,680.18. SAUDI ARABIA 3,326.99. RUSSIA 3,167.9
10. LYBIA 2,956.5Total Main 10 Markets 49,945.3Total Ongoing Contracts 90,785.2
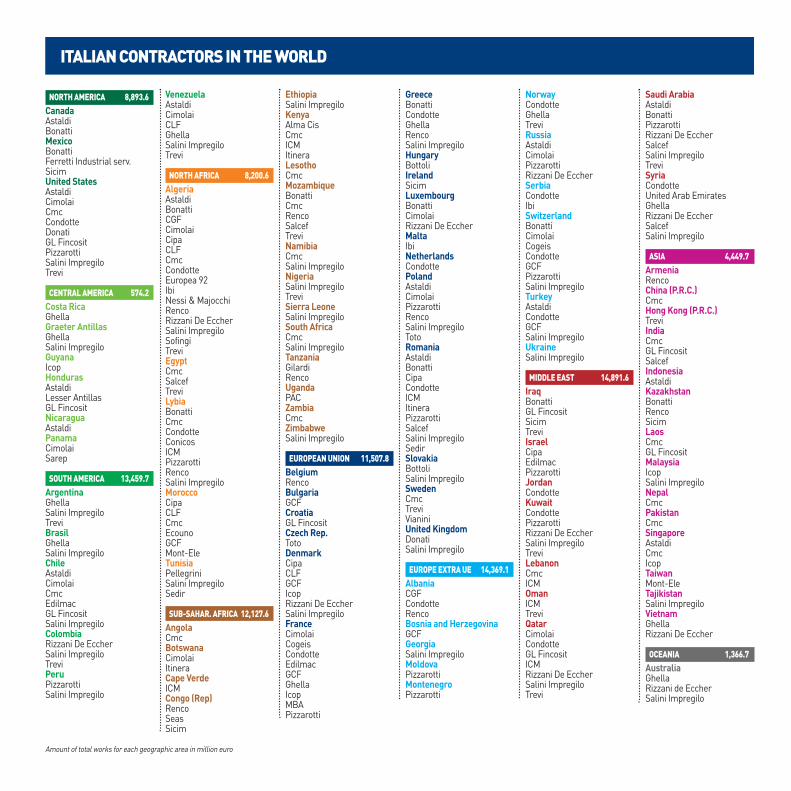
ITALIAN CONTRACTORS IN THE WORLD
Amount of total works for each geographic area in million euro
NORTH AMERICA 8,893.6Canada AstaldiBonattiMexico BonattiFerretti Industrial serv.Sicim United StatesAstaldi CimolaiCmcCondotteDonatiGL FincositPizzarottiSalini ImpregiloTrevi
CENTRAL AMERICA 574.2Costa Rica GhellaGraeter AntillasGhellaSalini ImpregiloGuyanaIcopHondurasAstaldiLesser AntillasGL FincositNicaraguaAstaldiPanama CimolaiSarep
SOUTH AMERICA 13,459.7Argentina GhellaSalini ImpregiloTreviBrasilGhellaSalini ImpregiloChile AstaldiCimolaiCmcEdilmacGL FincositSalini ImpregiloColombiaRizzani De EccherSalini ImpregiloTreviPeruPizzarottiSalini Impregilo
Venezuela AstaldiCimolaiCLFGhellaSalini ImpregiloTrevi
NORTH AFRICA 8,200.6Algeria AstaldiBonattiCGFCimolaiCipaCLFCmcCondotteEuropea 92IbiNessi & MajocchiRencoRizzani De EccherSalini ImpregiloSofingiTreviEgyptCmcSalcefTreviLybia BonattiCmcCondotteConicosICMPizzarottiRencoSalini ImpregiloMorocco CipaCLFCmcEcounoGCFMont-EleTunisia PellegriniSalini ImpregiloSedir
SUB-SAHAR. AFRICA 12,127.6Angola CmcBotswana CimolaiItinera Cape VerdeICMCongo (Rep)RencoSeasSicim
EthiopiaSalini ImpregiloKenya Alma CisCmcICMItinera Lesotho CmcMozambiqueBonattiCmcRencoSalcefTreviNamibia CmcSalini ImpregiloNigeria Salini ImpregiloTreviSierra Leone Salini ImpregiloSouth Africa CmcSalini ImpregiloTanzania GilardiRencoUganda PACZambia CmcZimbabwe Salini Impregilo
EUROPEAN UNION 11,507.8Belgium RencoBulgaria GCFCroatia GL FincositCzech Rep.TotoDenmarkCipaCLFGCFIcopRizzani De EccherSalini ImpregiloFranceCimolaiCogeisCondotteEdilmacGCFGhellaIcopMBAPizzarotti
GreeceBonattiCondotteGhellaRencoSalini ImpregiloHungary BottoliIrelandSicimLuxembourgBonattiCimolaiRizzani De EccherMalta IbiNetherlands CondottePoland AstaldiCimolaiPizzarottiRencoSalini ImpregiloTotoRomania AstaldiBonattiCipaCondotteICMItineraPizzarottiSalcefSalini ImpregiloSedirSlovakia BottoliSalini ImpregiloSwedenCmcTreviVianiniUnited KingdomDonati Salini Impregilo
EUROPE EXTRA UE 14,369.1Albania CGFCondotteRencoBosnia and HerzegovinaGCFGeorgia Salini ImpregiloMoldovaPizzarottiMontenegro Pizzarotti
NorwayCondotteGhellaTreviRussia AstaldiCimolaiPizzarottiRizzani De EccherSerbia CondotteIbiSwitzerland BonattiCimolaiCogeisCondotteGCFPizzarottiSalini ImpregiloTurkeyAstaldiCondotteGCFSalini ImpregiloUkraine Salini Impregilo
MIDDLE EAST 14,891.6Iraq BonattiGL Fincosit SicimTreviIsraelCipaEdilmacPizzarottiJordanCondotteKuwait CondottePizzarottiRizzani De EccherSalini ImpregiloTreviLebanonCmcICMOman ICMTreviQatar CimolaiCondotteGL FincositICMRizzani De EccherSalini ImpregiloTrevi
Saudi ArabiaAstaldiBonattiPizzarottiRizzani De EccherSalcefSalini ImpregiloTreviSyria CondotteUnited Arab EmiratesGhellaRizzani De EccherSalcefSalini Impregilo
ASIA 4,449.7Armenia RencoChina (P.R.C.) CmcHong Kong (P.R.C.)TreviIndia CmcGL FincositSalcefIndonesia AstaldiKazakhstan BonattiRencoSicimLaos CmcGL FincositMalaysia IcopSalini ImpregiloNepal CmcPakistan CmcSingapore AstaldiCmcIcopTaiwan Mont-EleTajikistanSalini ImpregiloVietnam GhellaRizzani De Eccher
OCEANIA 1,366.7Australia GhellaRizzani de EccherSalini Impregilo

New contracts signed in 2016 are concentrated in North America, Sub-Saharian Africa and Middle East.
South America 7.2%
EU 10.1%
Europe Extra EU 3.5%
Middle East 17.6%
Sub-Saharian Africa 17.6%
Central America 0.3%
North America 23.8%
Oceania 4.8%
North Africa 1.9%
Asia 13.3%
The majority of the companies undertakes complex infrastructuressuch as roads, bridges, hydraulic works, railways and subways.
0
5
10
15
20
25
21.9
ROAD
S & BR
IDGE
S
16.9
HYDR
AULIC
WOR
KS
16.1
RAILW
AYS
15.8
SUBW
AYS
10.2
BUILD
INGS
9.3
OTHE
RS
4.4
HYDR
OELE
CTRI
C PLA
NTS
3.8
POWE
R, OI
L, GA
S
0.8
AIRP
ORTS
0.5PO
RTS
0.3PI
LES &
FOUN
DATIO
NS0.1
WAST
E DISP
OSAL
FACI
LITIES
Italian contractors are running 686 construction sites internationally for almost € 90.8 billion.
Value of concessions are approximately € 37.5 billion.
Construction Value of Contracts’ average BacklogSites n. Contracts amount
million euro million euro
CONSTRUCTION
New Contracts in 2016 244 20,812.0 15,406.1
Total 686 90,785.2 52,616.6
CONCESSIONS
New Concessions in 2016 3 1,248.2
Total 21 37,475.1 1,784.5
Summary Amount of Contracts per Sector (% on Total Revenues)
Geographic Distribution of New Contracts 2016
Contracts’ average amount by geographic area (million euro)
Major works are located in Oceania and Europe Extra EU. Average amount is € 131.0 million.
0
50
100
150
200
250
300
350
Ocea
nia
Euro
pe ex
tra EU
Midd
le Ea
st
Sout
h Am
erica
Euro
pean
Unio
n
North
Am
erica
Sub-
Saha
rian A
frica
Asia
Cent
ral A
mer
ica
North
Afri
ca
341.7
231.8
97.5 90.8 81.244.2
107.2150.4 134.8
Average = 131.0
200.9
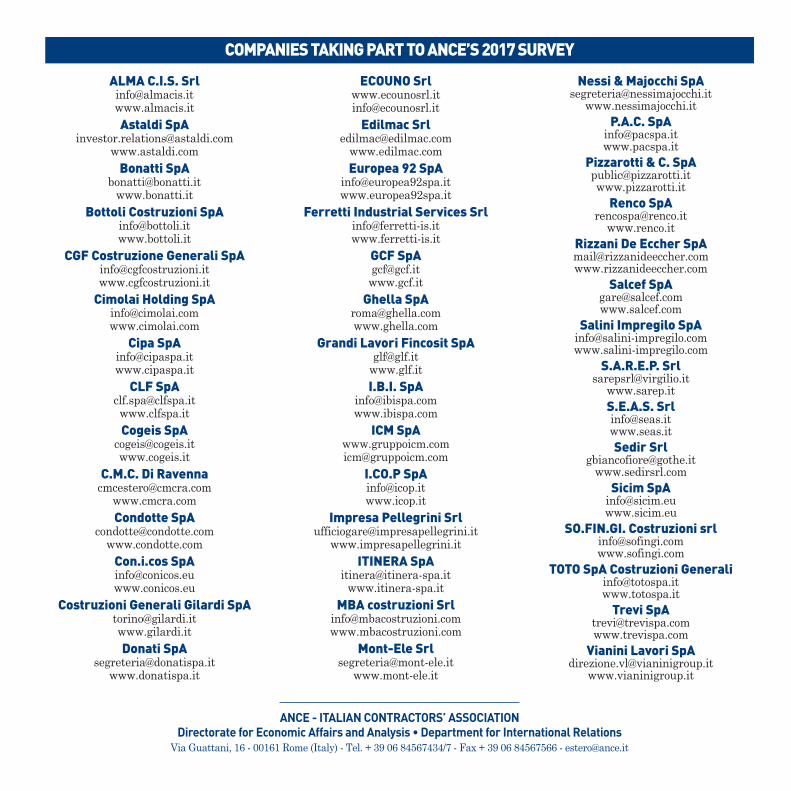
COMPANIES TAKING PART TO ANCE’S 2017 SURVEY
ANCE - ITALIAN CONTRACTORS’ ASSOCIATIONDirectorate for Economic Affairs and Analysis • Department for International Relations
Via Guattani, 16 - 00161 Rome (Italy) - Tel. + 39 06 84567434/7 - Fax + 39 06 84567566 - [email protected]
ALMA C.I.S. [email protected] www.almacis.itAstaldi SpA
Bonatti [email protected]
www.bonatti.itBottoli Costruzioni SpA
CGF Costruzione Generali [email protected] www.cgfcostruzioni.it
Cimolai Holding [email protected]
Cipa [email protected]
CLF [email protected] SpA
C.M.C. Di [email protected]
www.cmcra.comCondotte SpA
Con.i.cos [email protected]
Costruzioni Generali Gilardi [email protected] SpA
ECOUNO [email protected]
Edilmac [email protected]
www.edilmac.comEuropea 92 SpA
Ferretti Industrial Services [email protected]
www.gcf.itGhella SpA
Grandi Lavori Fincosit [email protected]
www.glf.itI.B.I. SpA
ICM SpAwww.gruppoicm.com [email protected]
I.CO.P [email protected]
Impresa Pellegrini [email protected]
www.impresapellegrini.it ITINERA SpA
MBA costruzioni [email protected]
Mont-Ele [email protected]
www.mont-ele.it
Nessi & Majocchi [email protected]
www.nessimajocchi.itP.A.C. SpA
Pizzarotti & C. [email protected]
Renco [email protected]
www.renco.itRizzani De Eccher [email protected]
Salcef [email protected]
Salini Impregilo [email protected]
S.A.R.E.P. [email protected]
www.sarep.it S.E.A.S. [email protected] Srl
Sicim [email protected]
SO.FIN.GI. Costruzioni [email protected]
TOTO SpA Costruzioni Generali [email protected]
Trevi [email protected]
Vianini Lavori [email protected]
www.vianinigroup.it