BlogMyDataA Virtual Research Environment for collaborative visualization of environmental data
Andrew Milsted, Jeremy FreyDepartment of Chemistry, University of Southampton
Jon Blower, Adit SantokheeReading e-Science Centre, University of Reading
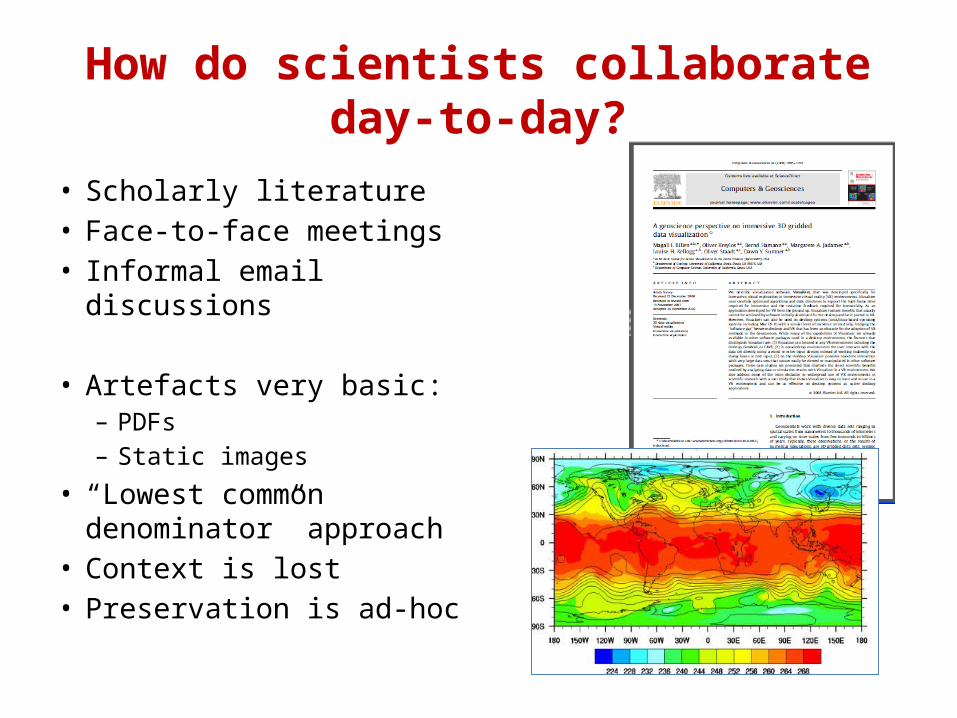
How do scientists collaborateday-to-day?
• Scholarly literature• Face-to-face meetings• Informal email discussions
• Artefacts very basic:– PDFs– Static images
• “Lowest common denominator” approach
• Context is lost• Preservation is ad-hoc
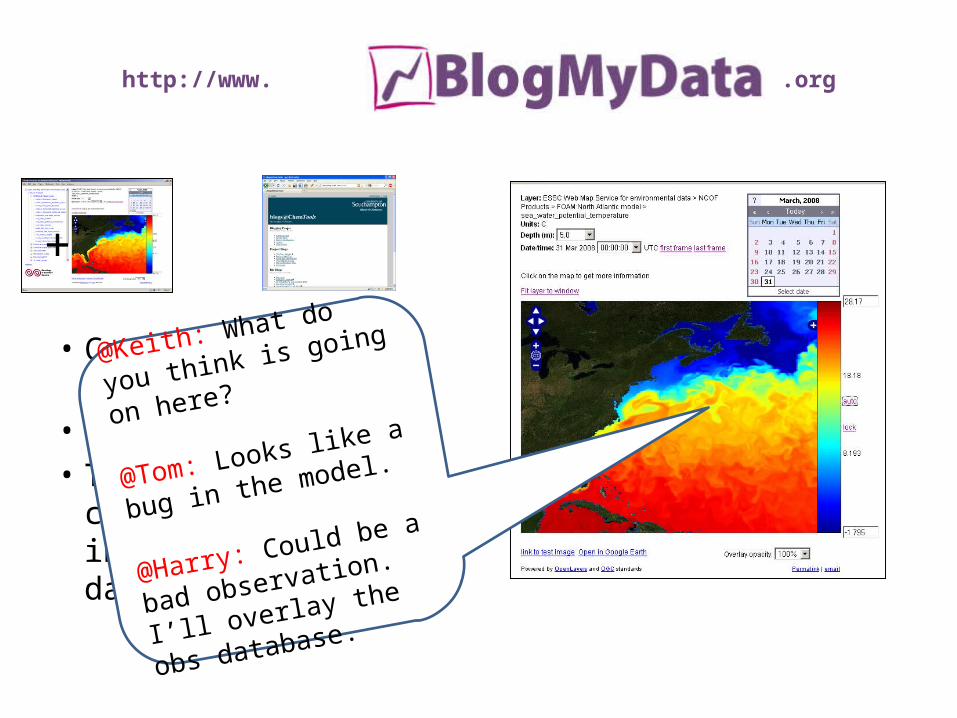
http://www. .org
• Combines web-based visualization…
• With a blog engine…• To create a VRE for
collaborative interpretation of data
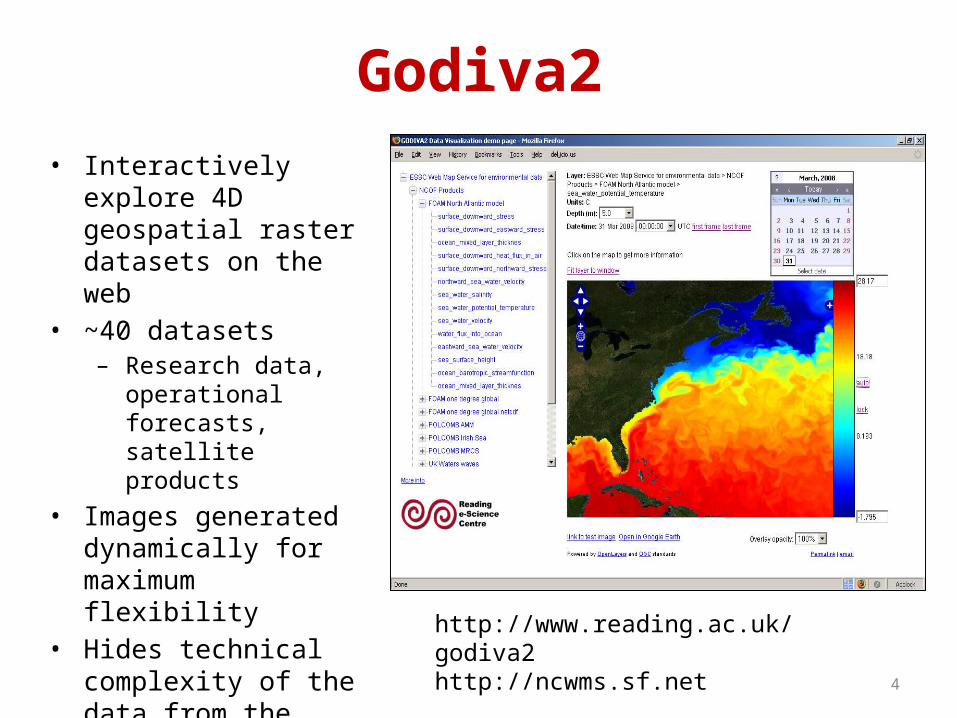
www.rdg.ac.uk/godiva2
+ =blogs.chem.soton.ac.uk
@Keith: What do you think
is going on here?
@Tom: Looks like a bug in
the model.
@Harry: Could be a bad
observation. I’ll overlay
the obs database.
4
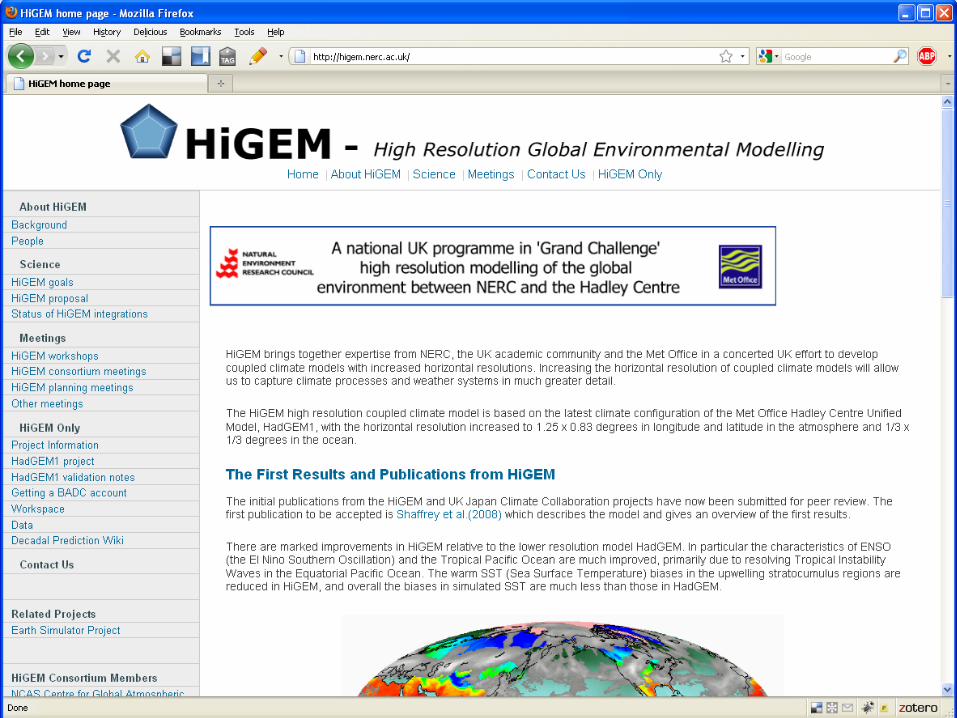
Godiva2• Interactively explore 4D
geospatial raster datasets on the web
• ~40 datasets– Research data,
operational forecasts, satellite products
• Images generated dynamically for maximum flexibility
• Hides technical complexity of the data from the users
http://www.reading.ac.uk/godiva2http://ncwms.sf.net
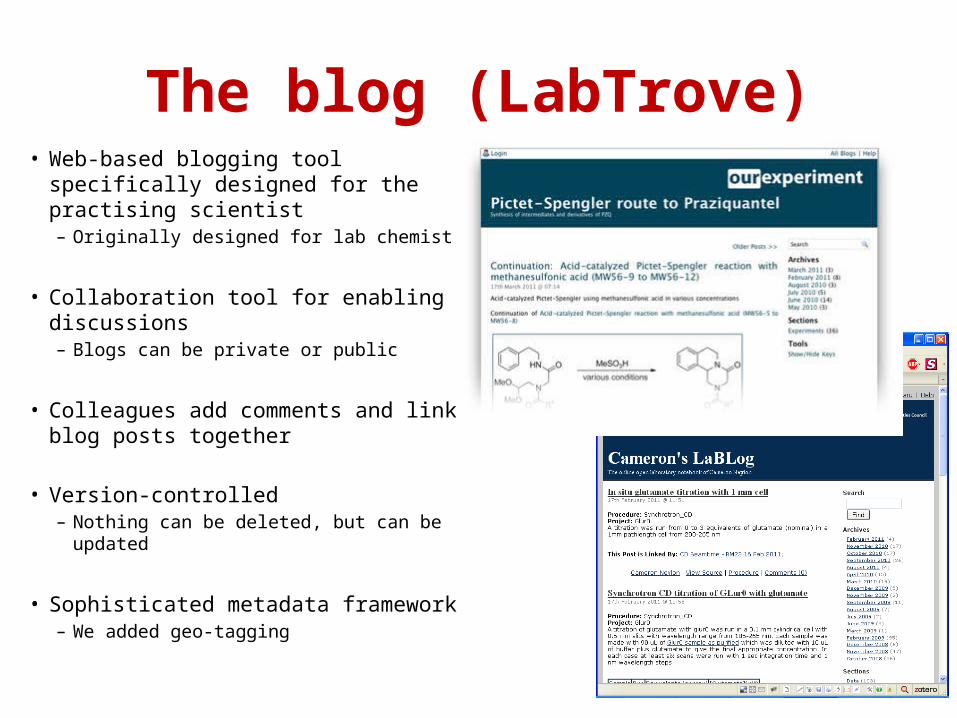
The blog (LabTrove)• Web-based blogging tool specifically
designed for the practising scientist– Originally designed for lab chemist
• Collaboration tool for enabling discussions– Blogs can be private or public
• Colleagues add comments and link blog posts together
• Version-controlled– Nothing can be deleted, but can be
updated
• Sophisticated metadata framework– We added geo-tagging
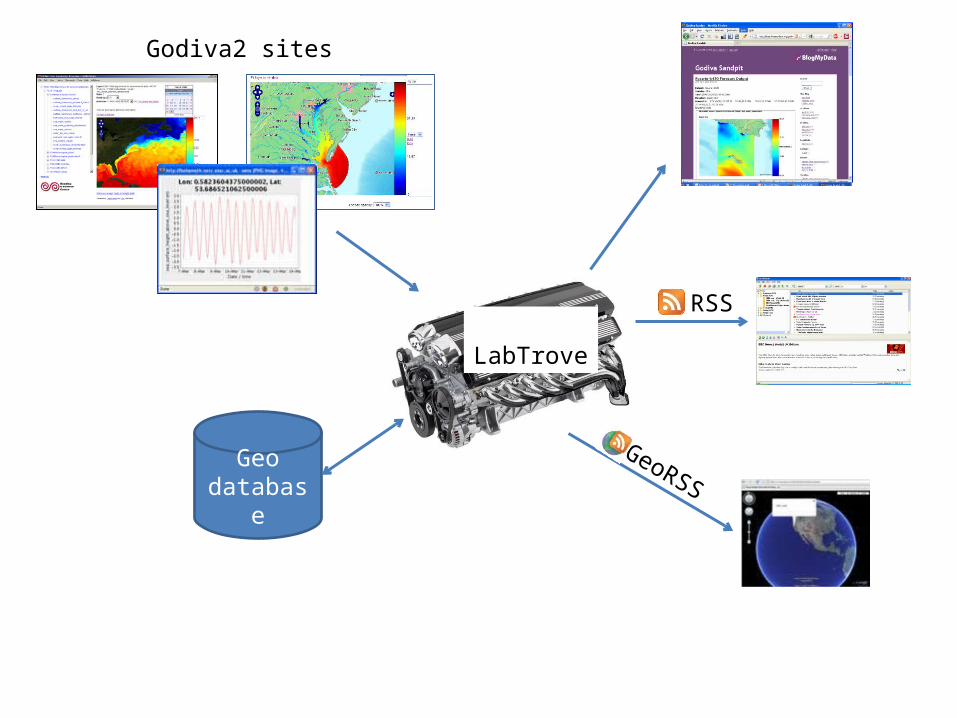
LabTrove
Geodatabase
Godiva2 sites
RSS
GeoRSS

Illustrative use cases
• Postdoc/PhD student:– Discover an interesting feature in a dataset– Post a blog entry asking a question
• Colleague at a different institute– Discovers others working on same dataset and/or same
geographic area– Discovers blog entry, posts explanatory comment
• PI/Manager:– Views “hot topics” feed (most active discussions)
Feature summary• Create blog entries about different kinds of visualizations
– Chiefly map plots and animations so far
• Doesn’t store any data: just metadata and links
• Can highlight a point of interest– “What’s going on at this location?”
• Lots of metadata automatically captured– User dataset, variable, plot type– Geospatial and temporal context– Posts can be filtered on this metadata– Original visualization can be regenerated
• Proof of concept! (for now)
• Demo video: see http://blogs.blogmydata.org/projectblog/398/New_demonstration_video.html
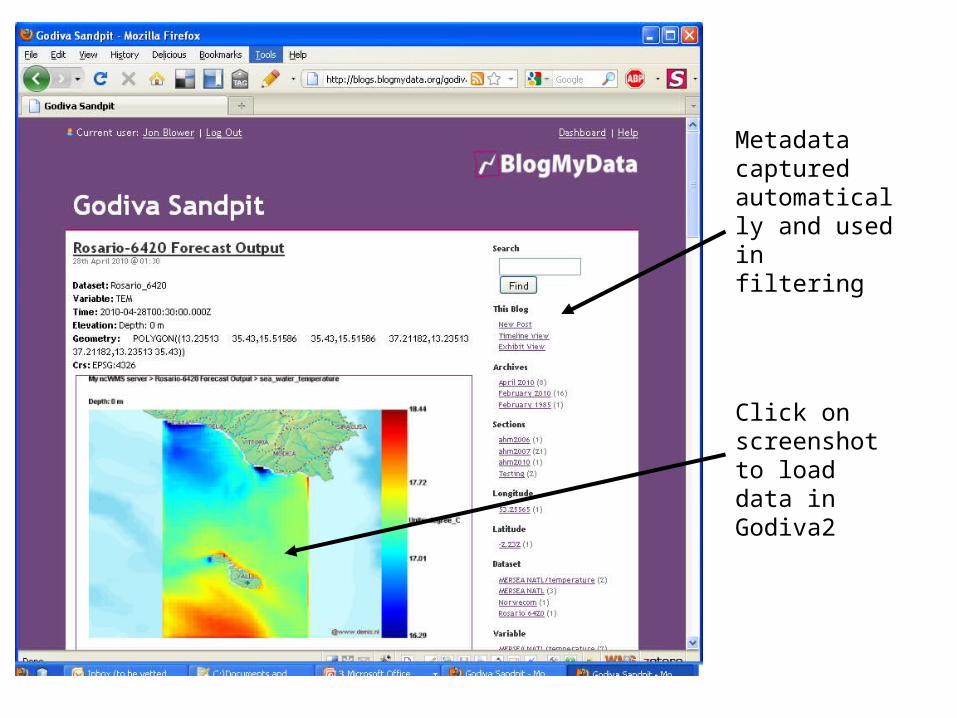
Metadata captured automatically and used in filtering
Click on screenshot to load data in Godiva2
User feedback guided development
• Privacy controls essential– We could give even more control in future
• “Content is king”– Prototype system needs to contain interesting
data!
• Animations difficult to handle but big attraction for users
13
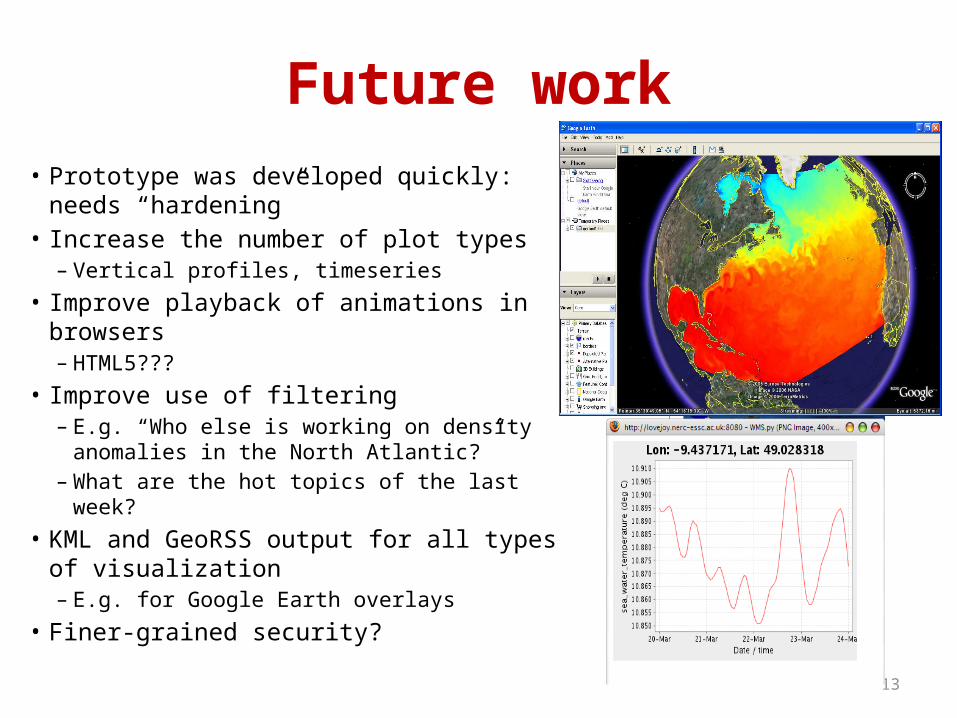
Future work• Prototype was developed quickly: needs
“hardening”• Increase the number of plot types
– Vertical profiles, timeseries• Improve playback of animations in browsers
– HTML5???• Improve use of filtering
– E.g. “Who else is working on density anomalies in the North Atlantic?”
– What are the hot topics of the last week?• KML and GeoRSS output for all types of
visualization– E.g. for Google Earth overlays
• Finer-grained security?