2017 Crosstabs for Delaware County
x1 Age * x2 Grade Crosstabulation
x2 Grade
Total6th 8th 10th 12th
x1 Age 10 or younger Count
% within x2 Grade
11 Count
% within x2 Grade
12 Count
% within x2 Grade
13 Count
% within x2 Grade
14 Count
% within x2 Grade
15 Count
% within x2 Grade
16 Count
% within x2 Grade
17 Count
% within x2 Grade
18 Count
% within x2 Grade
19 or older Count
% within x2 Grade
Total Count
% within x2 Grade
40 0 0 0 40
1.0% 0.0% 0.0% 0.0% 0.3%
3007 0 0 0 3007
75.3% 0.0% 0.0% 0.0% 21.2%
921 32 0 0 953
23.0% 0.9% 0.0% 0.0% 6.7%
27 2548 0 0 2575
0.7% 73.2% 0.0% 0.0% 18.1%
1 869 25 0 895
0.0% 25.0% 0.7% 0.0% 6.3%
0 31 2636 0 2667
0.0% 0.9% 69.8% 0.0% 18.8%
0 0 1067 23 1090
0.0% 0.0% 28.3% 0.8% 7.7%
0 0 43 2137 2180
0.0% 0.0% 1.1% 72.1% 15.3%
0 0 3 769 772
0.0% 0.0% 0.1% 26.0% 5.4%
0 0 0 34 34
0.0% 0.0% 0.0% 1.1% 0.2%
3996 3480 3774 2963 14213
100.0% 100.0% 100.0% 100.0% 100.0%
Page 1

x2 Grade
Frequency Percent Valid PercentCumulative
Percent
Valid 6th
8th
10th
12th
Total
3996 28.1 28.1 28.1
3480 24.5 24.5 52.6
3774 26.6 26.6 79.2
2963 20.8 20.8 100.0
14213 100.0 100.0
x3 Are you of Hispanic, Latino, or Spanish origin? * x2 Grade Crosstabulation
x2 Grade
Total6th 8th 10th 12th
x3 Are you of Hispanic, Latino, or Spanish origin?
No, not of Hispanic, Latino, or Spanish origin
Count
% within x2 Grade
Yes, Mexican, Mexican Am., Chicano
Count
% within x2 Grade
Yes, Puerto Rican Count
% within x2 Grade
Yes, Cuban Count
% within x2 Grade
Yes, another Hispanic, Latino, or Spanish origin
Count
% within x2 Grade
Total Count
% within x2 Grade
3144 2940 3404 2698 12186
86.8% 88.8% 92.1% 92.8% 90.0%
65 44 46 27 182
1.8% 1.3% 1.2% 0.9% 1.3%
211 168 101 77 557
5.8% 5.1% 2.7% 2.6% 4.1%
17 18 11 10 56
0.5% 0.5% 0.3% 0.3% 0.4%
186 142 134 96 558
5.1% 4.3% 3.6% 3.3% 4.1%
3623 3312 3696 2908 13539
100.0% 100.0% 100.0% 100.0% 100.0%
Page 2
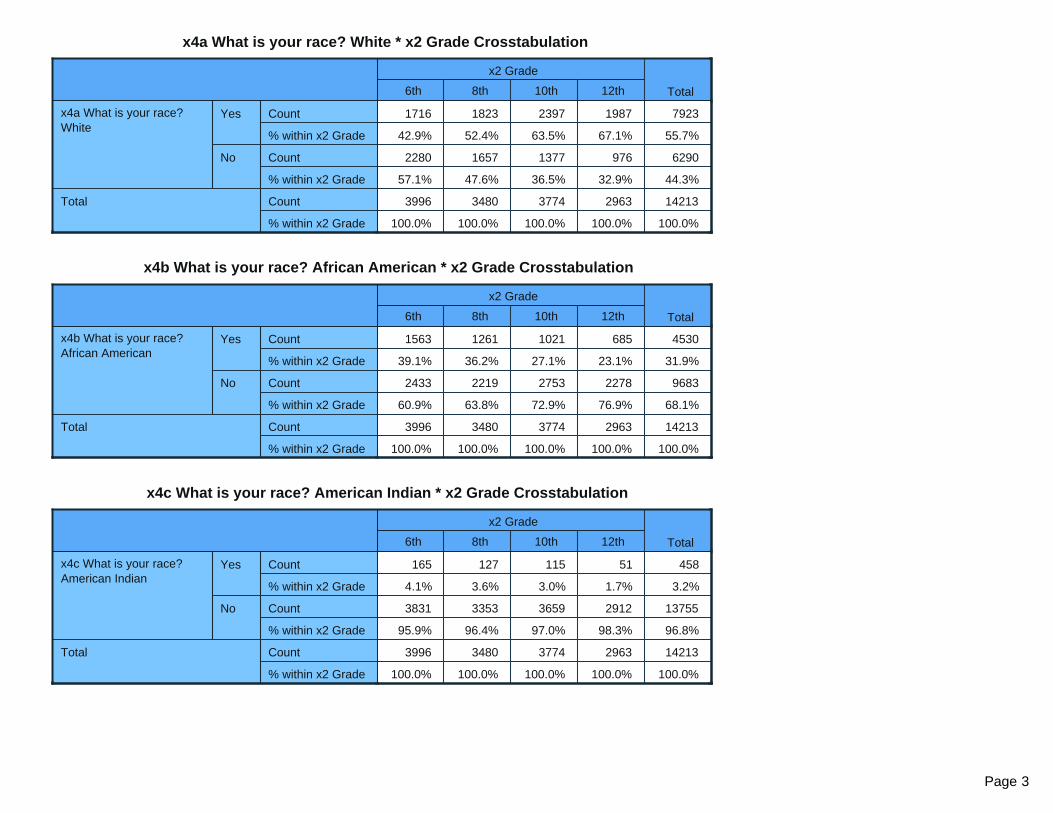
x4a What is your race? White * x2 Grade Crosstabulation
x2 Grade
Total6th 8th 10th 12th
x4a What is your race? White
Yes Count
% within x2 Grade
No Count
% within x2 Grade
Total Count
% within x2 Grade
1716 1823 2397 1987 7923
42.9% 52.4% 63.5% 67.1% 55.7%
2280 1657 1377 976 6290
57.1% 47.6% 36.5% 32.9% 44.3%
3996 3480 3774 2963 14213
100.0% 100.0% 100.0% 100.0% 100.0%
x4b What is your race? African American * x2 Grade Crosstabulation
x2 Grade
Total6th 8th 10th 12th
x4b What is your race? African American
Yes Count
% within x2 Grade
No Count
% within x2 Grade
Total Count
% within x2 Grade
1563 1261 1021 685 4530
39.1% 36.2% 27.1% 23.1% 31.9%
2433 2219 2753 2278 9683
60.9% 63.8% 72.9% 76.9% 68.1%
3996 3480 3774 2963 14213
100.0% 100.0% 100.0% 100.0% 100.0%
x4c What is your race? American Indian * x2 Grade Crosstabulation
x2 Grade
Total6th 8th 10th 12th
x4c What is your race? American Indian
Yes Count
% within x2 Grade
No Count
% within x2 Grade
Total Count
% within x2 Grade
165 127 115 51 458
4.1% 3.6% 3.0% 1.7% 3.2%
3831 3353 3659 2912 13755
95.9% 96.4% 97.0% 98.3% 96.8%
3996 3480 3774 2963 14213
100.0% 100.0% 100.0% 100.0% 100.0%
Page 3
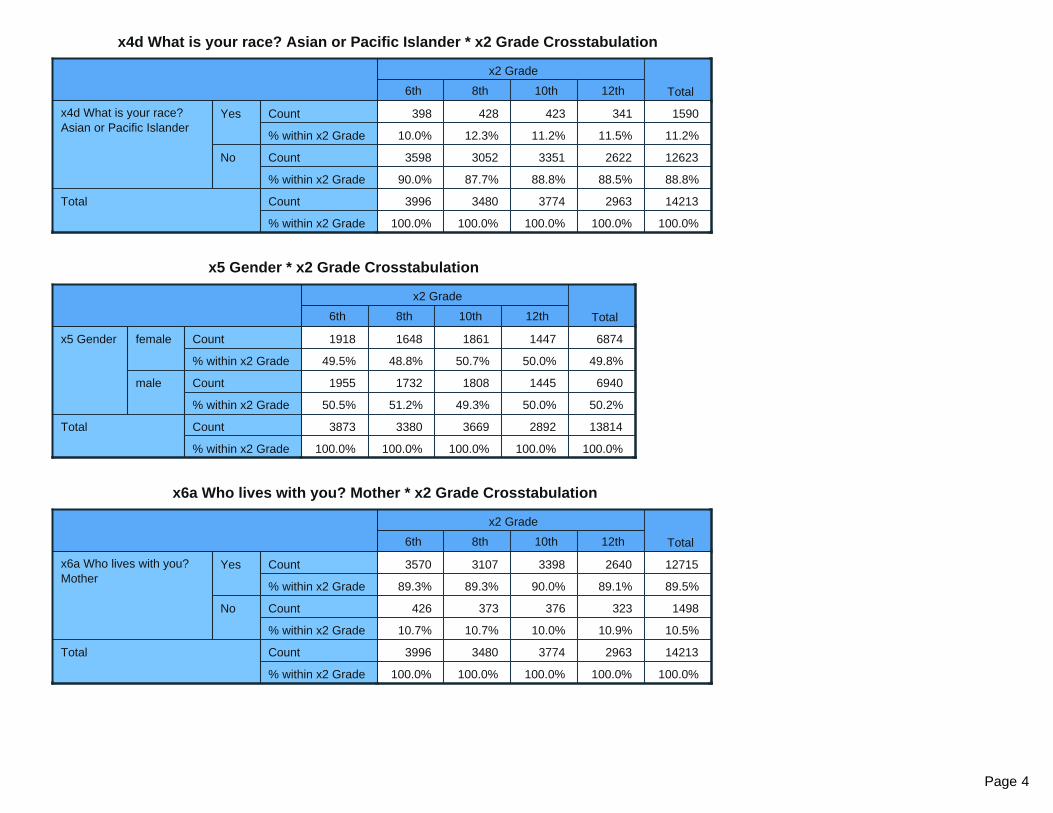
x4d What is your race? Asian or Pacific Islander * x2 Grade Crosstabulation
x2 Grade
Total6th 8th 10th 12th
x4d What is your race? Asian or Pacific Islander
Yes Count
% within x2 Grade
No Count
% within x2 Grade
Total Count
% within x2 Grade
398 428 423 341 1590
10.0% 12.3% 11.2% 11.5% 11.2%
3598 3052 3351 2622 12623
90.0% 87.7% 88.8% 88.5% 88.8%
3996 3480 3774 2963 14213
100.0% 100.0% 100.0% 100.0% 100.0%
x5 Gender * x2 Grade Crosstabulation
x2 Grade
Total6th 8th 10th 12th
x5 Gender female Count
% within x2 Grade
male Count
% within x2 Grade
Total Count
% within x2 Grade
1918 1648 1861 1447 6874
49.5% 48.8% 50.7% 50.0% 49.8%
1955 1732 1808 1445 6940
50.5% 51.2% 49.3% 50.0% 50.2%
3873 3380 3669 2892 13814
100.0% 100.0% 100.0% 100.0% 100.0%
x6a Who lives with you? Mother * x2 Grade Crosstabulation
x2 Grade
Total6th 8th 10th 12th
x6a Who lives with you? Mother
Yes Count
% within x2 Grade
No Count
% within x2 Grade
Total Count
% within x2 Grade
3570 3107 3398 2640 12715
89.3% 89.3% 90.0% 89.1% 89.5%
426 373 376 323 1498
10.7% 10.7% 10.0% 10.9% 10.5%
3996 3480 3774 2963 14213
100.0% 100.0% 100.0% 100.0% 100.0%
Page 4
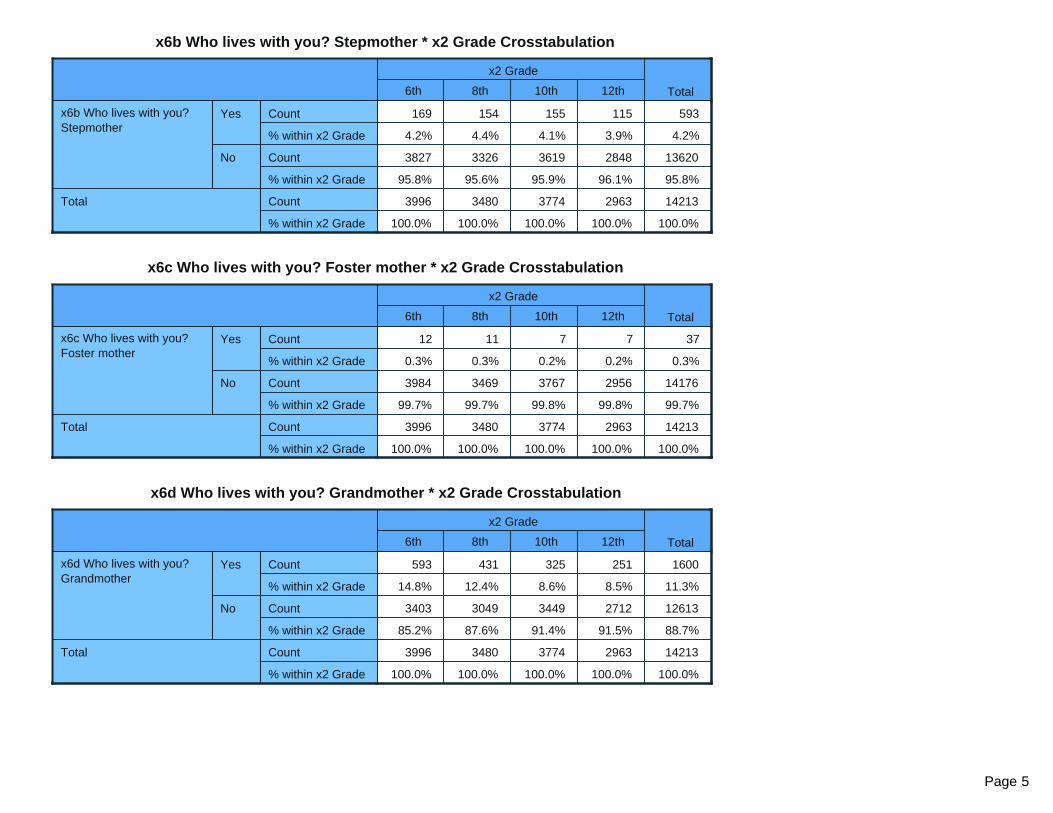
x6b Who lives with you? Stepmother * x2 Grade Crosstabulation
x2 Grade
Total6th 8th 10th 12th
x6b Who lives with you? Stepmother
Yes Count
% within x2 Grade
No Count
% within x2 Grade
Total Count
% within x2 Grade
169 154 155 115 593
4.2% 4.4% 4.1% 3.9% 4.2%
3827 3326 3619 2848 13620
95.8% 95.6% 95.9% 96.1% 95.8%
3996 3480 3774 2963 14213
100.0% 100.0% 100.0% 100.0% 100.0%
x6c Who lives with you? Foster mother * x2 Grade Crosstabulation
x2 Grade
Total6th 8th 10th 12th
x6c Who lives with you? Foster mother
Yes Count
% within x2 Grade
No Count
% within x2 Grade
Total Count
% within x2 Grade
12 11 7 7 37
0.3% 0.3% 0.2% 0.2% 0.3%
3984 3469 3767 2956 14176
99.7% 99.7% 99.8% 99.8% 99.7%
3996 3480 3774 2963 14213
100.0% 100.0% 100.0% 100.0% 100.0%
x6d Who lives with you? Grandmother * x2 Grade Crosstabulation
x2 Grade
Total6th 8th 10th 12th
x6d Who lives with you? Grandmother
Yes Count
% within x2 Grade
No Count
% within x2 Grade
Total Count
% within x2 Grade
593 431 325 251 1600
14.8% 12.4% 8.6% 8.5% 11.3%
3403 3049 3449 2712 12613
85.2% 87.6% 91.4% 91.5% 88.7%
3996 3480 3774 2963 14213
100.0% 100.0% 100.0% 100.0% 100.0%
Page 5

x6e Who lives with you? Aunt * x2 Grade Crosstabulation
x2 Grade
Total6th 8th 10th 12th
x6e Who lives with you? Aunt
Yes Count
% within x2 Grade
No Count
% within x2 Grade
Total Count
% within x2 Grade
256 174 145 84 659
6.4% 5.0% 3.8% 2.8% 4.6%
3740 3306 3629 2879 13554
93.6% 95.0% 96.2% 97.2% 95.4%
3996 3480 3774 2963 14213
100.0% 100.0% 100.0% 100.0% 100.0%
x6f Who lives with you? Father * x2 Grade Crosstabulation
x2 Grade
Total6th 8th 10th 12th
x6f Who lives with you? Father
Yes Count
% within x2 Grade
No Count
% within x2 Grade
Total Count
% within x2 Grade
2476 2196 2527 1955 9154
62.0% 63.1% 67.0% 66.0% 64.4%
1520 1284 1247 1008 5059
38.0% 36.9% 33.0% 34.0% 35.6%
3996 3480 3774 2963 14213
100.0% 100.0% 100.0% 100.0% 100.0%
x6g Who lives with you? Stepfather * x2 Grade Crosstabulation
x2 Grade
Total6th 8th 10th 12th
x6g Who lives with you? Stepfather
Yes Count
% within x2 Grade
No Count
% within x2 Grade
Total Count
% within x2 Grade
414 385 376 234 1409
10.4% 11.1% 10.0% 7.9% 9.9%
3582 3095 3398 2729 12804
89.6% 88.9% 90.0% 92.1% 90.1%
3996 3480 3774 2963 14213
100.0% 100.0% 100.0% 100.0% 100.0%
Page 6
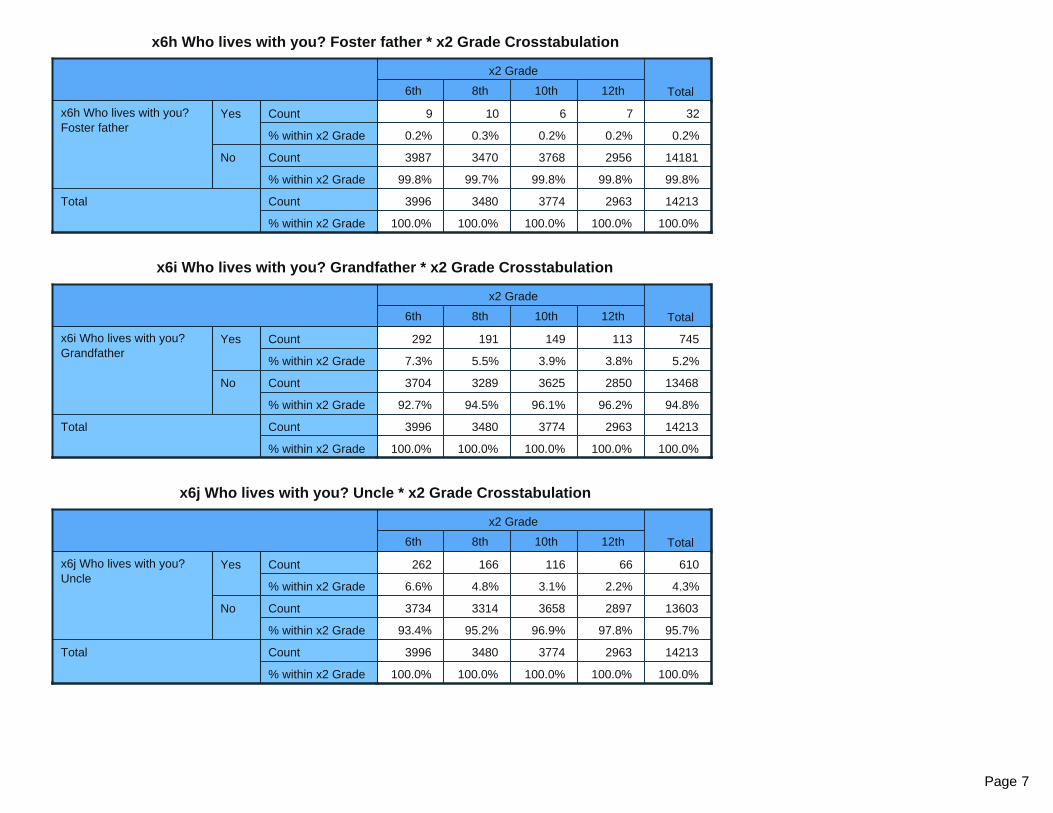
x6h Who lives with you? Foster father * x2 Grade Crosstabulation
x2 Grade
Total6th 8th 10th 12th
x6h Who lives with you? Foster father
Yes Count
% within x2 Grade
No Count
% within x2 Grade
Total Count
% within x2 Grade
9 10 6 7 32
0.2% 0.3% 0.2% 0.2% 0.2%
3987 3470 3768 2956 14181
99.8% 99.7% 99.8% 99.8% 99.8%
3996 3480 3774 2963 14213
100.0% 100.0% 100.0% 100.0% 100.0%
x6i Who lives with you? Grandfather * x2 Grade Crosstabulation
x2 Grade
Total6th 8th 10th 12th
x6i Who lives with you? Grandfather
Yes Count
% within x2 Grade
No Count
% within x2 Grade
Total Count
% within x2 Grade
292 191 149 113 745
7.3% 5.5% 3.9% 3.8% 5.2%
3704 3289 3625 2850 13468
92.7% 94.5% 96.1% 96.2% 94.8%
3996 3480 3774 2963 14213
100.0% 100.0% 100.0% 100.0% 100.0%
x6j Who lives with you? Uncle * x2 Grade Crosstabulation
x2 Grade
Total6th 8th 10th 12th
x6j Who lives with you? Uncle
Yes Count
% within x2 Grade
No Count
% within x2 Grade
Total Count
% within x2 Grade
262 166 116 66 610
6.6% 4.8% 3.1% 2.2% 4.3%
3734 3314 3658 2897 13603
93.4% 95.2% 96.9% 97.8% 95.7%
3996 3480 3774 2963 14213
100.0% 100.0% 100.0% 100.0% 100.0%
Page 7
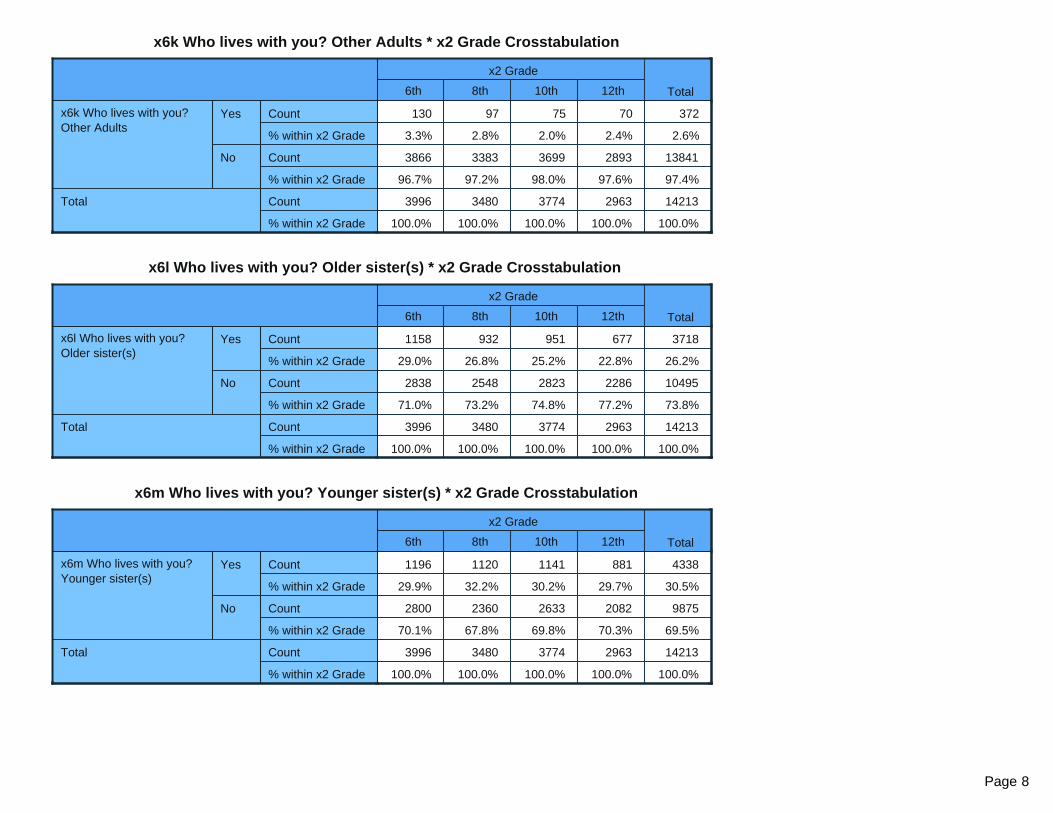
x6k Who lives with you? Other Adults * x2 Grade Crosstabulation
x2 Grade
Total6th 8th 10th 12th
x6k Who lives with you? Other Adults
Yes Count
% within x2 Grade
No Count
% within x2 Grade
Total Count
% within x2 Grade
130 97 75 70 372
3.3% 2.8% 2.0% 2.4% 2.6%
3866 3383 3699 2893 13841
96.7% 97.2% 98.0% 97.6% 97.4%
3996 3480 3774 2963 14213
100.0% 100.0% 100.0% 100.0% 100.0%
x6l Who lives with you? Older sister(s) * x2 Grade Crosstabulation
x2 Grade
Total6th 8th 10th 12th
x6l Who lives with you? Older sister(s)
Yes Count
% within x2 Grade
No Count
% within x2 Grade
Total Count
% within x2 Grade
1158 932 951 677 3718
29.0% 26.8% 25.2% 22.8% 26.2%
2838 2548 2823 2286 10495
71.0% 73.2% 74.8% 77.2% 73.8%
3996 3480 3774 2963 14213
100.0% 100.0% 100.0% 100.0% 100.0%
x6m Who lives with you? Younger sister(s) * x2 Grade Crosstabulation
x2 Grade
Total6th 8th 10th 12th
x6m Who lives with you? Younger sister(s)
Yes Count
% within x2 Grade
No Count
% within x2 Grade
Total Count
% within x2 Grade
1196 1120 1141 881 4338
29.9% 32.2% 30.2% 29.7% 30.5%
2800 2360 2633 2082 9875
70.1% 67.8% 69.8% 70.3% 69.5%
3996 3480 3774 2963 14213
100.0% 100.0% 100.0% 100.0% 100.0%
Page 8
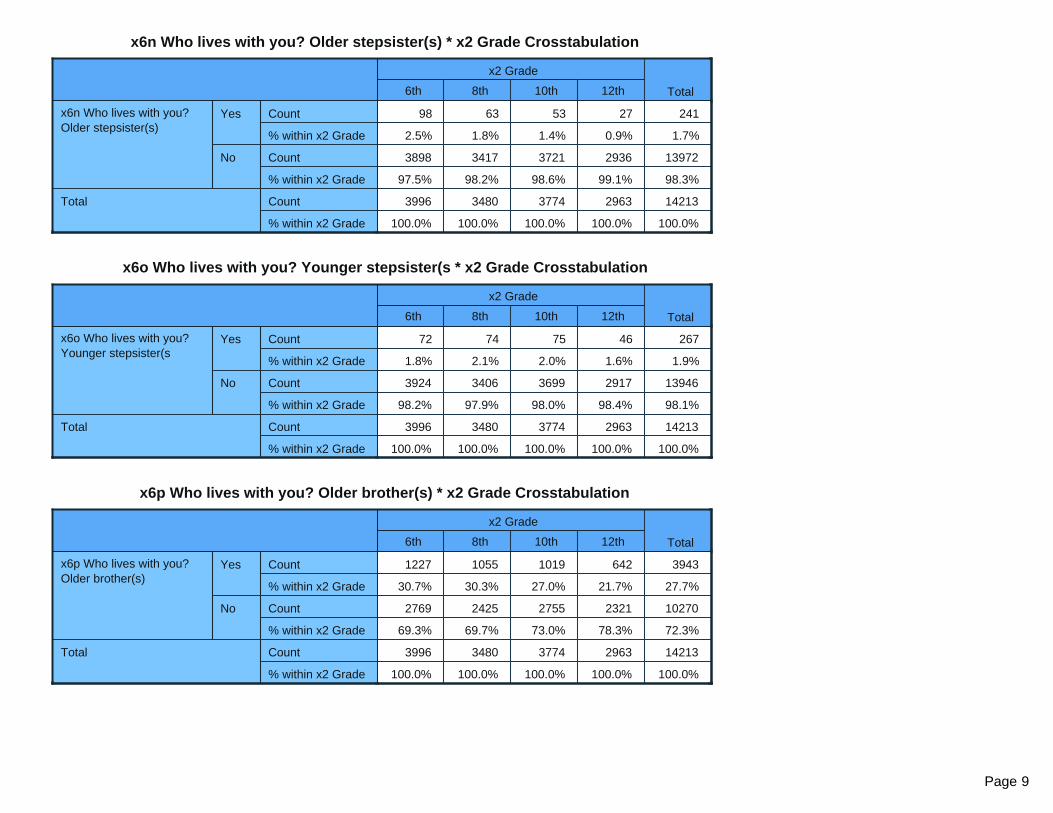
x6n Who lives with you? Older stepsister(s) * x2 Grade Crosstabulation
x2 Grade
Total6th 8th 10th 12th
x6n Who lives with you? Older stepsister(s)
Yes Count
% within x2 Grade
No Count
% within x2 Grade
Total Count
% within x2 Grade
98 63 53 27 241
2.5% 1.8% 1.4% 0.9% 1.7%
3898 3417 3721 2936 13972
97.5% 98.2% 98.6% 99.1% 98.3%
3996 3480 3774 2963 14213
100.0% 100.0% 100.0% 100.0% 100.0%
x6o Who lives with you? Younger stepsister(s * x2 Grade Crosstabulation
x2 Grade
Total6th 8th 10th 12th
x6o Who lives with you? Younger stepsister(s
Yes Count
% within x2 Grade
No Count
% within x2 Grade
Total Count
% within x2 Grade
72 74 75 46 267
1.8% 2.1% 2.0% 1.6% 1.9%
3924 3406 3699 2917 13946
98.2% 97.9% 98.0% 98.4% 98.1%
3996 3480 3774 2963 14213
100.0% 100.0% 100.0% 100.0% 100.0%
x6p Who lives with you? Older brother(s) * x2 Grade Crosstabulation
x2 Grade
Total6th 8th 10th 12th
x6p Who lives with you? Older brother(s)
Yes Count
% within x2 Grade
No Count
% within x2 Grade
Total Count
% within x2 Grade
1227 1055 1019 642 3943
30.7% 30.3% 27.0% 21.7% 27.7%
2769 2425 2755 2321 10270
69.3% 69.7% 73.0% 78.3% 72.3%
3996 3480 3774 2963 14213
100.0% 100.0% 100.0% 100.0% 100.0%
Page 9

x6q Who lives with you? Younger brother(s) * x2 Grade Crosstabulation
x2 Grade
Total6th 8th 10th 12th
x6q Who lives with you? Younger brother(s)
Yes Count
% within x2 Grade
No Count
% within x2 Grade
Total Count
% within x2 Grade
1184 1085 1220 883 4372
29.6% 31.2% 32.3% 29.8% 30.8%
2812 2395 2554 2080 9841
70.4% 68.8% 67.7% 70.2% 69.2%
3996 3480 3774 2963 14213
100.0% 100.0% 100.0% 100.0% 100.0%
x6r Who lives with you? Older stepbrother(s) * x2 Grade Crosstabulation
x2 Grade
Total6th 8th 10th 12th
x6r Who lives with you? Older stepbrother(s)
Yes Count
% within x2 Grade
No Count
% within x2 Grade
Total Count
% within x2 Grade
80 90 50 34 254
2.0% 2.6% 1.3% 1.1% 1.8%
3916 3390 3724 2929 13959
98.0% 97.4% 98.7% 98.9% 98.2%
3996 3480 3774 2963 14213
100.0% 100.0% 100.0% 100.0% 100.0%
x6s Who lives with you? Younger stepbrother(s) * x2 Grade Crosstabulation
x2 Grade
Total6th 8th 10th 12th
x6s Who lives with you? Younger stepbrother(s)
Yes Count
% within x2 Grade
No Count
% within x2 Grade
Total Count
% within x2 Grade
81 73 68 36 258
2.0% 2.1% 1.8% 1.2% 1.8%
3915 3407 3706 2927 13955
98.0% 97.9% 98.2% 98.8% 98.2%
3996 3480 3774 2963 14213
100.0% 100.0% 100.0% 100.0% 100.0%
Page 10
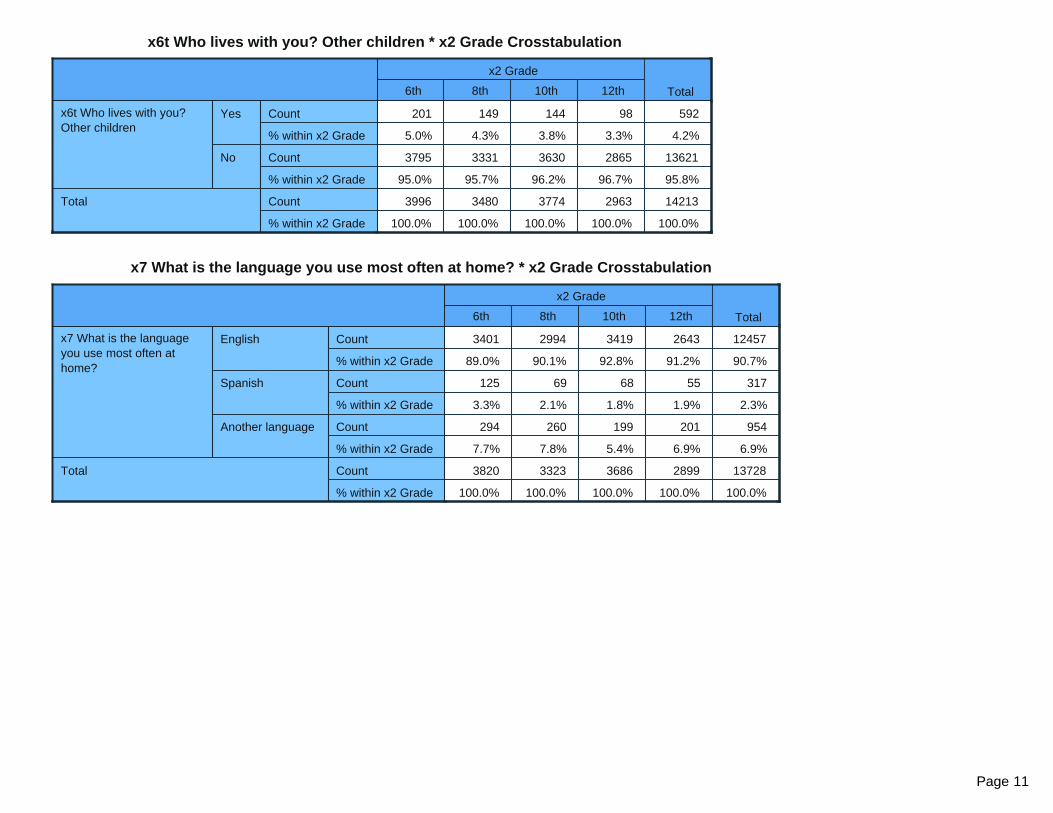
x6t Who lives with you? Other children * x2 Grade Crosstabulation
x2 Grade
Total6th 8th 10th 12th
x6t Who lives with you? Other children
Yes Count
% within x2 Grade
No Count
% within x2 Grade
Total Count
% within x2 Grade
201 149 144 98 592
5.0% 4.3% 3.8% 3.3% 4.2%
3795 3331 3630 2865 13621
95.0% 95.7% 96.2% 96.7% 95.8%
3996 3480 3774 2963 14213
100.0% 100.0% 100.0% 100.0% 100.0%
x7 What is the language you use most often at home? * x2 Grade Crosstabulation
x2 Grade
Total6th 8th 10th 12th
x7 What is the language you use most often at home?
English Count
% within x2 Grade
Spanish Count
% within x2 Grade
Another language Count
% within x2 Grade
Total Count
% within x2 Grade
3401 2994 3419 2643 12457
89.0% 90.1% 92.8% 91.2% 90.7%
125 69 68 55 317
3.3% 2.1% 1.8% 1.9% 2.3%
294 260 199 201 954
7.7% 7.8% 5.4% 6.9% 6.9%
3820 3323 3686 2899 13728
100.0% 100.0% 100.0% 100.0% 100.0%
Page 11

x8a How wrong do your parents feel it would be for YOU to drink alcohol regularly? * x2 Grade Crosstabulation
x2 Grade
Total6th 8th 10th 12th
x8a How wrong do your parents feel it would be for YOU to drink alcohol regularly?
Not at all wrong Count
% within x2 Grade
A little bit wrong Count
% within x2 Grade
Wrong Count
% within x2 Grade
Very wrong Count
% within x2 Grade
Total Count
% within x2 Grade
178 94 103 140 515
4.8% 2.8% 2.8% 4.8% 3.8%
103 122 237 320 782
2.8% 3.6% 6.4% 11.0% 5.7%
354 467 757 682 2260
9.5% 13.9% 20.5% 23.5% 16.5%
3082 2669 2589 1760 10100
82.9% 79.6% 70.2% 60.6% 74.0%
3717 3352 3686 2902 13657
100.0% 100.0% 100.0% 100.0% 100.0%
x8b How wrong do your parents feel it would be for YOU use prescription drugs not prescribed to you? * x2 Grade Crosstabulation
x2 Grade
Total6th 8th 10th 12th
x8b How wrong do your parents feel it would be for YOU use prescription drugs not prescribed to you?
Not at all wrong Count
% within x2 Grade
A little bit wrong Count
% within x2 Grade
Wrong Count
% within x2 Grade
Very wrong Count
% within x2 Grade
Total Count
% within x2 Grade
239 167 121 115 642
6.7% 5.1% 3.3% 4.0% 4.8%
101 90 114 90 395
2.8% 2.7% 3.1% 3.1% 2.9%
322 447 450 340 1559
9.0% 13.5% 12.3% 11.8% 11.6%
2913 2600 2981 2340 10834
81.5% 78.7% 81.3% 81.1% 80.7%
3575 3304 3666 2885 13430
100.0% 100.0% 100.0% 100.0% 100.0%
Page 12
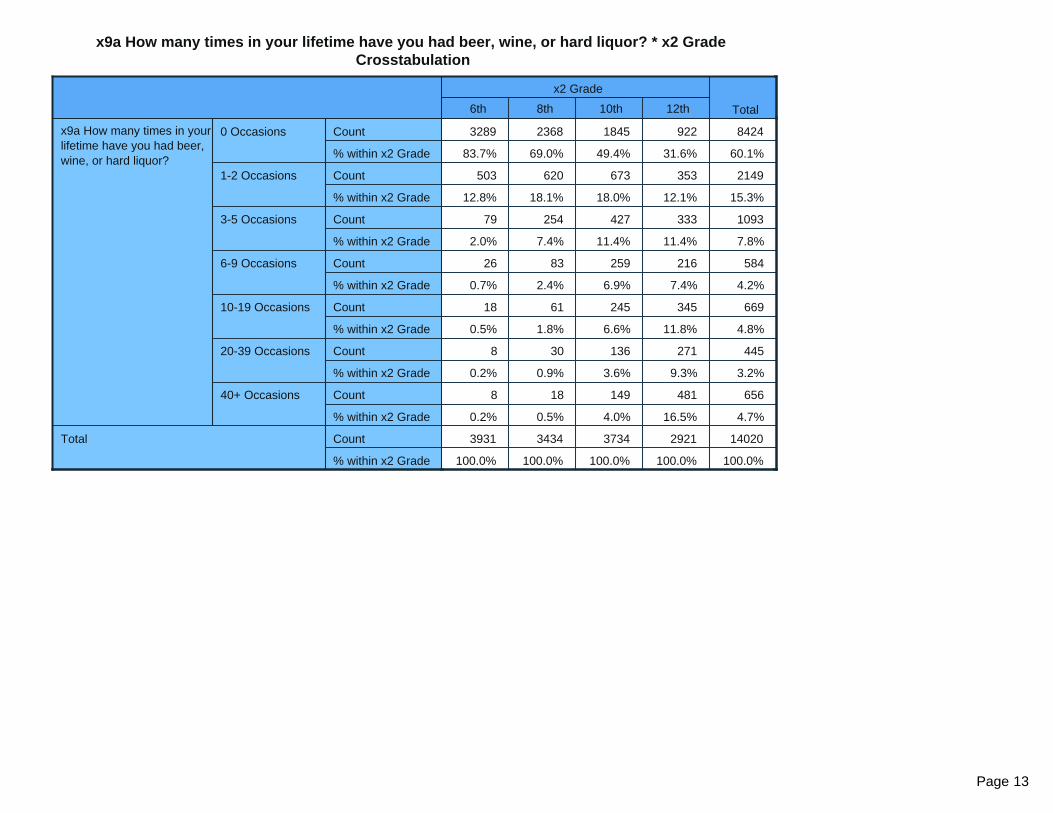
x9a How many times in your lifetime have you had beer, wine, or hard liquor? * x2 Grade Crosstabulation
x2 Grade
Total6th 8th 10th 12th
x9a How many times in your lifetime have you had beer, wine, or hard liquor?
0 Occasions Count
% within x2 Grade
1-2 Occasions Count
% within x2 Grade
3-5 Occasions Count
% within x2 Grade
6-9 Occasions Count
% within x2 Grade
10-19 Occasions Count
% within x2 Grade
20-39 Occasions Count
% within x2 Grade
40+ Occasions Count
% within x2 Grade
Total Count
% within x2 Grade
3289 2368 1845 922 8424
83.7% 69.0% 49.4% 31.6% 60.1%
503 620 673 353 2149
12.8% 18.1% 18.0% 12.1% 15.3%
79 254 427 333 1093
2.0% 7.4% 11.4% 11.4% 7.8%
26 83 259 216 584
0.7% 2.4% 6.9% 7.4% 4.2%
18 61 245 345 669
0.5% 1.8% 6.6% 11.8% 4.8%
8 30 136 271 445
0.2% 0.9% 3.6% 9.3% 3.2%
8 18 149 481 656
0.2% 0.5% 4.0% 16.5% 4.7%
3931 3434 3734 2921 14020
100.0% 100.0% 100.0% 100.0% 100.0%
Page 13

x9b How many times in your lifetime have you used marijuana (pot, hash, cannabis, weed)? * x2 Grade Crosstabulation
x2 Grade
Total6th 8th 10th 12th
x9b How many times in your lifetime have you used marijuana (pot, hash, cannabis, weed)?
0 Occasions Count
% within x2 Grade
1-2 Occasions Count
% within x2 Grade
3-5 Occasions Count
% within x2 Grade
6-9 Occasions Count
% within x2 Grade
10-19 Occasions Count
% within x2 Grade
20-39 Occasions Count
% within x2 Grade
40+ Occasions Count
% within x2 Grade
Total Count
% within x2 Grade
3773 3084 2750 1622 11229
98.3% 90.1% 73.8% 55.7% 80.8%
45 157 258 222 682
1.2% 4.6% 6.9% 7.6% 4.9%
10 68 154 171 403
0.3% 2.0% 4.1% 5.9% 2.9%
3 32 106 149 290
0.1% 0.9% 2.8% 5.1% 2.1%
1 34 129 157 321
0.0% 1.0% 3.5% 5.4% 2.3%
2 25 90 126 243
0.1% 0.7% 2.4% 4.3% 1.7%
5 22 237 464 728
0.1% 0.6% 6.4% 15.9% 5.2%
3839 3422 3724 2911 13896
100.0% 100.0% 100.0% 100.0% 100.0%
Page 14

x9c How many times in your lifetime have you sniffed glue, breathed the contents of an aerosol spray can, or inhaled other gases or sprays in order to get high? * x2 Grade Crosstabulation
x2 Grade
Total6th 8th 10th 12th
x9c How many times in your lifetime have you sniffed glue, breathed the contents of an aerosol spray can, or inhaled other gases or sprays in order to get high?
0 Occasions Count
% within x2 Grade
1-2 Occasions Count
% within x2 Grade
3-5 Occasions Count
% within x2 Grade
6-9 Occasions Count
% within x2 Grade
10-19 Occasions Count
% within x2 Grade
20-39 Occasions Count
% within x2 Grade
40+ Occasions Count
% within x2 Grade
Total Count
% within x2 Grade
3718 3279 3576 2793 13366
95.8% 95.7% 96.1% 96.0% 95.9%
103 95 80 66 344
2.7% 2.8% 2.1% 2.3% 2.5%
31 31 27 21 110
0.8% 0.9% 0.7% 0.7% 0.8%
15 10 15 9 49
0.4% 0.3% 0.4% 0.3% 0.4%
5 4 4 7 20
0.1% 0.1% 0.1% 0.2% 0.1%
5 5 7 4 21
0.1% 0.1% 0.2% 0.1% 0.2%
4 4 14 9 31
0.1% 0.1% 0.4% 0.3% 0.2%
3881 3428 3723 2909 13941
100.0% 100.0% 100.0% 100.0% 100.0%
Page 15
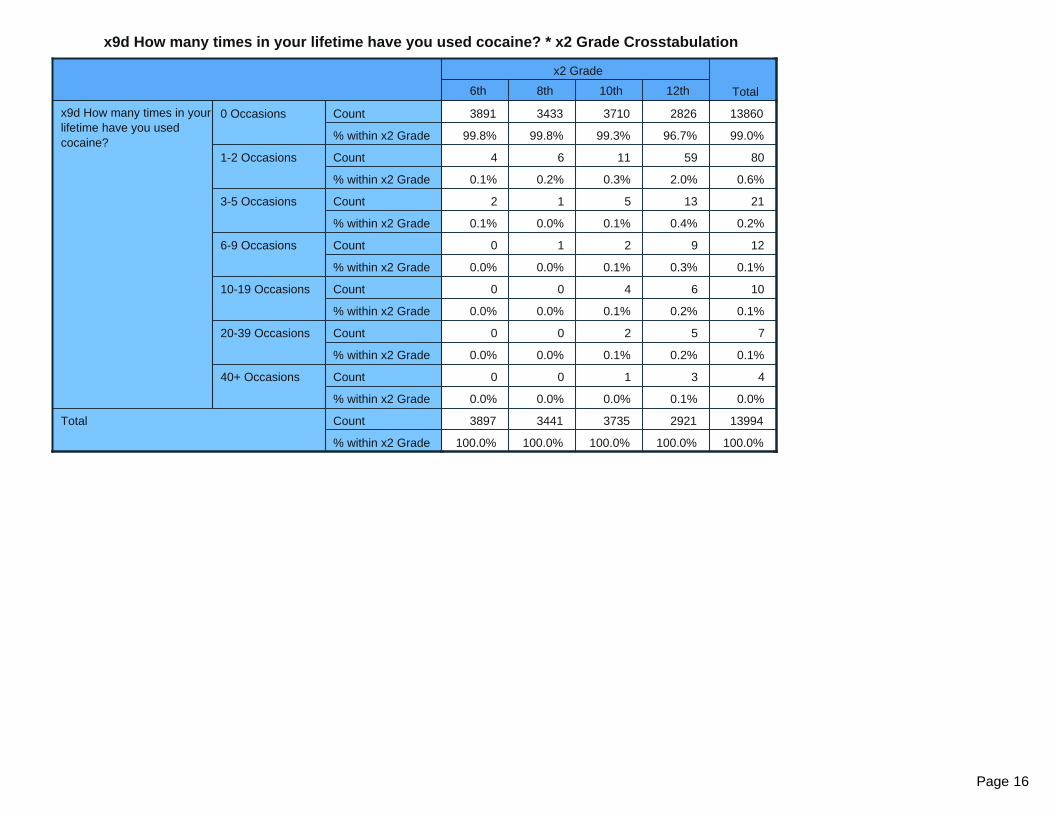
x9d How many times in your lifetime have you used cocaine? * x2 Grade Crosstabulation
x2 Grade
Total6th 8th 10th 12th
x9d How many times in your lifetime have you used cocaine?
0 Occasions Count
% within x2 Grade
1-2 Occasions Count
% within x2 Grade
3-5 Occasions Count
% within x2 Grade
6-9 Occasions Count
% within x2 Grade
10-19 Occasions Count
% within x2 Grade
20-39 Occasions Count
% within x2 Grade
40+ Occasions Count
% within x2 Grade
Total Count
% within x2 Grade
3891 3433 3710 2826 13860
99.8% 99.8% 99.3% 96.7% 99.0%
4 6 11 59 80
0.1% 0.2% 0.3% 2.0% 0.6%
2 1 5 13 21
0.1% 0.0% 0.1% 0.4% 0.2%
0 1 2 9 12
0.0% 0.0% 0.1% 0.3% 0.1%
0 0 4 6 10
0.0% 0.0% 0.1% 0.2% 0.1%
0 0 2 5 7
0.0% 0.0% 0.1% 0.2% 0.1%
0 0 1 3 4
0.0% 0.0% 0.0% 0.1% 0.0%
3897 3441 3735 2921 13994
100.0% 100.0% 100.0% 100.0% 100.0%
Page 16
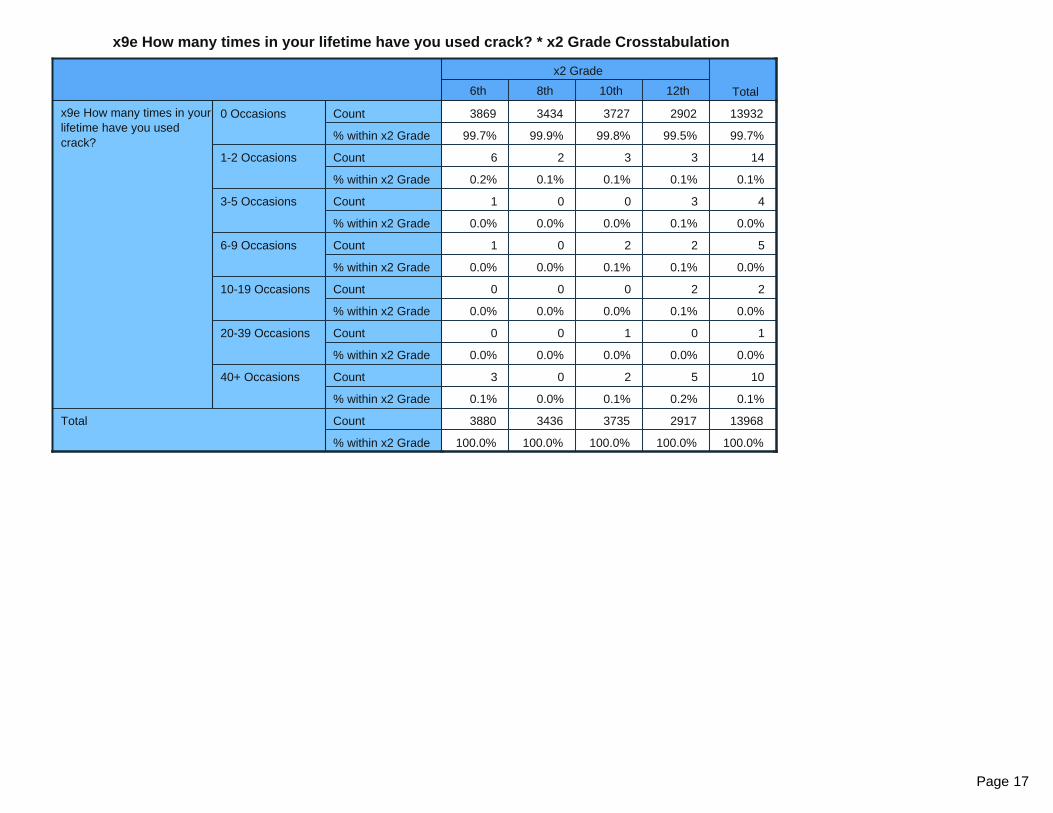
x9e How many times in your lifetime have you used crack? * x2 Grade Crosstabulation
x2 Grade
Total6th 8th 10th 12th
x9e How many times in your lifetime have you used crack?
0 Occasions Count
% within x2 Grade
1-2 Occasions Count
% within x2 Grade
3-5 Occasions Count
% within x2 Grade
6-9 Occasions Count
% within x2 Grade
10-19 Occasions Count
% within x2 Grade
20-39 Occasions Count
% within x2 Grade
40+ Occasions Count
% within x2 Grade
Total Count
% within x2 Grade
3869 3434 3727 2902 13932
99.7% 99.9% 99.8% 99.5% 99.7%
6 2 3 3 14
0.2% 0.1% 0.1% 0.1% 0.1%
1 0 0 3 4
0.0% 0.0% 0.0% 0.1% 0.0%
1 0 2 2 5
0.0% 0.0% 0.1% 0.1% 0.0%
0 0 0 2 2
0.0% 0.0% 0.0% 0.1% 0.0%
0 0 1 0 1
0.0% 0.0% 0.0% 0.0% 0.0%
3 0 2 5 10
0.1% 0.0% 0.1% 0.2% 0.1%
3880 3436 3735 2917 13968
100.0% 100.0% 100.0% 100.0% 100.0%
Page 17

x9f How many times in your lifetime have you used heroin? * x2 Grade Crosstabulation
x2 Grade
Total6th 8th 10th 12th
x9f How many times in your lifetime have you used heroin?
0 Occasions Count
% within x2 Grade
1-2 Occasions Count
% within x2 Grade
3-5 Occasions Count
% within x2 Grade
6-9 Occasions Count
% within x2 Grade
10-19 Occasions Count
% within x2 Grade
20-39 Occasions Count
% within x2 Grade
40+ Occasions Count
% within x2 Grade
Total Count
% within x2 Grade
3859 3421 3719 2900 13899
99.8% 99.9% 99.7% 99.6% 99.7%
4 2 5 7 18
0.1% 0.1% 0.1% 0.2% 0.1%
1 1 3 2 7
0.0% 0.0% 0.1% 0.1% 0.1%
1 0 0 0 1
0.0% 0.0% 0.0% 0.0% 0.0%
1 0 1 0 2
0.0% 0.0% 0.0% 0.0% 0.0%
0 0 1 2 3
0.0% 0.0% 0.0% 0.1% 0.0%
2 0 2 1 5
0.1% 0.0% 0.1% 0.0% 0.0%
3868 3424 3731 2912 13935
100.0% 100.0% 100.0% 100.0% 100.0%
Page 18

x9g How many times in your lifetime have you used hallucinogens (acid, LSD, shrooms)? * x2 Grade Crosstabulation
x2 Grade
Total6th 8th 10th 12th
x9g How many times in your lifetime have you used hallucinogens (acid, LSD, shrooms)?
0 Occasions Count
% within x2 Grade
1-2 Occasions Count
% within x2 Grade
3-5 Occasions Count
% within x2 Grade
6-9 Occasions Count
% within x2 Grade
10-19 Occasions Count
% within x2 Grade
20-39 Occasions Count
% within x2 Grade
40+ Occasions Count
% within x2 Grade
Total Count
% within x2 Grade
3794 3401 3649 2759 13603
99.7% 99.3% 98.1% 94.8% 98.2%
7 20 55 79 161
0.2% 0.6% 1.5% 2.7% 1.2%
1 0 10 36 47
0.0% 0.0% 0.3% 1.2% 0.3%
0 0 3 18 21
0.0% 0.0% 0.1% 0.6% 0.2%
1 3 2 8 14
0.0% 0.1% 0.1% 0.3% 0.1%
0 0 1 3 4
0.0% 0.0% 0.0% 0.1% 0.0%
1 0 0 6 7
0.0% 0.0% 0.0% 0.2% 0.1%
3804 3424 3720 2909 13857
100.0% 100.0% 100.0% 100.0% 100.0%
Page 19
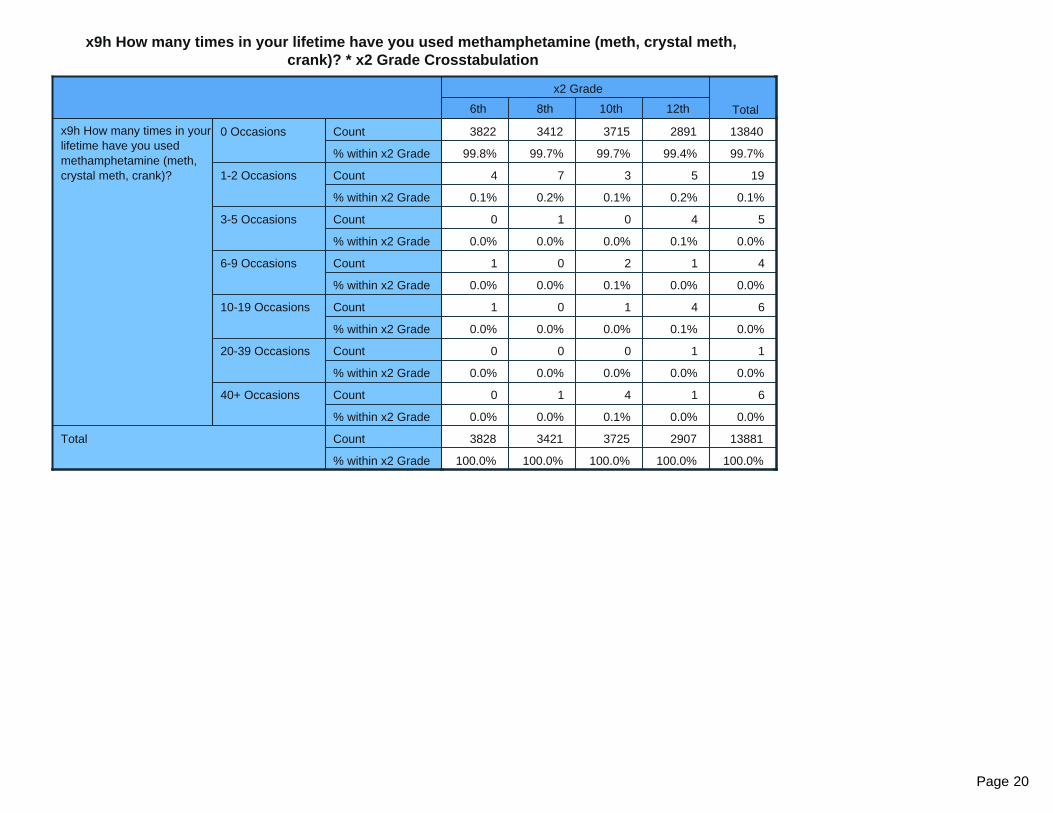
x9h How many times in your lifetime have you used methamphetamine (meth, crystal meth, crank)? * x2 Grade Crosstabulation
x2 Grade
Total6th 8th 10th 12th
x9h How many times in your lifetime have you used methamphetamine (meth, crystal meth, crank)?
0 Occasions Count
% within x2 Grade
1-2 Occasions Count
% within x2 Grade
3-5 Occasions Count
% within x2 Grade
6-9 Occasions Count
% within x2 Grade
10-19 Occasions Count
% within x2 Grade
20-39 Occasions Count
% within x2 Grade
40+ Occasions Count
% within x2 Grade
Total Count
% within x2 Grade
3822 3412 3715 2891 13840
99.8% 99.7% 99.7% 99.4% 99.7%
4 7 3 5 19
0.1% 0.2% 0.1% 0.2% 0.1%
0 1 0 4 5
0.0% 0.0% 0.0% 0.1% 0.0%
1 0 2 1 4
0.0% 0.0% 0.1% 0.0% 0.0%
1 0 1 4 6
0.0% 0.0% 0.0% 0.1% 0.0%
0 0 0 1 1
0.0% 0.0% 0.0% 0.0% 0.0%
0 1 4 1 6
0.0% 0.0% 0.1% 0.0% 0.0%
3828 3421 3725 2907 13881
100.0% 100.0% 100.0% 100.0% 100.0%
Page 20
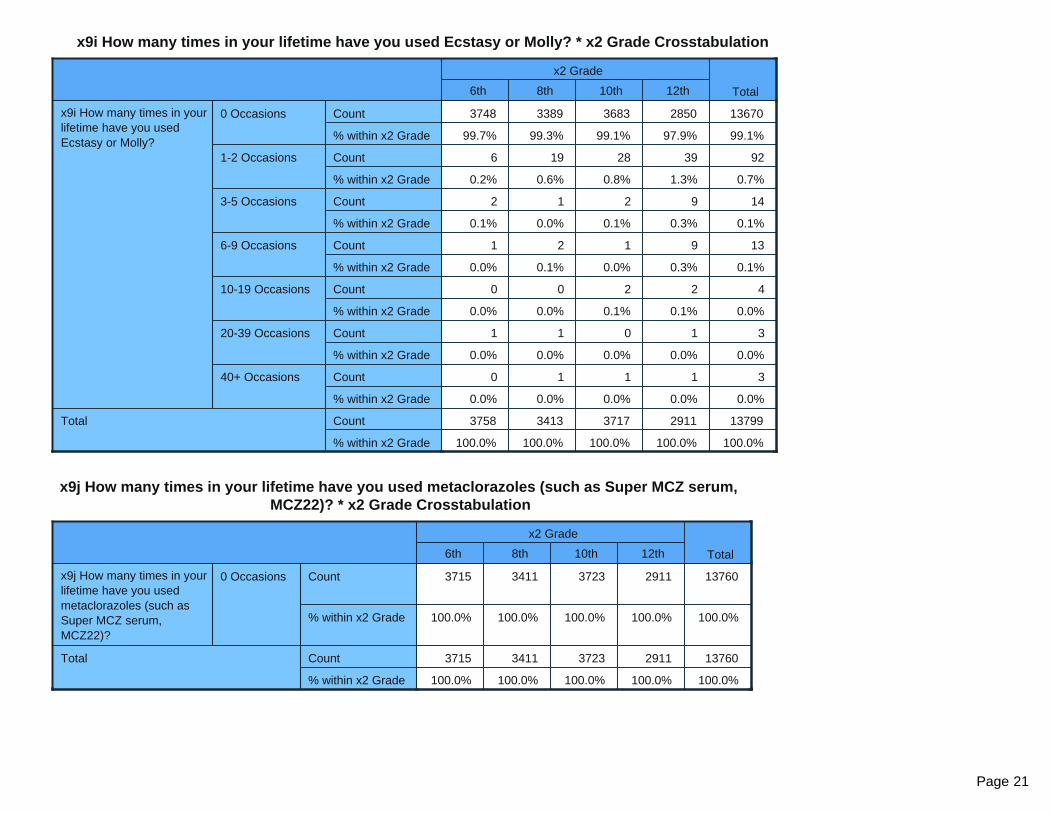
x9i How many times in your lifetime have you used Ecstasy or Molly? * x2 Grade Crosstabulation
x2 Grade
Total6th 8th 10th 12th
x9i How many times in your lifetime have you used Ecstasy or Molly?
0 Occasions Count
% within x2 Grade
1-2 Occasions Count
% within x2 Grade
3-5 Occasions Count
% within x2 Grade
6-9 Occasions Count
% within x2 Grade
10-19 Occasions Count
% within x2 Grade
20-39 Occasions Count
% within x2 Grade
40+ Occasions Count
% within x2 Grade
Total Count
% within x2 Grade
3748 3389 3683 2850 13670
99.7% 99.3% 99.1% 97.9% 99.1%
6 19 28 39 92
0.2% 0.6% 0.8% 1.3% 0.7%
2 1 2 9 14
0.1% 0.0% 0.1% 0.3% 0.1%
1 2 1 9 13
0.0% 0.1% 0.0% 0.3% 0.1%
0 0 2 2 4
0.0% 0.0% 0.1% 0.1% 0.0%
1 1 0 1 3
0.0% 0.0% 0.0% 0.0% 0.0%
0 1 1 1 3
0.0% 0.0% 0.0% 0.0% 0.0%
3758 3413 3717 2911 13799
100.0% 100.0% 100.0% 100.0% 100.0%
x9j How many times in your lifetime have you used metaclorazoles (such as Super MCZ serum, MCZ22)? * x2 Grade Crosstabulation
x2 Grade
Total6th 8th 10th 12th
x9j How many times in your lifetime have you used metaclorazoles (such as Super MCZ serum, MCZ22)?
0 Occasions Count
% within x2 Grade
Total Count
% within x2 Grade
3715 3411 3723 2911 13760
100.0% 100.0% 100.0% 100.0% 100.0%
3715 3411 3723 2911 13760
100.0% 100.0% 100.0% 100.0% 100.0%
Page 21

x9k How many times in your lifetime have you performance enhancing drugs (such as steroids, human growth hormone) without a doctor telling you to take them? * x2 Grade Crosstabulation
x2 Grade
Total6th 8th 10th 12th
x9k How many times in your lifetime have you performance enhancing drugs (such as steroids, human growth hormone) without a doctor telling you to take them?
0 Occasions Count
% within x2 Grade
1-2 Occasions Count
% within x2 Grade
3-5 Occasions Count
% within x2 Grade
6-9 Occasions Count
% within x2 Grade
10-19 Occasions Count
% within x2 Grade
20-39 Occasions Count
% within x2 Grade
40+ Occasions Count
% within x2 Grade
Total Count
% within x2 Grade
3834 3397 3702 2884 13817
99.2% 99.1% 99.3% 98.9% 99.1%
22 18 16 11 67
0.6% 0.5% 0.4% 0.4% 0.5%
6 5 7 7 25
0.2% 0.1% 0.2% 0.2% 0.2%
0 6 0 5 11
0.0% 0.2% 0.0% 0.2% 0.1%
2 0 1 3 6
0.1% 0.0% 0.0% 0.1% 0.0%
0 0 2 1 3
0.0% 0.0% 0.1% 0.0% 0.0%
0 1 1 5 7
0.0% 0.0% 0.0% 0.2% 0.1%
3864 3427 3729 2916 13936
100.0% 100.0% 100.0% 100.0% 100.0%
Page 22
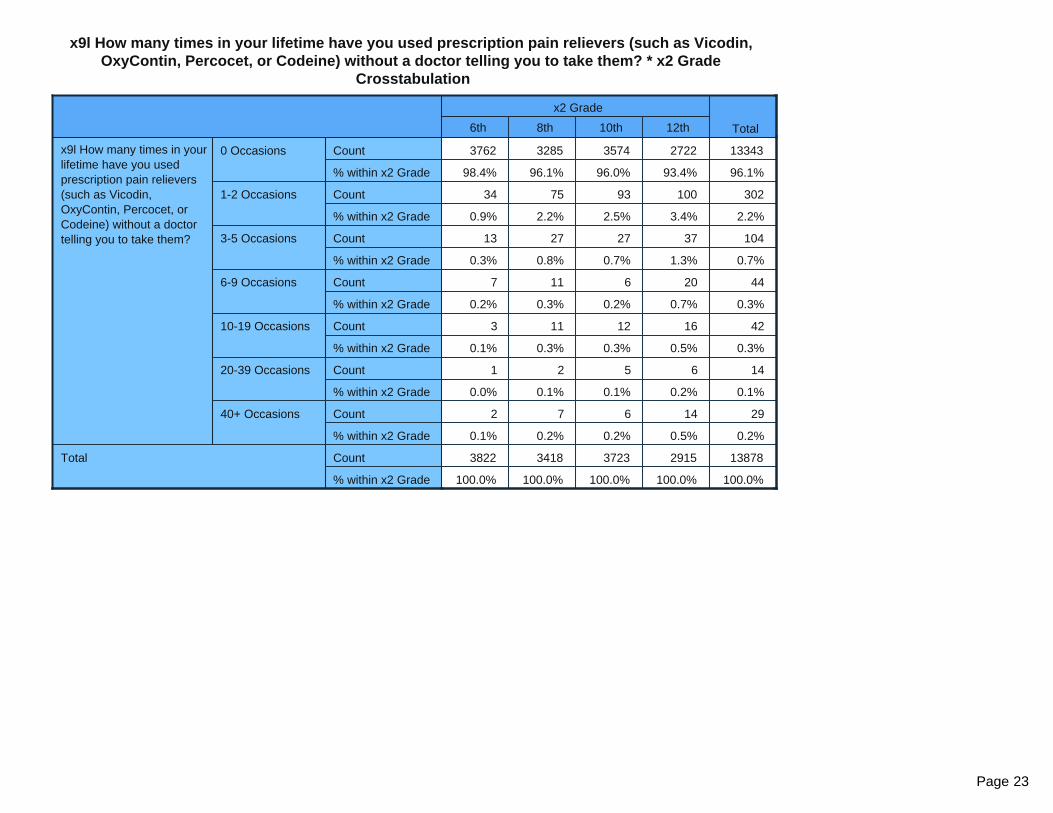
x9l How many times in your lifetime have you used prescription pain relievers (such as Vicodin, OxyContin, Percocet, or Codeine) without a doctor telling you to take them? * x2 Grade
Crosstabulation
x2 Grade
Total6th 8th 10th 12th
x9l How many times in your lifetime have you used prescription pain relievers (such as Vicodin, OxyContin, Percocet, or Codeine) without a doctor telling you to take them?
0 Occasions Count
% within x2 Grade
1-2 Occasions Count
% within x2 Grade
3-5 Occasions Count
% within x2 Grade
6-9 Occasions Count
% within x2 Grade
10-19 Occasions Count
% within x2 Grade
20-39 Occasions Count
% within x2 Grade
40+ Occasions Count
% within x2 Grade
Total Count
% within x2 Grade
3762 3285 3574 2722 13343
98.4% 96.1% 96.0% 93.4% 96.1%
34 75 93 100 302
0.9% 2.2% 2.5% 3.4% 2.2%
13 27 27 37 104
0.3% 0.8% 0.7% 1.3% 0.7%
7 11 6 20 44
0.2% 0.3% 0.2% 0.7% 0.3%
3 11 12 16 42
0.1% 0.3% 0.3% 0.5% 0.3%
1 2 5 6 14
0.0% 0.1% 0.1% 0.2% 0.1%
2 7 6 14 29
0.1% 0.2% 0.2% 0.5% 0.2%
3822 3418 3723 2915 13878
100.0% 100.0% 100.0% 100.0% 100.0%
Page 23

x9m How many times in your lifetime have you used prescription tranquilizers (such as Ambien, Lunesta, Valium, or Xanax) without a doctor telling you to take them? * x2 Grade Crosstabulation
x2 Grade
Total6th 8th 10th 12th
x9m How many times in your lifetime have you used prescription tranquilizers (such as Ambien, Lunesta, Valium, or Xanax) without a doctor telling you to take them?
0 Occasions Count
% within x2 Grade
1-2 Occasions Count
% within x2 Grade
3-5 Occasions Count
% within x2 Grade
6-9 Occasions Count
% within x2 Grade
10-19 Occasions Count
% within x2 Grade
20-39 Occasions Count
% within x2 Grade
40+ Occasions Count
% within x2 Grade
Total Count
% within x2 Grade
3781 3369 3649 2802 13601
99.5% 98.9% 98.1% 96.3% 98.3%
14 20 44 53 131
0.4% 0.6% 1.2% 1.8% 0.9%
4 9 11 21 45
0.1% 0.3% 0.3% 0.7% 0.3%
0 4 8 12 24
0.0% 0.1% 0.2% 0.4% 0.2%
0 1 3 11 15
0.0% 0.0% 0.1% 0.4% 0.1%
0 1 1 5 7
0.0% 0.0% 0.0% 0.2% 0.1%
1 3 3 5 12
0.0% 0.1% 0.1% 0.2% 0.1%
3800 3407 3719 2909 13835
100.0% 100.0% 100.0% 100.0% 100.0%
Page 24

x9n How many times in your lifetime have you used prescription stimulants (such as Ritalin or Adderall) without a doctor telling you to take them? * x2 Grade Crosstabulation
x2 Grade
Total6th 8th 10th 12th
x9n How many times in your lifetime have you used prescription stimulants (such as Ritalin or Adderall) without a doctor telling you to take them?
0 Occasions Count
% within x2 Grade
1-2 Occasions Count
% within x2 Grade
3-5 Occasions Count
% within x2 Grade
6-9 Occasions Count
% within x2 Grade
10-19 Occasions Count
% within x2 Grade
20-39 Occasions Count
% within x2 Grade
40+ Occasions Count
% within x2 Grade
Total Count
% within x2 Grade
3738 3357 3613 2682 13390
99.4% 98.9% 97.5% 92.6% 97.4%
14 26 53 101 194
0.4% 0.8% 1.4% 3.5% 1.4%
4 4 21 43 72
0.1% 0.1% 0.6% 1.5% 0.5%
2 1 7 16 26
0.1% 0.0% 0.2% 0.6% 0.2%
0 1 5 27 33
0.0% 0.0% 0.1% 0.9% 0.2%
0 0 3 12 15
0.0% 0.0% 0.1% 0.4% 0.1%
2 4 3 15 24
0.1% 0.1% 0.1% 0.5% 0.2%
3760 3393 3705 2896 13754
100.0% 100.0% 100.0% 100.0% 100.0%
Page 25

x9o How many times in your lifetime have you used synthetic drugs (man-made drugs such as Bath Salts, K2, Spice, Mr. Smiley, Blaze)? * x2 Grade Crosstabulation
x2 Grade
Total6th 8th 10th 12th
x9o How many times in your lifetime have you used synthetic drugs (man-made drugs such as Bath Salts, K2, Spice, Mr. Smiley, Blaze)?
0 Occasions Count
% within x2 Grade
1-2 Occasions Count
% within x2 Grade
3-5 Occasions Count
% within x2 Grade
6-9 Occasions Count
% within x2 Grade
10-19 Occasions Count
% within x2 Grade
20-39 Occasions Count
% within x2 Grade
40+ Occasions Count
% within x2 Grade
Total Count
% within x2 Grade
3677 3327 3644 2827 13475
98.5% 98.7% 98.6% 97.7% 98.4%
34 26 37 47 144
0.9% 0.8% 1.0% 1.6% 1.1%
11 8 7 6 32
0.3% 0.2% 0.2% 0.2% 0.2%
3 5 2 6 16
0.1% 0.1% 0.1% 0.2% 0.1%
6 3 1 3 13
0.2% 0.1% 0.0% 0.1% 0.1%
2 0 3 2 7
0.1% 0.0% 0.1% 0.1% 0.1%
1 1 1 4 7
0.0% 0.0% 0.0% 0.1% 0.1%
3734 3370 3695 2895 13694
100.0% 100.0% 100.0% 100.0% 100.0%
Page 26
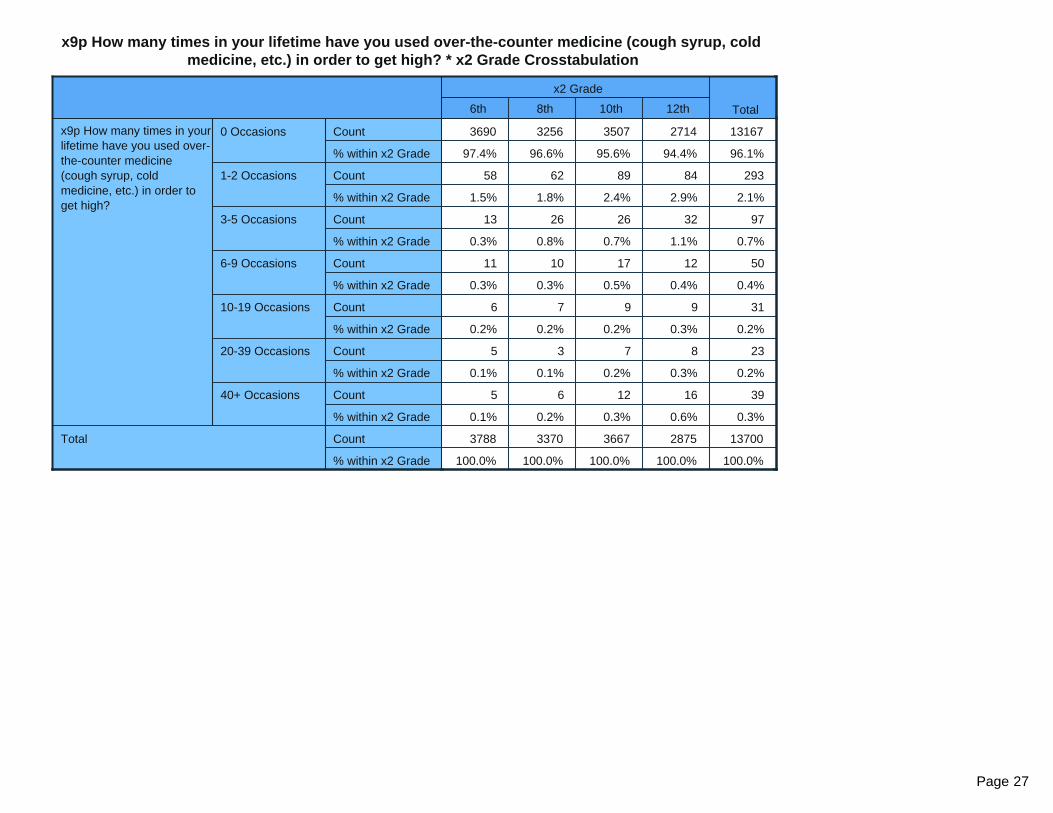
x9p How many times in your lifetime have you used over-the-counter medicine (cough syrup, cold medicine, etc.) in order to get high? * x2 Grade Crosstabulation
x2 Grade
Total6th 8th 10th 12th
x9p How many times in your lifetime have you used over-the-counter medicine (cough syrup, cold medicine, etc.) in order to get high?
0 Occasions Count
% within x2 Grade
1-2 Occasions Count
% within x2 Grade
3-5 Occasions Count
% within x2 Grade
6-9 Occasions Count
% within x2 Grade
10-19 Occasions Count
% within x2 Grade
20-39 Occasions Count
% within x2 Grade
40+ Occasions Count
% within x2 Grade
Total Count
% within x2 Grade
3690 3256 3507 2714 13167
97.4% 96.6% 95.6% 94.4% 96.1%
58 62 89 84 293
1.5% 1.8% 2.4% 2.9% 2.1%
13 26 26 32 97
0.3% 0.8% 0.7% 1.1% 0.7%
11 10 17 12 50
0.3% 0.3% 0.5% 0.4% 0.4%
6 7 9 9 31
0.2% 0.2% 0.2% 0.3% 0.2%
5 3 7 8 23
0.1% 0.1% 0.2% 0.3% 0.2%
5 6 12 16 39
0.1% 0.2% 0.3% 0.6% 0.3%
3788 3370 3667 2875 13700
100.0% 100.0% 100.0% 100.0% 100.0%
Page 27

x10a How many times in the past 30 days have you had beer, wine, or hard liquor? * x2 Grade Crosstabulation
x2 Grade
Total6th 8th 10th 12th
x10a How many times in the past 30 days have you had beer, wine, or hard liquor?
0 Occasions Count
% within x2 Grade
1-2 Occasions Count
% within x2 Grade
3-5 Occasions Count
% within x2 Grade
6-9 Occasions Count
% within x2 Grade
10-19 Occasions Count
% within x2 Grade
20-39 Occasions Count
% within x2 Grade
40+ Occasions Count
% within x2 Grade
Total Count
% within x2 Grade
3684 3082 2874 1760 11400
96.6% 90.8% 77.9% 60.9% 82.7%
117 251 488 526 1382
3.1% 7.4% 13.2% 18.2% 10.0%
11 42 187 326 566
0.3% 1.2% 5.1% 11.3% 4.1%
2 11 88 144 245
0.1% 0.3% 2.4% 5.0% 1.8%
1 4 36 88 129
0.0% 0.1% 1.0% 3.0% 0.9%
0 4 6 24 34
0.0% 0.1% 0.2% 0.8% 0.2%
0 1 9 20 30
0.0% 0.0% 0.2% 0.7% 0.2%
3815 3395 3688 2888 13786
100.0% 100.0% 100.0% 100.0% 100.0%
Page 28
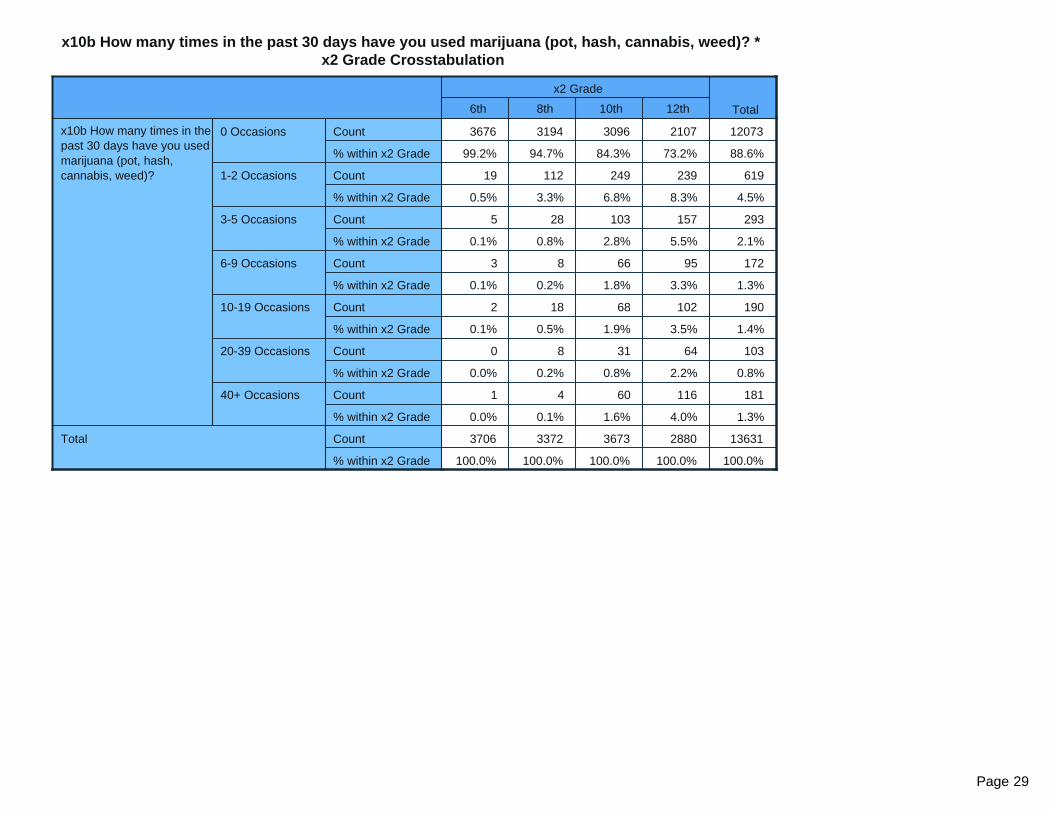
x10b How many times in the past 30 days have you used marijuana (pot, hash, cannabis, weed)? * x2 Grade Crosstabulation
x2 Grade
Total6th 8th 10th 12th
x10b How many times in the past 30 days have you used marijuana (pot, hash, cannabis, weed)?
0 Occasions Count
% within x2 Grade
1-2 Occasions Count
% within x2 Grade
3-5 Occasions Count
% within x2 Grade
6-9 Occasions Count
% within x2 Grade
10-19 Occasions Count
% within x2 Grade
20-39 Occasions Count
% within x2 Grade
40+ Occasions Count
% within x2 Grade
Total Count
% within x2 Grade
3676 3194 3096 2107 12073
99.2% 94.7% 84.3% 73.2% 88.6%
19 112 249 239 619
0.5% 3.3% 6.8% 8.3% 4.5%
5 28 103 157 293
0.1% 0.8% 2.8% 5.5% 2.1%
3 8 66 95 172
0.1% 0.2% 1.8% 3.3% 1.3%
2 18 68 102 190
0.1% 0.5% 1.9% 3.5% 1.4%
0 8 31 64 103
0.0% 0.2% 0.8% 2.2% 0.8%
1 4 60 116 181
0.0% 0.1% 1.6% 4.0% 1.3%
3706 3372 3673 2880 13631
100.0% 100.0% 100.0% 100.0% 100.0%
Page 29

x10c How many times in the past 30 days have you sniffed glue, breathed the contents of an aerosol spray can, or inhaled other gases or sprays in order to get high? * x2 Grade
Crosstabulation
x2 Grade
Total6th 8th 10th 12th
x10c How many times in the past 30 days have you sniffed glue, breathed the contents of an aerosol spray can, or inhaled other gases or sprays in order to get high?
0 Occasions Count
% within x2 Grade
1-2 Occasions Count
% within x2 Grade
3-5 Occasions Count
% within x2 Grade
6-9 Occasions Count
% within x2 Grade
10-19 Occasions Count
% within x2 Grade
20-39 Occasions Count
% within x2 Grade
40+ Occasions Count
% within x2 Grade
Total Count
% within x2 Grade
3657 3341 3624 2862 13484
97.7% 98.9% 99.0% 99.4% 98.7%
62 34 22 7 125
1.7% 1.0% 0.6% 0.2% 0.9%
17 1 7 6 31
0.5% 0.0% 0.2% 0.2% 0.2%
4 0 1 0 5
0.1% 0.0% 0.0% 0.0% 0.0%
2 2 0 2 6
0.1% 0.1% 0.0% 0.1% 0.0%
2 0 1 0 3
0.1% 0.0% 0.0% 0.0% 0.0%
1 1 4 2 8
0.0% 0.0% 0.1% 0.1% 0.1%
3745 3379 3659 2879 13662
100.0% 100.0% 100.0% 100.0% 100.0%
Page 30

x10d How many times in the past 30 days have you used cocaine? * x2 Grade Crosstabulation
x2 Grade
Total6th 8th 10th 12th
x10d How many times in the past 30 days have you used cocaine?
0 Occasions Count
% within x2 Grade
1-2 Occasions Count
% within x2 Grade
3-5 Occasions Count
% within x2 Grade
10-19 Occasions Count
% within x2 Grade
20-39 Occasions Count
% within x2 Grade
Total Count
% within x2 Grade
3738 3366 3654 2849 13607
99.9% 100.0% 99.8% 99.1% 99.7%
3 1 2 14 20
0.1% 0.0% 0.1% 0.5% 0.1%
0 0 2 10 12
0.0% 0.0% 0.1% 0.3% 0.1%
0 0 2 2 4
0.0% 0.0% 0.1% 0.1% 0.0%
0 0 0 1 1
0.0% 0.0% 0.0% 0.0% 0.0%
3741 3367 3660 2876 13644
100.0% 100.0% 100.0% 100.0% 100.0%
x10e How many times in the past 30 days have you used crack? * x2 Grade Crosstabulation
x2 Grade
Total6th 8th 10th 12th
x10e How many times in the past 30 days have you used crack?
0 Occasions Count
% within x2 Grade
1-2 Occasions Count
% within x2 Grade
6-9 Occasions Count
% within x2 Grade
40+ Occasions Count
% within x2 Grade
Total Count
% within x2 Grade
3726 3364 3646 2868 13604
99.9% 100.0% 99.9% 99.9% 99.9%
2 0 2 2 6
0.1% 0.0% 0.1% 0.1% 0.0%
1 0 0 0 1
0.0% 0.0% 0.0% 0.0% 0.0%
1 0 1 1 3
0.0% 0.0% 0.0% 0.0% 0.0%
3730 3364 3649 2871 13614
100.0% 100.0% 100.0% 100.0% 100.0%
Page 31

x10f How many times in the past 30 days have you used heroin? * x2 Grade Crosstabulation
x2 Grade
Total6th 8th 10th 12th
x10f How many times in the past 30 days have you used heroin?
0 Occasions Count
% within x2 Grade
1-2 Occasions Count
% within x2 Grade
3-5 Occasions Count
% within x2 Grade
10-19 Occasions Count
% within x2 Grade
20-39 Occasions Count
% within x2 Grade
40+ Occasions Count
% within x2 Grade
Total Count
% within x2 Grade
3714 3358 3641 2863 13576
99.9% 100.0% 99.9% 99.9% 99.9%
2 1 1 2 6
0.1% 0.0% 0.0% 0.1% 0.0%
1 0 0 1 2
0.0% 0.0% 0.0% 0.0% 0.0%
0 0 1 0 1
0.0% 0.0% 0.0% 0.0% 0.0%
0 0 1 0 1
0.0% 0.0% 0.0% 0.0% 0.0%
2 0 0 0 2
0.1% 0.0% 0.0% 0.0% 0.0%
3719 3359 3644 2866 13588
100.0% 100.0% 100.0% 100.0% 100.0%
x10g How many times in the past 30 days have you used hallucinogens (acid, LSD, shrooms)? * x2 Grade Crosstabulation
x2 Grade
Total6th 8th 10th 12th
x10g How many times in the past 30 days have you used hallucinogens (acid, LSD, shrooms)?
0 Occasions Count
% within x2 Grade
1-2 Occasions Count
% within x2 Grade
3-5 Occasions Count
% within x2 Grade
6-9 Occasions Count
% within x2 Grade
Total Count
% within x2 Grade
3662 3352 3634 2840 13488
99.9% 99.8% 99.7% 99.1% 99.6%
4 4 9 19 36
0.1% 0.1% 0.2% 0.7% 0.3%
1 3 2 7 13
0.0% 0.1% 0.1% 0.2% 0.1%
0 0 1 0 1
0.0% 0.0% 0.0% 0.0% 0.0%
3667 3359 3646 2866 13538
100.0% 100.0% 100.0% 100.0% 100.0%
Page 32

x10h How many times in the past 30 days have you used methamphetamine (meth, crystal meth, crank)? * x2 Grade Crosstabulation
x2 Grade
Total6th 8th 10th 12th
x10h How many times in the past 30 days have you used methamphetamine (meth, crystal meth, crank)?
0 Occasions Count
% within x2 Grade
1-2 Occasions Count
% within x2 Grade
6-9 Occasions Count
% within x2 Grade
10-19 Occasions Count
% within x2 Grade
40+ Occasions Count
% within x2 Grade
Total Count
% within x2 Grade
3673 3353 3636 2859 13521
99.9% 99.9% 99.8% 99.9% 99.9%
2 2 2 3 9
0.1% 0.1% 0.1% 0.1% 0.1%
1 0 1 0 2
0.0% 0.0% 0.0% 0.0% 0.0%
0 0 1 0 1
0.0% 0.0% 0.0% 0.0% 0.0%
0 0 3 0 3
0.0% 0.0% 0.1% 0.0% 0.0%
3676 3355 3643 2862 13536
100.0% 100.0% 100.0% 100.0% 100.0%
Page 33
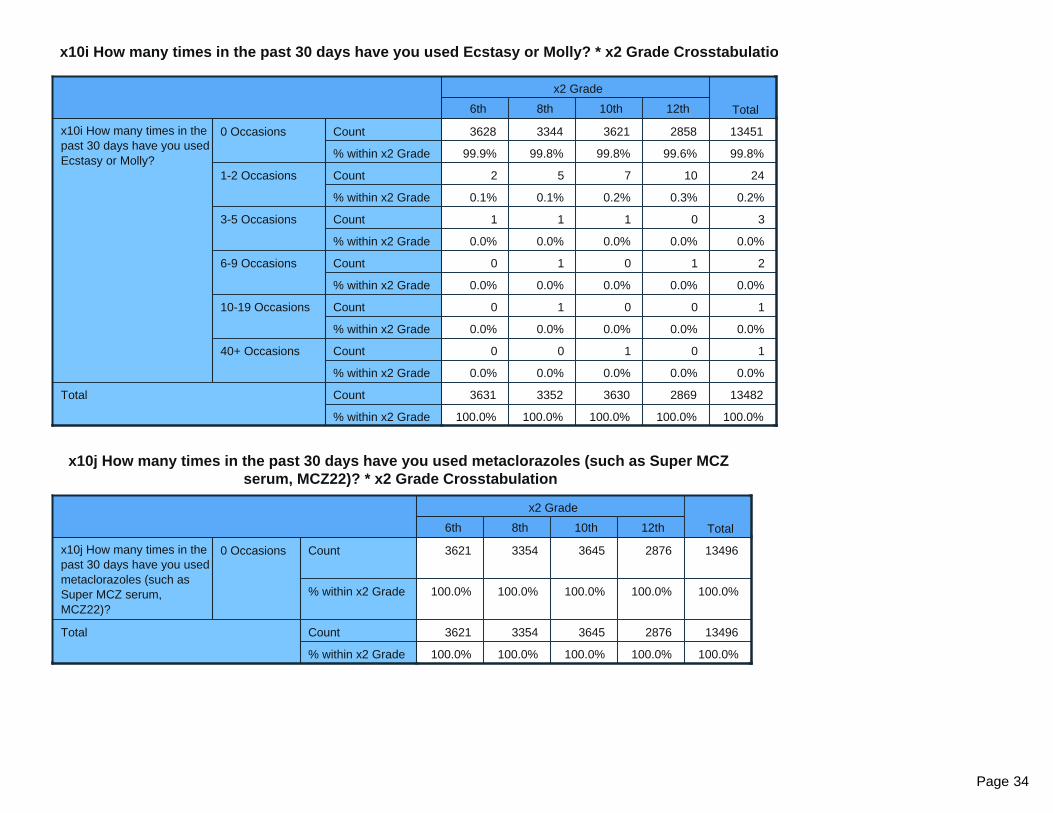
x10i How many times in the past 30 days have you used Ecstasy or Molly? * x2 Grade Crosstabulatio
x2 Grade
Total6th 8th 10th 12th
x10i How many times in the past 30 days have you used Ecstasy or Molly?
0 Occasions Count
% within x2 Grade
1-2 Occasions Count
% within x2 Grade
3-5 Occasions Count
% within x2 Grade
6-9 Occasions Count
% within x2 Grade
10-19 Occasions Count
% within x2 Grade
40+ Occasions Count
% within x2 Grade
Total Count
% within x2 Grade
3628 3344 3621 2858 13451
99.9% 99.8% 99.8% 99.6% 99.8%
2 5 7 10 24
0.1% 0.1% 0.2% 0.3% 0.2%
1 1 1 0 3
0.0% 0.0% 0.0% 0.0% 0.0%
0 1 0 1 2
0.0% 0.0% 0.0% 0.0% 0.0%
0 1 0 0 1
0.0% 0.0% 0.0% 0.0% 0.0%
0 0 1 0 1
0.0% 0.0% 0.0% 0.0% 0.0%
3631 3352 3630 2869 13482
100.0% 100.0% 100.0% 100.0% 100.0%
x10j How many times in the past 30 days have you used metaclorazoles (such as Super MCZ serum, MCZ22)? * x2 Grade Crosstabulation
x2 Grade
Total6th 8th 10th 12th
x10j How many times in the past 30 days have you used metaclorazoles (such as Super MCZ serum, MCZ22)?
0 Occasions Count
% within x2 Grade
Total Count
% within x2 Grade
3621 3354 3645 2876 13496
100.0% 100.0% 100.0% 100.0% 100.0%
3621 3354 3645 2876 13496
100.0% 100.0% 100.0% 100.0% 100.0%
Page 34

x10k How many times in the past 30 days have you used performance enhancing drugs (such as steroids, human growth hormone) without a doctor telling you to take them? * x2 Grade
Crosstabulation
x2 Grade
Total6th 8th 10th 12th
x10k How many times in the past 30 days have you used performance enhancing drugs (such as steroids, human growth hormone) without a doctor telling you to take them?
0 Occasions Count
% within x2 Grade
1-2 Occasions Count
% within x2 Grade
3-5 Occasions Count
% within x2 Grade
6-9 Occasions Count
% within x2 Grade
10-19 Occasions Count
% within x2 Grade
20-39 Occasions Count
% within x2 Grade
Total Count
% within x2 Grade
3712 3348 3642 2855 13557
99.7% 99.6% 99.8% 99.5% 99.7%
8 10 6 7 31
0.2% 0.3% 0.2% 0.2% 0.2%
2 2 1 3 8
0.1% 0.1% 0.0% 0.1% 0.1%
0 2 1 0 3
0.0% 0.1% 0.0% 0.0% 0.0%
1 0 0 3 4
0.0% 0.0% 0.0% 0.1% 0.0%
0 0 0 1 1
0.0% 0.0% 0.0% 0.0% 0.0%
3723 3362 3650 2869 13604
100.0% 100.0% 100.0% 100.0% 100.0%
Page 35

x10l How many times in the past 30 days have you used prescription pain relievers (such as Vicodin, OxyContin, Percocet, or Codeine) without a doctor telling you to take them? * x2 Grade
Crosstabulation
x2 Grade
Total6th 8th 10th 12th
x10l How many times in the past 30 days have you used prescription pain relievers (such as Vicodin, OxyContin, Percocet, or Codeine) without a doctor telling you to take them?
0 Occasions Count
% within x2 Grade
1-2 Occasions Count
% within x2 Grade
3-5 Occasions Count
% within x2 Grade
6-9 Occasions Count
% within x2 Grade
10-19 Occasions Count
% within x2 Grade
20-39 Occasions Count
% within x2 Grade
40+ Occasions Count
% within x2 Grade
Total Count
% within x2 Grade
3675 3326 3615 2831 13447
99.2% 98.9% 99.1% 98.5% 98.9%
14 20 21 27 82
0.4% 0.6% 0.6% 0.9% 0.6%
8 9 8 8 33
0.2% 0.3% 0.2% 0.3% 0.2%
4 2 0 3 9
0.1% 0.1% 0.0% 0.1% 0.1%
2 3 2 4 11
0.1% 0.1% 0.1% 0.1% 0.1%
1 0 1 0 2
0.0% 0.0% 0.0% 0.0% 0.0%
0 3 2 1 6
0.0% 0.1% 0.1% 0.0% 0.0%
3704 3363 3649 2874 13590
100.0% 100.0% 100.0% 100.0% 100.0%
Page 36

x10m How many times in the past 30 days have you used prescription tranquilizers (such as Ambien, Lunesta, Valium, or Xanax) without a doctor telling you to take them? * x2 Grade
Crosstabulation
x2 Grade
Total6th 8th 10th 12th
x10m How many times in the past 30 days have you used prescription tranquilizers (such as Ambien, Lunesta, Valium, or Xanax) without a doctor telling you to take them?
0 Occasions Count
% within x2 Grade
1-2 Occasions Count
% within x2 Grade
3-5 Occasions Count
% within x2 Grade
6-9 Occasions Count
% within x2 Grade
10-19 Occasions Count
% within x2 Grade
Total Count
% within x2 Grade
3681 3342 3614 2850 13487
99.8% 99.5% 99.2% 99.0% 99.4%
4 13 22 19 58
0.1% 0.4% 0.6% 0.7% 0.4%
1 4 5 6 16
0.0% 0.1% 0.1% 0.2% 0.1%
1 1 2 2 6
0.0% 0.0% 0.1% 0.1% 0.0%
1 0 0 1 2
0.0% 0.0% 0.0% 0.0% 0.0%
3688 3360 3643 2878 13569
100.0% 100.0% 100.0% 100.0% 100.0%
Page 37

x10n How many times in the past 30 days have you used prescription stimulants (such as Ritalin or Adderall) without a doctor telling you to take them? * x2 Grade Crosstabulation
x2 Grade
Total6th 8th 10th 12th
x10n How many times in the past 30 days have you used prescription stimulants (such as Ritalin or Adderall) without a doctor telling you to take them?
0 Occasions Count
% within x2 Grade
1-2 Occasions Count
% within x2 Grade
3-5 Occasions Count
% within x2 Grade
6-9 Occasions Count
% within x2 Grade
10-19 Occasions Count
% within x2 Grade
20-39 Occasions Count
% within x2 Grade
40+ Occasions Count
% within x2 Grade
Total Count
% within x2 Grade
3652 3344 3627 2816 13439
99.7% 99.7% 99.5% 98.0% 99.3%
5 6 12 37 60
0.1% 0.2% 0.3% 1.3% 0.4%
2 1 3 11 17
0.1% 0.0% 0.1% 0.4% 0.1%
2 3 0 4 9
0.1% 0.1% 0.0% 0.1% 0.1%
0 0 2 1 3
0.0% 0.0% 0.1% 0.0% 0.0%
0 1 0 1 2
0.0% 0.0% 0.0% 0.0% 0.0%
1 0 0 3 4
0.0% 0.0% 0.0% 0.1% 0.0%
3662 3355 3644 2873 13534
100.0% 100.0% 100.0% 100.0% 100.0%
Page 38

x10o How many times in the past 30 days have you used synthetic drugs (man-made drugs such as Bath Salts, K2, Spice, Mr. Smiley, Blaze)? * x2 Grade Crosstabulation
x2 Grade
Total6th 8th 10th 12th
x10o How many times in the past 30 days have you used synthetic drugs (man-made drugs such as Bath Salts, K2, Spice, Mr. Smiley, Blaze)?
0 Occasions Count
% within x2 Grade
1-2 Occasions Count
% within x2 Grade
3-5 Occasions Count
% within x2 Grade
6-9 Occasions Count
% within x2 Grade
10-19 Occasions Count
% within x2 Grade
40+ Occasions Count
% within x2 Grade
Total Count
% within x2 Grade
3622 3335 3626 2868 13451
99.1% 99.4% 99.6% 99.7% 99.4%
24 17 9 6 56
0.7% 0.5% 0.2% 0.2% 0.4%
6 1 3 0 10
0.2% 0.0% 0.1% 0.0% 0.1%
2 0 1 0 3
0.1% 0.0% 0.0% 0.0% 0.0%
1 1 1 1 4
0.0% 0.0% 0.0% 0.0% 0.0%
0 0 0 2 2
0.0% 0.0% 0.0% 0.1% 0.0%
3655 3354 3640 2877 13526
100.0% 100.0% 100.0% 100.0% 100.0%
Page 39

x10p How many times in the past 30 days have you used over-the-counter medicine (cough syrup, cold medicine, etc.) in order to get high? * x2 Grade Crosstabulation
x2 Grade
Total6th 8th 10th 12th
x10p How many times in the past 30 days have you used over-the-counter medicine (cough syrup, cold medicine, etc.) in order to get high?
0 Occasions Count
% within x2 Grade
1-2 Occasions Count
% within x2 Grade
3-5 Occasions Count
% within x2 Grade
6-9 Occasions Count
% within x2 Grade
10-19 Occasions Count
% within x2 Grade
20-39 Occasions Count
% within x2 Grade
40+ Occasions Count
% within x2 Grade
Total Count
% within x2 Grade
3649 3302 3596 2832 13379
98.7% 98.7% 98.6% 98.7% 98.7%
34 26 29 24 113
0.9% 0.8% 0.8% 0.8% 0.8%
6 10 13 6 35
0.2% 0.3% 0.4% 0.2% 0.3%
4 4 3 3 14
0.1% 0.1% 0.1% 0.1% 0.1%
1 2 1 2 6
0.0% 0.1% 0.0% 0.1% 0.0%
0 2 1 0 3
0.0% 0.1% 0.0% 0.0% 0.0%
2 0 3 1 6
0.1% 0.0% 0.1% 0.0% 0.0%
3696 3346 3646 2868 13556
100.0% 100.0% 100.0% 100.0% 100.0%
Page 40
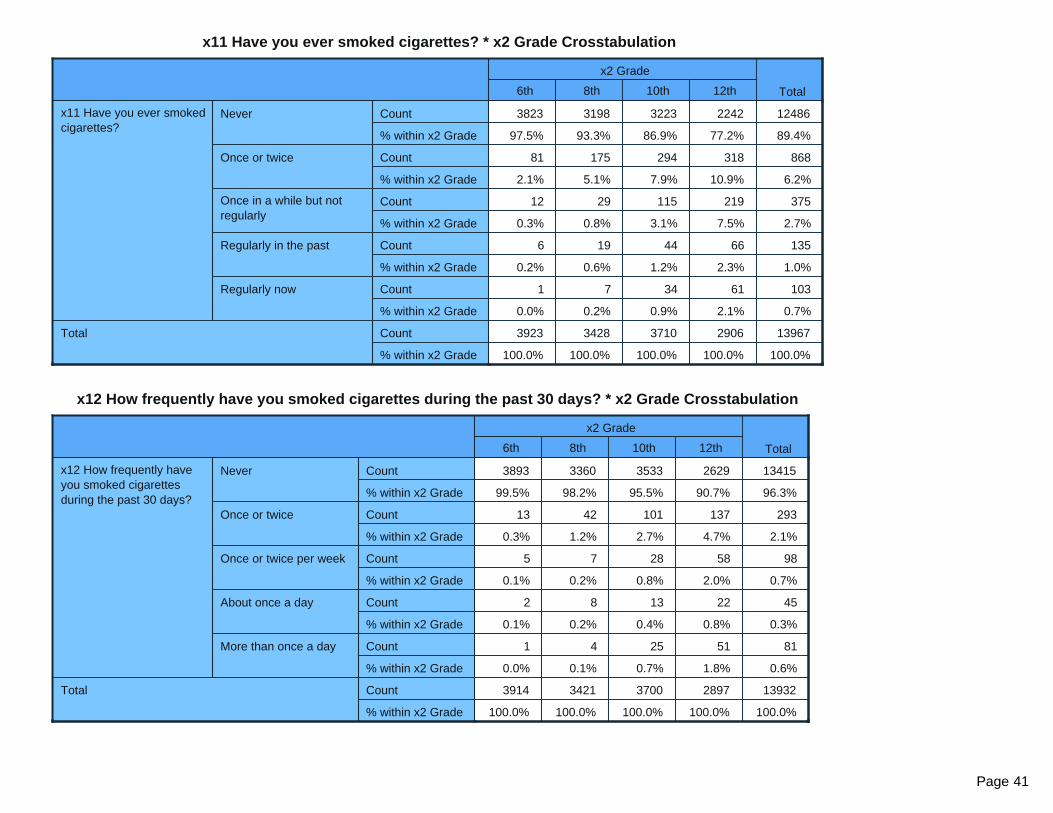
x11 Have you ever smoked cigarettes? * x2 Grade Crosstabulation
x2 Grade
Total6th 8th 10th 12th
x11 Have you ever smoked cigarettes?
Never Count
% within x2 Grade
Once or twice Count
% within x2 Grade
Once in a while but not regularly
Count
% within x2 Grade
Regularly in the past Count
% within x2 Grade
Regularly now Count
% within x2 Grade
Total Count
% within x2 Grade
3823 3198 3223 2242 12486
97.5% 93.3% 86.9% 77.2% 89.4%
81 175 294 318 868
2.1% 5.1% 7.9% 10.9% 6.2%
12 29 115 219 375
0.3% 0.8% 3.1% 7.5% 2.7%
6 19 44 66 135
0.2% 0.6% 1.2% 2.3% 1.0%
1 7 34 61 103
0.0% 0.2% 0.9% 2.1% 0.7%
3923 3428 3710 2906 13967
100.0% 100.0% 100.0% 100.0% 100.0%
x12 How frequently have you smoked cigarettes during the past 30 days? * x2 Grade Crosstabulation
x2 Grade
Total6th 8th 10th 12th
x12 How frequently have you smoked cigarettes during the past 30 days?
Never Count
% within x2 Grade
Once or twice Count
% within x2 Grade
Once or twice per week Count
% within x2 Grade
About once a day Count
% within x2 Grade
More than once a day Count
% within x2 Grade
Total Count
% within x2 Grade
3893 3360 3533 2629 13415
99.5% 98.2% 95.5% 90.7% 96.3%
13 42 101 137 293
0.3% 1.2% 2.7% 4.7% 2.1%
5 7 28 58 98
0.1% 0.2% 0.8% 2.0% 0.7%
2 8 13 22 45
0.1% 0.2% 0.4% 0.8% 0.3%
1 4 25 51 81
0.0% 0.1% 0.7% 1.8% 0.6%
3914 3421 3700 2897 13932
100.0% 100.0% 100.0% 100.0% 100.0%
Page 41

x13 Have you ever used smokeless tobacco (chew, snuff, plug, dipping tobacco, or chewing tobacco)? * x2 Grade Crosstabulation
x2 Grade
Total6th 8th 10th 12th
x13 Have you ever used smokeless tobacco (chew, snuff, plug, dipping tobacco, or chewing tobacco)?
Never Count
% within x2 Grade
Once or twice Count
% within x2 Grade
Once in a while but not regularly
Count
% within x2 Grade
Regularly in the past Count
% within x2 Grade
Regularly now Count
% within x2 Grade
Total Count
% within x2 Grade
3886 3364 3520 2603 13373
99.5% 98.2% 95.1% 89.9% 96.0%
18 44 103 135 300
0.5% 1.3% 2.8% 4.7% 2.2%
2 12 44 92 150
0.1% 0.4% 1.2% 3.2% 1.1%
0 3 25 38 66
0.0% 0.1% 0.7% 1.3% 0.5%
0 2 8 26 36
0.0% 0.1% 0.2% 0.9% 0.3%
3906 3425 3700 2894 13925
100.0% 100.0% 100.0% 100.0% 100.0%
x14 How frequently have you used smokeless tobacco during the past 30 days? * x2 Grade Crosstabulation
x2 Grade
Total6th 8th 10th 12th
x14 How frequently have you used smokeless tobacco during the past 30 days?
Never Count
% within x2 Grade
Once or twice Count
% within x2 Grade
Once or twice per week Count
% within x2 Grade
About once a day Count
% within x2 Grade
More than once a day Count
% within x2 Grade
Total Count
% within x2 Grade
3889 3377 3637 2774 13677
99.8% 99.0% 98.4% 96.0% 98.4%
6 26 38 68 138
0.2% 0.8% 1.0% 2.4% 1.0%
1 4 10 20 35
0.0% 0.1% 0.3% 0.7% 0.3%
0 0 10 12 22
0.0% 0.0% 0.3% 0.4% 0.2%
0 4 2 16 22
0.0% 0.1% 0.1% 0.6% 0.2%
3896 3411 3697 2890 13894
100.0% 100.0% 100.0% 100.0% 100.0%
Page 42
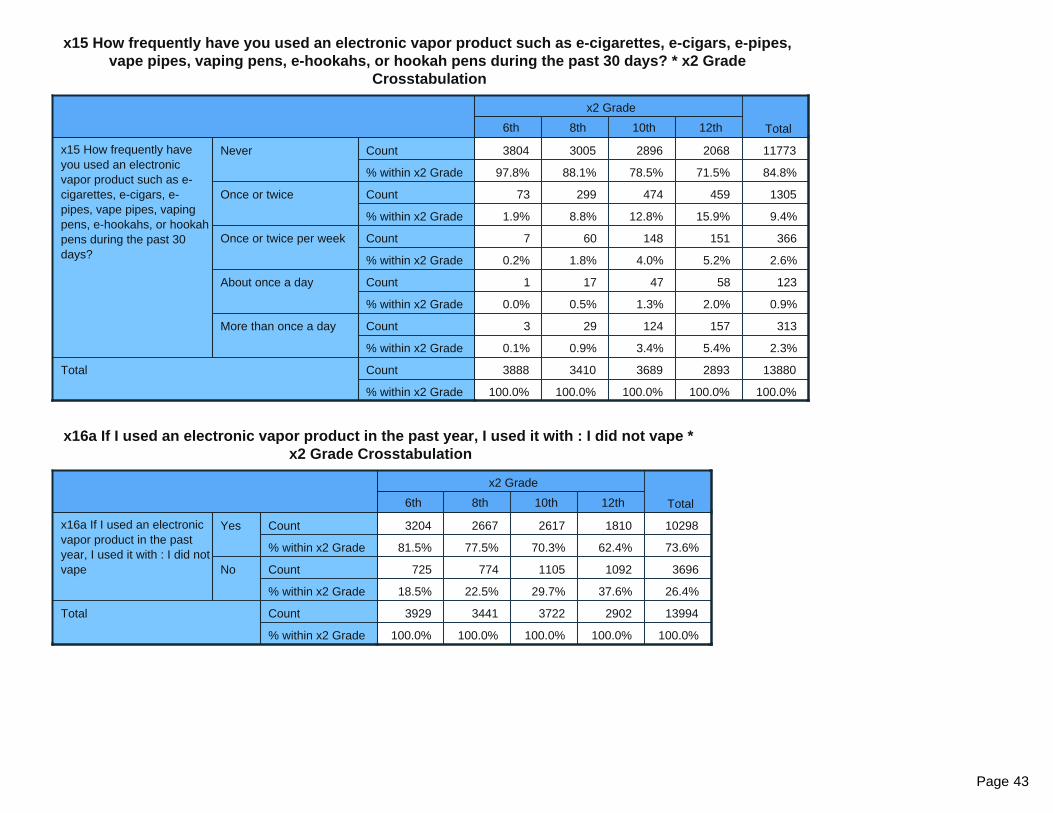
x15 How frequently have you used an electronic vapor product such as e-cigarettes, e-cigars, e-pipes, vape pipes, vaping pens, e-hookahs, or hookah pens during the past 30 days? * x2 Grade
Crosstabulation
x2 Grade
Total6th 8th 10th 12th
x15 How frequently have you used an electronic vapor product such as e-cigarettes, e-cigars, e-pipes, vape pipes, vaping pens, e-hookahs, or hookah pens during the past 30 days?
Never Count
% within x2 Grade
Once or twice Count
% within x2 Grade
Once or twice per week Count
% within x2 Grade
About once a day Count
% within x2 Grade
More than once a day Count
% within x2 Grade
Total Count
% within x2 Grade
3804 3005 2896 2068 11773
97.8% 88.1% 78.5% 71.5% 84.8%
73 299 474 459 1305
1.9% 8.8% 12.8% 15.9% 9.4%
7 60 148 151 366
0.2% 1.8% 4.0% 5.2% 2.6%
1 17 47 58 123
0.0% 0.5% 1.3% 2.0% 0.9%
3 29 124 157 313
0.1% 0.9% 3.4% 5.4% 2.3%
3888 3410 3689 2893 13880
100.0% 100.0% 100.0% 100.0% 100.0%
x16a If I used an electronic vapor product in the past year, I used it with : I did not vape * x2 Grade Crosstabulation
x2 Grade
Total6th 8th 10th 12th
x16a If I used an electronic vapor product in the past year, I used it with : I did not vape
Yes Count
% within x2 Grade
No Count
% within x2 Grade
Total Count
% within x2 Grade
3204 2667 2617 1810 10298
81.5% 77.5% 70.3% 62.4% 73.6%
725 774 1105 1092 3696
18.5% 22.5% 29.7% 37.6% 26.4%
3929 3441 3722 2902 13994
100.0% 100.0% 100.0% 100.0% 100.0%
Page 43
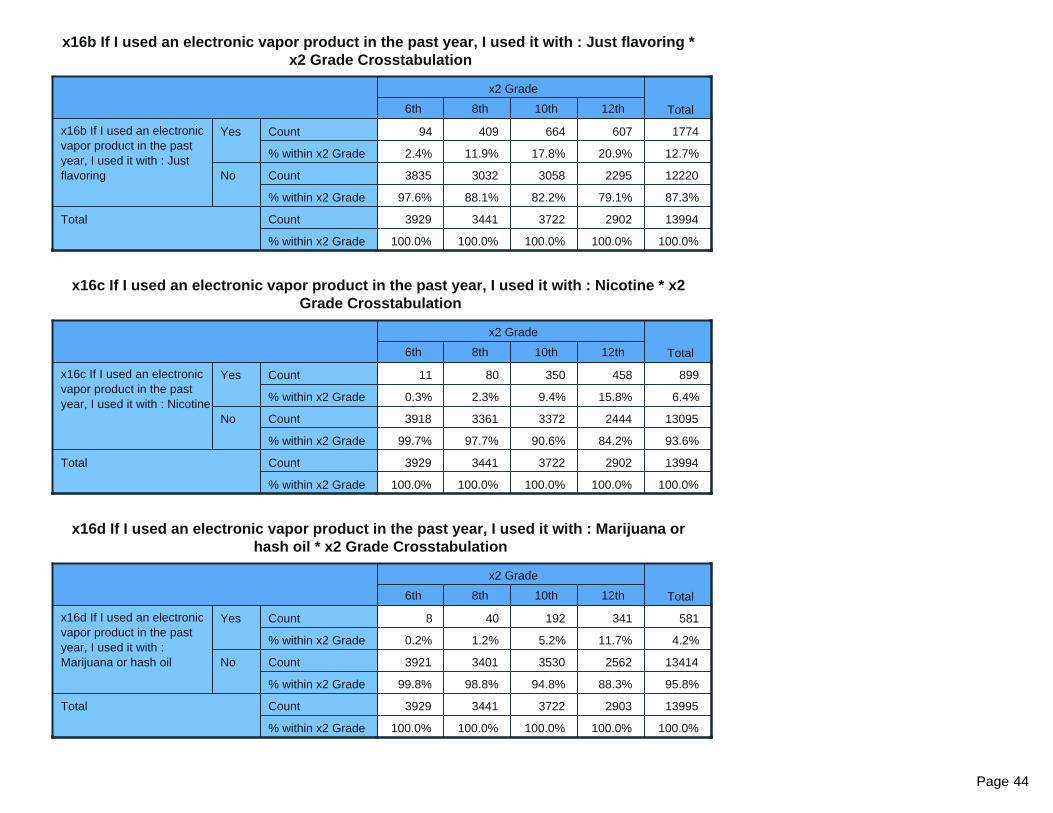
x16b If I used an electronic vapor product in the past year, I used it with : Just flavoring * x2 Grade Crosstabulation
x2 Grade
Total6th 8th 10th 12th
x16b If I used an electronic vapor product in the past year, I used it with : Just flavoring
Yes Count
% within x2 Grade
No Count
% within x2 Grade
Total Count
% within x2 Grade
94 409 664 607 1774
2.4% 11.9% 17.8% 20.9% 12.7%
3835 3032 3058 2295 12220
97.6% 88.1% 82.2% 79.1% 87.3%
3929 3441 3722 2902 13994
100.0% 100.0% 100.0% 100.0% 100.0%
x16c If I used an electronic vapor product in the past year, I used it with : Nicotine * x2 Grade Crosstabulation
x2 Grade
Total6th 8th 10th 12th
x16c If I used an electronic vapor product in the past year, I used it with : Nicotine
Yes Count
% within x2 Grade
No Count
% within x2 Grade
Total Count
% within x2 Grade
11 80 350 458 899
0.3% 2.3% 9.4% 15.8% 6.4%
3918 3361 3372 2444 13095
99.7% 97.7% 90.6% 84.2% 93.6%
3929 3441 3722 2902 13994
100.0% 100.0% 100.0% 100.0% 100.0%
x16d If I used an electronic vapor product in the past year, I used it with : Marijuana or hash oil * x2 Grade Crosstabulation
x2 Grade
Total6th 8th 10th 12th
x16d If I used an electronic vapor product in the past year, I used it with : Marijuana or hash oil
Yes Count
% within x2 Grade
No Count
% within x2 Grade
Total Count
% within x2 Grade
8 40 192 341 581
0.2% 1.2% 5.2% 11.7% 4.2%
3921 3401 3530 2562 13414
99.8% 98.8% 94.8% 88.3% 95.8%
3929 3441 3722 2903 13995
100.0% 100.0% 100.0% 100.0% 100.0%
Page 44

x16e If I used an electronic vapor product in the past year, I used it with : Other substances * x2 Grade Crosstabulation
x2 Grade
Total6th 8th 10th 12th
x16e If I used an electronic vapor product in the past year, I used it with : Other substances
Yes Count
% within x2 Grade
No Count
% within x2 Grade
Total Count
% within x2 Grade
5 9 10 9 33
0.1% 0.3% 0.3% 0.3% 0.2%
3924 3432 3712 2893 13961
99.9% 99.7% 99.7% 99.7% 99.8%
3929 3441 3722 2902 13994
100.0% 100.0% 100.0% 100.0% 100.0%
x16f If I used an electronic vapor product in the past year, I used it with : I don't know * x2 Grade Crosstabulation
x2 Grade
Total6th 8th 10th 12th
x16f If I used an electronic vapor product in the past year, I used it with : I don't know
Yes Count
% within x2 Grade
No Count
% within x2 Grade
Total Count
% within x2 Grade
341 213 132 93 779
8.7% 6.2% 3.5% 3.2% 5.6%
3588 3228 3591 2809 13216
91.3% 93.8% 96.5% 96.8% 94.4%
3929 3441 3723 2902 13995
100.0% 100.0% 100.0% 100.0% 100.0%
Page 45
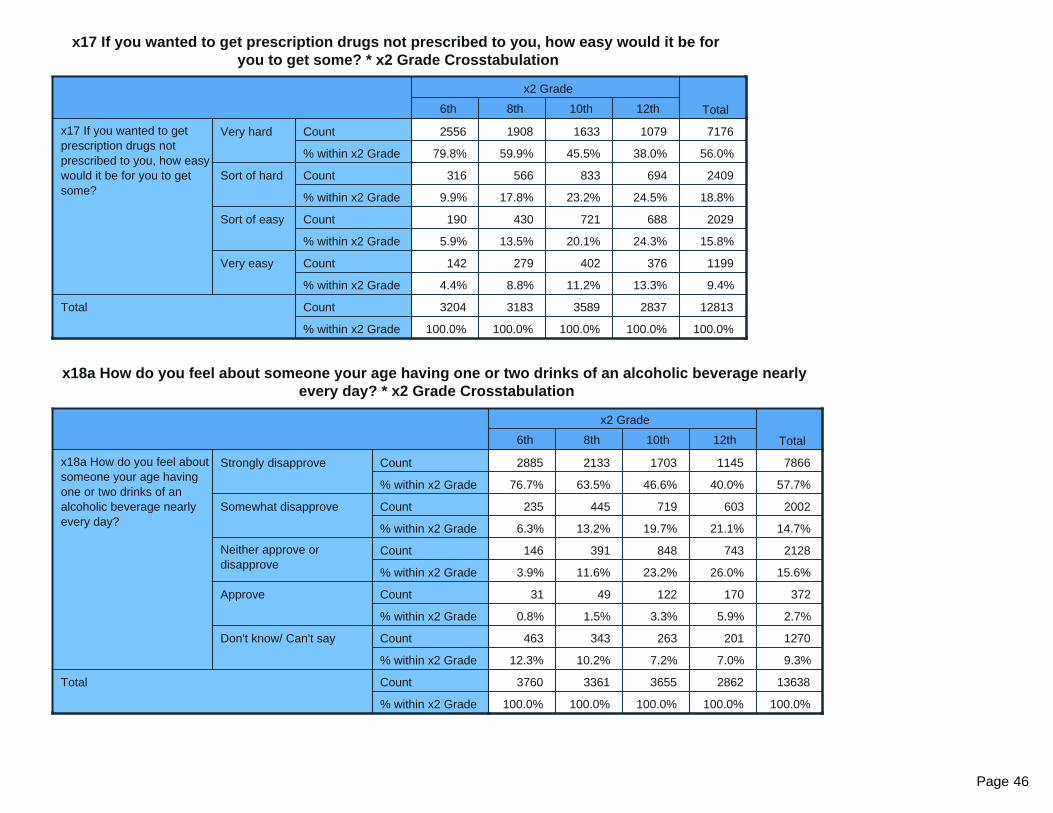
x17 If you wanted to get prescription drugs not prescribed to you, how easy would it be for you to get some? * x2 Grade Crosstabulation
x2 Grade
Total6th 8th 10th 12th
x17 If you wanted to get prescription drugs not prescribed to you, how easy would it be for you to get some?
Very hard Count
% within x2 Grade
Sort of hard Count
% within x2 Grade
Sort of easy Count
% within x2 Grade
Very easy Count
% within x2 Grade
Total Count
% within x2 Grade
2556 1908 1633 1079 7176
79.8% 59.9% 45.5% 38.0% 56.0%
316 566 833 694 2409
9.9% 17.8% 23.2% 24.5% 18.8%
190 430 721 688 2029
5.9% 13.5% 20.1% 24.3% 15.8%
142 279 402 376 1199
4.4% 8.8% 11.2% 13.3% 9.4%
3204 3183 3589 2837 12813
100.0% 100.0% 100.0% 100.0% 100.0%
x18a How do you feel about someone your age having one or two drinks of an alcoholic beverage nearly every day? * x2 Grade Crosstabulation
x2 Grade
Total6th 8th 10th 12th
x18a How do you feel about someone your age having one or two drinks of an alcoholic beverage nearly every day?
Strongly disapprove Count
% within x2 Grade
Somewhat disapprove Count
% within x2 Grade
Neither approve or disapprove
Count
% within x2 Grade
Approve Count
% within x2 Grade
Don't know/ Can't say Count
% within x2 Grade
Total Count
% within x2 Grade
2885 2133 1703 1145 7866
76.7% 63.5% 46.6% 40.0% 57.7%
235 445 719 603 2002
6.3% 13.2% 19.7% 21.1% 14.7%
146 391 848 743 2128
3.9% 11.6% 23.2% 26.0% 15.6%
31 49 122 170 372
0.8% 1.5% 3.3% 5.9% 2.7%
463 343 263 201 1270
12.3% 10.2% 7.2% 7.0% 9.3%
3760 3361 3655 2862 13638
100.0% 100.0% 100.0% 100.0% 100.0%
Page 46

x18b How do you feel about someone your age smoking one or more packs of cigarettes a day? * x2 Grade Crosstabulation
x2 Grade
Total6th 8th 10th 12th
x18b How do you feel about someone your age smoking one or more packs of cigarettes a day?
Strongly disapprove Count
% within x2 Grade
Somewhat disapprove Count
% within x2 Grade
Neither approve or disapprove
Count
% within x2 Grade
Approve Count
% within x2 Grade
Don't know/ Can't say Count
% within x2 Grade
Total Count
% within x2 Grade
3232 2781 2872 2161 11046
86.3% 82.8% 78.7% 75.5% 81.1%
118 194 355 277 944
3.2% 5.8% 9.7% 9.7% 6.9%
86 157 257 280 780
2.3% 4.7% 7.0% 9.8% 5.7%
11 14 20 23 68
0.3% 0.4% 0.5% 0.8% 0.5%
296 213 147 122 778
7.9% 6.3% 4.0% 4.3% 5.7%
3743 3359 3651 2863 13616
100.0% 100.0% 100.0% 100.0% 100.0%
x18c How do you feel about someone your age using marijuana once a month or more? * x2 Grade Crosstabulation
x2 Grade
Total6th 8th 10th 12th
x18c How do you feel about someone your age using marijuana once a month or more?
Strongly disapprove Count
% within x2 Grade
Somewhat disapprove Count
% within x2 Grade
Neither approve or disapprove
Count
% within x2 Grade
Approve Count
% within x2 Grade
Don't know/ Can't say Count
% within x2 Grade
Total Count
% within x2 Grade
3108 2214 1251 670 7243
84.0% 66.2% 34.4% 23.5% 53.5%
129 327 562 328 1346
3.5% 9.8% 15.5% 11.5% 9.9%
101 384 1020 964 2469
2.7% 11.5% 28.1% 33.8% 18.2%
30 155 576 743 1504
0.8% 4.6% 15.9% 26.0% 11.1%
334 263 224 148 969
9.0% 7.9% 6.2% 5.2% 7.2%
3702 3343 3633 2853 13531
100.0% 100.0% 100.0% 100.0% 100.0%
Page 47

x18d How do you feel about someone your age using prescription drugs not prescribed to them? * x2 Grade Crosstabulation
x2 Grade
Total6th 8th 10th 12th
x18d How do you feel about someone your age using prescription drugs not prescribed to them?
Strongly disapprove Count
% within x2 Grade
Somewhat disapprove Count
% within x2 Grade
Neither approve or disapprove
Count
% within x2 Grade
Approve Count
% within x2 Grade
Don't know/ Can't say Count
% within x2 Grade
Total Count
% within x2 Grade
2943 2456 2524 1939 9862
80.1% 73.7% 69.8% 68.2% 73.2%
257 376 534 420 1587
7.0% 11.3% 14.8% 14.8% 11.8%
121 219 334 311 985
3.3% 6.6% 9.2% 10.9% 7.3%
20 18 28 35 101
0.5% 0.5% 0.8% 1.2% 0.8%
331 264 196 140 931
9.0% 7.9% 5.4% 4.9% 6.9%
3672 3333 3616 2845 13466
100.0% 100.0% 100.0% 100.0% 100.0%
Page 48
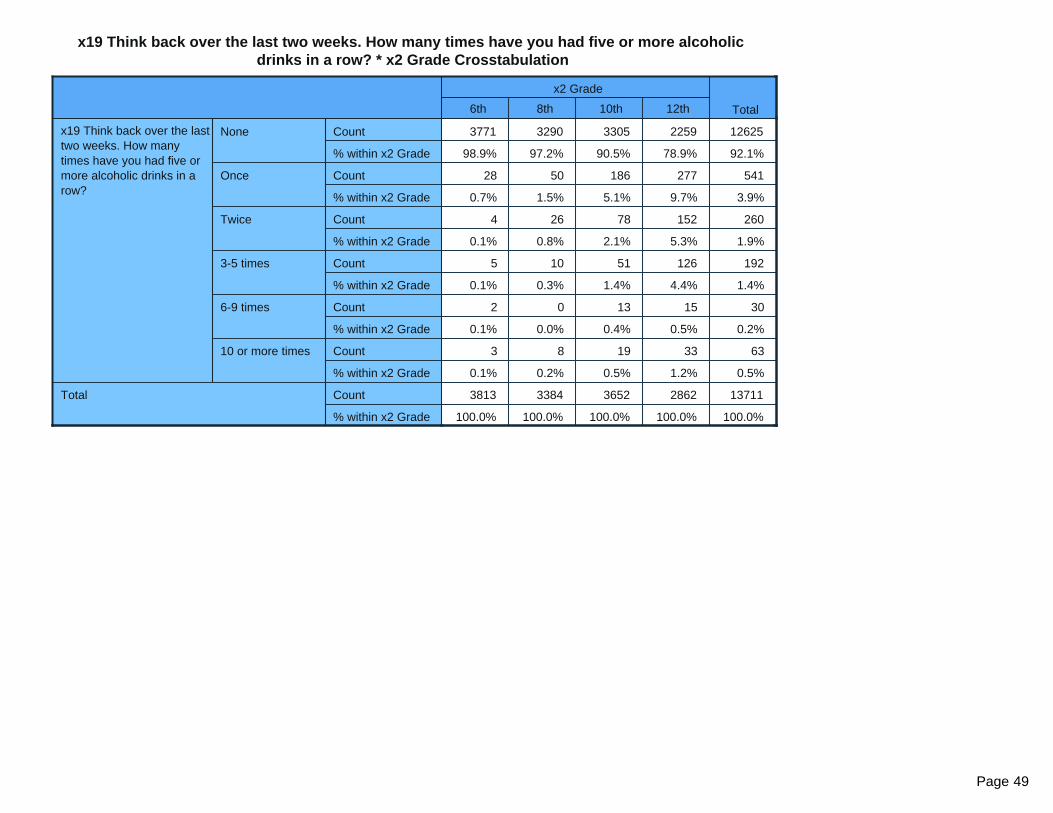
x19 Think back over the last two weeks. How many times have you had five or more alcoholic drinks in a row? * x2 Grade Crosstabulation
x2 Grade
Total6th 8th 10th 12th
x19 Think back over the last two weeks. How many times have you had five or more alcoholic drinks in a row?
None Count
% within x2 Grade
Once Count
% within x2 Grade
Twice Count
% within x2 Grade
3-5 times Count
% within x2 Grade
6-9 times Count
% within x2 Grade
10 or more times Count
% within x2 Grade
Total Count
% within x2 Grade
3771 3290 3305 2259 12625
98.9% 97.2% 90.5% 78.9% 92.1%
28 50 186 277 541
0.7% 1.5% 5.1% 9.7% 3.9%
4 26 78 152 260
0.1% 0.8% 2.1% 5.3% 1.9%
5 10 51 126 192
0.1% 0.3% 1.4% 4.4% 1.4%
2 0 13 15 30
0.1% 0.0% 0.4% 0.5% 0.2%
3 8 19 33 63
0.1% 0.2% 0.5% 1.2% 0.5%
3813 3384 3652 2862 13711
100.0% 100.0% 100.0% 100.0% 100.0%
Page 49
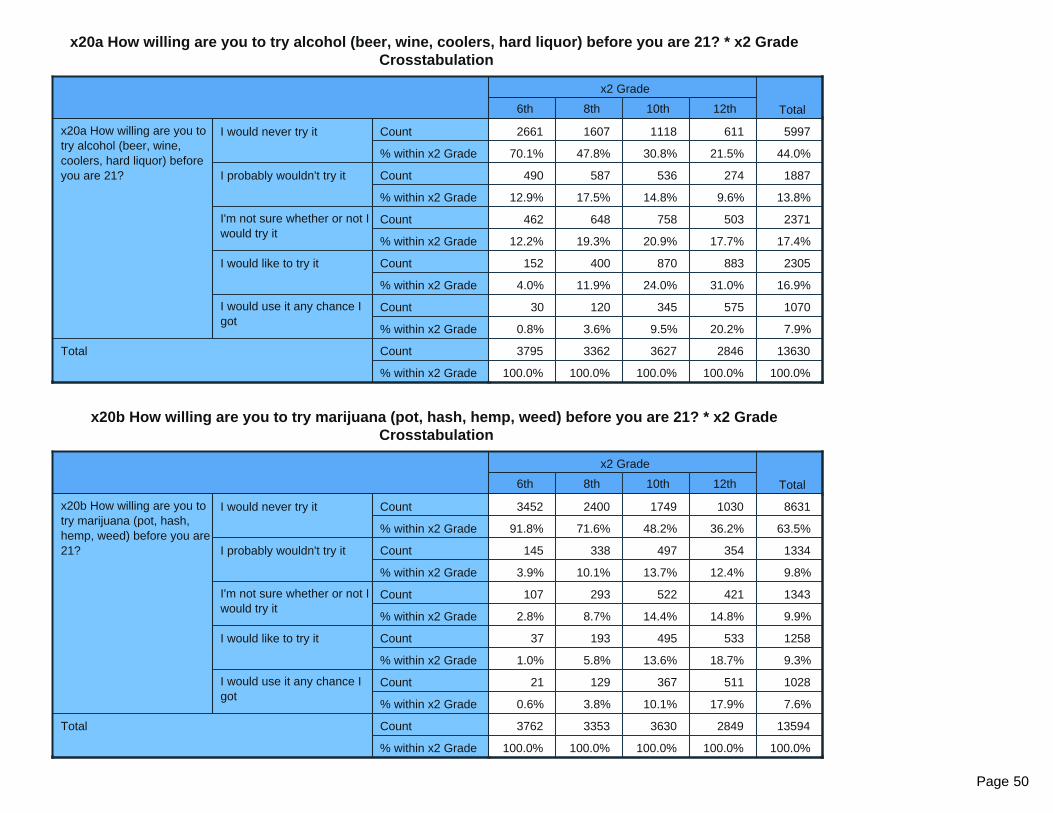
x20a How willing are you to try alcohol (beer, wine, coolers, hard liquor) before you are 21? * x2 Grade Crosstabulation
x2 Grade
Total6th 8th 10th 12th
x20a How willing are you to try alcohol (beer, wine, coolers, hard liquor) before you are 21?
I would never try it Count
% within x2 Grade
I probably wouldn't try it Count
% within x2 Grade
I'm not sure whether or not I would try it
Count
% within x2 Grade
I would like to try it Count
% within x2 Grade
I would use it any chance I got
Count
% within x2 Grade
Total Count
% within x2 Grade
2661 1607 1118 611 5997
70.1% 47.8% 30.8% 21.5% 44.0%
490 587 536 274 1887
12.9% 17.5% 14.8% 9.6% 13.8%
462 648 758 503 2371
12.2% 19.3% 20.9% 17.7% 17.4%
152 400 870 883 2305
4.0% 11.9% 24.0% 31.0% 16.9%
30 120 345 575 1070
0.8% 3.6% 9.5% 20.2% 7.9%
3795 3362 3627 2846 13630
100.0% 100.0% 100.0% 100.0% 100.0%
x20b How willing are you to try marijuana (pot, hash, hemp, weed) before you are 21? * x2 Grade Crosstabulation
x2 Grade
Total6th 8th 10th 12th
x20b How willing are you to try marijuana (pot, hash, hemp, weed) before you are 21?
I would never try it Count
% within x2 Grade
I probably wouldn't try it Count
% within x2 Grade
I'm not sure whether or not I would try it
Count
% within x2 Grade
I would like to try it Count
% within x2 Grade
I would use it any chance I got
Count
% within x2 Grade
Total Count
% within x2 Grade
3452 2400 1749 1030 8631
91.8% 71.6% 48.2% 36.2% 63.5%
145 338 497 354 1334
3.9% 10.1% 13.7% 12.4% 9.8%
107 293 522 421 1343
2.8% 8.7% 14.4% 14.8% 9.9%
37 193 495 533 1258
1.0% 5.8% 13.6% 18.7% 9.3%
21 129 367 511 1028
0.6% 3.8% 10.1% 17.9% 7.6%
3762 3353 3630 2849 13594
100.0% 100.0% 100.0% 100.0% 100.0%
Page 50

a1 During the last four weeks, how many whole days of school have you missed because you skipped or 'cut'? * x2 Grade Crosstabulation
x2 Grade
Total6th 8th 10th 12th
a1 During the last four weeks, how many whole days of school have you missed because you skipped or 'cut'?
None Count
% within x2 Grade
1 day Count
% within x2 Grade
2 days Count
% within x2 Grade
3 days Count
% within x2 Grade
4 to 5 days Count
% within x2 Grade
6 to 10 days Count
% within x2 Grade
11 or more days Count
% within x2 Grade
Total Count
% within x2 Grade
2804 2778 3017 2115 10714
91.0% 90.5% 87.8% 78.9% 87.3%
129 155 208 283 775
4.2% 5.1% 6.1% 10.6% 6.3%
76 59 91 133 359
2.5% 1.9% 2.6% 5.0% 2.9%
33 32 59 71 195
1.1% 1.0% 1.7% 2.6% 1.6%
25 26 34 40 125
0.8% 0.8% 1.0% 1.5% 1.0%
6 15 14 23 58
0.2% 0.5% 0.4% 0.9% 0.5%
8 4 13 16 41
0.3% 0.1% 0.4% 0.6% 0.3%
3081 3069 3436 2681 12267
100.0% 100.0% 100.0% 100.0% 100.0%
Page 51

a2 How important do you think the things you are learning in school are going to be for your later life? * x2 Grade Crosstabulation
x2 Grade
Total6th 8th 10th 12th
a2 How important do you think the things you are learning in school are going to be for your later life?
Very important Count
% within x2 Grade
Quite important Count
% within x2 Grade
Fairly important Count
% within x2 Grade
Slightly important Count
% within x2 Grade
Not at all important Count
% within x2 Grade
Total Count
% within x2 Grade
1825 1182 937 697 4641
60.4% 38.7% 27.4% 26.1% 38.2%
592 691 740 509 2532
19.6% 22.6% 21.6% 19.1% 20.8%
376 635 860 709 2580
12.4% 20.8% 25.2% 26.6% 21.2%
158 383 662 573 1776
5.2% 12.6% 19.4% 21.5% 14.6%
71 160 220 180 631
2.3% 5.2% 6.4% 6.7% 5.2%
3022 3051 3419 2668 12160
100.0% 100.0% 100.0% 100.0% 100.0%
a3 How interesting are most of your courses to you? * x2 Grade Crosstabulation
x2 Grade
Total6th 8th 10th 12th
a3 How interesting are most of your courses to you?
Very interesting and stimulating
Count
% within x2 Grade
Quite interesting Count
% within x2 Grade
Fairly interesting Count
% within x2 Grade
Slightly Dull Count
% within x2 Grade
Very Dull Count
% within x2 Grade
Total Count
% within x2 Grade
883 563 426 440 2312
31.5% 18.8% 12.5% 16.5% 19.5%
894 798 817 756 3265
31.9% 26.6% 23.9% 28.4% 27.5%
603 899 1240 884 3626
21.5% 30.0% 36.3% 33.2% 30.5%
243 462 601 382 1688
8.7% 15.4% 17.6% 14.4% 14.2%
179 275 330 198 982
6.4% 9.2% 9.7% 7.4% 8.3%
2802 2997 3414 2660 11873
100.0% 100.0% 100.0% 100.0% 100.0%
Page 52
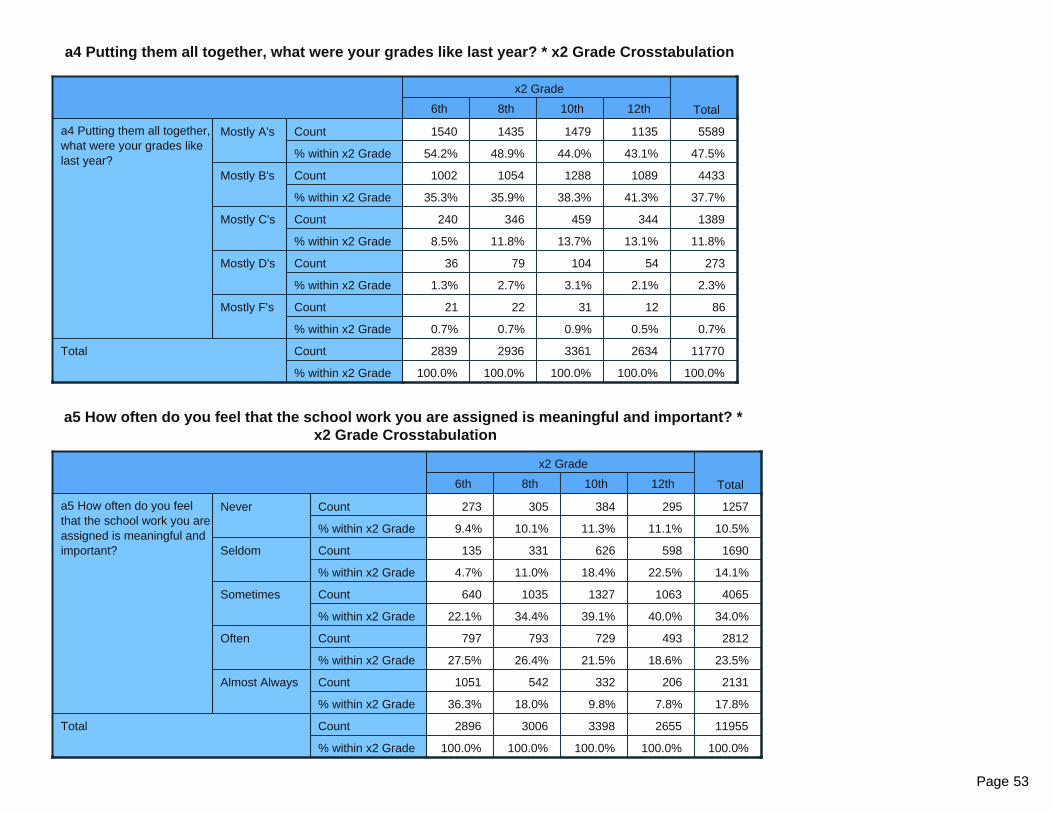
a4 Putting them all together, what were your grades like last year? * x2 Grade Crosstabulation
x2 Grade
Total6th 8th 10th 12th
a4 Putting them all together, what were your grades like last year?
Mostly A's Count
% within x2 Grade
Mostly B's Count
% within x2 Grade
Mostly C's Count
% within x2 Grade
Mostly D's Count
% within x2 Grade
Mostly F's Count
% within x2 Grade
Total Count
% within x2 Grade
1540 1435 1479 1135 5589
54.2% 48.9% 44.0% 43.1% 47.5%
1002 1054 1288 1089 4433
35.3% 35.9% 38.3% 41.3% 37.7%
240 346 459 344 1389
8.5% 11.8% 13.7% 13.1% 11.8%
36 79 104 54 273
1.3% 2.7% 3.1% 2.1% 2.3%
21 22 31 12 86
0.7% 0.7% 0.9% 0.5% 0.7%
2839 2936 3361 2634 11770
100.0% 100.0% 100.0% 100.0% 100.0%
a5 How often do you feel that the school work you are assigned is meaningful and important? * x2 Grade Crosstabulation
x2 Grade
Total6th 8th 10th 12th
a5 How often do you feel that the school work you are assigned is meaningful and important?
Never Count
% within x2 Grade
Seldom Count
% within x2 Grade
Sometimes Count
% within x2 Grade
Often Count
% within x2 Grade
Almost Always Count
% within x2 Grade
Total Count
% within x2 Grade
273 305 384 295 1257
9.4% 10.1% 11.3% 11.1% 10.5%
135 331 626 598 1690
4.7% 11.0% 18.4% 22.5% 14.1%
640 1035 1327 1063 4065
22.1% 34.4% 39.1% 40.0% 34.0%
797 793 729 493 2812
27.5% 26.4% 21.5% 18.6% 23.5%
1051 542 332 206 2131
36.3% 18.0% 9.8% 7.8% 17.8%
2896 3006 3398 2655 11955
100.0% 100.0% 100.0% 100.0% 100.0%
Page 53
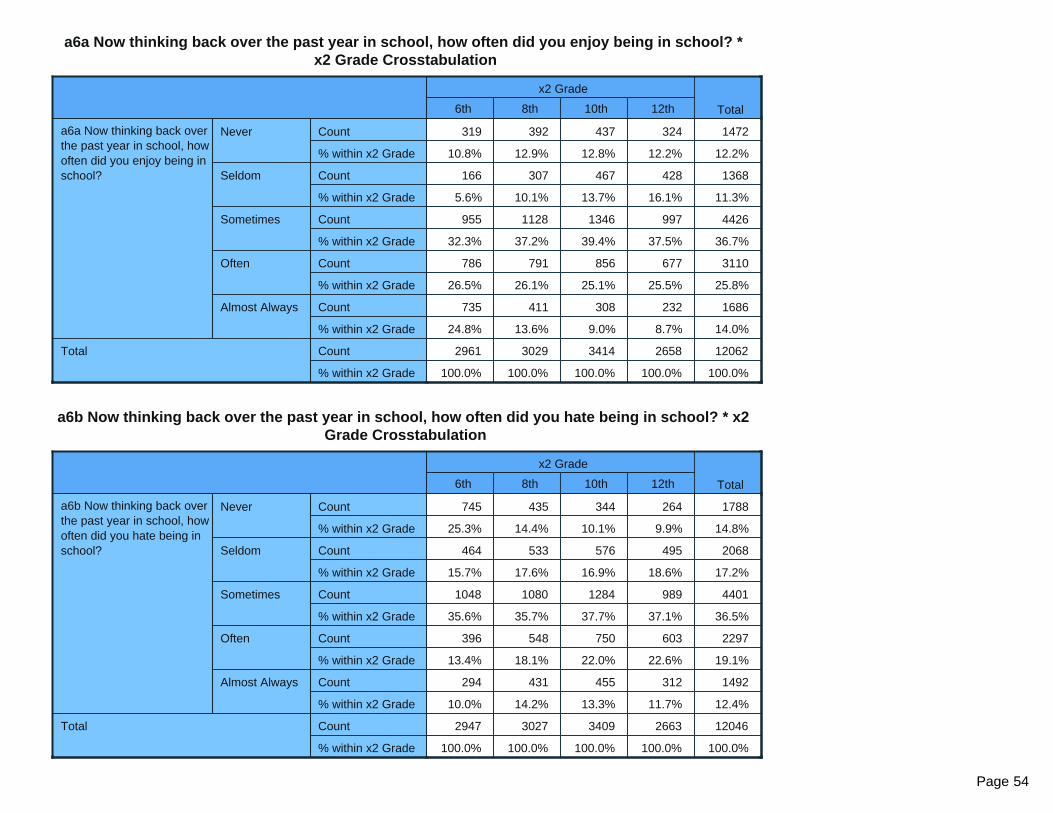
a6a Now thinking back over the past year in school, how often did you enjoy being in school? * x2 Grade Crosstabulation
x2 Grade
Total6th 8th 10th 12th
a6a Now thinking back over the past year in school, how often did you enjoy being in school?
Never Count
% within x2 Grade
Seldom Count
% within x2 Grade
Sometimes Count
% within x2 Grade
Often Count
% within x2 Grade
Almost Always Count
% within x2 Grade
Total Count
% within x2 Grade
319 392 437 324 1472
10.8% 12.9% 12.8% 12.2% 12.2%
166 307 467 428 1368
5.6% 10.1% 13.7% 16.1% 11.3%
955 1128 1346 997 4426
32.3% 37.2% 39.4% 37.5% 36.7%
786 791 856 677 3110
26.5% 26.1% 25.1% 25.5% 25.8%
735 411 308 232 1686
24.8% 13.6% 9.0% 8.7% 14.0%
2961 3029 3414 2658 12062
100.0% 100.0% 100.0% 100.0% 100.0%
a6b Now thinking back over the past year in school, how often did you hate being in school? * x2 Grade Crosstabulation
x2 Grade
Total6th 8th 10th 12th
a6b Now thinking back over the past year in school, how often did you hate being in school?
Never Count
% within x2 Grade
Seldom Count
% within x2 Grade
Sometimes Count
% within x2 Grade
Often Count
% within x2 Grade
Almost Always Count
% within x2 Grade
Total Count
% within x2 Grade
745 435 344 264 1788
25.3% 14.4% 10.1% 9.9% 14.8%
464 533 576 495 2068
15.7% 17.6% 16.9% 18.6% 17.2%
1048 1080 1284 989 4401
35.6% 35.7% 37.7% 37.1% 36.5%
396 548 750 603 2297
13.4% 18.1% 22.0% 22.6% 19.1%
294 431 455 312 1492
10.0% 14.2% 13.3% 11.7% 12.4%
2947 3027 3409 2663 12046
100.0% 100.0% 100.0% 100.0% 100.0%
Page 54

a6c Now thinking back over the past year in school, how often did you try to do best work in school? * x2 Grade Crosstabulation
x2 Grade
Total6th 8th 10th 12th
a6c Now thinking back over the past year in school, how often did you try to do best work in school?
Never Count
% within x2 Grade
Seldom Count
% within x2 Grade
Sometimes Count
% within x2 Grade
Often Count
% within x2 Grade
Almost Always Count
% within x2 Grade
Total Count
% within x2 Grade
77 78 79 97 331
2.6% 2.6% 2.3% 3.7% 2.8%
42 67 126 113 348
1.4% 2.2% 3.7% 4.3% 2.9%
187 340 527 465 1519
6.4% 11.3% 15.5% 17.6% 12.7%
589 917 1119 897 3522
20.1% 30.4% 32.9% 34.0% 29.4%
2041 1610 1551 1070 6272
69.5% 53.5% 45.6% 40.5% 52.3%
2936 3012 3402 2642 11992
100.0% 100.0% 100.0% 100.0% 100.0%
a7 Are your school grades better than the grades of most students in your class? * x2 Grade Crosstabulation
x2 Grade
Total6th 8th 10th 12th
a7 Are your school grades better than the grades of most students in your class?
NO! Count
% within x2 Grade
no Count
% within x2 Grade
yes Count
% within x2 Grade
YES! Count
% within x2 Grade
Total Count
% within x2 Grade
165 168 193 169 695
6.0% 5.7% 5.7% 6.4% 5.9%
579 699 907 716 2901
21.0% 23.6% 26.9% 27.2% 24.7%
1460 1553 1756 1278 6047
52.8% 52.4% 52.1% 48.5% 51.6%
559 541 512 472 2084
20.2% 18.3% 15.2% 17.9% 17.8%
2763 2961 3368 2635 11727
100.0% 100.0% 100.0% 100.0% 100.0%
Page 55
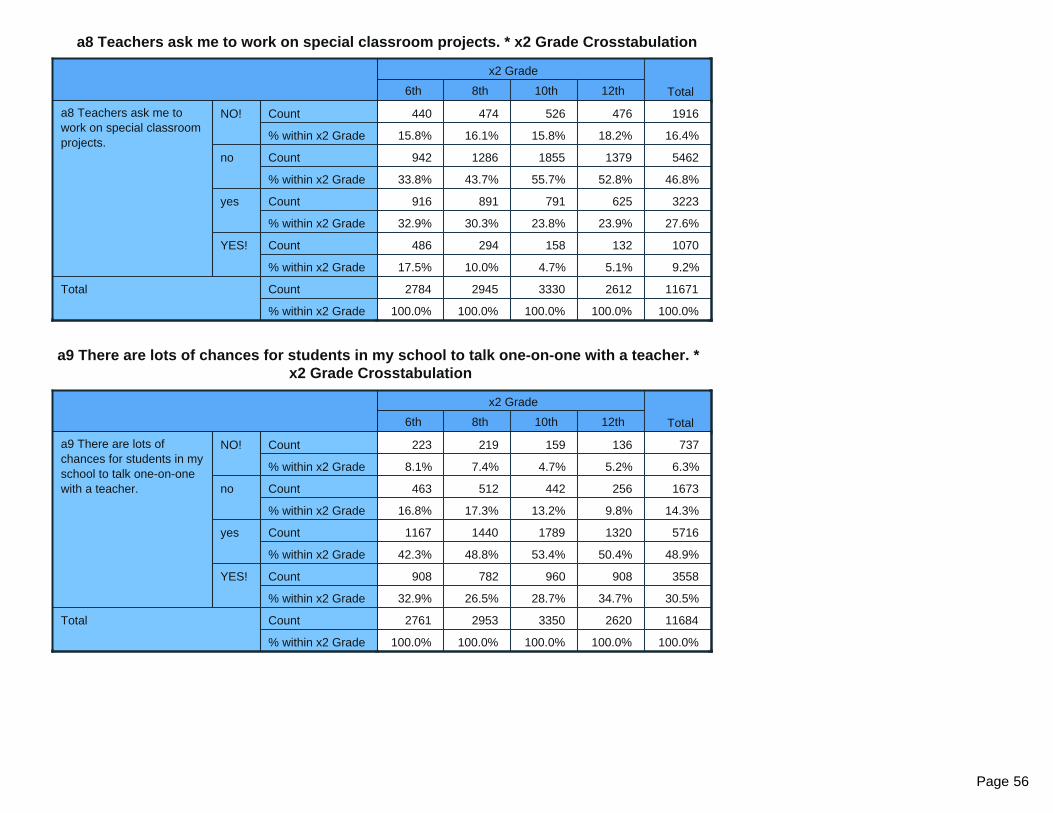
a8 Teachers ask me to work on special classroom projects. * x2 Grade Crosstabulation
x2 Grade
Total6th 8th 10th 12th
a8 Teachers ask me to work on special classroom projects.
NO! Count
% within x2 Grade
no Count
% within x2 Grade
yes Count
% within x2 Grade
YES! Count
% within x2 Grade
Total Count
% within x2 Grade
440 474 526 476 1916
15.8% 16.1% 15.8% 18.2% 16.4%
942 1286 1855 1379 5462
33.8% 43.7% 55.7% 52.8% 46.8%
916 891 791 625 3223
32.9% 30.3% 23.8% 23.9% 27.6%
486 294 158 132 1070
17.5% 10.0% 4.7% 5.1% 9.2%
2784 2945 3330 2612 11671
100.0% 100.0% 100.0% 100.0% 100.0%
a9 There are lots of chances for students in my school to talk one-on-one with a teacher. * x2 Grade Crosstabulation
x2 Grade
Total6th 8th 10th 12th
a9 There are lots of chances for students in my school to talk one-on-one with a teacher.
NO! Count
% within x2 Grade
no Count
% within x2 Grade
yes Count
% within x2 Grade
YES! Count
% within x2 Grade
Total Count
% within x2 Grade
223 219 159 136 737
8.1% 7.4% 4.7% 5.2% 6.3%
463 512 442 256 1673
16.8% 17.3% 13.2% 9.8% 14.3%
1167 1440 1789 1320 5716
42.3% 48.8% 53.4% 50.4% 48.9%
908 782 960 908 3558
32.9% 26.5% 28.7% 34.7% 30.5%
2761 2953 3350 2620 11684
100.0% 100.0% 100.0% 100.0% 100.0%
Page 56
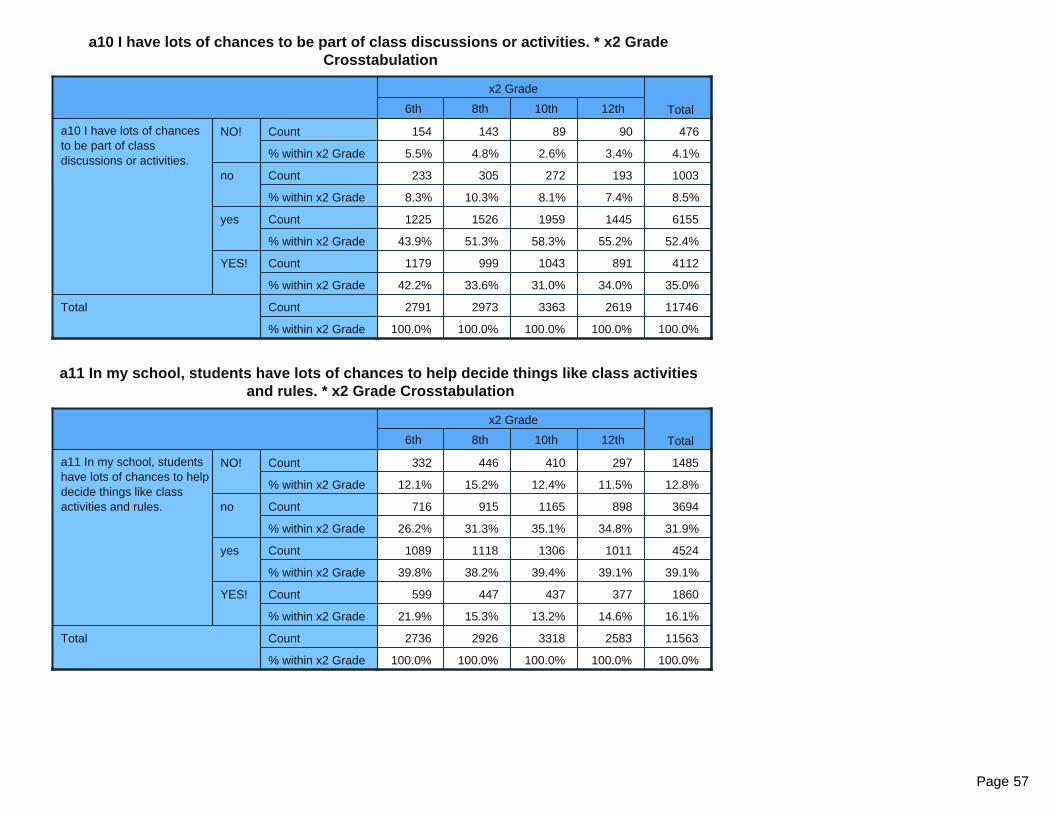
a10 I have lots of chances to be part of class discussions or activities. * x2 Grade Crosstabulation
x2 Grade
Total6th 8th 10th 12th
a10 I have lots of chances to be part of class discussions or activities.
NO! Count
% within x2 Grade
no Count
% within x2 Grade
yes Count
% within x2 Grade
YES! Count
% within x2 Grade
Total Count
% within x2 Grade
154 143 89 90 476
5.5% 4.8% 2.6% 3.4% 4.1%
233 305 272 193 1003
8.3% 10.3% 8.1% 7.4% 8.5%
1225 1526 1959 1445 6155
43.9% 51.3% 58.3% 55.2% 52.4%
1179 999 1043 891 4112
42.2% 33.6% 31.0% 34.0% 35.0%
2791 2973 3363 2619 11746
100.0% 100.0% 100.0% 100.0% 100.0%
a11 In my school, students have lots of chances to help decide things like class activities and rules. * x2 Grade Crosstabulation
x2 Grade
Total6th 8th 10th 12th
a11 In my school, students have lots of chances to help decide things like class activities and rules.
NO! Count
% within x2 Grade
no Count
% within x2 Grade
yes Count
% within x2 Grade
YES! Count
% within x2 Grade
Total Count
% within x2 Grade
332 446 410 297 1485
12.1% 15.2% 12.4% 11.5% 12.8%
716 915 1165 898 3694
26.2% 31.3% 35.1% 34.8% 31.9%
1089 1118 1306 1011 4524
39.8% 38.2% 39.4% 39.1% 39.1%
599 447 437 377 1860
21.9% 15.3% 13.2% 14.6% 16.1%
2736 2926 3318 2583 11563
100.0% 100.0% 100.0% 100.0% 100.0%
Page 57

a12 There are lots of chances for students in my school to get involved in sports, clubs, and other school activities outside of class. * x2 Grade Crosstabulation
x2 Grade
Total6th 8th 10th 12th
a12 There are lots of chances for students in my school to get involved in sports, clubs, and other school activities outside of class.
NO! Count
% within x2 Grade
no Count
% within x2 Grade
yes Count
% within x2 Grade
YES! Count
% within x2 Grade
Total Count
% within x2 Grade
134 118 79 73 404
4.9% 4.0% 2.4% 2.8% 3.5%
198 126 102 80 506
7.2% 4.3% 3.0% 3.1% 4.3%
991 1110 1238 961 4300
35.9% 37.7% 36.9% 36.9% 36.9%
1439 1587 1937 1493 6456
52.1% 54.0% 57.7% 57.3% 55.3%
2762 2941 3356 2607 11666
100.0% 100.0% 100.0% 100.0% 100.0%
a13 My teacher(s) notices when I am doing a good job and lets me know about it. * x2 Grade Crosstabulation
x2 Grade
Total6th 8th 10th 12th
a13 My teacher(s) notices when I am doing a good job and lets me know about it.
NO! Count
% within x2 Grade
no Count
% within x2 Grade
yes Count
% within x2 Grade
YES! Count
% within x2 Grade
Total Count
% within x2 Grade
190 241 239 195 865
6.8% 8.1% 7.2% 7.5% 7.4%
363 615 1005 723 2706
13.0% 20.8% 30.1% 27.7% 23.1%
1274 1428 1592 1278 5572
45.7% 48.3% 47.7% 48.9% 47.6%
959 675 505 415 2554
34.4% 22.8% 15.1% 15.9% 21.8%
2786 2959 3341 2611 11697
100.0% 100.0% 100.0% 100.0% 100.0%
Page 58

a14 I feel safe at my school. * x2 Grade Crosstabulation
x2 Grade
Total6th 8th 10th 12th
a14 I feel safe at my school. NO! Count
% within x2 Grade
no Count
% within x2 Grade
yes Count
% within x2 Grade
YES! Count
% within x2 Grade
Total Count
% within x2 Grade
162 239 188 135 724
5.8% 8.1% 5.6% 5.2% 6.2%
308 456 461 276 1501
11.1% 15.5% 13.8% 10.6% 12.9%
1116 1436 1882 1372 5806
40.1% 48.9% 56.3% 52.6% 49.8%
1197 804 810 826 3637
43.0% 27.4% 24.2% 31.7% 31.2%
2783 2935 3341 2609 11668
100.0% 100.0% 100.0% 100.0% 100.0%
a15 The school lets my parents know when I have done something well. * x2 Grade Crosstabulation
x2 Grade
Total6th 8th 10th 12th
a15 The school lets my parents know when I have done something well.
NO! Count
% within x2 Grade
no Count
% within x2 Grade
yes Count
% within x2 Grade
YES! Count
% within x2 Grade
Total Count
% within x2 Grade
340 581 702 573 2196
12.4% 19.8% 21.1% 22.1% 18.9%
740 1061 1593 1241 4635
27.0% 36.1% 47.8% 47.8% 39.9%
947 919 797 566 3229
34.5% 31.3% 23.9% 21.8% 27.8%
716 375 242 218 1551
26.1% 12.8% 7.3% 8.4% 13.4%
2743 2936 3334 2598 11611
100.0% 100.0% 100.0% 100.0% 100.0%
Page 59
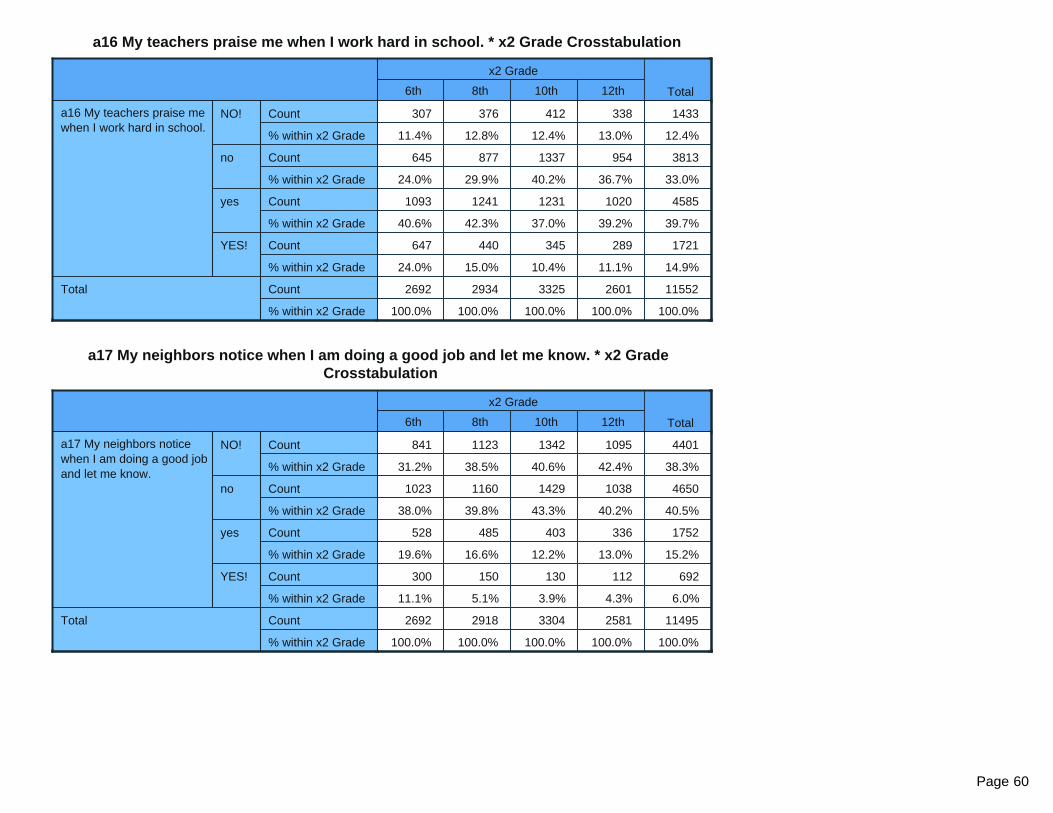
a16 My teachers praise me when I work hard in school. * x2 Grade Crosstabulation
x2 Grade
Total6th 8th 10th 12th
a16 My teachers praise me when I work hard in school.
NO! Count
% within x2 Grade
no Count
% within x2 Grade
yes Count
% within x2 Grade
YES! Count
% within x2 Grade
Total Count
% within x2 Grade
307 376 412 338 1433
11.4% 12.8% 12.4% 13.0% 12.4%
645 877 1337 954 3813
24.0% 29.9% 40.2% 36.7% 33.0%
1093 1241 1231 1020 4585
40.6% 42.3% 37.0% 39.2% 39.7%
647 440 345 289 1721
24.0% 15.0% 10.4% 11.1% 14.9%
2692 2934 3325 2601 11552
100.0% 100.0% 100.0% 100.0% 100.0%
a17 My neighbors notice when I am doing a good job and let me know. * x2 Grade Crosstabulation
x2 Grade
Total6th 8th 10th 12th
a17 My neighbors notice when I am doing a good job and let me know.
NO! Count
% within x2 Grade
no Count
% within x2 Grade
yes Count
% within x2 Grade
YES! Count
% within x2 Grade
Total Count
% within x2 Grade
841 1123 1342 1095 4401
31.2% 38.5% 40.6% 42.4% 38.3%
1023 1160 1429 1038 4650
38.0% 39.8% 43.3% 40.2% 40.5%
528 485 403 336 1752
19.6% 16.6% 12.2% 13.0% 15.2%
300 150 130 112 692
11.1% 5.1% 3.9% 4.3% 6.0%
2692 2918 3304 2581 11495
100.0% 100.0% 100.0% 100.0% 100.0%
Page 60

a18 There are people in my neighborhood who are proud of me when I do something well. * x2 Grade Crosstabulation
x2 Grade
Total6th 8th 10th 12th
a18 There are people in my neighborhood who are proud of me when I do something well.
NO! Count
% within x2 Grade
no Count
% within x2 Grade
yes Count
% within x2 Grade
YES! Count
% within x2 Grade
Total Count
% within x2 Grade
667 940 1075 900 3582
24.8% 32.4% 32.5% 34.9% 31.2%
780 900 1182 860 3722
29.0% 31.0% 35.8% 33.3% 32.4%
811 830 819 638 3098
30.2% 28.6% 24.8% 24.7% 27.0%
431 233 227 182 1073
16.0% 8.0% 6.9% 7.1% 9.4%
2689 2903 3303 2580 11475
100.0% 100.0% 100.0% 100.0% 100.0%
a19 There are people in my neighborhood who encourage me to do my best. * x2 Grade Crosstabulation
x2 Grade
Total6th 8th 10th 12th
a19 There are people in my neighborhood who encourage me to do my best.
NO! Count
% within x2 Grade
no Count
% within x2 Grade
yes Count
% within x2 Grade
YES! Count
% within x2 Grade
Total Count
% within x2 Grade
554 806 953 803 3116
20.5% 27.7% 28.9% 31.2% 27.2%
582 753 996 756 3087
21.6% 25.9% 30.2% 29.4% 26.9%
935 992 1025 787 3739
34.7% 34.1% 31.1% 30.6% 32.6%
626 355 322 226 1529
23.2% 12.2% 9.8% 8.8% 13.3%
2697 2906 3296 2572 11471
100.0% 100.0% 100.0% 100.0% 100.0%
Page 61

a20 I like my neighborhood. * x2 Grade Crosstabulation
x2 Grade
Total6th 8th 10th 12th
a20 I like my neighborhood. NO! Count
% within x2 Grade
no Count
% within x2 Grade
yes Count
% within x2 Grade
YES! Count
% within x2 Grade
Total Count
% within x2 Grade
240 292 304 217 1053
8.8% 10.0% 9.2% 8.4% 9.1%
249 394 452 378 1473
9.1% 13.5% 13.7% 14.6% 12.8%
1045 1382 1776 1420 5623
38.3% 47.4% 53.8% 55.0% 48.8%
1198 847 768 569 3382
43.9% 29.1% 23.3% 22.0% 29.3%
2732 2915 3300 2584 11531
100.0% 100.0% 100.0% 100.0% 100.0%
a21 I’d like to get out of my neighborhood. * x2 Grade Crosstabulation
x2 Grade
Total6th 8th 10th 12th
a21 I’d like to get out of my neighborhood.
NO! Count
% within x2 Grade
no Count
% within x2 Grade
yes Count
% within x2 Grade
YES! Count
% within x2 Grade
Total Count
% within x2 Grade
1232 940 869 534 3575
45.6% 32.3% 26.4% 20.8% 31.2%
804 1077 1360 986 4227
29.8% 37.0% 41.3% 38.3% 36.8%
379 557 645 641 2222
14.0% 19.1% 19.6% 24.9% 19.4%
287 337 415 412 1451
10.6% 11.6% 12.6% 16.0% 12.6%
2702 2911 3289 2573 11475
100.0% 100.0% 100.0% 100.0% 100.0%
Page 62

a22 If I had to move, I would miss the neighborhood I now live in. * x2 Grade Crosstabulation
x2 Grade
Total6th 8th 10th 12th
a22 If I had to move, I would miss the neighborhood I now live in.
NO! Count
% within x2 Grade
no Count
% within x2 Grade
yes Count
% within x2 Grade
YES! Count
% within x2 Grade
Total Count
% within x2 Grade
286 349 351 289 1275
10.5% 12.0% 10.6% 11.2% 11.0%
331 533 687 631 2182
12.1% 18.3% 20.8% 24.4% 18.9%
790 1075 1363 1116 4344
28.9% 36.8% 41.2% 43.2% 37.6%
1325 962 906 549 3742
48.5% 33.0% 27.4% 21.2% 32.4%
2732 2919 3307 2585 11543
100.0% 100.0% 100.0% 100.0% 100.0%
a23a How wrong do your friends feel it would be for YOU to have 1 or 2 drinks nearly every day? * x2 Grade Crosstabulation
x2 Grade
Total6th 8th 10th 12th
a23a How wrong do your friends feel it would be for YOU to have 1 or 2 drinks nearly every day?
Not Wrong at All Count
% within x2 Grade
A Little Bit Wrong Count
% within x2 Grade
Wrong Count
% within x2 Grade
Very wrong Count
% within x2 Grade
Total Count
% within x2 Grade
207 263 423 421 1314
7.7% 9.0% 12.7% 16.3% 11.4%
139 307 632 553 1631
5.1% 10.5% 19.0% 21.4% 14.1%
368 685 900 736 2689
13.6% 23.5% 27.0% 28.4% 23.3%
1987 1665 1373 877 5902
73.6% 57.0% 41.3% 33.9% 51.2%
2701 2920 3328 2587 11536
100.0% 100.0% 100.0% 100.0% 100.0%
Page 63
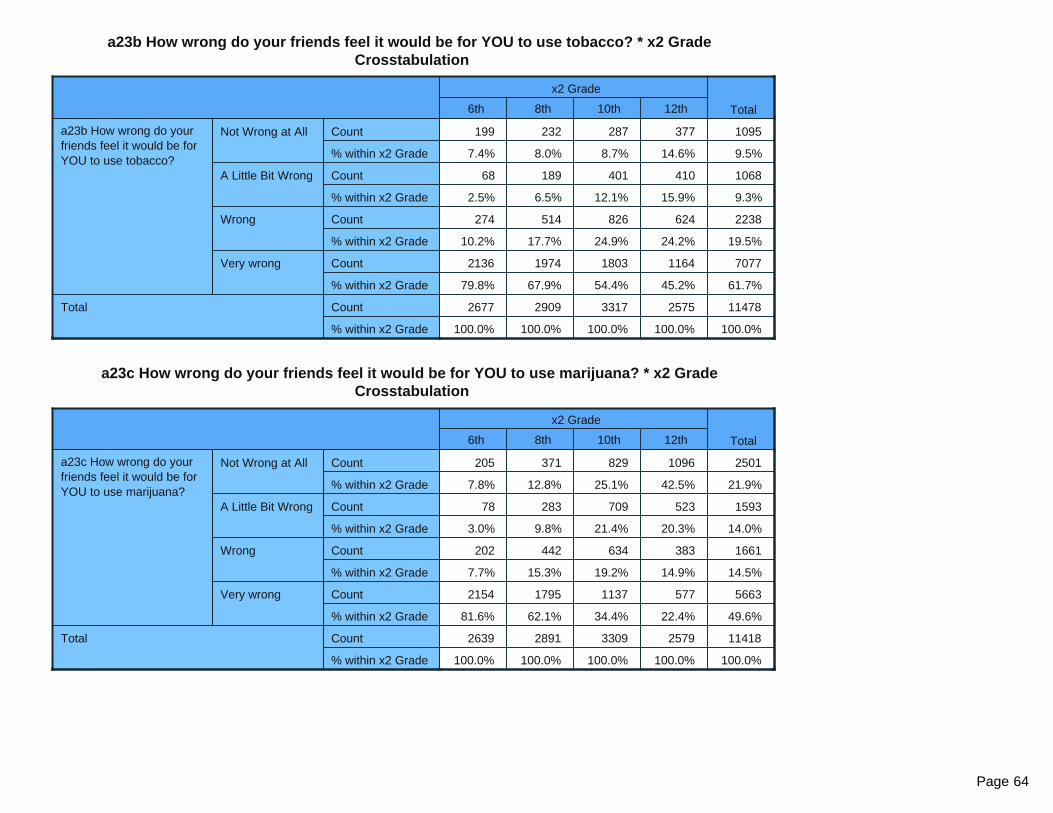
a23b How wrong do your friends feel it would be for YOU to use tobacco? * x2 Grade Crosstabulation
x2 Grade
Total6th 8th 10th 12th
a23b How wrong do your friends feel it would be for YOU to use tobacco?
Not Wrong at All Count
% within x2 Grade
A Little Bit Wrong Count
% within x2 Grade
Wrong Count
% within x2 Grade
Very wrong Count
% within x2 Grade
Total Count
% within x2 Grade
199 232 287 377 1095
7.4% 8.0% 8.7% 14.6% 9.5%
68 189 401 410 1068
2.5% 6.5% 12.1% 15.9% 9.3%
274 514 826 624 2238
10.2% 17.7% 24.9% 24.2% 19.5%
2136 1974 1803 1164 7077
79.8% 67.9% 54.4% 45.2% 61.7%
2677 2909 3317 2575 11478
100.0% 100.0% 100.0% 100.0% 100.0%
a23c How wrong do your friends feel it would be for YOU to use marijuana? * x2 Grade Crosstabulation
x2 Grade
Total6th 8th 10th 12th
a23c How wrong do your friends feel it would be for YOU to use marijuana?
Not Wrong at All Count
% within x2 Grade
A Little Bit Wrong Count
% within x2 Grade
Wrong Count
% within x2 Grade
Very wrong Count
% within x2 Grade
Total Count
% within x2 Grade
205 371 829 1096 2501
7.8% 12.8% 25.1% 42.5% 21.9%
78 283 709 523 1593
3.0% 9.8% 21.4% 20.3% 14.0%
202 442 634 383 1661
7.7% 15.3% 19.2% 14.9% 14.5%
2154 1795 1137 577 5663
81.6% 62.1% 34.4% 22.4% 49.6%
2639 2891 3309 2579 11418
100.0% 100.0% 100.0% 100.0% 100.0%
Page 64
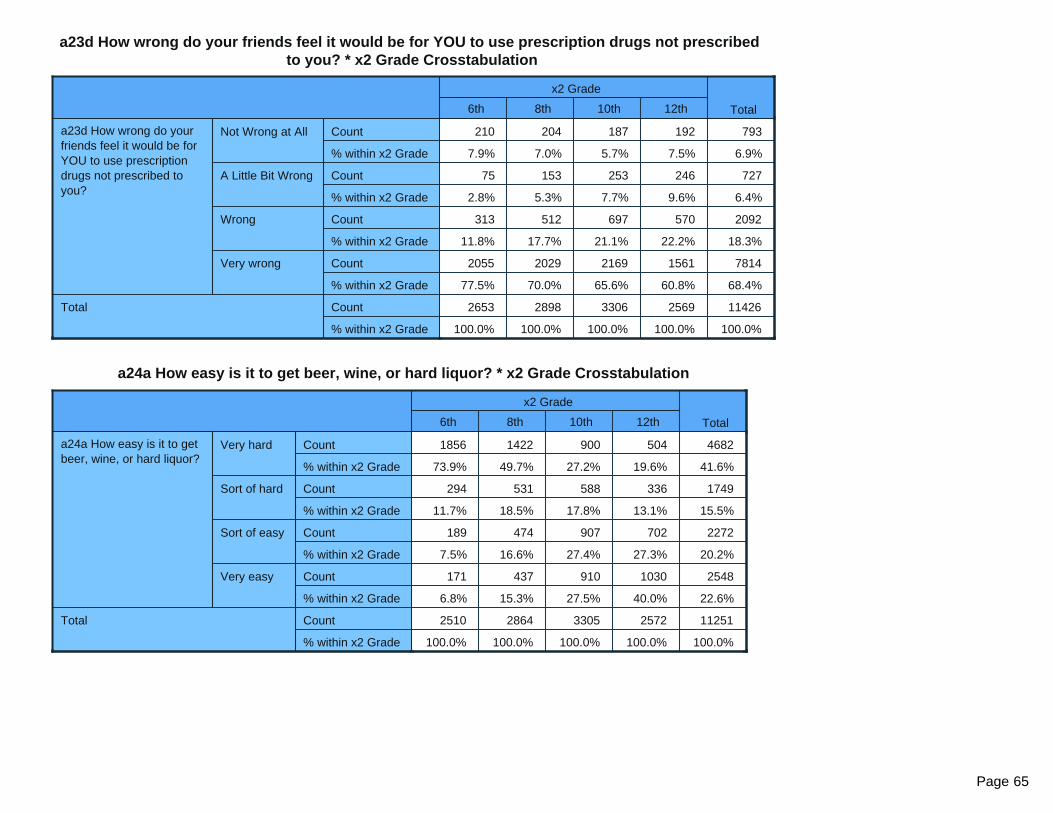
a23d How wrong do your friends feel it would be for YOU to use prescription drugs not prescribed to you? * x2 Grade Crosstabulation
x2 Grade
Total6th 8th 10th 12th
a23d How wrong do your friends feel it would be for YOU to use prescription drugs not prescribed to you?
Not Wrong at All Count
% within x2 Grade
A Little Bit Wrong Count
% within x2 Grade
Wrong Count
% within x2 Grade
Very wrong Count
% within x2 Grade
Total Count
% within x2 Grade
210 204 187 192 793
7.9% 7.0% 5.7% 7.5% 6.9%
75 153 253 246 727
2.8% 5.3% 7.7% 9.6% 6.4%
313 512 697 570 2092
11.8% 17.7% 21.1% 22.2% 18.3%
2055 2029 2169 1561 7814
77.5% 70.0% 65.6% 60.8% 68.4%
2653 2898 3306 2569 11426
100.0% 100.0% 100.0% 100.0% 100.0%
a24a How easy is it to get beer, wine, or hard liquor? * x2 Grade Crosstabulation
x2 Grade
Total6th 8th 10th 12th
a24a How easy is it to get beer, wine, or hard liquor?
Very hard Count
% within x2 Grade
Sort of hard Count
% within x2 Grade
Sort of easy Count
% within x2 Grade
Very easy Count
% within x2 Grade
Total Count
% within x2 Grade
1856 1422 900 504 4682
73.9% 49.7% 27.2% 19.6% 41.6%
294 531 588 336 1749
11.7% 18.5% 17.8% 13.1% 15.5%
189 474 907 702 2272
7.5% 16.6% 27.4% 27.3% 20.2%
171 437 910 1030 2548
6.8% 15.3% 27.5% 40.0% 22.6%
2510 2864 3305 2572 11251
100.0% 100.0% 100.0% 100.0% 100.0%
Page 65
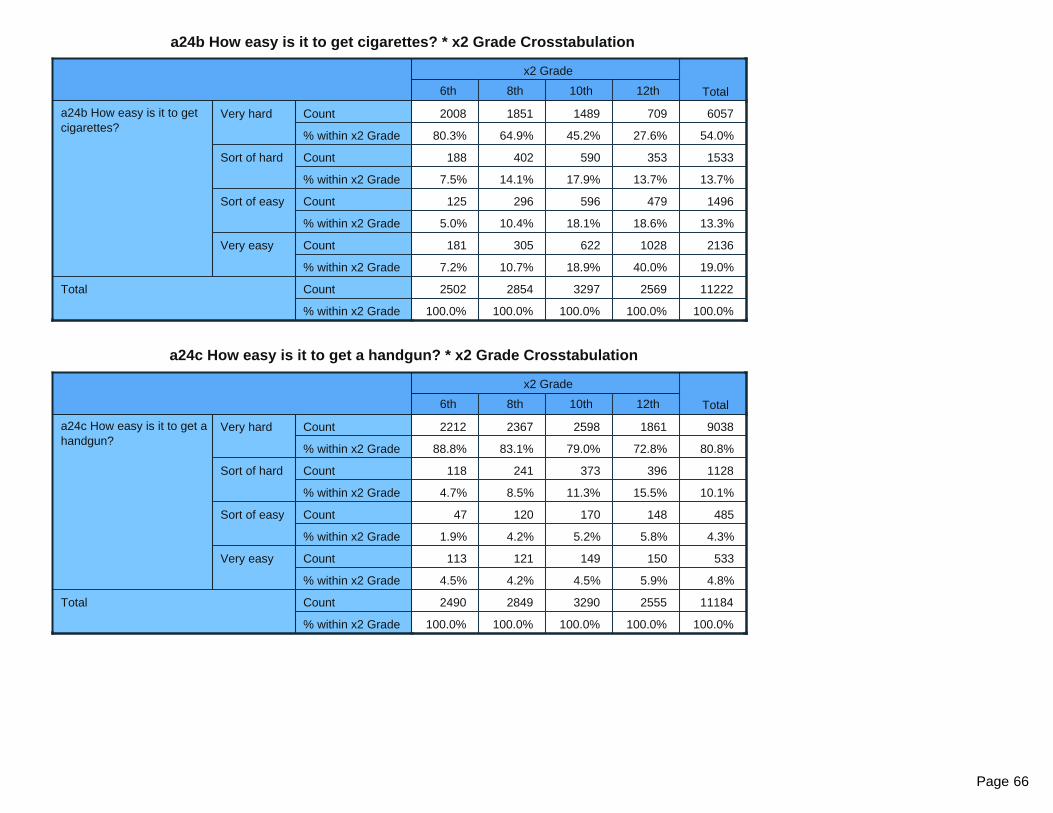
a24b How easy is it to get cigarettes? * x2 Grade Crosstabulation
x2 Grade
Total6th 8th 10th 12th
a24b How easy is it to get cigarettes?
Very hard Count
% within x2 Grade
Sort of hard Count
% within x2 Grade
Sort of easy Count
% within x2 Grade
Very easy Count
% within x2 Grade
Total Count
% within x2 Grade
2008 1851 1489 709 6057
80.3% 64.9% 45.2% 27.6% 54.0%
188 402 590 353 1533
7.5% 14.1% 17.9% 13.7% 13.7%
125 296 596 479 1496
5.0% 10.4% 18.1% 18.6% 13.3%
181 305 622 1028 2136
7.2% 10.7% 18.9% 40.0% 19.0%
2502 2854 3297 2569 11222
100.0% 100.0% 100.0% 100.0% 100.0%
a24c How easy is it to get a handgun? * x2 Grade Crosstabulation
x2 Grade
Total6th 8th 10th 12th
a24c How easy is it to get a handgun?
Very hard Count
% within x2 Grade
Sort of hard Count
% within x2 Grade
Sort of easy Count
% within x2 Grade
Very easy Count
% within x2 Grade
Total Count
% within x2 Grade
2212 2367 2598 1861 9038
88.8% 83.1% 79.0% 72.8% 80.8%
118 241 373 396 1128
4.7% 8.5% 11.3% 15.5% 10.1%
47 120 170 148 485
1.9% 4.2% 5.2% 5.8% 4.3%
113 121 149 150 533
4.5% 4.2% 4.5% 5.9% 4.8%
2490 2849 3290 2555 11184
100.0% 100.0% 100.0% 100.0% 100.0%
Page 66
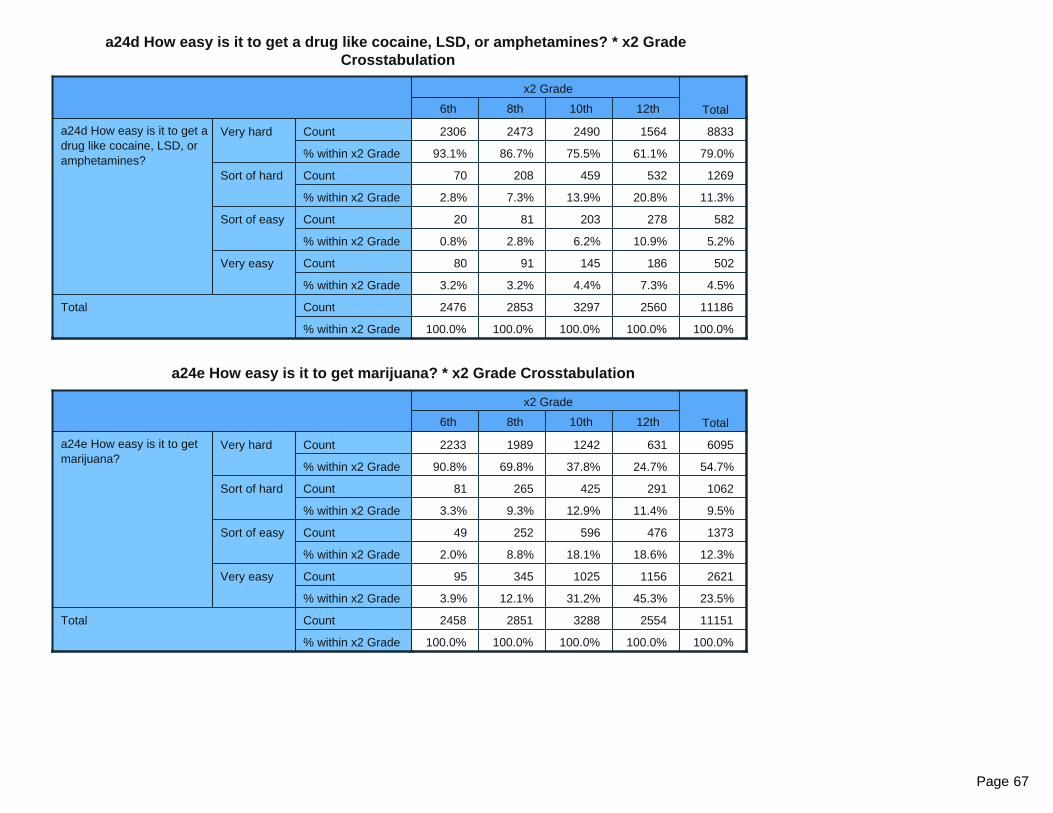
a24d How easy is it to get a drug like cocaine, LSD, or amphetamines? * x2 Grade Crosstabulation
x2 Grade
Total6th 8th 10th 12th
a24d How easy is it to get a drug like cocaine, LSD, or amphetamines?
Very hard Count
% within x2 Grade
Sort of hard Count
% within x2 Grade
Sort of easy Count
% within x2 Grade
Very easy Count
% within x2 Grade
Total Count
% within x2 Grade
2306 2473 2490 1564 8833
93.1% 86.7% 75.5% 61.1% 79.0%
70 208 459 532 1269
2.8% 7.3% 13.9% 20.8% 11.3%
20 81 203 278 582
0.8% 2.8% 6.2% 10.9% 5.2%
80 91 145 186 502
3.2% 3.2% 4.4% 7.3% 4.5%
2476 2853 3297 2560 11186
100.0% 100.0% 100.0% 100.0% 100.0%
a24e How easy is it to get marijuana? * x2 Grade Crosstabulation
x2 Grade
Total6th 8th 10th 12th
a24e How easy is it to get marijuana?
Very hard Count
% within x2 Grade
Sort of hard Count
% within x2 Grade
Sort of easy Count
% within x2 Grade
Very easy Count
% within x2 Grade
Total Count
% within x2 Grade
2233 1989 1242 631 6095
90.8% 69.8% 37.8% 24.7% 54.7%
81 265 425 291 1062
3.3% 9.3% 12.9% 11.4% 9.5%
49 252 596 476 1373
2.0% 8.8% 18.1% 18.6% 12.3%
95 345 1025 1156 2621
3.9% 12.1% 31.2% 45.3% 23.5%
2458 2851 3288 2554 11151
100.0% 100.0% 100.0% 100.0% 100.0%
Page 67

a25 If a kid drank some beer, wine, or hard liquor (for example: vodka, whiskey, gin, or rum) in your neighborhood could he or she be caught by the police? * x2 Grade
Crosstabulation
x2 Grade
Total6th 8th 10th 12th
a25 If a kid drank some beer, wine, or hard liquor (for example: vodka, whiskey, gin, or rum) in your neighborhood could he or she be caught by the police?
NO! Count
% within x2 Grade
no Count
% within x2 Grade
yes Count
% within x2 Grade
YES! Count
% within x2 Grade
Total Count
% within x2 Grade
306 413 488 490 1697
12.0% 14.7% 15.0% 19.3% 15.2%
536 1139 1770 1448 4893
21.0% 40.5% 54.5% 56.9% 43.9%
871 819 711 434 2835
34.1% 29.1% 21.9% 17.1% 25.4%
841 439 280 173 1733
32.9% 15.6% 8.6% 6.8% 15.5%
2554 2810 3249 2545 11158
100.0% 100.0% 100.0% 100.0% 100.0%
a26 If a kid smoked marijuana in your neighborhood would he or she be caught by the police? * x2 Grade Crosstabulation
x2 Grade
Total6th 8th 10th 12th
a26 If a kid smoked marijuana in your neighborhood would he or she be caught by the police?
NO! Count
% within x2 Grade
no Count
% within x2 Grade
yes Count
% within x2 Grade
YES! Count
% within x2 Grade
Total Count
% within x2 Grade
266 421 575 527 1789
10.5% 15.0% 17.7% 20.8% 16.1%
379 957 1631 1409 4376
14.9% 34.1% 50.1% 55.5% 39.3%
882 897 769 422 2970
34.7% 31.9% 23.6% 16.6% 26.7%
1015 533 281 179 2008
39.9% 19.0% 8.6% 7.1% 18.0%
2542 2808 3256 2537 11143
100.0% 100.0% 100.0% 100.0% 100.0%
Page 68

a27a How wrong would most adults in your neighborhood think it is for kids your age to drink alcohol * x2 Grade Crosstabulation
x2 Grade
Total6th 8th 10th 12th
a27a How wrong would most adults in your neighborhood think it is for kids your age to drink alcohol
Not Wrong at All Count
% within x2 Grade
A Little Bit Wrong Count
% within x2 Grade
Wrong Count
% within x2 Grade
Very wrong Count
% within x2 Grade
Total Count
% within x2 Grade
128 123 146 214 611
5.0% 4.3% 4.4% 8.4% 5.4%
125 238 603 674 1640
4.8% 8.4% 18.3% 26.5% 14.6%
361 734 1199 973 3267
14.0% 25.8% 36.4% 38.2% 29.0%
1970 1750 1342 683 5745
76.2% 61.5% 40.8% 26.8% 51.0%
2584 2845 3290 2544 11263
100.0% 100.0% 100.0% 100.0% 100.0%
a27b How wrong would most adults in your neighborhood think it is for kids your age to smoke cigarettes * x2 Grade Crosstabulation
x2 Grade
Total6th 8th 10th 12th
a27b How wrong would most adults in your neighborhood think it is for kids your age to smoke cigarettes
Not Wrong at All Count
% within x2 Grade
A Little Bit Wrong Count
% within x2 Grade
Wrong Count
% within x2 Grade
Very wrong Count
% within x2 Grade
Total Count
% within x2 Grade
134 120 141 196 591
5.2% 4.2% 4.3% 7.7% 5.3%
94 127 307 376 904
3.7% 4.5% 9.4% 14.8% 8.1%
306 622 1004 865 2797
11.9% 21.9% 30.6% 34.1% 24.9%
2027 1969 1827 1096 6919
79.1% 69.4% 55.7% 43.3% 61.7%
2561 2838 3279 2533 11211
100.0% 100.0% 100.0% 100.0% 100.0%
Page 69

a27c How wrong would most adults in your neighborhood think it is for kids your age to use marijuana * x2 Grade Crosstabulation
x2 Grade
Total6th 8th 10th 12th
a27c How wrong would most adults in your neighborhood think it is for kids your age to use marijuana
Not Wrong at All Count
% within x2 Grade
A Little Bit Wrong Count
% within x2 Grade
Wrong Count
% within x2 Grade
Very wrong Count
% within x2 Grade
Total Count
% within x2 Grade
118 148 215 246 727
4.6% 5.2% 6.6% 9.7% 6.5%
70 169 440 470 1149
2.7% 6.0% 13.5% 18.6% 10.3%
211 502 962 842 2517
8.3% 17.8% 29.5% 33.3% 22.5%
2152 2004 1649 970 6775
84.4% 71.0% 50.5% 38.4% 60.7%
2551 2823 3266 2528 11168
100.0% 100.0% 100.0% 100.0% 100.0%
a28a Have you ever belonged to a gang? * x2 Grade Crosstabulation
x2 Grade
Total6th 8th 10th 12th
a28a Have you ever belonged to a gang?
Yes Count
% within x2 Grade
No Count
% within x2 Grade
Total Count
% within x2 Grade
202 207 150 128 687
7.7% 7.2% 4.5% 4.9% 6.0%
2423 2672 3180 2459 10734
92.3% 92.8% 95.5% 95.1% 94.0%
2625 2879 3330 2587 11421
100.0% 100.0% 100.0% 100.0% 100.0%
Page 70

a28b If you have ever belonged to a gang, did that gang have a name? * x2 Grade Crosstabulation
x2 Grade
Total6th 8th 10th 12th
a28b If you have ever belonged to a gang, did that gang have a name?
Yes Count
% within x2 Grade
No Count
% within x2 Grade
I have never belonged to a gang
Count
% within x2 Grade
Total Count
% within x2 Grade
198 175 148 112 633
7.6% 6.1% 4.5% 4.4% 5.6%
219 217 278 303 1017
8.4% 7.6% 8.4% 11.8% 9.0%
2200 2463 2884 2157 9704
84.1% 86.3% 87.1% 83.9% 85.5%
2617 2855 3310 2572 11354
100.0% 100.0% 100.0% 100.0% 100.0%
a29 How old were you when you first belonged to a gang? * x2 Grade Crosstabulation
x2 Grade
Total6th 8th 10th 12th
a29 How old were you when you first belonged to a gang?
Never have Count
% within x2 Grade
10 or younger Count
% within x2 Grade
11 Count
% within x2 Grade
12 Count
% within x2 Grade
13 Count
% within x2 Grade
14 Count
% within x2 Grade
15 Count
% within x2 Grade
16 Count
% within x2 Grade
17 or Older Count
% within x2 Grade
2417 2665 3157 2448 10687
92.1% 92.9% 95.3% 95.1% 93.9%
113 41 35 43 232
4.3% 1.4% 1.1% 1.7% 2.0%
81 38 14 14 147
3.1% 1.3% 0.4% 0.5% 1.3%
11 68 18 10 107
0.4% 2.4% 0.5% 0.4% 0.9%
1 49 24 11 85
0.0% 1.7% 0.7% 0.4% 0.7%
0 9 39 13 61
0.0% 0.3% 1.2% 0.5% 0.5%
0 0 19 15 34
0.0% 0.0% 0.6% 0.6% 0.3%
0 0 8 14 22
0.0% 0.0% 0.2% 0.5% 0.2%
0 0 0 6 6
0.0% 0.0% 0.0% 0.2% 0.1%
Page 71

a29 How old were you when you first belonged to a gang? * x2 Grade Crosstabulation
x2 Grade
Total6th 8th 10th 12th
Total Count
% within x2 Grade
2623 2870 3314 2574 11381
100.0% 100.0% 100.0% 100.0% 100.0%
a30 In the past 12 months, how many of your best friends have been a member of a gang? * x2 Grade Crosstabulation
x2 Grade
Total6th 8th 10th 12th
a30 In the past 12 months, how many of your best friends have been a member of a gang?
None Count
% within x2 Grade
1 Count
% within x2 Grade
2 Count
% within x2 Grade
3 Count
% within x2 Grade
4 Count
% within x2 Grade
Total Count
% within x2 Grade
2249 2556 3058 2426 10289
86.6% 89.0% 92.3% 94.3% 90.6%
116 125 104 55 400
4.5% 4.4% 3.1% 2.1% 3.5%
71 58 43 27 199
2.7% 2.0% 1.3% 1.0% 1.8%
36 40 24 11 111
1.4% 1.4% 0.7% 0.4% 1.0%
124 92 83 54 353
4.8% 3.2% 2.5% 2.1% 3.1%
2596 2871 3312 2573 11352
100.0% 100.0% 100.0% 100.0% 100.0%
Page 72
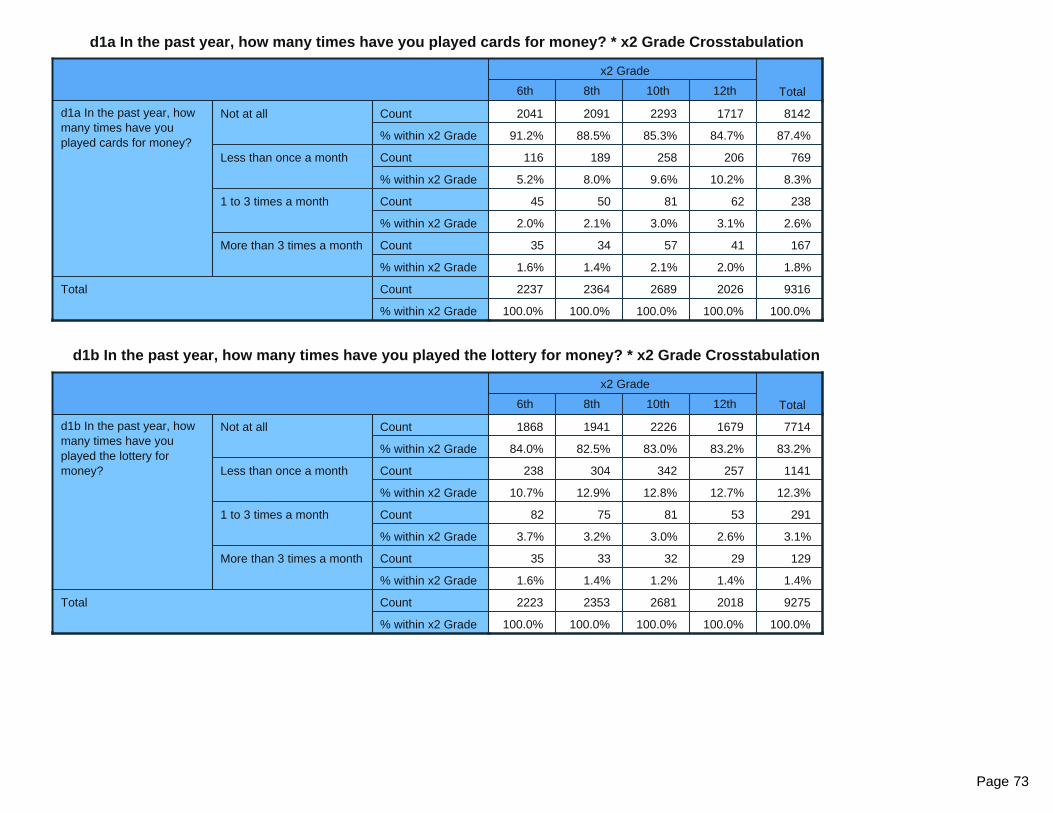
d1a In the past year, how many times have you played cards for money? * x2 Grade Crosstabulation
x2 Grade
Total6th 8th 10th 12th
d1a In the past year, how many times have you played cards for money?
Not at all Count
% within x2 Grade
Less than once a month Count
% within x2 Grade
1 to 3 times a month Count
% within x2 Grade
More than 3 times a month Count
% within x2 Grade
Total Count
% within x2 Grade
2041 2091 2293 1717 8142
91.2% 88.5% 85.3% 84.7% 87.4%
116 189 258 206 769
5.2% 8.0% 9.6% 10.2% 8.3%
45 50 81 62 238
2.0% 2.1% 3.0% 3.1% 2.6%
35 34 57 41 167
1.6% 1.4% 2.1% 2.0% 1.8%
2237 2364 2689 2026 9316
100.0% 100.0% 100.0% 100.0% 100.0%
d1b In the past year, how many times have you played the lottery for money? * x2 Grade Crosstabulation
x2 Grade
Total6th 8th 10th 12th
d1b In the past year, how many times have you played the lottery for money?
Not at all Count
% within x2 Grade
Less than once a month Count
% within x2 Grade
1 to 3 times a month Count
% within x2 Grade
More than 3 times a month Count
% within x2 Grade
Total Count
% within x2 Grade
1868 1941 2226 1679 7714
84.0% 82.5% 83.0% 83.2% 83.2%
238 304 342 257 1141
10.7% 12.9% 12.8% 12.7% 12.3%
82 75 81 53 291
3.7% 3.2% 3.0% 2.6% 3.1%
35 33 32 29 129
1.6% 1.4% 1.2% 1.4% 1.4%
2223 2353 2681 2018 9275
100.0% 100.0% 100.0% 100.0% 100.0%
Page 73
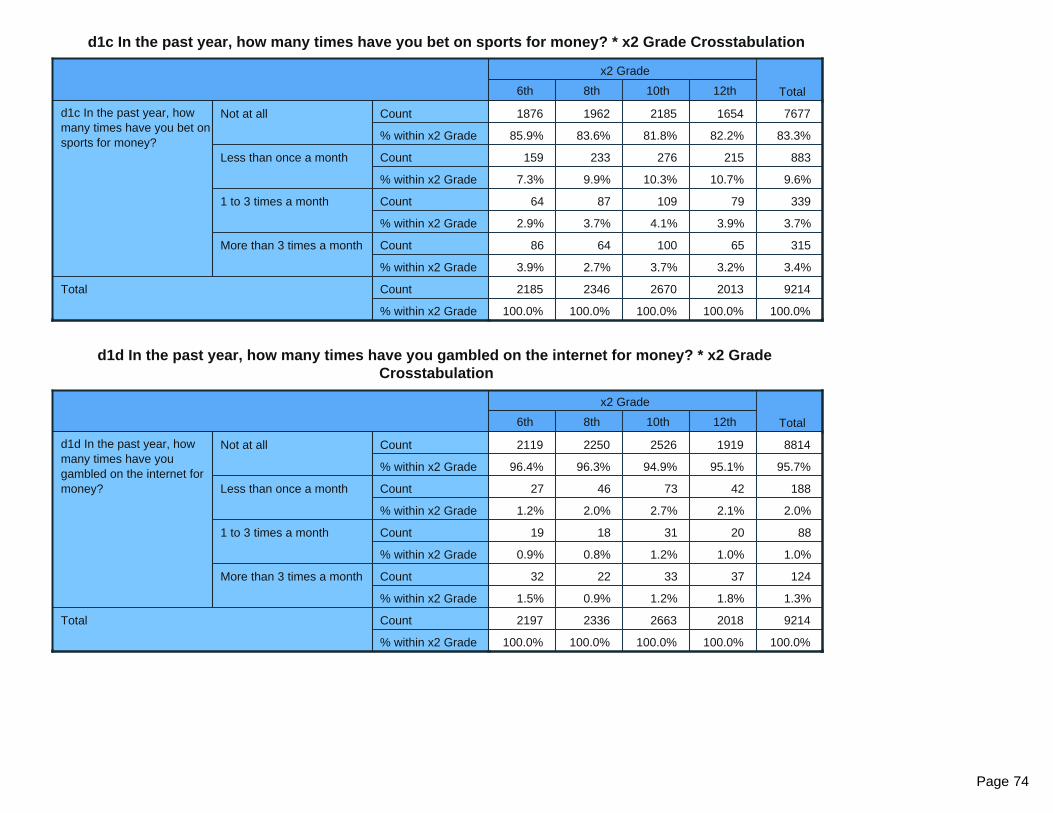
d1c In the past year, how many times have you bet on sports for money? * x2 Grade Crosstabulation
x2 Grade
Total6th 8th 10th 12th
d1c In the past year, how many times have you bet on sports for money?
Not at all Count
% within x2 Grade
Less than once a month Count
% within x2 Grade
1 to 3 times a month Count
% within x2 Grade
More than 3 times a month Count
% within x2 Grade
Total Count
% within x2 Grade
1876 1962 2185 1654 7677
85.9% 83.6% 81.8% 82.2% 83.3%
159 233 276 215 883
7.3% 9.9% 10.3% 10.7% 9.6%
64 87 109 79 339
2.9% 3.7% 4.1% 3.9% 3.7%
86 64 100 65 315
3.9% 2.7% 3.7% 3.2% 3.4%
2185 2346 2670 2013 9214
100.0% 100.0% 100.0% 100.0% 100.0%
d1d In the past year, how many times have you gambled on the internet for money? * x2 Grade Crosstabulation
x2 Grade
Total6th 8th 10th 12th
d1d In the past year, how many times have you gambled on the internet for money?
Not at all Count
% within x2 Grade
Less than once a month Count
% within x2 Grade
1 to 3 times a month Count
% within x2 Grade
More than 3 times a month Count
% within x2 Grade
Total Count
% within x2 Grade
2119 2250 2526 1919 8814
96.4% 96.3% 94.9% 95.1% 95.7%
27 46 73 42 188
1.2% 2.0% 2.7% 2.1% 2.0%
19 18 31 20 88
0.9% 0.8% 1.2% 1.0% 1.0%
32 22 33 37 124
1.5% 0.9% 1.2% 1.8% 1.3%
2197 2336 2663 2018 9214
100.0% 100.0% 100.0% 100.0% 100.0%
Page 74

d1e In the past year, how many times have you bet on games of skill for money? * x2 Grade Crosstabulation
x2 Grade
Total6th 8th 10th 12th
d1e In the past year, how many times have you bet on games of skill for money?
Not at all Count
% within x2 Grade
Less than once a month Count
% within x2 Grade
1 to 3 times a month Count
% within x2 Grade
More than 3 times a month Count
% within x2 Grade
Total Count
% within x2 Grade
1753 1870 2161 1689 7473
80.0% 79.6% 81.2% 83.9% 81.1%
201 257 285 168 911
9.2% 10.9% 10.7% 8.3% 9.9%
93 120 110 90 413
4.2% 5.1% 4.1% 4.5% 4.5%
145 102 104 67 418
6.6% 4.3% 3.9% 3.3% 4.5%
2192 2349 2660 2014 9215
100.0% 100.0% 100.0% 100.0% 100.0%
d1f In the past year, how many times have you bet in some other way for money? * x2 Grade Crosstabulatio
x2 Grade
Total6th 8th 10th 12th
d1f In the past year, how many times have you bet in some other way for money?
Not at all Count
% within x2 Grade
Less than once a month Count
% within x2 Grade
1 to 3 times a month Count
% within x2 Grade
More than 3 times a month Count
% within x2 Grade
Total Count
% within x2 Grade
1990 2016 2279 1720 8005
91.7% 86.6% 85.3% 85.8% 87.2%
108 193 236 179 716
5.0% 8.3% 8.8% 8.9% 7.8%
31 75 90 55 251
1.4% 3.2% 3.4% 2.7% 2.7%
42 44 66 51 203
1.9% 1.9% 2.5% 2.5% 2.2%
2171 2328 2671 2005 9175
100.0% 100.0% 100.0% 100.0% 100.0%
Page 75
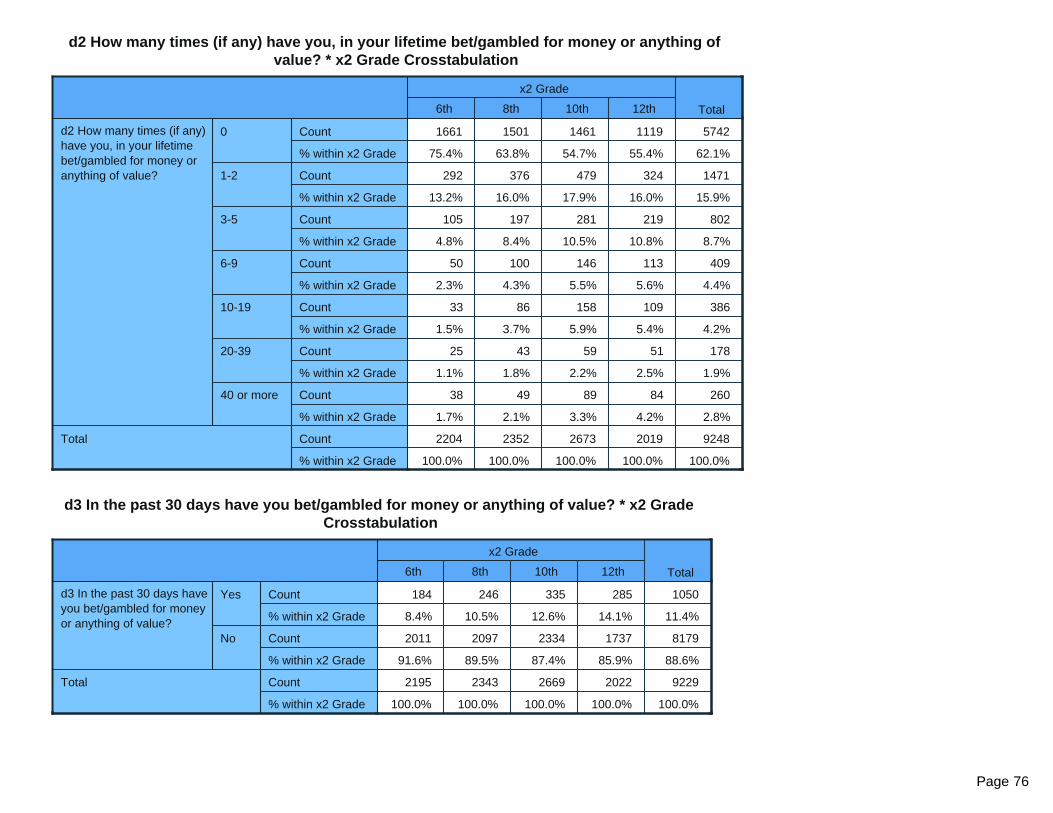
d2 How many times (if any) have you, in your lifetime bet/gambled for money or anything of value? * x2 Grade Crosstabulation
x2 Grade
Total6th 8th 10th 12th
d2 How many times (if any) have you, in your lifetime bet/gambled for money or anything of value?
0 Count
% within x2 Grade
1-2 Count
% within x2 Grade
3-5 Count
% within x2 Grade
6-9 Count
% within x2 Grade
10-19 Count
% within x2 Grade
20-39 Count
% within x2 Grade
40 or more Count
% within x2 Grade
Total Count
% within x2 Grade
1661 1501 1461 1119 5742
75.4% 63.8% 54.7% 55.4% 62.1%
292 376 479 324 1471
13.2% 16.0% 17.9% 16.0% 15.9%
105 197 281 219 802
4.8% 8.4% 10.5% 10.8% 8.7%
50 100 146 113 409
2.3% 4.3% 5.5% 5.6% 4.4%
33 86 158 109 386
1.5% 3.7% 5.9% 5.4% 4.2%
25 43 59 51 178
1.1% 1.8% 2.2% 2.5% 1.9%
38 49 89 84 260
1.7% 2.1% 3.3% 4.2% 2.8%
2204 2352 2673 2019 9248
100.0% 100.0% 100.0% 100.0% 100.0%
d3 In the past 30 days have you bet/gambled for money or anything of value? * x2 Grade Crosstabulation
x2 Grade
Total6th 8th 10th 12th
d3 In the past 30 days have you bet/gambled for money or anything of value?
Yes Count
% within x2 Grade
No Count
% within x2 Grade
Total Count
% within x2 Grade
184 246 335 285 1050
8.4% 10.5% 12.6% 14.1% 11.4%
2011 2097 2334 1737 8179
91.6% 89.5% 87.4% 85.9% 88.6%
2195 2343 2669 2022 9229
100.0% 100.0% 100.0% 100.0% 100.0%
Page 76

d4a Have you ever felt the need to bet more and more money? * x2 Grade Crosstabulation
x2 Grade
Total6th 8th 10th 12th
d4a Have you ever felt the need to bet more and more money?
Yes Count
% within x2 Grade
No Count
% within x2 Grade
Total Count
% within x2 Grade
99 113 136 136 484
4.6% 4.9% 5.1% 6.7% 5.3%
2049 2214 2522 1884 8669
95.4% 95.1% 94.9% 93.3% 94.7%
2148 2327 2658 2020 9153
100.0% 100.0% 100.0% 100.0% 100.0%
d4b Have you ever felt the need to lie to important people (such as your family/friends) about how much you gamble? * x2 Grade Crosstabulation
x2 Grade
Total6th 8th 10th 12th
d4b Have you ever felt the need to lie to important people (such as your family/friends) about how much you gamble?
Yes Count
% within x2 Grade
No Count
% within x2 Grade
Total Count
% within x2 Grade
56 73 66 71 266
2.6% 3.2% 2.5% 3.5% 2.9%
2072 2241 2585 1940 8838
97.4% 96.8% 97.5% 96.5% 97.1%
2128 2314 2651 2011 9104
100.0% 100.0% 100.0% 100.0% 100.0%
d5a If you drank alcohol during the past 12 months, how did you usually get it? Did not drink any alcohol * x2 Grade Crosstabulation
x2 Grade
Total6th 8th 10th 12th
d5a If you drank alcohol during the past 12 months, how did you usually get it? Did not drink any alcohol
Yes Count
% within x2 Grade
No Count
% within x2 Grade
Total Count
% within x2 Grade
1959 1933 1676 878 6446
87.1% 81.4% 61.9% 43.1% 68.8%
291 443 1031 1160 2925
12.9% 18.6% 38.1% 56.9% 31.2%
2250 2376 2707 2038 9371
100.0% 100.0% 100.0% 100.0% 100.0%
Page 77

d5b If you drank alcohol during the past 12 months, how did you usually get it? Bought it in a store * x2 Grade Crosstabulation
x2 Grade
Total6th 8th 10th 12th
d5b If you drank alcohol during the past 12 months, how did you usually get it? Bought it in a store
Yes Count
% within x2 Grade
No Count
% within x2 Grade
Total Count
% within x2 Grade
10 6 48 156 220
0.4% 0.3% 1.8% 7.7% 2.3%
2238 2369 2658 1882 9147
99.6% 99.7% 98.2% 92.3% 97.7%
2248 2375 2706 2038 9367
100.0% 100.0% 100.0% 100.0% 100.0%
d5c If you drank alcohol during the past 12 months, how did you usually get it? Bought it at a restaurant, bar or club * x2 Grade Crosstabulation
x2 Grade
Total6th 8th 10th 12th
d5c If you drank alcohol during the past 12 months, how did you usually get it? Bought it at a restaurant, bar or club
Yes Count
% within x2 Grade
No Count
% within x2 Grade
Total Count
% within x2 Grade
4 7 21 37 69
0.2% 0.3% 0.8% 1.8% 0.7%
2244 2368 2685 2001 9298
99.8% 99.7% 99.2% 98.2% 99.3%
2248 2375 2706 2038 9367
100.0% 100.0% 100.0% 100.0% 100.0%
d5d If you drank alcohol during the past 12 months, how did you usually get it? Bought it at a public event such as a concert or sporting event * x2 Grade Crosstabulation
x2 Grade
Total6th 8th 10th 12th
d5d If you drank alcohol during the past 12 months, how did you usually get it? Bought it at a public event such as a concert or sporting event
Yes Count
% within x2 Grade
No Count
% within x2 Grade
Total Count
% within x2 Grade
13 15 29 88 145
0.6% 0.6% 1.1% 4.3% 1.5%
2235 2360 2677 1950 9222
99.4% 99.4% 98.9% 95.7% 98.5%
2248 2375 2706 2038 9367
100.0% 100.0% 100.0% 100.0% 100.0%
Page 78

d5e If you drank alcohol during the past 12 months, how did you usually get it? Gave someone money to buy it for me * x2 Grade Crosstabulation
x2 Grade
Total6th 8th 10th 12th
d5e If you drank alcohol during the past 12 months, how did you usually get it? Gave someone money to buy it for me
Yes Count
% within x2 Grade
No Count
% within x2 Grade
Total Count
% within x2 Grade
16 52 362 498 928
0.7% 2.2% 13.4% 24.4% 9.9%
2232 2323 2344 1540 8439
99.3% 97.8% 86.6% 75.6% 90.1%
2248 2375 2706 2038 9367
100.0% 100.0% 100.0% 100.0% 100.0%
d5f If you drank alcohol during the past 12 months, how did you usually get it? Parents provided it to me * x2 Grade Crosstabulation
x2 Grade
Total6th 8th 10th 12th
d5f If you drank alcohol during the past 12 months, how did you usually get it? Parents provided it to me
Yes Count
% within x2 Grade
No Count
% within x2 Grade
Total Count
% within x2 Grade
37 74 118 190 419
1.6% 3.1% 4.4% 9.3% 4.5%
2210 2300 2588 1847 8945
98.4% 96.9% 95.6% 90.7% 95.5%
2247 2374 2706 2037 9364
100.0% 100.0% 100.0% 100.0% 100.0%
d5g If you drank alcohol during the past 12 months, how did you usually get it? Friends' parents provided it to me * x2 Grade Crosstabulation
x2 Grade
Total6th 8th 10th 12th
d5g If you drank alcohol during the past 12 months, how did you usually get it? Friends' parents provided it to me
Yes Count
% within x2 Grade
No Count
% within x2 Grade
Total Count
% within x2 Grade
12 41 113 194 360
0.5% 1.7% 4.2% 9.5% 3.8%
2235 2333 2593 1843 9004
99.5% 98.3% 95.8% 90.5% 96.2%
2247 2374 2706 2037 9364
100.0% 100.0% 100.0% 100.0% 100.0%
Page 79

d5h If you drank alcohol during the past 12 months, how did you usually get it? Friends, brothers, or sisters over 21 provided it to me * x2 Grade Crosstabulation
x2 Grade
Total6th 8th 10th 12th
d5h If you drank alcohol during the past 12 months, how did you usually get it? Friends, brothers, or sisters over 21 provided it to me
Yes Count
% within x2 Grade
No Count
% within x2 Grade
Total Count
% within x2 Grade
18 48 213 385 664
0.8% 2.0% 7.9% 18.9% 7.1%
2229 2326 2493 1652 8700
99.2% 98.0% 92.1% 81.1% 92.9%
2247 2374 2706 2037 9364
100.0% 100.0% 100.0% 100.0% 100.0%
d5i If you drank alcohol during the past 12 months, how did you usually get it? Friends, brothers, or sisters under 21 provided it to me * x2 Grade Crosstabulation
x2 Grade
Total6th 8th 10th 12th
d5i If you drank alcohol during the past 12 months, how did you usually get it? Friends, brothers, or sisters under 21 provided it to me
Yes Count
% within x2 Grade
No Count
% within x2 Grade
Total Count
% within x2 Grade
13 43 186 278 520
0.6% 1.8% 6.9% 13.6% 5.6%
2234 2331 2520 1759 8844
99.4% 98.2% 93.1% 86.4% 94.4%
2247 2374 2706 2037 9364
100.0% 100.0% 100.0% 100.0% 100.0%
d5j If you drank alcohol during the past 12 months, how did you usually get it? Other relatives provided it to me * x2 Grade Crosstabulation
x2 Grade
Total6th 8th 10th 12th
d5j If you drank alcohol during the past 12 months, how did you usually get it? Other relatives provided it to me
Yes Count
% within x2 Grade
No Count
% within x2 Grade
Total Count
% within x2 Grade
24 51 112 129 316
1.1% 2.1% 4.1% 6.3% 3.4%
2225 2324 2594 1909 9052
98.9% 97.9% 95.9% 93.7% 96.6%
2249 2375 2706 2038 9368
100.0% 100.0% 100.0% 100.0% 100.0%
Page 80
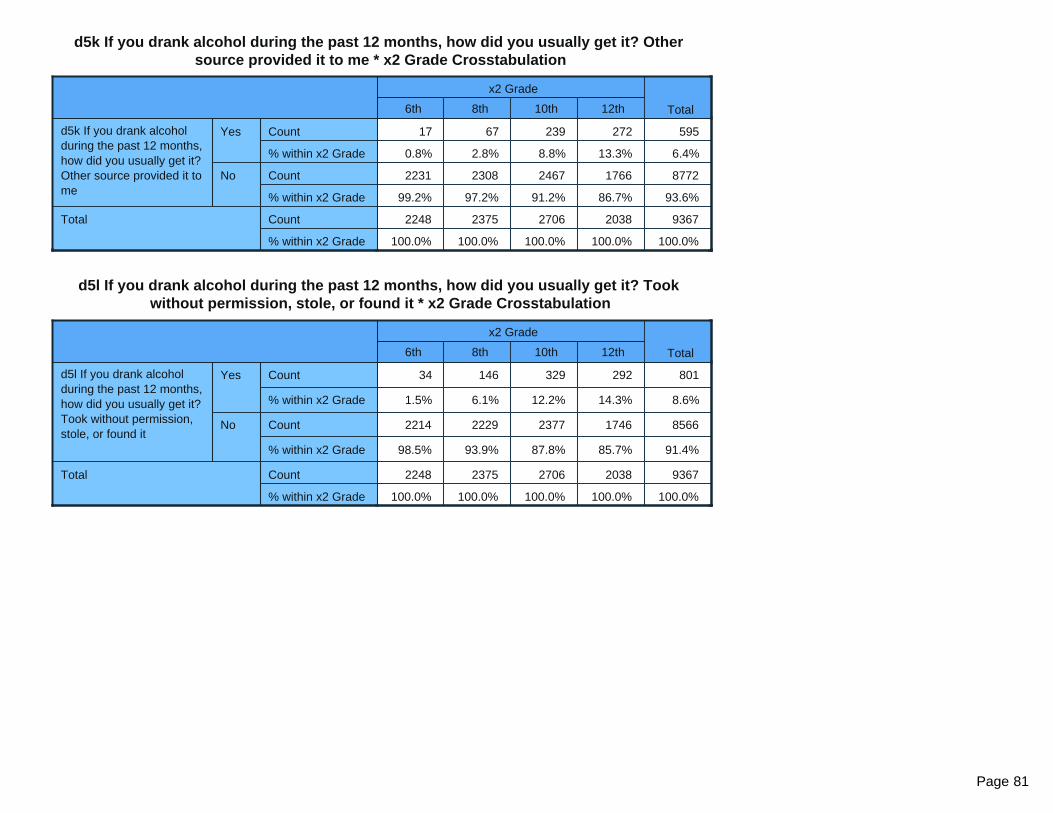
d5k If you drank alcohol during the past 12 months, how did you usually get it? Other source provided it to me * x2 Grade Crosstabulation
x2 Grade
Total6th 8th 10th 12th
d5k If you drank alcohol during the past 12 months, how did you usually get it? Other source provided it to me
Yes Count
% within x2 Grade
No Count
% within x2 Grade
Total Count
% within x2 Grade
17 67 239 272 595
0.8% 2.8% 8.8% 13.3% 6.4%
2231 2308 2467 1766 8772
99.2% 97.2% 91.2% 86.7% 93.6%
2248 2375 2706 2038 9367
100.0% 100.0% 100.0% 100.0% 100.0%
d5l If you drank alcohol during the past 12 months, how did you usually get it? Took without permission, stole, or found it * x2 Grade Crosstabulation
x2 Grade
Total6th 8th 10th 12th
d5l If you drank alcohol during the past 12 months, how did you usually get it? Took without permission, stole, or found it
Yes Count
% within x2 Grade
No Count
% within x2 Grade
Total Count
% within x2 Grade
34 146 329 292 801
1.5% 6.1% 12.2% 14.3% 8.6%
2214 2229 2377 1746 8566
98.5% 93.9% 87.8% 85.7% 91.4%
2248 2375 2706 2038 9367
100.0% 100.0% 100.0% 100.0% 100.0%
Page 81
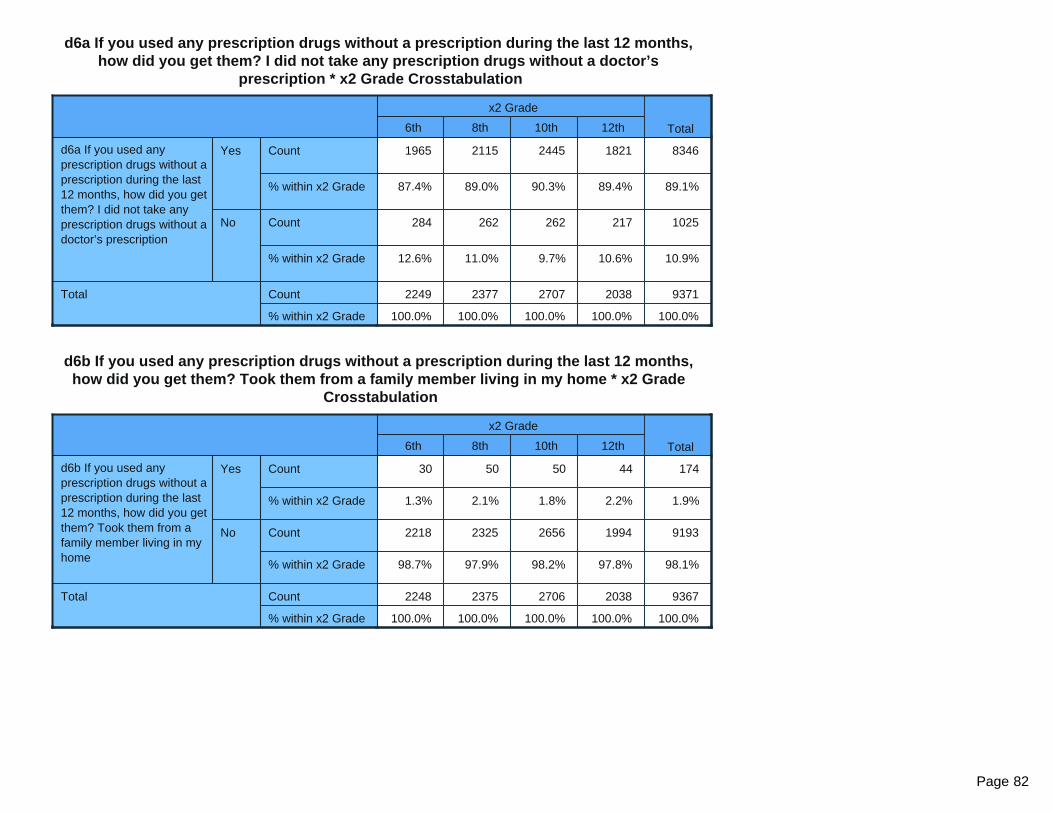
d6a If you used any prescription drugs without a prescription during the last 12 months, how did you get them? I did not take any prescription drugs without a doctor’s
prescription * x2 Grade Crosstabulation
x2 Grade
Total6th 8th 10th 12th
d6a If you used any prescription drugs without a prescription during the last 12 months, how did you get them? I did not take any prescription drugs without a doctor’s prescription
Yes Count
% within x2 Grade
No Count
% within x2 Grade
Total Count
% within x2 Grade
1965 2115 2445 1821 8346
87.4% 89.0% 90.3% 89.4% 89.1%
284 262 262 217 1025
12.6% 11.0% 9.7% 10.6% 10.9%
2249 2377 2707 2038 9371
100.0% 100.0% 100.0% 100.0% 100.0%
d6b If you used any prescription drugs without a prescription during the last 12 months, how did you get them? Took them from a family member living in my home * x2 Grade
Crosstabulation
x2 Grade
Total6th 8th 10th 12th
d6b If you used any prescription drugs without a prescription during the last 12 months, how did you get them? Took them from a family member living in my home
Yes Count
% within x2 Grade
No Count
% within x2 Grade
Total Count
% within x2 Grade
30 50 50 44 174
1.3% 2.1% 1.8% 2.2% 1.9%
2218 2325 2656 1994 9193
98.7% 97.9% 98.2% 97.8% 98.1%
2248 2375 2706 2038 9367
100.0% 100.0% 100.0% 100.0% 100.0%
Page 82

d6c If you used any prescription drugs without a prescription during the last 12 months, how did you get them? Took them from other relatives not living in my home * x2 Grade
Crosstabulation
x2 Grade
Total6th 8th 10th 12th
d6c If you used any prescription drugs without a prescription during the last 12 months, how did you get them? Took them from other relatives not living in my home
Yes Count
% within x2 Grade
No Count
% within x2 Grade
Total Count
% within x2 Grade
6 11 10 6 33
0.3% 0.5% 0.4% 0.3% 0.4%
2242 2364 2696 2032 9334
99.7% 99.5% 99.6% 99.7% 99.6%
2248 2375 2706 2038 9367
100.0% 100.0% 100.0% 100.0% 100.0%
d6d If you used any prescription drugs without a prescription during the last 12 months, how did you get them? Took them from someone not related to me * x2 Grade
Crosstabulation
x2 Grade
Total6th 8th 10th 12th
d6d If you used any prescription drugs without a prescription during the last 12 months, how did you get them? Took them from someone not related to me
Yes Count
% within x2 Grade
No Count
% within x2 Grade
Total Count
% within x2 Grade
6 5 11 13 35
0.3% 0.2% 0.4% 0.6% 0.4%
2242 2370 2695 2025 9332
99.7% 99.8% 99.6% 99.4% 99.6%
2248 2375 2706 2038 9367
100.0% 100.0% 100.0% 100.0% 100.0%
Page 83

d6e If you used any prescription drugs without a prescription during the last 12 months, how did you get them? A friend or family member gave them to me * x2 Grade
Crosstabulation
x2 Grade
Total6th 8th 10th 12th
d6e If you used any prescription drugs without a prescription during the last 12 months, how did you get them? A friend or family member gave them to me
Yes Count
% within x2 Grade
No Count
% within x2 Grade
Total Count
% within x2 Grade
17 34 47 53 151
0.8% 1.4% 1.7% 2.6% 1.6%
2231 2341 2659 1985 9216
99.2% 98.6% 98.3% 97.4% 98.4%
2248 2375 2706 2038 9367
100.0% 100.0% 100.0% 100.0% 100.0%
d6f If you used any prescription drugs without a prescription during the last 12 months, how did you get them? Bought them from someone * x2 Grade Crosstabulation
x2 Grade
Total6th 8th 10th 12th
d6f If you used any prescription drugs without a prescription during the last 12 months, how did you get them? Bought them from someone
Yes Count
% within x2 Grade
No Count
% within x2 Grade
Total Count
% within x2 Grade
6 17 33 46 102
0.3% 0.7% 1.2% 2.3% 1.1%
2242 2358 2673 1992 9265
99.7% 99.3% 98.8% 97.7% 98.9%
2248 2375 2706 2038 9367
100.0% 100.0% 100.0% 100.0% 100.0%
Page 84
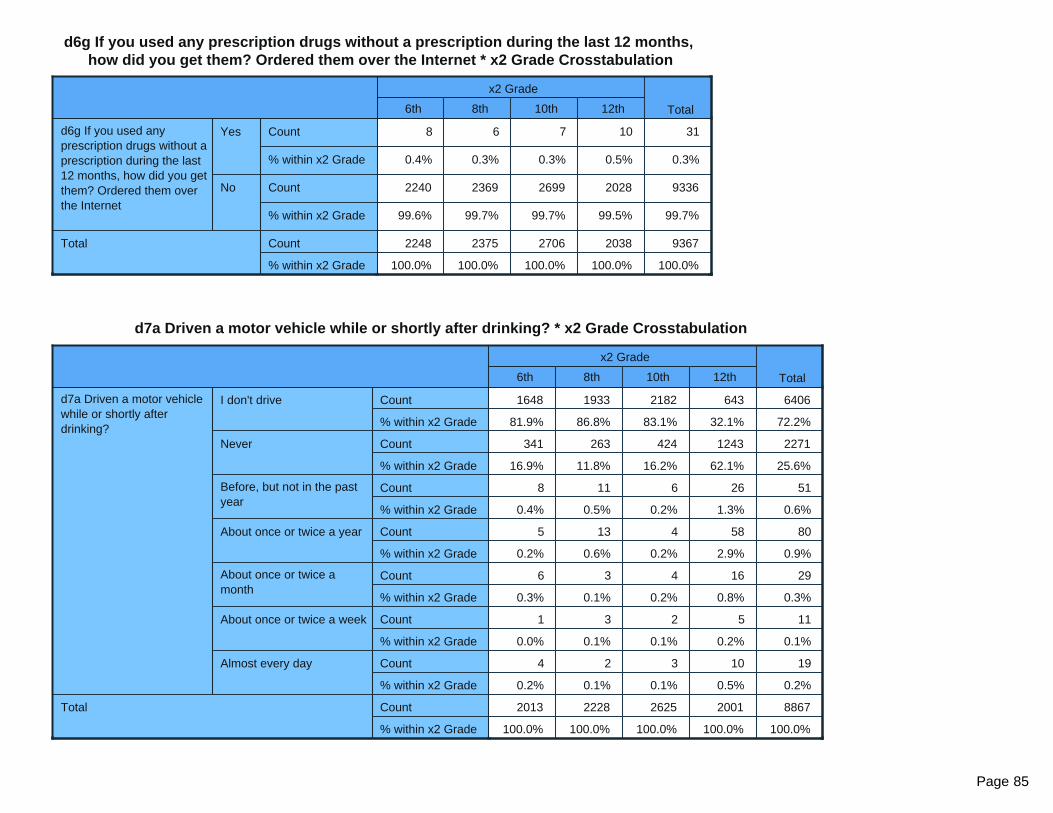
d6g If you used any prescription drugs without a prescription during the last 12 months, how did you get them? Ordered them over the Internet * x2 Grade Crosstabulation
x2 Grade
Total6th 8th 10th 12th
d6g If you used any prescription drugs without a prescription during the last 12 months, how did you get them? Ordered them over the Internet
Yes Count
% within x2 Grade
No Count
% within x2 Grade
Total Count
% within x2 Grade
8 6 7 10 31
0.4% 0.3% 0.3% 0.5% 0.3%
2240 2369 2699 2028 9336
99.6% 99.7% 99.7% 99.5% 99.7%
2248 2375 2706 2038 9367
100.0% 100.0% 100.0% 100.0% 100.0%
d7a Driven a motor vehicle while or shortly after drinking? * x2 Grade Crosstabulation
x2 Grade
Total6th 8th 10th 12th
d7a Driven a motor vehicle while or shortly after drinking?
I don't drive Count
% within x2 Grade
Never Count
% within x2 Grade
Before, but not in the past year
Count
% within x2 Grade
About once or twice a year Count
% within x2 Grade
About once or twice a month
Count
% within x2 Grade
About once or twice a week Count
% within x2 Grade
Almost every day Count
% within x2 Grade
Total Count
% within x2 Grade
1648 1933 2182 643 6406
81.9% 86.8% 83.1% 32.1% 72.2%
341 263 424 1243 2271
16.9% 11.8% 16.2% 62.1% 25.6%
8 11 6 26 51
0.4% 0.5% 0.2% 1.3% 0.6%
5 13 4 58 80
0.2% 0.6% 0.2% 2.9% 0.9%
6 3 4 16 29
0.3% 0.1% 0.2% 0.8% 0.3%
1 3 2 5 11
0.0% 0.1% 0.1% 0.2% 0.1%
4 2 3 10 19
0.2% 0.1% 0.1% 0.5% 0.2%
2013 2228 2625 2001 8867
100.0% 100.0% 100.0% 100.0% 100.0%
Page 85

d7b Driven a motor vehicle while or shortly after using marijuana (pot, hash, cannabis, weed)? * x2 Grade Crosstabulation
x2 Grade
Total6th 8th 10th 12th
d7b Driven a motor vehicle while or shortly after using marijuana (pot, hash, cannabis, weed)?
I don't drive Count
% within x2 Grade
Never Count
% within x2 Grade
Before, but not in the past year
Count
% within x2 Grade
About once or twice a year Count
% within x2 Grade
About once or twice a month
Count
% within x2 Grade
About once or twice a week Count
% within x2 Grade
Almost every day Count
% within x2 Grade
Total Count
% within x2 Grade
1630 1926 2170 642 6368
81.3% 86.8% 82.7% 32.2% 72.0%
359 271 417 1088 2135
17.9% 12.2% 15.9% 54.5% 24.1%
5 7 9 49 70
0.2% 0.3% 0.3% 2.5% 0.8%
4 10 9 91 114
0.2% 0.5% 0.3% 4.6% 1.3%
3 3 8 46 60
0.1% 0.1% 0.3% 2.3% 0.7%
0 1 5 37 43
0.0% 0.0% 0.2% 1.9% 0.5%
4 2 7 43 56
0.2% 0.1% 0.3% 2.2% 0.6%
2005 2220 2625 1996 8846
100.0% 100.0% 100.0% 100.0% 100.0%
Page 86

b1 My parents ask me what I think before most family decisions affecting me are made. * x2 Grade Crosstabulation
x2 Grade
Total6th 8th 10th 12th
b1 My parents ask me what I think before most family decisions affecting me are made.
NO! Count
% within x2 Grade
no Count
% within x2 Grade
yes Count
% within x2 Grade
YES! Count
% within x2 Grade
Total Count
% within x2 Grade
434 390 370 333 1527
15.6% 13.0% 11.0% 12.7% 13.0%
567 676 810 625 2678
20.4% 22.5% 24.0% 23.8% 22.7%
1051 1277 1605 1193 5126
37.8% 42.5% 47.6% 45.4% 43.5%
725 660 589 478 2452
26.1% 22.0% 17.5% 18.2% 20.8%
2777 3003 3374 2629 11783
100.0% 100.0% 100.0% 100.0% 100.0%
b2 If I had a personal problem, I could ask my mom or dad for help. * x2 Grade Crosstabulation
x2 Grade
Total6th 8th 10th 12th
b2 If I had a personal problem, I could ask my mom or dad for help.
NO! Count
% within x2 Grade
no Count
% within x2 Grade
yes Count
% within x2 Grade
YES! Count
% within x2 Grade
Total Count
% within x2 Grade
198 245 266 248 957
6.6% 8.0% 7.8% 9.4% 7.9%
158 354 487 367 1366
5.2% 11.5% 14.2% 13.9% 11.2%
918 1207 1543 1115 4783
30.4% 39.2% 45.0% 42.1% 39.3%
1747 1271 1136 916 5070
57.8% 41.3% 33.1% 34.6% 41.6%
3021 3077 3432 2646 12176
100.0% 100.0% 100.0% 100.0% 100.0%
Page 87

b3 My parents give me lots of chances to do fun things with them. * x2 Grade Crosstabulation
x2 Grade
Total6th 8th 10th 12th
b3 My parents give me lots of chances to do fun things with them.
NO! Count
% within x2 Grade
no Count
% within x2 Grade
yes Count
% within x2 Grade
YES! Count
% within x2 Grade
Total Count
% within x2 Grade
175 171 201 215 762
5.8% 5.6% 5.9% 8.1% 6.3%
273 438 609 555 1875
9.1% 14.3% 17.8% 21.0% 15.5%
1038 1269 1586 1127 5020
34.5% 41.3% 46.5% 42.7% 41.4%
1519 1193 1017 744 4473
50.5% 38.8% 29.8% 28.2% 36.9%
3005 3071 3413 2641 12130
100.0% 100.0% 100.0% 100.0% 100.0%
b4 My parents notice when I am doing a good job and let me know about it. * x2 Grade Crosstabulation
x2 Grade
Total6th 8th 10th 12th
b4 My parents notice when I am doing a good job and let me know about it.
Never or Almost Never Count
% within x2 Grade
Sometimes Count
% within x2 Grade
Often Count
% within x2 Grade
All the time Count
% within x2 Grade
Total Count
% within x2 Grade
192 275 331 309 1107
6.4% 8.9% 9.7% 11.7% 9.1%
623 815 994 819 3251
20.7% 26.4% 29.0% 31.0% 26.7%
849 911 1116 792 3668
28.2% 29.5% 32.6% 30.0% 30.2%
1347 1086 982 722 4137
44.7% 35.2% 28.7% 27.3% 34.0%
3011 3087 3423 2642 12163
100.0% 100.0% 100.0% 100.0% 100.0%
Page 88

b5 How often do your parents tell you they’re proud of you for something you’ve done? * x2 Grade Crosstabulation
x2 Grade
Total6th 8th 10th 12th
b5 How often do your parents tell you they’re proud of you for something you’ve done?
Never or Almost Never Count
% within x2 Grade
Sometimes Count
% within x2 Grade
Often Count
% within x2 Grade
All the time Count
% within x2 Grade
Total Count
% within x2 Grade
178 272 370 334 1154
6.0% 8.9% 10.8% 12.7% 9.5%
556 778 948 775 3057
18.6% 25.3% 27.7% 29.4% 25.2%
841 944 1090 814 3689
28.2% 30.7% 31.9% 30.9% 30.5%
1408 1078 1010 713 4209
47.2% 35.1% 29.5% 27.0% 34.8%
2983 3072 3418 2636 12109
100.0% 100.0% 100.0% 100.0% 100.0%
b6a Do you feel very close to your: Mother? * x2 Grade Crosstabulation
x2 Grade
Total6th 8th 10th 12th
b6a Do you feel very close to your: Mother?
NO! Count
% within x2 Grade
no Count
% within x2 Grade
yes Count
% within x2 Grade
YES! Count
% within x2 Grade
Total Count
% within x2 Grade
88 122 176 182 568
2.9% 4.0% 5.1% 6.9% 4.7%
125 196 325 294 940
4.1% 6.4% 9.5% 11.1% 7.8%
483 783 1077 857 3200
16.0% 25.6% 31.5% 32.5% 26.4%
2320 1956 1840 1305 7421
76.9% 64.0% 53.8% 49.5% 61.2%
3016 3057 3418 2638 12129
100.0% 100.0% 100.0% 100.0% 100.0%
Page 89

b6b Do you feel very close to your: Father? * x2 Grade Crosstabulation
x2 Grade
Total6th 8th 10th 12th
b6b Do you feel very close to your: Father?
NO! Count
% within x2 Grade
no Count
% within x2 Grade
yes Count
% within x2 Grade
YES! Count
% within x2 Grade
Total Count
% within x2 Grade
266 368 410 367 1411
9.2% 12.3% 12.2% 14.2% 11.9%
269 381 545 481 1676
9.3% 12.7% 16.2% 18.6% 14.2%
646 866 1159 863 3534
22.4% 28.8% 34.5% 33.3% 29.8%
1706 1389 1243 881 5219
59.1% 46.2% 37.0% 34.0% 44.1%
2887 3004 3357 2592 11840
100.0% 100.0% 100.0% 100.0% 100.0%
b7a Do you share your thoughts and feelings with your: Mother? * x2 Grade Crosstabulation
x2 Grade
Total6th 8th 10th 12th
b7a Do you share your thoughts and feelings with your: Mother?
NO! Count
% within x2 Grade
no Count
% within x2 Grade
yes Count
% within x2 Grade
YES! Count
% within x2 Grade
Total Count
% within x2 Grade
211 296 381 328 1216
7.1% 9.7% 11.2% 12.5% 10.1%
375 619 799 610 2403
12.7% 20.3% 23.5% 23.2% 20.0%
843 1004 1227 898 3972
28.5% 32.9% 36.1% 34.2% 33.0%
1534 1129 991 788 4442
51.8% 37.0% 29.2% 30.0% 36.9%
2963 3048 3398 2624 12033
100.0% 100.0% 100.0% 100.0% 100.0%
Page 90

b7b Do you share your thoughts and feelings with your: Father? * x2 Grade Crosstabulation
x2 Grade
Total6th 8th 10th 12th
b7b Do you share your thoughts and feelings with your: Father?
NO! Count
% within x2 Grade
no Count
% within x2 Grade
yes Count
% within x2 Grade
YES! Count
% within x2 Grade
Total Count
% within x2 Grade
454 604 696 562 2316
16.0% 20.3% 20.9% 21.8% 19.8%
613 821 1035 833 3302
21.7% 27.6% 31.1% 32.3% 28.2%
870 876 1057 779 3582
30.7% 29.5% 31.7% 30.2% 30.6%
893 673 543 407 2516
31.6% 22.6% 16.3% 15.8% 21.5%
2830 2974 3331 2581 11716
100.0% 100.0% 100.0% 100.0% 100.0%
b8a Do you enjoy spending time with your mother? * x2 Grade Crosstabulation
x2 Grade
Total6th 8th 10th 12th
b8a Do you enjoy spending time with your mother?
NO! Count
% within x2 Grade
no Count
% within x2 Grade
yes Count
% within x2 Grade
YES! Count
% within x2 Grade
Total Count
% within x2 Grade
73 97 147 141 458
2.5% 3.2% 4.3% 5.4% 3.8%
61 147 218 213 639
2.1% 4.9% 6.4% 8.2% 5.3%
571 957 1379 1076 3983
19.3% 31.6% 40.5% 41.2% 33.2%
2255 1827 1659 1183 6924
76.2% 60.3% 48.8% 45.3% 57.7%
2960 3028 3403 2613 12004
100.0% 100.0% 100.0% 100.0% 100.0%
Page 91

b8b Do you enjoy spending time with your father? * x2 Grade Crosstabulation
x2 Grade
Total6th 8th 10th 12th
b8b Do you enjoy spending time with your father?
NO! Count
% within x2 Grade
no Count
% within x2 Grade
yes Count
% within x2 Grade
YES! Count
% within x2 Grade
Total Count
% within x2 Grade
190 290 310 285 1075
6.6% 9.7% 9.3% 11.1% 9.1%
122 215 294 274 905
4.3% 7.2% 8.8% 10.6% 7.7%
608 951 1340 1051 3950
21.2% 31.8% 40.1% 40.8% 33.6%
1948 1531 1399 963 5841
67.9% 51.3% 41.8% 37.4% 49.6%
2868 2987 3343 2573 11771
100.0% 100.0% 100.0% 100.0% 100.0%
b9 When I am not at home, one of my parents knows where I am and who I am with. * x2 Grade Crosstabulation
x2 Grade
Total6th 8th 10th 12th
b9 When I am not at home, one of my parents knows where I am and who I am with.
NO! Count
% within x2 Grade
no Count
% within x2 Grade
yes Count
% within x2 Grade
YES! Count
% within x2 Grade
Total Count
% within x2 Grade
84 81 74 96 335
2.8% 2.6% 2.2% 3.6% 2.8%
126 195 257 291 869
4.3% 6.4% 7.5% 11.0% 7.2%
744 1107 1645 1300 4796
25.1% 36.1% 48.2% 49.4% 39.7%
2008 1687 1439 947 6081
67.8% 55.0% 42.1% 36.0% 50.3%
2962 3070 3415 2634 12081
100.0% 100.0% 100.0% 100.0% 100.0%
Page 92

b10 If you skipped school, would you be caught by your parents? * x2 Grade Crosstabulation
x2 Grade
Total6th 8th 10th 12th
b10 If you skipped school, would you be caught by your parents?
NO! Count
% within x2 Grade
no Count
% within x2 Grade
yes Count
% within x2 Grade
YES! Count
% within x2 Grade
Total Count
% within x2 Grade
160 156 132 172 620
5.5% 5.1% 3.9% 6.6% 5.2%
141 282 464 468 1355
4.9% 9.3% 13.7% 17.8% 11.4%
566 832 1251 1031 3680
19.6% 27.4% 36.9% 39.3% 30.8%
2018 1763 1541 952 6274
69.9% 58.1% 45.5% 36.3% 52.6%
2885 3033 3388 2623 11929
100.0% 100.0% 100.0% 100.0% 100.0%
b11 My parents ask if I’ve gotten my homework done. * x2 Grade Crosstabulation
x2 Grade
Total6th 8th 10th 12th
b11 My parents ask if I’ve gotten my homework done.
NO! Count
% within x2 Grade
no Count
% within x2 Grade
yes Count
% within x2 Grade
YES! Count
% within x2 Grade
Total Count
% within x2 Grade
66 113 183 274 636
2.3% 3.7% 5.4% 10.4% 5.3%
95 264 539 623 1521
3.2% 8.7% 15.8% 23.7% 12.7%
710 1028 1415 1053 4206
24.2% 33.7% 41.5% 40.1% 35.0%
2059 1642 1271 678 5650
70.3% 53.9% 37.3% 25.8% 47.0%
2930 3047 3408 2628 12013
100.0% 100.0% 100.0% 100.0% 100.0%
Page 93
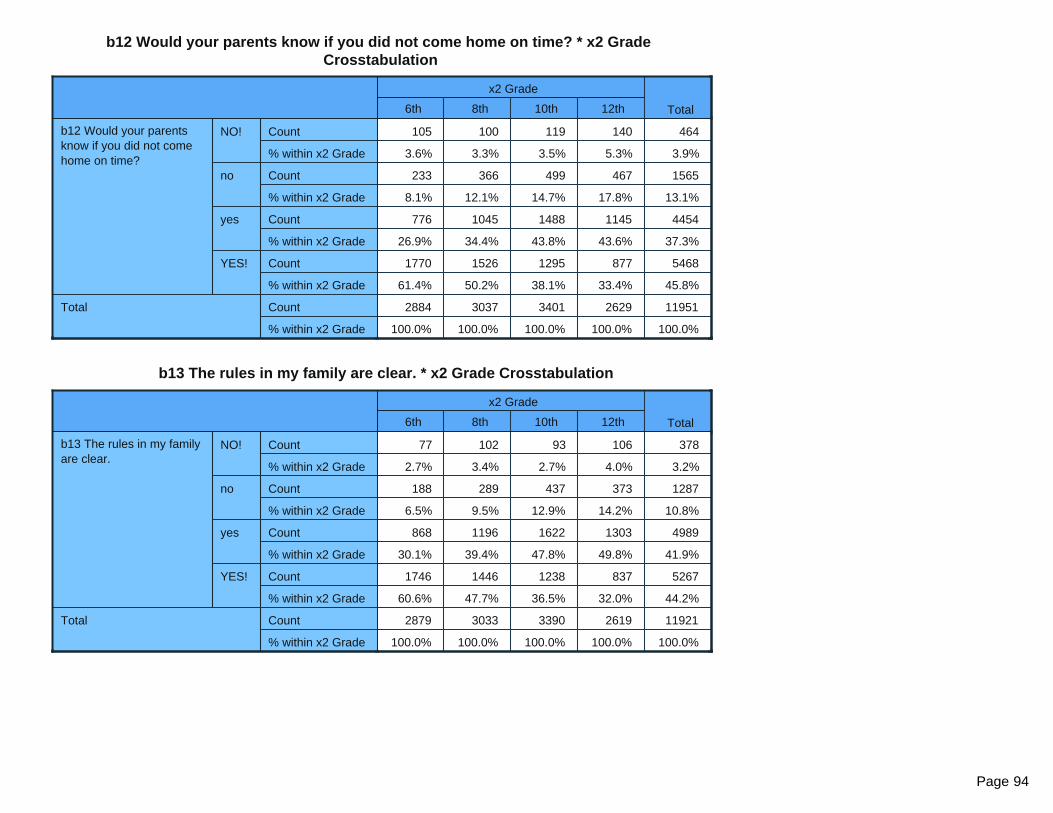
b12 Would your parents know if you did not come home on time? * x2 Grade Crosstabulation
x2 Grade
Total6th 8th 10th 12th
b12 Would your parents know if you did not come home on time?
NO! Count
% within x2 Grade
no Count
% within x2 Grade
yes Count
% within x2 Grade
YES! Count
% within x2 Grade
Total Count
% within x2 Grade
105 100 119 140 464
3.6% 3.3% 3.5% 5.3% 3.9%
233 366 499 467 1565
8.1% 12.1% 14.7% 17.8% 13.1%
776 1045 1488 1145 4454
26.9% 34.4% 43.8% 43.6% 37.3%
1770 1526 1295 877 5468
61.4% 50.2% 38.1% 33.4% 45.8%
2884 3037 3401 2629 11951
100.0% 100.0% 100.0% 100.0% 100.0%
b13 The rules in my family are clear. * x2 Grade Crosstabulation
x2 Grade
Total6th 8th 10th 12th
b13 The rules in my family are clear.
NO! Count
% within x2 Grade
no Count
% within x2 Grade
yes Count
% within x2 Grade
YES! Count
% within x2 Grade
Total Count
% within x2 Grade
77 102 93 106 378
2.7% 3.4% 2.7% 4.0% 3.2%
188 289 437 373 1287
6.5% 9.5% 12.9% 14.2% 10.8%
868 1196 1622 1303 4989
30.1% 39.4% 47.8% 49.8% 41.9%
1746 1446 1238 837 5267
60.6% 47.7% 36.5% 32.0% 44.2%
2879 3033 3390 2619 11921
100.0% 100.0% 100.0% 100.0% 100.0%
Page 94

b14 If you carried a handgun without your parent’s permission, would you be caught by them? * x2 Grade Crosstabulation
x2 Grade
Total6th 8th 10th 12th
b14 If you carried a handgun without your parent’s permission, would you be caught by them?
NO! Count
% within x2 Grade
no Count
% within x2 Grade
yes Count
% within x2 Grade
YES! Count
% within x2 Grade
Total Count
% within x2 Grade
116 148 153 168 585
4.1% 4.9% 4.5% 6.5% 5.0%
79 226 372 354 1031
2.8% 7.5% 11.0% 13.6% 8.7%
364 578 811 634 2387
12.9% 19.2% 24.1% 24.3% 20.2%
2270 2060 2033 1448 7811
80.2% 68.4% 60.3% 55.6% 66.1%
2829 3012 3369 2604 11814
100.0% 100.0% 100.0% 100.0% 100.0%
b15 People in my family often insult or yell at each other. * x2 Grade Crosstabulation
x2 Grade
Total6th 8th 10th 12th
b15 People in my family often insult or yell at each other.
NO! Count
% within x2 Grade
no Count
% within x2 Grade
yes Count
% within x2 Grade
YES! Count
% within x2 Grade
Total Count
% within x2 Grade
991 749 592 501 2833
35.1% 25.0% 17.5% 19.2% 24.0%
944 1159 1453 1064 4620
33.4% 38.6% 43.1% 40.8% 39.1%
589 739 895 682 2905
20.8% 24.6% 26.5% 26.2% 24.6%
301 354 435 360 1450
10.7% 11.8% 12.9% 13.8% 12.3%
2825 3001 3375 2607 11808
100.0% 100.0% 100.0% 100.0% 100.0%
Page 95
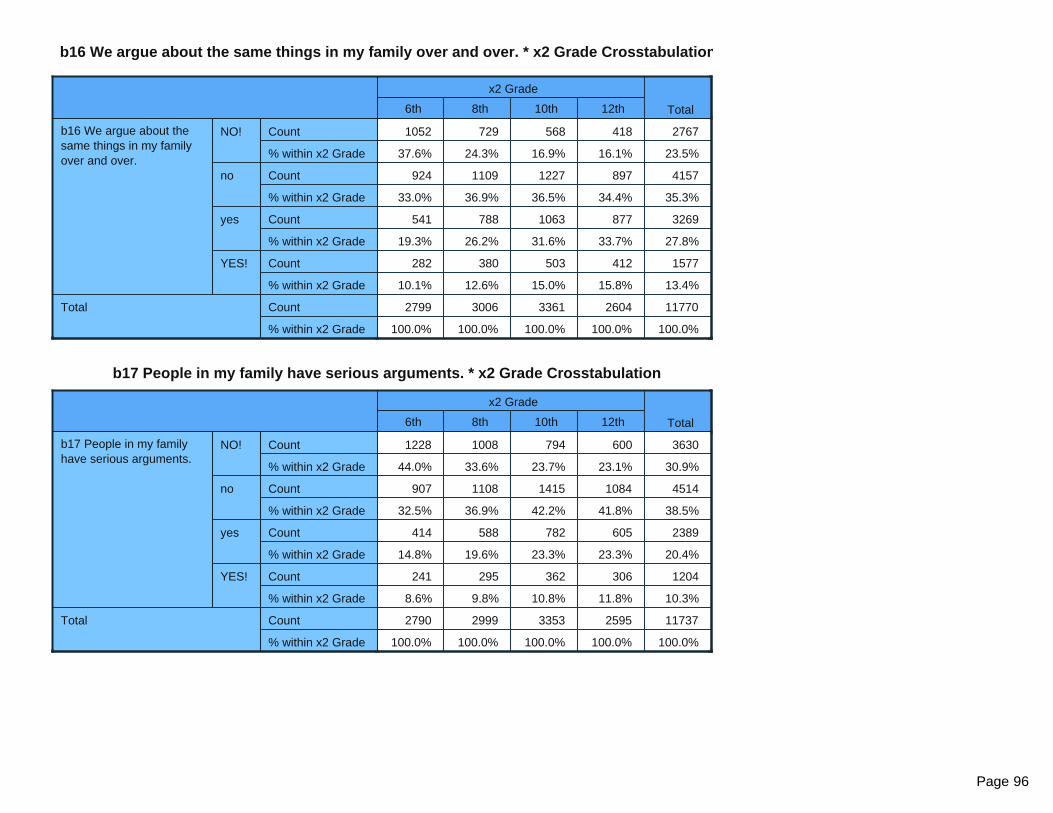
b16 We argue about the same things in my family over and over. * x2 Grade Crosstabulation
x2 Grade
Total6th 8th 10th 12th
b16 We argue about the same things in my family over and over.
NO! Count
% within x2 Grade
no Count
% within x2 Grade
yes Count
% within x2 Grade
YES! Count
% within x2 Grade
Total Count
% within x2 Grade
1052 729 568 418 2767
37.6% 24.3% 16.9% 16.1% 23.5%
924 1109 1227 897 4157
33.0% 36.9% 36.5% 34.4% 35.3%
541 788 1063 877 3269
19.3% 26.2% 31.6% 33.7% 27.8%
282 380 503 412 1577
10.1% 12.6% 15.0% 15.8% 13.4%
2799 3006 3361 2604 11770
100.0% 100.0% 100.0% 100.0% 100.0%
b17 People in my family have serious arguments. * x2 Grade Crosstabulation
x2 Grade
Total6th 8th 10th 12th
b17 People in my family have serious arguments.
NO! Count
% within x2 Grade
no Count
% within x2 Grade
yes Count
% within x2 Grade
YES! Count
% within x2 Grade
Total Count
% within x2 Grade
1228 1008 794 600 3630
44.0% 33.6% 23.7% 23.1% 30.9%
907 1108 1415 1084 4514
32.5% 36.9% 42.2% 41.8% 38.5%
414 588 782 605 2389
14.8% 19.6% 23.3% 23.3% 20.4%
241 295 362 306 1204
8.6% 9.8% 10.8% 11.8% 10.3%
2790 2999 3353 2595 11737
100.0% 100.0% 100.0% 100.0% 100.0%
Page 96

b18 If you drank some beer, wine, or liquor (for example vodka, whiskey, gin, or rum) without your parent’s permission, would you be caught by them? * x2 Grade
Crosstabulation
x2 Grade
Total6th 8th 10th 12th
b18 If you drank some beer, wine, or liquor (for example vodka, whiskey, gin, or rum) without your parent’s permission, would you be caught by them?
NO! Count
% within x2 Grade
no Count
% within x2 Grade
yes Count
% within x2 Grade
YES! Count
% within x2 Grade
Total Count
% within x2 Grade
171 206 285 324 986
6.1% 6.9% 8.5% 12.5% 8.4%
138 496 1058 1103 2795
4.9% 16.6% 31.6% 42.4% 23.8%
406 709 959 684 2758
14.5% 23.7% 28.6% 26.3% 23.5%
2076 1583 1050 491 5200
74.4% 52.9% 31.3% 18.9% 44.3%
2791 2994 3352 2602 11739
100.0% 100.0% 100.0% 100.0% 100.0%
b19 My family has clear rules about alcohol and drug use. * x2 Grade Crosstabulation
x2 Grade
Total6th 8th 10th 12th
b19 My family has clear rules about alcohol and drug use.
NO! Count
% within x2 Grade
no Count
% within x2 Grade
yes Count
% within x2 Grade
YES! Count
% within x2 Grade
Total Count
% within x2 Grade
93 94 104 109 400
3.3% 3.1% 3.1% 4.2% 3.4%
111 255 437 471 1274
3.9% 8.5% 13.0% 18.1% 10.8%
419 768 1251 1079 3517
14.9% 25.6% 37.3% 41.5% 29.9%
2192 1886 1563 941 6582
77.9% 62.8% 46.6% 36.2% 55.9%
2815 3003 3355 2600 11773
100.0% 100.0% 100.0% 100.0% 100.0%
Page 97

b20a About how many adults (over 21) have you known personally who in the past year have: Gotten drunk or high? * x2 Grade Crosstabulation
x2 Grade
Total6th 8th 10th 12th
b20a About how many adults (over 21) have you known personally who in the past year have: Gotten drunk or high?
None Count
% within x2 Grade
1 Count
% within x2 Grade
2 Count
% within x2 Grade
3 or 4 Count
% within x2 Grade
5 or more Count
% within x2 Grade
Total Count
% within x2 Grade
1733 1387 1106 674 4900
62.1% 46.3% 32.9% 25.8% 41.7%
406 446 392 241 1485
14.5% 14.9% 11.7% 9.2% 12.6%
240 322 445 308 1315
8.6% 10.8% 13.2% 11.8% 11.2%
159 349 495 408 1411
5.7% 11.7% 14.7% 15.6% 12.0%
254 490 922 986 2652
9.1% 16.4% 27.4% 37.7% 22.5%
2792 2994 3360 2617 11763
100.0% 100.0% 100.0% 100.0% 100.0%
b20b About how many adults (over 21) have you known personally who in the past year have: Used marijuana, crack, cocaine, or other drugs? * x2 Grade Crosstabulation
x2 Grade
Total6th 8th 10th 12th
b20b About how many adults (over 21) have you known personally who in the past year have: Used marijuana, crack, cocaine, or other drugs?
None Count
% within x2 Grade
1 Count
% within x2 Grade
2 Count
% within x2 Grade
3 or 4 Count
% within x2 Grade
5 or more Count
% within x2 Grade
Total Count
% within x2 Grade
2430 2295 2187 1407 8319
87.4% 76.7% 65.2% 53.9% 70.9%
176 286 371 313 1146
6.3% 9.6% 11.1% 12.0% 9.8%
75 158 270 290 793
2.7% 5.3% 8.0% 11.1% 6.8%
44 110 242 229 625
1.6% 3.7% 7.2% 8.8% 5.3%
55 142 285 371 853
2.0% 4.7% 8.5% 14.2% 7.3%
2780 2991 3355 2610 11736
100.0% 100.0% 100.0% 100.0% 100.0%
Page 98

b20c About how many adults (over 21) have you known personally who in the past year have: Sold or dealt drugs? * x2 Grade Crosstabulation
x2 Grade
Total6th 8th 10th 12th
b20c About how many adults (over 21) have you known personally who in the past year have: Sold or dealt drugs?
None Count
% within x2 Grade
1 Count
% within x2 Grade
2 Count
% within x2 Grade
3 or 4 Count
% within x2 Grade
5 or more Count
% within x2 Grade
Total Count
% within x2 Grade
2587 2606 2768 2028 9989
93.3% 87.9% 83.1% 78.2% 85.7%
98 153 215 190 656
3.5% 5.2% 6.5% 7.3% 5.6%
36 65 125 137 363
1.3% 2.2% 3.8% 5.3% 3.1%
17 57 88 79 241
0.6% 1.9% 2.6% 3.0% 2.1%
34 83 135 159 411
1.2% 2.8% 4.1% 6.1% 3.5%
2772 2964 3331 2593 11660
100.0% 100.0% 100.0% 100.0% 100.0%
Page 99
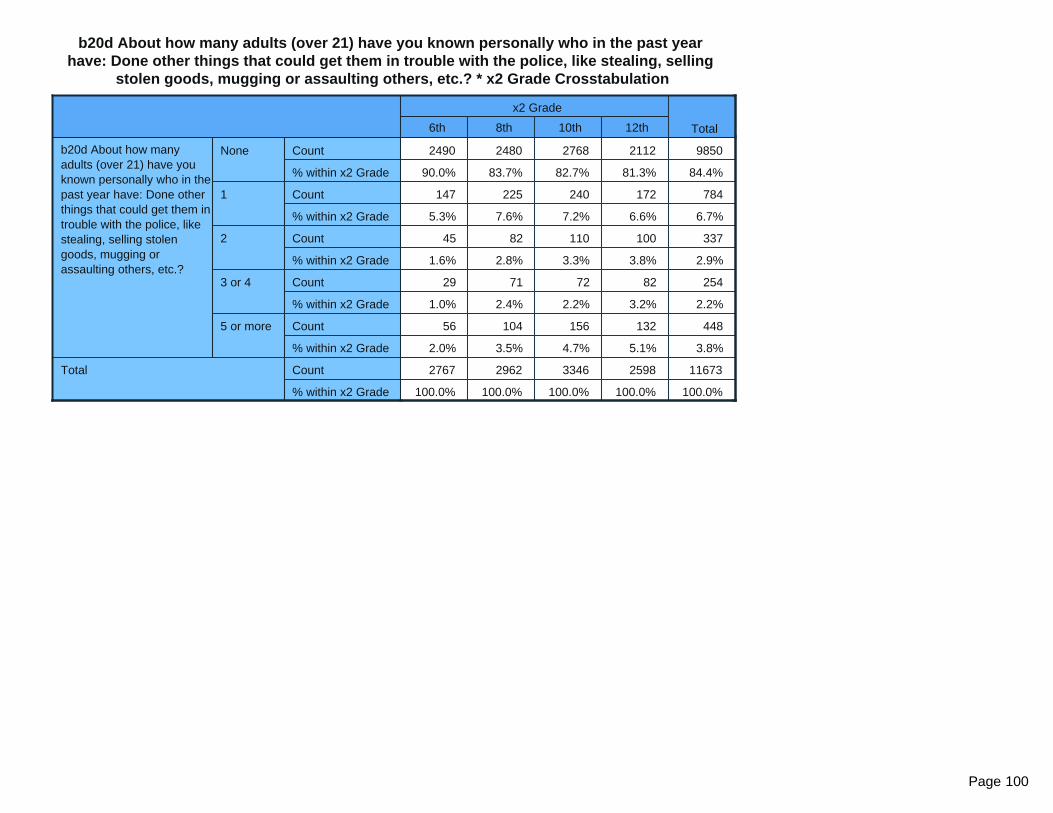
b20d About how many adults (over 21) have you known personally who in the past year have: Done other things that could get them in trouble with the police, like stealing, selling
stolen goods, mugging or assaulting others, etc.? * x2 Grade Crosstabulation
x2 Grade
Total6th 8th 10th 12th
b20d About how many adults (over 21) have you known personally who in the past year have: Done other things that could get them in trouble with the police, like stealing, selling stolen goods, mugging or assaulting others, etc.?
None Count
% within x2 Grade
1 Count
% within x2 Grade
2 Count
% within x2 Grade
3 or 4 Count
% within x2 Grade
5 or more Count
% within x2 Grade
Total Count
% within x2 Grade
2490 2480 2768 2112 9850
90.0% 83.7% 82.7% 81.3% 84.4%
147 225 240 172 784
5.3% 7.6% 7.2% 6.6% 6.7%
45 82 110 100 337
1.6% 2.8% 3.3% 3.8% 2.9%
29 71 72 82 254
1.0% 2.4% 2.2% 3.2% 2.2%
56 104 156 132 448
2.0% 3.5% 4.7% 5.1% 3.8%
2767 2962 3346 2598 11673
100.0% 100.0% 100.0% 100.0% 100.0%
Page 100

b21a How many of your brothers or sisters ever: Drank beer, wine or hard liquor (for example, vodka, whiskey or gin)? * x2 Grade Crosstabulation
x2 Grade
Total6th 8th 10th 12th
b21a How many of your brothers or sisters ever: Drank beer, wine or hard liquor (for example, vodka, whiskey or gin)?
I don't have any Count
% within x2 Grade
None Count
% within x2 Grade
1 Count
% within x2 Grade
2 Count
% within x2 Grade
3 or 4 Count
% within x2 Grade
5 or more Count
% within x2 Grade
Total Count
% within x2 Grade
441 462 458 324 1685
15.8% 15.6% 13.7% 12.5% 14.4%
1971 1886 1867 1332 7056
70.7% 63.5% 55.8% 51.3% 60.3%
222 339 570 548 1679
8.0% 11.4% 17.1% 21.1% 14.4%
91 150 275 237 753
3.3% 5.1% 8.2% 9.1% 6.4%
43 88 117 96 344
1.5% 3.0% 3.5% 3.7% 2.9%
19 45 56 57 177
0.7% 1.5% 1.7% 2.2% 1.5%
2787 2970 3343 2594 11694
100.0% 100.0% 100.0% 100.0% 100.0%
Page 101
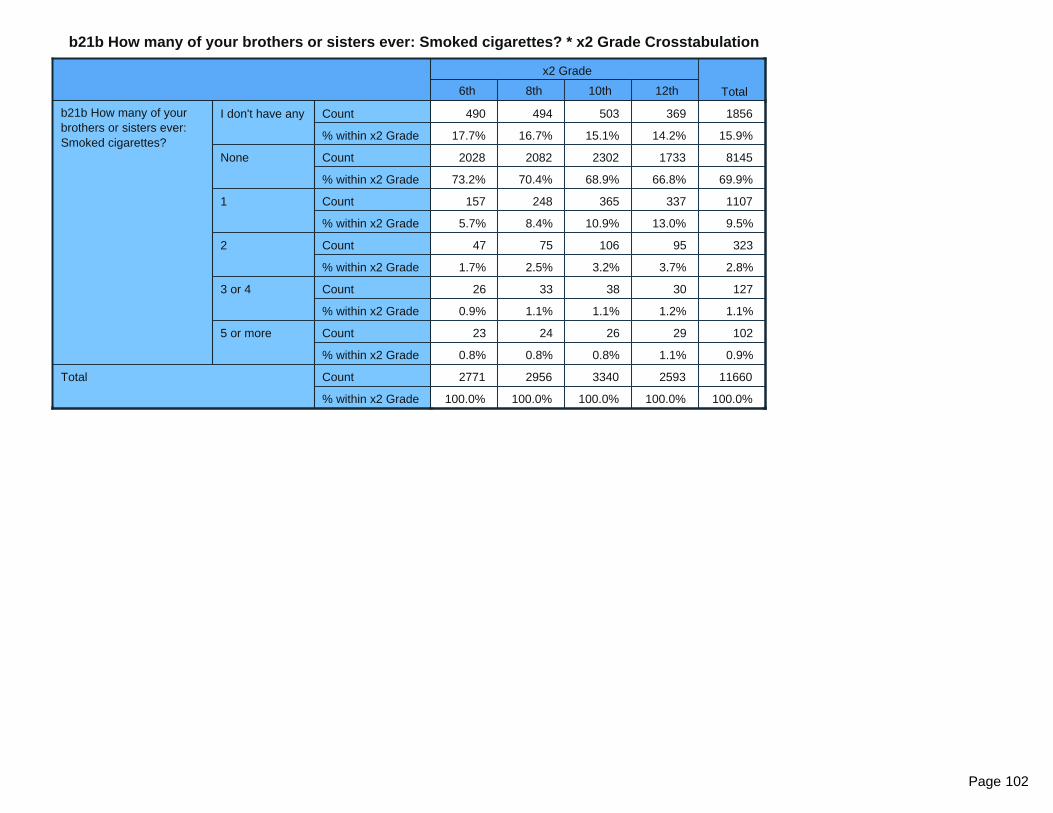
b21b How many of your brothers or sisters ever: Smoked cigarettes? * x2 Grade Crosstabulation
x2 Grade
Total6th 8th 10th 12th
b21b How many of your brothers or sisters ever: Smoked cigarettes?
I don't have any Count
% within x2 Grade
None Count
% within x2 Grade
1 Count
% within x2 Grade
2 Count
% within x2 Grade
3 or 4 Count
% within x2 Grade
5 or more Count
% within x2 Grade
Total Count
% within x2 Grade
490 494 503 369 1856
17.7% 16.7% 15.1% 14.2% 15.9%
2028 2082 2302 1733 8145
73.2% 70.4% 68.9% 66.8% 69.9%
157 248 365 337 1107
5.7% 8.4% 10.9% 13.0% 9.5%
47 75 106 95 323
1.7% 2.5% 3.2% 3.7% 2.8%
26 33 38 30 127
0.9% 1.1% 1.1% 1.2% 1.1%
23 24 26 29 102
0.8% 0.8% 0.8% 1.1% 0.9%
2771 2956 3340 2593 11660
100.0% 100.0% 100.0% 100.0% 100.0%
Page 102
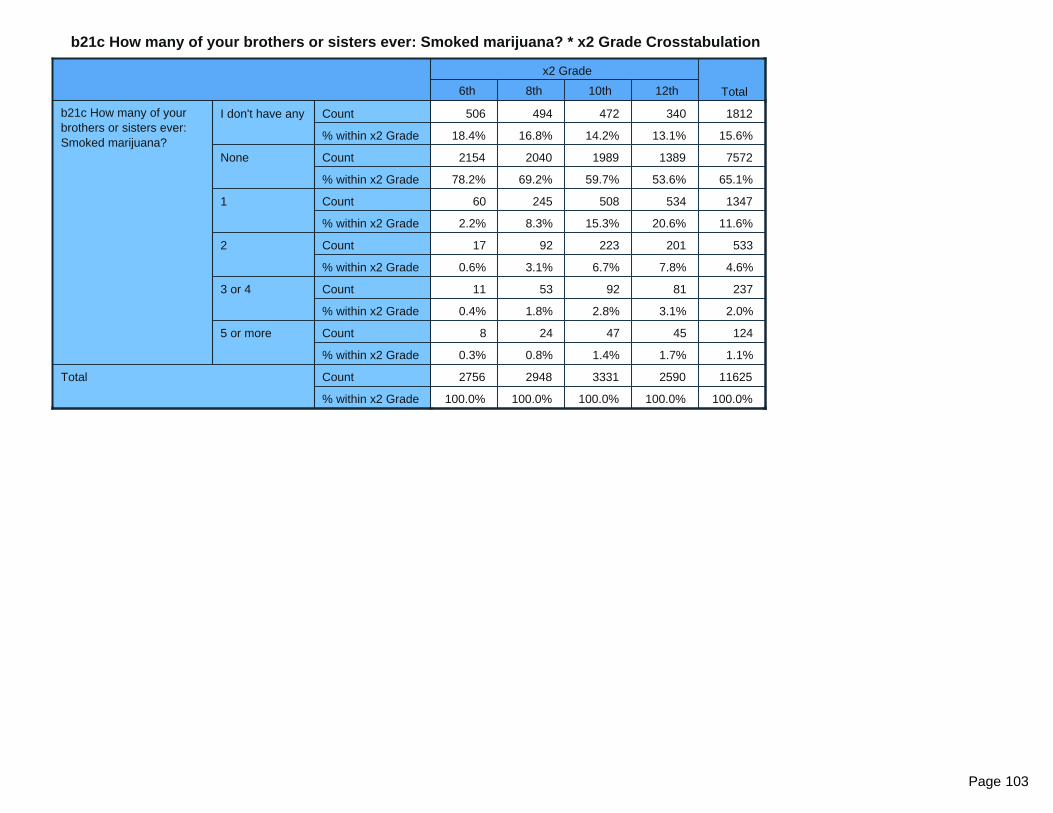
b21c How many of your brothers or sisters ever: Smoked marijuana? * x2 Grade Crosstabulation
x2 Grade
Total6th 8th 10th 12th
b21c How many of your brothers or sisters ever: Smoked marijuana?
I don't have any Count
% within x2 Grade
None Count
% within x2 Grade
1 Count
% within x2 Grade
2 Count
% within x2 Grade
3 or 4 Count
% within x2 Grade
5 or more Count
% within x2 Grade
Total Count
% within x2 Grade
506 494 472 340 1812
18.4% 16.8% 14.2% 13.1% 15.6%
2154 2040 1989 1389 7572
78.2% 69.2% 59.7% 53.6% 65.1%
60 245 508 534 1347
2.2% 8.3% 15.3% 20.6% 11.6%
17 92 223 201 533
0.6% 3.1% 6.7% 7.8% 4.6%
11 53 92 81 237
0.4% 1.8% 2.8% 3.1% 2.0%
8 24 47 45 124
0.3% 0.8% 1.4% 1.7% 1.1%
2756 2948 3331 2590 11625
100.0% 100.0% 100.0% 100.0% 100.0%
Page 103

b21d How many of your brothers or sisters ever: Took a handgun to school? * x2 Grade Crosstabulation
x2 Grade
Total6th 8th 10th 12th
b21d How many of your brothers or sisters ever: Took a handgun to school?
I don't have any Count
% within x2 Grade
None Count
% within x2 Grade
1 Count
% within x2 Grade
2 Count
% within x2 Grade
3 or 4 Count
% within x2 Grade
5 or more Count
% within x2 Grade
Total Count
% within x2 Grade
517 540 537 415 2009
18.7% 18.3% 16.1% 16.0% 17.3%
2229 2382 2766 2136 9513
80.6% 80.8% 83.0% 82.6% 81.8%
8 15 11 14 48
0.3% 0.5% 0.3% 0.5% 0.4%
2 4 6 7 19
0.1% 0.1% 0.2% 0.3% 0.2%
2 1 5 6 14
0.1% 0.0% 0.2% 0.2% 0.1%
6 5 7 9 27
0.2% 0.2% 0.2% 0.3% 0.2%
2764 2947 3332 2587 11630
100.0% 100.0% 100.0% 100.0% 100.0%
Page 104

b21e How many of your brothers or sisters ever: Been suspended or expelled from school? * x2 Grade Crosstabulation
x2 Grade
Total6th 8th 10th 12th
b21e How many of your brothers or sisters ever: Been suspended or expelled from school?
I don't have any Count
% within x2 Grade
None Count
% within x2 Grade
1 Count
% within x2 Grade
2 Count
% within x2 Grade
3 or 4 Count
% within x2 Grade
5 or more Count
% within x2 Grade
Total Count
% within x2 Grade
437 441 480 373 1731
15.8% 15.1% 14.4% 14.4% 14.9%
1777 1833 2168 1746 7524
64.4% 62.6% 65.1% 67.5% 64.8%
347 383 421 318 1469
12.6% 13.1% 12.6% 12.3% 12.7%
114 154 165 95 528
4.1% 5.3% 5.0% 3.7% 4.6%
46 63 67 31 207
1.7% 2.2% 2.0% 1.2% 1.8%
37 55 29 24 145
1.3% 1.9% 0.9% 0.9% 1.2%
2758 2929 3330 2587 11604
100.0% 100.0% 100.0% 100.0% 100.0%
b22 Has anyone in your family ever had a severe alcohol or drug problem? * x2 Grade Crosstabulation
x2 Grade
Total6th 8th 10th 12th
b22 Has anyone in your family ever had a severe alcohol or drug problem?
Yes Count
% within x2 Grade
No Count
% within x2 Grade
Total Count
% within x2 Grade
407 732 1133 954 3226
15.0% 25.0% 34.2% 37.0% 28.0%
2303 2192 2182 1626 8303
85.0% 75.0% 65.8% 63.0% 72.0%
2710 2924 3315 2580 11529
100.0% 100.0% 100.0% 100.0% 100.0%
Page 105

b23a How wrong do your parents feel it would be for you to: Pick a fight with someone? * x2 Grade Crosstabulation
x2 Grade
Total6th 8th 10th 12th
b23a How wrong do your parents feel it would be for you to: Pick a fight with someone?
Not Wrong at All Count
% within x2 Grade
A Little Bit Wrong Count
% within x2 Grade
Wrong Count
% within x2 Grade
Very wrong Count
% within x2 Grade
Total Count
% within x2 Grade
140 133 123 132 528
5.1% 4.5% 3.7% 5.1% 4.5%
340 527 656 484 2007
12.5% 17.8% 19.7% 18.7% 17.3%
751 1021 1258 954 3984
27.5% 34.5% 37.7% 36.8% 34.3%
1497 1275 1298 1021 5091
54.9% 43.1% 38.9% 39.4% 43.9%
2728 2956 3335 2591 11610
100.0% 100.0% 100.0% 100.0% 100.0%
b23b How wrong do your parents feel it would be for you to: Steal anything worth more than $5 * x2 Grade Crosstabulation
x2 Grade
Total6th 8th 10th 12th
b23b How wrong do your parents feel it would be for you to: Steal anything worth more than $5
Not Wrong at All Count
% within x2 Grade
A Little Bit Wrong Count
% within x2 Grade
Wrong Count
% within x2 Grade
Very wrong Count
% within x2 Grade
Total Count
% within x2 Grade
97 102 86 91 376
3.6% 3.5% 2.6% 3.5% 3.2%
85 138 178 114 515
3.1% 4.7% 5.3% 4.4% 4.5%
415 693 930 683 2721
15.3% 23.6% 27.9% 26.4% 23.5%
2124 2001 2138 1696 7959
78.1% 68.2% 64.2% 65.6% 68.8%
2721 2934 3332 2584 11571
100.0% 100.0% 100.0% 100.0% 100.0%
Page 106
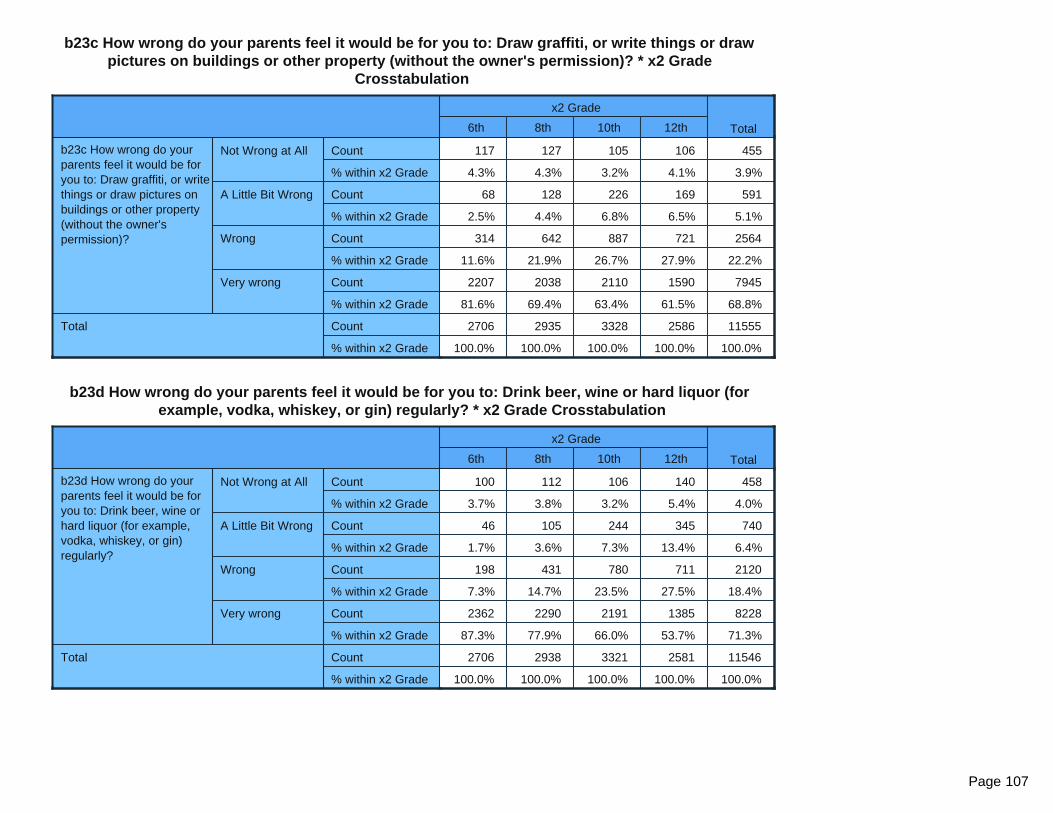
b23c How wrong do your parents feel it would be for you to: Draw graffiti, or write things or draw pictures on buildings or other property (without the owner's permission)? * x2 Grade
Crosstabulation
x2 Grade
Total6th 8th 10th 12th
b23c How wrong do your parents feel it would be for you to: Draw graffiti, or write things or draw pictures on buildings or other property (without the owner's permission)?
Not Wrong at All Count
% within x2 Grade
A Little Bit Wrong Count
% within x2 Grade
Wrong Count
% within x2 Grade
Very wrong Count
% within x2 Grade
Total Count
% within x2 Grade
117 127 105 106 455
4.3% 4.3% 3.2% 4.1% 3.9%
68 128 226 169 591
2.5% 4.4% 6.8% 6.5% 5.1%
314 642 887 721 2564
11.6% 21.9% 26.7% 27.9% 22.2%
2207 2038 2110 1590 7945
81.6% 69.4% 63.4% 61.5% 68.8%
2706 2935 3328 2586 11555
100.0% 100.0% 100.0% 100.0% 100.0%
b23d How wrong do your parents feel it would be for you to: Drink beer, wine or hard liquor (for example, vodka, whiskey, or gin) regularly? * x2 Grade Crosstabulation
x2 Grade
Total6th 8th 10th 12th
b23d How wrong do your parents feel it would be for you to: Drink beer, wine or hard liquor (for example, vodka, whiskey, or gin) regularly?
Not Wrong at All Count
% within x2 Grade
A Little Bit Wrong Count
% within x2 Grade
Wrong Count
% within x2 Grade
Very wrong Count
% within x2 Grade
Total Count
% within x2 Grade
100 112 106 140 458
3.7% 3.8% 3.2% 5.4% 4.0%
46 105 244 345 740
1.7% 3.6% 7.3% 13.4% 6.4%
198 431 780 711 2120
7.3% 14.7% 23.5% 27.5% 18.4%
2362 2290 2191 1385 8228
87.3% 77.9% 66.0% 53.7% 71.3%
2706 2938 3321 2581 11546
100.0% 100.0% 100.0% 100.0% 100.0%
Page 107

b23e How wrong do your parents feel it would be for you to: Smoke cigarettes? * x2 Grade Crosstabulation
x2 Grade
Total6th 8th 10th 12th
b23e How wrong do your parents feel it would be for you to: Smoke cigarettes?
Not Wrong at All Count
% within x2 Grade
A Little Bit Wrong Count
% within x2 Grade
Wrong Count
% within x2 Grade
Very wrong Count
% within x2 Grade
Total Count
% within x2 Grade
104 104 80 108 396
3.9% 3.6% 2.4% 4.2% 3.4%
27 43 63 104 237
1.0% 1.5% 1.9% 4.0% 2.1%
150 262 469 463 1344
5.6% 8.9% 14.1% 18.0% 11.7%
2418 2519 2709 1904 9550
89.6% 86.0% 81.6% 73.8% 82.8%
2699 2928 3321 2579 11527
100.0% 100.0% 100.0% 100.0% 100.0%
b23f How wrong do your parents feel it would be for you to: Smoke marijuana * x2 Grade Crosstabulation
x2 Grade
Total6th 8th 10th 12th
b23f How wrong do your parents feel it would be for you to: Smoke marijuana
Not Wrong at All Count
% within x2 Grade
A Little Bit Wrong Count
% within x2 Grade
Wrong Count
% within x2 Grade
Very wrong Count
% within x2 Grade
Total Count
% within x2 Grade
103 119 136 192 550
3.8% 4.1% 4.1% 7.4% 4.8%
16 95 274 350 735
0.6% 3.2% 8.3% 13.5% 6.4%
102 324 625 570 1621
3.8% 11.1% 18.9% 22.1% 14.1%
2462 2391 2279 1472 8604
91.8% 81.6% 68.8% 57.0% 74.8%
2683 2929 3314 2584 11510
100.0% 100.0% 100.0% 100.0% 100.0%
Page 108
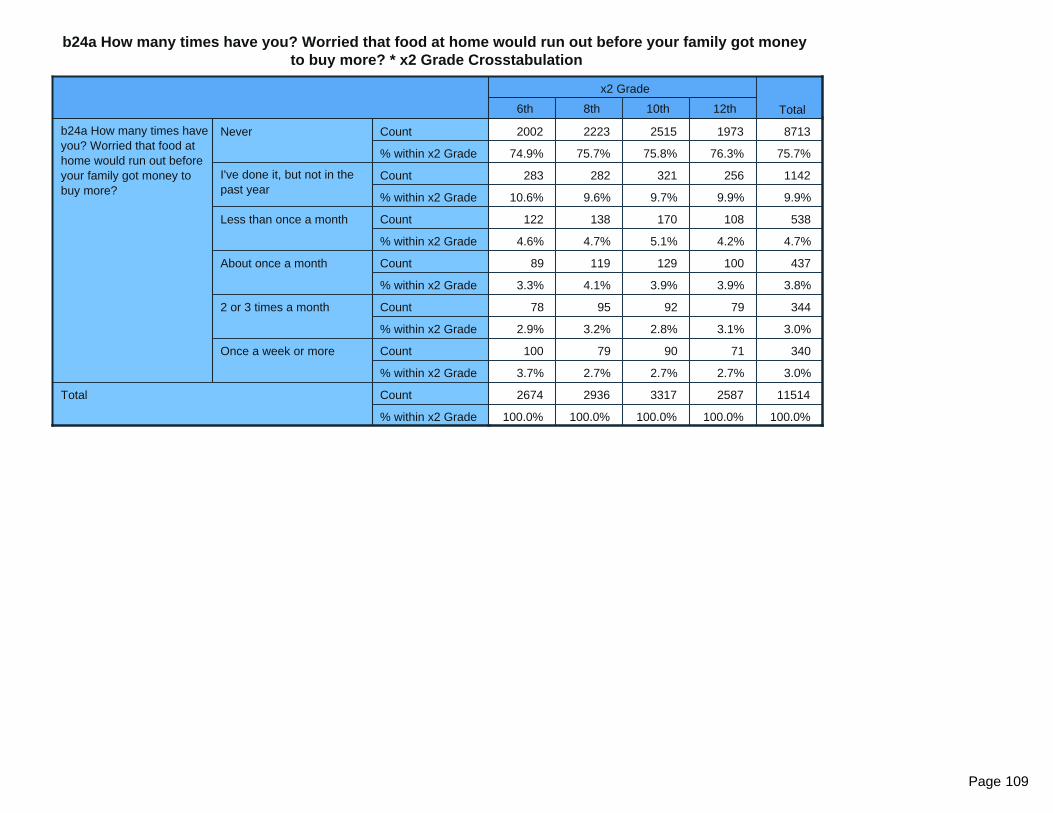
b24a How many times have you? Worried that food at home would run out before your family got money to buy more? * x2 Grade Crosstabulation
x2 Grade
Total6th 8th 10th 12th
b24a How many times have you? Worried that food at home would run out before your family got money to buy more?
Never Count
% within x2 Grade
I've done it, but not in the past year
Count
% within x2 Grade
Less than once a month Count
% within x2 Grade
About once a month Count
% within x2 Grade
2 or 3 times a month Count
% within x2 Grade
Once a week or more Count
% within x2 Grade
Total Count
% within x2 Grade
2002 2223 2515 1973 8713
74.9% 75.7% 75.8% 76.3% 75.7%
283 282 321 256 1142
10.6% 9.6% 9.7% 9.9% 9.9%
122 138 170 108 538
4.6% 4.7% 5.1% 4.2% 4.7%
89 119 129 100 437
3.3% 4.1% 3.9% 3.9% 3.8%
78 95 92 79 344
2.9% 3.2% 2.8% 3.1% 3.0%
100 79 90 71 340
3.7% 2.7% 2.7% 2.7% 3.0%
2674 2936 3317 2587 11514
100.0% 100.0% 100.0% 100.0% 100.0%
Page 109

b24b How many times have you? Skipped a meal because your family didn’t have enough money to buy food? * x2 Grade Crosstabulation
x2 Grade
Total6th 8th 10th 12th
b24b How many times have you? Skipped a meal because your family didn’t have enough money to buy food?
Never Count
% within x2 Grade
I've done it, but not in the past year
Count
% within x2 Grade
Less than once a month Count
% within x2 Grade
About once a month Count
% within x2 Grade
2 or 3 times a month Count
% within x2 Grade
Once a week or more Count
% within x2 Grade
Total Count
% within x2 Grade
2413 2574 2910 2202 10099
89.9% 87.7% 87.8% 84.9% 87.6%
120 142 161 150 573
4.5% 4.8% 4.9% 5.8% 5.0%
55 76 79 77 287
2.0% 2.6% 2.4% 3.0% 2.5%
24 46 50 43 163
0.9% 1.6% 1.5% 1.7% 1.4%
36 50 48 63 197
1.3% 1.7% 1.4% 2.4% 1.7%
35 48 66 58 207
1.3% 1.6% 2.0% 2.2% 1.8%
2683 2936 3314 2593 11526
100.0% 100.0% 100.0% 100.0% 100.0%
Page 110

e1a In the past 12 months, how often have you: Been threatened to be hit or beaten up on school property? * x2 Grade Crosstabulation
x2 Grade
Total6th 8th 10th 12th
e1a In the past 12 months, how often have you: Been threatened to be hit or beaten up on school property?
Never Count
% within x2 Grade
Once Count
% within x2 Grade
2 or 3 times Count
% within x2 Grade
4 or 5 times Count
% within x2 Grade
6 to 9 times Count
% within x2 Grade
10 or more times Count
% within x2 Grade
Total Count
% within x2 Grade
1734 1841 2217 1818 7610
74.0% 75.8% 81.6% 87.8% 79.6%
304 290 258 130 982
13.0% 11.9% 9.5% 6.3% 10.3%
169 155 140 77 541
7.2% 6.4% 5.2% 3.7% 5.7%
59 50 41 17 167
2.5% 2.1% 1.5% 0.8% 1.7%
16 24 20 4 64
0.7% 1.0% 0.7% 0.2% 0.7%
62 68 41 24 195
2.6% 2.8% 1.5% 1.2% 2.0%
2344 2428 2717 2070 9559
100.0% 100.0% 100.0% 100.0% 100.0%
Page 111

e1b In the past 12 months, how often have you: Been attacked and hit by someone or beaten up on school property? * x2 Grade Crosstabulation
x2 Grade
Total6th 8th 10th 12th
e1b In the past 12 months, how often have you: Been attacked and hit by someone or beaten up on school property?
Never Count
% within x2 Grade
Once Count
% within x2 Grade
2 or 3 times Count
% within x2 Grade
4 or 5 times Count
% within x2 Grade
6 to 9 times Count
% within x2 Grade
10 or more times Count
% within x2 Grade
Total Count
% within x2 Grade
2033 2148 2540 1973 8694
87.1% 88.9% 93.8% 95.5% 91.3%
176 161 101 60 498
7.5% 6.7% 3.7% 2.9% 5.2%
84 67 40 16 207
3.6% 2.8% 1.5% 0.8% 2.2%
15 16 9 6 46
0.6% 0.7% 0.3% 0.3% 0.5%
6 5 7 3 21
0.3% 0.2% 0.3% 0.1% 0.2%
21 19 12 7 59
0.9% 0.8% 0.4% 0.3% 0.6%
2335 2416 2709 2065 9525
100.0% 100.0% 100.0% 100.0% 100.0%
Page 112

e1c In the past 12 months, how often have you: Been threatened by someone with a weapon on school property? * x2 Grade Crosstabulation
x2 Grade
Total6th 8th 10th 12th
e1c In the past 12 months, how often have you: Been threatened by someone with a weapon on school property?
Never Count
% within x2 Grade
Once Count
% within x2 Grade
2 or 3 times Count
% within x2 Grade
4 or 5 times Count
% within x2 Grade
6 to 9 times Count
% within x2 Grade
10 or more times Count
% within x2 Grade
Total Count
% within x2 Grade
2205 2294 2617 2000 9116
94.6% 95.0% 96.7% 97.0% 95.8%
93 83 59 37 272
4.0% 3.4% 2.2% 1.8% 2.9%
19 22 8 14 63
0.8% 0.9% 0.3% 0.7% 0.7%
3 3 5 3 14
0.1% 0.1% 0.2% 0.1% 0.1%
3 2 5 1 11
0.1% 0.1% 0.2% 0.0% 0.1%
8 10 12 6 36
0.3% 0.4% 0.4% 0.3% 0.4%
2331 2414 2706 2061 9512
100.0% 100.0% 100.0% 100.0% 100.0%
Page 113

e1d In the past 12 months, how often have you: Been attacked by someone with a weapon on school property? * x2 Grade Crosstabulation
x2 Grade
Total6th 8th 10th 12th
e1d In the past 12 months, how often have you: Been attacked by someone with a weapon on school property?
Never Count
% within x2 Grade
Once Count
% within x2 Grade
2 or 3 times Count
% within x2 Grade
4 or 5 times Count
% within x2 Grade
6 to 9 times Count
% within x2 Grade
10 or more times Count
% within x2 Grade
Total Count
% within x2 Grade
2271 2360 2665 2027 9323
98.3% 98.3% 98.6% 98.7% 98.5%
26 21 18 17 82
1.1% 0.9% 0.7% 0.8% 0.9%
6 7 4 5 22
0.3% 0.3% 0.1% 0.2% 0.2%
3 1 8 2 14
0.1% 0.0% 0.3% 0.1% 0.1%
0 2 3 1 6
0.0% 0.1% 0.1% 0.0% 0.1%
5 9 6 2 22
0.2% 0.4% 0.2% 0.1% 0.2%
2311 2400 2704 2054 9469
100.0% 100.0% 100.0% 100.0% 100.0%
Page 114
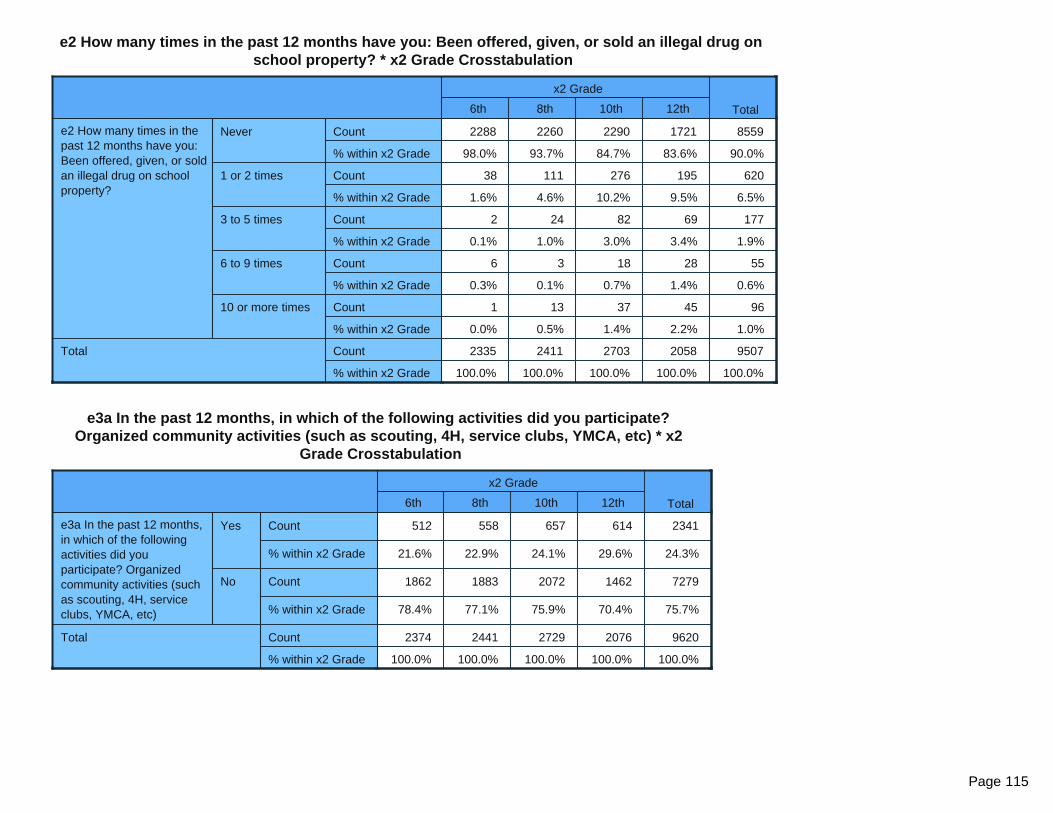
e2 How many times in the past 12 months have you: Been offered, given, or sold an illegal drug on school property? * x2 Grade Crosstabulation
x2 Grade
Total6th 8th 10th 12th
e2 How many times in the past 12 months have you: Been offered, given, or sold an illegal drug on school property?
Never Count
% within x2 Grade
1 or 2 times Count
% within x2 Grade
3 to 5 times Count
% within x2 Grade
6 to 9 times Count
% within x2 Grade
10 or more times Count
% within x2 Grade
Total Count
% within x2 Grade
2288 2260 2290 1721 8559
98.0% 93.7% 84.7% 83.6% 90.0%
38 111 276 195 620
1.6% 4.6% 10.2% 9.5% 6.5%
2 24 82 69 177
0.1% 1.0% 3.0% 3.4% 1.9%
6 3 18 28 55
0.3% 0.1% 0.7% 1.4% 0.6%
1 13 37 45 96
0.0% 0.5% 1.4% 2.2% 1.0%
2335 2411 2703 2058 9507
100.0% 100.0% 100.0% 100.0% 100.0%
e3a In the past 12 months, in which of the following activities did you participate? Organized community activities (such as scouting, 4H, service clubs, YMCA, etc) * x2
Grade Crosstabulation
x2 Grade
Total6th 8th 10th 12th
e3a In the past 12 months, in which of the following activities did you participate? Organized community activities (such as scouting, 4H, service clubs, YMCA, etc)
Yes Count
% within x2 Grade
No Count
% within x2 Grade
Total Count
% within x2 Grade
512 558 657 614 2341
21.6% 22.9% 24.1% 29.6% 24.3%
1862 1883 2072 1462 7279
78.4% 77.1% 75.9% 70.4% 75.7%
2374 2441 2729 2076 9620
100.0% 100.0% 100.0% 100.0% 100.0%
Page 115
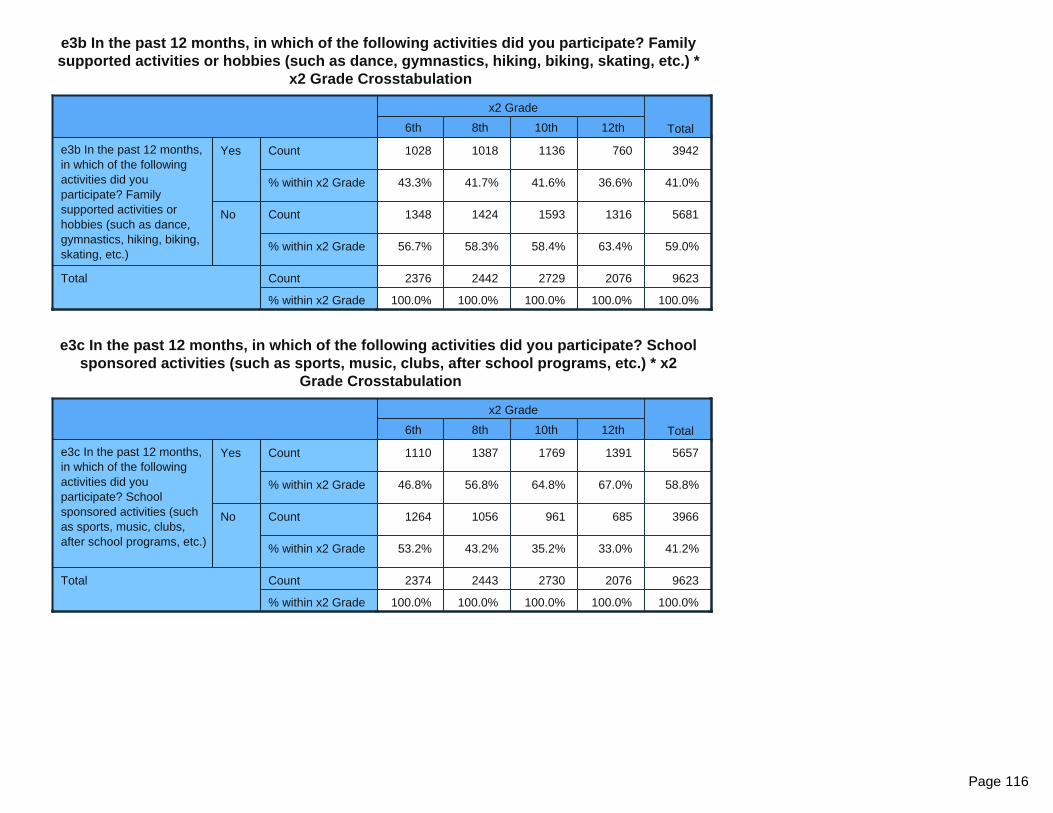
e3b In the past 12 months, in which of the following activities did you participate? Family supported activities or hobbies (such as dance, gymnastics, hiking, biking, skating, etc.) *
x2 Grade Crosstabulation
x2 Grade
Total6th 8th 10th 12th
e3b In the past 12 months, in which of the following activities did you participate? Family supported activities or hobbies (such as dance, gymnastics, hiking, biking, skating, etc.)
Yes Count
% within x2 Grade
No Count
% within x2 Grade
Total Count
% within x2 Grade
1028 1018 1136 760 3942
43.3% 41.7% 41.6% 36.6% 41.0%
1348 1424 1593 1316 5681
56.7% 58.3% 58.4% 63.4% 59.0%
2376 2442 2729 2076 9623
100.0% 100.0% 100.0% 100.0% 100.0%
e3c In the past 12 months, in which of the following activities did you participate? School sponsored activities (such as sports, music, clubs, after school programs, etc.) * x2
Grade Crosstabulation
x2 Grade
Total6th 8th 10th 12th
e3c In the past 12 months, in which of the following activities did you participate? School sponsored activities (such as sports, music, clubs, after school programs, etc.)
Yes Count
% within x2 Grade
No Count
% within x2 Grade
Total Count
% within x2 Grade
1110 1387 1769 1391 5657
46.8% 56.8% 64.8% 67.0% 58.8%
1264 1056 961 685 3966
53.2% 43.2% 35.2% 33.0% 41.2%
2374 2443 2730 2076 9623
100.0% 100.0% 100.0% 100.0% 100.0%
Page 116
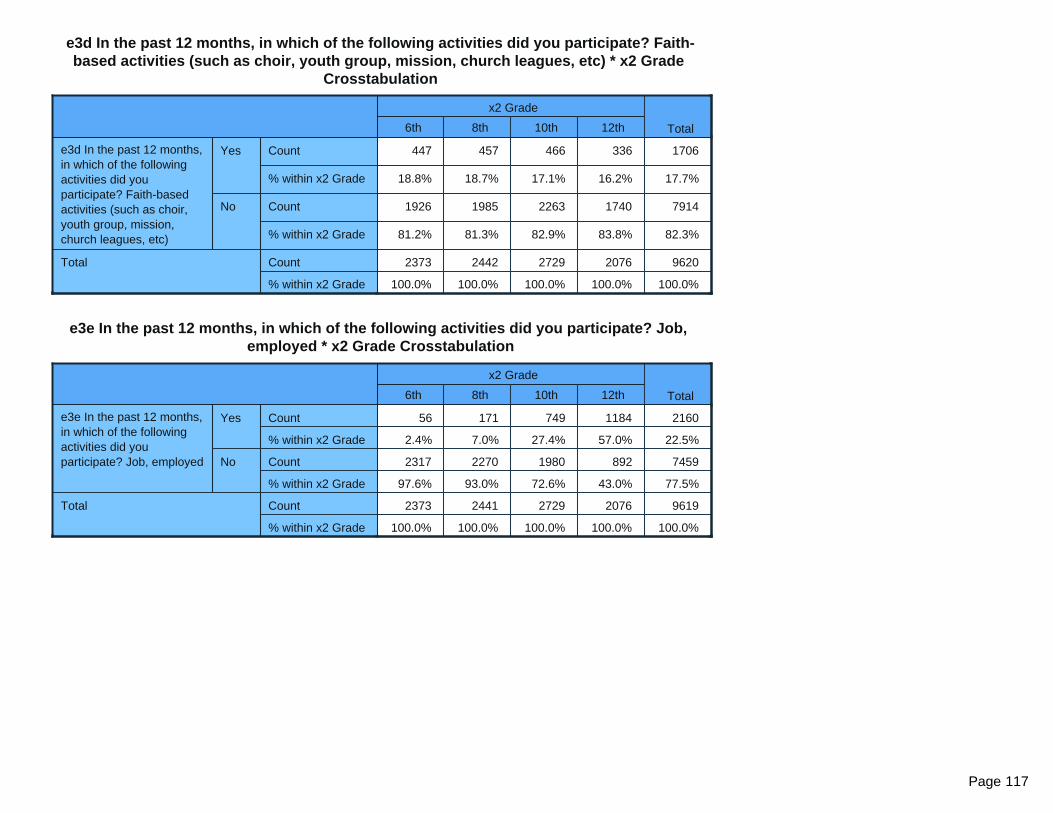
e3d In the past 12 months, in which of the following activities did you participate? Faith-based activities (such as choir, youth group, mission, church leagues, etc) * x2 Grade
Crosstabulation
x2 Grade
Total6th 8th 10th 12th
e3d In the past 12 months, in which of the following activities did you participate? Faith-based activities (such as choir, youth group, mission, church leagues, etc)
Yes Count
% within x2 Grade
No Count
% within x2 Grade
Total Count
% within x2 Grade
447 457 466 336 1706
18.8% 18.7% 17.1% 16.2% 17.7%
1926 1985 2263 1740 7914
81.2% 81.3% 82.9% 83.8% 82.3%
2373 2442 2729 2076 9620
100.0% 100.0% 100.0% 100.0% 100.0%
e3e In the past 12 months, in which of the following activities did you participate? Job, employed * x2 Grade Crosstabulation
x2 Grade
Total6th 8th 10th 12th
e3e In the past 12 months, in which of the following activities did you participate? Job, employed
Yes Count
% within x2 Grade
No Count
% within x2 Grade
Total Count
% within x2 Grade
56 171 749 1184 2160
2.4% 7.0% 27.4% 57.0% 22.5%
2317 2270 1980 892 7459
97.6% 93.0% 72.6% 43.0% 77.5%
2373 2441 2729 2076 9619
100.0% 100.0% 100.0% 100.0% 100.0%
Page 117
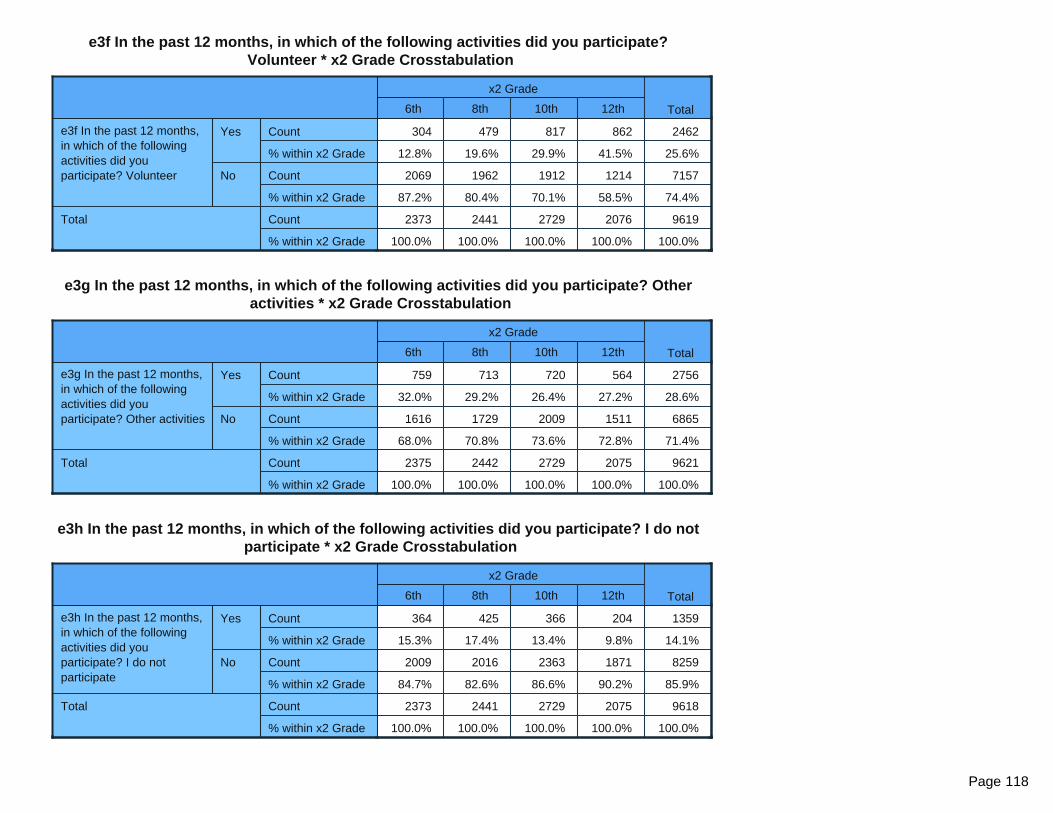
e3f In the past 12 months, in which of the following activities did you participate? Volunteer * x2 Grade Crosstabulation
x2 Grade
Total6th 8th 10th 12th
e3f In the past 12 months, in which of the following activities did you participate? Volunteer
Yes Count
% within x2 Grade
No Count
% within x2 Grade
Total Count
% within x2 Grade
304 479 817 862 2462
12.8% 19.6% 29.9% 41.5% 25.6%
2069 1962 1912 1214 7157
87.2% 80.4% 70.1% 58.5% 74.4%
2373 2441 2729 2076 9619
100.0% 100.0% 100.0% 100.0% 100.0%
e3g In the past 12 months, in which of the following activities did you participate? Other activities * x2 Grade Crosstabulation
x2 Grade
Total6th 8th 10th 12th
e3g In the past 12 months, in which of the following activities did you participate? Other activities
Yes Count
% within x2 Grade
No Count
% within x2 Grade
Total Count
% within x2 Grade
759 713 720 564 2756
32.0% 29.2% 26.4% 27.2% 28.6%
1616 1729 2009 1511 6865
68.0% 70.8% 73.6% 72.8% 71.4%
2375 2442 2729 2075 9621
100.0% 100.0% 100.0% 100.0% 100.0%
e3h In the past 12 months, in which of the following activities did you participate? I do not participate * x2 Grade Crosstabulation
x2 Grade
Total6th 8th 10th 12th
e3h In the past 12 months, in which of the following activities did you participate? I do not participate
Yes Count
% within x2 Grade
No Count
% within x2 Grade
Total Count
% within x2 Grade
364 425 366 204 1359
15.3% 17.4% 13.4% 9.8% 14.1%
2009 2016 2363 1871 8259
84.7% 82.6% 86.6% 90.2% 85.9%
2373 2441 2729 2075 9618
100.0% 100.0% 100.0% 100.0% 100.0%
Page 118

e4 How many times in your lifetime have you: Brought a weapon (such as a handgun, knife, etc.) to school? * x2 Grade Crosstabulation
x2 Grade
Total6th 8th 10th 12th
e4 How many times in your lifetime have you: Brought a weapon (such as a handgun, knife, etc.) to school?
0 times Count
% within x2 Grade
1 or 2 times Count
% within x2 Grade
3 to 5 times Count
% within x2 Grade
6 to 9 times Count
% within x2 Grade
10 to 19 times Count
% within x2 Grade
20 to 39 times Count
% within x2 Grade
40 or more times Count
% within x2 Grade
Total Count
% within x2 Grade
2227 2290 2551 1946 9014
97.2% 95.5% 94.8% 95.3% 95.7%
51 84 88 57 280
2.2% 3.5% 3.3% 2.8% 3.0%
5 7 17 12 41
0.2% 0.3% 0.6% 0.6% 0.4%
2 4 5 5 16
0.1% 0.2% 0.2% 0.2% 0.2%
2 4 11 4 21
0.1% 0.2% 0.4% 0.2% 0.2%
0 1 2 6 9
0.0% 0.0% 0.1% 0.3% 0.1%
4 7 16 13 40
0.2% 0.3% 0.6% 0.6% 0.4%
2291 2397 2690 2043 9421
100.0% 100.0% 100.0% 100.0% 100.0%
Page 119
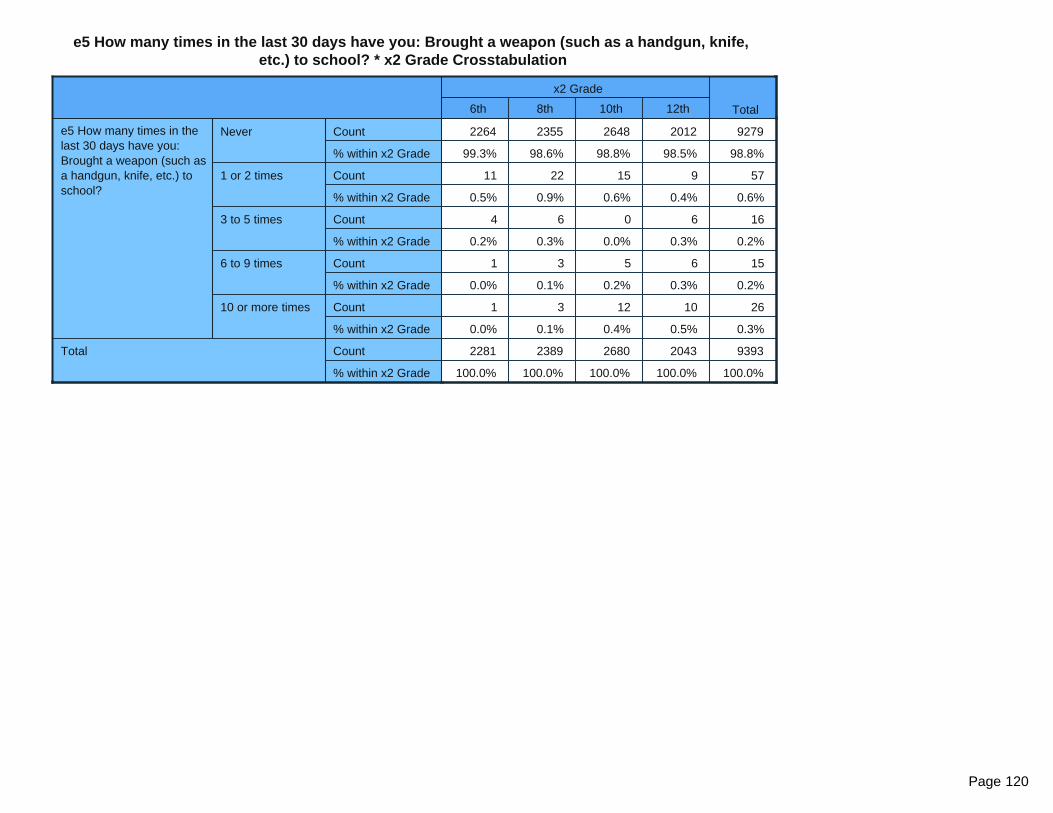
e5 How many times in the last 30 days have you: Brought a weapon (such as a handgun, knife, etc.) to school? * x2 Grade Crosstabulation
x2 Grade
Total6th 8th 10th 12th
e5 How many times in the last 30 days have you: Brought a weapon (such as a handgun, knife, etc.) to school?
Never Count
% within x2 Grade
1 or 2 times Count
% within x2 Grade
3 to 5 times Count
% within x2 Grade
6 to 9 times Count
% within x2 Grade
10 or more times Count
% within x2 Grade
Total Count
% within x2 Grade
2264 2355 2648 2012 9279
99.3% 98.6% 98.8% 98.5% 98.8%
11 22 15 9 57
0.5% 0.9% 0.6% 0.4% 0.6%
4 6 0 6 16
0.2% 0.3% 0.0% 0.3% 0.2%
1 3 5 6 15
0.0% 0.1% 0.2% 0.3% 0.2%
1 3 12 10 26
0.0% 0.1% 0.4% 0.5% 0.3%
2281 2389 2680 2043 9393
100.0% 100.0% 100.0% 100.0% 100.0%
Page 120

e6a How many times in the past 12 months have you attacked someone with the idea of seriously hurting them? * x2 Grade Crosstabulation
x2 Grade
Total6th 8th 10th 12th
e6a How many times in the past 12 months have you attacked someone with the idea of seriously hurting them?
0 times Count
% within x2 Grade
1 or 2 times Count
% within x2 Grade
3 to 5 times Count
% within x2 Grade
6 to 9 times Count
% within x2 Grade
10 to 19 times Count
% within x2 Grade
20 to 39 times Count
% within x2 Grade
40 or more times Count
% within x2 Grade
Total Count
% within x2 Grade
2096 2187 2494 1935 8712
92.8% 91.2% 92.8% 94.5% 92.8%
117 150 126 78 471
5.2% 6.3% 4.7% 3.8% 5.0%
22 35 29 20 106
1.0% 1.5% 1.1% 1.0% 1.1%
8 11 14 4 37
0.4% 0.5% 0.5% 0.2% 0.4%
6 6 6 1 19
0.3% 0.3% 0.2% 0.0% 0.2%
1 3 6 2 12
0.0% 0.1% 0.2% 0.1% 0.1%
8 7 12 8 35
0.4% 0.3% 0.4% 0.4% 0.4%
2258 2399 2687 2048 9392
100.0% 100.0% 100.0% 100.0% 100.0%
Page 121

e6b How many times in the past 12 months have you been arrested? * x2 Grade Crosstabulation
x2 Grade
Total6th 8th 10th 12th
e6b How many times in the past 12 months have you been arrested?
0 times Count
% within x2 Grade
1 or 2 times Count
% within x2 Grade
3 to 5 times Count
% within x2 Grade
6 to 9 times Count
% within x2 Grade
10 to 19 times Count
% within x2 Grade
20 to 39 times Count
% within x2 Grade
40 or more times Count
% within x2 Grade
Total Count
% within x2 Grade
2214 2304 2551 1964 9033
98.1% 96.4% 95.0% 96.2% 96.4%
31 68 106 60 265
1.4% 2.8% 3.9% 2.9% 2.8%
2 13 10 6 31
0.1% 0.5% 0.4% 0.3% 0.3%
8 1 6 4 19
0.4% 0.0% 0.2% 0.2% 0.2%
1 2 5 4 12
0.0% 0.1% 0.2% 0.2% 0.1%
1 0 2 1 4
0.0% 0.0% 0.1% 0.0% 0.0%
0 3 4 2 9
0.0% 0.1% 0.1% 0.1% 0.1%
2257 2391 2684 2041 9373
100.0% 100.0% 100.0% 100.0% 100.0%
Page 122

e6c How many times in the past 12 months have you been drunk or high at school? * x2 Grade Crosstabulation
x2 Grade
Total6th 8th 10th 12th
e6c How many times in the past 12 months have you been drunk or high at school?
0 times Count
% within x2 Grade
1 or 2 times Count
% within x2 Grade
3 to 5 times Count
% within x2 Grade
6 to 9 times Count
% within x2 Grade
10 to 19 times Count
% within x2 Grade
20 to 39 times Count
% within x2 Grade
40 or more times Count
% within x2 Grade
Total Count
% within x2 Grade
2219 2304 2454 1752 8729
99.1% 96.4% 91.8% 85.8% 93.4%
8 59 126 137 330
0.4% 2.5% 4.7% 6.7% 3.5%
9 16 38 50 113
0.4% 0.7% 1.4% 2.4% 1.2%
0 2 20 37 59
0.0% 0.1% 0.7% 1.8% 0.6%
1 4 10 21 36
0.0% 0.2% 0.4% 1.0% 0.4%
1 1 8 9 19
0.0% 0.0% 0.3% 0.4% 0.2%
1 4 18 36 59
0.0% 0.2% 0.7% 1.8% 0.6%
2239 2390 2674 2042 9345
100.0% 100.0% 100.0% 100.0% 100.0%
Page 123

e6d How many times in the past 12 months have you been suspended from school? * x2 Grade Crosstabulation
x2 Grade
Total6th 8th 10th 12th
e6d How many times in the past 12 months have you been suspended from school?
0 times Count
% within x2 Grade
1 or 2 times Count
% within x2 Grade
3 to 5 times Count
% within x2 Grade
6 to 9 times Count
% within x2 Grade
10 to 19 times Count
% within x2 Grade
20 to 39 times Count
% within x2 Grade
40 or more times Count
% within x2 Grade
Total Count
% within x2 Grade
1926 1993 2363 1865 8147
85.7% 83.2% 88.4% 91.4% 87.1%
214 253 199 122 788
9.5% 10.6% 7.4% 6.0% 8.4%
58 67 59 26 210
2.6% 2.8% 2.2% 1.3% 2.2%
22 33 22 11 88
1.0% 1.4% 0.8% 0.5% 0.9%
15 30 14 13 72
0.7% 1.3% 0.5% 0.6% 0.8%
5 10 2 2 19
0.2% 0.4% 0.1% 0.1% 0.2%
8 10 13 1 32
0.4% 0.4% 0.5% 0.0% 0.3%
2248 2396 2672 2040 9356
100.0% 100.0% 100.0% 100.0% 100.0%
Page 124

e6e How many times in the past 12 months have you sold illegal drugs? * x2 Grade Crosstabulation
x2 Grade
Total6th 8th 10th 12th
e6e How many times in the past 12 months have you sold illegal drugs?
0 times Count
% within x2 Grade
1 or 2 times Count
% within x2 Grade
3 to 5 times Count
% within x2 Grade
6 to 9 times Count
% within x2 Grade
10 to 19 times Count
% within x2 Grade
20 to 39 times Count
% within x2 Grade
40 or more times Count
% within x2 Grade
Total Count
% within x2 Grade
2227 2347 2561 1920 9055
99.6% 98.5% 95.9% 94.0% 97.0%
5 21 53 42 121
0.2% 0.9% 2.0% 2.1% 1.3%
1 4 19 21 45
0.0% 0.2% 0.7% 1.0% 0.5%
0 4 6 13 23
0.0% 0.2% 0.2% 0.6% 0.2%
2 1 8 11 22
0.1% 0.0% 0.3% 0.5% 0.2%
1 1 14 11 27
0.0% 0.0% 0.5% 0.5% 0.3%
1 4 10 24 39
0.0% 0.2% 0.4% 1.2% 0.4%
2237 2382 2671 2042 9332
100.0% 100.0% 100.0% 100.0% 100.0%
Page 125
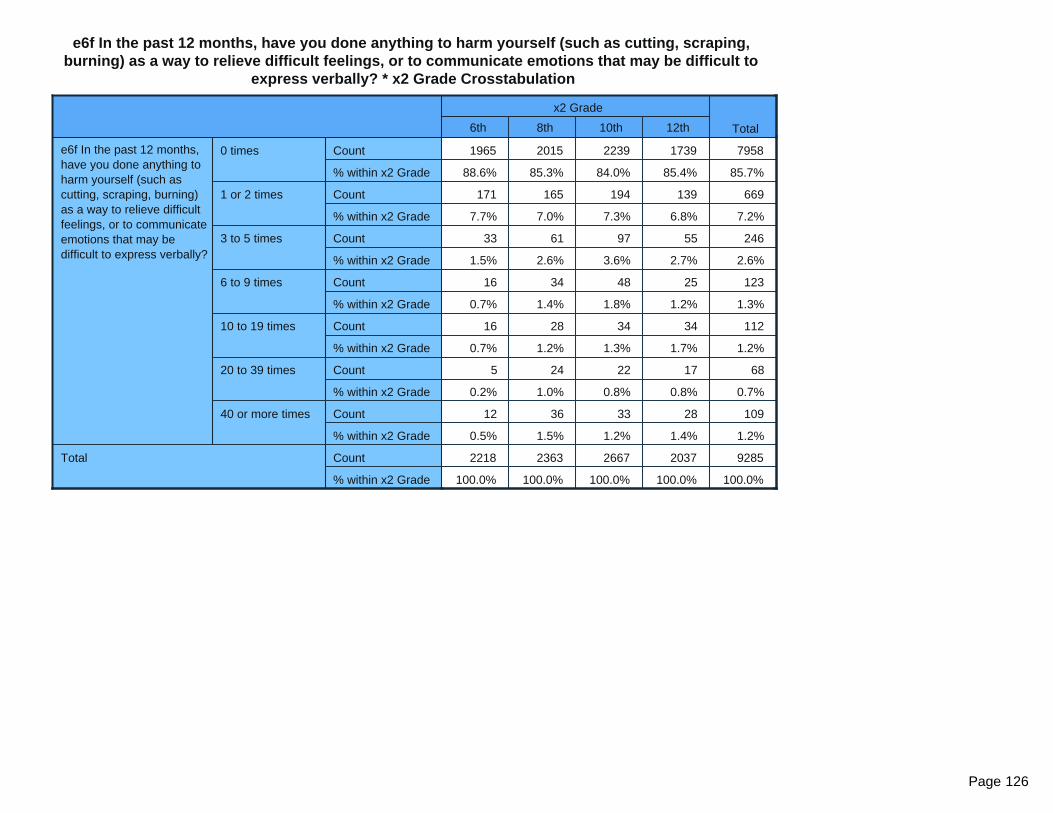
e6f In the past 12 months, have you done anything to harm yourself (such as cutting, scraping, burning) as a way to relieve difficult feelings, or to communicate emotions that may be difficult to
express verbally? * x2 Grade Crosstabulation
x2 Grade
Total6th 8th 10th 12th
e6f In the past 12 months, have you done anything to harm yourself (such as cutting, scraping, burning) as a way to relieve difficult feelings, or to communicate emotions that may be difficult to express verbally?
0 times Count
% within x2 Grade
1 or 2 times Count
% within x2 Grade
3 to 5 times Count
% within x2 Grade
6 to 9 times Count
% within x2 Grade
10 to 19 times Count
% within x2 Grade
20 to 39 times Count
% within x2 Grade
40 or more times Count
% within x2 Grade
Total Count
% within x2 Grade
1965 2015 2239 1739 7958
88.6% 85.3% 84.0% 85.4% 85.7%
171 165 194 139 669
7.7% 7.0% 7.3% 6.8% 7.2%
33 61 97 55 246
1.5% 2.6% 3.6% 2.7% 2.6%
16 34 48 25 123
0.7% 1.4% 1.8% 1.2% 1.3%
16 28 34 34 112
0.7% 1.2% 1.3% 1.7% 1.2%
5 24 22 17 68
0.2% 1.0% 0.8% 0.8% 0.7%
12 36 33 28 109
0.5% 1.5% 1.2% 1.4% 1.2%
2218 2363 2667 2037 9285
100.0% 100.0% 100.0% 100.0% 100.0%
Page 126

e7 In the past 12 months, have you or your family lived in a shelter, hotel, motel, car, campground, or someone else's home, etc. due to loss of housing, lack of money, or did not have another place to stay? *
x2 Grade Crosstabulation
x2 Grade
Total6th 8th 10th 12th
e7 In the past 12 months, have you or your family lived in a shelter, hotel, motel, car, campground, or someone else's home, etc. due to loss of housing, lack of money, or did not have another place to stay?
No Count
% within x2 Grade
Yes, but for less than a month
Count
% within x2 Grade
Yes, but for more than a month
Count
% within x2 Grade
Yes, for most of the year Count
% within x2 Grade
Total Count
% within x2 Grade
2087 2255 2595 1980 8917
93.8% 95.3% 97.3% 97.0% 95.9%
74 55 31 22 182
3.3% 2.3% 1.2% 1.1% 2.0%
33 25 25 17 100
1.5% 1.1% 0.9% 0.8% 1.1%
30 32 17 22 101
1.3% 1.4% 0.6% 1.1% 1.1%
2224 2367 2668 2041 9300
100.0% 100.0% 100.0% 100.0% 100.0%
e8 In the past 12 months, did you ever live away from your parents or guardians because you were kicked out, ran away, or were abandoned? * x2 Grade Crosstabulation
x2 Grade
Total6th 8th 10th 12th
e8 In the past 12 months, did you ever live away from your parents or guardians because you were kicked out, ran away, or were abandoned?
Yes Count
% within x2 Grade
No Count
% within x2 Grade
Total Count
% within x2 Grade
68 112 174 175 529
3.1% 4.7% 6.5% 8.6% 5.7%
2152 2258 2493 1866 8769
96.9% 95.3% 93.5% 91.4% 94.3%
2220 2370 2667 2041 9298
100.0% 100.0% 100.0% 100.0% 100.0%
Page 127
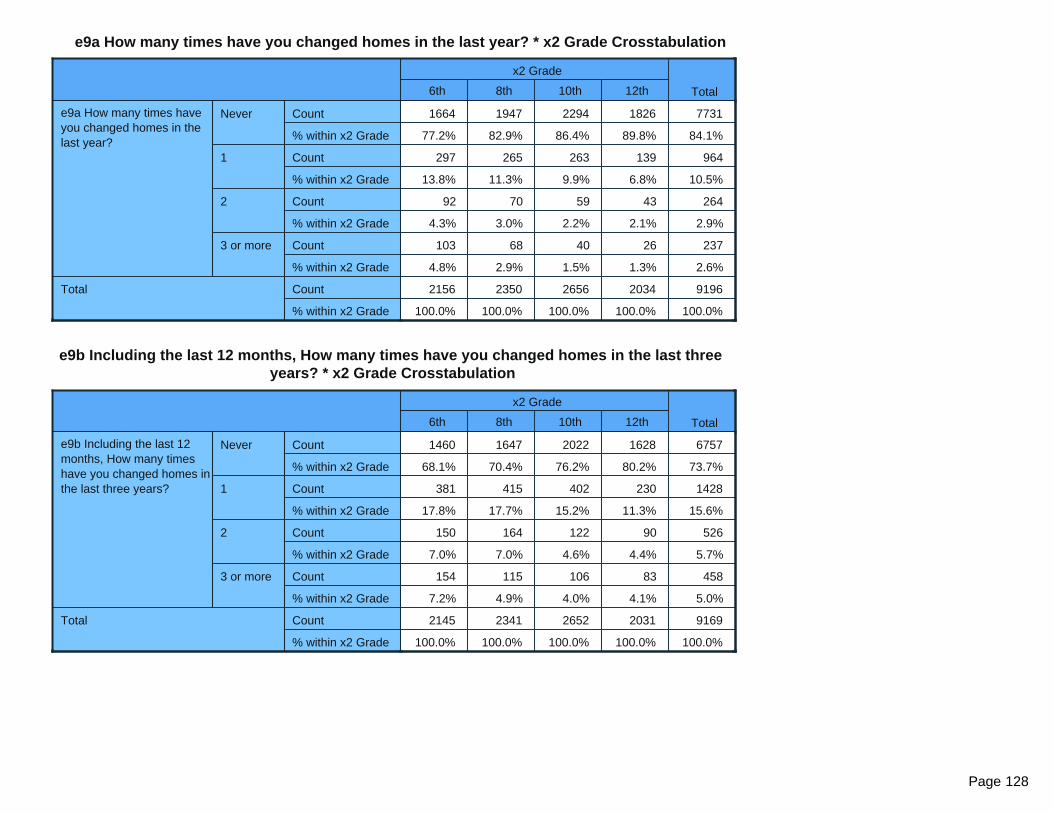
e9a How many times have you changed homes in the last year? * x2 Grade Crosstabulation
x2 Grade
Total6th 8th 10th 12th
e9a How many times have you changed homes in the last year?
Never Count
% within x2 Grade
1 Count
% within x2 Grade
2 Count
% within x2 Grade
3 or more Count
% within x2 Grade
Total Count
% within x2 Grade
1664 1947 2294 1826 7731
77.2% 82.9% 86.4% 89.8% 84.1%
297 265 263 139 964
13.8% 11.3% 9.9% 6.8% 10.5%
92 70 59 43 264
4.3% 3.0% 2.2% 2.1% 2.9%
103 68 40 26 237
4.8% 2.9% 1.5% 1.3% 2.6%
2156 2350 2656 2034 9196
100.0% 100.0% 100.0% 100.0% 100.0%
e9b Including the last 12 months, How many times have you changed homes in the last three years? * x2 Grade Crosstabulation
x2 Grade
Total6th 8th 10th 12th
e9b Including the last 12 months, How many times have you changed homes in the last three years?
Never Count
% within x2 Grade
1 Count
% within x2 Grade
2 Count
% within x2 Grade
3 or more Count
% within x2 Grade
Total Count
% within x2 Grade
1460 1647 2022 1628 6757
68.1% 70.4% 76.2% 80.2% 73.7%
381 415 402 230 1428
17.8% 17.7% 15.2% 11.3% 15.6%
150 164 122 90 526
7.0% 7.0% 4.6% 4.4% 5.7%
154 115 106 83 458
7.2% 4.9% 4.0% 4.1% 5.0%
2145 2341 2652 2031 9169
100.0% 100.0% 100.0% 100.0% 100.0%
Page 128

c1 I like to see how much I can get away with. * x2 Grade Crosstabulation
x2 Grade
Total6th 8th 10th 12th
c1 I like to see how much I can get away with.
Very false Count
% within x2 Grade
Somewhat false Count
% within x2 Grade
Somewhat true Count
% within x2 Grade
Very true Count
% within x2 Grade
Total Count
% within x2 Grade
2188 1650 1460 1057 6355
72.9% 53.5% 42.4% 39.5% 52.1%
438 751 953 744 2886
14.6% 24.4% 27.7% 27.8% 23.7%
301 542 847 692 2382
10.0% 17.6% 24.6% 25.9% 19.5%
75 141 180 180 576
2.5% 4.6% 5.2% 6.7% 4.7%
3002 3084 3440 2673 12199
100.0% 100.0% 100.0% 100.0% 100.0%
c2 I ignore the rules that get in my way. * x2 Grade Crosstabulation
x2 Grade
Total6th 8th 10th 12th
c2 I ignore the rules that get in my way.
Very false Count
% within x2 Grade
Somewhat false Count
% within x2 Grade
Somewhat true Count
% within x2 Grade
Very true Count
% within x2 Grade
Total Count
% within x2 Grade
2255 1731 1645 1133 6764
73.9% 56.0% 47.9% 42.5% 55.3%
470 815 1043 895 3223
15.4% 26.4% 30.4% 33.6% 26.3%
250 434 614 526 1824
8.2% 14.0% 17.9% 19.7% 14.9%
75 112 132 111 430
2.5% 3.6% 3.8% 4.2% 3.5%
3050 3092 3434 2665 12241
100.0% 100.0% 100.0% 100.0% 100.0%
Page 129

c3 I do the opposite of what people tell me, just to get them mad. * x2 Grade Crosstabulation
x2 Grade
Total6th 8th 10th 12th
c3 I do the opposite of what people tell me, just to get them mad.
Very false Count
% within x2 Grade
Somewhat false Count
% within x2 Grade
Somewhat true Count
% within x2 Grade
Very true Count
% within x2 Grade
Total Count
% within x2 Grade
2217 1839 2022 1639 7717
72.7% 59.6% 59.0% 61.4% 63.1%
484 725 875 612 2696
15.9% 23.5% 25.5% 22.9% 22.0%
263 399 421 340 1423
8.6% 12.9% 12.3% 12.7% 11.6%
84 125 108 78 395
2.8% 4.0% 3.2% 2.9% 3.2%
3048 3088 3426 2669 12231
100.0% 100.0% 100.0% 100.0% 100.0%
c4 In the past 12 months have you felt depressed or sad MOST days, even if you feel OK sometimes? * x2 Grade Crosstabulation
x2 Grade
Total6th 8th 10th 12th
c4 In the past 12 months have you felt depressed or sad MOST days, even if you feel OK sometimes?
NO! Count
% within x2 Grade
no Count
% within x2 Grade
yes Count
% within x2 Grade
YES! Count
% within x2 Grade
Total Count
% within x2 Grade
1197 1112 976 772 4057
39.2% 36.0% 28.5% 28.9% 33.2%
747 809 1004 745 3305
24.5% 26.2% 29.4% 27.9% 27.0%
765 719 878 689 3051
25.1% 23.3% 25.7% 25.8% 25.0%
342 450 562 461 1815
11.2% 14.6% 16.4% 17.3% 14.8%
3051 3090 3420 2667 12228
100.0% 100.0% 100.0% 100.0% 100.0%
Page 130
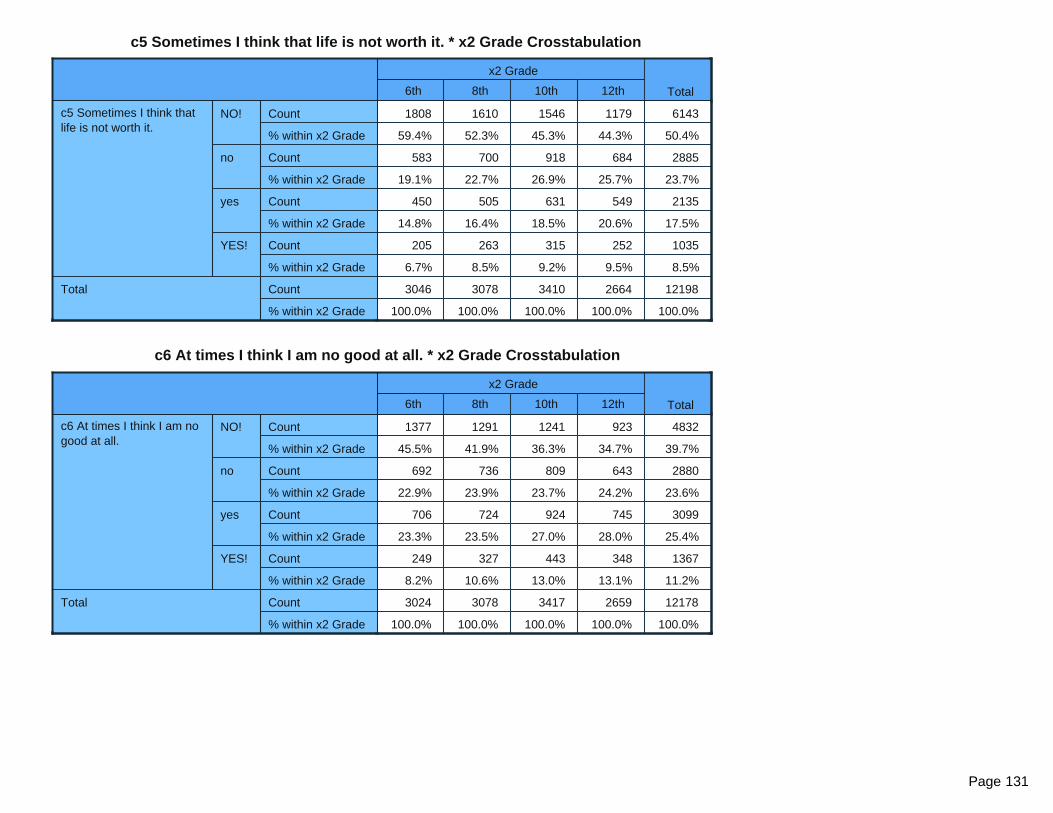
c5 Sometimes I think that life is not worth it. * x2 Grade Crosstabulation
x2 Grade
Total6th 8th 10th 12th
c5 Sometimes I think that life is not worth it.
NO! Count
% within x2 Grade
no Count
% within x2 Grade
yes Count
% within x2 Grade
YES! Count
% within x2 Grade
Total Count
% within x2 Grade
1808 1610 1546 1179 6143
59.4% 52.3% 45.3% 44.3% 50.4%
583 700 918 684 2885
19.1% 22.7% 26.9% 25.7% 23.7%
450 505 631 549 2135
14.8% 16.4% 18.5% 20.6% 17.5%
205 263 315 252 1035
6.7% 8.5% 9.2% 9.5% 8.5%
3046 3078 3410 2664 12198
100.0% 100.0% 100.0% 100.0% 100.0%
c6 At times I think I am no good at all. * x2 Grade Crosstabulation
x2 Grade
Total6th 8th 10th 12th
c6 At times I think I am no good at all.
NO! Count
% within x2 Grade
no Count
% within x2 Grade
yes Count
% within x2 Grade
YES! Count
% within x2 Grade
Total Count
% within x2 Grade
1377 1291 1241 923 4832
45.5% 41.9% 36.3% 34.7% 39.7%
692 736 809 643 2880
22.9% 23.9% 23.7% 24.2% 23.6%
706 724 924 745 3099
23.3% 23.5% 27.0% 28.0% 25.4%
249 327 443 348 1367
8.2% 10.6% 13.0% 13.1% 11.2%
3024 3078 3417 2659 12178
100.0% 100.0% 100.0% 100.0% 100.0%
Page 131

c7 All in all, I am inclined to think that I am a failure. * x2 Grade Crosstabulation
x2 Grade
Total6th 8th 10th 12th
c7 All in all, I am inclined to think that I am a failure.
NO! Count
% within x2 Grade
no Count
% within x2 Grade
yes Count
% within x2 Grade
YES! Count
% within x2 Grade
Total Count
% within x2 Grade
1786 1627 1487 1118 6018
60.0% 52.9% 43.8% 42.1% 49.7%
707 854 1081 873 3515
23.7% 27.7% 31.8% 32.8% 29.0%
319 372 510 424 1625
10.7% 12.1% 15.0% 16.0% 13.4%
167 225 317 243 952
5.6% 7.3% 9.3% 9.1% 7.9%
2979 3078 3395 2658 12110
100.0% 100.0% 100.0% 100.0% 100.0%
c8a How much do you think people risk harming themselves if they take 1-2 alcoholic drinks nearly every day? * x2 Grade Crosstabulation
x2 Grade
Total6th 8th 10th 12th
c8a How much do you think people risk harming themselves if they take 1-2 alcoholic drinks nearly every day?
No risk Count
% within x2 Grade
Slight risk Count
% within x2 Grade
Moderate risk Count
% within x2 Grade
Great risk Count
% within x2 Grade
Total Count
% within x2 Grade
643 409 358 343 1753
22.5% 13.5% 10.6% 13.0% 14.7%
429 556 646 577 2208
15.0% 18.4% 19.1% 21.8% 18.5%
635 841 1051 805 3332
22.2% 27.8% 31.0% 30.4% 27.9%
1155 1220 1336 922 4633
40.4% 40.3% 39.4% 34.8% 38.8%
2862 3026 3391 2647 11926
100.0% 100.0% 100.0% 100.0% 100.0%
Page 132

c8b How much do you think people risk harming themselves if they drink 5 or more drinks once or twice a week? * x2 Grade Crosstabulation
x2 Grade
Total6th 8th 10th 12th
c8b How much do you think people risk harming themselves if they drink 5 or more drinks once or twice a week?
No risk Count
% within x2 Grade
Slight risk Count
% within x2 Grade
Moderate risk Count
% within x2 Grade
Great risk Count
% within x2 Grade
Total Count
% within x2 Grade
629 395 310 335 1669
22.1% 13.2% 9.2% 12.7% 14.1%
328 416 565 510 1819
11.5% 13.9% 16.7% 19.3% 15.3%
678 912 1167 888 3645
23.8% 30.4% 34.5% 33.7% 30.7%
1208 1279 1338 905 4730
42.5% 42.6% 39.6% 34.3% 39.9%
2843 3002 3380 2638 11863
100.0% 100.0% 100.0% 100.0% 100.0%
c8c How much do you think people risk harming themselves if they smoke one or more packs of cigarettes per day * x2 Grade Crosstabulation
x2 Grade
Total6th 8th 10th 12th
c8c How much do you think people risk harming themselves if they smoke one or more packs of cigarettes per day
No risk Count
% within x2 Grade
Slight risk Count
% within x2 Grade
Moderate risk Count
% within x2 Grade
Great risk Count
% within x2 Grade
Total Count
% within x2 Grade
617 392 284 275 1568
21.6% 13.1% 8.4% 10.4% 13.2%
184 202 280 230 896
6.5% 6.8% 8.3% 8.7% 7.6%
396 504 572 444 1916
13.9% 16.8% 16.9% 16.8% 16.2%
1654 1894 2245 1689 7482
58.0% 63.3% 66.4% 64.0% 63.1%
2851 2992 3381 2638 11862
100.0% 100.0% 100.0% 100.0% 100.0%
Page 133

c8d How much do you think people risk harming themselves if they try marijuana once or twice? * x2 Grade Crosstabulation
x2 Grade
Total6th 8th 10th 12th
c8d How much do you think people risk harming themselves if they try marijuana once or twice?
No risk Count
% within x2 Grade
Slight risk Count
% within x2 Grade
Moderate risk Count
% within x2 Grade
Great risk Count
% within x2 Grade
Total Count
% within x2 Grade
740 769 1373 1460 4342
26.4% 25.7% 40.7% 55.5% 36.8%
509 806 1011 621 2947
18.1% 26.9% 30.0% 23.6% 25.0%
563 610 437 251 1861
20.1% 20.4% 13.0% 9.5% 15.8%
994 807 550 299 2650
35.4% 27.0% 16.3% 11.4% 22.5%
2806 2992 3371 2631 11800
100.0% 100.0% 100.0% 100.0% 100.0%
c8e How much do you think people risk harming themselves if they smoke marijuana once or twice a week? * x2 Grade Crosstabulation
x2 Grade
Total6th 8th 10th 12th
c8e How much do you think people risk harming themselves if they smoke marijuana once or twice a week?
No risk Count
% within x2 Grade
Slight risk Count
% within x2 Grade
Moderate risk Count
% within x2 Grade
Great risk Count
% within x2 Grade
Total Count
% within x2 Grade
652 572 922 988 3134
23.3% 19.2% 27.5% 37.7% 26.7%
272 504 882 752 2410
9.7% 16.9% 26.3% 28.7% 20.5%
582 777 819 494 2672
20.8% 26.1% 24.4% 18.8% 22.7%
1290 1127 735 390 3542
46.1% 37.8% 21.9% 14.9% 30.1%
2796 2980 3358 2624 11758
100.0% 100.0% 100.0% 100.0% 100.0%
Page 134

c8f How much do you think people risk harming themselves if they smoke marijuana regularly? * x2 Grade Crosstabulation
x2 Grade
Total6th 8th 10th 12th
c8f How much do you think people risk harming themselves if they smoke marijuana regularly?
No risk Count
% within x2 Grade
Slight risk Count
% within x2 Grade
Moderate risk Count
% within x2 Grade
Great risk Count
% within x2 Grade
Total Count
% within x2 Grade
640 489 670 716 2515
22.9% 16.4% 20.0% 27.3% 21.4%
127 254 567 605 1553
4.5% 8.5% 16.9% 23.1% 13.2%
265 471 813 590 2139
9.5% 15.8% 24.2% 22.5% 18.2%
1762 1766 1308 713 5549
63.1% 59.3% 39.0% 27.2% 47.2%
2794 2980 3358 2624 11756
100.0% 100.0% 100.0% 100.0% 100.0%
c8g How much do you think people risk harming themselves if they use prescription drugs that are not prescribed to them? * x2 Grade Crosstabulation
x2 Grade
Total6th 8th 10th 12th
c8g How much do you think people risk harming themselves if they use prescription drugs that are not prescribed to them?
No risk Count
% within x2 Grade
Slight risk Count
% within x2 Grade
Moderate risk Count
% within x2 Grade
Great risk Count
% within x2 Grade
Total Count
% within x2 Grade
606 377 238 191 1412
21.6% 12.7% 7.1% 7.3% 12.0%
205 243 210 205 863
7.3% 8.2% 6.3% 7.8% 7.3%
514 637 656 525 2332
18.4% 21.4% 19.6% 20.0% 19.9%
1476 1718 2244 1698 7136
52.7% 57.7% 67.0% 64.8% 60.8%
2801 2975 3348 2619 11743
100.0% 100.0% 100.0% 100.0% 100.0%
Page 135

c9 How often do you attend religious services or activities? * x2 Grade Crosstabulation
x2 Grade
Total6th 8th 10th 12th
c9 How often do you attend religious services or activities?
Never Count
% within x2 Grade
Rarely Count
% within x2 Grade
1-2 times a month Count
% within x2 Grade
Once a week or more Count
% within x2 Grade
Total Count
% within x2 Grade
839 855 1105 1001 3800
29.9% 28.3% 32.7% 38.0% 32.1%
803 988 1133 881 3805
28.6% 32.7% 33.5% 33.5% 32.1%
392 488 482 322 1684
14.0% 16.2% 14.3% 12.2% 14.2%
774 686 659 429 2548
27.6% 22.7% 19.5% 16.3% 21.5%
2808 3017 3379 2633 11837
100.0% 100.0% 100.0% 100.0% 100.0%
c10a How wrong do you think it is for someone your age to stay away from school all day when their parents think they are at school? * x2 Grade Crosstabulation
x2 Grade
Total6th 8th 10th 12th
c10a How wrong do you think it is for someone your age to stay away from school all day when their parents think they are at school?
Not Wrong at All Count
% within x2 Grade
A Little Bit Wrong Count
% within x2 Grade
Wrong Count
% within x2 Grade
Very wrong Count
% within x2 Grade
Total Count
% within x2 Grade
127 140 147 166 580
4.4% 4.6% 4.3% 6.3% 4.8%
142 332 580 622 1676
4.9% 11.0% 17.1% 23.6% 14.0%
569 990 1277 943 3779
19.6% 32.7% 37.6% 35.8% 31.6%
2065 1568 1388 905 5926
71.1% 51.7% 40.9% 34.3% 49.5%
2903 3030 3392 2636 11961
100.0% 100.0% 100.0% 100.0% 100.0%
Page 136

c10b How wrong do you think it is for someone your age to take a handgun to school? * x2 Grade Crosstabulation
x2 Grade
Total6th 8th 10th 12th
c10b How wrong do you think it is for someone your age to take a handgun to school?
Not Wrong at All Count
% within x2 Grade
A Little Bit Wrong Count
% within x2 Grade
Wrong Count
% within x2 Grade
Very wrong Count
% within x2 Grade
Total Count
% within x2 Grade
113 102 103 94 412
3.9% 3.4% 3.0% 3.6% 3.4%
28 50 31 26 135
1.0% 1.6% 0.9% 1.0% 1.1%
108 195 176 133 612
3.7% 6.4% 5.2% 5.0% 5.1%
2652 2689 3074 2384 10799
91.4% 88.6% 90.8% 90.4% 90.3%
2901 3036 3384 2637 11958
100.0% 100.0% 100.0% 100.0% 100.0%
c10c How wrong do you think it is for someone your age to steal anything worth more than $5? * x2 Grade Crosstabulation
x2 Grade
Total6th 8th 10th 12th
c10c How wrong do you think it is for someone your age to steal anything worth more than $5?
Not Wrong at All Count
% within x2 Grade
A Little Bit Wrong Count
% within x2 Grade
Wrong Count
% within x2 Grade
Very wrong Count
% within x2 Grade
Total Count
% within x2 Grade
114 137 140 131 522
4.0% 4.5% 4.2% 5.0% 4.4%
176 355 490 356 1377
6.1% 11.8% 14.5% 13.5% 11.6%
711 1018 1246 949 3924
24.7% 33.8% 37.0% 36.1% 33.0%
1878 1504 1496 1194 6072
65.2% 49.9% 44.4% 45.4% 51.0%
2879 3014 3372 2630 11895
100.0% 100.0% 100.0% 100.0% 100.0%
Page 137
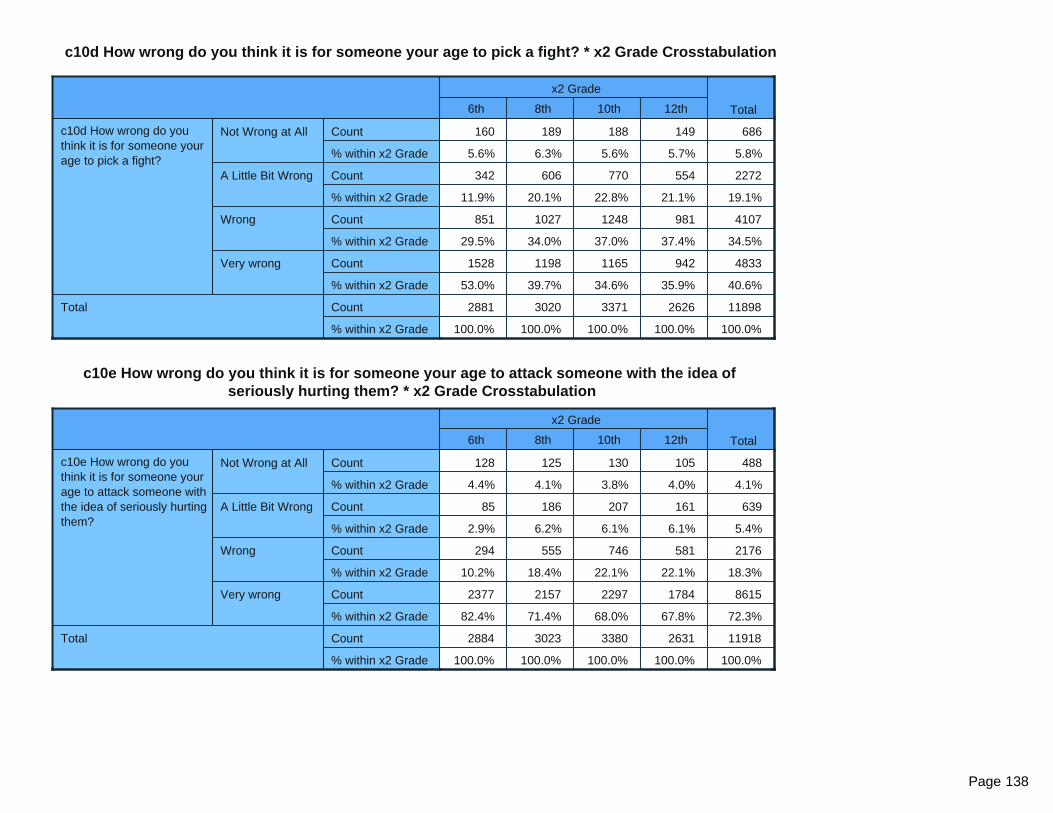
c10d How wrong do you think it is for someone your age to pick a fight? * x2 Grade Crosstabulation
x2 Grade
Total6th 8th 10th 12th
c10d How wrong do you think it is for someone your age to pick a fight?
Not Wrong at All Count
% within x2 Grade
A Little Bit Wrong Count
% within x2 Grade
Wrong Count
% within x2 Grade
Very wrong Count
% within x2 Grade
Total Count
% within x2 Grade
160 189 188 149 686
5.6% 6.3% 5.6% 5.7% 5.8%
342 606 770 554 2272
11.9% 20.1% 22.8% 21.1% 19.1%
851 1027 1248 981 4107
29.5% 34.0% 37.0% 37.4% 34.5%
1528 1198 1165 942 4833
53.0% 39.7% 34.6% 35.9% 40.6%
2881 3020 3371 2626 11898
100.0% 100.0% 100.0% 100.0% 100.0%
c10e How wrong do you think it is for someone your age to attack someone with the idea of seriously hurting them? * x2 Grade Crosstabulation
x2 Grade
Total6th 8th 10th 12th
c10e How wrong do you think it is for someone your age to attack someone with the idea of seriously hurting them?
Not Wrong at All Count
% within x2 Grade
A Little Bit Wrong Count
% within x2 Grade
Wrong Count
% within x2 Grade
Very wrong Count
% within x2 Grade
Total Count
% within x2 Grade
128 125 130 105 488
4.4% 4.1% 3.8% 4.0% 4.1%
85 186 207 161 639
2.9% 6.2% 6.1% 6.1% 5.4%
294 555 746 581 2176
10.2% 18.4% 22.1% 22.1% 18.3%
2377 2157 2297 1784 8615
82.4% 71.4% 68.0% 67.8% 72.3%
2884 3023 3380 2631 11918
100.0% 100.0% 100.0% 100.0% 100.0%
Page 138

c10f How wrong do you think it is for someone your age to drink beer, wine or hard liquor regularly? * x2 Grade Crosstabulation
x2 Grade
Total6th 8th 10th 12th
c10f How wrong do you think it is for someone your age to drink beer, wine or hard liquor regularly?
Not Wrong at All Count
% within x2 Grade
A Little Bit Wrong Count
% within x2 Grade
Wrong Count
% within x2 Grade
Very wrong Count
% within x2 Grade
Total Count
% within x2 Grade
113 139 194 284 730
3.9% 4.6% 5.8% 10.8% 6.1%
55 208 568 571 1402
1.9% 6.9% 16.8% 21.7% 11.8%
241 595 1001 811 2648
8.4% 19.7% 29.7% 30.8% 22.2%
2474 2077 1610 964 7125
85.8% 68.8% 47.7% 36.7% 59.8%
2883 3019 3373 2630 11905
100.0% 100.0% 100.0% 100.0% 100.0%
c10g How wrong do you think it is for someone your age to smoke cigarettes? * x2 Grade Crosstabulation
x2 Grade
Total6th 8th 10th 12th
c10g How wrong do you think it is for someone your age to smoke cigarettes?
Not Wrong at All Count
% within x2 Grade
A Little Bit Wrong Count
% within x2 Grade
Wrong Count
% within x2 Grade
Very wrong Count
% within x2 Grade
Total Count
% within x2 Grade
106 117 130 188 541
3.7% 3.9% 3.9% 7.2% 4.6%
72 120 266 326 784
2.5% 4.0% 7.9% 12.4% 6.6%
267 505 801 678 2251
9.3% 16.8% 23.8% 25.8% 19.0%
2428 2263 2169 1434 8294
84.5% 75.3% 64.4% 54.6% 69.9%
2873 3005 3366 2626 11870
100.0% 100.0% 100.0% 100.0% 100.0%
Page 139

c10h How wrong do you think it is for someone your age to use LSD, cocaine, amphetamines or another illegal drug? * x2 Grade Crosstabulation
x2 Grade
Total6th 8th 10th 12th
c10h How wrong do you think it is for someone your age to use LSD, cocaine, amphetamines or another illegal drug?
Not Wrong at All Count
% within x2 Grade
A Little Bit Wrong Count
% within x2 Grade
Wrong Count
% within x2 Grade
Very wrong Count
% within x2 Grade
Total Count
% within x2 Grade
102 101 104 121 428
3.6% 3.4% 3.1% 4.6% 3.6%
15 59 113 187 374
0.5% 2.0% 3.4% 7.1% 3.2%
114 325 436 433 1308
4.0% 10.8% 12.9% 16.5% 11.0%
2632 2516 2717 1884 9749
91.9% 83.8% 80.6% 71.8% 82.2%
2863 3001 3370 2625 11859
100.0% 100.0% 100.0% 100.0% 100.0%
c10i How wrong do you think it is for someone your age to smoke marijuana? * x2 Grade Crosstabulation
x2 Grade
Total6th 8th 10th 12th
c10i How wrong do you think it is for someone your age to smoke marijuana?
Not Wrong at All Count
% within x2 Grade
A Little Bit Wrong Count
% within x2 Grade
Wrong Count
% within x2 Grade
Very wrong Count
% within x2 Grade
Total Count
% within x2 Grade
113 244 682 861 1900
4.0% 8.1% 20.2% 32.7% 16.0%
62 300 802 712 1876
2.2% 10.0% 23.8% 27.0% 15.8%
186 451 659 413 1709
6.5% 15.0% 19.5% 15.7% 14.4%
2491 2012 1229 647 6379
87.3% 66.9% 36.4% 24.6% 53.8%
2852 3007 3372 2633 11864
100.0% 100.0% 100.0% 100.0% 100.0%
Page 140

c11a How many times have you done what feels good no matter what? * x2 Grade Crosstabulation
x2 Grade
Total6th 8th 10th 12th
c11a How many times have you done what feels good no matter what?
Never Count
% within x2 Grade
I've done it, but not in the past year
Count
% within x2 Grade
Less than once a month Count
% within x2 Grade
About once a month Count
% within x2 Grade
2 or 3 times a month Count
% within x2 Grade
Once a week or more Count
% within x2 Grade
Total Count
% within x2 Grade
1650 1693 1559 1004 5906
64.4% 59.2% 48.3% 39.4% 52.7%
309 312 420 283 1324
12.1% 10.9% 13.0% 11.1% 11.8%
113 243 372 385 1113
4.4% 8.5% 11.5% 15.1% 9.9%
89 162 281 287 819
3.5% 5.7% 8.7% 11.3% 7.3%
146 165 279 272 862
5.7% 5.8% 8.6% 10.7% 7.7%
257 284 318 320 1179
10.0% 9.9% 9.8% 12.5% 10.5%
2564 2859 3229 2551 11203
100.0% 100.0% 100.0% 100.0% 100.0%
Page 141

c11b How many times have you done something dangerous because someone dared you to do it? * x2 Grade Crosstabulation
x2 Grade
Total6th 8th 10th 12th
c11b How many times have you done something dangerous because someone dared you to do it?
Never Count
% within x2 Grade
I've done it, but not in the past year
Count
% within x2 Grade
Less than once a month Count
% within x2 Grade
About once a month Count
% within x2 Grade
2 or 3 times a month Count
% within x2 Grade
Once a week or more Count
% within x2 Grade
Total Count
% within x2 Grade
2211 2004 1983 1545 7743
78.7% 67.3% 59.5% 59.2% 66.0%
377 508 654 507 2046
13.4% 17.1% 19.6% 19.4% 17.4%
102 219 371 318 1010
3.6% 7.4% 11.1% 12.2% 8.6%
42 91 162 130 425
1.5% 3.1% 4.9% 5.0% 3.6%
42 87 110 68 307
1.5% 2.9% 3.3% 2.6% 2.6%
36 67 53 41 197
1.3% 2.3% 1.6% 1.6% 1.7%
2810 2976 3333 2609 11728
100.0% 100.0% 100.0% 100.0% 100.0%
Page 142
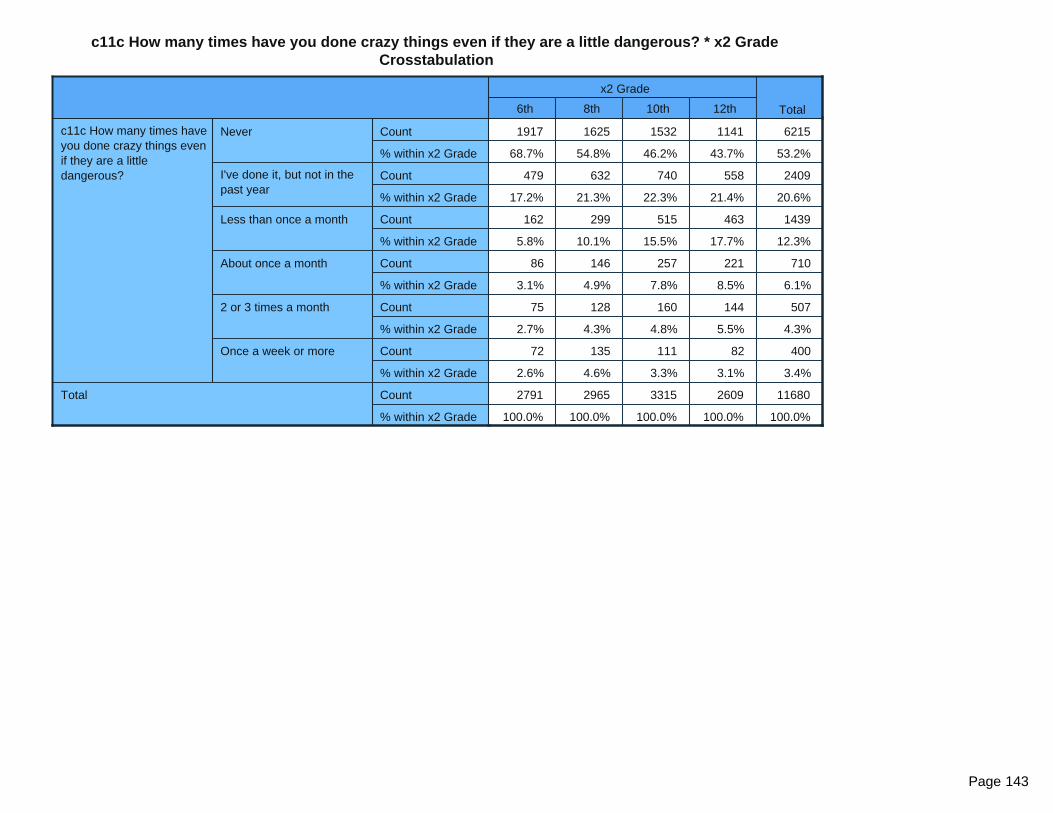
c11c How many times have you done crazy things even if they are a little dangerous? * x2 Grade Crosstabulation
x2 Grade
Total6th 8th 10th 12th
c11c How many times have you done crazy things even if they are a little dangerous?
Never Count
% within x2 Grade
I've done it, but not in the past year
Count
% within x2 Grade
Less than once a month Count
% within x2 Grade
About once a month Count
% within x2 Grade
2 or 3 times a month Count
% within x2 Grade
Once a week or more Count
% within x2 Grade
Total Count
% within x2 Grade
1917 1625 1532 1141 6215
68.7% 54.8% 46.2% 43.7% 53.2%
479 632 740 558 2409
17.2% 21.3% 22.3% 21.4% 20.6%
162 299 515 463 1439
5.8% 10.1% 15.5% 17.7% 12.3%
86 146 257 221 710
3.1% 4.9% 7.8% 8.5% 6.1%
75 128 160 144 507
2.7% 4.3% 4.8% 5.5% 4.3%
72 135 111 82 400
2.6% 4.6% 3.3% 3.1% 3.4%
2791 2965 3315 2609 11680
100.0% 100.0% 100.0% 100.0% 100.0%
Page 143

c12a What are the chances you would be seen as cool if you: carried a handgun? * x2 Grade Crosstabulation
x2 Grade
Total6th 8th 10th 12th
c12a What are the chances you would be seen as cool if you: carried a handgun?
No or Very Little Chance Count
% within x2 Grade
Little Chance Count
% within x2 Grade
Some Chance Count
% within x2 Grade
Pretty Good Chance Count
% within x2 Grade
Very Good Chance Count
% within x2 Grade
Total Count
% within x2 Grade
2356 2385 2747 2216 9704
85.5% 79.7% 82.0% 84.7% 82.9%
167 256 289 198 910
6.1% 8.6% 8.6% 7.6% 7.8%
92 181 163 110 546
3.3% 6.1% 4.9% 4.2% 4.7%
62 94 80 43 279
2.3% 3.1% 2.4% 1.6% 2.4%
78 75 69 49 271
2.8% 2.5% 2.1% 1.9% 2.3%
2755 2991 3348 2616 11710
100.0% 100.0% 100.0% 100.0% 100.0%
c12b What are the chances you would be seen as cool if you: began drinking alcoholic beverages regularly, that is, at least once or twice a month? * x2 Grade Crosstabulation
x2 Grade
Total6th 8th 10th 12th
c12b What are the chances you would be seen as cool if you: began drinking alcoholic beverages regularly, that is, at least once or twice a month?
No or Very Little Chance Count
% within x2 Grade
Little Chance Count
% within x2 Grade
Some Chance Count
% within x2 Grade
Pretty Good Chance Count
% within x2 Grade
Very Good Chance Count
% within x2 Grade
Total Count
% within x2 Grade
2370 2094 1742 1286 7492
86.9% 70.6% 52.2% 49.3% 64.4%
154 357 537 443 1491
5.6% 12.0% 16.1% 17.0% 12.8%
92 261 537 426 1316
3.4% 8.8% 16.1% 16.3% 11.3%
45 159 360 308 872
1.6% 5.4% 10.8% 11.8% 7.5%
67 95 161 146 469
2.5% 3.2% 4.8% 5.6% 4.0%
2728 2966 3337 2609 11640
100.0% 100.0% 100.0% 100.0% 100.0%
Page 144

c12c What are the chances you would be seen as cool if you: smoked cigarettes? * x2 Grade Crosstabulation
x2 Grade
Total6th 8th 10th 12th
c12c What are the chances you would be seen as cool if you: smoked cigarettes?
No or Very Little Chance Count
% within x2 Grade
Little Chance Count
% within x2 Grade
Some Chance Count
% within x2 Grade
Pretty Good Chance Count
% within x2 Grade
Very Good Chance Count
% within x2 Grade
Total Count
% within x2 Grade
2388 2372 2524 1958 9242
87.6% 80.2% 75.9% 75.1% 79.6%
158 264 473 399 1294
5.8% 8.9% 14.2% 15.3% 11.1%
64 150 186 144 544
2.3% 5.1% 5.6% 5.5% 4.7%
49 104 80 53 286
1.8% 3.5% 2.4% 2.0% 2.5%
66 66 63 54 249
2.4% 2.2% 1.9% 2.1% 2.1%
2725 2956 3326 2608 11615
100.0% 100.0% 100.0% 100.0% 100.0%
c12d What are the chances you would be seen as cool if you: smoked marijuana? * x2 Grade Crosstabulation
x2 Grade
Total6th 8th 10th 12th
c12d What are the chances you would be seen as cool if you: smoked marijuana?
No or Very Little Chance Count
% within x2 Grade
Little Chance Count
% within x2 Grade
Some Chance Count
% within x2 Grade
Pretty Good Chance Count
% within x2 Grade
Very Good Chance Count
% within x2 Grade
Total Count
% within x2 Grade
2373 1990 1550 1148 7061
88.4% 67.4% 46.5% 44.1% 61.0%
106 300 503 411 1320
3.9% 10.2% 15.1% 15.8% 11.4%
65 279 577 469 1390
2.4% 9.4% 17.3% 18.0% 12.0%
50 200 415 335 1000
1.9% 6.8% 12.5% 12.9% 8.6%
91 184 287 240 802
3.4% 6.2% 8.6% 9.2% 6.9%
2685 2953 3332 2603 11573
100.0% 100.0% 100.0% 100.0% 100.0%
Page 145

c13 I think it is okay to take something without asking as long as you get away with it. * x2 Grade Crosstabulation
x2 Grade
Total6th 8th 10th 12th
c13 I think it is okay to take something without asking as long as you get away with it.
NO! Count
% within x2 Grade
no Count
% within x2 Grade
yes Count
% within x2 Grade
YES! Count
% within x2 Grade
Total Count
% within x2 Grade
2106 1769 1706 1405 6986
76.2% 59.9% 51.3% 54.0% 60.0%
552 968 1370 1034 3924
20.0% 32.8% 41.2% 39.7% 33.7%
68 172 206 130 576
2.5% 5.8% 6.2% 5.0% 4.9%
36 46 45 34 161
1.3% 1.6% 1.4% 1.3% 1.4%
2762 2955 3327 2603 11647
100.0% 100.0% 100.0% 100.0% 100.0%
c14 It is all right to beat up people if they start the fight. * x2 Grade Crosstabulation
x2 Grade
Total6th 8th 10th 12th
c14 It is all right to beat up people if they start the fight.
NO! Count
% within x2 Grade
no Count
% within x2 Grade
yes Count
% within x2 Grade
YES! Count
% within x2 Grade
Total Count
% within x2 Grade
1252 874 836 712 3674
45.7% 29.7% 25.1% 27.3% 31.6%
565 638 752 592 2547
20.6% 21.7% 22.6% 22.7% 21.9%
513 822 1045 764 3144
18.7% 28.0% 31.4% 29.3% 27.1%
412 606 695 536 2249
15.0% 20.6% 20.9% 20.6% 19.4%
2742 2940 3328 2604 11614
100.0% 100.0% 100.0% 100.0% 100.0%
Page 146

c15 I think sometimes it’s okay to cheat at school. * x2 Grade Crosstabulation
x2 Grade
Total6th 8th 10th 12th
c15 I think sometimes it’s okay to cheat at school.
NO! Count
% within x2 Grade
no Count
% within x2 Grade
yes Count
% within x2 Grade
YES! Count
% within x2 Grade
Total Count
% within x2 Grade
1985 1390 998 731 5104
71.1% 47.1% 29.9% 28.0% 43.7%
653 1098 1338 936 4025
23.4% 37.2% 40.1% 35.8% 34.4%
125 403 848 754 2130
4.5% 13.7% 25.4% 28.8% 18.2%
27 61 152 193 433
1.0% 2.1% 4.6% 7.4% 3.7%
2790 2952 3336 2614 11692
100.0% 100.0% 100.0% 100.0% 100.0%
c16 It is important to be honest with your parents, even if they become upset or you get punished. * x2 Grade Crosstabulation
x2 Grade
Total6th 8th 10th 12th
c16 It is important to be honest with your parents, even if they become upset or you get punished.
NO! Count
% within x2 Grade
no Count
% within x2 Grade
yes Count
% within x2 Grade
YES! Count
% within x2 Grade
Total Count
% within x2 Grade
244 226 230 221 921
8.9% 7.7% 6.9% 8.5% 7.9%
151 282 469 383 1285
5.5% 9.6% 14.1% 14.7% 11.1%
699 1182 1660 1241 4782
25.4% 40.3% 50.0% 47.7% 41.2%
1657 1245 964 754 4620
60.2% 42.4% 29.0% 29.0% 39.8%
2751 2935 3323 2599 11608
100.0% 100.0% 100.0% 100.0% 100.0%
Page 147

c17a In the past year, how many of your 4 best friends have been arrested? * x2 Grade Crosstabulation
x2 Grade
Total6th 8th 10th 12th
c17a In the past year, how many of your 4 best friends have been arrested?
None Count
% within x2 Grade
1 Count
% within x2 Grade
2 Count
% within x2 Grade
3 Count
% within x2 Grade
4 Count
% within x2 Grade
Total Count
% within x2 Grade
2545 2660 2871 2228 10304
91.8% 89.8% 86.0% 85.1% 88.1%
113 152 256 218 739
4.1% 5.1% 7.7% 8.3% 6.3%
40 71 115 90 316
1.4% 2.4% 3.4% 3.4% 2.7%
22 33 46 32 133
0.8% 1.1% 1.4% 1.2% 1.1%
51 45 52 51 199
1.8% 1.5% 1.6% 1.9% 1.7%
2771 2961 3340 2619 11691
100.0% 100.0% 100.0% 100.0% 100.0%
c17b In the past year, how many of your 4 best friends have dropped out of school? * x2 Grade Crosstabulation
x2 Grade
Total6th 8th 10th 12th
c17b In the past year, how many of your 4 best friends have dropped out of school?
None Count
% within x2 Grade
1 Count
% within x2 Grade
2 Count
% within x2 Grade
3 Count
% within x2 Grade
4 Count
% within x2 Grade
Total Count
% within x2 Grade
2633 2852 3235 2468 11188
96.3% 96.8% 97.0% 94.6% 96.3%
66 59 71 106 302
2.4% 2.0% 2.1% 4.1% 2.6%
19 16 17 20 72
0.7% 0.5% 0.5% 0.8% 0.6%
5 7 5 9 26
0.2% 0.2% 0.1% 0.3% 0.2%
11 11 7 6 35
0.4% 0.4% 0.2% 0.2% 0.3%
2734 2945 3335 2609 11623
100.0% 100.0% 100.0% 100.0% 100.0%
Page 148

c17c In the past year, how many of your 4 best friends have steal motor vehicles? * x2 Grade Crosstabulation
x2 Grade
Total6th 8th 10th 12th
c17c In the past year, how many of your 4 best friends have steal motor vehicles?
None Count
% within x2 Grade
1 Count
% within x2 Grade
2 Count
% within x2 Grade
3 Count
% within x2 Grade
4 Count
% within x2 Grade
Total Count
% within x2 Grade
2694 2866 3186 2532 11278
97.9% 97.2% 95.5% 97.0% 96.8%
31 42 93 56 222
1.1% 1.4% 2.8% 2.1% 1.9%
20 14 30 14 78
0.7% 0.5% 0.9% 0.5% 0.7%
3 11 10 2 26
0.1% 0.4% 0.3% 0.1% 0.2%
4 17 17 7 45
0.1% 0.6% 0.5% 0.3% 0.4%
2752 2950 3336 2611 11649
100.0% 100.0% 100.0% 100.0% 100.0%
c17d In the past year, how many of your 4 best friends have been suspended from school? * x2 Grade Crosstabulation
x2 Grade
Total6th 8th 10th 12th
c17d In the past year, how many of your 4 best friends have been suspended from school?
None Count
% within x2 Grade
1 Count
% within x2 Grade
2 Count
% within x2 Grade
3 Count
% within x2 Grade
4 Count
% within x2 Grade
Total Count
% within x2 Grade
1908 1924 2515 2102 8449
69.8% 65.6% 75.5% 80.6% 72.8%
431 486 422 278 1617
15.8% 16.6% 12.7% 10.7% 13.9%
165 221 191 127 704
6.0% 7.5% 5.7% 4.9% 6.1%
83 102 69 34 288
3.0% 3.5% 2.1% 1.3% 2.5%
145 199 132 68 544
5.3% 6.8% 4.0% 2.6% 4.7%
2732 2932 3329 2609 11602
100.0% 100.0% 100.0% 100.0% 100.0%
Page 149
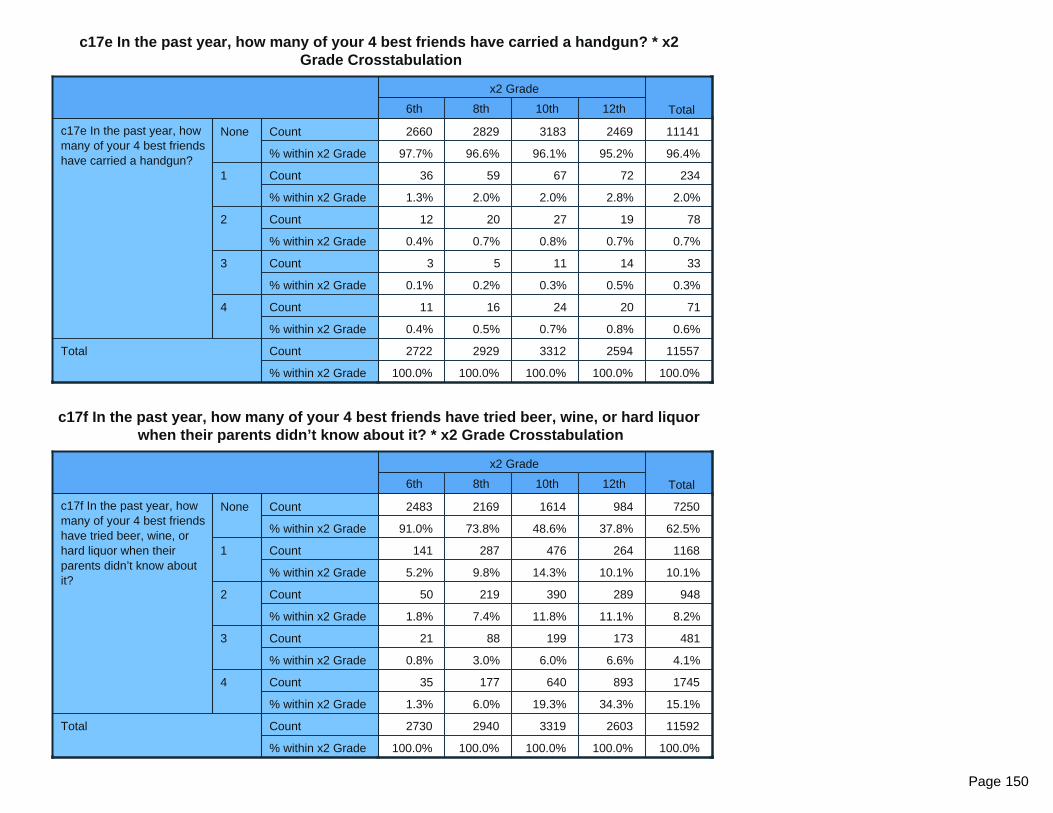
c17e In the past year, how many of your 4 best friends have carried a handgun? * x2 Grade Crosstabulation
x2 Grade
Total6th 8th 10th 12th
c17e In the past year, how many of your 4 best friends have carried a handgun?
None Count
% within x2 Grade
1 Count
% within x2 Grade
2 Count
% within x2 Grade
3 Count
% within x2 Grade
4 Count
% within x2 Grade
Total Count
% within x2 Grade
2660 2829 3183 2469 11141
97.7% 96.6% 96.1% 95.2% 96.4%
36 59 67 72 234
1.3% 2.0% 2.0% 2.8% 2.0%
12 20 27 19 78
0.4% 0.7% 0.8% 0.7% 0.7%
3 5 11 14 33
0.1% 0.2% 0.3% 0.5% 0.3%
11 16 24 20 71
0.4% 0.5% 0.7% 0.8% 0.6%
2722 2929 3312 2594 11557
100.0% 100.0% 100.0% 100.0% 100.0%
c17f In the past year, how many of your 4 best friends have tried beer, wine, or hard liquor when their parents didn’t know about it? * x2 Grade Crosstabulation
x2 Grade
Total6th 8th 10th 12th
c17f In the past year, how many of your 4 best friends have tried beer, wine, or hard liquor when their parents didn’t know about it?
None Count
% within x2 Grade
1 Count
% within x2 Grade
2 Count
% within x2 Grade
3 Count
% within x2 Grade
4 Count
% within x2 Grade
Total Count
% within x2 Grade
2483 2169 1614 984 7250
91.0% 73.8% 48.6% 37.8% 62.5%
141 287 476 264 1168
5.2% 9.8% 14.3% 10.1% 10.1%
50 219 390 289 948
1.8% 7.4% 11.8% 11.1% 8.2%
21 88 199 173 481
0.8% 3.0% 6.0% 6.6% 4.1%
35 177 640 893 1745
1.3% 6.0% 19.3% 34.3% 15.1%
2730 2940 3319 2603 11592
100.0% 100.0% 100.0% 100.0% 100.0%
Page 150

c17g In the past year, how many of your 4 best friends have smoked cigarettes? * x2 Grade Crosstabulation
x2 Grade
Total6th 8th 10th 12th
c17g In the past year, how many of your 4 best friends have smoked cigarettes?
None Count
% within x2 Grade
1 Count
% within x2 Grade
2 Count
% within x2 Grade
3 Count
% within x2 Grade
4 Count
% within x2 Grade
Total Count
% within x2 Grade
2605 2666 2698 1861 9830
95.2% 90.6% 81.1% 71.7% 84.7%
80 139 316 299 834
2.9% 4.7% 9.5% 11.5% 7.2%
17 77 149 193 436
0.6% 2.6% 4.5% 7.4% 3.8%
14 18 58 79 169
0.5% 0.6% 1.7% 3.0% 1.5%
20 43 105 164 332
0.7% 1.5% 3.2% 6.3% 2.9%
2736 2943 3326 2596 11601
100.0% 100.0% 100.0% 100.0% 100.0%
c17h In the past year, how many of your 4 best friends have sold illegal drugs? * x2 Grade Crosstabulation
x2 Grade
Total6th 8th 10th 12th
c17h In the past year, how many of your 4 best friends have sold illegal drugs?
None Count
% within x2 Grade
1 Count
% within x2 Grade
2 Count
% within x2 Grade
3 Count
% within x2 Grade
4 Count
% within x2 Grade
Total Count
% within x2 Grade
2686 2794 2897 2096 10473
98.5% 95.2% 87.1% 80.6% 90.4%
14 75 194 247 530
0.5% 2.6% 5.8% 9.5% 4.6%
7 25 106 136 274
0.3% 0.9% 3.2% 5.2% 2.4%
3 20 38 47 108
0.1% 0.7% 1.1% 1.8% 0.9%
16 21 90 75 202
0.6% 0.7% 2.7% 2.9% 1.7%
2726 2935 3325 2601 11587
100.0% 100.0% 100.0% 100.0% 100.0%
Page 151
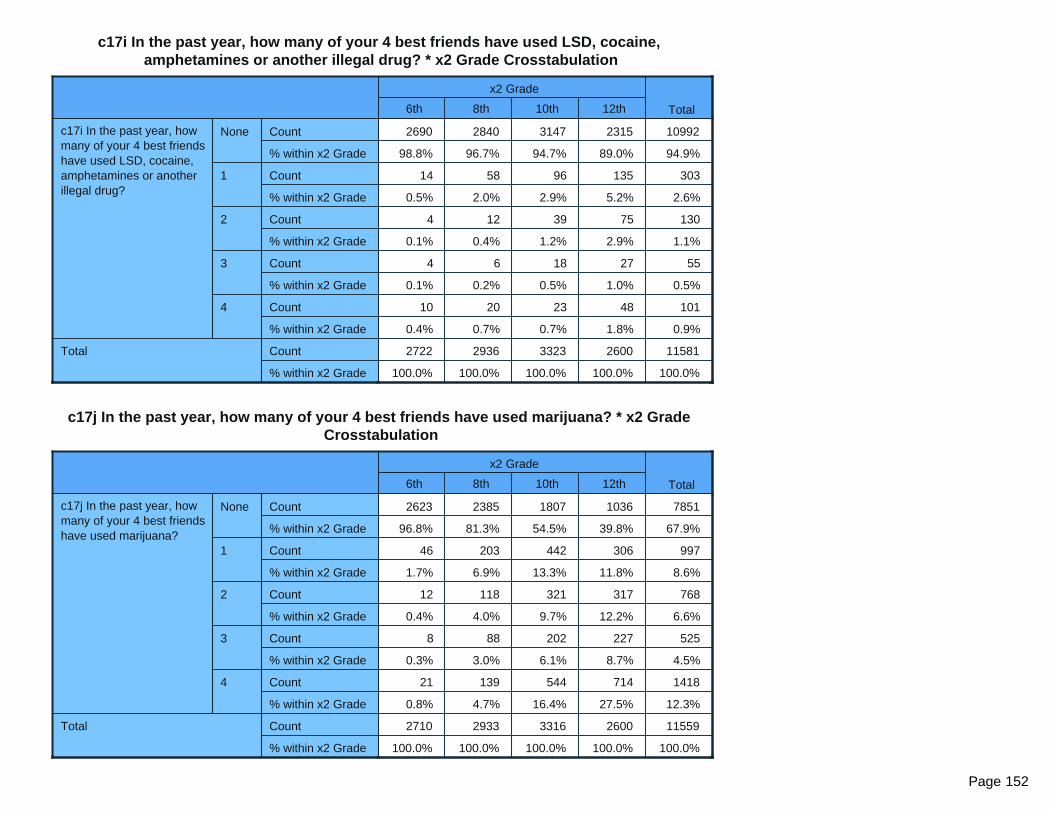
c17i In the past year, how many of your 4 best friends have used LSD, cocaine, amphetamines or another illegal drug? * x2 Grade Crosstabulation
x2 Grade
Total6th 8th 10th 12th
c17i In the past year, how many of your 4 best friends have used LSD, cocaine, amphetamines or another illegal drug?
None Count
% within x2 Grade
1 Count
% within x2 Grade
2 Count
% within x2 Grade
3 Count
% within x2 Grade
4 Count
% within x2 Grade
Total Count
% within x2 Grade
2690 2840 3147 2315 10992
98.8% 96.7% 94.7% 89.0% 94.9%
14 58 96 135 303
0.5% 2.0% 2.9% 5.2% 2.6%
4 12 39 75 130
0.1% 0.4% 1.2% 2.9% 1.1%
4 6 18 27 55
0.1% 0.2% 0.5% 1.0% 0.5%
10 20 23 48 101
0.4% 0.7% 0.7% 1.8% 0.9%
2722 2936 3323 2600 11581
100.0% 100.0% 100.0% 100.0% 100.0%
c17j In the past year, how many of your 4 best friends have used marijuana? * x2 Grade Crosstabulation
x2 Grade
Total6th 8th 10th 12th
c17j In the past year, how many of your 4 best friends have used marijuana?
None Count
% within x2 Grade
1 Count
% within x2 Grade
2 Count
% within x2 Grade
3 Count
% within x2 Grade
4 Count
% within x2 Grade
Total Count
% within x2 Grade
2623 2385 1807 1036 7851
96.8% 81.3% 54.5% 39.8% 67.9%
46 203 442 306 997
1.7% 6.9% 13.3% 11.8% 8.6%
12 118 321 317 768
0.4% 4.0% 9.7% 12.2% 6.6%
8 88 202 227 525
0.3% 3.0% 6.1% 8.7% 4.5%
21 139 544 714 1418
0.8% 4.7% 16.4% 27.5% 12.3%
2710 2933 3316 2600 11559
100.0% 100.0% 100.0% 100.0% 100.0%
Page 152
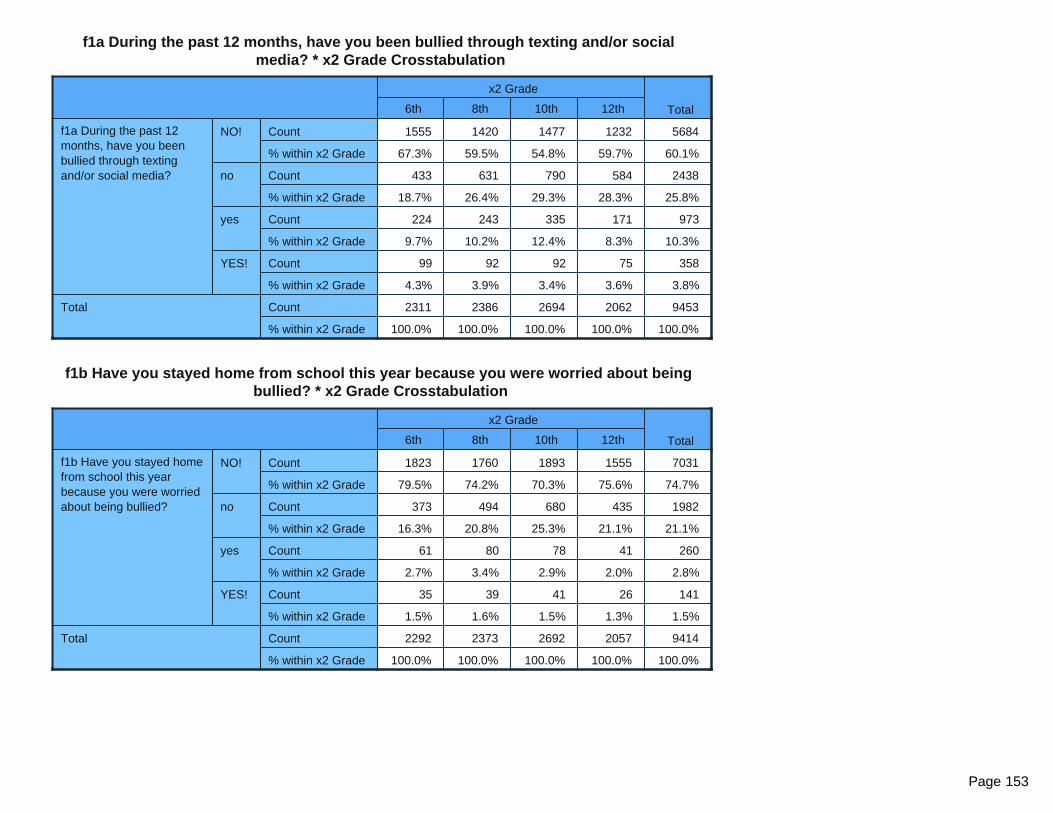
f1a During the past 12 months, have you been bullied through texting and/or social media? * x2 Grade Crosstabulation
x2 Grade
Total6th 8th 10th 12th
f1a During the past 12 months, have you been bullied through texting and/or social media?
NO! Count
% within x2 Grade
no Count
% within x2 Grade
yes Count
% within x2 Grade
YES! Count
% within x2 Grade
Total Count
% within x2 Grade
1555 1420 1477 1232 5684
67.3% 59.5% 54.8% 59.7% 60.1%
433 631 790 584 2438
18.7% 26.4% 29.3% 28.3% 25.8%
224 243 335 171 973
9.7% 10.2% 12.4% 8.3% 10.3%
99 92 92 75 358
4.3% 3.9% 3.4% 3.6% 3.8%
2311 2386 2694 2062 9453
100.0% 100.0% 100.0% 100.0% 100.0%
f1b Have you stayed home from school this year because you were worried about being bullied? * x2 Grade Crosstabulation
x2 Grade
Total6th 8th 10th 12th
f1b Have you stayed home from school this year because you were worried about being bullied?
NO! Count
% within x2 Grade
no Count
% within x2 Grade
yes Count
% within x2 Grade
YES! Count
% within x2 Grade
Total Count
% within x2 Grade
1823 1760 1893 1555 7031
79.5% 74.2% 70.3% 75.6% 74.7%
373 494 680 435 1982
16.3% 20.8% 25.3% 21.1% 21.1%
61 80 78 41 260
2.7% 3.4% 2.9% 2.0% 2.8%
35 39 41 26 141
1.5% 1.6% 1.5% 1.3% 1.5%
2292 2373 2692 2057 9414
100.0% 100.0% 100.0% 100.0% 100.0%
Page 153

f1c Do adults at your school stop bullying when they see/hear it or when a student tells them about it? * x2 Grade Crosstabulation
x2 Grade
Total6th 8th 10th 12th
f1c Do adults at your school stop bullying when they see/hear it or when a student tells them about it?
NO! Count
% within x2 Grade
no Count
% within x2 Grade
yes Count
% within x2 Grade
YES! Count
% within x2 Grade
Total Count
% within x2 Grade
302 395 398 352 1447
13.6% 16.9% 15.0% 17.2% 15.6%
233 470 658 496 1857
10.5% 20.1% 24.8% 24.3% 20.1%
674 921 1187 870 3652
30.3% 39.4% 44.7% 42.6% 39.4%
1019 549 410 326 2304
45.7% 23.5% 15.5% 15.9% 24.9%
2228 2335 2653 2044 9260
100.0% 100.0% 100.0% 100.0% 100.0%
f1d If you have been bullied in the past 12 months, how frequently were you bullied? * x2 Grade Crosstabulation
x2 Grade
Total6th 8th 10th 12th
f1d If you have been bullied in the past 12 months, how frequently were you bullied?
No Count
% within x2 Grade
Yes, very rarely Count
% within x2 Grade
Yes, now and then Count
% within x2 Grade
Yes, several times per month
Count
% within x2 Grade
Yes, several times per week Count
% within x2 Grade
Yes, almost daily Count
% within x2 Grade
Total Count
% within x2 Grade
1590 1681 1982 1628 6881
70.1% 71.4% 73.7% 79.0% 73.4%
336 333 347 216 1232
14.8% 14.1% 12.9% 10.5% 13.1%
195 201 236 137 769
8.6% 8.5% 8.8% 6.6% 8.2%
43 54 54 43 194
1.9% 2.3% 2.0% 2.1% 2.1%
35 35 28 19 117
1.5% 1.5% 1.0% 0.9% 1.2%
68 51 42 19 180
3.0% 2.2% 1.6% 0.9% 1.9%
2267 2355 2689 2062 9373
100.0% 100.0% 100.0% 100.0% 100.0%
Page 154
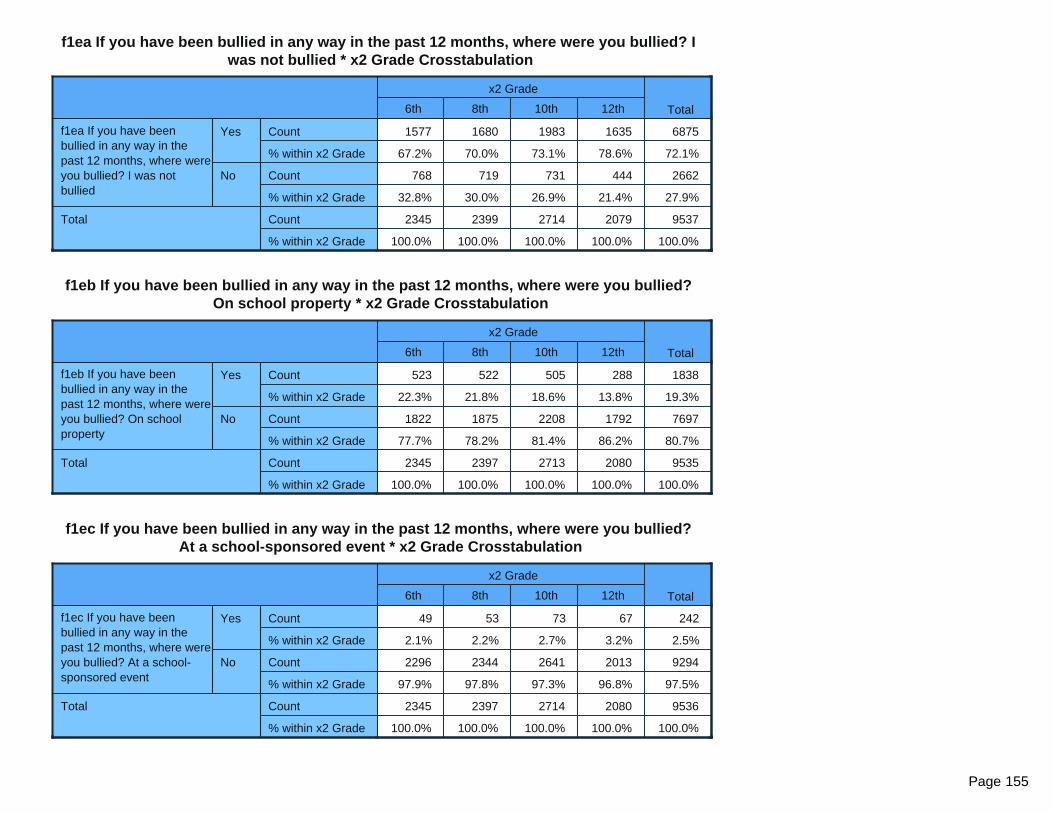
f1ea If you have been bullied in any way in the past 12 months, where were you bullied? I was not bullied * x2 Grade Crosstabulation
x2 Grade
Total6th 8th 10th 12th
f1ea If you have been bullied in any way in the past 12 months, where were you bullied? I was not bullied
Yes Count
% within x2 Grade
No Count
% within x2 Grade
Total Count
% within x2 Grade
1577 1680 1983 1635 6875
67.2% 70.0% 73.1% 78.6% 72.1%
768 719 731 444 2662
32.8% 30.0% 26.9% 21.4% 27.9%
2345 2399 2714 2079 9537
100.0% 100.0% 100.0% 100.0% 100.0%
f1eb If you have been bullied in any way in the past 12 months, where were you bullied? On school property * x2 Grade Crosstabulation
x2 Grade
Total6th 8th 10th 12th
f1eb If you have been bullied in any way in the past 12 months, where were you bullied? On school property
Yes Count
% within x2 Grade
No Count
% within x2 Grade
Total Count
% within x2 Grade
523 522 505 288 1838
22.3% 21.8% 18.6% 13.8% 19.3%
1822 1875 2208 1792 7697
77.7% 78.2% 81.4% 86.2% 80.7%
2345 2397 2713 2080 9535
100.0% 100.0% 100.0% 100.0% 100.0%
f1ec If you have been bullied in any way in the past 12 months, where were you bullied? At a school-sponsored event * x2 Grade Crosstabulation
x2 Grade
Total6th 8th 10th 12th
f1ec If you have been bullied in any way in the past 12 months, where were you bullied? At a school-sponsored event
Yes Count
% within x2 Grade
No Count
% within x2 Grade
Total Count
% within x2 Grade
49 53 73 67 242
2.1% 2.2% 2.7% 3.2% 2.5%
2296 2344 2641 2013 9294
97.9% 97.8% 97.3% 96.8% 97.5%
2345 2397 2714 2080 9536
100.0% 100.0% 100.0% 100.0% 100.0%
Page 155
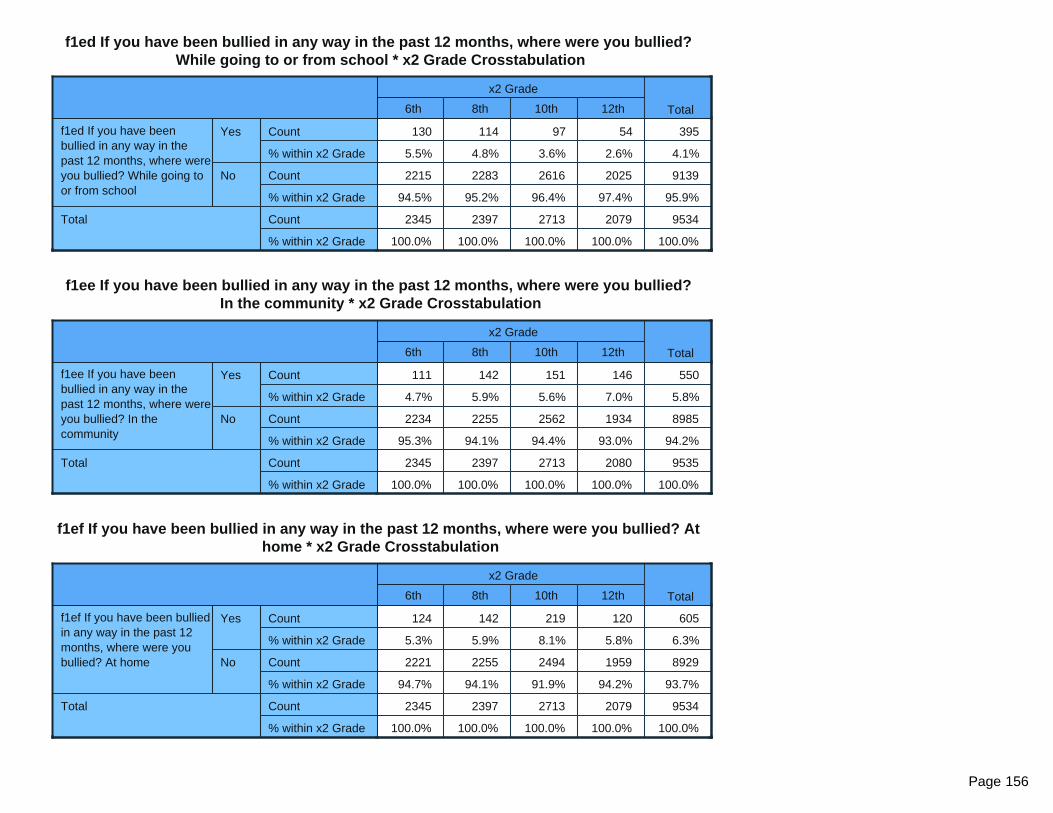
f1ed If you have been bullied in any way in the past 12 months, where were you bullied? While going to or from school * x2 Grade Crosstabulation
x2 Grade
Total6th 8th 10th 12th
f1ed If you have been bullied in any way in the past 12 months, where were you bullied? While going to or from school
Yes Count
% within x2 Grade
No Count
% within x2 Grade
Total Count
% within x2 Grade
130 114 97 54 395
5.5% 4.8% 3.6% 2.6% 4.1%
2215 2283 2616 2025 9139
94.5% 95.2% 96.4% 97.4% 95.9%
2345 2397 2713 2079 9534
100.0% 100.0% 100.0% 100.0% 100.0%
f1ee If you have been bullied in any way in the past 12 months, where were you bullied? In the community * x2 Grade Crosstabulation
x2 Grade
Total6th 8th 10th 12th
f1ee If you have been bullied in any way in the past 12 months, where were you bullied? In the community
Yes Count
% within x2 Grade
No Count
% within x2 Grade
Total Count
% within x2 Grade
111 142 151 146 550
4.7% 5.9% 5.6% 7.0% 5.8%
2234 2255 2562 1934 8985
95.3% 94.1% 94.4% 93.0% 94.2%
2345 2397 2713 2080 9535
100.0% 100.0% 100.0% 100.0% 100.0%
f1ef If you have been bullied in any way in the past 12 months, where were you bullied? At home * x2 Grade Crosstabulation
x2 Grade
Total6th 8th 10th 12th
f1ef If you have been bullied in any way in the past 12 months, where were you bullied? At home
Yes Count
% within x2 Grade
No Count
% within x2 Grade
Total Count
% within x2 Grade
124 142 219 120 605
5.3% 5.9% 8.1% 5.8% 6.3%
2221 2255 2494 1959 8929
94.7% 94.1% 91.9% 94.2% 93.7%
2345 2397 2713 2079 9534
100.0% 100.0% 100.0% 100.0% 100.0%
Page 156

f1fa If you have been bullied in the past 12 months by other students, why were you bullied? I have not been made fun of by other students * x2 Grade Crosstabulation
x2 Grade
Total6th 8th 10th 12th
f1fa If you have been bullied in the past 12 months by other students, why were you bullied? I have not been made fun of by other students
Yes Count
% within x2 Grade
No Count
% within x2 Grade
Total Count
% within x2 Grade
1394 1495 1765 1511 6165
59.4% 62.3% 65.0% 72.7% 64.6%
951 903 950 568 3372
40.6% 37.7% 35.0% 27.3% 35.4%
2345 2398 2715 2079 9537
100.0% 100.0% 100.0% 100.0% 100.0%
f1fb If you have been bullied in the past 12 months by other students, why were you bullied? I don’t know why * x2 Grade Crosstabulation
x2 Grade
Total6th 8th 10th 12th
f1fb If you have been bullied in the past 12 months by other students, why were you bullied? I don’t know why
Yes Count
% within x2 Grade
No Count
% within x2 Grade
Total Count
% within x2 Grade
296 233 207 138 874
12.6% 9.7% 7.6% 6.6% 9.2%
2049 2164 2507 1941 8661
87.4% 90.3% 92.4% 93.4% 90.8%
2345 2397 2714 2079 9535
100.0% 100.0% 100.0% 100.0% 100.0%
Page 157

f1fc If you have been bullied in the past 12 months by other students, why were you bullied? The color of my skin * x2 Grade Crosstabulation
x2 Grade
Total6th 8th 10th 12th
f1fc If you have been bullied in the past 12 months by other students, why were you bullied? The color of my skin
Yes Count
% within x2 Grade
No Count
% within x2 Grade
Total Count
% within x2 Grade
66 88 66 44 264
2.8% 3.7% 2.4% 2.1% 2.8%
2279 2309 2647 2035 9270
97.2% 96.3% 97.6% 97.9% 97.2%
2345 2397 2713 2079 9534
100.0% 100.0% 100.0% 100.0% 100.0%
f1fd If you have been bullied in the past 12 months by other students, why were you bullied? My religion * x2 Grade Crosstabulation
x2 Grade
Total6th 8th 10th 12th
f1fd If you have been bullied in the past 12 months by other students, why were you bullied? My religion
Yes Count
% within x2 Grade
No Count
% within x2 Grade
Total Count
% within x2 Grade
42 49 50 23 164
1.8% 2.0% 1.8% 1.1% 1.7%
2303 2348 2663 2056 9370
98.2% 98.0% 98.2% 98.9% 98.3%
2345 2397 2713 2079 9534
100.0% 100.0% 100.0% 100.0% 100.0%
f1fe If you have been bullied in the past 12 months by other students, why were you bullied? My size (height, weight, etc.) * x2 Grade Crosstabulation
x2 Grade
Total6th 8th 10th 12th
f1fe If you have been bullied in the past 12 months by other students, why were you bullied? My size (height, weight, etc.)
Yes Count
% within x2 Grade
No Count
% within x2 Grade
Total Count
% within x2 Grade
241 273 198 114 826
10.3% 11.4% 7.3% 5.5% 8.7%
2104 2124 2515 1965 8708
89.7% 88.6% 92.7% 94.5% 91.3%
2345 2397 2713 2079 9534
100.0% 100.0% 100.0% 100.0% 100.0%
Page 158

f1ff If you have been bullied in the past 12 months by other students, why were you bullied? My accent * x2 Grade Crosstabulation
x2 Grade
Total6th 8th 10th 12th
f1ff If you have been bullied in the past 12 months by other students, why were you bullied? My accent
Yes Count
% within x2 Grade
No Count
% within x2 Grade
Total Count
% within x2 Grade
19 22 24 20 85
0.8% 0.9% 0.9% 1.0% 0.9%
2326 2375 2689 2059 9449
99.2% 99.1% 99.1% 99.0% 99.1%
2345 2397 2713 2079 9534
100.0% 100.0% 100.0% 100.0% 100.0%
f1fg If you have been bullied in the past 12 months by other students, why were you bullied? The country I was born in * x2 Grade Crosstabulation
x2 Grade
Total6th 8th 10th 12th
f1fg If you have been bullied in the past 12 months by other students, why were you bullied? The country I was born in
Yes Count
% within x2 Grade
No Count
% within x2 Grade
Total Count
% within x2 Grade
16 26 19 16 77
0.7% 1.1% 0.7% 0.8% 0.8%
2329 2371 2694 2063 9457
99.3% 98.9% 99.3% 99.2% 99.2%
2345 2397 2713 2079 9534
100.0% 100.0% 100.0% 100.0% 100.0%
Page 159
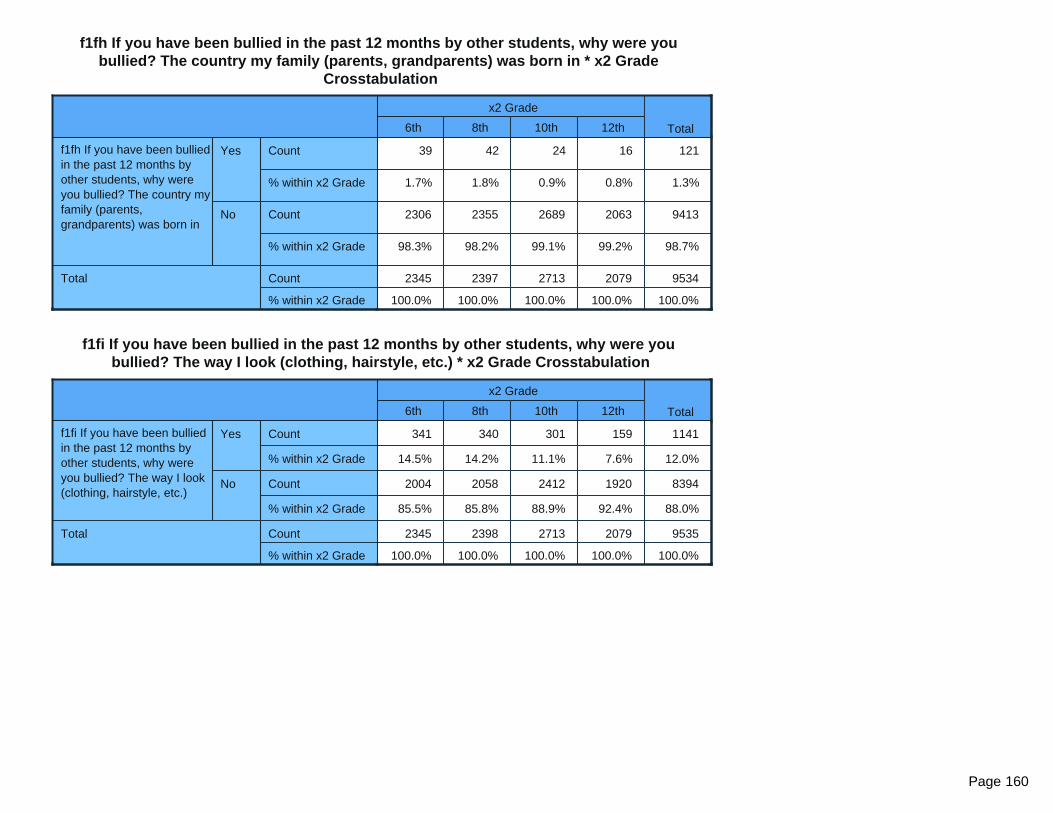
f1fh If you have been bullied in the past 12 months by other students, why were you bullied? The country my family (parents, grandparents) was born in * x2 Grade
Crosstabulation
x2 Grade
Total6th 8th 10th 12th
f1fh If you have been bullied in the past 12 months by other students, why were you bullied? The country my family (parents, grandparents) was born in
Yes Count
% within x2 Grade
No Count
% within x2 Grade
Total Count
% within x2 Grade
39 42 24 16 121
1.7% 1.8% 0.9% 0.8% 1.3%
2306 2355 2689 2063 9413
98.3% 98.2% 99.1% 99.2% 98.7%
2345 2397 2713 2079 9534
100.0% 100.0% 100.0% 100.0% 100.0%
f1fi If you have been bullied in the past 12 months by other students, why were you bullied? The way I look (clothing, hairstyle, etc.) * x2 Grade Crosstabulation
x2 Grade
Total6th 8th 10th 12th
f1fi If you have been bullied in the past 12 months by other students, why were you bullied? The way I look (clothing, hairstyle, etc.)
Yes Count
% within x2 Grade
No Count
% within x2 Grade
Total Count
% within x2 Grade
341 340 301 159 1141
14.5% 14.2% 11.1% 7.6% 12.0%
2004 2058 2412 1920 8394
85.5% 85.8% 88.9% 92.4% 88.0%
2345 2398 2713 2079 9535
100.0% 100.0% 100.0% 100.0% 100.0%
Page 160
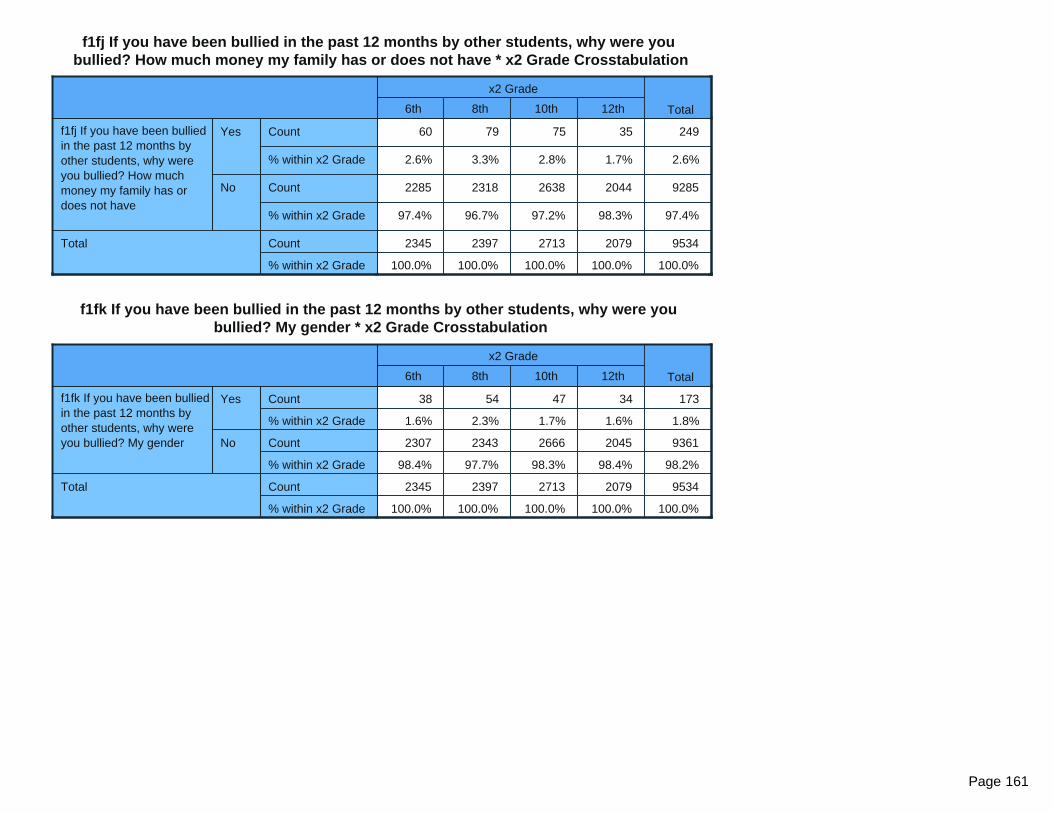
f1fj If you have been bullied in the past 12 months by other students, why were you bullied? How much money my family has or does not have * x2 Grade Crosstabulation
x2 Grade
Total6th 8th 10th 12th
f1fj If you have been bullied in the past 12 months by other students, why were you bullied? How much money my family has or does not have
Yes Count
% within x2 Grade
No Count
% within x2 Grade
Total Count
% within x2 Grade
60 79 75 35 249
2.6% 3.3% 2.8% 1.7% 2.6%
2285 2318 2638 2044 9285
97.4% 96.7% 97.2% 98.3% 97.4%
2345 2397 2713 2079 9534
100.0% 100.0% 100.0% 100.0% 100.0%
f1fk If you have been bullied in the past 12 months by other students, why were you bullied? My gender * x2 Grade Crosstabulation
x2 Grade
Total6th 8th 10th 12th
f1fk If you have been bullied in the past 12 months by other students, why were you bullied? My gender
Yes Count
% within x2 Grade
No Count
% within x2 Grade
Total Count
% within x2 Grade
38 54 47 34 173
1.6% 2.3% 1.7% 1.6% 1.8%
2307 2343 2666 2045 9361
98.4% 97.7% 98.3% 98.4% 98.2%
2345 2397 2713 2079 9534
100.0% 100.0% 100.0% 100.0% 100.0%
Page 161
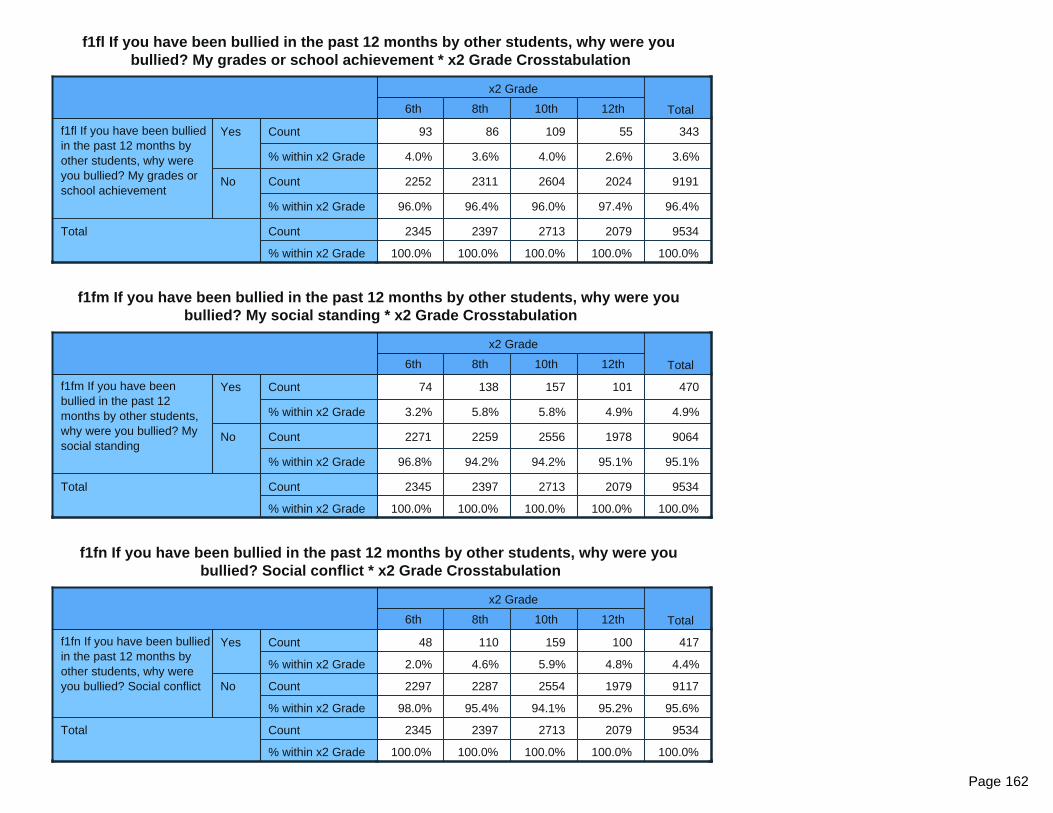
f1fl If you have been bullied in the past 12 months by other students, why were you bullied? My grades or school achievement * x2 Grade Crosstabulation
x2 Grade
Total6th 8th 10th 12th
f1fl If you have been bullied in the past 12 months by other students, why were you bullied? My grades or school achievement
Yes Count
% within x2 Grade
No Count
% within x2 Grade
Total Count
% within x2 Grade
93 86 109 55 343
4.0% 3.6% 4.0% 2.6% 3.6%
2252 2311 2604 2024 9191
96.0% 96.4% 96.0% 97.4% 96.4%
2345 2397 2713 2079 9534
100.0% 100.0% 100.0% 100.0% 100.0%
f1fm If you have been bullied in the past 12 months by other students, why were you bullied? My social standing * x2 Grade Crosstabulation
x2 Grade
Total6th 8th 10th 12th
f1fm If you have been bullied in the past 12 months by other students, why were you bullied? My social standing
Yes Count
% within x2 Grade
No Count
% within x2 Grade
Total Count
% within x2 Grade
74 138 157 101 470
3.2% 5.8% 5.8% 4.9% 4.9%
2271 2259 2556 1978 9064
96.8% 94.2% 94.2% 95.1% 95.1%
2345 2397 2713 2079 9534
100.0% 100.0% 100.0% 100.0% 100.0%
f1fn If you have been bullied in the past 12 months by other students, why were you bullied? Social conflict * x2 Grade Crosstabulation
x2 Grade
Total6th 8th 10th 12th
f1fn If you have been bullied in the past 12 months by other students, why were you bullied? Social conflict
Yes Count
% within x2 Grade
No Count
% within x2 Grade
Total Count
% within x2 Grade
48 110 159 100 417
2.0% 4.6% 5.9% 4.8% 4.4%
2297 2287 2554 1979 9117
98.0% 95.4% 94.1% 95.2% 95.6%
2345 2397 2713 2079 9534
100.0% 100.0% 100.0% 100.0% 100.0%
Page 162
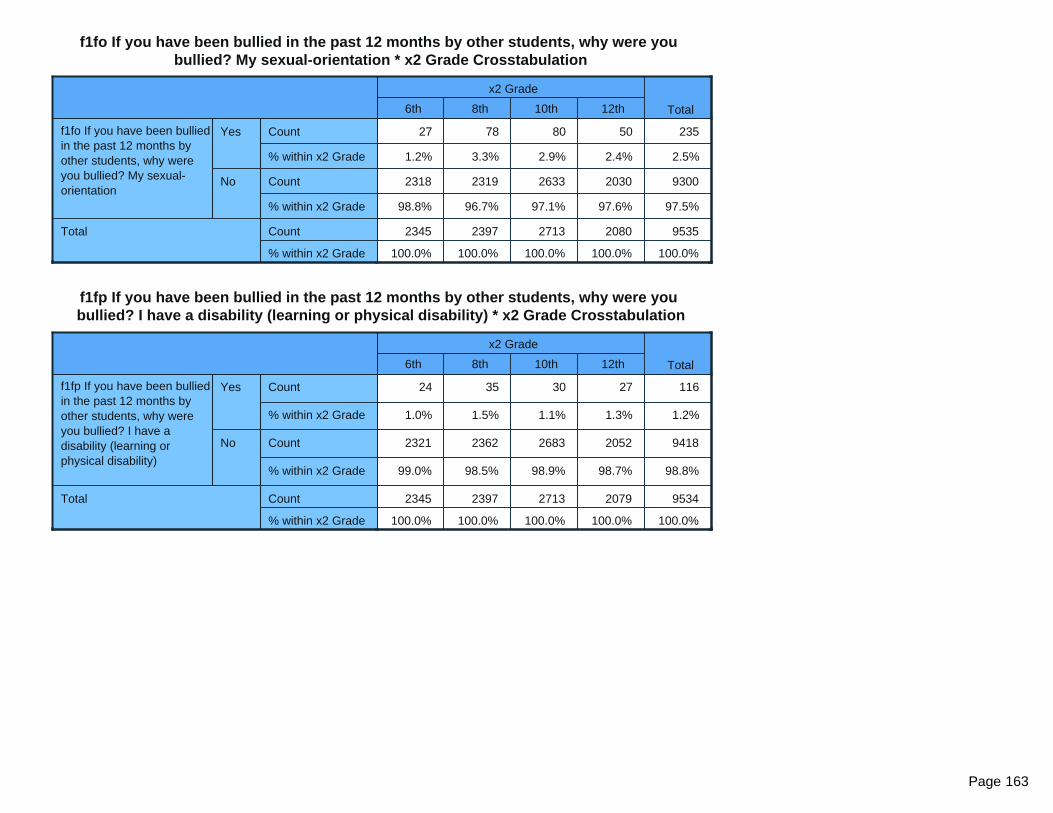
f1fo If you have been bullied in the past 12 months by other students, why were you bullied? My sexual-orientation * x2 Grade Crosstabulation
x2 Grade
Total6th 8th 10th 12th
f1fo If you have been bullied in the past 12 months by other students, why were you bullied? My sexual-orientation
Yes Count
% within x2 Grade
No Count
% within x2 Grade
Total Count
% within x2 Grade
27 78 80 50 235
1.2% 3.3% 2.9% 2.4% 2.5%
2318 2319 2633 2030 9300
98.8% 96.7% 97.1% 97.6% 97.5%
2345 2397 2713 2080 9535
100.0% 100.0% 100.0% 100.0% 100.0%
f1fp If you have been bullied in the past 12 months by other students, why were you bullied? I have a disability (learning or physical disability) * x2 Grade Crosstabulation
x2 Grade
Total6th 8th 10th 12th
f1fp If you have been bullied in the past 12 months by other students, why were you bullied? I have a disability (learning or physical disability)
Yes Count
% within x2 Grade
No Count
% within x2 Grade
Total Count
% within x2 Grade
24 35 30 27 116
1.0% 1.5% 1.1% 1.3% 1.2%
2321 2362 2683 2052 9418
99.0% 98.5% 98.9% 98.7% 98.8%
2345 2397 2713 2079 9534
100.0% 100.0% 100.0% 100.0% 100.0%
Page 163
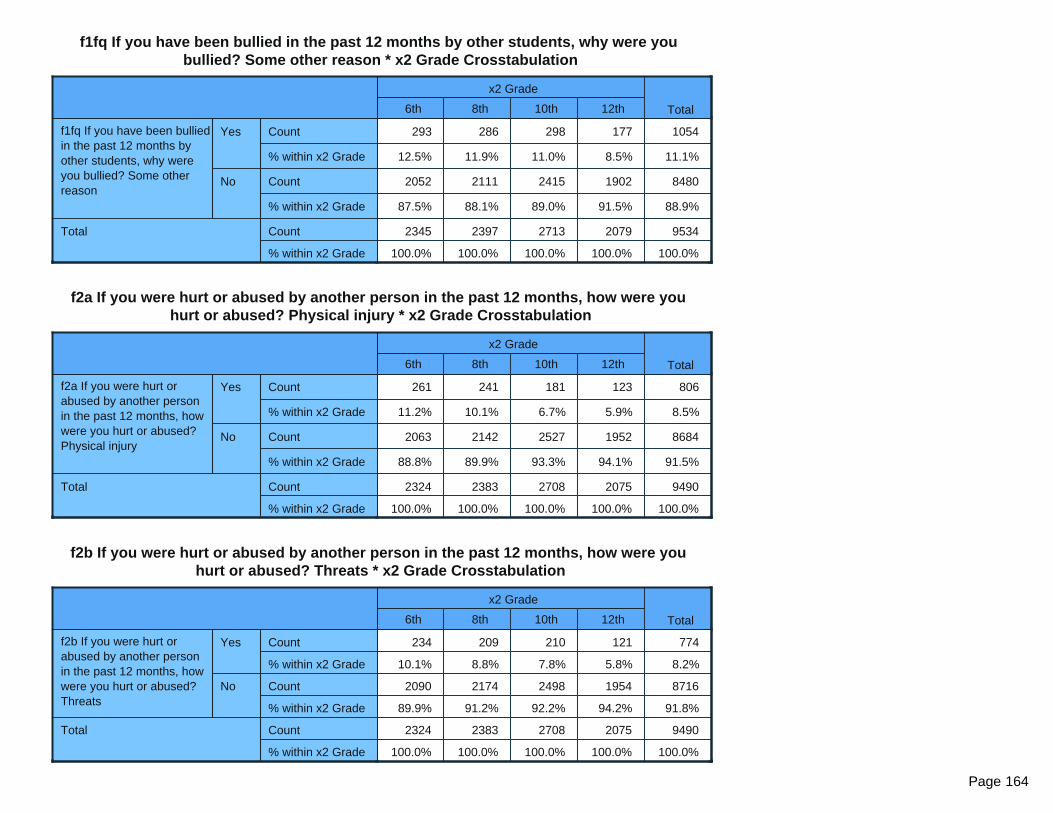
f1fq If you have been bullied in the past 12 months by other students, why were you bullied? Some other reason * x2 Grade Crosstabulation
x2 Grade
Total6th 8th 10th 12th
f1fq If you have been bullied in the past 12 months by other students, why were you bullied? Some other reason
Yes Count
% within x2 Grade
No Count
% within x2 Grade
Total Count
% within x2 Grade
293 286 298 177 1054
12.5% 11.9% 11.0% 8.5% 11.1%
2052 2111 2415 1902 8480
87.5% 88.1% 89.0% 91.5% 88.9%
2345 2397 2713 2079 9534
100.0% 100.0% 100.0% 100.0% 100.0%
f2a If you were hurt or abused by another person in the past 12 months, how were you hurt or abused? Physical injury * x2 Grade Crosstabulation
x2 Grade
Total6th 8th 10th 12th
f2a If you were hurt or abused by another person in the past 12 months, how were you hurt or abused? Physical injury
Yes Count
% within x2 Grade
No Count
% within x2 Grade
Total Count
% within x2 Grade
261 241 181 123 806
11.2% 10.1% 6.7% 5.9% 8.5%
2063 2142 2527 1952 8684
88.8% 89.9% 93.3% 94.1% 91.5%
2324 2383 2708 2075 9490
100.0% 100.0% 100.0% 100.0% 100.0%
f2b If you were hurt or abused by another person in the past 12 months, how were you hurt or abused? Threats * x2 Grade Crosstabulation
x2 Grade
Total6th 8th 10th 12th
f2b If you were hurt or abused by another person in the past 12 months, how were you hurt or abused? Threats
Yes Count
% within x2 Grade
No Count
% within x2 Grade
Total Count
% within x2 Grade
234 209 210 121 774
10.1% 8.8% 7.8% 5.8% 8.2%
2090 2174 2498 1954 8716
89.9% 91.2% 92.2% 94.2% 91.8%
2324 2383 2708 2075 9490
100.0% 100.0% 100.0% 100.0% 100.0%
Page 164

f2c If you were hurt or abused by another person in the past 12 months, how were you hurt or abused? Emotional abuse, insults, name-calling * x2 Grade Crosstabulation
x2 Grade
Total6th 8th 10th 12th
f2c If you were hurt or abused by another person in the past 12 months, how were you hurt or abused? Emotional abuse, insults, name-calling
Yes Count
% within x2 Grade
No Count
% within x2 Grade
Total Count
% within x2 Grade
355 432 564 398 1749
15.3% 18.1% 20.8% 19.2% 18.4%
1969 1951 2144 1677 7741
84.7% 81.9% 79.2% 80.8% 81.6%
2324 2383 2708 2075 9490
100.0% 100.0% 100.0% 100.0% 100.0%
f2d If you were hurt or abused by another person in the past 12 months, how were you hurt or abused? Isolation from friends and family * x2 Grade Crosstabulation
x2 Grade
Total6th 8th 10th 12th
f2d If you were hurt or abused by another person in the past 12 months, how were you hurt or abused? Isolation from friends and family
Yes Count
% within x2 Grade
No Count
% within x2 Grade
Total Count
% within x2 Grade
40 86 134 105 365
1.7% 3.6% 4.9% 5.1% 3.8%
2284 2297 2574 1970 9125
98.3% 96.4% 95.1% 94.9% 96.2%
2324 2383 2708 2075 9490
100.0% 100.0% 100.0% 100.0% 100.0%
Page 165

f2e If you were hurt or abused by another person in the past 12 months, how were you hurt or abused? Control of what you were wearing * x2 Grade Crosstabulation
x2 Grade
Total6th 8th 10th 12th
f2e If you were hurt or abused by another person in the past 12 months, how were you hurt or abused? Control of what you were wearing
Yes Count
% within x2 Grade
No Count
% within x2 Grade
Total Count
% within x2 Grade
48 72 61 43 224
2.1% 3.0% 2.3% 2.1% 2.4%
2276 2311 2647 2032 9266
97.9% 97.0% 97.7% 97.9% 97.6%
2324 2383 2708 2075 9490
100.0% 100.0% 100.0% 100.0% 100.0%
f2f If you were hurt or abused by another person in the past 12 months, how were you hurt or abused? Control with whom you socialized * x2 Grade Crosstabulation
x2 Grade
Total6th 8th 10th 12th
f2f If you were hurt or abused by another person in the past 12 months, how were you hurt or abused? Control with whom you socialized
Yes Count
% within x2 Grade
No Count
% within x2 Grade
Total Count
% within x2 Grade
38 86 110 82 316
1.6% 3.6% 4.1% 4.0% 3.3%
2286 2297 2598 1993 9174
98.4% 96.4% 95.9% 96.0% 96.7%
2324 2383 2708 2075 9490
100.0% 100.0% 100.0% 100.0% 100.0%
Page 166
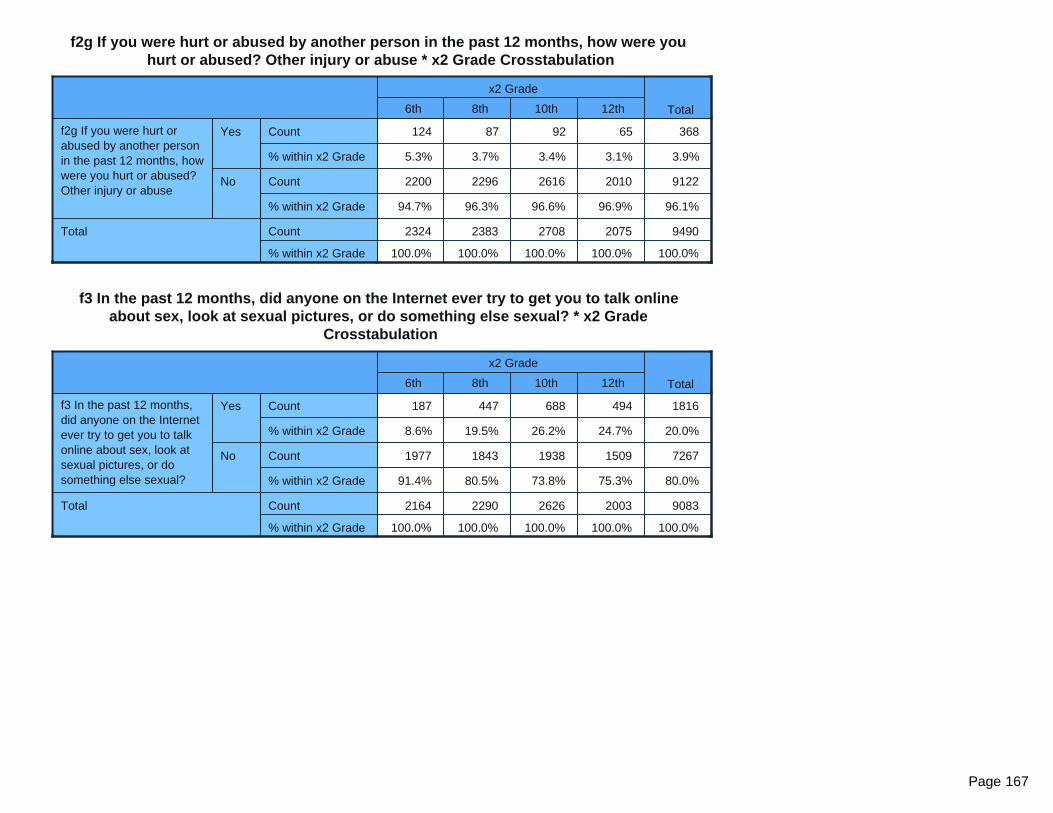
f2g If you were hurt or abused by another person in the past 12 months, how were you hurt or abused? Other injury or abuse * x2 Grade Crosstabulation
x2 Grade
Total6th 8th 10th 12th
f2g If you were hurt or abused by another person in the past 12 months, how were you hurt or abused? Other injury or abuse
Yes Count
% within x2 Grade
No Count
% within x2 Grade
Total Count
% within x2 Grade
124 87 92 65 368
5.3% 3.7% 3.4% 3.1% 3.9%
2200 2296 2616 2010 9122
94.7% 96.3% 96.6% 96.9% 96.1%
2324 2383 2708 2075 9490
100.0% 100.0% 100.0% 100.0% 100.0%
f3 In the past 12 months, did anyone on the Internet ever try to get you to talk online about sex, look at sexual pictures, or do something else sexual? * x2 Grade
Crosstabulation
x2 Grade
Total6th 8th 10th 12th
f3 In the past 12 months, did anyone on the Internet ever try to get you to talk online about sex, look at sexual pictures, or do something else sexual?
Yes Count
% within x2 Grade
No Count
% within x2 Grade
Total Count
% within x2 Grade
187 447 688 494 1816
8.6% 19.5% 26.2% 24.7% 20.0%
1977 1843 1938 1509 7267
91.4% 80.5% 73.8% 75.3% 80.0%
2164 2290 2626 2003 9083
100.0% 100.0% 100.0% 100.0% 100.0%
Page 167

f4a Did you ever feel so sad or hopeless almost every day for two weeks or more in a row that you stopped doing some usual activites? * x2 Grade Crosstabulation
x2 Grade
Total6th 8th 10th 12th
f4a Did you ever feel so sad or hopeless almost every day for two weeks or more in a row that you stopped doing some usual activites?
Yes Count
% within x2 Grade
No Count
% within x2 Grade
Total Count
% within x2 Grade
367 515 694 582 2158
17.2% 22.5% 26.2% 28.5% 23.7%
1770 1771 1951 1462 6954
82.8% 77.5% 73.8% 71.5% 76.3%
2137 2286 2645 2044 9112
100.0% 100.0% 100.0% 100.0% 100.0%
f4b Did you ever seriously consider attempting suicide? * x2 Grade Crosstabulation
x2 Grade
Total6th 8th 10th 12th
f4b Did you ever seriously consider attempting suicide?
Yes Count
% within x2 Grade
No Count
% within x2 Grade
Total Count
% within x2 Grade
237 386 522 401 1546
11.2% 17.0% 19.8% 19.8% 17.1%
1880 1882 2113 1624 7499
88.8% 83.0% 80.2% 80.2% 82.9%
2117 2268 2635 2025 9045
100.0% 100.0% 100.0% 100.0% 100.0%
f4c Did you make a plan about how you would attempt suicide? * x2 Grade Crosstabulation
x2 Grade
Total6th 8th 10th 12th
f4c Did you make a plan about how you would attempt suicide?
Yes Count
% within x2 Grade
No Count
% within x2 Grade
Total Count
% within x2 Grade
182 315 423 324 1244
8.6% 13.9% 16.0% 16.0% 13.8%
1935 1947 2215 1699 7796
91.4% 86.1% 84.0% 84.0% 86.2%
2117 2262 2638 2023 9040
100.0% 100.0% 100.0% 100.0% 100.0%
Page 168
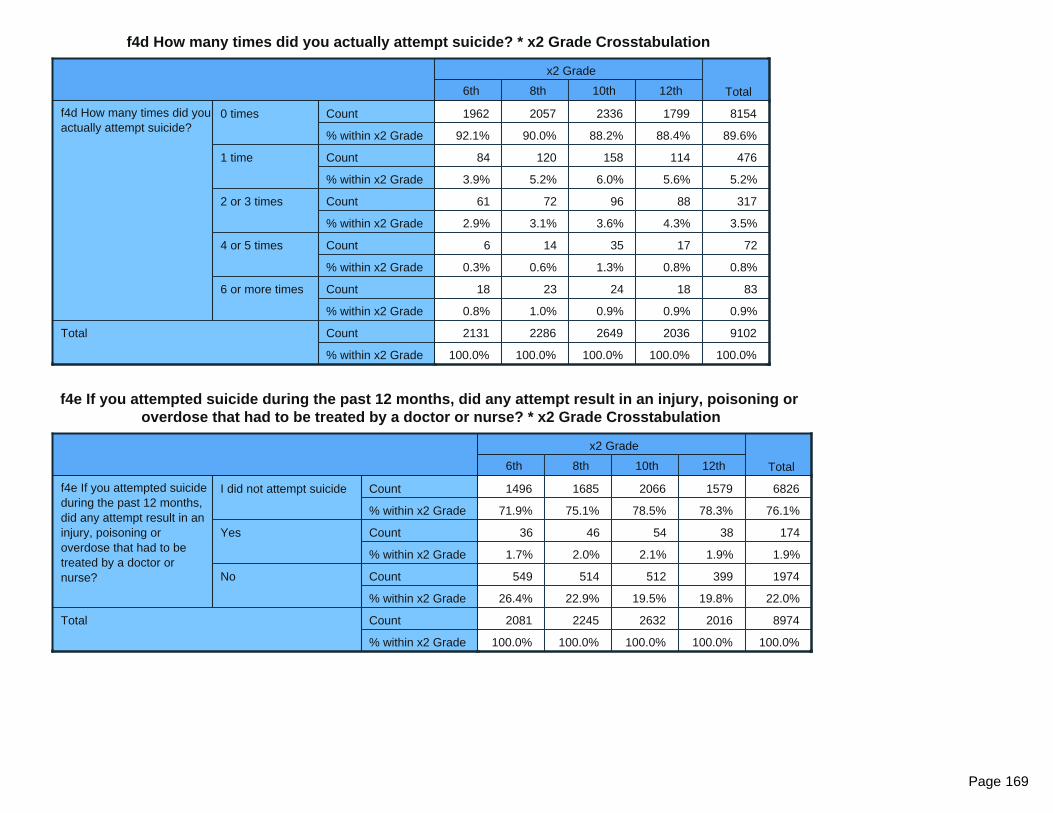
f4d How many times did you actually attempt suicide? * x2 Grade Crosstabulation
x2 Grade
Total6th 8th 10th 12th
f4d How many times did you actually attempt suicide?
0 times Count
% within x2 Grade
1 time Count
% within x2 Grade
2 or 3 times Count
% within x2 Grade
4 or 5 times Count
% within x2 Grade
6 or more times Count
% within x2 Grade
Total Count
% within x2 Grade
1962 2057 2336 1799 8154
92.1% 90.0% 88.2% 88.4% 89.6%
84 120 158 114 476
3.9% 5.2% 6.0% 5.6% 5.2%
61 72 96 88 317
2.9% 3.1% 3.6% 4.3% 3.5%
6 14 35 17 72
0.3% 0.6% 1.3% 0.8% 0.8%
18 23 24 18 83
0.8% 1.0% 0.9% 0.9% 0.9%
2131 2286 2649 2036 9102
100.0% 100.0% 100.0% 100.0% 100.0%
f4e If you attempted suicide during the past 12 months, did any attempt result in an injury, poisoning or overdose that had to be treated by a doctor or nurse? * x2 Grade Crosstabulation
x2 Grade
Total6th 8th 10th 12th
f4e If you attempted suicide during the past 12 months, did any attempt result in an injury, poisoning or overdose that had to be treated by a doctor or nurse?
I did not attempt suicide Count
% within x2 Grade
Yes Count
% within x2 Grade
No Count
% within x2 Grade
Total Count
% within x2 Grade
1496 1685 2066 1579 6826
71.9% 75.1% 78.5% 78.3% 76.1%
36 46 54 38 174
1.7% 2.0% 2.1% 1.9% 1.9%
549 514 512 399 1974
26.4% 22.9% 19.5% 19.8% 22.0%
2081 2245 2632 2016 8974
100.0% 100.0% 100.0% 100.0% 100.0%
Page 169

f5 In the past 12 months, have any of your friends or family members close to you died? * x2 Grade Crosstabulation
x2 Grade
Total6th 8th 10th 12th
f5 In the past 12 months, have any of your friends or family members close to you died?
Yes Count
% within x2 Grade
No Count
% within x2 Grade
Total Count
% within x2 Grade
950 982 1073 722 3727
44.9% 43.0% 40.6% 35.5% 41.0%
1167 1303 1573 1311 5354
55.1% 57.0% 59.4% 64.5% 59.0%
2117 2285 2646 2033 9081
100.0% 100.0% 100.0% 100.0% 100.0%
Page 170