2016 FINRA Annual Financial Report

Contents
Letter From the President and Chief Executive Officer 1
Management Report on Financial Operations 5
Management Report on Internal Control Over Financial Reporting 18
Investment Committee Report 19
Audit Committee Report 21
Management Compensation Committee Report 23
Report of Independent Registered Public Accounting Firm on Internal Control Over Financial Reporting 27
Report of Independent Registered Public Accounting Firm 28
FINRA 2016 Consolidated Financial Statements:
Consolidated Balance Sheets 29
Consolidated Statements of Operations 31
Consolidated Statements of Comprehensive Income (Loss) 32
Consolidated Statements of Changes in Equity 33
Consolidated Statements of Cash Flows 34
Notes to Consolidated Financial Statements 36
FINRA Board of Governors 63
FINRA Officers 63
FINRA Corporate Offices 64
FINRA District Offices 64
FINRA Market Regulation Regional Offices 65
FINRA Dispute Resolution Regional Offices 65

FINRA 2016 Annual Financial Report 1
FINRA plays an essential role in the oversight of U.S. broker-dealers, working to protect investors, promote market integrity and facilitate vibrant capital markets. To fully support this mission, FINRA must maintain a strong financial position and be a prudent steward of its resources.
The accompanying 2016 Annual Financial Report describes FINRA’s financial operations for last year.
Operating revenues declined 6 percent in 2016, driven by changes to the scope of regulatory functions provided under regulatory services agreements, lower corporate financing fees due to a decline in the number of filings for initial and secondary public offerings, and a decline in continuing education fees following the transition to a lower-fee online delivery format—which was designed to reduce costs and increase convenience for our members. We expect operating revenue challenges to continue this year, with a projected decline of 1 percent for 2017.
A MESSAGE FROM THE PRESIDENT AND CEO
Robert W. Cook | President and Chief Executive Officer
2 FINRA 2016 Annual Financial Report
Management Report on Financial Operations (continued)
FINRA tightly managed expenses in 2016, and as a result, costs remained flat year over year. Overall, compensation and benefits expenses increased slightly, as did spending due to cloud computing, big data software and data analytics. However, these increases were offset by a 9 percent decline in incentive compensation (relative to total eligible salaries), and a reduction in continuing education administration costs as a result of the move to online content. We also transitioned more than 1,100 employees from a pension plan to a defined contribution component of our 401(k) plan, reducing our pension liability as of December 31, 2016, by approximately $80.2 million. For 2017, we are continuing to take steps to manage expenses closely. Already this year, among other actions, we have reduced year-over-year compensation increases by freezing officer salaries, freezing promotions of existing officers (other than where necessary to backfill positions), and reducing annual merit increases for non-officers.
FINRA maintains a strong balance sheet to support its operations, with approximately $1.6 billion in equity (net assets). This balance sheet enables us to strategically advance our mission through prudent, targeted investments in technology and other areas, such as financing the migration of our market surveillance programs to the cloud, which we completed in 2016.
In addition, we have used approximately $50 million of yield from our investment portfolio annually to fund our operations, which has enabled us to defer fee increases to members. As a result, member fees were last increased five years ago.
Emerging Regulatory Issues
FINRA 2016 Annual Financial Report 3
Management Report on Financial Operations (continued)
Robert W. CookPresident and Chief Executive Officer
As we look forward to the second half of 2017 and beyond, FINRA is focused on operating efficiently and effectively as a self-regulatory organization. It has been 10 years since FINRA was formed through the merger of NASD and certain regulatory operations of the NYSE. During the last decade, FINRA has made many substantial enhancements to its operations to adapt to changes in its membership and the markets. But amidst all that important work, FINRA has not had an opportunity to conduct an organizationwide self-assessment and improvement initiative. With our 10th anniversary, and continuing feedback from my ongoing listening tour, we have determined that the time is right to take a hard look at ourselves and implement changes necessary to ensure that FINRA is well-positioned to achieve our mission now and in the future.
Market Surveillance Collaboration
To achieve this objective, we have embarked on a comprehensive, multi-year initiative called FINRA360 that is focused on creating an organization committed to continuous improvement. This initiative provides a framework for processing the internal and external feedback we continue to receive, engaging in a thoughtful analysis to determine whether there are opportunities for improvement, and making changes that will produce a stronger organization.
As we proceed with FINRA360, we will work to identify opportunities to be more efficient with our resources while also maintaining high standards of investor protection—and doing so in a manner that fully supports the important role that America’s capital markets play in creating jobs, building financial security and fostering innovation.
I look forward to providing updates on our progress with FINRA360 in the coming months.
4 FINRA 2016 Annual Financial Report
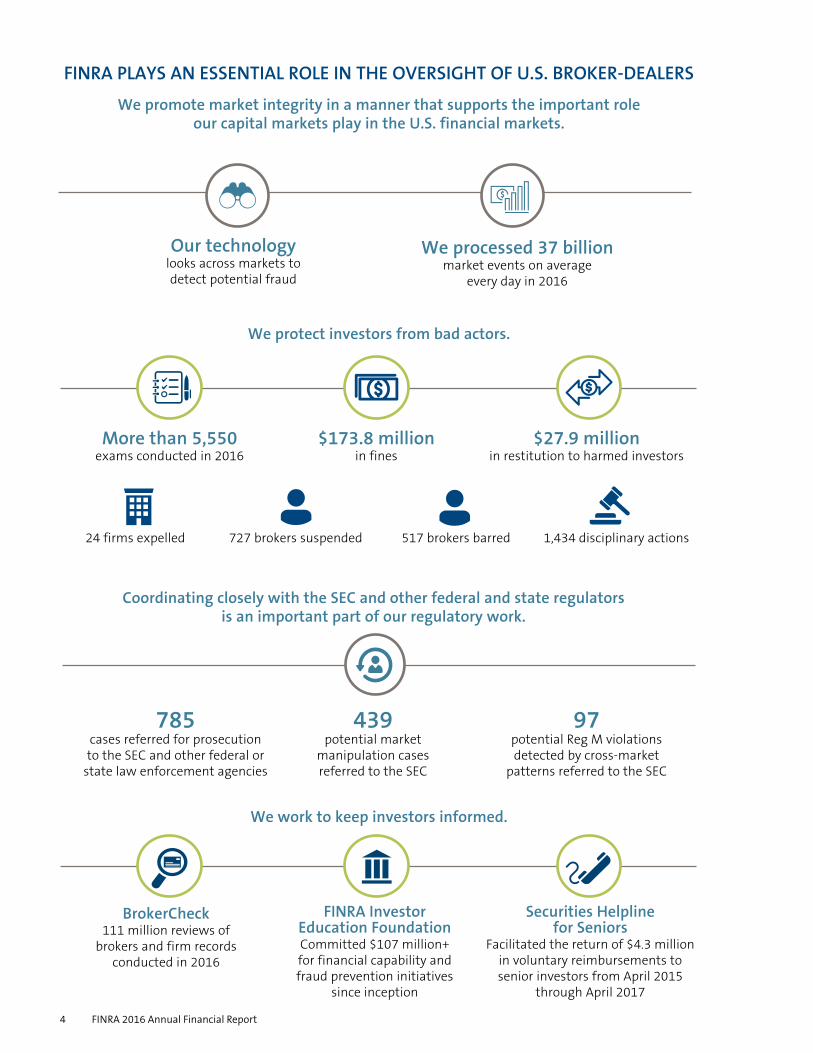
FINRA PLAYS AN ESSENTIAL ROLE IN THE OVERSIGHT OF U.S. BROKER-DEALERS
We promote market integrity in a manner that supports the important role our capital markets play in the U.S. financial markets.
We processed 37 billion market events on average
every day in 2016
More than 5,550 exams conducted in 2016
Our technology looks across markets todetect potential fraud
We protect investors from bad actors.
$173.8 million in fines
$27.9 million in restitution to harmed investors
Coordinating closely with the SEC and other federal and state regulators is an important part of our regulatory work.
24 firms expelled 727 brokers suspended 517 brokers barred 1,434 disciplinary actions
785cases referred for prosecution to the SEC and other federal or
state law enforcement agencies
439 potential market
manipulation cases referred to the SEC
97 potential Reg M violations detected by cross-market
patterns referred to the SEC
We work to keep investors informed.
BrokerCheck 111 million reviews of
brokers and firm records conducted in 2016
FINRA Investor Education Foundation Committed $107 million+ for financial capability and fraud prevention initiatives
since inception
Securities Helpline for Seniors
Facilitated the return of $4.3 million in voluntary reimbursements to senior investors from April 2015
through April 2017
FINRA 2016 Annual Financial Report 5
Management Report on Financial Operations
Who We Are
The Financial Industry Regulatory Authority, Inc.® (FINRA®) is a not-for-profit self-regulatory organization (SRO) authorized by federal law to help protect investors and ensure the fair and honest operation of financial markets. Under the supervision of the Securities and Exchange Commission (SEC), we regulate the activities of U.S. broker-dealers and perform market regulation pursuant to our own statutory responsibility and under contract for certain exchanges.
Our Mission
Our core mission is to pursue investor protection and market integrity, and we carry it out by overseeing virtually every aspect of the broker-dealer industry.
UX Design
Our Regulatory Model
To carry out its mission, FINRA uses a multi-pronged approach that includes regulation, rulemaking, transparency and education:
Member Regulation/Enforcement
FINRA’s Member Regulation and Enforcement departments monitor and enforce member compliance with industry rules and regulations.
Fraud Detection
FINRA’s Office of Fraud Detection and Market Intelligence centralizes FINRA’s review of allegations of serious fraud and significant investor harm, analyzes trading activity across U.S. markets for evidence of insider trading, and analyzes tips and complaints of possible fraud or other misconduct that are submitted to FINRA’s Whistleblower hotline or mailbox.
Market Regulation
FINRA’s Market Regulation Department conducts automated surveillance, examinations and investigations of trading market activity in U.S. equities, options and fixed income markets and enforces rules.

6 FINRA 2016 Annual Financial Report
Management Report on Financial Operations (continued)
FINRA.org and RAD Collaboration
Advertising Regulation/Corporate Finance
Through the Advertising Regulation Department, FINRA ensures that member communications to the public are fair, balanced and not misleading, and through the Corporate Finance Department, FINRA regulates corporate offerings to address fraudulent private placements and ensure underwriting compensation is fair.
Investor Education
FINRA’s Office of Investor Education provides investors with financial tools and resources, and through the FINRA Investor Education Foundation®, FINRA supports important research and financial education initiatives.
FINRA’s Regulatory Policy Committee; Finance, Operations and Technology Committee; Management Compensation Committee; Executive Committee and Audit Committee of the Board of Governors (Board) all meet multiple times throughout the year to review both the accomplishments and the risks and challenges associated with each of these areas in the furtherance of FINRA’s mission.
Further description of FINRA’s statutory responsibilities as well as its responsibilities under contract for certain exchanges can be found in Note 1, “Organization and Nature of Operations,” to the consolidated financial statements.
Rulemaking and Guidance
FINRA’s Office of General Counsel assists FINRA in adopting rules and providing guidance applicable to securities firms and brokers. FINRA solicits comment on its proposed rules from its members, investors and other interested parties, and, with limited exceptions, all FINRA rules must be approved by the SEC.
Registration and Disclosure, and Testing and Continuing Education
FINRA’s Registration and Disclosure Department operates FINRA’s utilities to register and test securities industry personnel and provides those same services under contract for the benefit of investment advisers and mortgage brokers.
Market Transparency
FINRA’s Transparency Services Department operates facilities that disseminate real-time and historical market information for over-the-counter (OTC) trading in the equity and fixed income markets, and maintains the databases FINRA uses to oversee OTC securities.
Dispute Resolution
FINRA’s Office of Dispute Resolution operates a dispute resolution forum for investors, brokerage firms and their registered employees, and administers arbitrations and mediations through a network of four regional offices, with 71 hearing locations, including one in each state and Puerto Rico.
FINRA 2016 Annual Financial Report 7
Management Report on Financial Operations (continued)
This Management Report should be read in connection with the consolidated financial statements and accompanying notes included elsewhere in this Annual Financial Report. The 2016 consolidated financial statements reflect the activities of FINRA and its consolidated subsidiaries, collectively referred to as “we,” “our,” “us,” “FINRA” or the “Company” throughout this Management Report. As of and for the years ended December 31, 2016 and 2015, FINRA’s primary consolidated subsidiaries are FINRA Regulation, Inc. and the FINRA Investor Education Foundation.
Our consolidated financial statements are prepared in conformity with U.S. generally accepted accounting principles (U.S. GAAP). Under U.S. GAAP, we are required to adopt accounting principles and make estimates and judgments to develop amounts reported in the consolidated financial statements and accompanying notes.
Our significant accounting policies are described in Note 2, “Summary of Significant Accounting Policies,” Note 5, “Fair Value Measurement,” and Note 7, “Employee Benefit Liabilities,” to the consolidated financial statements.
RESULTS OF OPERATIONS
Summary of Operations
The following table provides a summary of our financial results on a U.S. GAAP basis for the two years ended December 31, 2016. Years Ended December 31,
2016 2015 (in millions)
Operating revenues $ 844.6 $ 898.7Fines 173.8 93.8Net revenues 1,018.4 992.5
Expenses (1,037.4) (1,038.1)Interest and dividend income 31.4 28.2Operating income (loss) 12.4 (17.4)
Net realized and unrealized investment gains (losses) 17.1 (7.4)Equity earnings (losses) from other investments 29.7 (13.5)Other expense (1.5) (1.2)Net income (loss) $ 57.7 $ (39.5)
We reported net income of $57.7 million in 2016 versus a loss of $39.5 million in 2015. The change is primarily related to two areas: fines and portfolio returns. An increase in fines revenue more than offset the decrease in operating revenues for the year, while portfolio returns, including interest and dividend income, increased $70.9 million year over year. A more detailed look at our operating results follows.
RCM Program Collaboration
Management Report on Financial Operations (continued)
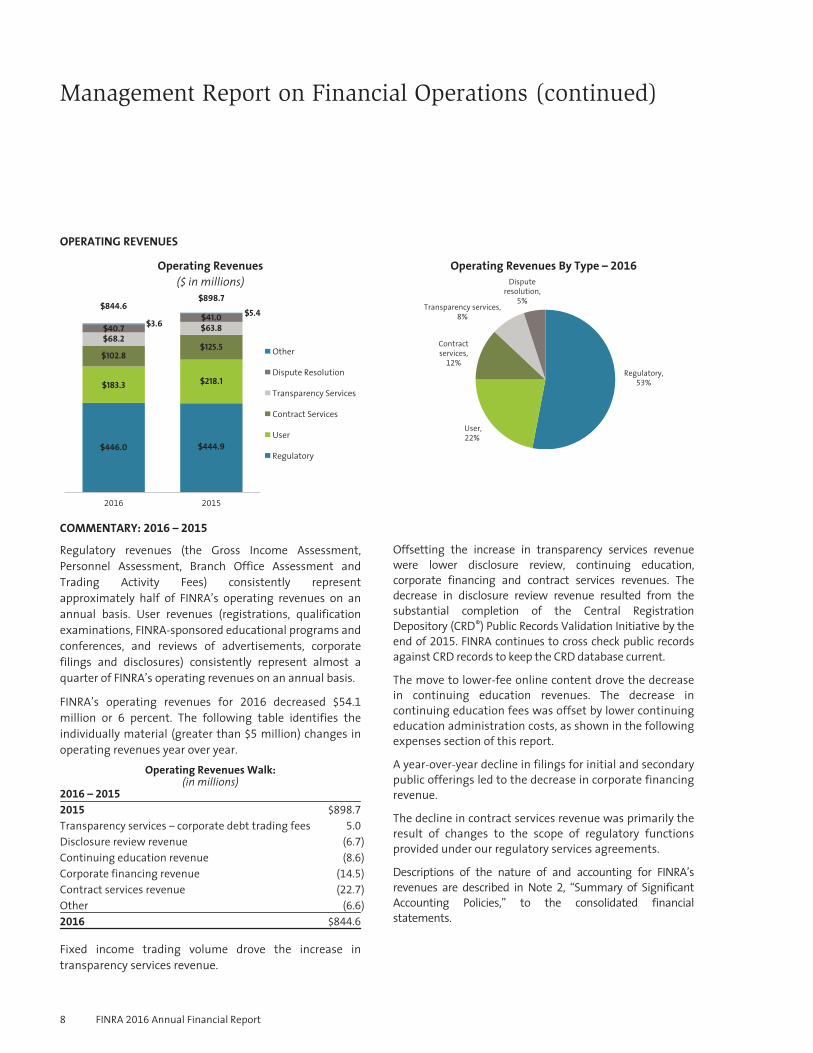
OPERATING REVENUES
Operating Revenues($ in millions)
$844.6$898.7
$444.9$446.0
$183.3
$102.8$68.2$40.7
$218.1
$125.5
$63.8$41.0 $5.4
$3.6
Regulatory
2016 2015
User
Contract Services
Transparency Services
Dispute Resolution
Other
Operating Revenues By Type – 2016
Regulatory,53%
User,22%
Contractservices,
12%
Transparency services,8%
Disputeresolution,
5%
COMMENTARY: 2016 – 2015
Regulatory revenues (the Gross Income Assessment,Personnel Assessment, Branch Office Assessment andTrading Activity Fees) consistently representapproximately half of FINRA’s operating revenues on anannual basis. User revenues (registrations, qualificationexaminations, FINRA-sponsored educational programs andconferences, and reviews of advertisements, corporatefilings and disclosures) consistently represent almost aquarter of FINRA’s operating revenues on an annual basis.
FINRA’s operating revenues for 2016 decreased $54.1
million or 6 percent. The following table identifies theindividually material (greater than $5 million) changes inoperating revenues year over year.
Operating Revenues Walk:(in millions)
2016 – 2015
2015 $898.7
Transparency services – corporate debt trading fees 5.0
Disclosure review revenue (6.7)
Continuing education revenue (8.6)
Corporate financing revenue (14.5)
Contract services revenue (22.7)
Other (6.6)
2016 $844.6
Fixed income trading volume drove the increase intransparency services revenue.
Offsetting the increase in transparency services revenuewere lower disclosure review, continuing education,corporate financing and contract services revenues. Thedecrease in disclosure review revenue resulted from thesubstantial completion of the Central RegistrationDepository (CRD®) Public Records Validation Initiative by theend of 2015. FINRA continues to cross check public recordsagainst CRD records to keep the CRD database current.
The move to lower-fee online content drove the decreasein continuing education revenues. The decrease incontinuing education fees was offset by lower continuingeducation administration costs, as shown in the followingexpenses section of this report.
A year-over-year decline in filings for initial and secondarypublic offerings led to the decrease in corporate financingrevenue.
The decline in contract services revenue was primarily theresult of changes to the scope of regulatory functionsprovided under our regulatory services agreements.
Descriptions of the nature of and accounting for FINRA’srevenues are described in Note 2, “Summary of SignificantAccounting Policies,” to the consolidated financialstatements.
8 FINRA 2016 Annual Financial Report
Management Report on Financial Operations (continued)
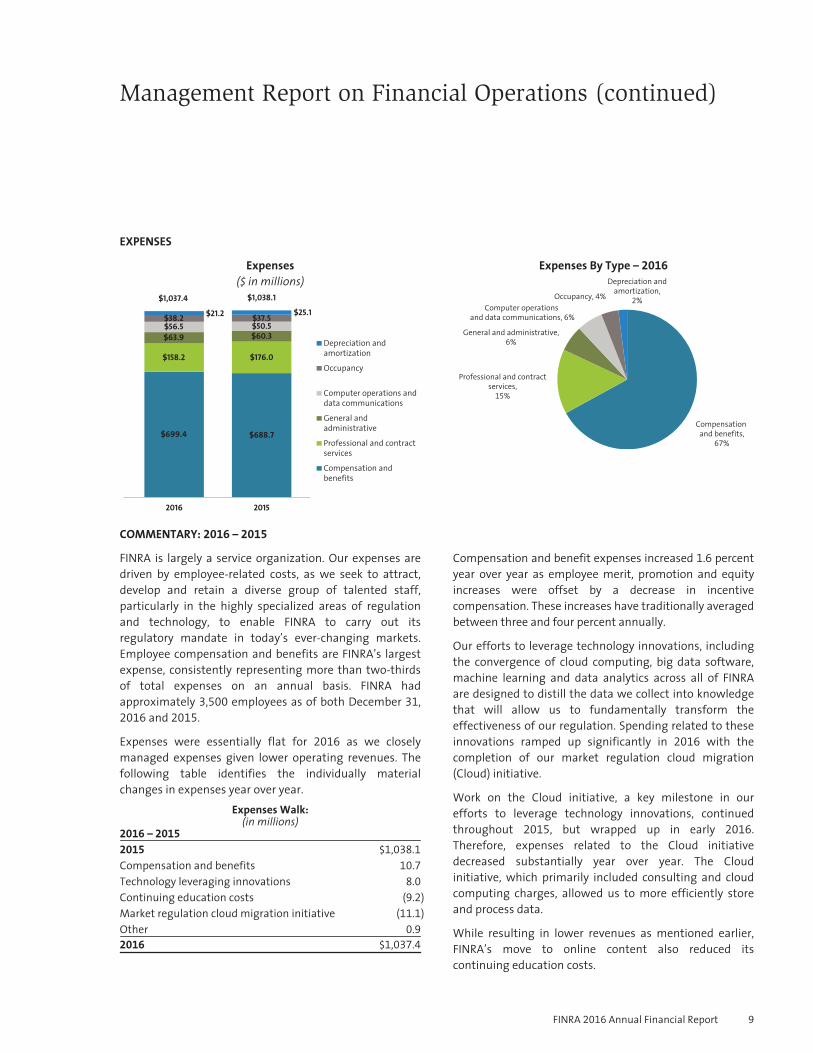
EXPENSES
Expenses($ in millions)
2016 2015
Depreciation andamortization
Compensation andbenefits
Professional and contractservices
General andadministrative
Computer operations anddata communications
Occupancy
$1,037.4 $1,038.1
$688.7$699.4
$158.2
$63.9$56.5$38.2
$176.0
$60.3$50.5
$25.1$21.2 $37.5
Expenses By Type – 2016
Compensation and benefits,
67%
General and administrative,6%
Professional and contractservices,
15%
Occupancy, 4%
Computer operations and data communications, 6%
Depreciation andamortization,
2%
COMMENTARY: 2016 – 2015
FINRA is largely a service organization. Our expenses aredriven by employee-related costs, as we seek to attract,develop and retain a diverse group of talented staff,particularly in the highly specialized areas of regulationand technology, to enable FINRA to carry out itsregulatory mandate in today’s ever-changing markets.Employee compensation and benefits are FINRA’s largestexpense, consistently representing more than two-thirdsof total expenses on an annual basis. FINRA hadapproximately 3,500 employees as of both December 31,2016 and 2015.
Expenses were essentially flat for 2016 as we closelymanaged expenses given lower operating revenues. Thefollowing table identifies the individually materialchanges in expenses year over year.
Expenses Walk:(in millions)
2016 – 2015
2015 $1,038.1
Compensation and benefits 10.7
Technology leveraging innovations 8.0
Continuing education costs (9.2)
Market regulation cloud migration initiative (11.1)
Other 0.9
2016 $1,037.4
Compensation and benefit expenses increased 1.6 percentyear over year as employee merit, promotion and equityincreases were offset by a decrease in incentivecompensation. These increases have traditionally averagedbetween three and four percent annually.
Our efforts to leverage technology innovations, includingthe convergence of cloud computing, big data software,machine learning and data analytics across all of FINRAare designed to distill the data we collect into knowledgethat will allow us to fundamentally transform theeffectiveness of our regulation. Spending related to theseinnovations ramped up significantly in 2016 with thecompletion of our market regulation cloud migration(Cloud) initiative.
Work on the Cloud initiative, a key milestone in ourefforts to leverage technology innovations, continuedthroughout 2015, but wrapped up in early 2016.Therefore, expenses related to the Cloud initiativedecreased substantially year over year. The Cloudinitiative, which primarily included consulting and cloudcomputing charges, allowed us to more efficiently storeand process data.
While resulting in lower revenues as mentioned earlier,FINRA’s move to online content also reduced itscontinuing education costs.
FINRA 2016 Annual Financial Report 9
Management Report on Financial Operations (continued)
INVESTMENT RETURNS
COMMENTARY: 2016 – 2015
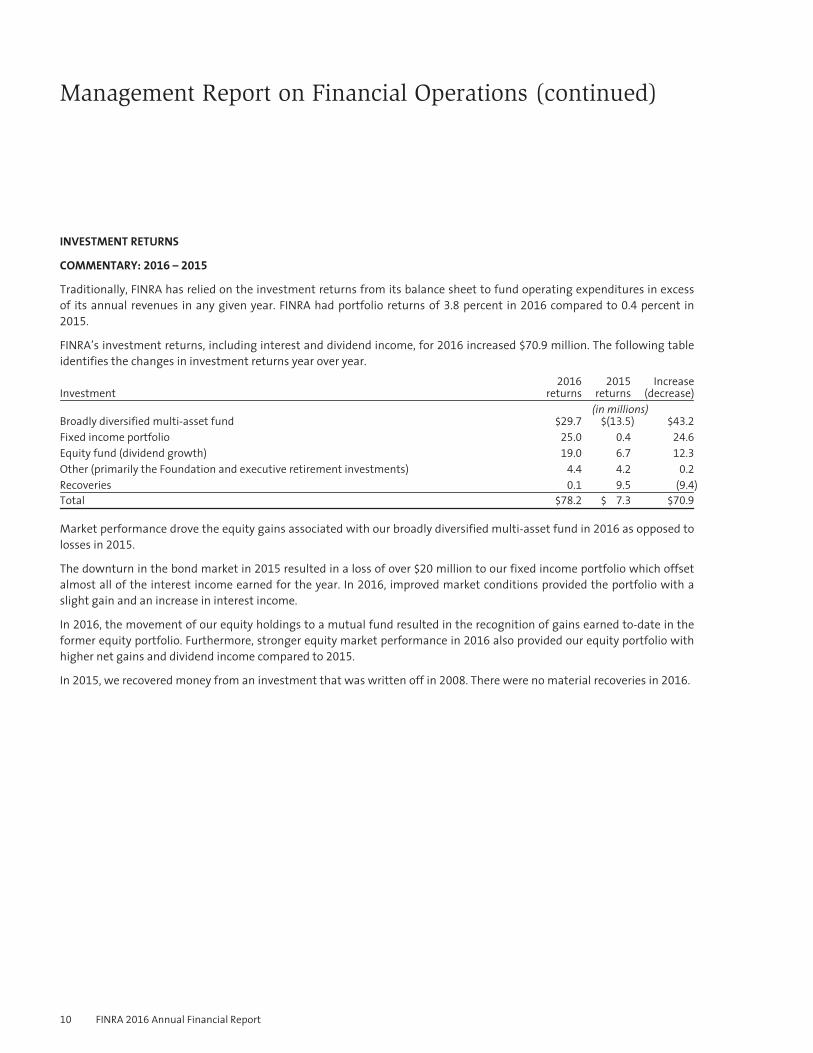
Traditionally, FINRA has relied on the investment returns from its balance sheet to fund operating expenditures in excessof its annual revenues in any given year. FINRA had portfolio returns of 3.8 percent in 2016 compared to 0.4 percent in2015.
FINRA’s investment returns, including interest and dividend income, for 2016 increased $70.9 million. The following tableidentifies the changes in investment returns year over year.
Investment2016
returns2015
returnsIncrease
(decrease)(in millions)
Broadly diversified multi-asset fund $29.7 $(13.5) $43.2
Fixed income portfolio 25.0 0.4 24.6
Equity fund (dividend growth) 19.0 6.7 12.3
Other (primarily the Foundation and executive retirement investments) 4.4 4.2 0.2
Recoveries 0.1 9.5 (9.4)
Total $78.2 $ 7.3 $70.9
Market performance drove the equity gains associated with our broadly diversified multi-asset fund in 2016 as opposed tolosses in 2015.
The downturn in the bond market in 2015 resulted in a loss of over $20 million to our fixed income portfolio which offsetalmost all of the interest income earned for the year. In 2016, improved market conditions provided the portfolio with aslight gain and an increase in interest income.
In 2016, the movement of our equity holdings to a mutual fund resulted in the recognition of gains earned to-date in theformer equity portfolio. Furthermore, stronger equity market performance in 2016 also provided our equity portfolio withhigher net gains and dividend income compared to 2015.
In 2015, we recovered money from an investment that was written off in 2008. There were no material recoveries in 2016.
10 FINRA 2016 Annual Financial Report
Management Report on Financial Operations (continued)
FINES
FINRA is dedicated to investor protection and market integrity through effective and efficient regulation of broker-dealers.Our job is to protect America’s investors by making sure the broker-dealer industry operates fairly and honestly. We do thisby writing and enforcing rules governing the activities of broker-dealers, examining firms for compliance with those rules,fostering market transparency and educating investors.
One of FINRA’s top priorities is to advance investor confidence in the securities markets through vigorous, fair andeffective enforcement of FINRA rules and federal securities regulations. We focus not only on bringing disciplinary actionsand levying fines, but also on ordering restitution for harmed investors.
Fines represent sanctions for rule violations. The National Adjudicatory Council (NAC) has developed the FINRA SanctionGuidelines for use by the various bodies adjudicating disciplinary decisions, including Hearing Panels and the NAC itself, indetermining appropriate remedial sanctions. FINRA publishes the FINRA Sanction Guidelines so that members, associatedpersons and their counsel may become more familiar with the types of disciplinary sanctions that may be applicable tovarious violations.
FINRA recognizes fines upon issuance of a written consent or disciplinary decision. We do not view fines as part of ouroperating revenues. The use of fine monies is limited to capital expenditures and regulatory projects, such as our efforts toleverage technology innovations and the Cloud initiative, and other projects as appropriate, which are reported to andapproved by our Finance, Operations and Technology Committee and Board.
While the number of monetary sanctions decreased approximately 10 percent from 691 in 2015 to 624 in 2016, total finesincreased $80.0 million in 2016 to $173.8 million. We also ordered $27.9 million in restitution to harmed investors during2016.
FINRA 2016 Annual Financial Report 11
Management Report on Financial Operations (continued)
BALANCE SHEET
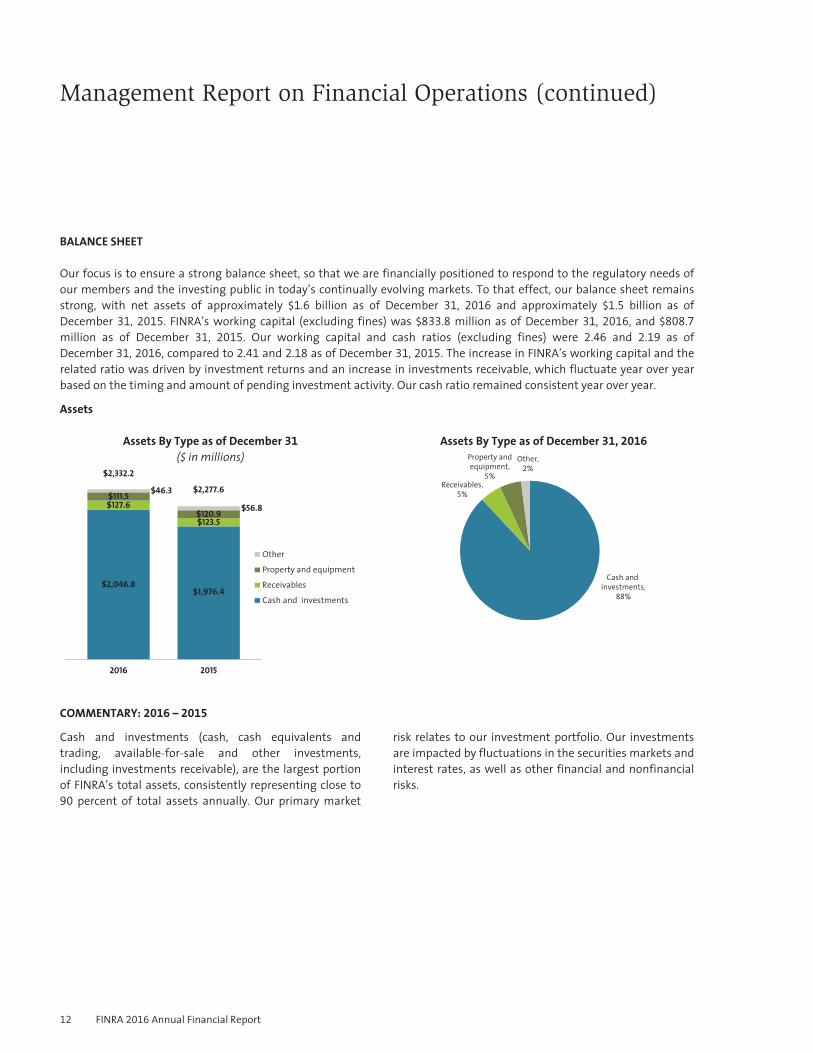
Our focus is to ensure a strong balance sheet, so that we are financially positioned to respond to the regulatory needs ofour members and the investing public in today’s continually evolving markets. To that effect, our balance sheet remainsstrong, with net assets of approximately $1.6 billion as of December 31, 2016 and approximately $1.5 billion as ofDecember 31, 2015. FINRA’s working capital (excluding fines) was $833.8 million as of December 31, 2016, and $808.7
million as of December 31, 2015. Our working capital and cash ratios (excluding fines) were 2.46 and 2.19 as ofDecember 31, 2016, compared to 2.41 and 2.18 as of December 31, 2015. The increase in FINRA’s working capital and therelated ratio was driven by investment returns and an increase in investments receivable, which fluctuate year over yearbased on the timing and amount of pending investment activity. Our cash ratio remained consistent year over year.
Assets
Assets By Type as of December 31
($ in millions)$2,332.2
$2,277.6
$1,976.4$2,046.8
$127.6$111.5
$123.5$120.9
$46.3$56.8
Cash and investments
2016 2015
Receivables
Property and equipment
Other
Assets By Type as of December 31, 2016
Property andequipment,
5%
Receivables,5%
Other,2%
Cash and investments,
88%
COMMENTARY: 2016 – 2015
Cash and investments (cash, cash equivalents andtrading, available-for-sale and other investments,including investments receivable), are the largest portionof FINRA’s total assets, consistently representing close to90 percent of total assets annually. Our primary market
risk relates to our investment portfolio. Our investmentsare impacted by fluctuations in the securities markets andinterest rates, as well as other financial and nonfinancialrisks.
12 FINRA 2016 Annual Financial Report
Management Report on Financial Operations (continued)
Assets (continued)
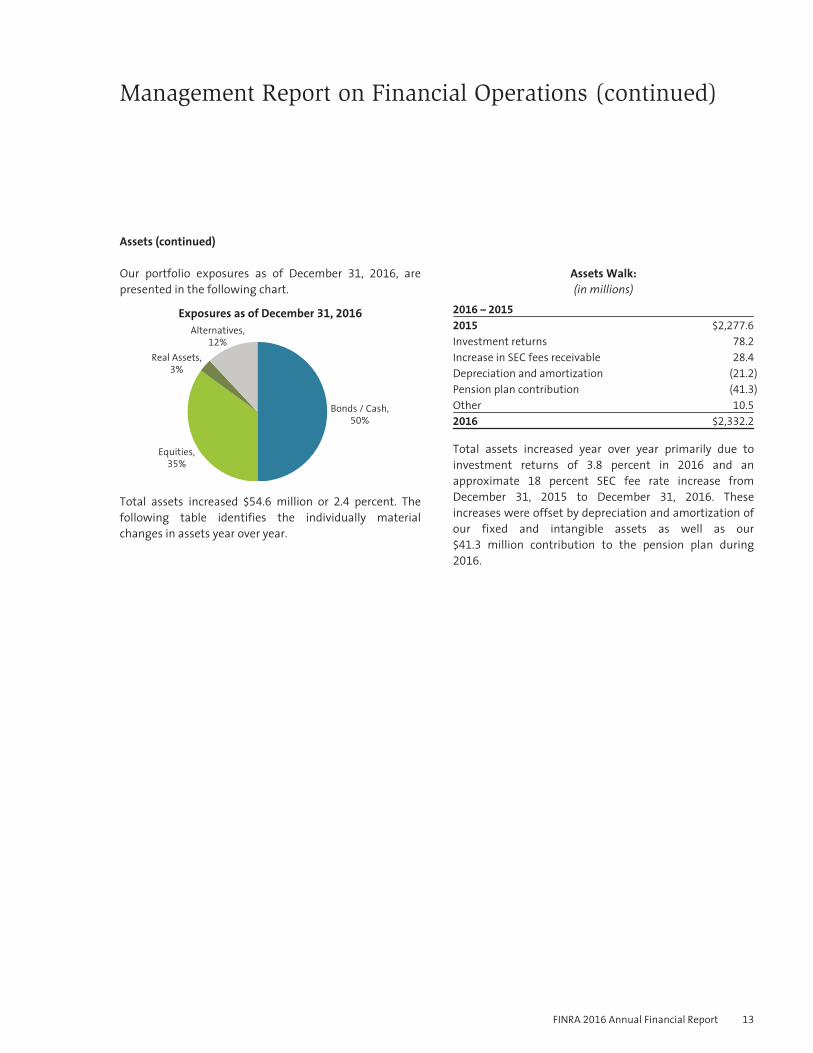
Our portfolio exposures as of December 31, 2016, arepresented in the following chart.
Exposures as of December 31, 2016
Bonds / Cash,50%
Equities,35%
Real Assets,3%
Alternatives,12%
Total assets increased $54.6 million or 2.4 percent. Thefollowing table identifies the individually materialchanges in assets year over year.
Assets Walk:(in millions)
2016 – 2015
2015 $2,277.6
Investment returns 78.2
Increase in SEC fees receivable 28.4
Depreciation and amortization (21.2)
Pension plan contribution (41.3)
Other 10.5
2016 $2,332.2
Total assets increased year over year primarily due toinvestment returns of 3.8 percent in 2016 and anapproximate 18 percent SEC fee rate increase fromDecember 31, 2015 to December 31, 2016. Theseincreases were offset by depreciation and amortization ofour fixed and intangible assets as well as our$41.3 million contribution to the pension plan during2016.
FINRA 2016 Annual Financial Report 13
Management Report on Financial Operations (continued)
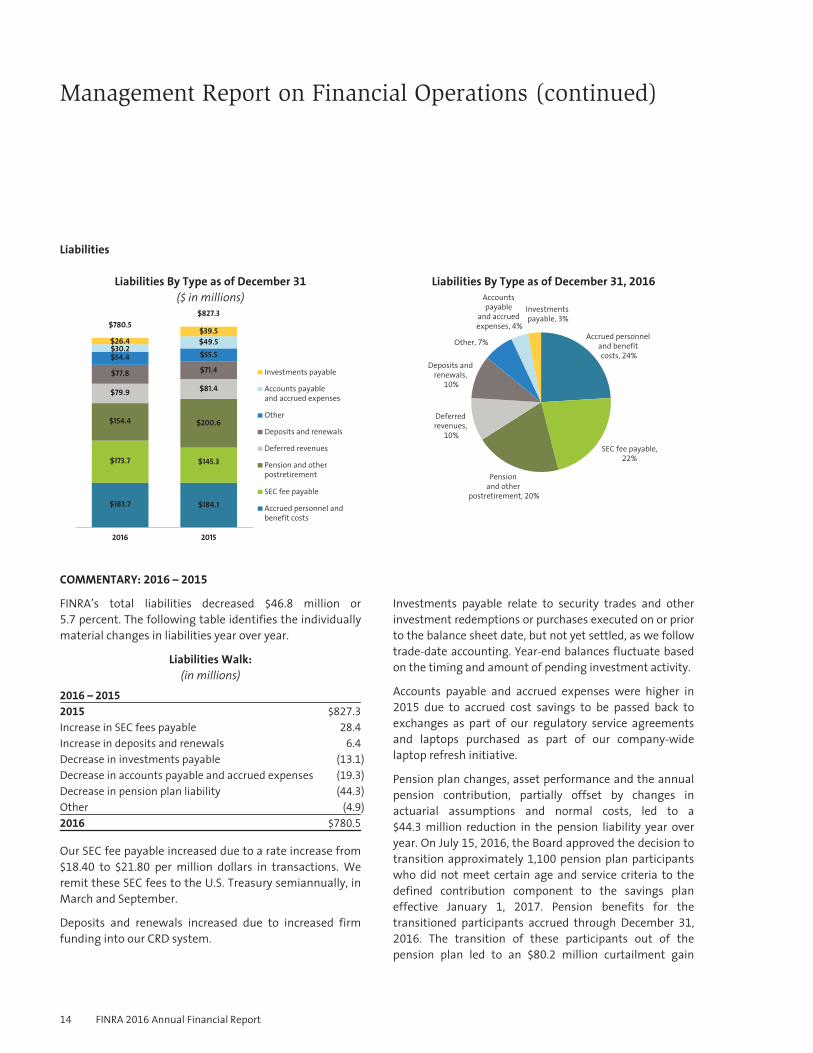
Liabilities
Liabilities By Type as of December 31
($ in millions)
$780.5$827.3
2016 2015
Other
Deferred revenues
Pension and other postretirement
SEC fee payable
Investments payable
$183.7 $184.1
$173.7 $145.3
$200.6
$81.4
$71.4$55.5$49.5$39.5
$154.4
$79.9
$77.8$54.4$30.2$26.4
Accrued personnel and benefit costs
Deposits and renewals
Accounts payable and accrued expenses
Liabilities By Type as of December 31, 2016
Other, 7%
Deferred revenues,
10%
Pension and other
postretirement, 20%
SEC fee payable, 22%
Investments payable, 3%
Accrued personnel and benefit costs, 24%
Deposits and renewals,
10%
Accounts payable
and accrued expenses, 4%
COMMENTARY: 2016 – 2015
FINRA’s total liabilities decreased $46.8 million or5.7 percent. The following table identifies the individuallymaterial changes in liabilities year over year.
Liabilities Walk:(in millions)
2016 – 2015
2015 $827.3
Increase in SEC fees payable 28.4
Increase in deposits and renewals 6.4
Decrease in investments payable (13.1)
Decrease in accounts payable and accrued expenses (19.3)
Decrease in pension plan liability (44.3)
Other (4.9)
2016 $780.5
Our SEC fee payable increased due to a rate increase from$18.40 to $21.80 per million dollars in transactions. Weremit these SEC fees to the U.S. Treasury semiannually, inMarch and September.
Deposits and renewals increased due to increased firmfunding into our CRD system.
Investments payable relate to security trades and otherinvestment redemptions or purchases executed on or priorto the balance sheet date, but not yet settled, as we followtrade-date accounting. Year-end balances fluctuate basedon the timing and amount of pending investment activity.
Accounts payable and accrued expenses were higher in2015 due to accrued cost savings to be passed back toexchanges as part of our regulatory service agreementsand laptops purchased as part of our company-widelaptop refresh initiative.
Pension plan changes, asset performance and the annualpension contribution, partially offset by changes inactuarial assumptions and normal costs, led to a$44.3 million reduction in the pension liability year overyear. On July 15, 2016, the Board approved the decision totransition approximately 1,100 pension plan participantswho did not meet certain age and service criteria to thedefined contribution component to the savings planeffective January 1, 2017. Pension benefits for thetransitioned participants accrued through December 31,
2016. The transition of these participants out of thepension plan led to an $80.2 million curtailment gain
14 FINRA 2016 Annual Financial Report
Management Report on Financial Operations (continued)
Liabilities (continued)
which decreased the pension plan liability. Favorableasset performance of $26.8 million and our pensioncontribution of $41.3 million also decreased the pensionliability. Offsetting these decreases were $54.3 million ofactuarial losses and $49.7 million of service and interestcosts. The actuarial losses were driven by a decrease in thediscount rate from 4.5 percent at December 31, 2015, to4.25 percent at December 31, 2016, coupled with a50 basis point reduction in lump sum rates. Service andinterest costs represent benefits attributed to the currentyear. The $80.2 million curtailment gain correspondinglyincreased equity, while the $54.3 million of actuariallosses correspondingly decreased equity.
Pension and other postretirement benefit costs representa significant liability to FINRA in terms of both theassumptions used to estimate the liability and its portionof FINRA’s total liabilities. These costs have historicallyrepresented close to 25 percent of total liabilities on anannual basis, although that percentage dropped to20 percent in 2016 in light of the transition discussedabove. Further disclosures regarding the assumptionsused in determining our pension and otherpostretirement liabilities can be found in Note 2,“Summary of Significant Accounting Policies.”
FINRA 2016 Annual Financial Report 15
Management Report on Financial Operations (continued)
LIQUIDITY AND CAPITAL RESOURCESLiquidity is the ongoing ability to fund asset growth and business operations and meet contractual obligations throughunrestricted access to funding at reasonable market rates. Liquidity management involves forecasting fundingrequirements and maintaining sufficient working capital to meet business needs and accommodate fluctuations in assetand liability levels due to changes in business operations or unanticipated events. We primarily rely on operating cashflows to fund current and future operations.FINRA’s investment portfolio (the Portfolio) is governed by a policy based on the degree of risk deemed appropriate forFINRA assets by the Board as applied to its investment objectives. FINRA’s Investment Committee, whose members haveextensive background and experience in the investment community, provides overall guidance and advice in determiningthe appropriate policy and allocation for the Portfolio. As of December 31, 2016, the Portfolio remained highly liquid, with60 percent available in 30 days or less.
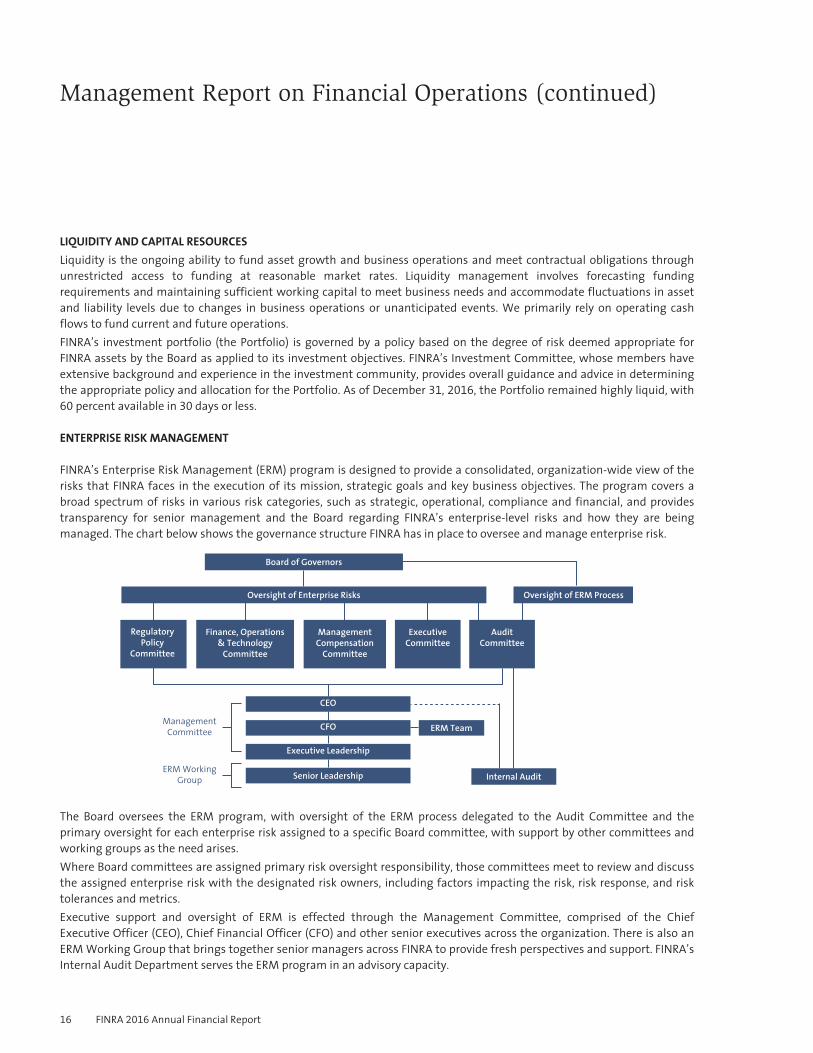
ENTERPRISE RISK MANAGEMENT
FINRA’s Enterprise Risk Management (ERM) program is designed to provide a consolidated, organization-wide view of therisks that FINRA faces in the execution of its mission, strategic goals and key business objectives. The program covers abroad spectrum of risks in various risk categories, such as strategic, operational, compliance and financial, and providestransparency for senior management and the Board regarding FINRA’s enterprise-level risks and how they are beingmanaged. The chart below shows the governance structure FINRA has in place to oversee and manage enterprise risk.
ManagementCommittee
Board of Governors
Oversight of Enterprise Risks
RegulatoryPolicy
Committee
Finance, Operations& Technology
Committee
ManagementCompensation
Committee
ERM Team
Internal Audit
ExecutiveCommittee
CEO
CFO
Executive Leadership
Senior Leadership
AuditCommittee
Oversight of ERM Process
ERM WorkingGroup
The Board oversees the ERM program, with oversight of the ERM process delegated to the Audit Committee and theprimary oversight for each enterprise risk assigned to a specific Board committee, with support by other committees andworking groups as the need arises.Where Board committees are assigned primary risk oversight responsibility, those committees meet to review and discussthe assigned enterprise risk with the designated risk owners, including factors impacting the risk, risk response, and risktolerances and metrics.Executive support and oversight of ERM is effected through the Management Committee, comprised of the ChiefExecutive Officer (CEO), Chief Financial Officer (CFO) and other senior executives across the organization. There is also anERM Working Group that brings together senior managers across FINRA to provide fresh perspectives and support. FINRA’sInternal Audit Department serves the ERM program in an advisory capacity.
16 FINRA 2016 Annual Financial Report
Management Report on Financial Operations (continued)
FINRA’s ERM program addresses a number of areas important to the execution of the organization’s mission, and FINRAmanagement is actively engaged with the Board in the program’s operations.
CONCLUSION
As noted in the letter from President and CEO Robert Cook, FINRA’s revenues for 2017 are projected to decline by aboutone percent. Additionally, we anticipate that expenses for 2017 will increase about two percent, and operating cash flowsare anticipated to be break even in 2017. Based on this forecast, we will continue to monitor the changing economicconditions and evaluate their potential impact on our organization, as well as evaluate cost-savings initiatives and reviewour fee structure to ensure our strong financial position without compromising our regulatory mission.
FINRA 2016 Annual Financial Report 17
Management Report on Internal Control Over Financial Reporting
FINRA management is responsible for the preparation and integrity of the consolidated financial statements appearing inour annual report. The consolidated financial statements were prepared in conformity with U.S. generally acceptedaccounting principles (U.S. GAAP) and include amounts based on management’s estimates and judgments. FINRAmanagement is also responsible for establishing and maintaining adequate internal control over financial reporting andfor the assessment of the effectiveness of internal control over financial reporting. Internal control over financial reportingis a process designed by management to provide reasonable assurance regarding the reliability of financial reporting andthe preparation of financial statements in accordance with U.S. GAAP.
FINRA maintains a system of internal control that is designed to provide reasonable assurance as to the fair and reliablepreparation and presentation of the consolidated financial statements, as well as to safeguard assets from unauthorizeduse or disposition that could have a material effect on the consolidated financial statements. FINRA’s internal control overfinancial reporting includes written policies and procedures that 1) pertain to the maintenance of records that, inreasonable detail, accurately and fairly reflect the transactions and dispositions of FINRA’s assets; 2) provide reasonableassurance that transactions are recorded as necessary to permit preparation of consolidated financial statements inaccordance with U.S. GAAP, and that receipts and expenditures of FINRA are being made only in accordance withauthorizations of FINRA’s management and governors; and 3) provide reasonable assurance regarding prevention ortimely detection of unauthorized acquisition, use or disposition of FINRA’s assets that could have a material effect on theconsolidated financial statements.
Because of its inherent limitations, internal control over financial reporting may not prevent or detect misstatements dueto error or fraud, including the possibility of the circumvention or overriding of controls. Projections of any evaluation ofeffectiveness to future periods are subject to the risk that controls may become inadequate because of changes inconditions, or that the degree of compliance with the policies or procedures may deteriorate.
Under the supervision of the President and Chief Executive Officer and the Chief Financial Officer, FINRA’s managementassessed the effectiveness of FINRA’s internal control over financial reporting as of December 31, 2016. In making thisassessment, management used the criteria set forth by the Committee of Sponsoring Organizations of the TreadwayCommission in Internal Control–Integrated Framework (2013 framework). This evaluation included reviews of thedocumentation of controls, evaluations of the design effectiveness of controls, tests of the operating effectiveness ofcontrols and a conclusion on management’s evaluation. Based on this assessment, we assert that FINRA maintainedeffective internal control over financial reporting as of December 31, 2016.
FINRA’s consolidated financial statements included in this annual report have been audited by Ernst & Young LLP (EY), anindependent registered public accounting firm. EY has also issued an attestation report on FINRA’s internal control overfinancial reporting as of December 31, 2016.
June 26, 2017
Robert W. CookPresident and Chief Executive Officer
Todd T. DiganciExecutive Vice President – Chief Financial Officer andChief Administrative Officer
18 FINRA 2016 Annual Financial Report
Investment Committee ReportYear Ended December 31, 2016
The FINRA investment portfolio* was created to support FINRA in fulfilling its mission to protect investors and maintainmarket integrity by providing FINRA with supplemental financial resources. FINRA’s investment policy strives to preserveprincipal, in real terms, while seeking to earn a long-term rate of return commensurate with the degree of risk deemedappropriate for FINRA assets by the Board of Governors (Board). Distributions from the portfolio are subject to priorapproval by the Board.
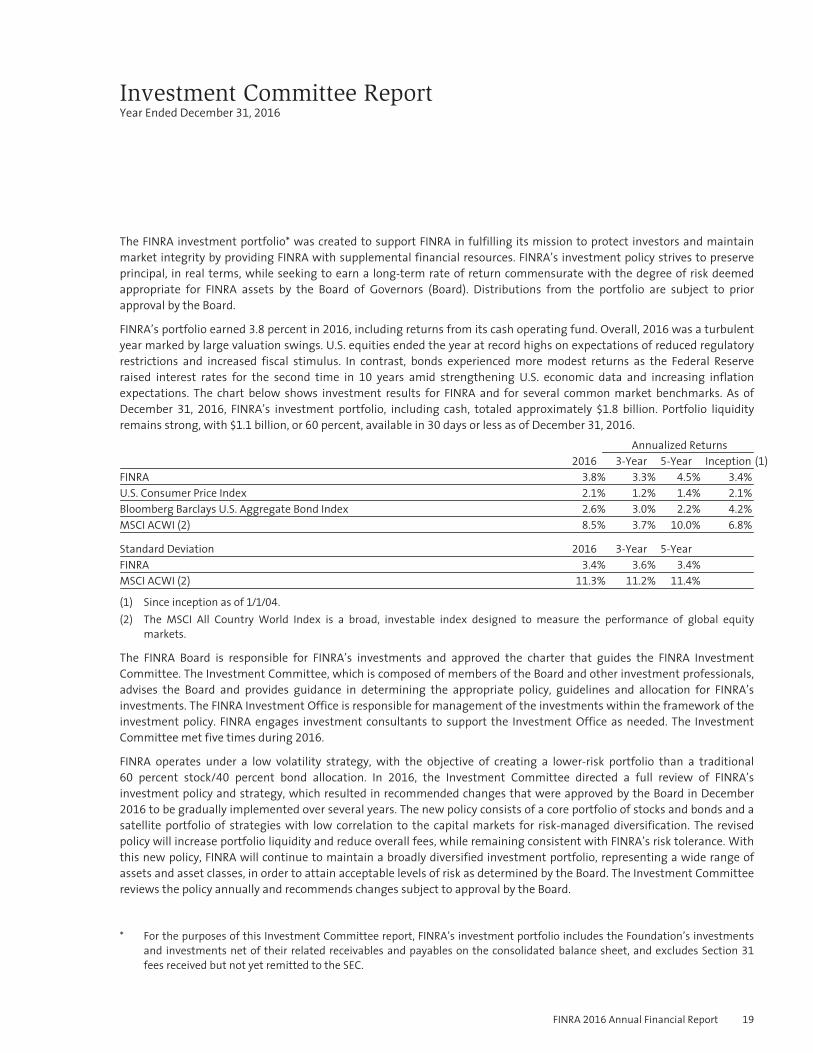
FINRA’s portfolio earned 3.8 percent in 2016, including returns from its cash operating fund. Overall, 2016 was a turbulentyear marked by large valuation swings. U.S. equities ended the year at record highs on expectations of reduced regulatoryrestrictions and increased fiscal stimulus. In contrast, bonds experienced more modest returns as the Federal Reserveraised interest rates for the second time in 10 years amid strengthening U.S. economic data and increasing inflationexpectations. The chart below shows investment results for FINRA and for several common market benchmarks. As ofDecember 31, 2016, FINRA’s investment portfolio, including cash, totaled approximately $1.8 billion. Portfolio liquidityremains strong, with $1.1 billion, or 60 percent, available in 30 days or less as of December 31, 2016.
Annualized Returns2016 3-Year 5-Year Inception (1)
FINRA 3.8% 3.3% 4.5% 3.4%
U.S. Consumer Price Index 2.1% 1.2% 1.4% 2.1%
Bloomberg Barclays U.S. Aggregate Bond Index 2.6% 3.0% 2.2% 4.2%
MSCI ACWI (2) 8.5% 3.7% 10.0% 6.8%
Standard Deviation 2016 3-Year 5-YearFINRA 3.4% 3.6% 3.4%
MSCI ACWI (2) 11.3% 11.2% 11.4%
(1) Since inception as of 1/1/04.(2) The MSCI All Country World Index is a broad, investable index designed to measure the performance of global equity
markets.
The FINRA Board is responsible for FINRA’s investments and approved the charter that guides the FINRA InvestmentCommittee. The Investment Committee, which is composed of members of the Board and other investment professionals,advises the Board and provides guidance in determining the appropriate policy, guidelines and allocation for FINRA’sinvestments. The FINRA Investment Office is responsible for management of the investments within the framework of theinvestment policy. FINRA engages investment consultants to support the Investment Office as needed. The InvestmentCommittee met five times during 2016.
FINRA operates under a low volatility strategy, with the objective of creating a lower-risk portfolio than a traditional60 percent stock/40 percent bond allocation. In 2016, the Investment Committee directed a full review of FINRA’sinvestment policy and strategy, which resulted in recommended changes that were approved by the Board in December2016 to be gradually implemented over several years. The new policy consists of a core portfolio of stocks and bonds and asatellite portfolio of strategies with low correlation to the capital markets for risk-managed diversification. The revisedpolicy will increase portfolio liquidity and reduce overall fees, while remaining consistent with FINRA’s risk tolerance. Withthis new policy, FINRA will continue to maintain a broadly diversified investment portfolio, representing a wide range ofassets and asset classes, in order to attain acceptable levels of risk as determined by the Board. The Investment Committeereviews the policy annually and recommends changes subject to approval by the Board.
* For the purposes of this Investment Committee report, FINRA’s investment portfolio includes the Foundation’s investmentsand investments net of their related receivables and payables on the consolidated balance sheet, and excludes Section 31
fees received but not yet remitted to the SEC.
FINRA 2016 Annual Financial Report 19
Investment Committee Report (continued)
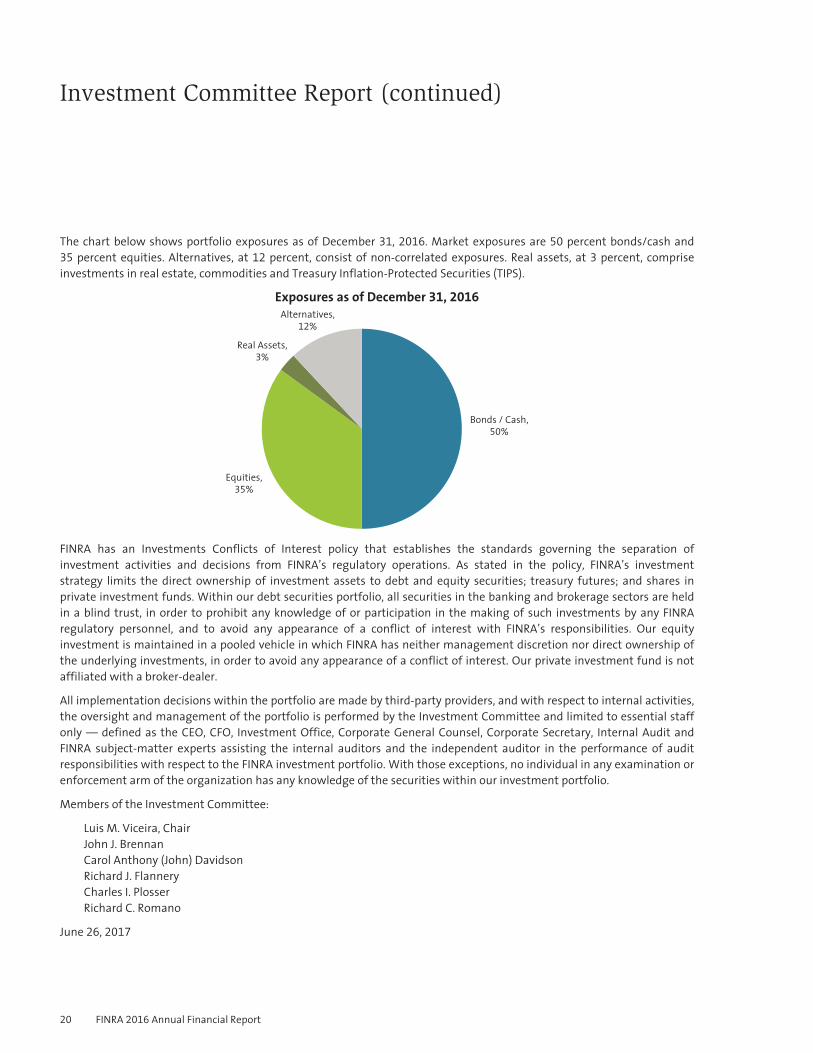
The chart below shows portfolio exposures as of December 31, 2016. Market exposures are 50 percent bonds/cash and35 percent equities. Alternatives, at 12 percent, consist of non-correlated exposures. Real assets, at 3 percent, compriseinvestments in real estate, commodities and Treasury Inflation-Protected Securities (TIPS).
Exposures as of December 31, 2016
Bonds / Cash,50%
Equities,35%
Real Assets,3%
Alternatives,12%
FINRA has an Investments Conflicts of Interest policy that establishes the standards governing the separation ofinvestment activities and decisions from FINRA’s regulatory operations. As stated in the policy, FINRA’s investmentstrategy limits the direct ownership of investment assets to debt and equity securities; treasury futures; and shares inprivate investment funds. Within our debt securities portfolio, all securities in the banking and brokerage sectors are heldin a blind trust, in order to prohibit any knowledge of or participation in the making of such investments by any FINRAregulatory personnel, and to avoid any appearance of a conflict of interest with FINRA’s responsibilities. Our equityinvestment is maintained in a pooled vehicle in which FINRA has neither management discretion nor direct ownership ofthe underlying investments, in order to avoid any appearance of a conflict of interest. Our private investment fund is notaffiliated with a broker-dealer.
All implementation decisions within the portfolio are made by third-party providers, and with respect to internal activities,the oversight and management of the portfolio is performed by the Investment Committee and limited to essential staffonly — defined as the CEO, CFO, Investment Office, Corporate General Counsel, Corporate Secretary, Internal Audit andFINRA subject-matter experts assisting the internal auditors and the independent auditor in the performance of auditresponsibilities with respect to the FINRA investment portfolio. With those exceptions, no individual in any examination orenforcement arm of the organization has any knowledge of the securities within our investment portfolio.
Members of the Investment Committee:
Luis M. Viceira, ChairJohn J. BrennanCarol Anthony (John) DavidsonRichard J. FlanneryCharles I. PlosserRichard C. Romano
June 26, 2017
20 FINRA 2016 Annual Financial Report
Audit Committee Report
The Audit Committee of the Board of Governors (Board) assists the Board in fulfilling its responsibility for Board oversightof the quality and integrity of the accounting, auditing and financial reporting practices of FINRA in accordance with theCharter adopted by the Board.
Each member of the Audit Committee is an independent director as defined by the Securities and Exchange Commission’s(SEC) Rule 10A-3 under The Securities Exchange Act of 1934, Listing Standards Relating to Audit Committees. In addition,the Audit Committee and Board have determined that Leslie F. Seidman and John Davidson are audit committee financialexperts, as defined by the SEC.
During 2016, the Audit Committee met seven times.
The Charter and the By-Laws of FINRA make the Chief Audit Executive directly responsible to the Audit Committee. In allrespects, the Charter complies with standards applicable to publicly-owned companies. (The Charter for the FINRA AuditCommittee is available at: http://www.finra.org/about/audit-committee-charter.)
Additionally, the Charter gives the Audit Committee responsibility for monitoring the independence of the independentauditor, recommending the appointment of the independent auditor for approval by the Board, ensuring sufficient scopeof independent auditor activities to perform an adequate financial statement audit and ensuring the independent auditoris fairly and appropriately compensated for its effort. The Charter makes clear that the independent auditor is accountableto the Audit Committee and the Board, as representatives of the members and the public. In addition, the AuditCommittee discusses significant areas of the audit engagement with the independent auditor, with and withoutmanagement present, as needed.
In discharging its oversight responsibility, the Audit Committee reviewed the assessments of audit risk and the audit plansof both the independent and internal auditors. The Audit Committee also discussed with management, the internalauditors, and the independent auditor the quality and adequacy of FINRA’s internal controls and the internal auditorganization, responsibilities, budget and staffing.
In conducting its formal annual assessment of the independent auditor, Audit Committee considerations include, but arenot limited to, the following factors: (i) the most recent results from surveys conducted by management regarding theperformance of the independent auditor, incorporating audit quality, the experience of the engagement team,reasonableness of audit cost, Public Company Accounting Oversight Board (PCAOB) audit results of the independentauditor and the ongoing strength of the independent audit firm’s reputation; (ii) the length of time the firm has served asFINRA’s independent auditor; and (iii) the timeliness of the independent auditor in escalating issues and reporting resultsto and answering questions proposed by the Audit Committee.
The lead audit partner, having primary responsibility for the audit, rotates off of the engagement every five years, and theAudit Committee is involved in the selection of the lead audit partner. The current lead audit partner was appointed in July2016.
Ernst & Young LLP (EY) has been FINRA’s independent auditor for approximately 25 years.
FINRA 2016 Annual Financial Report 21
Audit Committee Report (continued)
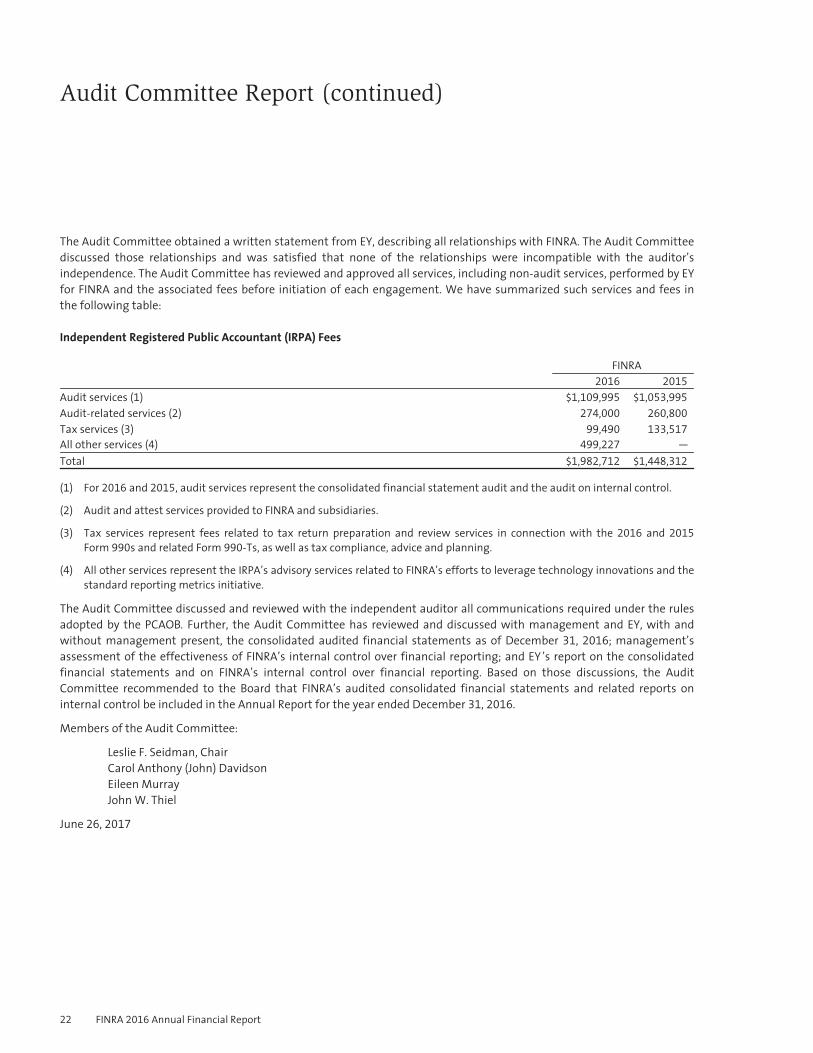
The Audit Committee obtained a written statement from EY, describing all relationships with FINRA. The Audit Committeediscussed those relationships and was satisfied that none of the relationships were incompatible with the auditor’sindependence. The Audit Committee has reviewed and approved all services, including non-audit services, performed by EYfor FINRA and the associated fees before initiation of each engagement. We have summarized such services and fees inthe following table:
Independent Registered Public Accountant (IRPA) Fees
FINRA2016 2015
Audit services (1) $1,109,995 $1,053,995
Audit-related services (2) 274,000 260,800
Tax services (3) 99,490 133,517
All other services (4) 499,227 —
Total $1,982,712 $1,448,312
(1) For 2016 and 2015, audit services represent the consolidated financial statement audit and the audit on internal control.
(2) Audit and attest services provided to FINRA and subsidiaries.
(3) Tax services represent fees related to tax return preparation and review services in connection with the 2016 and 2015
Form 990s and related Form 990-Ts, as well as tax compliance, advice and planning.
(4) All other services represent the IRPA’s advisory services related to FINRA’s efforts to leverage technology innovations and thestandard reporting metrics initiative.
The Audit Committee discussed and reviewed with the independent auditor all communications required under the rulesadopted by the PCAOB. Further, the Audit Committee has reviewed and discussed with management and EY, with andwithout management present, the consolidated audited financial statements as of December 31, 2016; management’sassessment of the effectiveness of FINRA’s internal control over financial reporting; and EY ’s report on the consolidatedfinancial statements and on FINRA’s internal control over financial reporting. Based on those discussions, the AuditCommittee recommended to the Board that FINRA’s audited consolidated financial statements and related reports oninternal control be included in the Annual Report for the year ended December 31, 2016.
Members of the Audit Committee:
Leslie F. Seidman, ChairCarol Anthony (John) DavidsonEileen MurrayJohn W. Thiel
June 26, 2017
22 FINRA 2016 Annual Financial Report
Management Compensation Committee ReportYear Ended December 31, 2016
FINRA Compensation Philosophy
FINRA’s compensation philosophy is a pay-for-performance model that seeks to achieve pay levels in line with thecompetitive market while meeting the objectives of attracting, developing and retaining high-performing individuals whoare capable of achieving our mission, and to provide rewards commensurate with individual contributions and FINRA’soverall performance. This philosophy applies to employees at all levels within the organization.
Benchmarking
FINRA strives to be competitive with the external market when establishing starting pay rates, annual incentives andsalary structures. A number of external sources are leveraged to compile market data to establish these structures. FINRAuses specific position survey data to evaluate skill sets and benchmarks the compensation paid to internal talent todetermine whether compensation is comparable to the price that those skills would command on the open market.Ultimately, in assessing how to price staff positions, FINRA places an emphasis foremost on the demands andcompetitiveness of each job to ensure that FINRA is paying equitably for skills, expertise and performance level within theoverall context of remaining comparable to the market.
Defining the relevant employment market for competitive compensation benchmarking purposes is a significantchallenge for FINRA due to the scarcity of natural comparisons, the uniqueness of functions performed, the need forspecialized expertise in financial services and securities law and a constantly changing environment under heightenedscrutiny.
As part of its compensation philosophy, FINRA has determined that its competitive compensation positioning for allemployees should be considered against a broad section of financial services and capital market companies, as this is themost likely sector from which FINRA will recruit talent, and that would recruit talent away from the Company. FINRA alsobenchmarks against general industry positions and law departments for jobs that are not unique to the financial servicesindustry. FINRA recognizes that it does not provide fully competitive opportunities, particularly in the equity/long-termincentive area, when compared to certain global investment and securities firms. As a result, benchmarking for keyexecutives will follow the same philosophy but with ranges geared to offset the lack of long-term incentives.
Executive Compensation
The Management Compensation Committee (the Committee), which is composed solely of public members of the Boardof Governors (Board), is responsible for approving salary levels and incentive compensation ranges for top-level executives.The Committee determines the incentive compensation awards based on actual performance. In determining salary andincentive compensation, management and the Committee consider operational, strategic and financial factors in additionto individual performance. The salary and incentive compensation recommendations for the CEO are reviewed andapproved by the Board annually. The Committee met six times during 2016.
FINRA 2016 Annual Financial Report 23
Management Compensation Committee Report (continued)
The Committee has the sole right and responsibility to hire and terminate a compensation consultant. In 2016, as in pastyears, the Committee engaged Mercer, Inc. (Mercer), an independent third-party compensation consultant, to prepare acompensation study, which included objective analysis of current compensation levels and benchmarking usinginformation from a comparable segment of the market for key executives. To ensure the independence of Mercer:
▪ throughout the year, Mercer reported directly and exclusively to the Committee;▪ no Mercer employee is hired by FINRA;▪ Mercer provides no significant services, other than compensation consulting services, to FINRA;▪ any interaction between Mercer and FINRA executive management is limited to discussions on behalf of the
Committee and information that is presented to the Committee for approval; and▪ fees paid to Mercer for compensation consulting services are reasonable and in line with industry standards.
In determining a benchmarking strategy for key executives, financial services organizations (broker-dealers, investmentbanks, Federal Reserve banks, commercial banks, insurance companies, exchanges and regulators) were determined to bethe most relevant group for comparison purposes. The Committee and Mercer engaged in substantial research andconsideration of the functions and operations of several potential comparisons as well as general competitive conditions.Ultimately, the Committee approved a benchmarking process for key executives that focused on the following sources:
▪ Public comparison group comprised of a blend of financial services organizations engaged in brokerage orother related banking activities.
▪ Public exchanges and regulators.▪ Financial services industry survey data.
The Committee will routinely review the aforementioned sources in determining annual salary and incentivecompensation.
24 FINRA 2016 Annual Financial Report
Management Compensation Committee Report (continued)
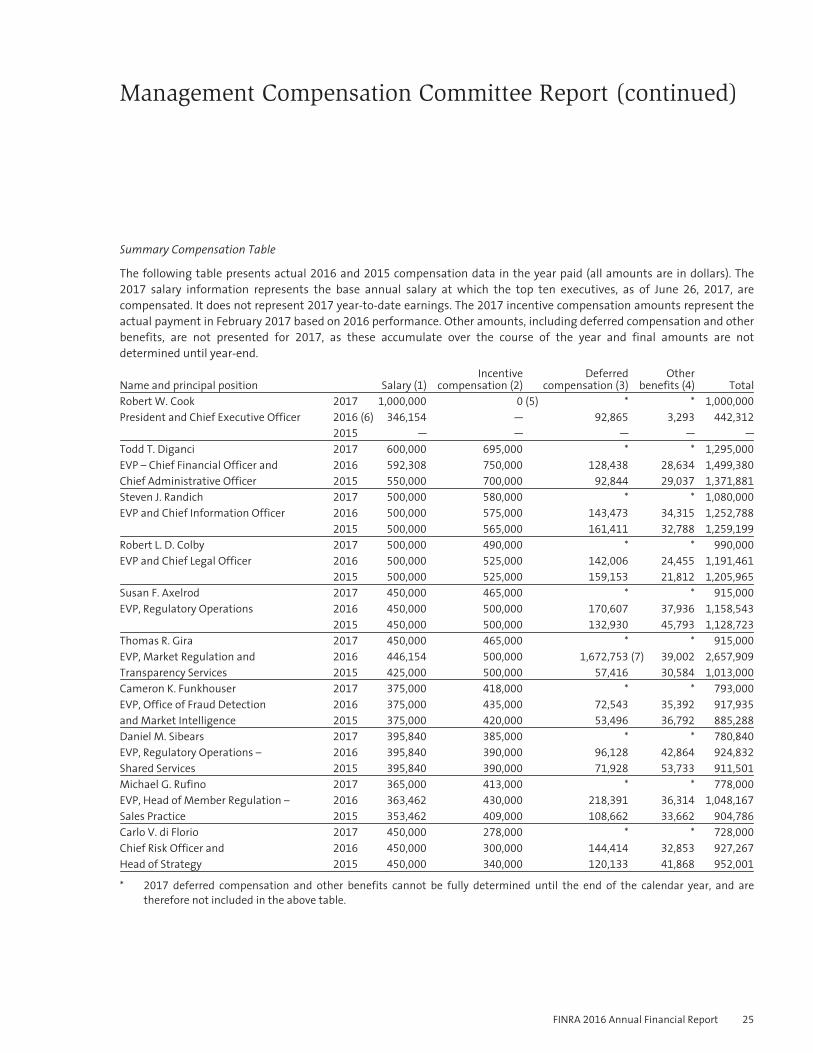
Summary Compensation Table
The following table presents actual 2016 and 2015 compensation data in the year paid (all amounts are in dollars). The2017 salary information represents the base annual salary at which the top ten executives, as of June 26, 2017, arecompensated. It does not represent 2017 year-to-date earnings. The 2017 incentive compensation amounts represent theactual payment in February 2017 based on 2016 performance. Other amounts, including deferred compensation and otherbenefits, are not presented for 2017, as these accumulate over the course of the year and final amounts are notdetermined until year-end.
Name and principal position Salary (1)Incentive
compensation (2)Deferred
compensation (3)Other
benefits (4) TotalRobert W. Cook 2017 1,000,000 0 (5) * * 1,000,000
President and Chief Executive Officer 2016 (6) 346,154 — 92,865 3,293 442,312
2015 — — — — —
Todd T. Diganci 2017 600,000 695,000 * * 1,295,000
EVP – Chief Financial Officer andChief Administrative Officer
2016 592,308 750,000 128,438 28,634 1,499,380
2015 550,000 700,000 92,844 29,037 1,371,881
Steven J. Randich 2017 500,000 580,000 * * 1,080,000
EVP and Chief Information Officer 2016 500,000 575,000 143,473 34,315 1,252,788
2015 500,000 565,000 161,411 32,788 1,259,199
Robert L. D. Colby 2017 500,000 490,000 * * 990,000
EVP and Chief Legal Officer 2016 500,000 525,000 142,006 24,455 1,191,461
2015 500,000 525,000 159,153 21,812 1,205,965
Susan F. Axelrod 2017 450,000 465,000 * * 915,000
EVP, Regulatory Operations 2016 450,000 500,000 170,607 37,936 1,158,543
2015 450,000 500,000 132,930 45,793 1,128,723
Thomas R. Gira 2017 450,000 465,000 * * 915,000
EVP, Market Regulation and 2016 446,154 500,000 1,672,753 (7) 39,002 2,657,909
Transparency Services 2015 425,000 500,000 57,416 30,584 1,013,000
Cameron K. Funkhouser 2017 375,000 418,000 * * 793,000
EVP, Office of Fraud Detection 2016 375,000 435,000 72,543 35,392 917,935
and Market Intelligence 2015 375,000 420,000 53,496 36,792 885,288
Daniel M. Sibears 2017 395,840 385,000 * * 780,840
EVP, Regulatory Operations – 2016 395,840 390,000 96,128 42,864 924,832
Shared Services 2015 395,840 390,000 71,928 53,733 911,501
Michael G. Rufino 2017 365,000 413,000 * * 778,000
EVP, Head of Member Regulation – 2016 363,462 430,000 218,391 36,314 1,048,167
Sales Practice 2015 353,462 409,000 108,662 33,662 904,786
Carlo V. di Florio 2017 450,000 278,000 * * 728,000
Chief Risk Officer and 2016 450,000 300,000 144,414 32,853 927,267
Head of Strategy 2015 450,000 340,000 120,133 41,868 952,001
* 2017 deferred compensation and other benefits cannot be fully determined until the end of the calendar year, and aretherefore not included in the above table.
FINRA 2016 Annual Financial Report 25
Management Compensation Committee Report (continued)
1 Salary is paid bi-weekly, one week in arrears. 2017 salary information represents the executives’ current base annual rate ofpay as of June 26, 2017.
2 Incentive compensation is paid after the close of the calendar year based on the prior year’s performance. Payments arereflected in the table above in the year paid, consistent with FINRA’s reporting in its Form 990 tax returns. Thus, the amountpresented in 2017 was paid in February 2017, based on 2016 performance.
3 Deferred compensation includes earnings and accruals in supplemental executive retirement plans, which are not availableto all employees. Mr. Diganci, Mr. Gira, Mr. Funkhouser and Mr. Sibears participate in FINRA’s supplemental defined benefitretirement plan, which is now closed to new participants. The remaining listed executives are participants in thesupplemental defined contribution retirement plan. Deferred compensation also includes employer-funded 401(k) matchingcontributions and the accrual of benefits in FINRA’s employee retirement plans. The 401(k) and retirement plans aregenerally available to all employees.
4 Other benefits include taxable and non-taxable benefits such as employer-paid health, life and disability insurance, whichare generally available to all employees. They also include parking, travel subsidies, tax gross-ups and other miscellaneousfringe benefits.
5 Mr. Cook was eligible for but declined to accept incentive compensation for 2016.6 The 2016 compensation for Mr. Cook represents a partial year of employment.7 This amount represents a one-time cliff vesting event within the supplemental defined benefit retirement plan, covering
more than 24 years of service to FINRA.
Components of Compensation
Direct Compensation
▪ Base salaries consist of job-grade structures to provide for appropriate flexibility in hiring and retention. Actualsalaries are based on job content, individual performance and relevant experience levels, and may fall above orbelow competitive levels.
▪ Incentive compensation is an additional “at-risk” compensation that is performance-based and determined inrelation to individual achievements and FINRA’s overall performance. The size of the actual award varies basedon goal achievement, performance, grade level and degree of responsibility within the organization. Ifawarded, it is paid as a lump sum in the following year.
Indirect Compensation
▪ Supplemental retirement benefits are provided for top executives and are either defined benefit or definedcontribution based on employment start date. These plans are non-qualified and are based on salary, officerlevel, and, depending on officer level, a portion of incentive compensation.
▪ Employee and family health, life and other insurance, pension and 401(k) deferral and matching programs,health club subsidies and other benefits are generally available to all employees. Additionally, certainexecutives receive miscellaneous taxable fringe benefits that may include parking, travel subsidies and similarminor items.
Members of the Management Compensation Committee:
Randal K. Quarles, ChairCarol Anthony (John) DavidsonShelly LazarusLuis M. Viceira
June 26, 2017
26 FINRA 2016 Annual Financial Report
Report of Independent Registered Public Accounting Firmon Internal Control Over Financial Reporting
Board of Governors of
Financial Industry Regulatory Authority, Inc.
We have audited the Financial Industry Regulatory Authority, Inc.’s (FINRA) internal control over financial reporting as ofDecember 31, 2016, based on criteria established in Internal Control–Integrated Framework issued by the Committee ofSponsoring Organizations of the Treadway Commission (2013 framework) (the COSO criteria). FINRA’s management isresponsible for maintaining effective internal control over financial reporting, and for its assessment of the effectivenessof internal control over financial reporting included in the accompanying Management Report on Internal Control OverFinancial Reporting. Our responsibility is to express an opinion on the company’s internal control over financial reportingbased on our audit.
We conducted our audit in accordance with the standards of the Public Company Accounting Oversight Board(United States) and in accordance with auditing standards generally accepted in the United States of America. Thosestandards require that we plan and perform the audit to obtain reasonable assurance about whether effective internalcontrol over financial reporting was maintained in all material respects. Our audit included obtaining an understanding ofinternal control over financial reporting, assessing the risk that a material weakness exists, testing and evaluating thedesign and operating effectiveness of internal control based on the assessed risk, and performing such other procedures aswe considered necessary in the circumstances. We believe that our audit provides a reasonable basis for our opinion.
A company’s internal control over financial reporting is a process designed to provide reasonable assurance regarding thereliability of financial reporting and the preparation of financial statements for external purposes in accordance with generallyaccepted accounting principles. A company’s internal control over financial reporting includes those policies and proceduresthat (1) pertain to the maintenance of records that, in reasonable detail, accurately and fairly reflect the transactions anddispositions of the assets of the company; (2) provide reasonable assurance that transactions are recorded as necessary topermit preparation of financial statements in accordance with generally accepted accounting principles, and that receipts andexpenditures of the company are being made only in accordance with authorizations of management and governors of thecompany; and (3) provide reasonable assurance regarding prevention or timely detection of unauthorized acquisition, use, ordisposition of the company’s assets that could have a material effect on the financial statements.
Because of its inherent limitations, internal control over financial reporting may not prevent or detect misstatements. Also,projections of any evaluation of effectiveness to future periods are subject to the risk that controls may become inadequatebecause of changes in conditions, or that the degree of compliance with the policies or procedures may deteriorate.
In our opinion, FINRA maintained, in all material respects, effective internal control over financial reporting as ofDecember 31, 2016, based on the COSO criteria.
We also have audited, in accordance with the standards of the Public Company Accounting Oversight Board (United States) andin accordance with auditing standards generally accepted in the United States of America, the consolidated balance sheet ofFINRA as of December 31, 2016 and the related consolidated statements of operations, comprehensive income (loss), changesin equity, and cash flows in the year ended December 31, 2016. We have audited in accordance with the standards of the PublicCompany Accounting Oversight Board (United States), the consolidated balance sheet of FINRA as of December 31, 2015, andthe related consolidated statements of operations, comprehensive income (loss), changes in equity, and cash flows for the yearended December 31, 2015. Our report dated June 26, 2017 expressed an unqualified opinion thereon.
Tysons, VirginiaJune 26, 2017
FINRA 2016 Annual Financial Report 27
Report of Independent RegisteredPublic Accounting Firm
Board of Governors of
Financial Industry Regulatory Authority, Inc.
We have audited the accompanying consolidated balance sheets of the Financial Industry Regulatory Authority, Inc.(FINRA) as of December 31, 2016 and 2015, and the related consolidated statements of operations, comprehensive income(loss), changes in equity, and cash flows for the years then ended. These financial statements are the responsibility of theCompany’s management. Our responsibility is to express an opinion on these financial statements based on our audits.
We conducted our December 31, 2016 audit in accordance with the standards of the Public Company AccountingOversight Board (United States) and in accordance with auditing standards generally accepted in the United States ofAmerica. We conducted our December 31, 2015 audit in accordance with the standards of the Public Company AccountingOversight Board (United States). Those standards require that we plan and perform the audit to obtain reasonableassurance about whether the financial statements are free of material misstatement. An audit includes examining, on atest basis, evidence supporting the amounts and disclosures in the financial statements. An audit also includes assessingthe accounting principles used and significant estimates made by management, as well as evaluating the overall financialstatement presentation. We believe that our audits provide a reasonable basis for our opinion.
In our opinion, the financial statements referred to above present fairly, in all material respects, the consolidated financialposition of FINRA at December 31, 2016 and 2015, and the consolidated results of their operations and their cash flows forthe years then ended in conformity with U.S. generally accepted accounting principles.
We also have audited, in accordance with the standards of the Public Company Accounting Oversight Board (UnitedStates) and in accordance with auditing standards generally accepted in the United States of America, FINRA’s internalcontrol over financial reporting as of December 31, 2016, based on criteria established in Internal Control–IntegratedFramework issued by the Committee of Sponsoring Organizations of the Treadway Commission (2013 framework) and ourreport dated June 26, 2017 expressed an unqualified opinion thereon.
Tysons, VirginiaJune 26, 2017
28 FINRA 2016 Annual Financial Report
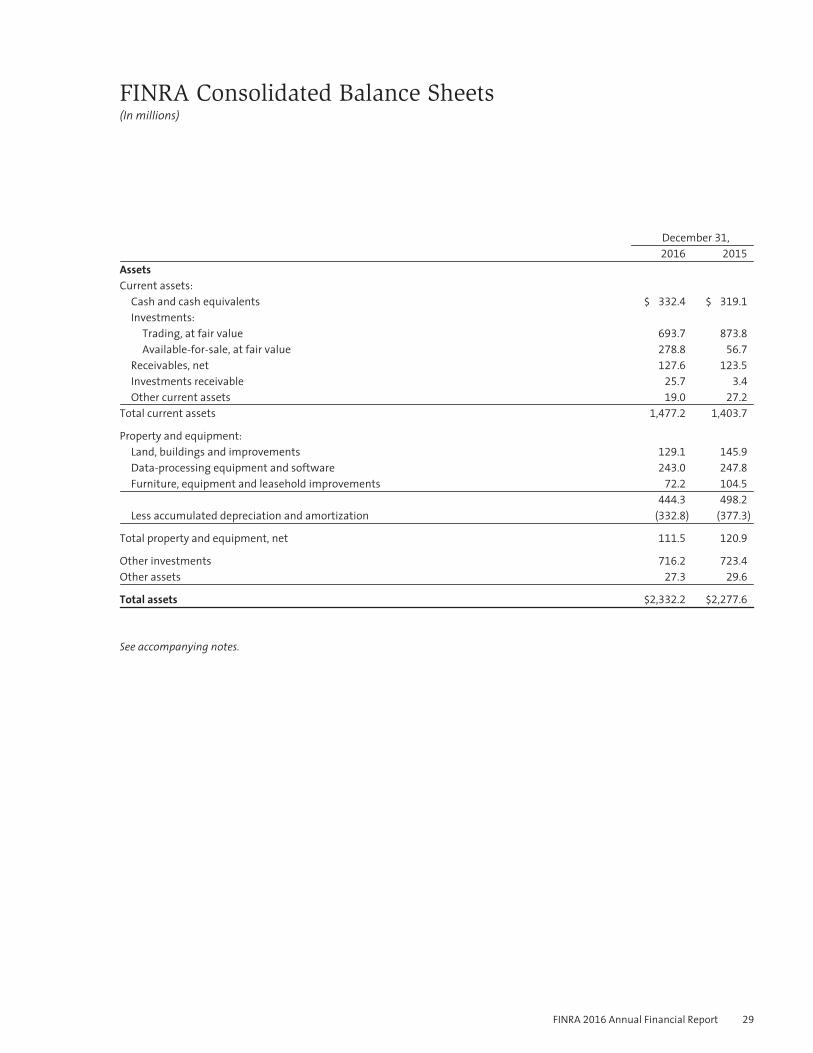
FINRA Consolidated Balance Sheets(In millions)
December 31,2016 2015
AssetsCurrent assets:
Cash and cash equivalents $ 332.4 $ 319.1
Investments:Trading, at fair value 693.7 873.8
Available-for-sale, at fair value 278.8 56.7
Receivables, net 127.6 123.5
Investments receivable 25.7 3.4
Other current assets 19.0 27.2
Total current assets 1,477.2 1,403.7
Property and equipment:Land, buildings and improvements 129.1 145.9
Data-processing equipment and software 243.0 247.8
Furniture, equipment and leasehold improvements 72.2 104.5
444.3 498.2
Less accumulated depreciation and amortization (332.8) (377.3)
Total property and equipment, net 111.5 120.9
Other investments 716.2 723.4
Other assets 27.3 29.6
Total assets $2,332.2 $2,277.6
See accompanying notes.
FINRA 2016 Annual Financial Report 29
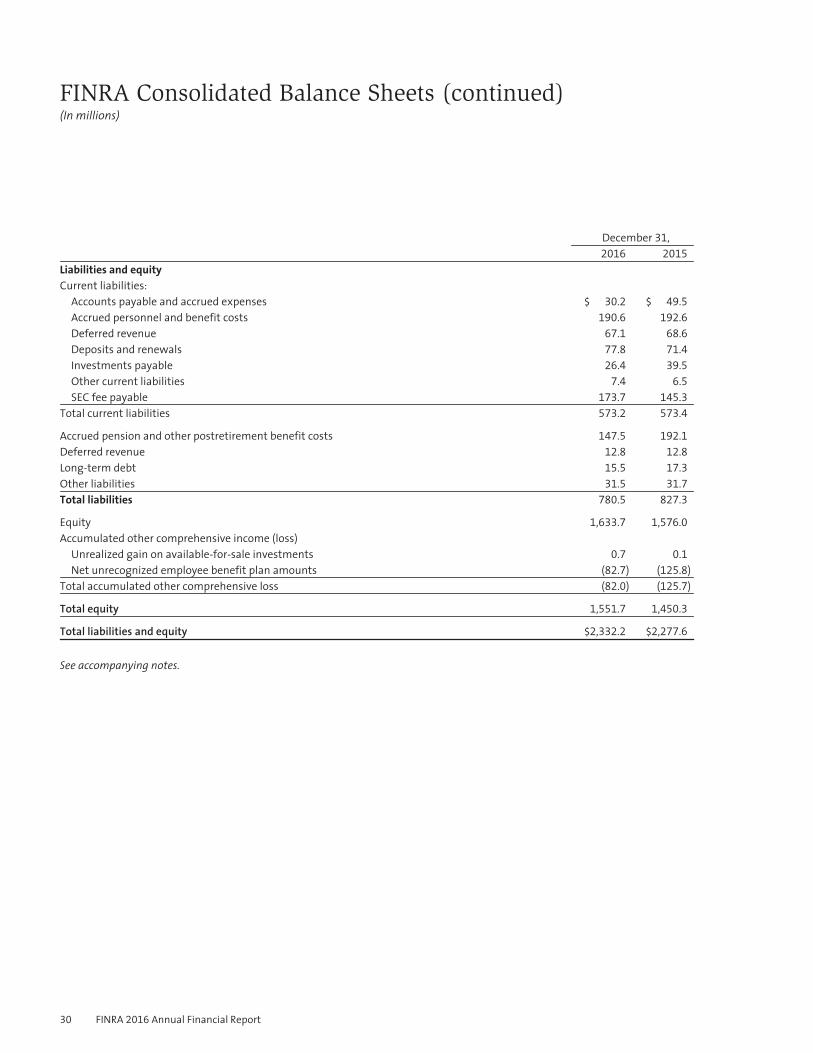
FINRA Consolidated Balance Sheets (continued)(In millions)
December 31,2016 2015
Liabilities and equityCurrent liabilities:
Accounts payable and accrued expenses $ 30.2 $ 49.5
Accrued personnel and benefit costs 190.6 192.6
Deferred revenue 67.1 68.6
Deposits and renewals 77.8 71.4
Investments payable 26.4 39.5
Other current liabilities 7.4 6.5
SEC fee payable 173.7 145.3
Total current liabilities 573.2 573.4
Accrued pension and other postretirement benefit costs 147.5 192.1
Deferred revenue 12.8 12.8
Long-term debt 15.5 17.3
Other liabilities 31.5 31.7
Total liabilities 780.5 827.3
Equity 1,633.7 1,576.0
Accumulated other comprehensive income (loss)Unrealized gain on available-for-sale investments 0.7 0.1
Net unrecognized employee benefit plan amounts (82.7) (125.8)
Total accumulated other comprehensive loss (82.0) (125.7)
Total equity 1,551.7 1,450.3
Total liabilities and equity $2,332.2 $2,277.6
See accompanying notes.
30 FINRA 2016 Annual Financial Report
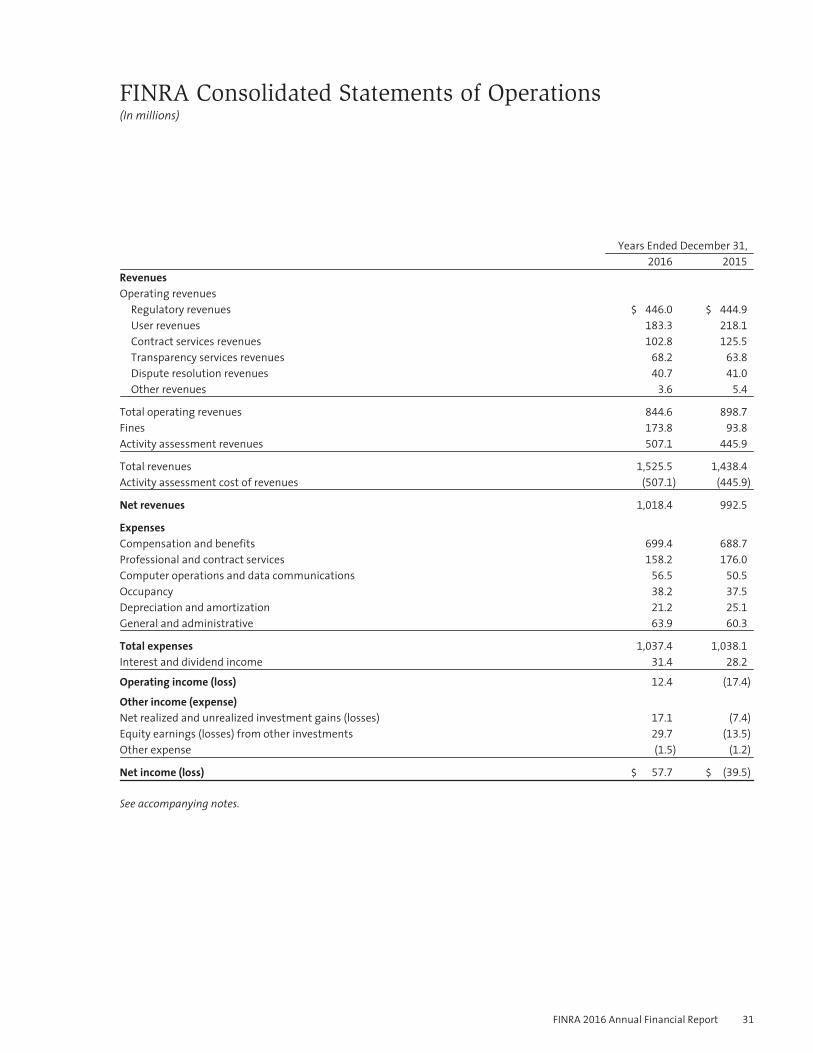
FINRA Consolidated Statements of Operations(In millions)
Years Ended December 31,2016 2015
RevenuesOperating revenues
Regulatory revenues $ 446.0 $ 444.9
User revenues 183.3 218.1
Contract services revenues 102.8 125.5
Transparency services revenues 68.2 63.8
Dispute resolution revenues 40.7 41.0
Other revenues 3.6 5.4
Total operating revenues 844.6 898.7
Fines 173.8 93.8
Activity assessment revenues 507.1 445.9
Total revenues 1,525.5 1,438.4
Activity assessment cost of revenues (507.1) (445.9)
Net revenues 1,018.4 992.5
ExpensesCompensation and benefits 699.4 688.7
Professional and contract services 158.2 176.0
Computer operations and data communications 56.5 50.5
Occupancy 38.2 37.5
Depreciation and amortization 21.2 25.1
General and administrative 63.9 60.3
Total expenses 1,037.4 1,038.1
Interest and dividend income 31.4 28.2
Operating income (loss) 12.4 (17.4)
Other income (expense)Net realized and unrealized investment gains (losses) 17.1 (7.4)
Equity earnings (losses) from other investments 29.7 (13.5)
Other expense (1.5) (1.2)
Net income (loss) $ 57.7 $ (39.5)
See accompanying notes.
FINRA 2016 Annual Financial Report 31
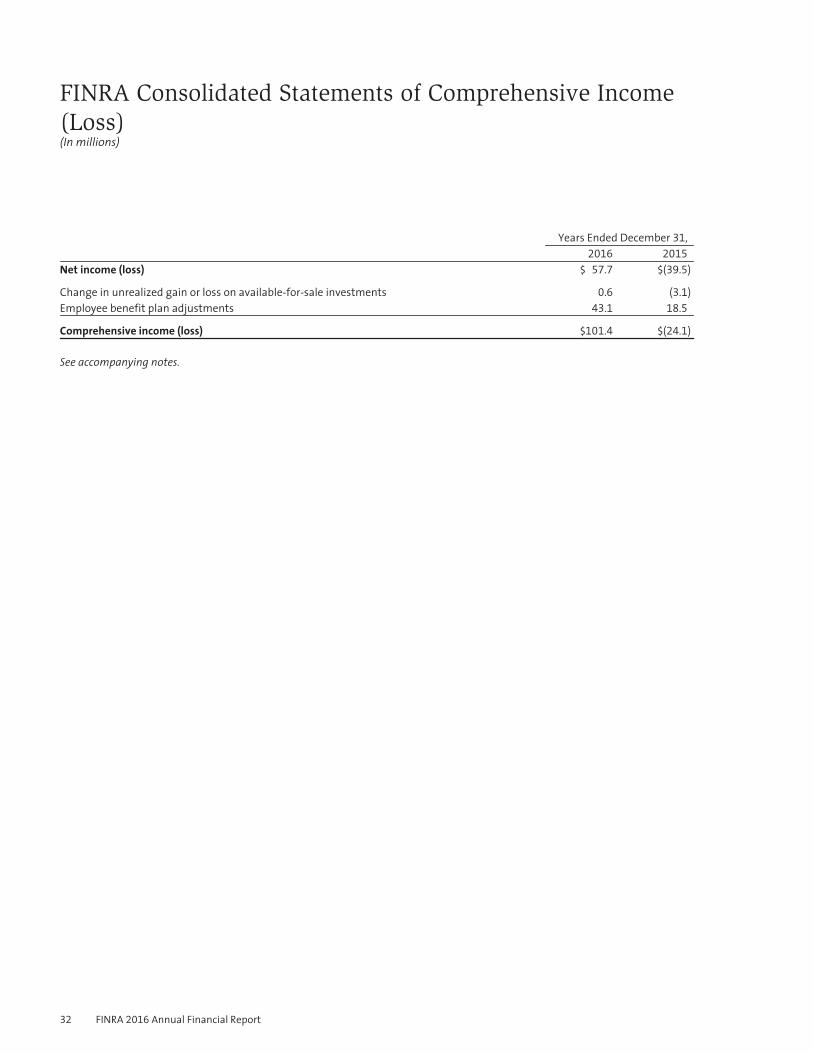
FINRA Consolidated Statements of Comprehensive Income(Loss)(In millions)
Years Ended December 31,2016 2015
Net income (loss) $ 57.7 $(39.5)
Change in unrealized gain or loss on available-for-sale investments 0.6 (3.1)
Employee benefit plan adjustments 43.1 18.5
Comprehensive income (loss) $101.4 $(24.1)
See accompanying notes.
32 FINRA 2016 Annual Financial Report
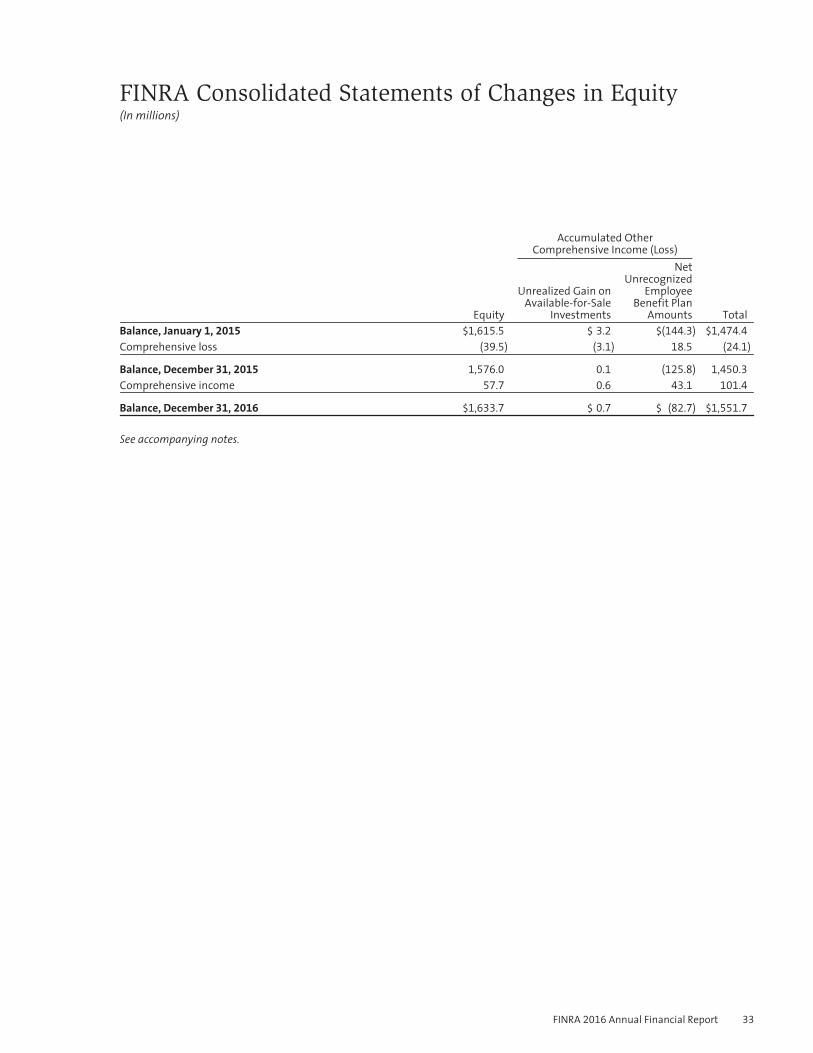
FINRA Consolidated Statements of Changes in Equity(In millions)
Accumulated OtherComprehensive Income (Loss)
Equity
Unrealized Gain onAvailable-for-Sale
Investments
NetUnrecognized
EmployeeBenefit Plan
Amounts TotalBalance, January 1, 2015 $1,615.5 $ 3.2 $(144.3) $1,474.4
Comprehensive loss (39.5) (3.1) 18.5 (24.1)
Balance, December 31, 2015 1,576.0 0.1 (125.8) 1,450.3
Comprehensive income 57.7 0.6 43.1 101.4
Balance, December 31, 2016 $1,633.7 $ 0.7 $ (82.7) $1,551.7
See accompanying notes.
FINRA 2016 Annual Financial Report 33
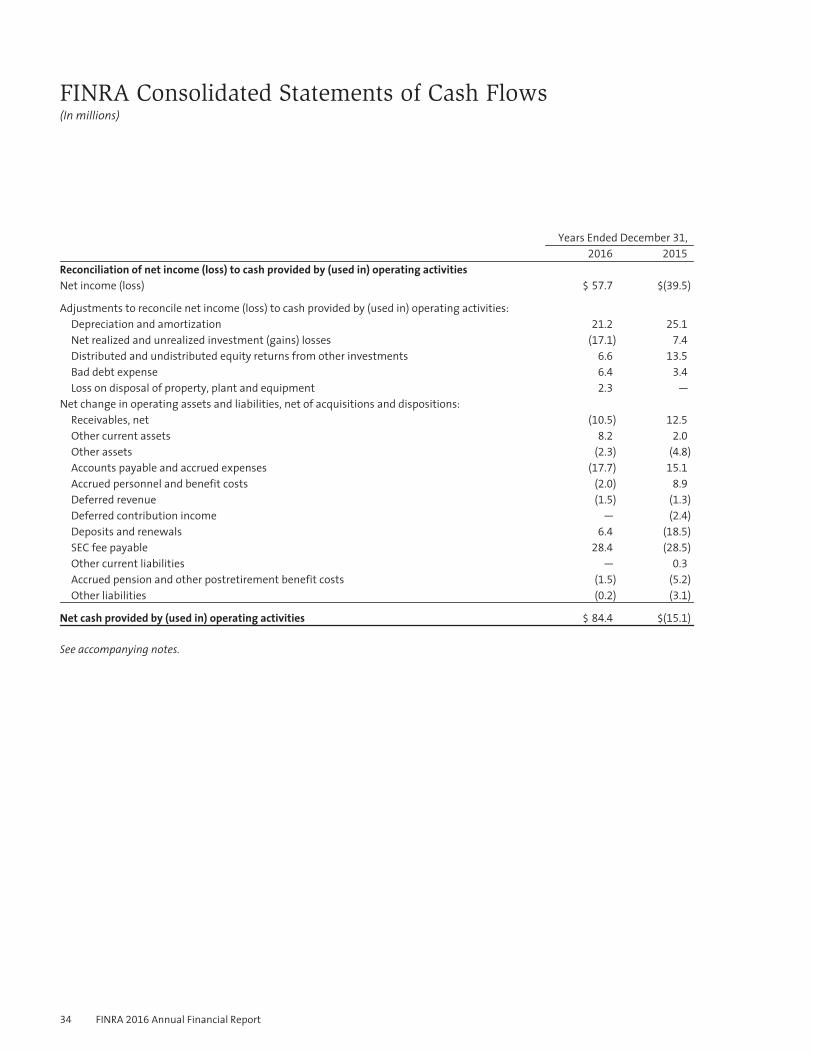
FINRA Consolidated Statements of Cash Flows(In millions)
Years Ended December 31,2016 2015
Reconciliation of net income (loss) to cash provided by (used in) operating activitiesNet income (loss) $ 57.7 $(39.5)
Adjustments to reconcile net income (loss) to cash provided by (used in) operating activities:Depreciation and amortization 21.2 25.1
Net realized and unrealized investment (gains) losses (17.1) 7.4
Distributed and undistributed equity returns from other investments 6.6 13.5
Bad debt expense 6.4 3.4
Loss on disposal of property, plant and equipment 2.3 —
Net change in operating assets and liabilities, net of acquisitions and dispositions:Receivables, net (10.5) 12.5
Other current assets 8.2 2.0
Other assets (2.3) (4.8)
Accounts payable and accrued expenses (17.7) 15.1
Accrued personnel and benefit costs (2.0) 8.9
Deferred revenue (1.5) (1.3)
Deferred contribution income — (2.4)
Deposits and renewals 6.4 (18.5)
SEC fee payable 28.4 (28.5)
Other current liabilities — 0.3
Accrued pension and other postretirement benefit costs (1.5) (5.2)
Other liabilities (0.2) (3.1)
Net cash provided by (used in) operating activities $ 84.4 $(15.1)
See accompanying notes.
34 FINRA 2016 Annual Financial Report
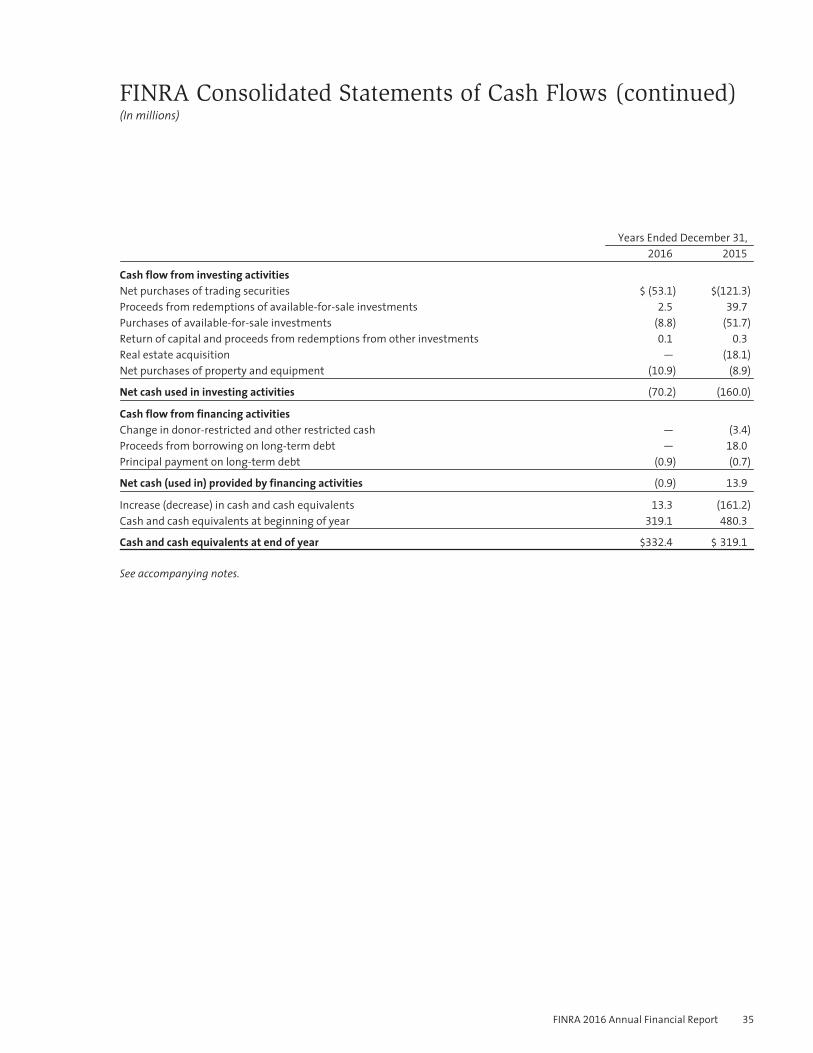
FINRA Consolidated Statements of Cash Flows (continued)(In millions)
Years Ended December 31,
2016 2015
Cash flow from investing activitiesNet purchases of trading securities $ (53.1) $(121.3)
Proceeds from redemptions of available-for-sale investments 2.5 39.7
Purchases of available-for-sale investments (8.8) (51.7)
Return of capital and proceeds from redemptions from other investments 0.1 0.3
Real estate acquisition — (18.1)
Net purchases of property and equipment (10.9) (8.9)
Net cash used in investing activities (70.2) (160.0)
Cash flow from financing activitiesChange in donor-restricted and other restricted cash — (3.4)
Proceeds from borrowing on long-term debt — 18.0
Principal payment on long-term debt (0.9) (0.7)
Net cash (used in) provided by financing activities (0.9) 13.9
Increase (decrease) in cash and cash equivalents 13.3 (161.2)
Cash and cash equivalents at beginning of year 319.1 480.3
Cash and cash equivalents at end of year $332.4 $ 319.1
See accompanying notes.
FINRA 2016 Annual Financial Report 35
FINRA 2016 Notes to Consolidated Financial Statements
1. ORGANIZATION AND NATURE OF OPERATIONS
References to the terms “we,” “our,” “us,” “FINRA” or the “Company” used throughout these Notes to ConsolidatedFinancial Statements refer to the Financial Industry Regulatory Authority, Inc. (FINRA), a Delaware corporation, and itswholly owned subsidiaries. FINRA wholly owns the following significant subsidiaries: FINRA Regulation, Inc. (FINRA REG)and FINRA Investor Education Foundation (the Foundation). The Foundation is a tax-exempt membership corporationincorporated in the State of Delaware, with FINRA as the sole member.
We are a self-regulatory organization (SRO) for brokerage firms doing business with the public in the United States. Weregulate the activities of U.S. broker-dealers and perform market regulation pursuant to our own statutory responsibilityand under contract for certain exchanges. Our statutory regulatory functions include on-site examinations of securitiesfirms, continuous automated surveillance of markets, reviews of fraud allegations and disciplinary actions against firmsand registered representatives. FINRA’s examination process is risk-based, meaning our approach for identifying firms forexamination is based upon risk, scale and scope of firm operations. We conduct examinations to determine whether firmsare in compliance with federal securities law and FINRA rules, as well as in response to investor complaints, terminationsof brokerage employees for cause, arbitrations and referrals from other regulators. FINRA operates unique equity andoptions cross-market surveillance programs. Employing advanced technology, these programs collect and integratetrading data across exchanges and alternative trading systems to detect potential market manipulation and other ruleviolations. We provide a heightened and expedited review of allegations of serious fraud and consolidate recognizedexpertise in expedited fraud detection and investigation to prevent further harm to investors. We bring disciplinaryactions against firms and their employees that may result in sanctions including censures, fines, suspensions and, inegregious cases, expulsions or bars from the industry. In appropriate cases, we require firms and individuals to providerestitution to harmed investors and often impose other conditions on a firm’s business to prevent repeated wrongdoing.
We perform market regulation services under contract for the New York Stock Exchange LLC (NYSE), NYSE Arca, Inc. (NYSEArca), NYSE MKT LLC (NYSE MKT), The Nasdaq Stock Market LLC (Nasdaq), Nasdaq BX, Inc. (Boston), Nasdaq PHLX LLC(Philadelphia), the Chicago Board Options Exchange and the C2 Options Exchange (CBOE and C2), BATS Global Markets,Inc. (the BZX, BYZ, EDGA and EDGX exchanges, collectively referred to as BATS), the International Securities Exchange, LLC(ISE, ISE Gemini and ISE Mercury), The Investors Exchange (IEX), the Miami International Securities Exchange (MIAX), andthe Boston Options Exchange (BOX). We also regulate the over-the-counter (OTC) securities markets for listed and unlistedequities and the OTC markets for corporate bonds, asset-backed instruments, certain government agency instruments,municipal securities and other fixed income instruments.
We provide arbitration and mediation services to assist in the resolution of monetary and business disputes between andamong investors, broker-dealers and individual brokers. We also provide dispute resolution services for several exchangesthrough contractual agreements, thereby offering consistent procedures and the uniformity of a single forum for theresolution of securities-industry related disputes.
We provide technology-driven registration, testing and continuing education, and other regulatory services, as well asessential operations and support services to firms, other SROs, the Securities and Exchange Commission (SEC), the NorthAmerican Securities Administrators Association, state regulators, the investing public, the Conference of State BankSupervisors and its wholly-owned subsidiary, the State Regulatory Registry LLC (SRR). We developed and continue toenhance BrokerCheck®, a free tool that helps investors research the professional backgrounds of current and formerFINRA-registered brokerage firms and brokers, as well as investment adviser firms and representatives.
We are committed to ensuring that investors and market participants have access to market information, so they canmore effectively assess securities prices and valuations, through the management and operation of FINRA’s OTC markettransparency facilities. These facilities include the Trade Reporting and Compliance Engine® (TRACE®) for fixed incomesecurities, the OTC Reporting FacilityTM (ORFTM) for equity securities not listed on an exchange and the Trade Reporting
36 FINRA 2016 Annual Financial Report
FINRA 2016 Notes to Consolidated Financial Statements
1. ORGANIZATION AND NATURE OF OPERATIONS (CONTINUED)
Facilities® (TRFs®), operated in partnership with NYSE and Nasdaq, for OTC trading in equity securities that are listed on anexchange. In this capacity, we provide the public and professionals with timely quotes and trade information for equityand debt securities.
The Foundation provides underserved Americans with the knowledge, skills and tools necessary for financial successthroughout life. The Foundation supports innovative research and educational projects aimed at segments of theinvesting public that could benefit from additional resources.
2. SUMMARY OF SIGNIFICANT ACCOUNTING POLICIES
BASIS OF PRESENTATION
The accompanying consolidated financial statements are prepared in accordance with U.S. generally accepted accountingprinciples (U.S. GAAP) and include the accounts of FINRA and its wholly owned subsidiaries. We have eliminated allintercompany balances and transactions in consolidation.
USE OF ESTIMATES
The preparation of these consolidated financial statements requires management to make estimates and assumptions,including estimates of fair value of investments, valuation of investments and assumptions related to our benefit plans,allowances for uncollectible accounts, and the estimated service periods related to our recognition of certain revenue, thataffect the amounts reported in the consolidated financial statements and accompanying notes. Actual results couldmaterially differ from those estimates.
CASH AND CASH EQUIVALENTS
Cash and cash equivalents include demand cash, cash held in banks and all non-restricted, highly liquid investments withoriginal maturities of 90 days or less when acquired.
INVESTMENTS
Debt and Marketable Equity Securities
At the time of purchase, we classify individual debt and marketable equity securities as trading, available-for-sale or held-to-maturity based on the type of security and our intent and ability to sell or to hold the securities. We have designatedour investments in debt and marketable equity securities as either trading or available-for-sale. Trading securities arecarried at fair value, with changes in fair value recorded as a component of net realized and unrealized investment gains(losses) in the consolidated statements of operations. We present cash flows from purchases and sales of tradingsecurities as investing activities based on the nature and purpose for which the securities were acquired. We recordavailable-for-sale securities at fair value and recognize temporary changes in fair value as unrealized gains (losses) as aseparate component of other comprehensive income (loss).
Fair value is determined based on quoted market prices, when available, or on estimates provided by external pricingsources or dealers who make markets in such securities. Realized gains and losses on sales of securities are included inearnings using the average cost method. Investment receivables or payables relate to security trades and otherinvestment redemptions or purchases executed on or prior to the balance sheet date, but not yet settled, as we followtrade-date accounting.
FINRA 2016 Annual Financial Report 37
FINRA 2016 Notes to Consolidated Financial Statements
2. SUMMARY OF SIGNIFICANT ACCOUNTING POLICIES (CONTINUED)
Other Investments
FINRA is a limited partner in a private investment fund, which we account for under the equity method. We also haveresidual investments in hedge funds, which we account for under the equity method. The application of the equitymethod to the private investment fund and our investments in hedge funds, including our related equity earnings (losses),retains the investment company accounting applied by such funds.
Other-Than-Temporary Impairment
FINRA periodically monitors and evaluates the realizability of its available-for-sale and equity method investments. Whenassessing realizability, including other-than-temporary declines in value, we consider such factors as intent to hold, theextent of the decline in value, the duration of unrealized losses, the potential for recovery in the near term and theprobability that we will sell an equity method investment at an amount different from the net asset value of ourownership interest. We also review the financial statements of our equity method investments for potential indicators ofimpairment. If events and circumstances indicate that a decline in the value of these assets has occurred and is deemedother-than-temporary, the carrying value of the investment is reduced to its fair value and the impairment is charged toearnings.
RECEIVABLES, NET
The Company’s receivables are primarily concentrated with FINRA-registered firms, associated persons, NYSE, Nasdaq,CBOE and C2, BATS and other exchanges. The consolidated financial statements present receivables net of an allowancefor uncollectible accounts. As of December 31, 2016 and 2015, an allowance for uncollectible accounts of $13.4 million and$10.6 million was presented within receivables, net in the accompanying consolidated balance sheets. We calculate theallowance based on the age, source of the underlying receivable and past collection experience. We maintain theallowance at a level that management believes to be sufficient to absorb estimated losses inherent in our accountsreceivable portfolio. The allowance as of December 31, 2016 and 2015, primarily related to fines and arbitration activities.The allowance is increased by the provision for bad debts, which is charged against operating results and decreased by theamount of charge-offs, net of recoveries. We base the amount charged against operating results on several factors,including a periodic assessment of the collectibility of each account. In circumstances where a specific firm’s inability tomeet its financial obligations is known (e.g., bankruptcy filings), we record a specific provision for bad debts to reduce thereceivable to the amount we reasonably believe will be collected.
PROPERTY AND EQUIPMENT
FINRA records property and equipment at cost less accumulated depreciation. We expense repairs and maintenance costsas incurred. We calculate depreciation and amortization as follows:Asset category Depreciation/amortization method Estimated useful livesBuildings and improvements Straight-line 10 to 40 yearsData-processing equipment and software Straight-line 2 to 5 yearsFurniture and equipment Straight-line 5 to 10 years
Leasehold improvements Straight-lineTerm of applicable lease, includingany extension periods at our option
Depreciation and amortization expense for property and equipment totaled $13.8 million and $16.5 million for 2016 and2015.
38 FINRA 2016 Annual Financial Report
FINRA 2016 Notes to Consolidated Financial Statements
2. SUMMARY OF SIGNIFICANT ACCOUNTING POLICIES (CONTINUED)
SOFTWARE COSTS
FINRA capitalizes internal computer software development costs incurred during the application development stage.Computer software costs incurred prior to or subsequent to the application development stage are charged to expense asincurred. We capitalize significant purchased application software and operational software programs that are an integralpart of computer hardware, and amortize them using the straight-line method over their estimated useful life, generallythree years. We expense all other purchased software as incurred.
The consolidated financial statements reflect unamortized, capitalized software development costs of $0.1 million and$2.9 million as of December 31, 2016 and 2015, within total property and equipment, net in the consolidated balancesheets. There were no net additions to capitalized software in 2016 or 2015. Amortization of capitalized internal computersoftware costs totaled $2.8 million and $4.6 million for 2016 and 2015, and was included in depreciation and amortizationin the consolidated statements of operations.
IMPAIRMENT OF LONG-LIVED ASSETS
We review our long-lived assets for impairment annually. In the event facts and circumstances indicate that long-livedassets or other assets may be impaired, we perform an evaluation of recoverability that compares the estimated future,undiscounted cash flows associated with the asset to the asset’s carrying amount. If the evaluation fails the recoverabilitytest, we would then prepare a discounted cash flow analysis to estimate fair value and the amount of any impairment. In2016 and 2015, there were no indicators of long-lived asset impairment, and no impairment charges were recognized.
DEFERRED REVENUE
Deferred revenue represents cash received for which we have not yet provided the related services. Included in deferredrevenue is the unearned portion of mediation fees, arbitration fees, registration fees and firm application fees. Werecognize revenue from the upfront initial components of these fees on a straight-line basis over estimated serviceperiods.
The following chart reflects our estimated service periods and the basis for those estimated service periods for eachdeferred fee:Fee type Service period Estimation basisMediation fees 4 months Average turnaround time for a mediation caseArbitration fees 14 months Average turnaround time for an arbitration caseRegistration fees 4 years Average time individuals spend at a single firmFirm application fees 12 years Average lifespan for all member firms
DEPOSIT AND RENEWAL LIABILITIES
FINRA’s deposit and renewal liabilities primarily represent deposits into our Central Registration Depository (CRD) system.FINRA-registered firms use these deposits to pay for services, including registration fees charged by states and other SROs.
REVENUE RECOGNITION AND COST OF REVENUE
Revenues are generally measured by an exchange of values and recognized when: (1) there is persuasive evidence of anarrangement; (2) services have been rendered and payment has been contractually earned; (3) the fee is fixed ordeterminable; and (4) collectability is reasonably assured. Our recognition policy by type of fee is described in theparagraphs below.
FINRA 2016 Annual Financial Report 39
FINRA 2016 Notes to Consolidated Financial Statements
2. SUMMARY OF SIGNIFICANT ACCOUNTING POLICIES (CONTINUED)
Regulatory Revenues
Regulatory revenues include assessments for the supervision and regulation of firms through examination, policy making,rulemaking and enforcement activities. Regulatory revenues are recorded net of any firm rebates. The primary regulatoryrevenues are the Trading Activity Fee (TAF), Gross Income Assessment (GIA), Personnel Assessment (PA) and Branch OfficeAssessment (BOA). The TAF is calculated on the sell side of all transactions by firms in all covered securities regardless ofwhere the trade is executed and is assessed directly on the firm responsible for clearing the transaction. Firms self-reportthe TAF to us, and we recognize the income in the month the transactions occur. As the TAF is a self-reported revenuestream for us, subsequent adjustments may occur. We recognize these adjustments as revenue adjustments in the periodthey become known to us. The GIA, PA and BOA represent annual fees charged to firms and representatives. We recognizethese fees ratably over the applicable annual period.
User Revenues
User revenues represent amounts charged for initial and annual registrations, qualification examinations, FINRA-sponsored educational programs and conferences, reviews of advertisements, corporate filings (corporate financing fees)and disclosures.
FINRA charges registration fees for all registered representatives and investment advisers. First-year registration andapplication fees consist of two deliverables that we account for as separate units of accounting: upfront registrationdelivered at inception and an ongoing service obligation for the remainder of that calendar year. We allocate arrangementconsideration to upfront registrations based on our estimates of selling price. We estimate the selling prices of upfrontregistrations based on our internal cost structure, pricing practices and objectives, and historical prices. We allocatearrangement consideration to the remaining service obligation based on vendor-specific objective evidence of the pricingfor these services. Upfront registration revenue is recognized over the estimated service period for individualrepresentatives (four years) and firms (12 years), while the remaining service obligation revenue is recognized ratably overthe related remaining annual period. While the pricing model currently in use captures all critical variables, unforeseenchanges due to external market forces may result in the revision to some of our inputs. These modifications may result inthe allocation of consideration in future periods that differs from the allocation presently in use. Absent a significantchange in the pricing inputs, future changes in the pricing model are not expected to materially impact our allocation ofarrangement consideration.
Qualification fees consist of examination and continuing education fees. We recognize qualification fees as we administerexaminations or continuing education programs. FINRA-sponsored meeting and conference fees include fees paid byfinancial services industry participants for participating in our educational programs. We recognize these fees when theprogram or conference takes place. Advertising fees are charged for our review of firms’ communications to ensure thatthey are fair, balanced and not misleading. We recognize advertising fees as revenue when our review is completed.Corporate financing fees are charged for our review of proposed public offerings. We recognize corporate financing feeswhen our review is completed. FINRA requires the timely disclosure of regulatory actions, liens and judgments, amongother things, and charges a fee to review the disclosures to determine whether an applicant is subject to a statutorydisqualification or whether the applicant may present a regulatory risk for the firm and customers. FINRA recognizes thesedisclosure review fees when our review is completed.
Contract Services Revenues
Contract services revenues represent amounts charged for regulatory services provided primarily to the Nasdaq markets,the NYSE markets, CBOE and C2, the BATS markets and other exchanges, as well as the TRFs, for services includingsurveillance reviews, investigations, examinations and the disciplinary process. Contract services revenues also include
40 FINRA 2016 Annual Financial Report
FINRA 2016 Notes to Consolidated Financial Statements
2. SUMMARY OF SIGNIFICANT ACCOUNTING POLICIES (CONTINUED)
fees for the mortgage licensing system FINRA developed and deployed to SRR. We recognize contract services revenues asthe services are provided according to the terms and timeframes associated with each individual contract.
Transparency Services Revenues
Transparency services revenues represent amounts charged for the use of TRACE. In addition, fees are charged for our ORFservice for the reporting of trades and comparison in certain OTC equity securities. TRACE fees include market data fees, aswell as fees charged on secondary market transactions in eligible fixed income securities reported to us. The OTC BulletinBoard® (OTCBB®) is a regulated quotation service in which fees are charged for a variety of services related to the display ofreal-time quotes in OTC equity securities that are eligible for quotation on the OTCBB. In addition, fees are earned for thesale of market data from the OTCBB and the ORF. We recognize transparency services revenues as the transactions occuror when the market data is sold.
Dispute Resolution Revenues
FINRA earns fees during the arbitration and mediation processes. Certain arbitration fees, such as initial, counterclaim,cross-claim and other filing fees, and surcharge fees, relate to the entire period covered by an arbitration case, and arerecognized as revenue over the average turnaround time for an arbitration case (14 months). Mediation filing fees arerecognized over the average turnaround time for a mediation case (four months). All other arbitration- and mediation-related fees, such as pre-hearing and hearing processing fees, adjournment fees, hearing session fees and mediationsession fees, which are event-driven, are recognized as the service is provided. Dispute resolution revenues also includearbitrator application fees that are recognized as the service is provided.
Fines
Fines represent sanctions for rule violations, which FINRA recognizes upon issuance of a written consent or disciplinarydecision. We do not view fines as part of our operating revenues. FINRA limits the use of fine monies to capitalexpenditures and regulatory projects, which are reported to and approved by our Finance, Operations and TechnologyCommittee and Board of Governors (Board).
Activity Assessment Revenues and Cost of Revenues
FINRA, as an SRO, pays certain fees and assessments to the SEC pursuant to Section 31 of the Securities Exchange Act of1934. These fees are designed to recover costs incurred by the government for the supervision and regulation of securitiesmarkets and securities professionals, and are calculated based on the aggregate dollar amount of sales of covered securitiestransacted by or through any firm other than on a national securities exchange. Such covered transactions are reported tous through the TRFs and ORF. We remit these SEC fees to the U.S. Treasury semiannually, in March and September.
We recover the cost of the Section 31 fees and assessments through an activity assessment, charged to thefirm responsible for clearing the transaction, based on the aggregate dollar amount of sales of coveredsecurities transacted by or through any firm other than on a national securities exchange. The assessments billed tosecurities firms are recognized when the transactions are reported. As of December 31, 2016 and 2015, we had$43.9 million and $37.6 million of SEC fee receivables presented within receivables, net in the accompanying consolidatedbalance sheets. FINRA, as the primary obligor to the SEC, reports the activity assessment on a gross basis within revenues.Amounts due to the SEC are reported as a cost of revenue. We report amounts pending remittance to the SEC in SEC feepayable in the accompanying consolidated balance sheets.
Activity assessment revenues and cost of revenues are driven by third-party providers and securities firms reportingactivity in a complete, accurate and timely manner. As a result, subsequent adjustments may occur. We recognize anyresulting activity assessment adjustments in the period they become known to us.
FINRA 2016 Annual Financial Report 41
FINRA 2016 Notes to Consolidated Financial Statements
2. SUMMARY OF SIGNIFICANT ACCOUNTING POLICIES (CONTINUED)
Interest and Dividend Income
FINRA recognizes interest income from cash, trading investments and available-for-sale investments as it is earned.Dividend income is recognized on the ex-dividend date.
CLOUD COMPUTING COSTS
We account for our cloud computing arrangement as a service contract and expense applicable costs as incurred. As ourhosting arrangement does not give us the contractual right to the software at any time during the hosting period withoutpenalty, we are not deemed to have a software license. Cloud computing costs totaled $20.9 million and $14.0 million forthe years ended December 31, 2016 and 2015, and were included in computer operations and data communications in theconsolidated statement of operations.
PENSION AND OTHER POSTRETIREMENT LIABILITIES
FINRA provides two non-contributory defined benefit pension plans for the benefit of eligible employees. The non-contributory defined benefit plans consist of a qualified Employees Retirement Plan (ERP) and a non-qualifiedSupplemental Executive Retirement Plan (SERP). Both plans are now closed to new participants. We also offer access toretiree medical coverage for eligible active employees, retirees and their dependents. Eligible retirees pay the full premiumcost to be enrolled in the Company’s retiree medical coverage. Additionally, we provide an employer-funded definedcontribution Retiree Medical Account Plan (RMA Plan) to help our retirees offset health care premiums during retirement.Under the RMA Plan, Retiree Medical Accounts are created for eligible employees and retirees, and fixed annual credits areapplied to those accounts for each year of FINRA service beginning at age 40.
In calculating the expense and liability related to all of the abovementioned plans, we use several statistical and otherfactors, which attempt to anticipate future events. Key factors include assumptions about the expected rates of return onplan assets and the discount rate as determined by FINRA, within certain guidelines, as well as assumptions regardingfuture salary increases, mortality, turnover, retirement ages and the medical expense trend rate. We consider marketconditions, including changes in investment returns and interest rates, in making these assumptions. The discount rateused in the calculations is developed using a composite yield curve analysis based on a portfolio of high-quality, non-callable, marketable bonds. We determine the long-term rate of return based on analysis of historical and projectedreturns as prepared by our actuary and external investment consultant. FINRA’s Pension/401(k) Plan Committee (thePension Committee) reviews and advises FINRA management on both the expected long-term rate of return and thediscount rate assumptions. Amortization of net gain or loss included in accumulated other comprehensive income (loss)reflects a corridor based on 10 percent of the greater of the projected benefit obligation or the market-related value ofplan assets as of the beginning of the plan year, and is included as a component of net periodic pension cost.
The actuarial assumptions that we use in determining pension and other postretirement liabilities and expenses maydiffer materially from actual results due to changing market and economic conditions, as well as early withdrawals byterminating plan participants. While we believe that the assumptions used are appropriate, differences in actualexperience or changes in assumptions related to the ERP may materially affect our financial position. A 25 basis-pointincrease (decrease) in the discount rate assumption as of December 31, 2016, would cause the ERP projected benefitobligation to decrease (increase) by approximately $18.5 million.
INCOME TAXES
FINRA and FINRA REG are tax-exempt organizations under Internal Revenue Code (IRC) Section 501(c)(6). The Foundation isa tax-exempt organization under IRC Section 501(c)(4). However, unrelated business income activities are taxed at normalcorporate rates to the extent that they result in taxable net income. We determine deferred tax assets and liabilities based
42 FINRA 2016 Annual Financial Report
FINRA 2016 Notes to Consolidated Financial Statements
2. SUMMARY OF SIGNIFICANT ACCOUNTING POLICIES (CONTINUED)
on differences between the financial statement carrying amounts and the tax basis of existing assets and liabilities (i.e.,temporary differences). We measure these assets and liabilities at the enacted rates that we expect will be in effect whenwe will realize these differences. We also determine deferred tax assets based on the amount of net operating losscarryforwards. If necessary, we establish a valuation allowance to reduce deferred tax assets to the amount that is morelikely than not to be realized.
CONCENTRATION OF CREDIT RISK
Financial instruments that potentially subject us to concentrations of credit risk consist of cash and cash equivalents,trading investments, other investments and accounts receivable. We do not require collateral on these financialinstruments.
We maintain cash and cash equivalents in excess of federally insured limits, principally with financial institutions locatedin the U.S. Risk on accounts receivable is reduced by the number of entities comprising our member firm base and throughongoing evaluation of collectibility of amounts owed to us. We use outside investment managers to manage ourinvestment portfolio and a custody agent, a publicly traded company headquartered in New York, to hold our tradingsecurities.
We maintain a broadly diversified investment portfolio, representing a wide range of assets and asset classes, in order toattain acceptable levels of risk and return. FINRA’s investment portfolio consists of investments in debt securities, a mutualfund containing equity securities and other investments (including a private investment). The Foundation’s investmentportfolio consists of a mutual fund, a commingled fund and a private investment. Our consolidated limited partnershipinvestment represents approximately 42 percent of our total invested assets, excluding cash, as of December 31, 2016.
The Company attempts to minimize credit risk by monitoring the creditworthiness of the financial institutions with whichit transacts business.
RECENT ACCOUNTING PRONOUNCEMENTS
In May 2014, the Financial Accounting Standards Board (FASB) issued Accounting Standards Update (ASU) 2014-09,Revenue from Contracts with Customers (Topic 606). The ASU provides that a company recognize revenue when it transferspromised goods or services to customers in an amount that reflects the consideration to which the company expects to beentitled in exchange for those goods or services. Accordingly, companies will need to use more judgment and make moreestimates, which may include identifying performance obligations in the contract, estimating the amount of variableconsideration to include in the transaction price and allocating the transaction price to each separate performanceobligation. In August 2015, the FASB issued ASU 2015-14, Revenue from Contracts with Customers (Topic 606): Deferral ofthe Effective Date, which deferred the effective date of the new standard by one year. The ASU is effective for FINRA onJanuary 1, 2019; however, as a nonpublic entity, we may early adopt on January 1, 2018. In 2016, the FASB continued toissue various technical improvements through various ASUs, including principal versus agent considerations, identifyingperformance obligations and licensing. FINRA does not intend to early adopt the ASU, and we are currently performing adetailed analysis of our revenue streams and service contracts in order to determine the potential impact that the ASU willhave on our consolidated financial statements.
In January 2016, the FASB issued ASU 2016-01, Financial Instruments—Overall (Subtopic 825-10): Recognition andMeasurement of Financial Assets and Financial Liabilities. The ASU eliminates the available-for-sale classification of equityinvestments and requires entities to measure equity investments that do not result in consolidation and are notaccounted for under the equity method at fair value and recognize any changes in fair value in net income. The ASU iseffective for FINRA on January 1, 2019. We are currently assessing the potential impact that the ASU will have on ourconsolidated financial statements.
FINRA 2016 Annual Financial Report 43
FINRA 2016 Notes to Consolidated Financial Statements
2. SUMMARY OF SIGNIFICANT ACCOUNTING POLICIES (CONTINUED)
In February 2016, the FASB issued ASU 2016-02, Leases. The ASU requires lessees to put most leases on their balancesheets but recognize expenses on their statements of operations in a manner similar to today’s accounting. The ASU alsoeliminates today’s real estate-specific provisions for all entities. For lessors, the ASU modifies the classification criteria andthe accounting for sales-type and direct financing leases. The ASU is effective for FINRA on January 1, 2020. Early adoptionis permitted. We do not intend to early adopt the ASU, and we are currently assessing the potential impact that the ASUwill have on our consolidated financial statements.
In July 2016, the FASB issued the final guidance on credit losses, ASU 2016-13, Financial Instruments—Credit Losses(Topic 326): Measurement of Credit Losses on Financial Instruments, which will significantly change how entities willmeasure credit losses for most financial assets and certain other instruments that aren’t measured at fair value throughnet income. Entities will be required to use a new forward-looking “expected loss” model and record an allowance that,when deducted from the amortized cost basis of the financial asset, presents the net amount expected to be collected onthe financial asset. This approach will apply to most financial assets measured at amortized cost and certain otherinstruments, including trade and other receivables, loans, held-to-maturity debt securities, net investments in leases andoff-balance-sheet credit exposures. The ASU will also require significantly more disclosures to be made in an entity’sfinancial statements. The ASU is effective for FINRA on January 1, 2021. Early adoption is permitted. We do not intend toearly adopt the ASU, and we are currently assessing the potential impact that the ASU will have on our consolidatedfinancial statements.
In August 2016, the FASB issued ASU 2016-15, Statement of Cash Flows (Topic 230): Classification of Certain Cash Receiptsand Cash Payments, which clarifies how entities should classify certain cash receipts, such as distributions received fromequity method investees, and cash payments on the statement of cash flows. The ASU is effective for FINRA on January 1,2019. Early adoption is permitted. We do not intend to early adopt the ASU, and we are currently assessing the potentialimpact that the ASU will have on our consolidated financial statements.
The following accounting pronouncements were also recently issued:
▪ ASU No. 2015-02, Consolidations (Topic 810): Amendments to the Consolidation Analysis, effective for FINRA in2017; and
▪ ASU No. 2016-16, Income Taxes (Topic 710): Intra-Entity Transfers of Assets Other Than Inventory; effective forFINRA in 2019.
We have assessed these pronouncements and determined that they do not have any material impact on our consolidatedresults of operations or financial position, and they will be adopted as of their future effective date.
The following accounting pronouncements have been adopted by FINRA with no material effect on our consolidatedfinancial statements:
▪ ASU No. 2014-15, Presentation of Financial Statements—Going Concern (Subtopic 205-40): Disclosure ofUncertainties about an Entity’s Ability to Continue as a Going Concern, effective in 2016;
▪ ASU No. 2015-05, Intangibles—Goodwill and Other—Internal-Use Software (Subtopic 350-40): Customer’sAccounting for Fees Paid in a Cloud Computing Arrangement; effective in 2016. FINRA has adopted this ASUprospectively;
▪ ASU No. 2015-07, Fair Value Measurement (Topic 820): Disclosures for Investments in Certain Entities ThatCalculate Net Asset Value per Share (or Its Equivalent) – a consensus of the FASB Emerging Issues Task Force;effective in 2017. FINRA early adopted this ASU in 2015; and
▪ ASU No. 2015-17, Income Taxes (Topic 740): Balance Sheet Classification of Deferred Taxes; effective in 2018.FINRA early adopted this ASU prospectively in 2015.
44 FINRA 2016 Annual Financial Report
FINRA 2016 Notes to Consolidated Financial Statements
3. DEFERRED REVENUE
The following is a summary of amounts that we included in current and non-current deferred revenue as of December 31,
2016, and the years over which we will recognize those amounts:Registration Arbitration Annual Total
(in millions)Year ending December 31,2017 $ 7.1 $4.9 $55.1 $67.1
2018 5.2 — — 5.2
2019 3.3 — — 3.3
2020 1.4 — — 1.4
2021 and thereafter 2.9 — — 2.9
$19.9 $4.9 $55.1 $79.9
The following is a summary of activity in our current and non-current deferred revenue for the periods endedDecember 31, 2016 and 2015, for all revenue arrangements. Annual revenue below primarily includes the GIA, PA, BOA andregistered representative renewal fees. The additions reflect the fees charged during the period, while the amortizationreflects the revenues recognized during the period based on the significant accounting policies described in Note 2:
Registration Arbitration Annual Total(in millions)
Balance as of January 1, 2016 $20.0 $ 5.1 $ 56.3 $ 81.4
Additions 8.8 8.9 312.6 330.3
Amortization (8.9) (9.1) (313.8) (331.8)
Balance as of December 31, 2016 $19.9 $ 4.9 $ 55.1 $ 79.9
Registration Arbitration Annual Total(in millions)
Balance as of January 1, 2015 $19.9 $ 5.0 $ 57.8 $ 82.7
Additions 9.0 8.9 331.0 348.9
Amortization (8.9) (8.8) (332.5) (350.2)
Balance as of December 31, 2015 $20.0 $ 5.1 $ 56.3 $ 81.4
4. INVESTMENTS
FINRA owns a diverse investment portfolio consisting of 1) U.S. government (including state and local) securities; 2) agencymortgage-backed securities; 3) corporate and asset-backed securities; 4) mutual and commingled funds; 5) other investments(including private investments); and 6) other financial instruments. We have classified our marketable investments as tradingor available-for-sale based on their nature, and our intent and ability to sell or to hold the securities.
Our investment policy strives to preserve principal, in real terms, while seeking to earn a long-term rate of returncommensurate with the degree of risk deemed appropriate by the Board. We execute our investment strategy through aseparately managed account and direct investments. During 2016, our active trading portfolio was managed by an
FINRA 2016 Annual Financial Report 45
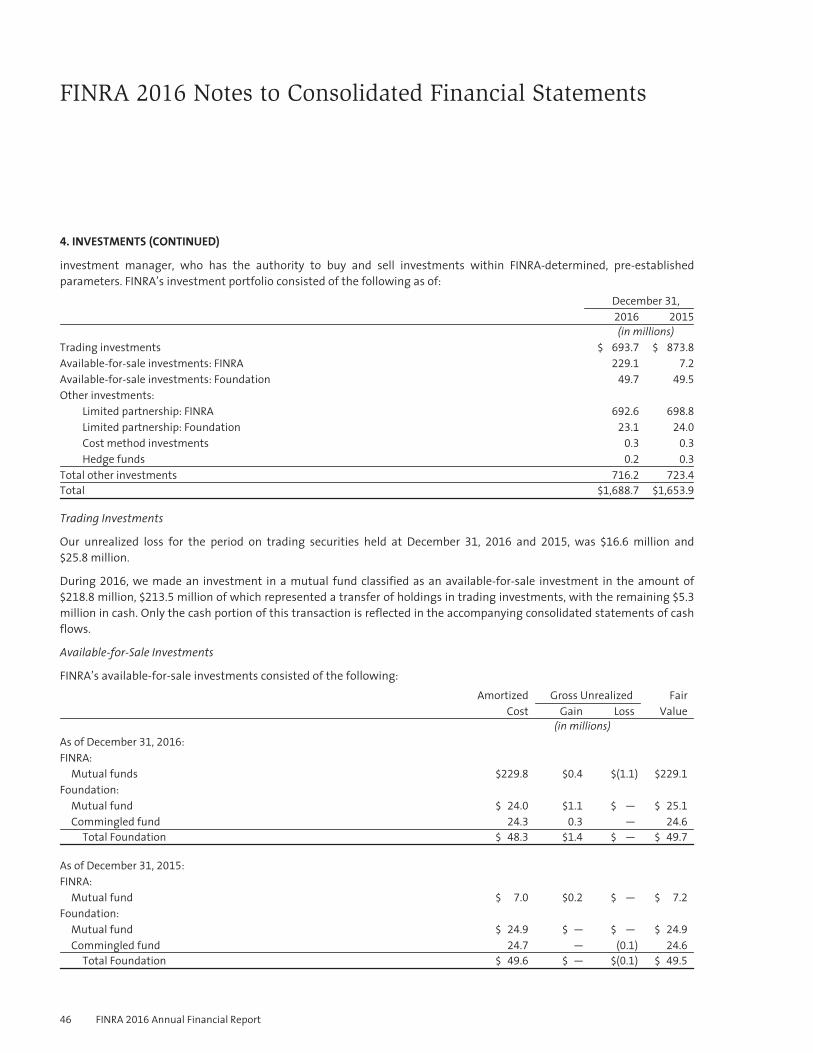
FINRA 2016 Notes to Consolidated Financial Statements
4. INVESTMENTS (CONTINUED)
investment manager, who has the authority to buy and sell investments within FINRA-determined, pre-establishedparameters. FINRA’s investment portfolio consisted of the following as of:
December 31,2016 2015
(in millions)Trading investments $ 693.7 $ 873.8
Available-for-sale investments: FINRA 229.1 7.2
Available-for-sale investments: Foundation 49.7 49.5
Other investments:Limited partnership: FINRA 692.6 698.8
Limited partnership: Foundation 23.1 24.0
Cost method investments 0.3 0.3
Hedge funds 0.2 0.3
Total other investments 716.2 723.4
Total $1,688.7 $1,653.9
Trading Investments
Our unrealized loss for the period on trading securities held at December 31, 2016 and 2015, was $16.6 million and$25.8 million.
During 2016, we made an investment in a mutual fund classified as an available-for-sale investment in the amount of$218.8 million, $213.5 million of which represented a transfer of holdings in trading investments, with the remaining $5.3
million in cash. Only the cash portion of this transaction is reflected in the accompanying consolidated statements of cashflows.
Available-for-Sale Investments
FINRA’s available-for-sale investments consisted of the following:Amortized Gross Unrealized Fair
Cost Gain Loss Value(in millions)
As of December 31, 2016:FINRA:
Mutual funds $229.8 $0.4 $(1.1) $229.1
Foundation:Mutual fund $ 24.0 $1.1 $ — $ 25.1
Commingled fund 24.3 0.3 — 24.6
Total Foundation $ 48.3 $1.4 $ — $ 49.7
As of December 31, 2015:FINRA:
Mutual fund $ 7.0 $0.2 $ — $ 7.2
Foundation:Mutual fund $ 24.9 $ — $ — $ 24.9
Commingled fund 24.7 — (0.1) 24.6
Total Foundation $ 49.6 $ — $(0.1) $ 49.5
46 FINRA 2016 Annual Financial Report
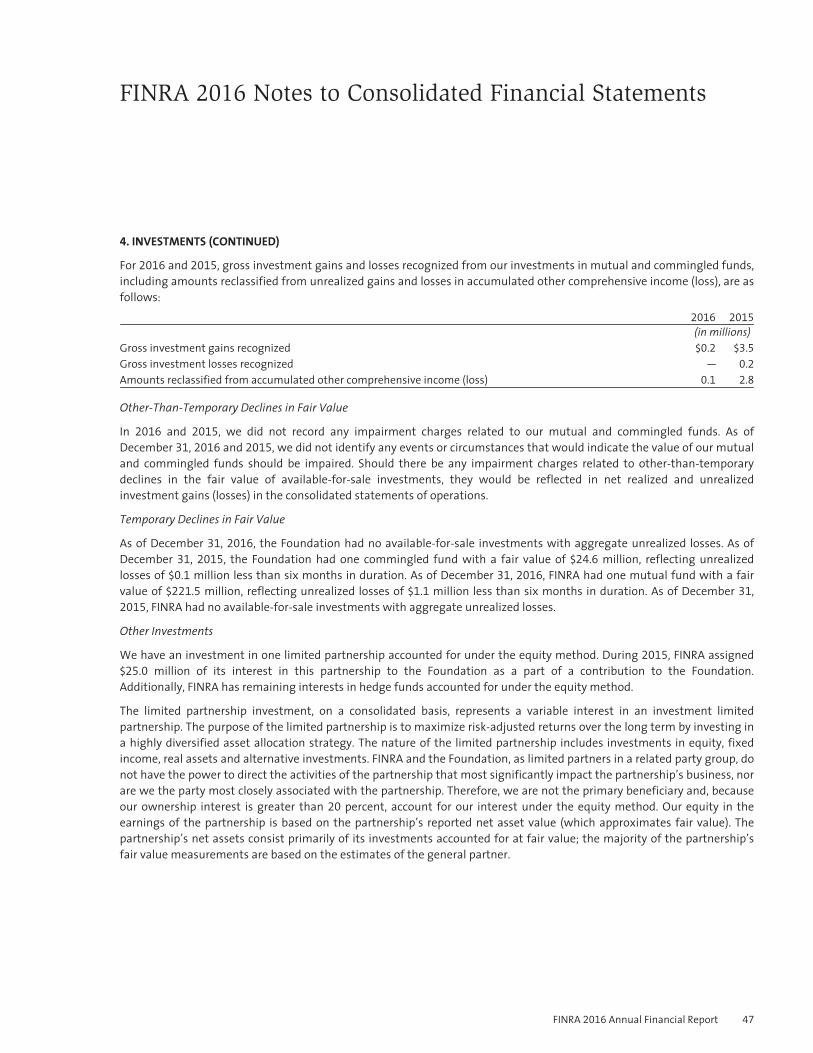
FINRA 2016 Notes to Consolidated Financial Statements
4. INVESTMENTS (CONTINUED)
For 2016 and 2015, gross investment gains and losses recognized from our investments in mutual and commingled funds,including amounts reclassified from unrealized gains and losses in accumulated other comprehensive income (loss), are asfollows:
2016 2015
(in millions)Gross investment gains recognized $0.2 $3.5
Gross investment losses recognized — 0.2
Amounts reclassified from accumulated other comprehensive income (loss) 0.1 2.8
Other-Than-Temporary Declines in Fair Value
In 2016 and 2015, we did not record any impairment charges related to our mutual and commingled funds. As ofDecember 31, 2016 and 2015, we did not identify any events or circumstances that would indicate the value of our mutualand commingled funds should be impaired. Should there be any impairment charges related to other-than-temporarydeclines in the fair value of available-for-sale investments, they would be reflected in net realized and unrealizedinvestment gains (losses) in the consolidated statements of operations.
Temporary Declines in Fair Value
As of December 31, 2016, the Foundation had no available-for-sale investments with aggregate unrealized losses. As ofDecember 31, 2015, the Foundation had one commingled fund with a fair value of $24.6 million, reflecting unrealizedlosses of $0.1 million less than six months in duration. As of December 31, 2016, FINRA had one mutual fund with a fairvalue of $221.5 million, reflecting unrealized losses of $1.1 million less than six months in duration. As of December 31,
2015, FINRA had no available-for-sale investments with aggregate unrealized losses.
Other Investments
We have an investment in one limited partnership accounted for under the equity method. During 2015, FINRA assigned$25.0 million of its interest in this partnership to the Foundation as a part of a contribution to the Foundation.Additionally, FINRA has remaining interests in hedge funds accounted for under the equity method.
The limited partnership investment, on a consolidated basis, represents a variable interest in an investment limitedpartnership. The purpose of the limited partnership is to maximize risk-adjusted returns over the long term by investing ina highly diversified asset allocation strategy. The nature of the limited partnership includes investments in equity, fixedincome, real assets and alternative investments. FINRA and the Foundation, as limited partners in a related party group, donot have the power to direct the activities of the partnership that most significantly impact the partnership’s business, norare we the party most closely associated with the partnership. Therefore, we are not the primary beneficiary and, becauseour ownership interest is greater than 20 percent, account for our interest under the equity method. Our equity in theearnings of the partnership is based on the partnership’s reported net asset value (which approximates fair value). Thepartnership’s net assets consist primarily of its investments accounted for at fair value; the majority of the partnership’sfair value measurements are based on the estimates of the general partner.
FINRA 2016 Annual Financial Report 47

FINRA 2016 Notes to Consolidated Financial Statements
4. INVESTMENTS (CONTINUED)
The limited partnership investment is included in other investments in the consolidated balance sheets. The gains (losses)are included in equity earnings (losses) from other investments in the consolidated statements of operations. Thefollowing table summarizes 2016 and 2015 activity related to the limited partnership for both FINRA and the Foundation.
Investment balanceas of December 31,
Gains (losses) forthe years ended
December 31, Redemptions2016 2015 2016 2015 2016
(in millions)Limited partnership: FINRA $692.6 $698.8 $28.8 $(12.5) $35.0
Limited partnership: Foundation 23.1 24.0 0.9 (1.0) 1.9
Total $715.7 $722.8 $29.7 $(13.5) $36.9
There were no redemptions in 2015. Other than the assignment to the Foundation during 2015, neither FINRA nor theFoundation made any contributions to this partnership during 2016 and 2015. The maximum exposure to loss related tothis partnership for FINRA and the Foundation is limited to $692.6 million and $23.1 million, the carrying amounts of theinvestment, due to the legal structure and design of this partnership. We have no outstanding capital commitments,guarantees or any other liquidity arrangements with this partnership. Our consolidated ownership interest in thispartnership was 63.0 percent at both December 31, 2016 and 2015.
The following table shows our ownership interest in all equity method investments (limited partnership and hedge funds)as of and for the periods ended December 31, 2016 and 2015.
2016 2015
Total net assets (in billions of dollars) $ 8.0 $ 7.5
Total gains (losses) from operations (in millions of dollars) $776.7 $(732.2)Weighted ownership interest in all equity method investees (percentage) 8.9% 9.7%
We did not recognize any impairment charges on our equity method investments for the years ended December 31, 2016
and 2015.
5. FAIR VALUE MEASUREMENT
The Company considers cash and cash equivalents, trading and available-for-sale investments, receivables, investmentsreceivable and investments payable to be its financial instruments. The carrying amounts reported in the consolidatedbalance sheets for these financial instruments equal or closely approximate fair value.
U.S. GAAP defines fair value as the price that would be received upon the sale of an asset or paid to transfer a liability in anorderly transaction between market participants as of the measurement date (i.e., an exit price).
U.S. GAAP prioritizes the level of market price observability used in measuring assets and liabilities at fair value. There are anumber of factors that impact market price observability, including the type of assets and liabilities, and the specificcharacteristics of the assets and liabilities. Assets and liabilities with prices that are readily available, actively quoted or forwhich fair value can be measured from actively quoted prices generally will have a higher degree of market priceobservability and less degree of judgment used in measuring fair value.
48 FINRA 2016 Annual Financial Report
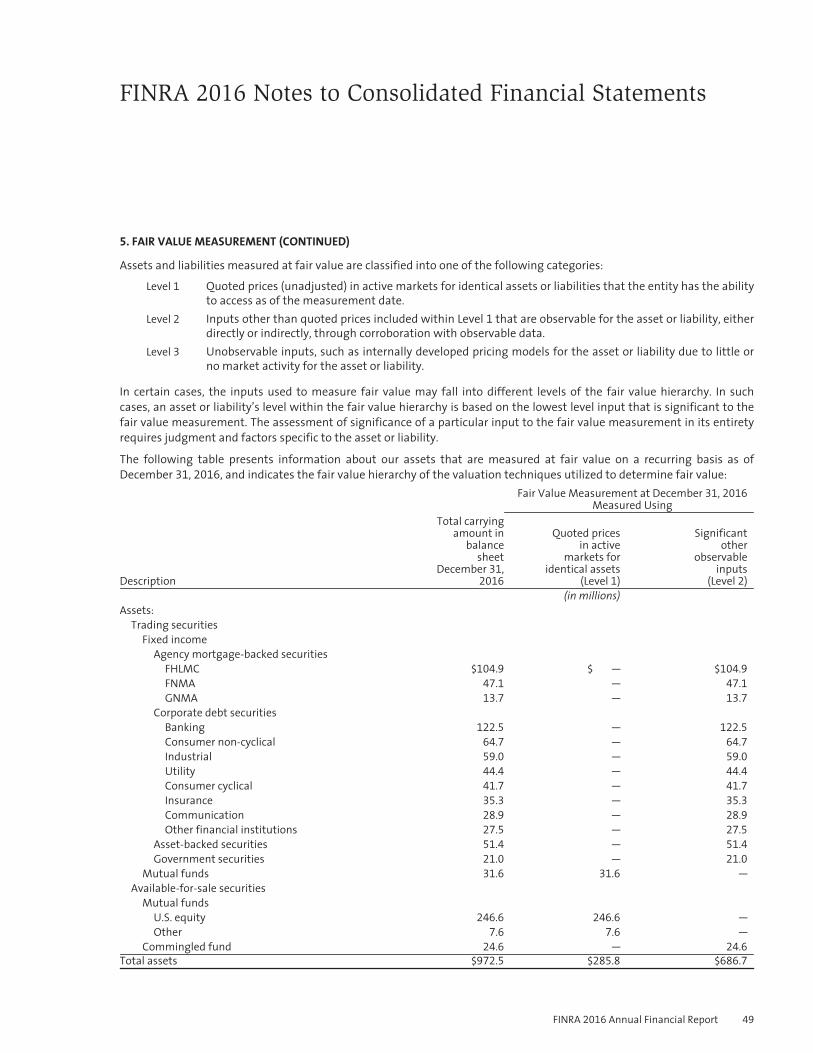
FINRA 2016 Notes to Consolidated Financial Statements
5. FAIR VALUE MEASUREMENT (CONTINUED)
Assets and liabilities measured at fair value are classified into one of the following categories:
Level 1 Quoted prices (unadjusted) in active markets for identical assets or liabilities that the entity has the abilityto access as of the measurement date.
Level 2 Inputs other than quoted prices included within Level 1 that are observable for the asset or liability, eitherdirectly or indirectly, through corroboration with observable data.
Level 3 Unobservable inputs, such as internally developed pricing models for the asset or liability due to little orno market activity for the asset or liability.
In certain cases, the inputs used to measure fair value may fall into different levels of the fair value hierarchy. In suchcases, an asset or liability’s level within the fair value hierarchy is based on the lowest level input that is significant to thefair value measurement. The assessment of significance of a particular input to the fair value measurement in its entiretyrequires judgment and factors specific to the asset or liability.
The following table presents information about our assets that are measured at fair value on a recurring basis as ofDecember 31, 2016, and indicates the fair value hierarchy of the valuation techniques utilized to determine fair value:
Fair Value Measurement at December 31, 2016
Measured Using
Description
Total carryingamount in
balancesheet
December 31,
2016
Quoted pricesin active
markets foridentical assets
(Level 1)
Significantother
observableinputs
(Level 2)(in millions)
Assets:Trading securities
Fixed incomeAgency mortgage-backed securities
FHLMC $104.9 $ — $104.9
FNMA 47.1 — 47.1
GNMA 13.7 — 13.7
Corporate debt securitiesBanking 122.5 — 122.5
Consumer non-cyclical 64.7 — 64.7
Industrial 59.0 — 59.0
Utility 44.4 — 44.4
Consumer cyclical 41.7 — 41.7
Insurance 35.3 — 35.3
Communication 28.9 — 28.9
Other financial institutions 27.5 — 27.5
Asset-backed securities 51.4 — 51.4
Government securities 21.0 — 21.0
Mutual funds 31.6 31.6 —
Available-for-sale securitiesMutual funds
U.S. equity 246.6 246.6 —
Other 7.6 7.6 —
Commingled fund 24.6 — 24.6
Total assets $972.5 $285.8 $686.7
FINRA 2016 Annual Financial Report 49
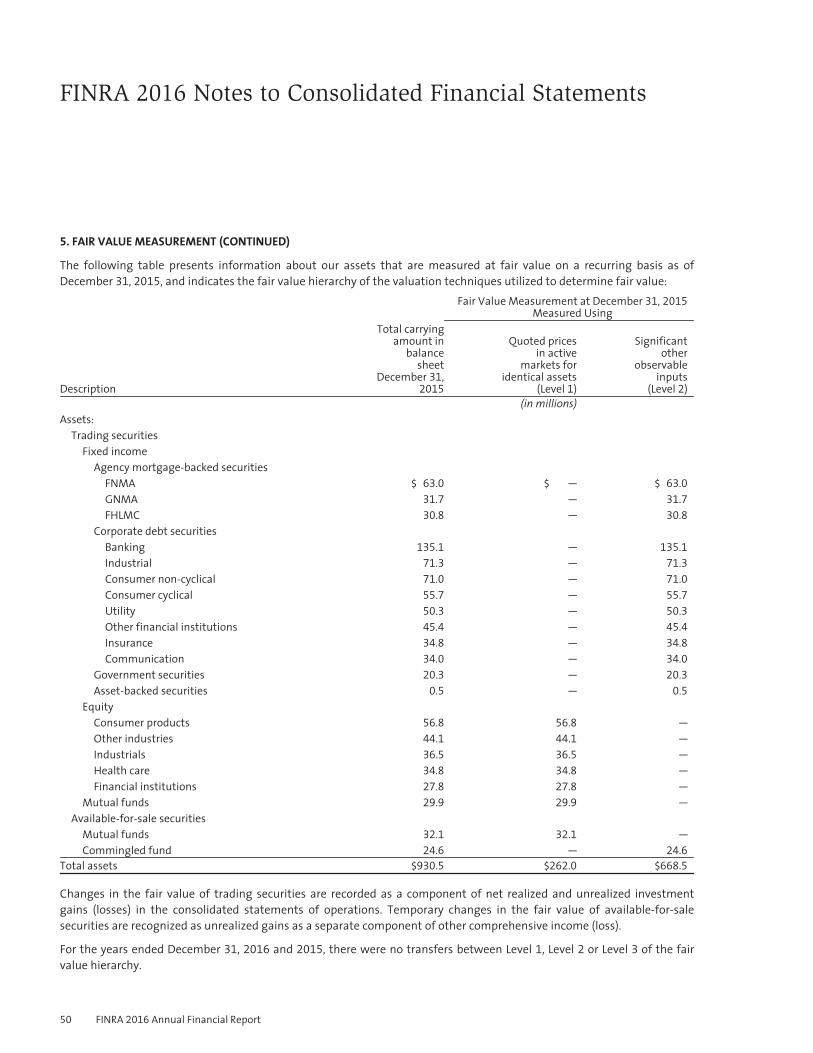
FINRA 2016 Notes to Consolidated Financial Statements
5. FAIR VALUE MEASUREMENT (CONTINUED)
The following table presents information about our assets that are measured at fair value on a recurring basis as ofDecember 31, 2015, and indicates the fair value hierarchy of the valuation techniques utilized to determine fair value:
Fair Value Measurement at December 31, 2015
Measured Using
Description
Total carryingamount in
balancesheet
December 31,
2015
Quoted pricesin active
markets foridentical assets
(Level 1)
Significantother
observableinputs
(Level 2)(in millions)
Assets:Trading securities
Fixed incomeAgency mortgage-backed securities
FNMA $ 63.0 $ — $ 63.0
GNMA 31.7 — 31.7
FHLMC 30.8 — 30.8
Corporate debt securitiesBanking 135.1 — 135.1
Industrial 71.3 — 71.3
Consumer non-cyclical 71.0 — 71.0
Consumer cyclical 55.7 — 55.7
Utility 50.3 — 50.3
Other financial institutions 45.4 — 45.4
Insurance 34.8 — 34.8
Communication 34.0 — 34.0
Government securities 20.3 — 20.3
Asset-backed securities 0.5 — 0.5
EquityConsumer products 56.8 56.8 —
Other industries 44.1 44.1 —
Industrials 36.5 36.5 —
Health care 34.8 34.8 —
Financial institutions 27.8 27.8 —
Mutual funds 29.9 29.9 —
Available-for-sale securitiesMutual funds 32.1 32.1 —
Commingled fund 24.6 — 24.6
Total assets $930.5 $262.0 $668.5
Changes in the fair value of trading securities are recorded as a component of net realized and unrealized investmentgains (losses) in the consolidated statements of operations. Temporary changes in the fair value of available-for-salesecurities are recognized as unrealized gains as a separate component of other comprehensive income (loss).
For the years ended December 31, 2016 and 2015, there were no transfers between Level 1, Level 2 or Level 3 of the fairvalue hierarchy.
50 FINRA 2016 Annual Financial Report
FINRA 2016 Notes to Consolidated Financial Statements
5. FAIR VALUE MEASUREMENT (CONTINUED)
The following is a description of the valuation methodologies used for financial assets measured at fair value on arecurring basis and the general classification of these instruments pursuant to the fair value hierarchy.
Fixed Income
All of our fixed income securities classified as trading securities are priced using the services of third-party pricing vendors.These vendors utilize evaluated and industry-accepted pricing models that vary by asset class and incorporate marketinputs such as available trade, bid and other market information to determine the fair value of the securities. Accordingly,the valuation of these securities is categorized in Level 2 of the fair value hierarchy.
We independently validate the fair value measurement of our trading securities to determine that the assigned fair valuesare appropriate. To validate pricing information received, our policy is to employ a variety of procedures throughout theyear, including comparing information received to other pricing sources and performing independent price checks.
Equity
FINRA no longer holds any equity securities in our trading portfolio as of December 31, 2016. In 2015, our equity securitiesconsisted of common stocks of large corporations in a variety of industry sectors, primarily in the United States. Thesesecurities were listed on major security exchanges and were valued at their closing prices on the balance sheet date.Accordingly, the valuation of these securities was categorized in Level 1 of the fair value hierarchy.
Mutual Funds
All of the mutual funds classified as trading securities, which consist of funds invested in domestic bonds as well asdomestic and international equities, relate to our defined contribution SERP for senior officers and deferred compensationplan for officers under the provisions of Section 457(b) of the IRC.
The Company also invests in mutual funds that are classified as available-for-sale investments based on our intent andability to sell or to hold these investments. One mutual fund investment, related to our closed defined benefit SERPobligation, consists of a life-cycle fund focused on asset allocation through investments in other mutual funds, primarily inbonds with the remainder in equities. Additionally, we have a domestic mutual fund that invests in high qualitycompanies that have both the ability and the commitment to grow their dividends over time.
These investments are valued at the publicly quoted net asset value per share which is computed as of the close ofbusiness on the balance sheet date. Accordingly, the valuation of these securities is categorized in Level 1 of the fair valuehierarchy.
Commingled Fund
Our commingled fund invests in a broad range of U.S. fixed income securities, including government and agencysecurities, mortgage and structured finance securities, and investment-grade U.S. dollar-denominated corporate andsovereign securities. This investment is valued at the quoted net asset value per unit, computed as of the close of businesson the balance sheet date. Units of this investment are valued daily and a unit-holder’s ability to transact in the fund’sunits occurs daily; however, units are not traded on an active exchange. As the fair value per unit is readily determinable,the valuation of these securities is categorized in Level 2 of the fair value hierarchy.
6. INCOME TAXES
FINRA and FINRA REG are tax-exempt organizations under IRC Section 501(c)(6). The Foundation is a tax-exemptorganization under IRC Section 501(c)(4).
FINRA 2016 Annual Financial Report 51
FINRA 2016 Notes to Consolidated Financial Statements
6. INCOME TAXES (CONTINUED)
Unrelated Business Income
Unrelated business income activities are taxed at normal corporate rates to the extent that they have taxable net income.Our unrelated business activities consist primarily of mortgage licensing services provided under our contract with SRR,certain external client exams and other consulting services.
In 2013, management performed an evaluation of the net operating loss (NOL) previously reported under New NASDHolding, Inc. (NAHO), which at that time was a wholly-owned taxable subsidiary of FINRA. Management determined thatFINRA, as the parent organization, should succeed to the NAHO NOLs upon the liquidation of NAHO. At the time ofliquidation, the NOL was determined to have a remaining value, net of gains recognized as part of the transaction, of$60.2 million. As a result of this recognition, as of December 31, 2016 and 2015, FINRA had federal unrelated business losscarryforwards of $54.2 million and $57.6 million, primarily related to NAHO losses and international consulting. The losscarryforwards are scheduled to expire beginning in 2021 through 2028.
The deferred tax asset related to the transfer of the NAHO NOL to FINRA was measured at $20.5 million. In order to recorda deferred tax asset without a valuation allowance, it must be more likely than not that the deferred tax asset will berealized. A component of realization is dependent on generating sufficient taxable income prior to the expiration of theloss carryforwards, as well as evaluation of uncertain tax positions. In 2013, we recorded a valuation allowance equal tothe amount of the deferred tax asset resulting from the NAHO liquidation.
The following table summarizes the 2016 and 2015 activity related to the federal deferred tax asset and valuationallowance:
2016 2015
(in millions)Deferred tax asset related to NOLs $ 18.4 $ 19.6
Other deferred tax assets 0.6 0.5
Valuation allowance for deferred tax assets (19.0) (20.1)
Net deferred tax assets $ — $ —
NOL carryforwards $ 54.2 $ 57.6
There were no other significant deferred tax assets or liabilities related to unrelated business income. The federal andstate 2016 and 2015 income tax provision of $1.5 million and $1.2 million primarily represented the net change in deferredtax assets related to unrelated business loss carryforwards during the year. The income tax provision was included in otherexpense in the consolidated statements of operations.
We did not have any significant unrelated business income taxes payable or refundable in 2016 or 2015.
Uncertain Tax Positions
U.S. GAAP provides a two-step approach for evaluating tax positions. Recognition (step 1) occurs when an entity concludesthat a tax position, based solely on its technical merits, is more likely than not to be sustained upon examination.Measurement (step 2) occurs when the tax benefit is measured as the largest amount of benefit, determined on acumulative probability basis, that is more likely than not to be realized upon ultimate settlement. From 2013 through2016, the years management considers to be open for examination by taxing authorities, management did not identifythe existence of any uncertain tax positions related to current operations. However, FINRA has recognized an uncertain taxposition related to the succession to the NAHO NOLs. The unrecognized tax benefit of the NAHO NOL has been partiallyoffset by other tax credits and non-NAHO NOLs resulting in a net unrecognized tax benefit liability of $1.5 million as ofDecember 31, 2016 and $0.4 million as of December 31, 2015.
52 FINRA 2016 Annual Financial Report
FINRA 2016 Notes to Consolidated Financial Statements
7. EMPLOYEE BENEFIT LIABILITIES
BENEFIT PLANSThe following table summarizes the benefit plans offered by FINRA.
Plan Eligible employees
Defined benefit ERP As of January 1, 2017, less than 700 current employeesnot previously phased out of the plan (closed to newparticipants)
Defined benefit SERP Less than 10 current senior executives not previouslyphased out of the plan in 2011 (closed to newparticipants)
Retiree medical plan Eligible active employees, retirees and their dependents
Postretirement life insurance benefit plan Less than 150 retirees who opted into the plan (closed tonew participants)
Voluntary contributory savings plans All active employees
Defined contribution component to the savings plan Active employees not participating in the defined benefitERP
Deferred compensation plan for officers Active officer-level employees (vice president and above)
Supplemental defined contribution plan for senior officers Active senior executives not participating in the definedbenefit SERP
A brief description of the plans follows.
Defined Benefit ERP and SERP
We provide two non-contributory defined benefit pension plans to eligible employees, including a qualified ERP and a non-qualified SERP. The benefits are based primarily on years of service and employees’ average compensation during thehighest 60 consecutive months of employment. Both plans are now closed to new participants.
On July 15, 2016, the Board approved the decision to transition approximately 1,100 ERP participants who did not meetcertain age and service criteria to the defined contribution component to the savings plan effective January 1, 2017. ERPbenefits for the transitioned participants accrued through December 31, 2016. The total amount of benefits theseparticipants accumulated in the ERP was frozen as of December 31, 2016, and will be made available to them uponretirement. Beginning January 1, 2017, these participants started receiving contributions in the defined contributioncomponent to the savings plan. Some transitioned participants may receive transition credits in the form of additionalcontributions, if they meet certain age and service criteria. As a result of this transition decision, approximately700 participants remain in the ERP as of January 1, 2017.
Retiree Medical Benefit Plan
The Company offers access to retiree medical coverage for eligible active employees, retirees and their dependents. Eligibleretirees pay the full premium cost to be enrolled in the Company’s retiree medical coverage. Additionally, the Companyprovides an employer-funded defined contribution RMA Plan to help our retirees offset health care premiums duringretirement. Under the RMA Plan, Retiree Medical Accounts are created for eligible employees and retirees and fixed annualcredits are applied to those accounts for each year of FINRA service beginning at age 40. Active employees may also accruecredits for a portion of their unused vacation and personal leave. The credits can be accessed only in retirement and maybe used only toward paying a portion of monthly premiums under FINRA-sponsored retiree health plans.
FINRA 2016 Annual Financial Report 53
FINRA 2016 Notes to Consolidated Financial Statements
7. EMPLOYEE BENEFIT LIABILITIES (CONTINUED)
Postretirement Life Insurance Benefit Plan
The Company provides a non-contributory specified life insurance benefit to eligible retired employees. Thepostretirement life insurance benefit plan is closed with respect to new participants.
Voluntary Contributory Savings Plan
FINRA maintains a voluntary contributory savings plan for eligible employees. Employees are immediately eligible to makeelective contributions to the plan up to specified plan limits. Employees are also eligible to receive from FINRA acorresponding dollar-for-dollar matching contribution on any elective contribution made by the participant to the savingsplan, up to a maximum of 4 percent of base compensation, plus an additional discretionary match. The plan also has aretiree medical match equal to 25 cents on the dollar for elective contributions in excess of 6 percent of compensation, upto an annual maximum match of $1,000. The savings plan expense for 2016 and 2015 was $25.2 million and $23.5 million,which was included within compensation and benefits expense in the consolidated statements of operations. The savingsplan expense included a discretionary 2 percent match totaling $7.3 million and $6.9 million for 2016 and 2015, and wasincluded within compensation and benefits expense in the consolidated statements of operations. The retiree medicalmatch for 2016 and 2015 totaled $2.1 million and $1.9 million, which was included within compensation and benefitsexpense in the consolidated statements of operations.
On July 15, 2016, the Board approved a change to the savings plan, effective January 1, 2017, whereby the current basicmatch of 4 percent, the discretionary match of up to 2 percent and the retiree medical match will be replaced with astraightforward 6 percent match of eligible base salary contributed by a participant.
Defined Contribution Component to the Savings Plan
FINRA also offers a defined contribution component to the savings plan to all new hires since January 1, 2011, as well asthe ERP participants who elected during 2011 to participate in the defined contribution component instead of the ERPbeginning on January 1, 2012. The accrued benefit of the former ERP participants was frozen, but future service with FINRAstill allows for growth into vesting and eligibility for early retirement and/or early payment subsidies. The Company’scontributions for this component are based on the participant’s age plus years of service, and vesting is on a graduatedscale over six years. The investment options are the same as the current options in the savings plan. Expenses related tothe defined contribution component to the savings plan for 2016 and 2015 were $9.1 million and $7.6 million, which wereincluded within compensation and benefits expense in the consolidated statements of operations. As previouslymentioned, effective January 1, 2017, approximately 1,100 ERP participants who did not meet certain age and servicecriteria as of December 31, 2016 were transferred to the defined contribution component to the savings plan.
Deferred Compensation Plan for Officers
FINRA maintains a deferred compensation plan for officers under the provisions of Section 457(b) of the IRC. Eligibleemployees may contribute to the plan and, at its discretion, FINRA may make additional contributions to the plan. FINRAplaced the assets of this plan into an irrevocable rabbi trust that the Company consolidates. As of December 31, 2016,$17.4 million of investments and $17.4 million of amounts due to plan participants were included in trading investmentsand accrued personnel and benefit costs in the consolidated balance sheet, representing participant contributions to thisplan and accrued earnings. As of December 31, 2015, $15.6 million of investments and $15.6 million of amounts due toplan participants were included in trading investments and accrued personnel and benefit costs in the consolidatedbalance sheet, representing participant contributions to this plan and accrued earnings. As of December 31, 2016 and2015, FINRA made no additional contributions to this plan.
54 FINRA 2016 Annual Financial Report
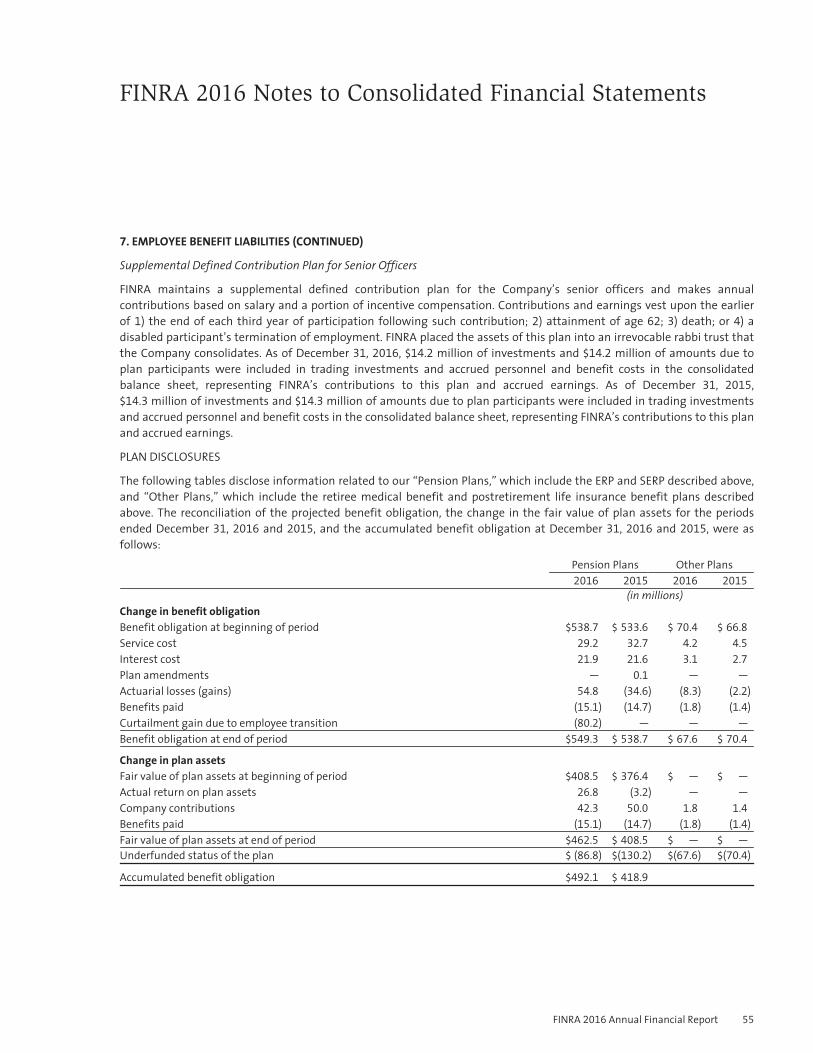
FINRA 2016 Notes to Consolidated Financial Statements
7. EMPLOYEE BENEFIT LIABILITIES (CONTINUED)
Supplemental Defined Contribution Plan for Senior Officers
FINRA maintains a supplemental defined contribution plan for the Company’s senior officers and makes annualcontributions based on salary and a portion of incentive compensation. Contributions and earnings vest upon the earlierof 1) the end of each third year of participation following such contribution; 2) attainment of age 62; 3) death; or 4) adisabled participant’s termination of employment. FINRA placed the assets of this plan into an irrevocable rabbi trust thatthe Company consolidates. As of December 31, 2016, $14.2 million of investments and $14.2 million of amounts due toplan participants were included in trading investments and accrued personnel and benefit costs in the consolidatedbalance sheet, representing FINRA’s contributions to this plan and accrued earnings. As of December 31, 2015,$14.3 million of investments and $14.3 million of amounts due to plan participants were included in trading investmentsand accrued personnel and benefit costs in the consolidated balance sheet, representing FINRA’s contributions to this planand accrued earnings.
PLAN DISCLOSURES
The following tables disclose information related to our “Pension Plans,” which include the ERP and SERP described above,and “Other Plans,” which include the retiree medical benefit and postretirement life insurance benefit plans describedabove. The reconciliation of the projected benefit obligation, the change in the fair value of plan assets for the periodsended December 31, 2016 and 2015, and the accumulated benefit obligation at December 31, 2016 and 2015, were asfollows:
Pension Plans Other Plans2016 2015 2016 2015
(in millions)Change in benefit obligationBenefit obligation at beginning of period $538.7 $ 533.6 $ 70.4 $ 66.8
Service cost 29.2 32.7 4.2 4.5
Interest cost 21.9 21.6 3.1 2.7
Plan amendments — 0.1 — —
Actuarial losses (gains) 54.8 (34.6) (8.3) (2.2)
Benefits paid (15.1) (14.7) (1.8) (1.4)
Curtailment gain due to employee transition (80.2) — — —
Benefit obligation at end of period $549.3 $ 538.7 $ 67.6 $ 70.4
Change in plan assetsFair value of plan assets at beginning of period $408.5 $ 376.4 $ — $ —
Actual return on plan assets 26.8 (3.2) — —
Company contributions 42.3 50.0 1.8 1.4
Benefits paid (15.1) (14.7) (1.8) (1.4)
Fair value of plan assets at end of period $462.5 $ 408.5 $ — $ —
Underfunded status of the plan $ (86.8) $(130.2) $(67.6) $(70.4)
Accumulated benefit obligation $492.1 $ 418.9
FINRA 2016 Annual Financial Report 55

FINRA 2016 Notes to Consolidated Financial Statements
7. EMPLOYEE BENEFIT LIABILITIES (CONTINUED)
Our total accrued pension and other postretirement liability in the consolidated balance sheets comprised the following:Pension Plans Other Plans2016 2015 2016 2015
(in millions)Current $ 5.3 $ 6.1 $ 1.6 $ 2.4
Noncurrent 81.5 124.1 66.0 68.0
Net amount at December 31 $86.8 $130.2 $67.6 $70.4
The current portion of pension and other liabilities represented the net present actuarial value of benefits to be paid overthe next 12 months in excess of plan assets, and was included in accrued personnel and benefit costs in the consolidatedbalance sheet. There are no plan assets for the SERP, retiree medical benefit and postretirement life insurance benefitplans.
The Company does not expect any plan assets to be returned to it during the year ending December 31, 2017.
The components of net periodic benefit cost included in the consolidated statements of operations were as follows:Pension Plans Other Plans2016 2015 2016 2015
(in millions)Service cost $ 29.2 $ 32.7 $4.2 $4.5
Interest cost 21.9 21.6 3.1 2.7
Expected return on plan assets (24.1) (22.4) — —
Recognized net actuarial losses 4.5 5.4 0.3 0.5
Prior service cost recognized 0.1 0.2 1.4 1.4
Curtailment expense as a result of the employee transition 0.4 — — —
Total $ 32.0 $ 37.5 $9.0 $9.1
The assumed health care cost trend rate to be used for the next year to measure the expected cost of other plan liabilitiesis 8.3 percent, with a gradual decline to 5.5 percent by the year 2021. This estimated trend rate is subject to change. Theassumed health care cost trend rate can have a significant effect on the amounts reported. However, a 1-percentage-pointchange in the assumed health care cost trend rate would not have a material impact on the benefit obligation or serviceand interest components of net periodic benefit cost.
The net amounts included in accumulated other comprehensive income (loss) were as follows:Pension Plans Other Plans2016 2015 2016 2015
(in millions)Unrecognized net actuarial loss $(72.5) $(105.1) $ (3.9) $(12.5)Unrecognized prior service cost (0.2) (0.7) (6.1) (7.5)
Net amount at December 31 $(72.7) $(105.8) $(10.0) $(20.0)
56 FINRA 2016 Annual Financial Report
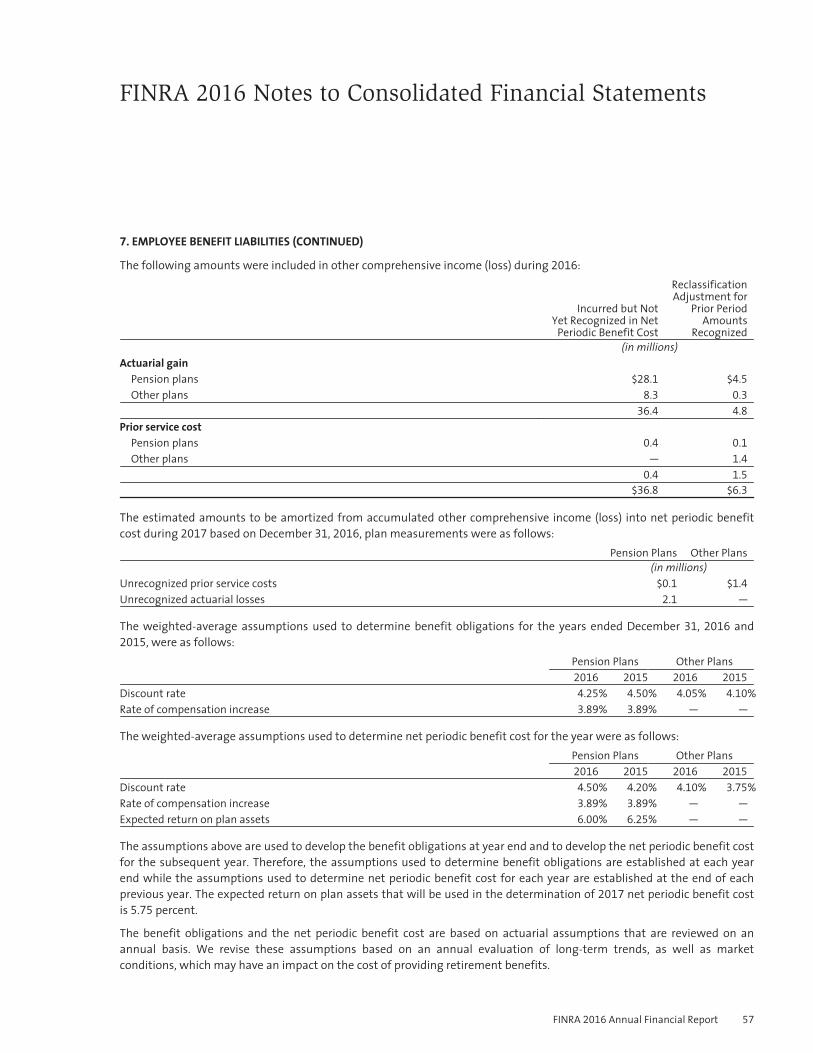
FINRA 2016 Notes to Consolidated Financial Statements
7. EMPLOYEE BENEFIT LIABILITIES (CONTINUED)
The following amounts were included in other comprehensive income (loss) during 2016:
Incurred but NotYet Recognized in Net
Periodic Benefit Cost
ReclassificationAdjustment for
Prior PeriodAmounts
Recognized(in millions)
Actuarial gainPension plans $28.1 $4.5
Other plans 8.3 0.3
36.4 4.8
Prior service costPension plans 0.4 0.1
Other plans — 1.4
0.4 1.5
$36.8 $6.3
The estimated amounts to be amortized from accumulated other comprehensive income (loss) into net periodic benefitcost during 2017 based on December 31, 2016, plan measurements were as follows:
Pension Plans Other Plans(in millions)
Unrecognized prior service costs $0.1 $1.4
Unrecognized actuarial losses 2.1 —
The weighted-average assumptions used to determine benefit obligations for the years ended December 31, 2016 and2015, were as follows:
Pension Plans Other Plans2016 2015 2016 2015
Discount rate 4.25% 4.50% 4.05% 4.10%
Rate of compensation increase 3.89% 3.89% — —
The weighted-average assumptions used to determine net periodic benefit cost for the year were as follows:Pension Plans Other Plans2016 2015 2016 2015
Discount rate 4.50% 4.20% 4.10% 3.75%
Rate of compensation increase 3.89% 3.89% — —
Expected return on plan assets 6.00% 6.25% — —
The assumptions above are used to develop the benefit obligations at year end and to develop the net periodic benefit costfor the subsequent year. Therefore, the assumptions used to determine benefit obligations are established at each yearend while the assumptions used to determine net periodic benefit cost for each year are established at the end of eachprevious year. The expected return on plan assets that will be used in the determination of 2017 net periodic benefit costis 5.75 percent.
The benefit obligations and the net periodic benefit cost are based on actuarial assumptions that are reviewed on anannual basis. We revise these assumptions based on an annual evaluation of long-term trends, as well as marketconditions, which may have an impact on the cost of providing retirement benefits.
FINRA 2016 Annual Financial Report 57
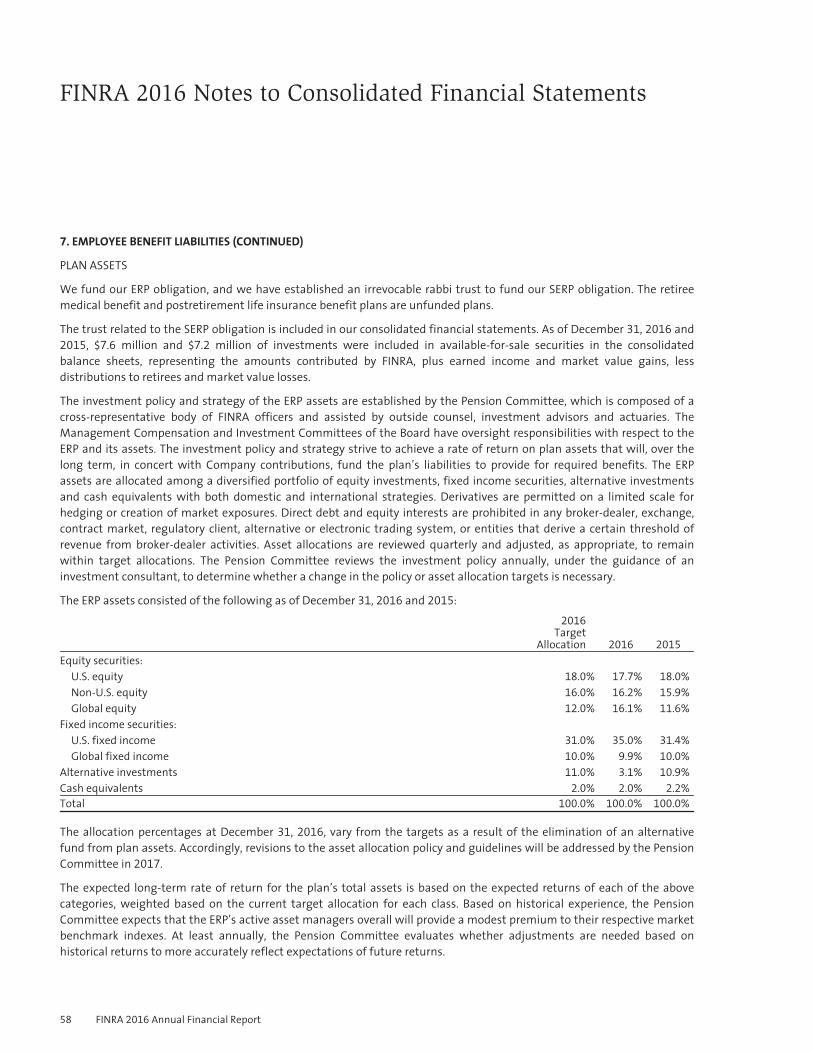
FINRA 2016 Notes to Consolidated Financial Statements
7. EMPLOYEE BENEFIT LIABILITIES (CONTINUED)
PLAN ASSETS
We fund our ERP obligation, and we have established an irrevocable rabbi trust to fund our SERP obligation. The retireemedical benefit and postretirement life insurance benefit plans are unfunded plans.
The trust related to the SERP obligation is included in our consolidated financial statements. As of December 31, 2016 and2015, $7.6 million and $7.2 million of investments were included in available-for-sale securities in the consolidatedbalance sheets, representing the amounts contributed by FINRA, plus earned income and market value gains, lessdistributions to retirees and market value losses.
The investment policy and strategy of the ERP assets are established by the Pension Committee, which is composed of across-representative body of FINRA officers and assisted by outside counsel, investment advisors and actuaries. TheManagement Compensation and Investment Committees of the Board have oversight responsibilities with respect to theERP and its assets. The investment policy and strategy strive to achieve a rate of return on plan assets that will, over thelong term, in concert with Company contributions, fund the plan’s liabilities to provide for required benefits. The ERPassets are allocated among a diversified portfolio of equity investments, fixed income securities, alternative investmentsand cash equivalents with both domestic and international strategies. Derivatives are permitted on a limited scale forhedging or creation of market exposures. Direct debt and equity interests are prohibited in any broker-dealer, exchange,contract market, regulatory client, alternative or electronic trading system, or entities that derive a certain threshold ofrevenue from broker-dealer activities. Asset allocations are reviewed quarterly and adjusted, as appropriate, to remainwithin target allocations. The Pension Committee reviews the investment policy annually, under the guidance of aninvestment consultant, to determine whether a change in the policy or asset allocation targets is necessary.
The ERP assets consisted of the following as of December 31, 2016 and 2015:2016
TargetAllocation 2016 2015
Equity securities:U.S. equity 18.0% 17.7% 18.0%
Non-U.S. equity 16.0% 16.2% 15.9%
Global equity 12.0% 16.1% 11.6%
Fixed income securities:U.S. fixed income 31.0% 35.0% 31.4%
Global fixed income 10.0% 9.9% 10.0%
Alternative investments 11.0% 3.1% 10.9%
Cash equivalents 2.0% 2.0% 2.2%
Total 100.0% 100.0% 100.0%
The allocation percentages at December 31, 2016, vary from the targets as a result of the elimination of an alternativefund from plan assets. Accordingly, revisions to the asset allocation policy and guidelines will be addressed by the PensionCommittee in 2017.
The expected long-term rate of return for the plan’s total assets is based on the expected returns of each of the abovecategories, weighted based on the current target allocation for each class. Based on historical experience, the PensionCommittee expects that the ERP’s active asset managers overall will provide a modest premium to their respective marketbenchmark indexes. At least annually, the Pension Committee evaluates whether adjustments are needed based onhistorical returns to more accurately reflect expectations of future returns.
58 FINRA 2016 Annual Financial Report
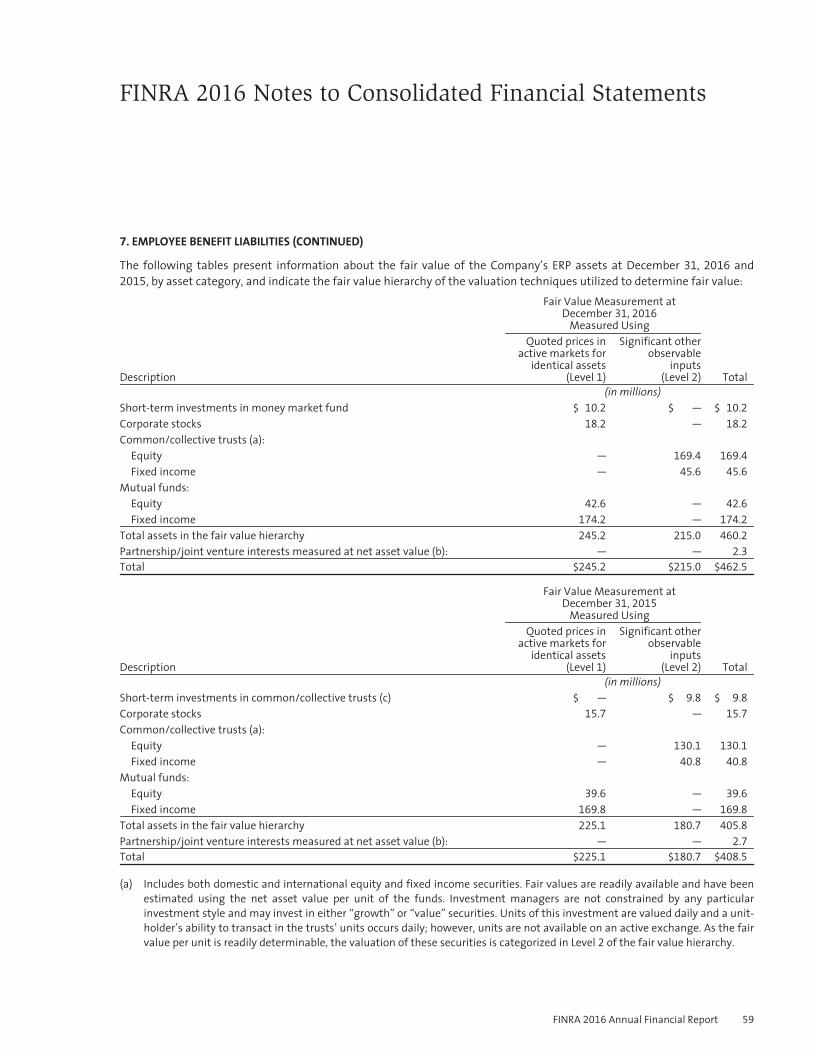
FINRA 2016 Notes to Consolidated Financial Statements
7. EMPLOYEE BENEFIT LIABILITIES (CONTINUED)
The following tables present information about the fair value of the Company’s ERP assets at December 31, 2016 and2015, by asset category, and indicate the fair value hierarchy of the valuation techniques utilized to determine fair value:
Fair Value Measurement atDecember 31, 2016
Measured Using
Description
Quoted prices inactive markets for
identical assets(Level 1)
Significant otherobservable
inputs(Level 2) Total
(in millions)Short-term investments in money market fund $ 10.2 $ — $ 10.2
Corporate stocks 18.2 — 18.2
Common/collective trusts (a):Equity — 169.4 169.4
Fixed income — 45.6 45.6
Mutual funds:Equity 42.6 — 42.6
Fixed income 174.2 — 174.2
Total assets in the fair value hierarchy 245.2 215.0 460.2
Partnership/joint venture interests measured at net asset value (b): — — 2.3
Total $245.2 $215.0 $462.5
Fair Value Measurement atDecember 31, 2015
Measured Using
Description
Quoted prices inactive markets for
identical assets(Level 1)
Significant otherobservable
inputs(Level 2) Total
(in millions)Short-term investments in common/collective trusts (c) $ — $ 9.8 $ 9.8
Corporate stocks 15.7 — 15.7
Common/collective trusts (a):Equity — 130.1 130.1
Fixed income — 40.8 40.8
Mutual funds:Equity 39.6 — 39.6
Fixed income 169.8 — 169.8
Total assets in the fair value hierarchy 225.1 180.7 405.8
Partnership/joint venture interests measured at net asset value (b): — — 2.7
Total $225.1 $180.7 $408.5
(a) Includes both domestic and international equity and fixed income securities. Fair values are readily available and have beenestimated using the net asset value per unit of the funds. Investment managers are not constrained by any particularinvestment style and may invest in either “growth” or “value” securities. Units of this investment are valued daily and a unit-holder’s ability to transact in the trusts’ units occurs daily; however, units are not available on an active exchange. As the fairvalue per unit is readily determinable, the valuation of these securities is categorized in Level 2 of the fair value hierarchy.
FINRA 2016 Annual Financial Report 59
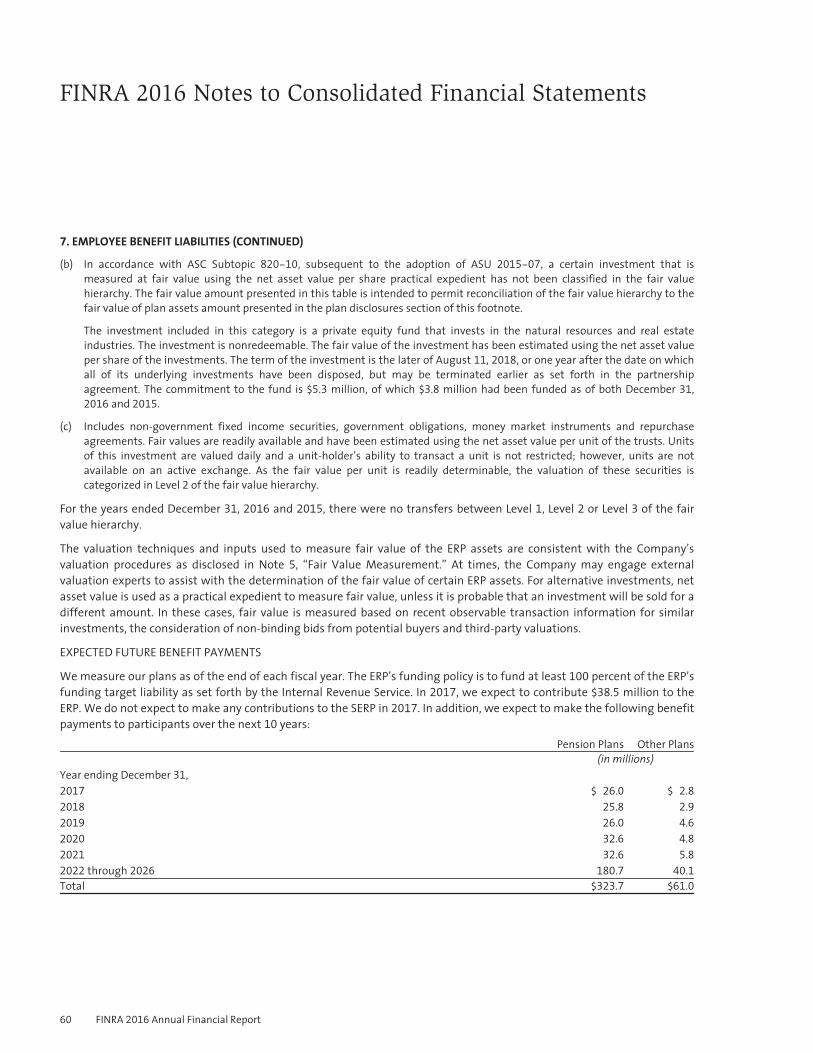
FINRA 2016 Notes to Consolidated Financial Statements
7. EMPLOYEE BENEFIT LIABILITIES (CONTINUED)
(b) In accordance with ASC Subtopic 820-10, subsequent to the adoption of ASU 2015-07, a certain investment that ismeasured at fair value using the net asset value per share practical expedient has not been classified in the fair valuehierarchy. The fair value amount presented in this table is intended to permit reconciliation of the fair value hierarchy to thefair value of plan assets amount presented in the plan disclosures section of this footnote.
The investment included in this category is a private equity fund that invests in the natural resources and real estateindustries. The investment is nonredeemable. The fair value of the investment has been estimated using the net asset valueper share of the investments. The term of the investment is the later of August 11, 2018, or one year after the date on whichall of its underlying investments have been disposed, but may be terminated earlier as set forth in the partnershipagreement. The commitment to the fund is $5.3 million, of which $3.8 million had been funded as of both December 31,
2016 and 2015.
(c) Includes non-government fixed income securities, government obligations, money market instruments and repurchaseagreements. Fair values are readily available and have been estimated using the net asset value per unit of the trusts. Unitsof this investment are valued daily and a unit-holder’s ability to transact a unit is not restricted; however, units are notavailable on an active exchange. As the fair value per unit is readily determinable, the valuation of these securities iscategorized in Level 2 of the fair value hierarchy.
For the years ended December 31, 2016 and 2015, there were no transfers between Level 1, Level 2 or Level 3 of the fairvalue hierarchy.
The valuation techniques and inputs used to measure fair value of the ERP assets are consistent with the Company’svaluation procedures as disclosed in Note 5, “Fair Value Measurement.” At times, the Company may engage externalvaluation experts to assist with the determination of the fair value of certain ERP assets. For alternative investments, netasset value is used as a practical expedient to measure fair value, unless it is probable that an investment will be sold for adifferent amount. In these cases, fair value is measured based on recent observable transaction information for similarinvestments, the consideration of non-binding bids from potential buyers and third-party valuations.
EXPECTED FUTURE BENEFIT PAYMENTS
We measure our plans as of the end of each fiscal year. The ERP’s funding policy is to fund at least 100 percent of the ERP’sfunding target liability as set forth by the Internal Revenue Service. In 2017, we expect to contribute $38.5 million to theERP. We do not expect to make any contributions to the SERP in 2017. In addition, we expect to make the following benefitpayments to participants over the next 10 years:
Pension Plans Other Plans(in millions)
Year ending December 31,2017 $ 26.0 $ 2.8
2018 25.8 2.9
2019 26.0 4.6
2020 32.6 4.8
2021 32.6 5.8
2022 through 2026 180.7 40.1
Total $323.7 $61.0
60 FINRA 2016 Annual Financial Report
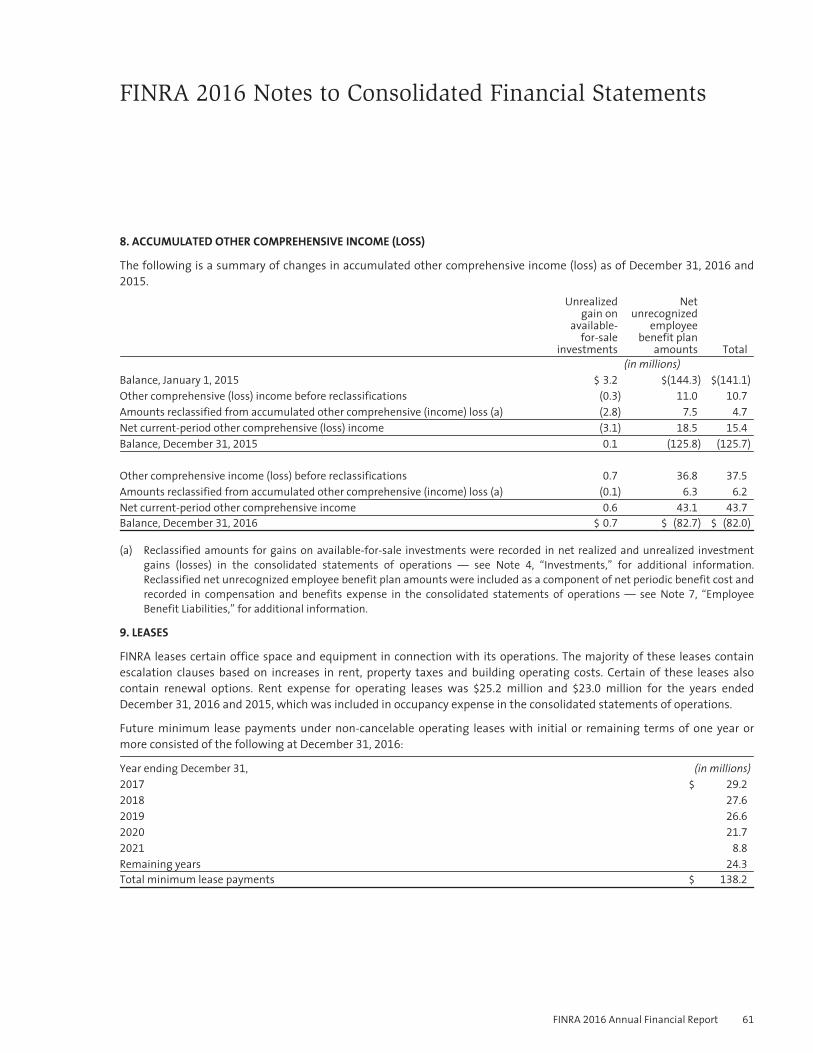
FINRA 2016 Notes to Consolidated Financial Statements
8. ACCUMULATED OTHER COMPREHENSIVE INCOME (LOSS)
The following is a summary of changes in accumulated other comprehensive income (loss) as of December 31, 2016 and2015.
Unrealizedgain on
available-for-sale
investments
Netunrecognized
employeebenefit plan
amounts Total(in millions)
Balance, January 1, 2015 $ 3.2 $(144.3) $(141.1)
Other comprehensive (loss) income before reclassifications (0.3) 11.0 10.7
Amounts reclassified from accumulated other comprehensive (income) loss (a) (2.8) 7.5 4.7
Net current-period other comprehensive (loss) income (3.1) 18.5 15.4
Balance, December 31, 2015 0.1 (125.8) (125.7)
Other comprehensive income (loss) before reclassifications 0.7 36.8 37.5
Amounts reclassified from accumulated other comprehensive (income) loss (a) (0.1) 6.3 6.2
Net current-period other comprehensive income 0.6 43.1 43.7
Balance, December 31, 2016 $ 0.7 $ (82.7) $ (82.0)
(a) Reclassified amounts for gains on available-for-sale investments were recorded in net realized and unrealized investmentgains (losses) in the consolidated statements of operations — see Note 4, “Investments,” for additional information.Reclassified net unrecognized employee benefit plan amounts were included as a component of net periodic benefit cost andrecorded in compensation and benefits expense in the consolidated statements of operations — see Note 7, “EmployeeBenefit Liabilities,” for additional information.
9. LEASES
FINRA leases certain office space and equipment in connection with its operations. The majority of these leases containescalation clauses based on increases in rent, property taxes and building operating costs. Certain of these leases alsocontain renewal options. Rent expense for operating leases was $25.2 million and $23.0 million for the years endedDecember 31, 2016 and 2015, which was included in occupancy expense in the consolidated statements of operations.
Future minimum lease payments under non-cancelable operating leases with initial or remaining terms of one year ormore consisted of the following at December 31, 2016:
Year ending December 31, (in millions)2017 $ 29.2
2018 27.6
2019 26.6
2020 21.7
2021 8.8
Remaining years 24.3
Total minimum lease payments $ 138.2
FINRA 2016 Annual Financial Report 61
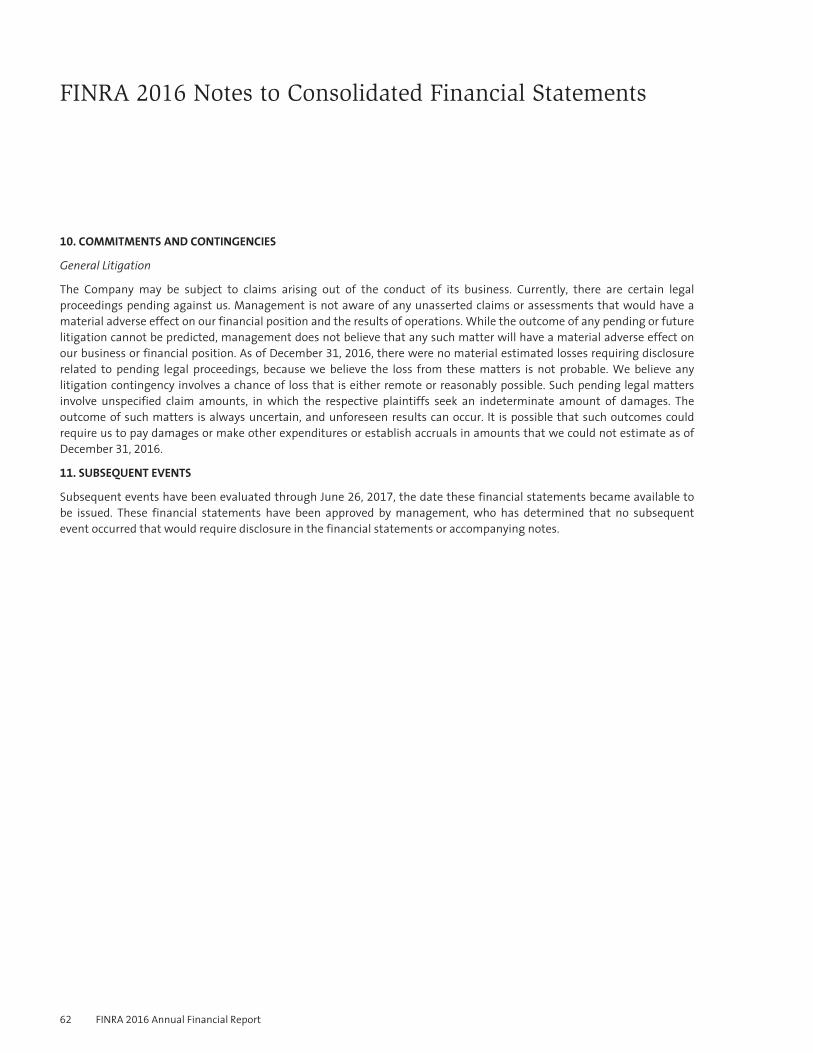
FINRA 2016 Notes to Consolidated Financial Statements
10. COMMITMENTS AND CONTINGENCIES
General Litigation
The Company may be subject to claims arising out of the conduct of its business. Currently, there are certain legalproceedings pending against us. Management is not aware of any unasserted claims or assessments that would have amaterial adverse effect on our financial position and the results of operations. While the outcome of any pending or futurelitigation cannot be predicted, management does not believe that any such matter will have a material adverse effect onour business or financial position. As of December 31, 2016, there were no material estimated losses requiring disclosurerelated to pending legal proceedings, because we believe the loss from these matters is not probable. We believe anylitigation contingency involves a chance of loss that is either remote or reasonably possible. Such pending legal mattersinvolve unspecified claim amounts, in which the respective plaintiffs seek an indeterminate amount of damages. Theoutcome of such matters is always uncertain, and unforeseen results can occur. It is possible that such outcomes couldrequire us to pay damages or make other expenditures or establish accruals in amounts that we could not estimate as ofDecember 31, 2016.
11. SUBSEQUENT EVENTS
Subsequent events have been evaluated through June 26, 2017, the date these financial statements became available tobe issued. These financial statements have been approved by management, who has determined that no subsequentevent occurred that would require disclosure in the financial statements or accompanying notes.
62 FINRA 2016 Annual Financial Report

FINRA Board ofGovernors as ofJune 16, 2017John J. Brennan (Industry)ChairmanThe Vanguard Group, Inc.Malvern, PA
Robert W. CookPresident and CEOFINRAWashington, DC
Mark W. Cresap (Industry)Cresap, Inc.Radnor, PA
Stephen M. Cutler (Industry)JPMorgan Chase & Co.New York, NY
Carol Anthony (John) Davidson(Public)RetiredBonita Springs, FL
Andrew S. Duff (Industry)Piper JaffrayMinneapolis, MN
Susan Wolburgh Jenah (Public)Former President and CEO,Investment Industry RegulatoryOrganization of CanadaToronto, ON
Brian J. Kovack (Industry)Kovack Securities, Inc.Ft. Lauderdale, FL
Rochelle B. Lazarus (Public)Ogilvy & MatherNew York, NY
Joshua S. Levine (Public)RetiredNew York, NY
Brigitte C. Madrian (Public)Harvard Kennedy School ofGovernmentCambridge, MA
Joseph M. Mecane (Industry)BarclaysNew York, NY
Robert A. Muh (Industry)Sutter Securities, Inc.San Francisco, CA
Kathleen A. Murphy (Industry)Fidelity Personal InvestingBoston, MA
Eileen Murray (Public)Bridgewater AssociatesWestport, CT
Charles I. Plosser (Public)Former President and CEO,Federal Reserve Bank ofPhiladelphiaAmelia Island, FL
Randal K. Quarles (Public)The Cynosure GroupSalt Lake City, UT
Joe Romano (Industry)Romano Wealth ManagementEvanston, IL
Hillary Sale (Public)Washington University inSt. Louis Law SchoolSt. Louis, MO
Leslie F. Seidman (Public)Former Chairman, FinancialAccounting Standards BoardWestport, CT
John W. Thiel (Industry)Merrill Lynch WealthManagementNew York, NY
Luis M. Viceira (Public)Harvard Business SchoolBoston, MA
Elisse B. Walter (Public)Former Commissioner andChairman, U.S. Securities andExchange CommissionBethesda, MD
FINRA Officers asof June 5, 2017Robert W. CookPresident andChief Executive Officer
Marcia E. AsquithExecutive Vice President,Board and External Relations
Susan F. AxelrodExecutive Vice President,Regulatory Operations
Richard W. BerryExecutive Vice President andDirector of Dispute Resolution
Robert L. D. ColbyExecutive Vice President andChief Legal Officer
Carlo V. di FlorioChief Risk Officer andHead of Strategy
Todd T. DiganciExecutive Vice President—Chief Financial Officer andChief Administrative Officer
Cameron K. FunkhouserExecutive Vice President,Office of Fraud Detection andMarket Intelligence
Thomas R. GiraExecutive Vice President,Market Regulation andTransparency Services
Derek W. LindenExecutive Vice President,Registration and Disclosure
Robert A. MarchmanExecutive Vice President,Market Regulation—LegalAdministration
Steven J. RandichExecutive Vice President andChief Information Officer
FINRA 2016 Annual Financial Report 63
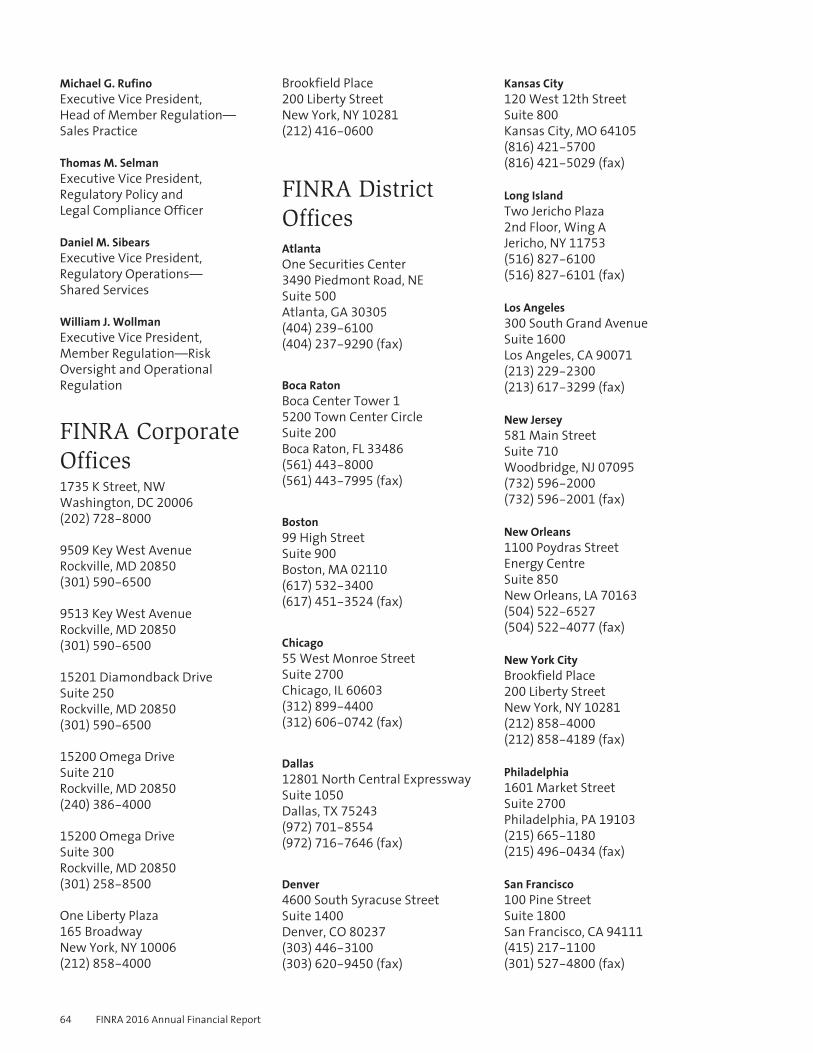
Michael G. RufinoExecutive Vice President,Head of Member Regulation—Sales Practice
Thomas M. SelmanExecutive Vice President,Regulatory Policy andLegal Compliance Officer
Daniel M. SibearsExecutive Vice President,Regulatory Operations—Shared Services
William J. WollmanExecutive Vice President,Member Regulation—RiskOversight and OperationalRegulation
FINRA CorporateOffices1735 K Street, NWWashington, DC 20006
(202) 728-8000
9509 Key West AvenueRockville, MD 20850
(301) 590-6500
9513 Key West AvenueRockville, MD 20850
(301) 590-6500
15201 Diamondback DriveSuite 250
Rockville, MD 20850
(301) 590-6500
15200 Omega DriveSuite 210
Rockville, MD 20850
(240) 386-4000
15200 Omega DriveSuite 300
Rockville, MD 20850
(301) 258-8500
One Liberty Plaza165 BroadwayNew York, NY 10006
(212) 858-4000
Brookfield Place200 Liberty StreetNew York, NY 10281
(212) 416-0600
FINRA DistrictOfficesAtlantaOne Securities Center3490 Piedmont Road, NESuite 500
Atlanta, GA 30305
(404) 239-6100
(404) 237-9290 (fax)
Boca RatonBoca Center Tower 1
5200 Town Center CircleSuite 200
Boca Raton, FL 33486
(561) 443-8000
(561) 443-7995 (fax)
Boston99 High StreetSuite 900
Boston, MA 02110
(617) 532-3400
(617) 451-3524 (fax)
Chicago55 West Monroe StreetSuite 2700
Chicago, IL 60603
(312) 899-4400
(312) 606-0742 (fax)
Dallas12801 North Central ExpresswaySuite 1050
Dallas, TX 75243
(972) 701-8554
(972) 716-7646 (fax)
Denver4600 South Syracuse StreetSuite 1400
Denver, CO 80237
(303) 446-3100
(303) 620-9450 (fax)
Kansas City120 West 12th StreetSuite 800
Kansas City, MO 64105
(816) 421-5700
(816) 421-5029 (fax)
Long IslandTwo Jericho Plaza2nd Floor, Wing AJericho, NY 11753
(516) 827-6100
(516) 827-6101 (fax)
Los Angeles300 South Grand AvenueSuite 1600
Los Angeles, CA 90071
(213) 229-2300
(213) 617-3299 (fax)
New Jersey581 Main StreetSuite 710
Woodbridge, NJ 07095
(732) 596-2000
(732) 596-2001 (fax)
New Orleans1100 Poydras StreetEnergy CentreSuite 850
New Orleans, LA 70163
(504) 522-6527
(504) 522-4077 (fax)
New York CityBrookfield Place200 Liberty StreetNew York, NY 10281
(212) 858-4000
(212) 858-4189 (fax)
Philadelphia1601 Market StreetSuite 2700
Philadelphia, PA 19103
(215) 665-1180
(215) 496-0434 (fax)
San Francisco100 Pine StreetSuite 1800
San Francisco, CA 94111
(415) 217-1100
(301) 527-4800 (fax)
64 FINRA 2016 Annual Financial Report
FINRA MarketRegulationRegional Offices55 West Monroe StreetSuite 2700
Chicago, IL 60603
(312) 899-4504
(312) 236-9257 (fax)
440 South LaSalle StreetSuite 3500
Chicago, IL 60605
One Liberty Plaza165 BroadwayNew York, NY 10006
(212) 858-4000
1601 Market StreetSuite 2700
Philadelphia, PA 19103
(215) 665-1180
(215) 496-0434 (fax)
FINRA DisputeResolutionRegional OfficesMidwest Region55 West Monroe StreetSuite 2600
Chicago, IL 60603
(312) 899-4440
(301) 527-4851 (fax)
Northeast RegionOne Liberty Plaza165 Broadway27th FloorNew York, NY 10006
(212) 858-4200
(301) 527-4873 (fax)
Southeast RegionBoca Center Tower 1
5200 Town Center CircleSuite 200
Boca Raton, FL 33486
(561) 416-0277
(301) 527-4868 (fax)
West Region300 South Grand AvenueSuite 1700
Los Angeles, CA 90071
(213) 613-2680
(301) 527-4766 (fax)
FINRA 2016 Annual Financial Report 65
This Annual Financial Report and the information contained herein is for general educational and informational purposesonly. The information contained herein is only timely as of the date of this report and the information, estimates andexpressions of judgment herein are subject to change without notice. To the extent this Annual Financial Report containsstatements that are not recitations of historical fact, such statements may constitute “forward-looking statements”. Inthis respect, the words “estimate,” “project,” “anticipate,” “expect,” “intend,” “believe,” and similar expressions areintended to identify forward-looking statements. Forward-looking statements are based on current expectations of futureevents and are subject to risks and uncertainties that could cause actual results to differ materially from those expressedor implied by such statements. All forward-looking statements included in this Section are made only as of the date of thestatement, and FINRA assumes no obligation to update any forward-looking statements made by them as a result of newinformation, future events, or other factors. Although FINRA takes reasonable care to ensure that the informationcontained in the Annual Financial Report is accurate, the information is provided “as is” and FINRA makes norepresentations or warranties, express or implied, regarding the information contained herein, including but not limited toany warranties regarding the accuracy, completeness or timeliness of the information provided herein. Neither FINRA norany of its respective affiliates, directors, officers, registered representatives or employees, nor any third party vendor, willbe liable or have any liability, whether in contract, tort, strict liability or otherwise, for any direct, indirect, incidental,consequential, punitive or special damages arising out of or in any way connected with your access or use or inability toaccess or use the Annual Financial Report or reliance on its content. Persons considering or making investment decisionsshould refer to the annual, quarterly and current reports, proxy statements and other information filed by the prospectiveinvestment vehicle with the Securities and Exchange Commission (SEC) under the Securities Exchange Act of 1934, asamended. Such reports and other information may be read and copied at the SEC’s Public Reference Room at 100 F Street,N.E., Washington, DC 20549 or obtained by mail from the Public Reference Room at prescribed rates. Such reports andother information are also available at the SEC’s Internet Web site, www.sec.gov. This Annual Financial Report does notincorporate by reference any other document or information.
©Copyright 2017. Financial Industry Regulatory Authority, Inc. All Rights Reserved. FINRA is a trademark of FinancialIndustry Regulatory Authority, Inc. No portion of this document may be duplicated, republished, modified, redistributed, ormanipulated in any form without prior written permission from FINRA.
FINRA 2016 Annual Financial Report

FINRA 2016 Annual Financial Report 11
Investor protection. Market integrity. 1735 K Street NWWashington, DC20006-1506
www.finra.org© 2017 FINRA. All rights reserved.FINRA and other trademarks of the Financial Industry Regulatory Authority, Inc. may not be used without permission.17_0108.1—06/17