1 Yellow River Basin Water Accounting Zhongping Zhu, Mark Giordano, Ximing Cai 1 , and David Molden International Water Management Institute (IWMI), Colombo, Sri Lanka Email contact: [email protected] Abstract Water accounting is a fundamental tool in river basin management and planning. Water accounting systems, however, are not universally consistent, complicating efforts to share information and research findings across nations. China, for example, utilizes a unique system that is not well understood by outside scientists. As China continues to emerge onto the global water management scene, it is becoming increasingly important for international researchers to understand Chinese water accounting frameworks and concepts. This paper uses data, largely provided by the Yellow River Conservancy Commission, to describe China’s water accounting system and examine water balances in the Yellow River, one of China’s most important water bodies. The paper shows that the primary difference between water accounting methodologies in the Yellow River basin and those familiar to most international researchers is related to supply accounting in general and groundwater accounting in particular. Although not currently included in its water accounting system, Chinese concepts of environmental water use, when included, will also differ substantially from those familiar to outside researchers. In terms of actual Yellow River balances, the paper highlights what could be a declining trend in both rainfall and runoff, which may require changes in current planning assumptions concerning average flow. In addition to declining supply, growing industrial and domestic demand are increasing pressure to reduce the use of water in agriculture, the basin’s largest water consuming sector. As an initial guide for assessing possible agricultural policy responses, the paper provides estimates, for the first time, of Yellow River basin agricultural water productivity. Finally, the paper highlights the massive challenge managers in the Yellow River, as in other basins around the world, are facing as they seek to balance human water demand with increasingly understood ecological needs. Key Words: Yellow River, Water Accounting, China, Water Management, Environmental Use 1 International Food Policy Research Institute (IFPRI), Washington DC

Welcome message from author
This document is posted to help you gain knowledge. Please leave a comment to let me know what you think about it! Share it to your friends and learn new things together.
Transcript
1
Yellow River Basin Water Accounting
Zhongping Zhu, Mark Giordano, Ximing Cai1, and David Molden
International Water Management Institute (IWMI), Colombo, Sri Lanka
Email contact: [email protected]
Abstract
Water accounting is a fundamental tool in river basin management and planning. Water
accounting systems, however, are not universally consistent, complicating efforts to share
information and research findings across nations. China, for example, utilizes a unique
system that is not well understood by outside scientists. As China continues to emerge
onto the global water management scene, it is becoming increasingly important for
international researchers to understand Chinese water accounting frameworks and
concepts. This paper uses data, largely provided by the Yellow River Conservancy
Commission, to describe China’s water accounting system and examine water balances in
the Yellow River, one of China’s most important water bodies. The paper shows that the
primary difference between water accounting methodologies in the Yellow River basin
and those familiar to most international researchers is related to supply accounting in
general and groundwater accounting in particular. Although not currently included in its
water accounting system, Chinese concepts of environmental water use, when included,
will also differ substantially from those familiar to outside researchers. In terms of actual
Yellow River balances, the paper highlights what could be a declining trend in both
rainfall and runoff, which may require changes in current planning assumptions
concerning average flow. In addition to declining supply, growing industrial and
domestic demand are increasing pressure to reduce the use of water in agriculture, the
basin’s largest water consuming sector. As an initial guide for assessing possible
agricultural policy responses, the paper provides estimates, for the first time, of Yellow
River basin agricultural water productivity. Finally, the paper highlights the massive
challenge managers in the Yellow River, as in other basins around the world, are facing
as they seek to balance human water demand with increasingly understood ecological
needs.
Key Words: Yellow River, Water Accounting, China, Water
Management, Environmental Use
1 International Food Policy Research Institute (IFPRI), Washington DC
2
Yellow River Basin Water Accounting
Zhongping Zhu, Mark Giordano, Ximing Cai
2, and David Molden
International Water Management Institute (IWMI), Colombo, Sri Lanka
Email contact: [email protected]
Introduction
The Yellow River, or Huanghe, is the second longest river in China. Originating in the
Bayangela Mountains in western China, the river drops a total of 4500m as it loops north
into the Gobi Desert before turning south through the Loess Plateau and then east to its
terminus in the Bohai Gulf. In total, the river flows over 5,400 km, passes through 9
provinces and autonomous regions and drains an area about the size of France. While the
Yellow River basin has long been at the center of China’s political, economic and social
development, it is also prone to drought and flood, sometimes resulting in human misery
at scales almost unheard of elsewhere in the world. The dual nature of the river in terms
of human livelihoods has resulted in the simultaneous use of the phrases “the cradle of
Chinese civilization” and “China’s sorrow” to describe the Yellow River.
Since the founding of the People’s Republic of China in 1949, major achievements have
been made in both flood control and, through irrigation development, drought mitigation
in the Yellow River basin (Chinese Engineering Academy, 2001; Qian, 2001; Wan, 2001;
Chen Zhikai, 2002). While the possibility of flooding is ever present and remains a key
issue in basin management, water scarcity and its economic and environmental
consequences have moved to the fore as major issues for basin administrators, residents
and the nation as a whole (Jin, no date; Geography Institute of China Science Academy,
1998; Chen Zhikai, 2002; Liu, 2002). Apparent declines in rainfall and runoff since the
early 1990s, only now being understood and evaluated, have further complicated the job
of allocating the Yellow River’s scarce water resources amongst competing and changing
uses.
How much water is available in the Yellow River basin and how is availability changing?
How is basin water now used and how is demand changing? What is the efficiency and
productivity of current water use? Where do ecological needs fit in? To begin answering
these questions requires an understanding of Yellow River basin water accounts.
Unfortunately, many outside scholars are unfamiliar with Chinese water accounting
systems and concepts, making the sharing of information and ideas concerning Yellow
River basin management difficult. To partially overcome this problem, the present paper
uses information from the Yellow River Water Resources Bulletins of 1998-2000
provided by the Yellow River Conservancy Commission (YRCC), the primary agency
responsible for Yellow River management, to both describe water accounting in the
Yellow River basin and the current state of water supply and use.
2 International Food Policy Research Institute (IFPRI), Washington DC
3
Basin Geography
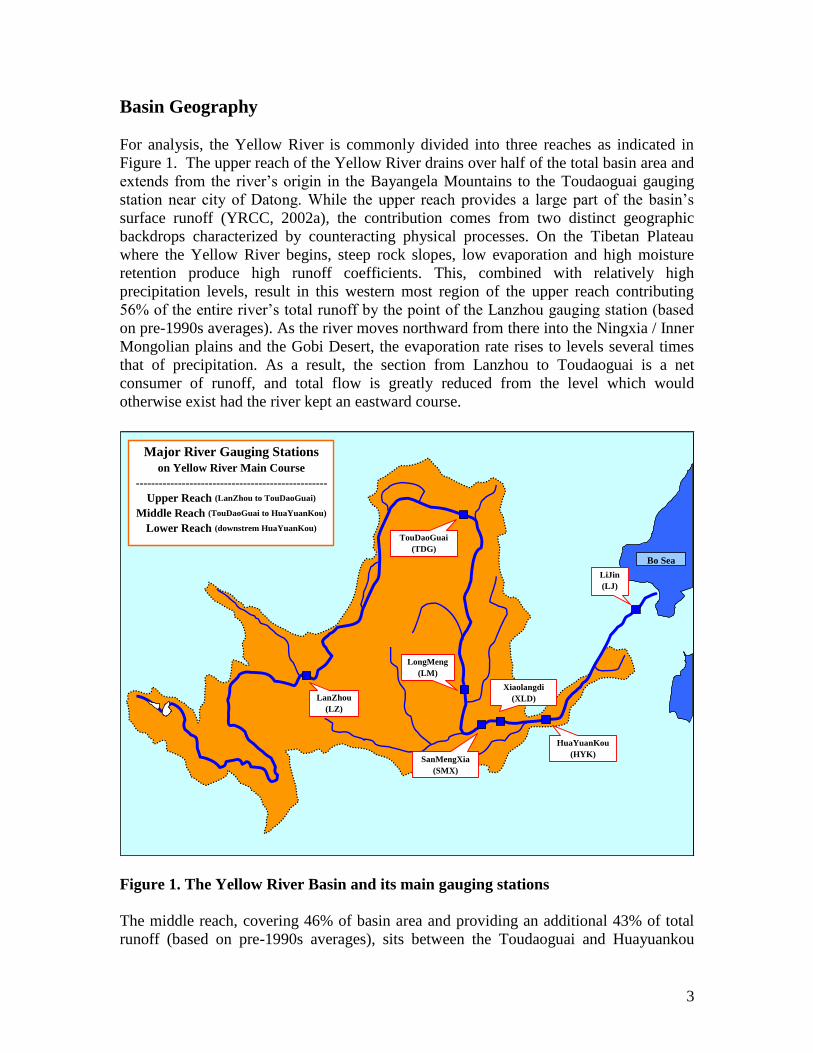
For analysis, the Yellow River is commonly divided into three reaches as indicated in
Figure 1. The upper reach of the Yellow River drains over half of the total basin area and
extends from the river’s origin in the Bayangela Mountains to the Toudaoguai gauging
station near city of Datong. While the upper reach provides a large part of the basin’s
surface runoff (YRCC, 2002a), the contribution comes from two distinct geographic
backdrops characterized by counteracting physical processes. On the Tibetan Plateau
where the Yellow River begins, steep rock slopes, low evaporation and high moisture
retention produce high runoff coefficients. This, combined with relatively high
precipitation levels, result in this western most region of the upper reach contributing
56% of the entire river’s total runoff by the point of the Lanzhou gauging station (based
on pre-1990s averages). As the river moves northward from there into the Ningxia / Inner
Mongolian plains and the Gobi Desert, the evaporation rate rises to levels several times
that of precipitation. As a result, the section from Lanzhou to Toudaoguai is a net
consumer of runoff, and total flow is greatly reduced from the level which would
otherwise exist had the river kept an eastward course.
Figure 1. The Yellow River Basin and its main gauging stations
The middle reach, covering 46% of basin area and providing an additional 43% of total
runoff (based on pre-1990s averages), sits between the Toudaoguai and Huayuankou
Bo Sea
Major River Gauging Stations
on Yellow River Main Course
--------------------------------------------------
Upper Reach (LanZhou to TouDaoGuai)
Middle Reach (TouDaoGuai to HuaYuanKou)
Lower Reach (downstrem HuaYuanKou)
LanZhou
(LZ)
LongMeng
(LM)
TouDaoGuai
(TDG)
SanMengXia
(SMX)
HuaYuanKou
(HYK)
LiJin
(LJ)
Xiaolangdi
(XLD)
4
gauging stations. From Toudaoguai, the river begins its “great bend” to the south into and
through the Loess Plateau. The middle reach of the river plays a significant role in basin
water balances and availability for human use for two reasons. First, the reach includes
some of the river’s major tributaries, such as the Fenhe and Weihe, which contribute
substantially to total flow. Second, as the river turns southward, it cuts through the Loess
Plateau and its highly erodible soils. These soils enter the main stem and its tributaries as
massive quantities of silt, providing 90% of the river’s total sediment, and resulting in
average sediment loads unprecedented amongst major waterways (MWR 2002c).
Unpredictable and intensive summer storms in the reach exacerbate the sedimentation
problem and are the major cause of Yellow River’s historically devastating floods.
The lower reach of the Yellow River commences at Huayuankou and forms one of the
most unique river segments in the world. Here the sediment transported from the middle
reach begins to settle as the river spills onto the flat North China Plain, producing a
consistently aggrading bed and a naturally meandering and unstable channel. To stabilize
the channel, millennia of successive river managers have constructed levees to hold the
river. While such structures may succeed in the short term, their success depends on
consistently raising levee walls as the sedimentation elevates the level of the channel
constrained within. Over time, the process of levee raising has created a “suspended”
river in which the channel bottom is above ground level, sometimes by as much as 10
meters. This raising of the channel above the level of the neighboring countryside has
clear implications for the severity of flooding when levees break but also alters the
meaning of the term “basin” in the Yellow River context. With the channel above ground
level, rainfall on surrounding lands cannot drain into the river nor can tributaries enter.
This essentially means that the river “basin” becomes a narrow corridor no wider than the
few kilometers breadth of the diked channel. With almost no inflow, the contribution of
the lower reach is limited to only 3% of total runoff.
Estimates of Basin Water Resources
Both China and the West have long, though differing, traditions of water management,
and it is increasingly recognized that each side has information and insights valuable for
the other. As a result, informational, scientific and policy exchanges in water
management are becoming increasingly common. However, there are hurdles to the
success of such exchanges. One such hurdle is language, a barrier which may be
overcome with translation. The second, more formidable, hurdle is definition, a problem
related to language but which requires translation as well as a deeper understanding of
perspective and background if it is to be surmounted. The problem of definition appears
immediately when comparative work is undertaken on one of most fundamental elements
in basin water management, water accounting. At present there has been little research or
reporting to clarify how water accounting differs between China and the West and how
those differences may translate into varied images of basin scale water availability and
use. The remainder of this paper attempts to partially remedy this shortfall using the
example of the Yellow River basin.
5
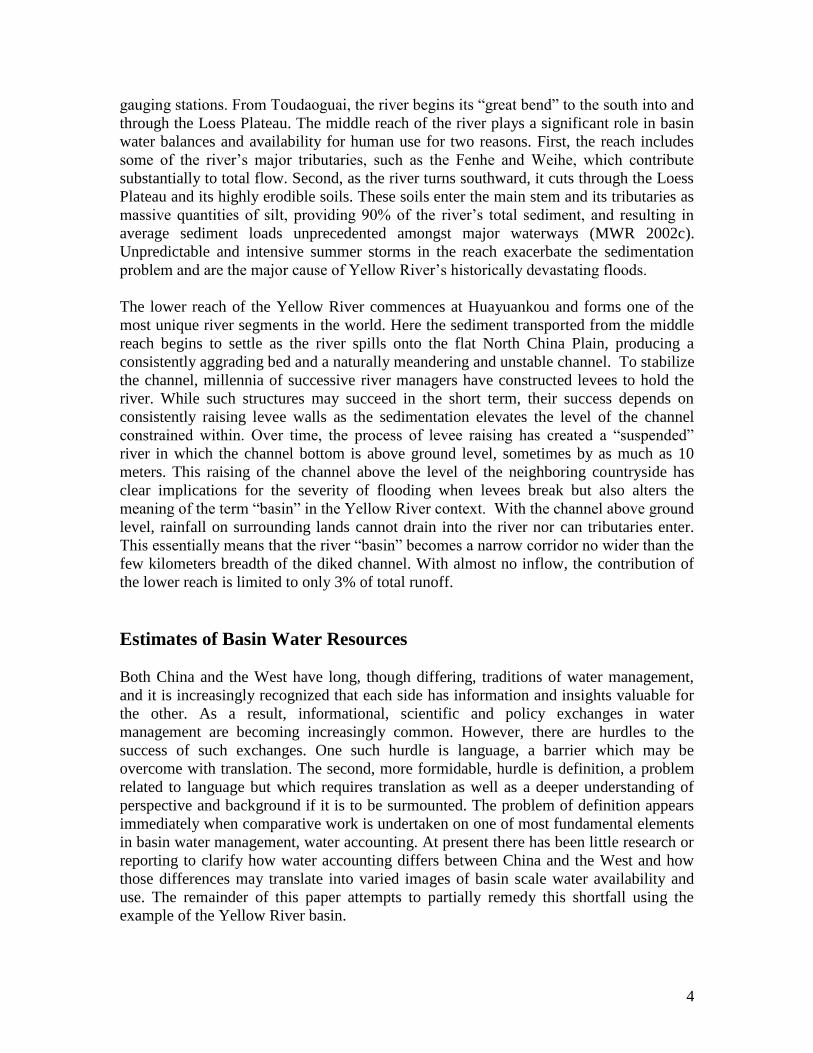
The basic water resources accounting framework used by the Yellow River Conservancy
Commission (YRCC) is shown in Table 1 (YRCC, 2002b). A similar system is used by
the Ministry of Water Resources for North China’s other two basins, the Haihe and
Huaihe, as well as the Huanghe (MWR, 2002a). The YRCC framework divides water
into its two primary components, surface and ground. Surface water is calculated as
measured flow adjusted by estimates of human depletion (depletion is discussed further
below) and change in storage. Groundwater resources are then separately calculated for
mountain and plains areas and the sum adjusted to compensate for a double counting
error which occurs in the estimation process. The total surface and groundwater estimates
are then further adjusted to account for a second, large, double counting error to arrive
finally at a total water resource calculation. It is unclear to the authors how the two
double counting adjustments are made, but it appears that assumptions and empirically
derived formulas may be the main tools. While the rationale for this system may be based
on the well-recognized difficulty in groundwater measurement, the lack of procedural
clarity is a hindrance to the utility and transferability of the figures.
Table 1. Yellow River Basin Water Resources (bcm), 2000
Gauging Station
LZ TDG LM SMX HYK
(1) Surface runoff
(a) Measured river flow 26.0 14.0 15.7 16.3 16.5
(b) Depletion 2.7 13.0 13.6 17.0 18.4
(c) Change in storage -3.3 -3.3 -3.3 -3.2 0.1
Surface runoff = (a)+(b)+(c) 25.4 23.7 26.0 30.1 35.0
(2) Groundwater
(e) Hilly area 12.6 13.1 15.3 19.7 22.6
(f) Plain area 1.6 7.6 9.5 14.6 15.4
(g)Double counting in (e) & (f) 0.7 1.3 1.8 3.8 4.1
Groundwater = (e)+(f)-(g) 13.5 19.5 23.0 30.4 33.9
(3) Double counting in (1) and (2) 12.8 17.2 18.6 22.4 24.7
(4) Total water resources = (1)+(2)-(3) 26.0 26.0 30.4 38.1 44.1
Lanzhou (LZ), Toudaoguai (TDG), Longmen (LM), Sanmenxia (SMX), Huayuankou (HYK)
Source: YRCC 2002b
To overcome similar measurement difficulties in other settings such as in Egypt (Zhu et
al, 1995) and in the State of California in the USA (Department of Water Resources,
1998), ground water abstraction has been used as a proxy for groundwater resources. The
primary danger in using abstraction is that it will overestimate groundwater resources if
extraction is in excess of recharge. The primary advantage is that it is straightforward and
avoids both the mountain/plain and surface/ground water doubling counting problems. In
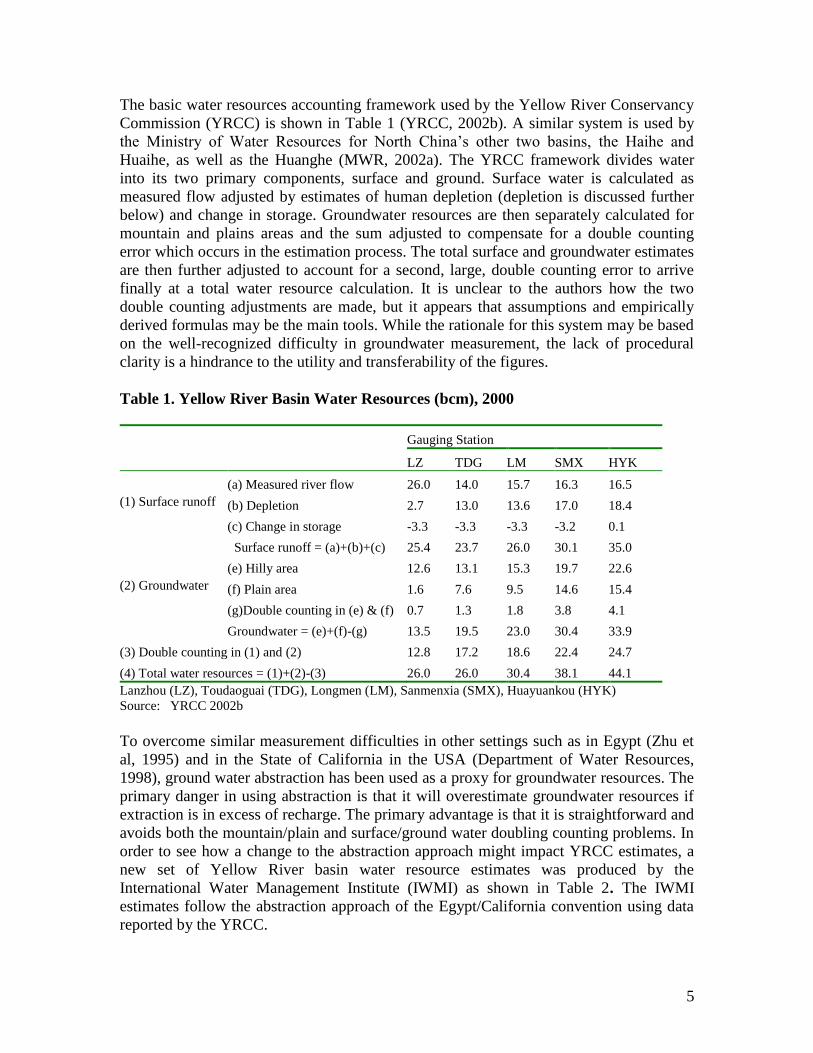
order to see how a change to the abstraction approach might impact YRCC estimates, a
new set of Yellow River basin water resource estimates was produced by the
International Water Management Institute (IWMI) as shown in Table 2. The IWMI
estimates follow the abstraction approach of the Egypt/California convention using data
reported by the YRCC.
6
Table 2. YRCC and IWMI Yellow River Basin Water Resource Estimates (bcm),
1998-2000
Gauging Station
LZ TDG LM SMX HYK
Year 1998
Surface water 28.1 28.6 33.7 39.1 44.8
Groundwater abstraction 0.4 2.8 3.3 8.7 10.2
IWMI estimate 28.5 31.5 37.0 47.9 55.0
YRCC bulletin 28.6 30.8 38.6 48.1 54.9
Difference 0% 2% -4% 0% 0%
Year 1999
Surface water 33.9 33.3 36.6 41.7 45.2
Groundwater abstraction 0.5 3.1 3.5 9.1 10.6
IWMI Estimate 34.4 36.4 40.1 50.7 55.8
YRCC Bulletin 36.8 40.5 43.0 53.9 56.3
Difference -6% -10% -7% -6% -1%
Year 2000
Surface water 25.4 23.7 26.0 30.1 35.0
Groundwater abstraction 0.5 3.2 3.6 9.2 10.7
IWMI Estimate 25.9 26.9 29.6 39.3 45.7
YRCC Bulletin 26.0 26.0 30.4 38.1 44.1
Difference 0% 3% -3% 3% 4%
Lanzhou (LZ), Toudaoguai (TDG), Longmen (LM), Sanmenxia (SMX), Huayuankou (HYK)
Interestingly, the IWMI estimates are remarkably similar to the original YRCC figures,
with no difference greater than 10% and most variation less than 4%. Assuming the data
are accurate, a negative difference between the IWMI and YRCC estimates implies a
horizontal groundwater flow into a reach from upstream and a positive difference implies
either a horizontal outflow or groundwater overdraft.
It would be of great use to international researchers if the methodology behind the current
double counting system were clarified or if estimates calculated using the abstraction
methodology were published along with those using the current system. Publishing
figures based on both methodologies would potentially have the added benefit of
providing insights into the groundwater overdraft problem, which is believed to exist on
the North China plain. However, the authors recognize that in China, as in other areas of
the world, authority for water management is not delineated solely using basin
boundaries and integrated water management concepts. It is quite possible that the
rationale for the water accounting system in the Yellow River basin is based not only on
the difficulty in measuring groundwater resources but also in part on the division of water
management authority. For example, while the Ministry of Water Resources is
responsible for surface water, groundwater is considered a mineral resource and has been
administered by the Ministry of Mining and other agencies. Thus any change in water
7
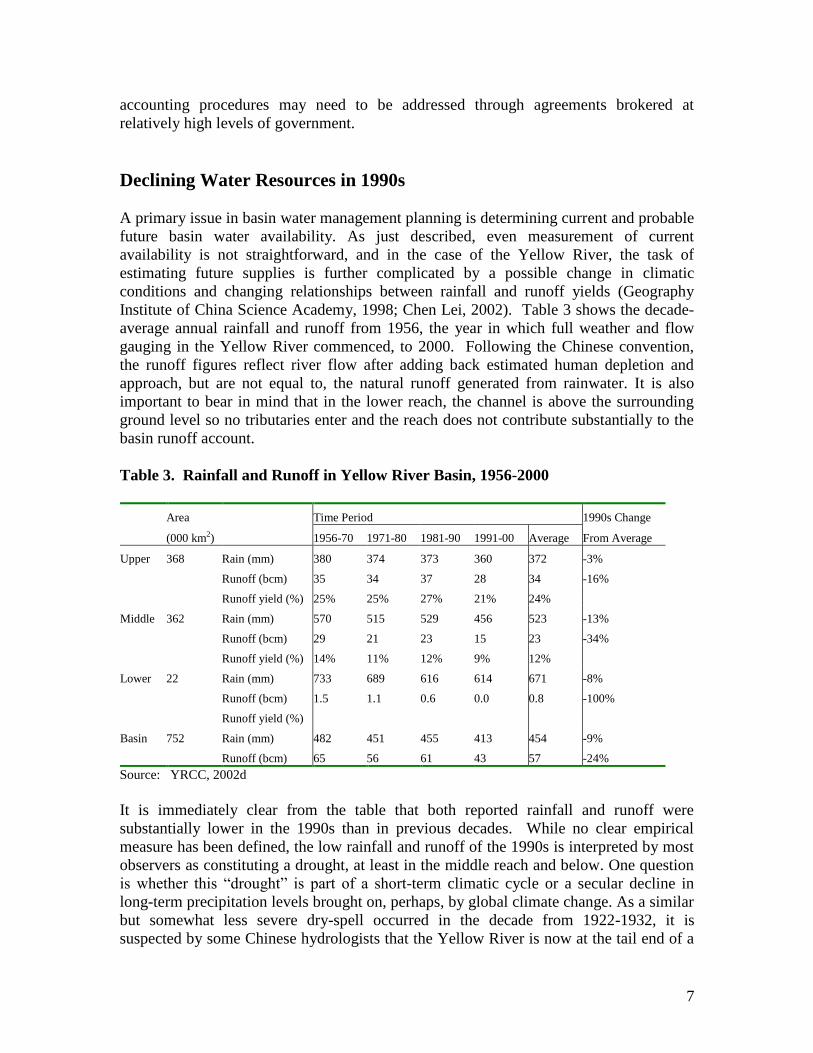
accounting procedures may need to be addressed through agreements brokered at
relatively high levels of government.
Declining Water Resources in 1990s
A primary issue in basin water management planning is determining current and probable
future basin water availability. As just described, even measurement of current
availability is not straightforward, and in the case of the Yellow River, the task of
estimating future supplies is further complicated by a possible change in climatic
conditions and changing relationships between rainfall and runoff yields (Geography
Institute of China Science Academy, 1998; Chen Lei, 2002). Table 3 shows the decade-
average annual rainfall and runoff from 1956, the year in which full weather and flow
gauging in the Yellow River commenced, to 2000. Following the Chinese convention,
the runoff figures reflect river flow after adding back estimated human depletion and
approach, but are not equal to, the natural runoff generated from rainwater. It is also
important to bear in mind that in the lower reach, the channel is above the surrounding
ground level so no tributaries enter and the reach does not contribute substantially to the
basin runoff account.
Table 3. Rainfall and Runoff in Yellow River Basin, 1956-2000
Area Time Period 1990s Change
(000 km2) 1956-70 1971-80 1981-90 1991-00 Average From Average
Upper 368 Rain (mm) 380 374 373 360 372 -3%
Runoff (bcm) 35 34 37 28 34 -16%
Runoff yield (%) 25% 25% 27% 21% 24%
Middle 362 Rain (mm) 570 515 529 456 523 -13%
Runoff (bcm) 29 21 23 15 23 -34%
Runoff yield (%) 14% 11% 12% 9% 12%
Lower 22 Rain (mm) 733 689 616 614 671 -8%
Runoff (bcm) 1.5 1.1 0.6 0.0 0.8 -100%
Runoff yield (%)
Basin 752 Rain (mm) 482 451 455 413 454 -9%
Runoff (bcm) 65 56 61 43 57 -24%
Source: YRCC, 2002d
It is immediately clear from the table that both reported rainfall and runoff were
substantially lower in the 1990s than in previous decades. While no clear empirical
measure has been defined, the low rainfall and runoff of the 1990s is interpreted by most
observers as constituting a drought, at least in the middle reach and below. One question
is whether this “drought” is part of a short-term climatic cycle or a secular decline in
long-term precipitation levels brought on, perhaps, by global climate change. As a similar
but somewhat less severe dry-spell occurred in the decade from 1922-1932, it is
suspected by some Chinese hydrologists that the Yellow River is now at the tail end of a
8
70 year cycle and that rainfall levels and river flows will therefore begin climbing in the
near future. While plausible, there is as yet insufficient evidence to confirm or refute this
hypothesis and so the potential end to the dry conditions is unclear.
Adding to the problem of declining rainfall and runoff has been an apparent change in the
rainfall/runoff ratio (Ma 1999, Chen Zhikai 2002; He 2002; Liu 2002), as shown in Table
3. The 1990s saw the runoff ratio in the upper reach decline by an average of 16% from
previous decades while in the middle reach the decline was by 34% (note that there is
essentially no rainfall or runoff in the lower reach because of the “suspended” channel).
In general, a one percent decrease in upper reach rainfall was associated with a four
percent runoff decline while in the middle reach a one percent decrease in rainfall was
associated with a two percent decline in runoff.
Some suspect the changing rainfall/runoff ratios are related to alterations in land use
patterns. While land use could clearly play a role, the fact that the change in ratios
appears to have occurred only in the 1990s though land cover change was already taking
place more than a decade earlier suggests that other forces may also be at work. One
possible alternative to the land use hypothesis may be human response to declining
rainfall coupled with the water resource accounting techniques currently in place. As
rainfall declined in the 1990s, farmers responded by increasing groundwater withdrawals
an estimated 5.1 billion cubic meters (bcm), or 61%, over the most recent 11 years
(MWR, 2002b). In some parts of the basin, groundwater supplies emanate from channel
seepage and the rate of this seepage out of the channel likely increased with increased
abstraction. In other areas, increased abstraction would reduce the quantity of
groundwater able to enter the channel and contribute to river flow. Both these factors, if
not properly accounted for, could cause a decrease in measured runoff and give an
appearance of a declining rainfall/runoff ratio when in fact rainfall and runoff dropped
proportionally. The true origin of the changing ratios needs to be carefully examined,
preferably with a longer data series than has currently been made available, since the
appropriate policy response to the apparent change depends fundamentally on cause.
Whatever the reasons, the decline in rainfall and river levels has contributed to a
desiccation of the river to the extent that that there was no flow in the lower reach’s main
channel for some 120 days each year from 1995-1998 (Chinese Engineering Academy,
2001; Geography Institute of China Science Academy, 1998; Chen Zhikai, 2002; Ma,
1999). This cut off in flow has important repercussions to basin function for three reasons.
First, it limits the availability of water for human use. Second, it negates the competence
of the river to carry its heavy sediment load to the sea, resulting in a more rapidly
aggrading and flood prone channel than would otherwise exist. Third, it has clear
consequences for the ecology of the downstream areas and, in particular, the Yellow
River delta. According to the 1998 Yellow River Bulletin, the Chinese central
government strengthened the 1987 Water Allocation Scheme to address the desiccation
issue by giving more authority to the YRCC for integrated demand management,
including in-stream environmental and ecological requirements. Since 1998, the YRCC
has managed to end absolute flow cut-off even though drought conditions continued in
1999 and 2000 (Ma 1999; Li, no date; Li 2002a). However, flow for environmental and
9
ecological use, especially for sediment flushing, is still far below that required. For
example, it has been estimated that 20 bcm of annual flow is required for sediment
transport, a level not met in any of the recent drought years.
An additional implication of the changing runoff levels is related to basin water
management. Various Chinese documents and papers continue to cite 58 bcm as average
annual runoff. However, as shown in Table 3, the average flow from 1956-2000 is
already marginally below this level and the figure from the 1990s, averaging only 43bcm
annually, is 25% lower. Even if some of this reported decline is due in part to a mis-
accounting of basin resources, it now seems apparent that traditional assumptions of
Yellow River water availability need to be reassessed. In addition, planners in the YRCC
and other agencies may wish to adopt both average and drought scenarios in their water
resources assessment and planning which account for both changes in overall water
availability and availability by reach.
Basin Water Uses
With a basic understanding of water supply accounting and current issues in supply
assessment, we turn now to an examination of water demand accounting. Unlike supply,
the water demand accounting system used in the Yellow River basin will generally be
familiar to international researchers. The two main concepts of interest in Yellow River
Conservancy Commission demand accounting are water withdrawal and water depletion.
Water withdrawal is the water diverted, pumped or otherwise taken for human use,
irrespective of whether it is returned to the system. Water depletion is defined as a use or
removal of water from a basin that renders it unavailable for further use, for example that
lost through evapotranspiration, flows directed to sinks such as evaporation ponds, or
pollution (Molden, 1997). Because not all water withdrawn from the system is depleted,
water withdrawal can be larger than total water resource availability. It should be kept in
mind when using figures at the sub-basin scale that withdrawal from one reach may
include return flow from an upstream reach. Also, the term “depletion” as used by the
YRCC refers to both beneficial and non-beneficial uses and thus cannot be used as a
traditional measure of efficiency.
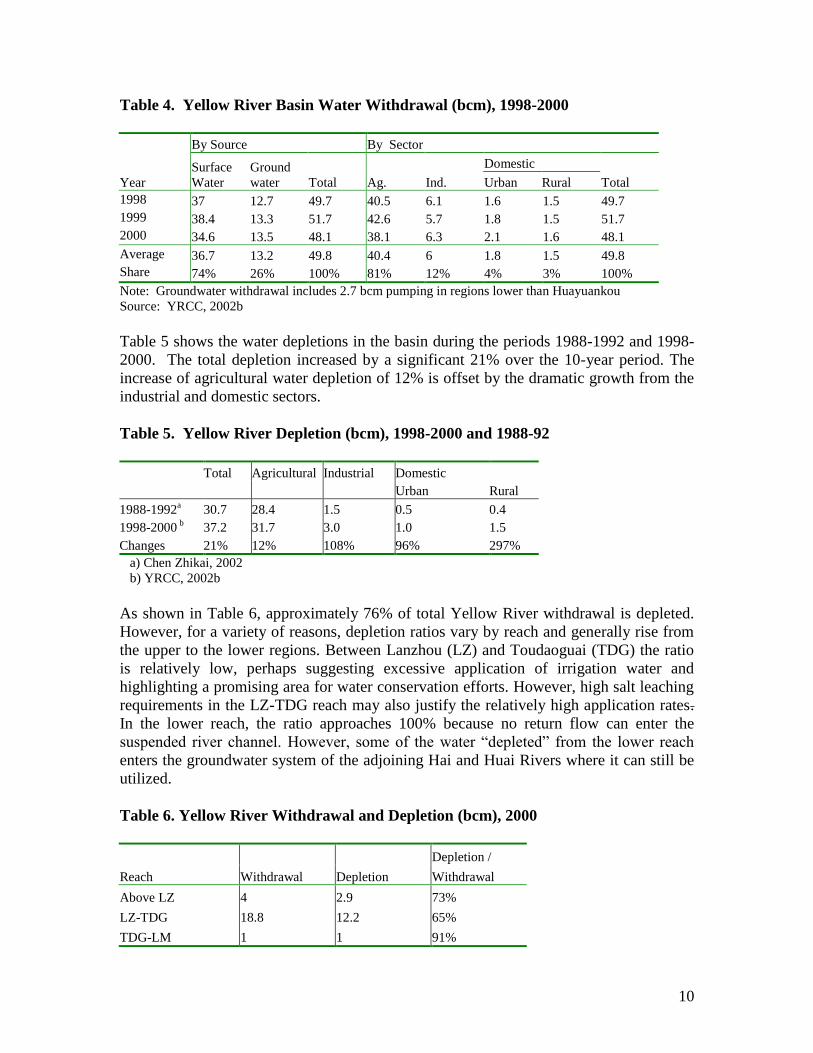
As seen in Table 4, the average annual withdrawal from the Yellow River basin in recent
years has been approximately 50 bcm, of which approximately 74% was from surface
water and 26% was from groundwater. Agriculture is by far the largest user of water,
accounting for 80% of total withdrawal, with industrial, urban and rural domestic sectors
sharing the remaining 20%. In terms of current management issues, it is interesting to
note that agricultural withdrawals decreased in 2000 by 2 bcm from 1998 levels, probably
driven by difficulty in access to surface flow due to drier conditions. In contrast,
industrial and domestic withdrawals expanded over this same time period as a result of
greater groundwater abstraction. Also of note, ecological water uses are not included in
the water demand accounts, an issue which will be discussed in further detail in later
section.
10
Table 4. Yellow River Basin Water Withdrawal (bcm), 1998-2000
Year
By Source By Sector
Surface
Water
Ground
water Total Ag. Ind.
Domestic
Total Urban Rural
1998 37 12.7 49.7 40.5 6.1 1.6 1.5 49.7
1999 38.4 13.3 51.7 42.6 5.7 1.8 1.5 51.7
2000 34.6 13.5 48.1 38.1 6.3 2.1 1.6 48.1
Average 36.7 13.2 49.8 40.4 6 1.8 1.5 49.8
Share 74% 26% 100% 81% 12% 4% 3% 100%
Note: Groundwater withdrawal includes 2.7 bcm pumping in regions lower than Huayuankou
Source: YRCC, 2002b
Table 5 shows the water depletions in the basin during the periods 1988-1992 and 1998-
2000. The total depletion increased by a significant 21% over the 10-year period. The
increase of agricultural water depletion of 12% is offset by the dramatic growth from the
industrial and domestic sectors.
Table 5. Yellow River Depletion (bcm), 1998-2000 and 1988-92
Total Agricultural Industrial Domestic
Urban Rural
1988-1992a 30.7 28.4 1.5 0.5 0.4
1998-2000 b 37.2 31.7 3.0 1.0 1.5
Changes 21% 12% 108% 96% 297%
a) Chen Zhikai, 2002
b) YRCC, 2002b
As shown in Table 6, approximately 76% of total Yellow River withdrawal is depleted.
However, for a variety of reasons, depletion ratios vary by reach and generally rise from
the upper to the lower regions. Between Lanzhou (LZ) and Toudaoguai (TDG) the ratio
is relatively low, perhaps suggesting excessive application of irrigation water and
highlighting a promising area for water conservation efforts. However, high salt leaching
requirements in the LZ-TDG reach may also justify the relatively high application rates.
In the lower reach, the ratio approaches 100% because no return flow can enter the
suspended river channel. However, some of the water “depleted” from the lower reach
enters the groundwater system of the adjoining Hai and Huai Rivers where it can still be
utilized.
Table 6. Yellow River Withdrawal and Depletion (bcm), 2000
Reach
Depletion /
Withdrawal Depletion Withdrawal
Above LZ 4 2.9 73%
LZ-TDG 18.8 12.2 65%
TDG-LM 1 1 91%
11
LM-SMX 9.3 7.3 79%
SMX-HYK 3.2 2.4 75%
HYK-LJ 10.8 9.9 92%
Below LJ 0.7 0.7 100%
Inland basins 0.2 0.2 84%
Sum/Average 48.1 36.6 76%
Lanzhou (LZ), Toudaoguai (TDG), Longmen (LM), Sanmenxia (SMX), Huayuankou (HYK)
Source: YRCC 2002b
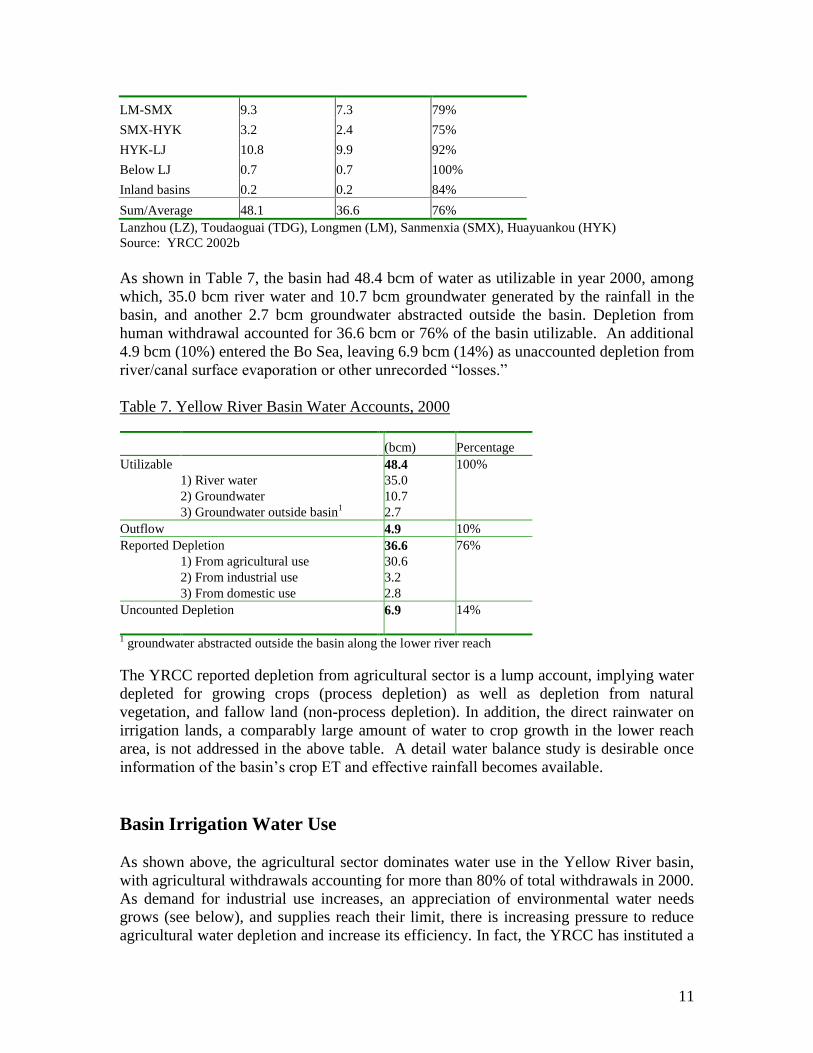
As shown in Table 7, the basin had 48.4 bcm of water as utilizable in year 2000, among
which, 35.0 bcm river water and 10.7 bcm groundwater generated by the rainfall in the
basin, and another 2.7 bcm groundwater abstracted outside the basin. Depletion from
human withdrawal accounted for 36.6 bcm or 76% of the basin utilizable. An additional
4.9 bcm (10%) entered the Bo Sea, leaving 6.9 bcm (14%) as unaccounted depletion from
river/canal surface evaporation or other unrecorded “losses.”
Table 7. Yellow River Basin Water Accounts, 2000
(bcm) Percentage
Utilizable 48.4 100%
1) River water 35.0
2) Groundwater 10.7
3) Groundwater outside basin1 2.7
Outflow 4.9 10%
Reported Depletion 36.6 76%
1) From agricultural use 30.6
2) From industrial use 3.2
3) From domestic use 2.8
Uncounted Depletion 6.9 14%
1 groundwater abstracted outside the basin along the lower river reach
The YRCC reported depletion from agricultural sector is a lump account, implying water
depleted for growing crops (process depletion) as well as depletion from natural
vegetation, and fallow land (non-process depletion). In addition, the direct rainwater on
irrigation lands, a comparably large amount of water to crop growth in the lower reach
area, is not addressed in the above table. A detail water balance study is desirable once
information of the basin’s crop ET and effective rainfall becomes available.
Basin Irrigation Water Use
As shown above, the agricultural sector dominates water use in the Yellow River basin,
with agricultural withdrawals accounting for more than 80% of total withdrawals in 2000.
As demand for industrial use increases, an appreciation of environmental water needs
grows (see below), and supplies reach their limit, there is increasing pressure to reduce
agricultural water depletion and increase its efficiency. In fact, the YRCC has instituted a
12
plan to reduce basin agricultural water consumption 10% by 2010. With this in mind, we
now turn to examination of agricultural water use in the basin.
The value of irrigation in Yellow River basin agriculture has long been recognized as
evidenced by the number of pre-modern irrigation systems, some of which are thousands
of years old. However, expansion of irrigated area has been especially rapid since the
founding of the People’s Republic, rising from 0.8 million hectares in year 1950 to 7.5
million hectares in 2000 (Li, no date). Table 8 shows the distribution of irrigated area by
reach. The basin has 46% of its arable lands irrigated, and more than half of them are
located within four large irrigation districts (Ningxia, Fenwei, Hanan, and Shandong).
Table 8. Cultivated and Irrigated Lands in Yellow River Basin
Reach Name
Arable
Lands Irrigation lands
Large -scale Small-scale Sum Irrigation
(mh) Name (mh) (mh) (mh) %
Upper LZ 1.01 0.31 0.31 30%
LZ-LM 2.42 NM 0.71 0.83 1.55 64%
TDG-LM 1.58 0.19 0.19 12%
LM-SMX 5.42 0.44 1.23 1.67 31%
SMX-HYK 0.86 FW & HN 0.31 0.23 0.54 63%
Down HYK 4.79 HN & SD 3.13 3.13 65%
Sum 16.09 4.59 2.80 7.38 46%
Lanzhou (LZ), Toudaoguai (TDG), Longmen (LM), Huayuankou (HYK), Sanmenxia (SMX),
Lijin (LJ), Ning Meng (NM), Feng Wei (FW), He Nan (HN), Shan Dong (SD)
Source: YRCC 2002d
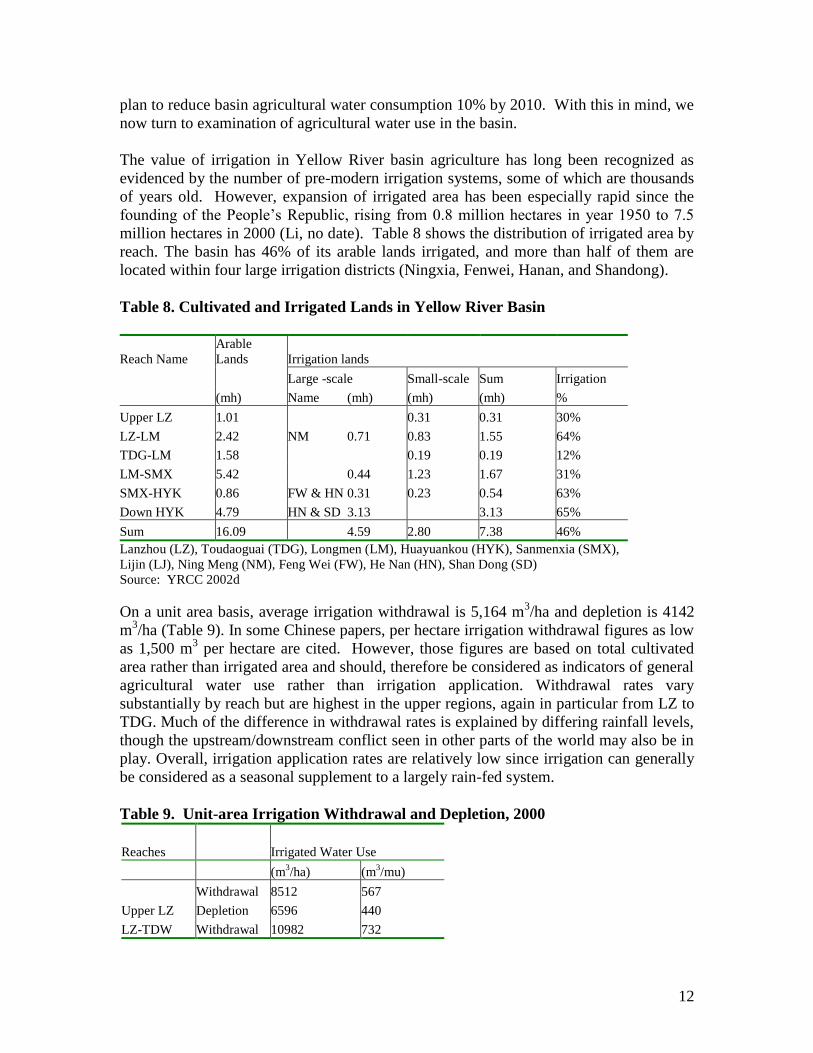
On a unit area basis, average irrigation withdrawal is 5,164 m3/ha and depletion is 4142
m3/ha (Table 9). In some Chinese papers, per hectare irrigation withdrawal figures as low
as 1,500 m3 per hectare are cited. However, those figures are based on total cultivated
area rather than irrigated area and should, therefore be considered as indicators of general
agricultural water use rather than irrigation application. Withdrawal rates vary
substantially by reach but are highest in the upper regions, again in particular from LZ to
TDG. Much of the difference in withdrawal rates is explained by differing rainfall levels,
though the upstream/downstream conflict seen in other parts of the world may also be in
play. Overall, irrigation application rates are relatively low since irrigation can generally
be considered as a seasonal supplement to a largely rain-fed system.
Table 9. Unit-area Irrigation Withdrawal and Depletion, 2000
Reaches Irrigated Water Use
(m3/ha) (m
3/mu)
Upper LZ
Withdrawal 8512 567
Depletion 6596 440
LZ-TDW Withdrawal 10982 732
13
Depletion 7447 496
TDW-LM
Withdrawal 3972 265
Depletion 3799 253
LM-SMX
Withdrawal 3575 238
Depletion 3142 209
SMX-HYK
Withdrawal 3637 242
Depletion 3178 212
Withdrawal 3084 206
Down HYK Depletion 2936 196
Withdrawal 5164 344
Basin Depletion 4142 276
Lanzhou (LZ), Toudaoguai (TDG), Longmen (LM), Sanmenxia (SMX), Huayuankou (HYK)
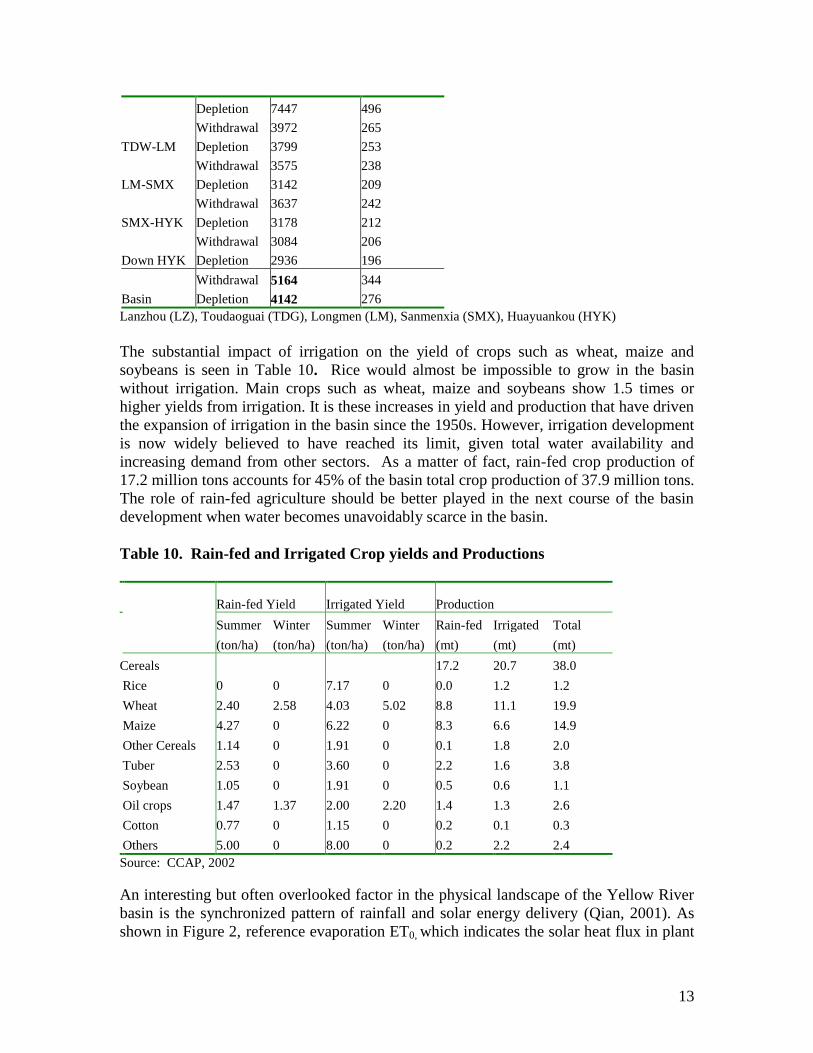
The substantial impact of irrigation on the yield of crops such as wheat, maize and
soybeans is seen in Table 10. Rice would almost be impossible to grow in the basin
without irrigation. Main crops such as wheat, maize and soybeans show 1.5 times or
higher yields from irrigation. It is these increases in yield and production that have driven
the expansion of irrigation in the basin since the 1950s. However, irrigation development
is now widely believed to have reached its limit, given total water availability and
increasing demand from other sectors. As a matter of fact, rain-fed crop production of
17.2 million tons accounts for 45% of the basin total crop production of 37.9 million tons.
The role of rain-fed agriculture should be better played in the next course of the basin
development when water becomes unavoidably scarce in the basin.
Table 10. Rain-fed and Irrigated Crop yields and Productions
Rain-fed Yield Irrigated Yield Production
Summer Winter Summer Winter Rain-fed Irrigated Total
(ton/ha) (ton/ha) (ton/ha) (ton/ha) (mt) (mt) (mt)
Cereals 17.2 20.7 38.0
Rice 0 0 7.17 0 0.0 1.2 1.2
Wheat 2.40 2.58 4.03 5.02 8.8 11.1 19.9
Maize 4.27 0 6.22 0 8.3 6.6 14.9
Other Cereals 1.14 0 1.91 0 0.1 1.8 2.0
Tuber 2.53 0 3.60 0 2.2 1.6 3.8
Soybean 1.05 0 1.91 0 0.5 0.6 1.1
Oil crops 1.47 1.37 2.00 2.20 1.4 1.3 2.6
Cotton 0.77 0 1.15 0 0.2 0.1 0.3
Others 5.00 0 8.00 0 0.2 2.2 2.4
Source: CCAP, 2002
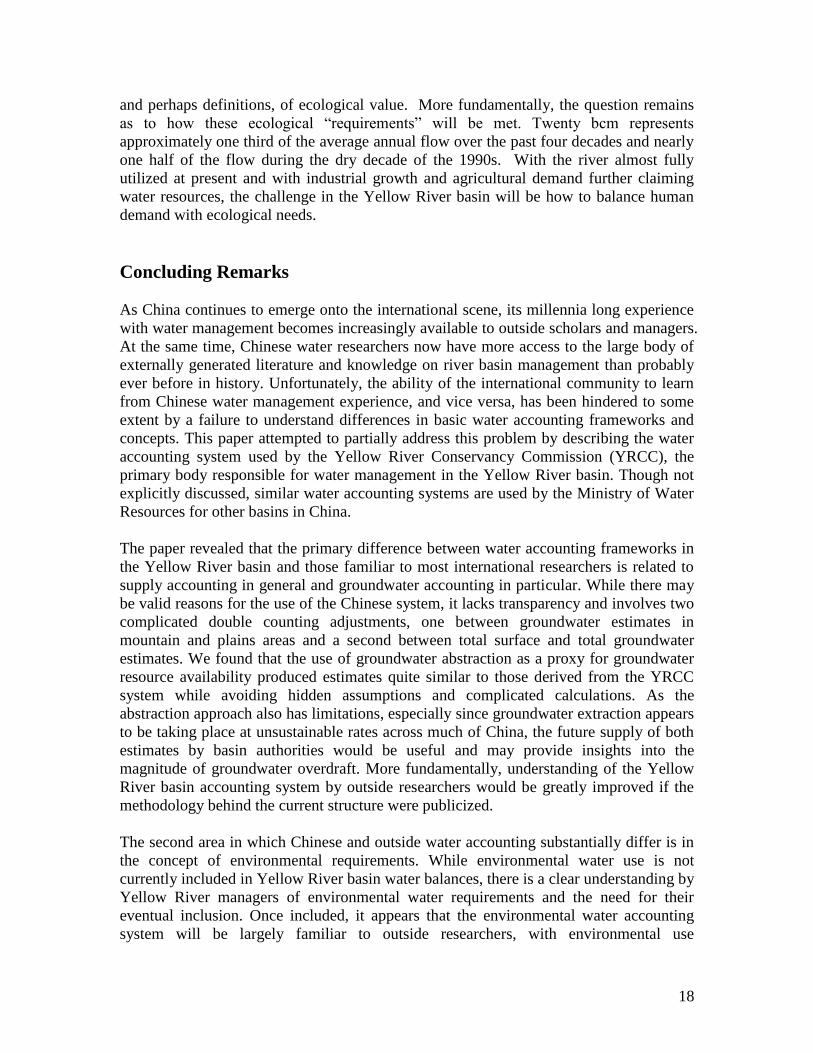
An interesting but often overlooked factor in the physical landscape of the Yellow River
basin is the synchronized pattern of rainfall and solar energy delivery (Qian, 2001). As
shown in Figure 2, reference evaporation ET0, which indicates the solar heat flux in plant
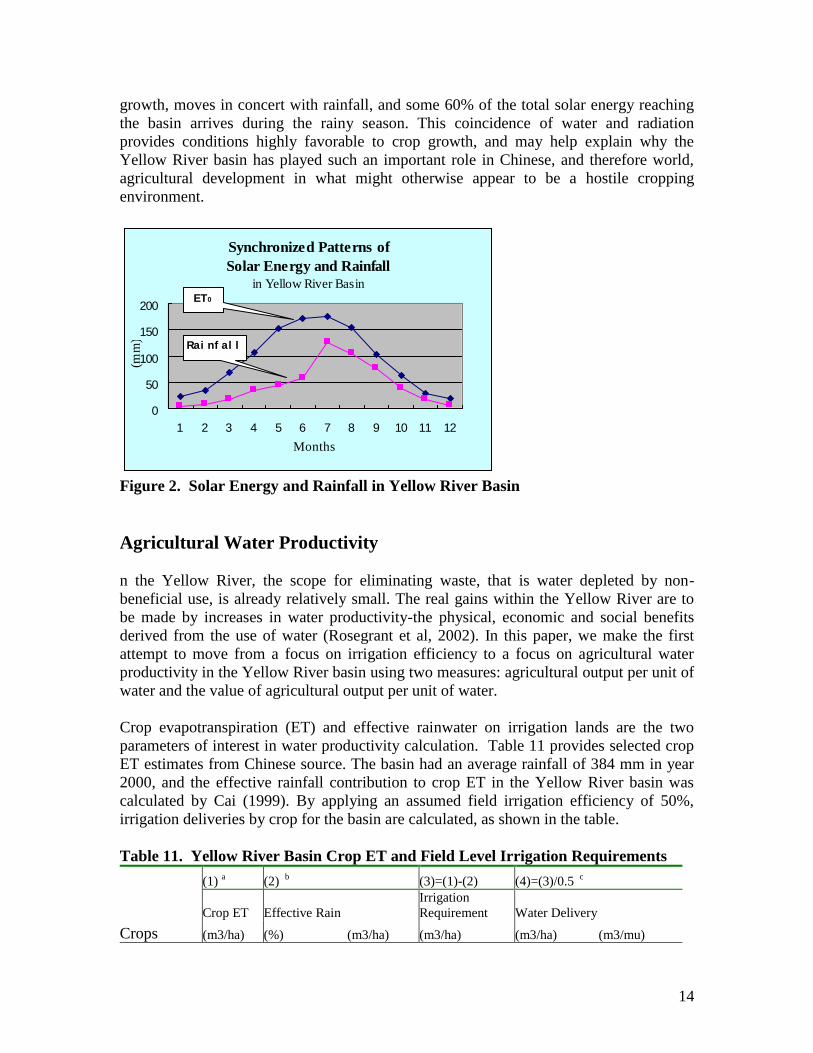
14
growth, moves in concert with rainfall, and some 60% of the total solar energy reaching
the basin arrives during the rainy season. This coincidence of water and radiation
provides conditions highly favorable to crop growth, and may help explain why the
Yellow River basin has played such an important role in Chinese, and therefore world,
agricultural development in what might otherwise appear to be a hostile cropping
environment.
Synchronized Patterns of
Solar Energy and Rainfall
in Yellow River Basin
0
50
100
150
200
1 2 3 4 5 6 7 8 9 10 11 12
Months
(mm
)
Rai nf al l
ET0
Figure 2. Solar Energy and Rainfall in Yellow River Basin
Agricultural Water Productivity
n the Yellow River, the scope for eliminating waste, that is water depleted by non-
beneficial use, is already relatively small. The real gains within the Yellow River are to
be made by increases in water productivity-the physical, economic and social benefits
derived from the use of water (Rosegrant et al, 2002). In this paper, we make the first
attempt to move from a focus on irrigation efficiency to a focus on agricultural water
productivity in the Yellow River basin using two measures: agricultural output per unit of
water and the value of agricultural output per unit of water.
Crop evapotranspiration (ET) and effective rainwater on irrigation lands are the two
parameters of interest in water productivity calculation. Table 11 provides selected crop
ET estimates from Chinese source. The basin had an average rainfall of 384 mm in year
2000, and the effective rainfall contribution to crop ET in the Yellow River basin was
calculated by Cai (1999). By applying an assumed field irrigation efficiency of 50%,
irrigation deliveries by crop for the basin are calculated, as shown in the table.
Table 11. Yellow River Basin Crop ET and Field Level Irrigation Requirements
Crops
(1) a (2)
b (3)=(1)-(2) (4)=(3)/0.5
c
Crop ET Effective Rain
Irrigation
Requirement Water Delivery
(m3/ha) (%) (m3/ha) (m3/ha) (m3/ha) (m3/mu)
15
Rice 9000 50 1920 7080 14160 944
Wheat 4950 20 768 4182 8364 558
Maize 3750 40 1536 2214 4428 295
Soybean 3750 40 1536 2214 4428 295
Cotton 5250 40 1536 3714 7428 495
a. “Chinese Rural Economic Statistics 1949-1996,” Chinese Agricultural Publisher, 1997
b. Cai, 1999. The basin average rainfall in year 2000 was 384 mm
c. A gross irrigation delivery efficiency of 50% is assumed
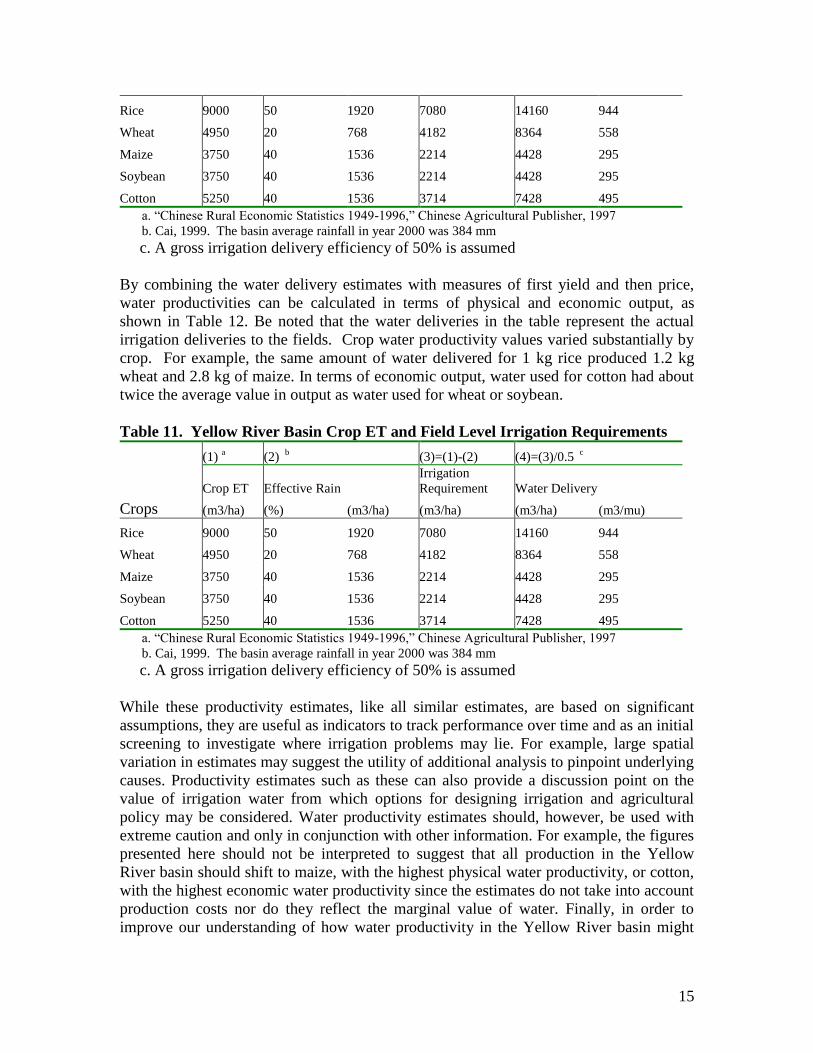
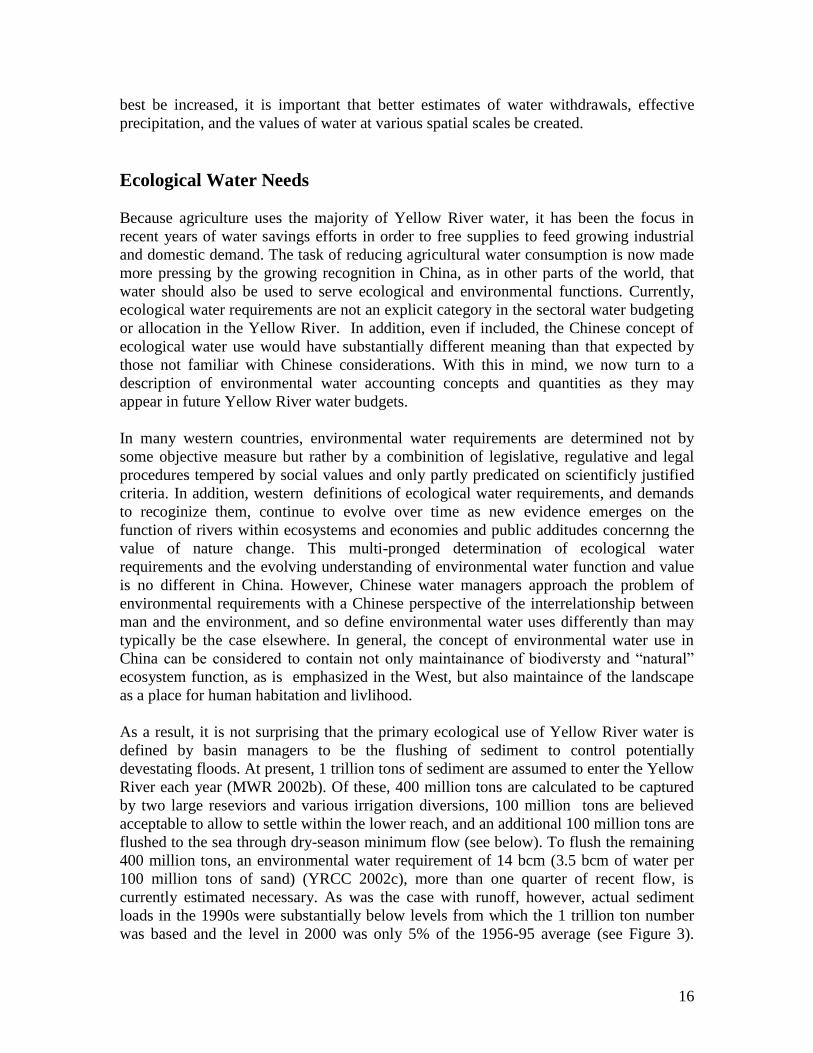
By combining the water delivery estimates with measures of first yield and then price,
water productivities can be calculated in terms of physical and economic output, as
shown in Table 12. Be noted that the water deliveries in the table represent the actual
irrigation deliveries to the fields. Crop water productivity values varied substantially by
crop. For example, the same amount of water delivered for 1 kg rice produced 1.2 kg
wheat and 2.8 kg of maize. In terms of economic output, water used for cotton had about
twice the average value in output as water used for wheat or soybean.
Table 11. Yellow River Basin Crop ET and Field Level Irrigation Requirements
Crops
(1) a (2)
b (3)=(1)-(2) (4)=(3)/0.5
c
Crop ET Effective Rain
Irrigation
Requirement Water Delivery
(m3/ha) (%) (m3/ha) (m3/ha) (m3/ha) (m3/mu)
Rice 9000 50 1920 7080 14160 944
Wheat 4950 20 768 4182 8364 558
Maize 3750 40 1536 2214 4428 295
Soybean 3750 40 1536 2214 4428 295
Cotton 5250 40 1536 3714 7428 495
a. “Chinese Rural Economic Statistics 1949-1996,” Chinese Agricultural Publisher, 1997
b. Cai, 1999. The basin average rainfall in year 2000 was 384 mm
c. A gross irrigation delivery efficiency of 50% is assumed
While these productivity estimates, like all similar estimates, are based on significant
assumptions, they are useful as indicators to track performance over time and as an initial
screening to investigate where irrigation problems may lie. For example, large spatial
variation in estimates may suggest the utility of additional analysis to pinpoint underlying
causes. Productivity estimates such as these can also provide a discussion point on the
value of irrigation water from which options for designing irrigation and agricultural
policy may be considered. Water productivity estimates should, however, be used with
extreme caution and only in conjunction with other information. For example, the figures
presented here should not be interpreted to suggest that all production in the Yellow
River basin should shift to maize, with the highest physical water productivity, or cotton,
with the highest economic water productivity since the estimates do not take into account
production costs nor do they reflect the marginal value of water. Finally, in order to
improve our understanding of how water productivity in the Yellow River basin might
16
best be increased, it is important that better estimates of water withdrawals, effective
precipitation, and the values of water at various spatial scales be created.
Ecological Water Needs
Because agriculture uses the majority of Yellow River water, it has been the focus in
recent years of water savings efforts in order to free supplies to feed growing industrial
and domestic demand. The task of reducing agricultural water consumption is now made
more pressing by the growing recognition in China, as in other parts of the world, that
water should also be used to serve ecological and environmental functions. Currently,
ecological water requirements are not an explicit category in the sectoral water budgeting
or allocation in the Yellow River. In addition, even if included, the Chinese concept of
ecological water use would have substantially different meaning than that expected by
those not familiar with Chinese considerations. With this in mind, we now turn to a
description of environmental water accounting concepts and quantities as they may
appear in future Yellow River water budgets.
In many western countries, environmental water requirements are determined not by
some objective measure but rather by a combinition of legislative, regulative and legal
procedures tempered by social values and only partly predicated on scientificly justified
criteria. In addition, western definitions of ecological water requirements, and demands
to recoginize them, continue to evolve over time as new evidence emerges on the
function of rivers within ecosystems and economies and public additudes concernng the
value of nature change. This multi-pronged determination of ecological water
requirements and the evolving understanding of environmental water function and value
is no different in China. However, Chinese water managers approach the problem of
environmental requirements with a Chinese perspective of the interrelationship between
man and the environment, and so define environmental water uses differently than may
typically be the case elsewhere. In general, the concept of environmental water use in
China can be considered to contain not only maintainance of biodiversty and “natural”
ecosystem function, as is emphasized in the West, but also maintaince of the landscape
as a place for human habitation and livlihood.
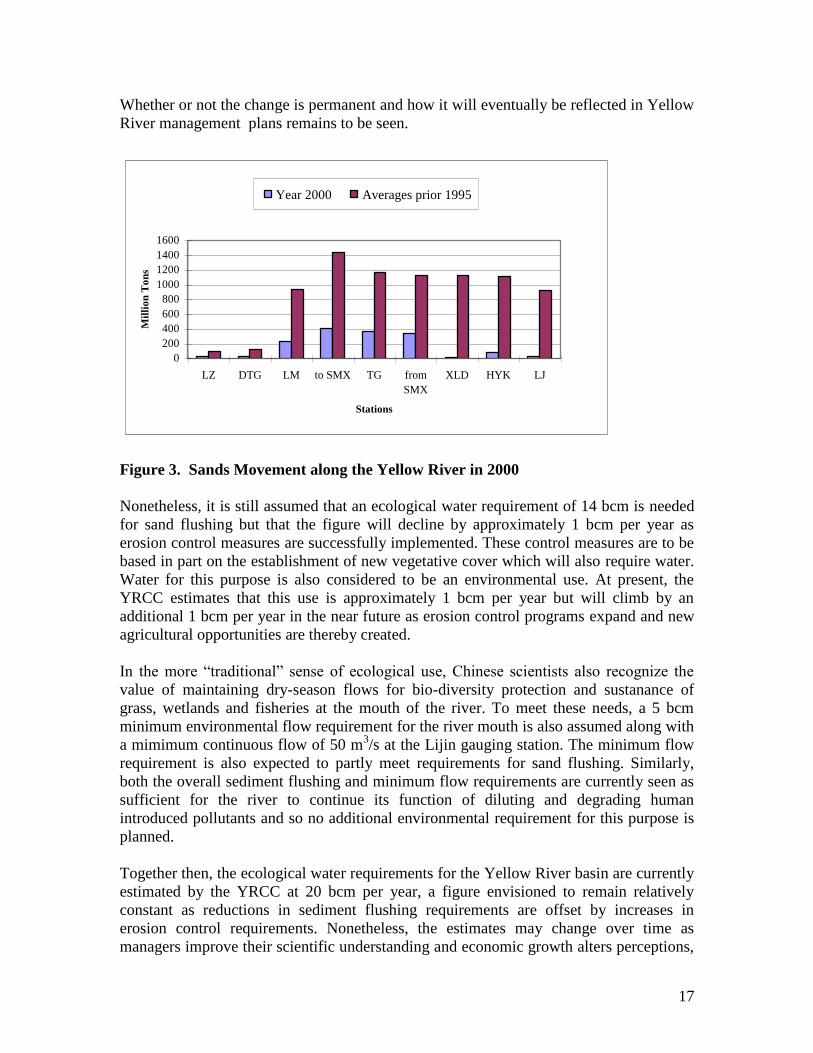
As a result, it is not surprising that the primary ecological use of Yellow River water is
defined by basin managers to be the flushing of sediment to control potentially
devestating floods. At present, 1 trillion tons of sediment are assumed to enter the Yellow
River each year (MWR 2002b). Of these, 400 million tons are calculated to be captured
by two large reseviors and various irrigation diversions, 100 million tons are believed
acceptable to allow to settle within the lower reach, and an additional 100 million tons are
flushed to the sea through dry-season minimum flow (see below). To flush the remaining
400 million tons, an environmental water requirement of 14 bcm (3.5 bcm of water per
100 million tons of sand) (YRCC 2002c), more than one quarter of recent flow, is
currently estimated necessary. As was the case with runoff, however, actual sediment
loads in the 1990s were substantially below levels from which the 1 trillion ton number
was based and the level in 2000 was only 5% of the 1956-95 average (see Figure 3).
17
Whether or not the change is permanent and how it will eventually be reflected in Yellow
River management plans remains to be seen.
Figure 3. Sands Movement along the Yellow River in 2000
Nonetheless, it is still assumed that an ecological water requirement of 14 bcm is needed
for sand flushing but that the figure will decline by approximately 1 bcm per year as
erosion control measures are successfully implemented. These control measures are to be
based in part on the establishment of new vegetative cover which will also require water.
Water for this purpose is also considered to be an environmental use. At present, the
YRCC estimates that this use is approximately 1 bcm per year but will climb by an
additional 1 bcm per year in the near future as erosion control programs expand and new
agricultural opportunities are thereby created.
In the more “traditional” sense of ecological use, Chinese scientists also recognize the
value of maintaining dry-season flows for bio-diversity protection and sustanance of
grass, wetlands and fisheries at the mouth of the river. To meet these needs, a 5 bcm
minimum environmental flow requirement for the river mouth is also assumed along with
a mimimum continuous flow of 50 m3/s at the Lijin gauging station. The minimum flow
requirement is also expected to partly meet requirements for sand flushing. Similarly,
both the overall sediment flushing and minimum flow requirements are currently seen as
sufficient for the river to continue its function of diluting and degrading human
introduced pollutants and so no additional environmental requirement for this purpose is
planned.
Together then, the ecological water requirements for the Yellow River basin are currently
estimated by the YRCC at 20 bcm per year, a figure envisioned to remain relatively
constant as reductions in sediment flushing requirements are offset by increases in
erosion control requirements. Nonetheless, the estimates may change over time as
managers improve their scientific understanding and economic growth alters perceptions,
0
200
400
600
800
1000
1200
1400
1600
LZ DTG LM to SMX TG from
SMX
XLD HYK LJ
Stations
Mil
lio
n T
on
s
Year 2000 Averages prior 1995
18
and perhaps definitions, of ecological value. More fundamentally, the question remains
as to how these ecological “requirements” will be met. Twenty bcm represents
approximately one third of the average annual flow over the past four decades and nearly
one half of the flow during the dry decade of the 1990s. With the river almost fully
utilized at present and with industrial growth and agricultural demand further claiming
water resources, the challenge in the Yellow River basin will be how to balance human
demand with ecological needs.
Concluding Remarks
As China continues to emerge onto the international scene, its millennia long experience
with water management becomes increasingly available to outside scholars and managers.
At the same time, Chinese water researchers now have more access to the large body of
externally generated literature and knowledge on river basin management than probably
ever before in history. Unfortunately, the ability of the international community to learn
from Chinese water management experience, and vice versa, has been hindered to some
extent by a failure to understand differences in basic water accounting frameworks and
concepts. This paper attempted to partially address this problem by describing the water
accounting system used by the Yellow River Conservancy Commission (YRCC), the
primary body responsible for water management in the Yellow River basin. Though not
explicitly discussed, similar water accounting systems are used by the Ministry of Water
Resources for other basins in China.
The paper revealed that the primary difference between water accounting frameworks in
the Yellow River basin and those familiar to most international researchers is related to
supply accounting in general and groundwater accounting in particular. While there may
be valid reasons for the use of the Chinese system, it lacks transparency and involves two
complicated double counting adjustments, one between groundwater estimates in
mountain and plains areas and a second between total surface and total groundwater
estimates. We found that the use of groundwater abstraction as a proxy for groundwater
resource availability produced estimates quite similar to those derived from the YRCC
system while avoiding hidden assumptions and complicated calculations. As the
abstraction approach also has limitations, especially since groundwater extraction appears
to be taking place at unsustainable rates across much of China, the future supply of both
estimates by basin authorities would be useful and may provide insights into the
magnitude of groundwater overdraft. More fundamentally, understanding of the Yellow
River basin accounting system by outside researchers would be greatly improved if the
methodology behind the current structure were publicized.
The second area in which Chinese and outside water accounting substantially differ is in
the concept of environmental requirements. While environmental water use is not
currently included in Yellow River basin water balances, there is a clear understanding by
Yellow River managers of environmental water requirements and the need for their
eventual inclusion. Once included, it appears that the environmental water accounting
system will be largely familiar to outside researchers, with environmental use
19
simply becoming another category of demand. However, it is critical to understand that
Chinese concepts of what should be included under the rubric of environment water use
may not conform to outside, especially Western, ideas. For example, the primary
environmental use of water in the Yellow River is considered to be sediment flushing to
reduce the human costs of flooding. The fact that conceptual differences in the definition
of environmental water use exist should not be taken to mean that one approach is
necessary better than the other. Rather it should be taken to highlight the need to fully
understand concepts and perspectives when undertaking comparative work.
In addition to providing insights on Chinese water accounting systems, an examination of
Yellow River water balance data also provided a number of insights into current and
probable future management issues. For example, it is clear that the 1990s saw a
substantial reduction in the volume of Yellow River water resources. The reduction was
caused in part by a decline in rainfall in much of the basin but also by an apparent
decrease in the runoff levels generated by that rainfall. Some have suggested that the
current drop in rainfall is part of a recurring 70-year cycle and is near its end. Even if true,
data suggest that river flow may not return to the levels seen before the 1990s, because
rainfall/runoff ratios have also declined. The extent to which the change in measured
rainfall/runoff ratios is a result of actual change rather than an artifact of measurement
procedures needs to be carefully explored, since it has serious implications for policy
response.
Even without the decrease in rainfall and runoff, growing industrial and domestic demand
is increasingly going to require difficult trade-offs in terms of Yellow River water
allocation. This will only further increase pressure to reduce use in the basin’s main
consuming sector, agriculture. There is already substantial work on technical and
institutional mechanisms for reducing agricultural water consumption in the Yellow
River basin. In this paper we attempted to supplement that work by presenting the first
basin-wide estimates of Yellow River agricultural water productivity. The findings
indicated that average productivity in terms of output volume was highest for maize and
in terms of economic value was highest for cotton. While decision making should be
based on marginal, rather than average, productivity, such numbers do provide some
guidelines for water policy, especially in the context of China where government decision
making still plays a major role in agricultural life.
The pressure to decrease water use in the agricultural sector is also going to be
substantially increased by the growing recognition of environmental water requirements.
Basin managers currently calculate a need of around 20 billion cubic meters per year for
environmental purposes. This figure is about one third of historic flow and nearly one
half the level experienced in the dry decade of the 1990s. How such a substantial need
will be met, and how the balance between environmental and human use will be found, is
going to be one of the major policy challenges for Yellow River managers as it is for
water managers around the world. Clearly, however, this confluence of problems between
Chinese and outside managers and researchers also provides opportunities for
cooperation and exchange, opportunities which will best be utilized if each side has a
thorough understanding of the other’s water management systems and perspectives.
20
Acknowledgements
The authors would like to thank the Yellow River Conservancy Commission and the
Chinese Center for Agricultural Policy for their assistance with data and for providing
useful dialogues on water resources issues in the Yellow River Basin.
IWMI receives its principal funding from 58 governments, private foundations, and
international and regional organizations known as the Consultative Group on
International Agricultural Research (CGIAR). Support is also given by the governments
of Ghana, Pakistan, South Africa, Sri Lanka and Thailand. This research was supported
in part through the Government of Netherlands support to the Comprehensive
Assessment of Water Management in Agriculture.
21
Literature Cited
Cai, X., 1999, “ Irrigated and Rain-fed Areas and Yields in River Basins of China, India,
and the U.S.,” working paper, International Food Policy Research Institute (IFPRI),
Washington DC.
CCAP (Chinese Center for Agricultural Policy), 2002, information made available during
meetings between the Chinese Center for Agricultural Policy and the International Water
Management Institute, September, 2002.
Chen Lei, 2002, “A Talk at the World Bank sponsored Forum on China Water Resources
Development, Jun 5. 2002, YRCC website. http://www.yrcc.gov.cn/. March, 2002. (In
Chinese)
Chen Zhikai, 2002, “Impact of the Successive Drought on the North China Plain
Ecological Environment,” working paper at the China Institute of Water and Hydropower
Research (CIWHR), 2002.
Chinese Engineering Academy, 2001, “China’s 21st Century Sustainable Development
Strategy on Water Resources – Comprehensive Report,” Research Group for China’s 21
Century Sustainable Development Strategy on Water Resources, December 10, 2001,
MWR website. http://www.mwr.gov.cn/. March 13, 2002. (In Chinese)
Department of Water Resources, State of California, 1998, “California Water Plan
Update Bulletin” 160-98.
Geography Institute of China Science Academy, 1998, “The Drying-out Yellow River
and Combating Strategies,” China Science, Oct 28, 1998, YRCC website.
http://www.yrcc.gov.cn/. March, 2002. (In Chinese)
He Weicheng,. 2001, “The Trends and Analysis of the Yellow River Water Resources,”
Water Forum, Sep 4, 2001, YRCC website http://www.yrcc.gov.cn/. March, 2002. (In
Chinese)
Jin Zhengsu, No date, “Thoughts on China’s Water Resources Sustainable
Development,” Deputy Water Minister, YRCC website. http://www.yrcc.gov.cn/. March,
2002. (In Chinese)
Li Guoying, 2002a, “Seek Truth and Open Mind: To Modernize the Yellow River
Development and Management,” Jan 5. 2002, YRCC website. http://www.yrcc.gov.cn/.
March, 2002. (In Chinese)
Li Guoying, No date, “Thoughts and Considerations on Long-term Yellow River
Development and Management,” YRCC website. http://www.yrcc.gov.cn/. March, 2002.
(In Chinese)
22
Liu Xiaoyan, 2002, “The Main Issues of the Yellow River Basin,” presentations at the
CGIAR Challenge Program in Sri Lanak and Malaysia, July and Oct 2002.
Ma Jun, 1999, “The Chinese Water Crisis,” The Chinese Environmental Science
Publisher.
Molden, D, 1997, “Accounting for Water Use and Productivity,” SWIM Paper 1.
Colombo, Sri Lanka, International Water Management Institute.
MWR (Ministry of Water Resources), 2002a, “1997, 1998, 1999, 2000 China Water
Resources Bulletins,” MWR website. http://www.mwr.gov.cn/. March, 2002. (In Chinese)
MWR (Ministry of Water Resources), 2002b, “2000 North China Groundwater
Resources Bulletin,” MWR website. http://www.mwr.gov.cn/. March, 2002. (In Chinese)
MWR (Ministry of Water Resources), 2002c, “China River Sediments Bulletin, Year
2000” MWR website. http://www.mwr.gov.cn/. March, 2002. (In Chinese)
Qian Zhengying, 2001, “Notable Issues in the Strategic Research of China’s Water
Resources,” The Journal of River and Sea University, Sep 5, 2001, YRCC website.
http://www.yrcc.gov.cn/. March, 2002. (In Chinese)
Rosegrant M.W., X. Cai, and S. Cline, 2002, “World Water and Food to 2025: Dealing
with Scarcity,” The International Food Policy Research Institute, Washington DC.
Wan Sucheng, 2001, “Water Environment: It’s Capacity and Management,” A Minister’s
Talk at the 70th
Anniversary of Chinese Water Conservancy Association, Oct 30, 2001,
MWR website. http://www.mwr.gov.cn/. March, 2002. (In Chinese)
YRCC (Yellow River Conservancy Commission), 2002a, “Yellow River Basin
Planning,” YRCC website. http://www.yrcc.gov.cn/. March, 2002. (In Chinese)
YRCC (Yellow River Conservancy Commission), 2002b, “1998, 1999, 2000 Yellow
River Water Resources Bulletins,” YRCC website. http://www.yrcc.gov.cn/. March, 2002.
(In Chinese)
YRCC (Yellow River Conservancy Commission), 2002c, “Results from the 2002 Pilot
Xiaolangdi Water-sand Regulating Release,” News release section, YRCC website
http://www.yrcc.gov.cn/. March, 2002. (In Chinese)
YRCC (Yellow River Conservancy Commission), 2002d, information made available
during meetings between the YRCC and the International Water Management Institute,
Zhengzhou, China, September-October, 2002.
Zhu, Z., L. Abed, and N. G. Yaqoub, 1995, “Revised Nile River Water Balance - Years
1987-1993,” working paper series No. 5-1, Strategic Research Program, National Water
Research Center of the Ministry of Water Resources and Irrigation, Cairo, Egypt.
Related Documents