WHO methods for life expectancy and healthy life expectancy Department of Health Statistics and Information Systems WHO, Geneva March 2014 Global Health Estimates Technical Paper WHO/HIS/HSI/GHE/2014.5

Welcome message from author
This document is posted to help you gain knowledge. Please leave a comment to let me know what you think about it! Share it to your friends and learn new things together.
Transcript
WHO methods for life expectancy and healthy life expectancy
Department of Health Statistics and Information Systems WHO, Geneva
March 2014
Global Health Estimates Technical Paper WHO/HIS/HSI/GHE/2014.5
Acknowledgments This Technical Report was written by Colin Mathers and Jessica Ho with inputs and assistance from Wahyu Retno Mahanani, Doris Ma Fat and Dan Hogan. WHO life tables were primarily prepared by Jessica Ho and Colin Mathers of the Mortality and Burden of Disease Unit in the WHO Department of Health Statistics and Information Systems (in the Health Systems and Innovation Cluster of WHO, Geneva). We also drew on prior life table work carried out by Mie Inoue for the previous revision to year 2011, and on advice and inputs from the Interagency Group on Child Mortality Estimation (UN IGME), the UN Population Division and the UN Population Division. We would particularly like to note the assistance and inputs provided by Kirill Andreev, Ties Boerma, Richard Garfield, Patrick Gerland, Peter Ghys, Danan Gu, Ken Hill, Mie Inoue, Nan Li, Mary Mahy, Francois Pelletier, Thomas Spoorenberg, John Stover, Tessa Wardlaw, John Wilmoth and Danzhen You.
Estimates and analysis are available at: http://www.who.int/gho/mortality_burden_disease/en/index.html
http://www.who.int/gho
For further information about the estimates and methods, please contact [email protected]
In this series
1. WHO methods and data sources for life tables 1990-2011 (Global Health Estimates Technical Paper WHO/HIS/HSI/GHE/2013.1)
2. WHO-CHERG methods and data sources for child causes of death 2000-2011 (Global Health Estimates Technical Paper WHO/HIS/HSI/GHE/2013.2)
3. WHO methods and data sources for global causes of death 2000-2011 (Global Health Estimates Technical Paper WHO/HIS/HSI/GHE/2013.3)
4. WHO methods and data sources for global burden of disease estimates 2000-2011 (Global Health Estimates Technical Paper WHO/HIS/HSI/GHE/2013.4)
Contents
Acknowledgments ......................................................................................................................................... 2
1 Introduction .......................................................................................................................................... 1
2 Concepts and definitions ...................................................................................................................... 1
3 Neonatal, Infant and Under-five mortality ........................................................................................... 2
3.1 Data sources and adjustments ...................................................................................................... 2
3.2 B3 method ..................................................................................................................................... 3
3.3 Estimates by sex ............................................................................................................................ 4
3.4 Neonatal mortality ........................................................................................................................ 4
4 Life table methodology ......................................................................................................................... 5
4.1 Life tables based on death rates computed from civil registration data ...................................... 5
4.2 Life tables for countries with other information on levels of adult mortality .............................. 6
4.3 Life tables for countries with high levels of HIV mortality ............................................................ 7
4.4 Conflicts and natural disasters ...................................................................................................... 7
5 WHO reporting on levels of mortality and life expectancies ................................................................ 9
6 Health-adjusted life expectancy (HALE) .............................................................................................. 10
6.1 Introduction ................................................................................................................................ 10
6.2 Method for calculation of health-adjusted life expectancy ........................................................ 10
6.3 WHO estimates of HALE for years 2000 and 2012 ..................................................................... 12
.................................................................................................................................................................... 14
References .................................................................................................................................................. 15
Annex Table A: Data sources and methods for WHO Life Tables ............................................................... 18

World Health Organization Page 1
1 Introduction
The World Health Organization (WHO) began producing annual life tables for all Member States in 1999. These life tables are a basic input to all WHO estimates of global, regional and country-level patterns and trends in all-cause and cause-specific mortality. After the publication of life tables for years to 2009 in the 2011 edition of World Health Statistics, WHO has shifted to a two year cycle for the updating of life tables for all Member States, and will move towards alignment of this revision cycle with that of the World Population Prospects produced biennially by the UN Population Division.
These life tables are available on the WHO Global Health Observatory (1) for the years 1990, 2000 and 2012 as of April 2014 and in World Health Statistics 2014. The following basic indicators are printed in the World Health Statistics (2) annual publication released each May:
• life expectancy at birth, by sex
• life expectancy at age 60, by sex
• the probability of dying between ages 15 and 60, by sex
• the probability of dying between ages 0 and 5 (released annually by UN IGME, see section 3).
This technical report summarizes the methods and data sources used.
2 Concepts and definitions
Abridged life table: definitions of columns.
Age age intervals x to x+n, where x= 0, 1, 5,....., 95, 100 years and n is the width of the age interval in years.
nMx age-specific death rates calculated from information on deaths among persons aged x to x+n during a given year and the population aged x to x+n at the mid-point of the same year.
nqx probability of dying between exact ages x and x+n.
lx number of people alive at exact age x among a hypothetical birth cohort of 100 000.
nLx total number of person-years lived between exact ages x and x+n.
ndx number of life table deaths in the age interval marked x to x+n.
Tx total number of person-years lived after age x.
ex expected average number of years of life left for a person age x.
World Health Organization Page 2
3 Neonatal, Infant and Under-five mortality The United Nations Inter-agency Group for Child Mortality Estimation (UN IGME), which includes members from UNICEF, WHO, the World Bank and United Nations Population Division, was established in 2004 to advance the work on monitoring progress towards the achievement of Millennium Development Goals regarding child mortality.
UN IGME annually assesses and adjusts all available surveys, censuses and vital registration data, to then estimate the country-specific trends in under-five mortality per 1000 live births (U5MR) over the past few decades in order to predict the rates for the reference years (3).
The preferred source of data is a civil registration system which records births and deaths on a continuous basis. If registration is complete and the system functions efficiently, the resulting estimates will be accurate and timely. However, in the developing world most countries do not have well-functioning vital registration systems, and household surveys, such as the UNICEF-supported Multiple Indicator Cluster Surveys (MICS), the USAID-supported Demographic and Health Surveys (DHS) and periodic population censuses have become the primary source of data on under-five and infant mortality in developing countries. All data sources and estimates are documented by country on CME info (www.childmortality.org) (4).
Data from these different sources require different calculation methods and may suffer from different errors, for example random errors in sample surveys or systematic errors due to misreporting. As a result, different surveys often yield widely different estimates of U5MR for a given time period. In order to reconcile these differences and take better account of the systematic biases associated with the various types of data inputs, the Technical Advisory Group (TAG) of the IGME has developed a new estimation method to fit a smoothed trend curve to a set of observations and to extrapolate that trend to a defined time point, in this case 2012. This method is referred to as the Bayesian B-splines bias-adjusted model or the B3 model and described in section 3.2.
3.1 Data sources and adjustments For data from civil registration, the calculation of U5MR and IMR is derived from a standard period abridged life table.
For countries without complete vital registration, surveys are the main data source. The majority of survey data comes in one of two forms: the full birth history (FBH), whereby women are asked for the date of birth of each of their children, whether the child is still alive, and if not the age at death; and the summary birth history (SBH), whereby women are asked only about the number of their children ever born and the number that have died (or equivalently the number still alive).
In populations severely affected by HIV/AIDS, HIV-positive (HIV+) children will be more likely to die than other children, and will also be less likely to be reported since their mothers will have been more likely to die also. The TAG of the IGME developed a method to adjust HIV/AIDS related mortality for each survey data observation from FBH during HIV/AIDS epidemic (1980-present), by adopting a set of simplified but reasonable assumptions about the distribution of births to HIV+ women (5). This method was applied to all World Fertility Surveys, as well as the Demographic and Health Surveys.
World Health Organization Page 3
To capture the extraordinarily rapid changes in child mortality driven by HIV/AIDS over the epidemic period in some countries, the regression models were fitted to data points for the U5MR from all other causes than HIV/AIDS, and then UNAIDS estimates of HIV/AIDS under-five mortality were added to estimates from the regression model. This method was used for 17 countries where the HIV prevalence rate exceeded 5% at any point in time since 1980. To address concerns about incompleteness of early infant mortality data from civil registration in European countries, The UN IGME examined the strong evidence and agreed that an adjustment of the order of 25% should be made to the Russian Federation estimates of infant mortality based on published analyses. Further analysis based on the ratio of early neonatal to total neonatal deaths resulted in a 10% upward adjustment to under-5 mortality for Belarus, Hungary and Lithuania; and a 20% adjustment for the other countries, including the Russian Federation. In all cases, a single country-specific correction factor was applied to the entire time series, except for Estonia from 1992 onwards.
3.2 B3 method For evaluating progress in reducing U5MR, accurate estimates of the rate of reduction and the uncertainty associated with it are required. The UN IGME 2012 estimates were based on the Loess estimation approach, and uncertainty bounds were obtained through a bootstrap method. The new B3 method was recommended by the TAG because compared to the previous method,
- The B3 model better accounts for data errors (including biases and sampling and non-sampling errors in the data),
- The splines model can better capture short-term fluctuations in the U5MR and ARR, and - The B3 model performs better in out-of-sample validation exercises. In summary, as compared
to the previous estimation approach, the B3 model is better able to take into account evidence of acceleration in the decline of U5MR from new surveys.
In the B3 model, log(U5MR) is estimated with a flexible splines regression model that is fitted to all U5MR observations in the country. An observed value for U5MR is considered to be the true value for U5MR multiplied by an error factor, i.e. observed U5MR = true U5MR * error, or on the log-scale, log(observed u5mr) = log(true U5MR) + log(error), where error refers to the relative difference between an observation and the truth. While estimating the true U5MR, properties of the errors that provide information about the quality of the observation, or in other words, the extent of error that we expect, are taken into account. These properties include: the standard error of the observation; its source type (e.g. DHS versus census) and if the observation is part of a data series from a specific survey (and how far the data series is from other series with overlapping observation periods). These properties are summarized in the so-called data model. When estimating the U5MR, the data model adjusts for the errors in the observations, including the average systematic biases associated with different types of data sources, using information on data quality for different source types from all countries in the world.
The B3 splines regression method was developed and implemented for the UN IGME by Leontine Alkema and Jin Rou New from the National University of Singapore with guidance and review by the TAG of the UN IGME. A more complete technical description of the B3 model is available elsewhere (6) and will be published in a journal.
World Health Organization Page 4
In general, the B3 model described above is applied to the U5MR for all countries (except for the Democratic Republic of Korea, where a nonstandard method was employed). For countries with high-quality VR data (covering a sufficient period of time and deemed to have high levels of completeness and coverage), the B3 model is also used, but is fitted to the logit transform of r, i.e. log(r/1-r), where r is the ratio of the IMR to the median B3 estimates of U5MR in the corresponding country-year. This is to restrict the IMR to be lower than the U5MR. For the remaining countries, the IMR is derived from the U5MR, through the use of model life tables that contain known regularities in age patterns of child mortality (7). The advantage of this approach is that it avoids potential problems with the under-reporting of neonatal deaths in some countries and ensures that the internal relationships of the three indicators are consistent with established norms.
3.3 Estimates by sex Due to fewer data available by sex than data for both sexes, UN IGME uses available data by sex to estimates time trend in the sex ratio (male/female) of U5MR. Leontine Alkema and Fengqing Chao of the National University of Singapore have developed new Bayesian methods for the UN IGME estimation of sex ratios, with a focus on the estimation and identification of countries with outlying levels or trends (8).
3.4 Neonatal mortality The neonatal mortality rate (NMR) is defined as the probability of dying before 28 days per 1000 live births. UN IGME methods for analysis of NMR are slightly updated from those published (9). The sources of data for NMR are basically the same as for under-5 mortality and infant mortality rate. A database consisting of pairs of neonatal mortality per 1000 live births (NMRs) and under-5 mortality per 1000 live births (U5MRs) was compiled. For a given year, NMR and U5MR were included in the database when data for both of these were available. To ensure consistency with U5MR estimates produced by UN IGME, U5MR and NMR data points were rescaled for all years to match the UN IGME estimates produced by UN IGME.
The following statistical model was used to estimate NMR:
log(NMR/1000) = α0+ β1*log(U5MR/1000) + β2*([log(U5MR/1000)] 2)
with additional random effect intercept parameters for both country and region. For countries with good vital registration data covering the period 1990-2012, we added random effects parameters for slope or trend parameters as well. Based on predictive performance evaluation using ten-fold cross-validation, the statistical model was fitted to data point for 1990 onwards were retained and we only included the most recent data point from each survey. To obtain the number of neonatal deaths, live births were applied to neonatal mortality rates.
The live births were calculated by taking the infant population from the World Population Prospects: the 2012 revision (10) and adding back the deaths in the neonatal and postneonatal periods while accounting for the fraction of period lived before the death. It was assumed that a neonate who dies in
World Health Organization Page 5
neonatal period lives an average of 4.7 days (or 0.0129 of the infant period) and that an infant who dies in the postneonatal period lives an average of 0.5 years.
The TAG of UN IGME recommended that for neonatal mortality in HIV-affected populations, the NMR be estimated initially on using neonatal and child mortality observations for non-AIDS deaths, calculated by subtracting from total death rates the estimates HIV death rates in the neonatal and 1-59 month periods respectively, and then AIDS neonatal deaths be added back on to the non-HIV neonatal deaths to compute the total estimated neonatal death rate.
4 Life table methodology Life tables have been developed for all Member States for years 1990-2012 starting with a systematic review of all available evidence from surveys, censuses, sample registration systems, population laboratories and vital registration on levels and trends in under-five and adult mortality rates.
In recent years, WHO has liaised more closely with the United Nations Population Division (UNPD) on life tables for countries, in order to maximize the consistency of UN and WHO life tables, and to minimize differences in the use and interpretation of available data on mortality levels. For countries where WHO previously predicted levels of adult mortality from estimated levels of child mortality, this update has taken into account additional country-specific sources of information on levels of adult mortality as reflected in the life tables prepared by the UN Population Division (UNPD) for its World Population Prospects – see below.
Procedures used to estimate WHO life tables Member States vary depending on the data available to assess child and adult mortality across the period 1990-2012. Three basic methods have been used for this revision, and are described in the following sections. In all three cases, UN IGME estimates of neonatal, infant and under-5 mortality rates were used. Annex table A below shows the availability of civil registration data to WHO for all Member States and summarizes the methods used for preparing life tables.
4.1 Life tables based on death rates computed from civil registration data
For 95 Member States with vital registration and sample vital registration systems, demographic techniques (such as Brass Growth–Balance method, Generalized Growth–Balance method or Bennett– Horiuchi method) were first applied to assess the level of completeness of recorded mortality data in the population above five years of age and then those mortality rates were adjusted accordingly. The proportion of all deaths which are registered in the population covered by the vital registration system (referred to as completeness) has been estimated by WHO and is given for the latest available years in the annex table.
World Health Organization Page 6
Abridged life tables for ages 15+ were constructed using death records data (11). Mortality rates in 5 year age intervals up to 85+ were extracted. The open-ended age interval 85+ was expanded using the Thatcher-Kannisto method to estimate qx for five year age groups 85-89, …, 120-124, 125+ (12,13). The average proportion of each 5-year age range lived by those who die in the age range (5ax) was estimated using the iterative method described by Preston et al (Section 3.2.2) (14).
It is recognized that death registration data, even for countries with good quality data as defined by the selection criteria described above, suffer from biases introduced by incomplete recording of deaths at older ages in some countries, age misreporting on death certificates and problems with population estimates for older age groups. These potential biases can change over time, complicating the interpretation of levels and trends. We applied the Thatcher-Kannisto method for estimation at older ages, and graduation techniques to reduce potential biases. For countries included in the Human Mortality Database (15), we also checked the older-age expansions of mortality rates against those in the HMD database, and for other countries against the life tables in the World Population Prospects 2012 (which also make use of the Thatcher-Kannisto method) (10).
Where vital registration data for all the reference years were available, the age specific mortality rates, adjusted for completeness if necessary were used directly to construct the life tables. Death registration data for year 2012 were available for 29 Member States.
For another 84 Member States where vital registration data for 2012 was not available, life table parameters were projected from those for available data years from 1985 onwards. Adjusted levels of child mortality (5q0) and adult mortality (45q15), excluding HIV/AIDS deaths where necessary, were used to estimate levels of two life table parameters (l5, l60) for each available year. The life table parameter l60 was projected forward to 2012 using a weighted regression model giving more weight to recent years (using an exponential weighting scheme such that the weight for each year t was 25% less than the weight for year t+1). For Member States with a total population less than 750,000 or where the root mean square error from this regression was greater than or equal to 0.011, a shorter-term trend was estimated by applying a weighting factor with 50% annual exponential decay. These projected values of l60, together with values of l5 based on 5q0 from UN IGME were then applied to a modified logit life table model (16), using the most recent national data as the standard, to predict the full life tables in the reference years.
For two small countries without available death registration data (Andorra and Monaco), life tables were based on mortality rates from neighbouring regions of Spain and France respectively.
4.2 Life tables for countries with other information on levels of adult mortality For 62 Member States without useable death registration data or inconsistent time series for deaths of population, assessments of mortality rates for ages 5 and over were based on the latest available life table analyses of the UN Population Division (10). The sources of available data used in the World
World Health Organization Page 7
Population Prospects are listed at (17). Annual age-sex-specific death rates for years 1990-2012 were interpolated from the World Population Prospects life tables, where necessary first subtracting out conflict and disaster deaths occurring in each specific 5-year time period. Annual estimates for conflict and disaster deaths were then added back as described below.
4.3 Life tables for countries with high levels of HIV mortality For 35 of these Member States with high levels of HIV mortality, the UN Population Division explicitly estimated HIV deaths in preparing life table time series using the Spectrum modelling system employed by UNAIDS for modelling the HIV epidemic in countries. For the World Population Prospects 2012 (10), the Spectrum models used the same input assumptions and HIV data as used by UNAIDS in late 2012 (18). UNAIDS subsequently further updated the Spectrum models and HIV estimates for its 2013 update (19).
To avoid some inconsistencies between the 2013 UNAIDS estimates for age-specific HIV mortality rate and the WPP 2012 all-cause age-specific mortality rates, revised estimates for HIV and non-HIV mortality rates were prepared for 35 countries with high levels of HIV mortality to ensure consistency. Starting with unpublished estimates of non-AIDS life expectancy provided by UN Population Division for each of these countries, an initial set of non-HIV mortality rates were estimated and input to Spectrum, together with the current data inputs for HIV. The resulting estimated all-cause mortality rates (including HIV mortality) were then compared to the WPP2012 all-cause mortality rates, and the input non-HIV mortality rates revised until a good match was obtained. Although reasonably consistent results were obtained for many of the high HIV countries, the resulting HIV and non-HIV age-specific mortality rates differ somewhat from the UNAIDS 2013 estimates for HIV mortality and the WPP 2012 estimates for all-cause mortality for some of the 35 countries. In the case of South Africa, all-cause death registration data adjusted for completeness was also used to assess levels of all-cause mortality, resulting in HIV mortality estimates somewhat lower than UNAIDS estimates. The high-HIV countries for which this method was used are identified in the Annex Table.
4.4 Conflicts and natural disasters Estimated deaths for major natural disasters were obtained from the OFDA/CRED International Disaster Database (20). For country-years where death rates from these disasters exceeded 1 per 10,000 population, these deaths were added to the life table death rates for the relevant year. Age-sex distributions were based on a number of studies as described in an earlier Global Health Estimates Technical Paper (21).
Country-specific estimates of war and conflict deaths were updated for the entire period 1990-2012 using revised methods documented previously which draw on information on conflict intensity, time trends, and mortality obtained from a number of war mortality databases (21). The revised WHO country-specific estimates of war and conflict deaths for the period 1990-2012 make use of estimates of direct deaths from three datasets: Battle-Related Deaths (version 5), Non-State Conflict Dataset (UCDP version 2.4), and One-sided Violence Dataset (UCDP version 1.4) from 1989 to 2011 (22-24). Using these three datasets, instead of focusing solely on battle-related deaths, reduces the likelihood that overall direct conflict deaths are underestimated. However, it likely that a degree of undercounting still occurs
World Health Organization Page 8
in the count-based datasets, and an adjustment factor obtained by Garfield and Blore (25) of 2.21 is applied to the annual battle death main estimates for state-state conflicts (22). No adjustments were applied to estimated conflict deaths (main estimates) for non-state conflict deaths (23), and one-sided violence (24).
For Syria, excess mortality in 2011 and 2012 due to the conflict was taken into account based on UN estimates of overall conflict deaths by month and age distribution of deaths (26). Additional information from epidemiological studies and surveys was also used for Iraq (27, 28). Deaths due to landmines and unexploded ordinance were estimated separately by country (29).
The revised WHO estimates for conflict deaths were taken into account in preparing final life tables for Member States for years 1990-2012 as follows. For country-years where death rates from conflict or disasters exceeded 1 per 10,000 population, the estimated annual age-sex-specific conflict deaths were added to the life table death rates for the relevant year. In cases of extended conflicts where death rates fluctuated above and below 1 per 10,000, only the death rate in excess of 1 per 10,000 was added to relevant years.
World Health Organization Page 9
5 WHO reporting on levels of mortality and life expectancies WHO applies standard methods to the analysis of Member State data to ensure comparability of estimates across countries. This will inevitably result in differences for some Member States with official estimates for quantities such as life expectancy, where a variety of different projection methods and other methods are used. Prior to release, a consultation on the WHO estimates for life expectancy and child and adult mortality rates was conducted with Member States, providing them with an opportunity to comment on data, methods and assumptions, and to provide additional data where relevant. However, these WHO estimates of mortality and life expectancies should not be regarded as the nationally endorsed statistics of Member States, which may have been derived using alternative methodologies.
There remain substantial data gaps and deficiencies in data on levels of child and adult mortality, particularly in those regions with the highest mortality levels. Improved uncertainty ranges for child mortality were published with the 2013 revision of the UN IGME estimates (30). Quantifiable uncertainty ranges for adult mortality are more complex to derive, and there is considerable research underway to develop improved methods for measuring adult mortality in surveys, and in assessing the systematic biases in such data.
A qualititative guide to the uncertainty in adult mortality and life expectancy estimates is provided by the listing of methods and data input types in Annex Table A. The most reliable estimates are those based on death registration data assessed as complete, followed by those based on incomplete or sample death registration data with adjustments for levels of completeness. For countries without useable death registration data, uncertainties are substantially higher, and two categories can be distinguished (a) those countries where there is independent evidence on adult mortality rates from surveys or censuses and (b) those where estimates of adult mortality levels are derived from model life tables with estimated infant and child mortality rates as inputs. Those countries with significant levels of mortality due to conflict and natural disasters (say, greater than 1 death per 10,000 population per annum) will usually have additional uncertainty associated with the difficulties in estimating conflict and disaster death rates.
World Health Organization Page 10
6 Health-adjusted life expectancy (HALE)
6.1 Introduction The concept of combining data on health or disability status of populations with mortality data in a life table to generate estimates of expected years of life in various health states was first proposed in the 1960s (31, 32) and Disability-free Life Expectancy (DFLE) was calculated for a number of countries during the 1970s and 1980s. A Network for Health Expectancy and the Disability Process, known by its French acronym of REVES, was established in 1989 and promoted the use of health expectancies as summary measures of population health (33).
The REVES Network in its early meetings identified the main challenge in the international use of health expectancies was the use of different questions, response scales and concepts (impairment, disability, handicap, quality of life) in nationally representative surveys. When a number of cross-national surveys became available in the 1990s, it also became apparent that differences in expectations and norms for health led to lack of comparability across populations in responses to self-report questions on health and disability.
WHO used a form of health expectancy to estimate the average levels of population health for its member countries in the World Health Report 2000 (34). Healthy life expectancy (HALE) is a form of health expectancy that, like the DALY, applies disability weights to health states to compute the equivalent number of years of life expected to be lived in full health. The first HALE calculations attempted to use existing health survey data together with imputed national-level data from the Global Burden of Disease study (35). More recent updates of HALE estimates drew on self-report data from the WHO Multi-country Survey Study, rather than national studies, though the improvements in cross-national comparability were limited (36).
Adjustments for dependent comorbidity were incorporated in the calculation of HALE for year 2002 as described by Mathers et al (37). The last HALE estimates published by WHO were for the year 2007 in World Health Statistics 2009 (38). More recently, the Global Burden of Disease 2010 study carried out calculations of HALE for years 1990-2010 using YLD results and life tables developed for the GBD 2010 study (39). Responding to interest in HALE as a high-level indicator for post-2015 global health monitoring, WHO held an expert consultation on the use and estimation of healthy life expectancy in December 2012 (40) which recommended that efforts should continue to be made to refine the measurement methodology and investigate its utility for monitoring health goals.
6.2 Method for calculation of health-adjusted life expectancy Sullivan’s method is used to compute HALE for each Member State from the country life tables for years 2000-2011 using age-sex-specific estimates of severity-adjusted equivalent years of healthy life lost as a fraction of total years lived by each age-sex group. This latter quantity is estimated by summing estimates of years of healthy life lost due to disability (YLD) across a comprehensive set of disease and injury causes. The estimates of YLD draw on analyses carried out for the Global Burden of Disease 2010 study (GBD 2010) (41) with selected revisions to disability weights and prevalence estimates as documented elsewhere (42).
World Health Organization Page 11
WHO has also adopted the simpler form of YLD, used by the GBD 2010 study (41), which has dropped age-weighting and time discounting, and the years lost due to disability (YLD) are calculated from prevalence estimates rather than incidence estimates. YLD are also adjusted for independent comorbidity.
Thus, the equivalent lost healthy year fractions required for the HALE calculation are estimated as the all-cause YLD rate per capita, adjusted for independent comorbidity, by age, sex and country. Sullivan's method uses the equivalent lost healthy year fraction (adjusted for comorbidity) at each age in the current population (for a given year) to divide the hypothetical years of life lived by a period life table cohort at different ages into years of equivalent full health and equivalent lost healthy years (32). The method is illustrated in detail in Mathers et al.(43).
Using standard notation for the country life table parameters, we calculate HALE at age x as follows:
Dx Equivalent lost healthy year fraction between ages x and x+5
Lx Total years lived by the life table population between ages x and x+5
YDx = Lx Dx Equivalent lost years of healthy life between ages x and x+5
YWDx = Lx (1- Dx) Equivalent years of healthy life lived between ages x and x+5
HALE at age x is the sum of YWDi from i = x to w (the last open-ended age interval in the life table) divided by lx (survivors at age x):
xw
xiix l/YWD= HALE
∑=
[14]
xxxw
xiix HALE- LE = l/YD= LHE
∑=
[15]
LHEx,the equivalent healthy years of life lost, is the sum of YDi from i = x to w divided by lx (survivors at age x). Sullivan’s method is applied in abridged life tables using five year age intervals, up to an open-ended interval of 100+ years. The first interval is subdivided into 0 years and 1-4 years.
World Health Organization Page 12
6.3 WHO estimates of HALE for years 2000 and 2012 Because these estimates draw on new data and on the results of the GBD 2010 study, and there have been substantial revisions to methods for many causes, and to the methods for dealing with comorbidity, these HALE estimates for the years 2000-2012 are not directly comparable with previous WHO estimates of HALE for earlier years.
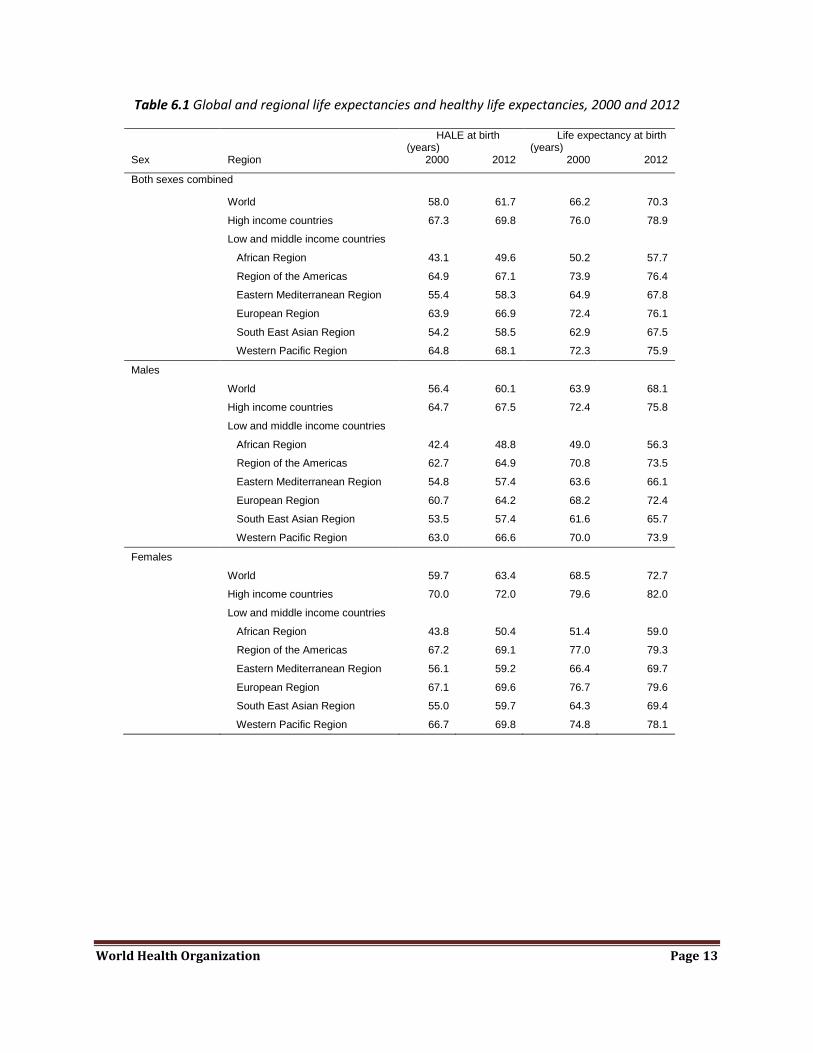
Overall, global HALE at birth in 2012 for males and females combined was 61.7 years, 8.6 years lower than total life expectancy at birth (Table 6.1). In other words, poor health resulted in a loss of nearly 9 years of healthy life, on average globally. Global HALE at birth for females was only 3.3 years greater than that for males. In comparison, female life expectancy at birth was 4.6 years higher than that for males. Global HALE at age 60 was 14.4 years and 16.6 years for males and females respectively in 2012; 4.1 years lower than total life expectancy at age 60 for males and 4.8 years lower for females.
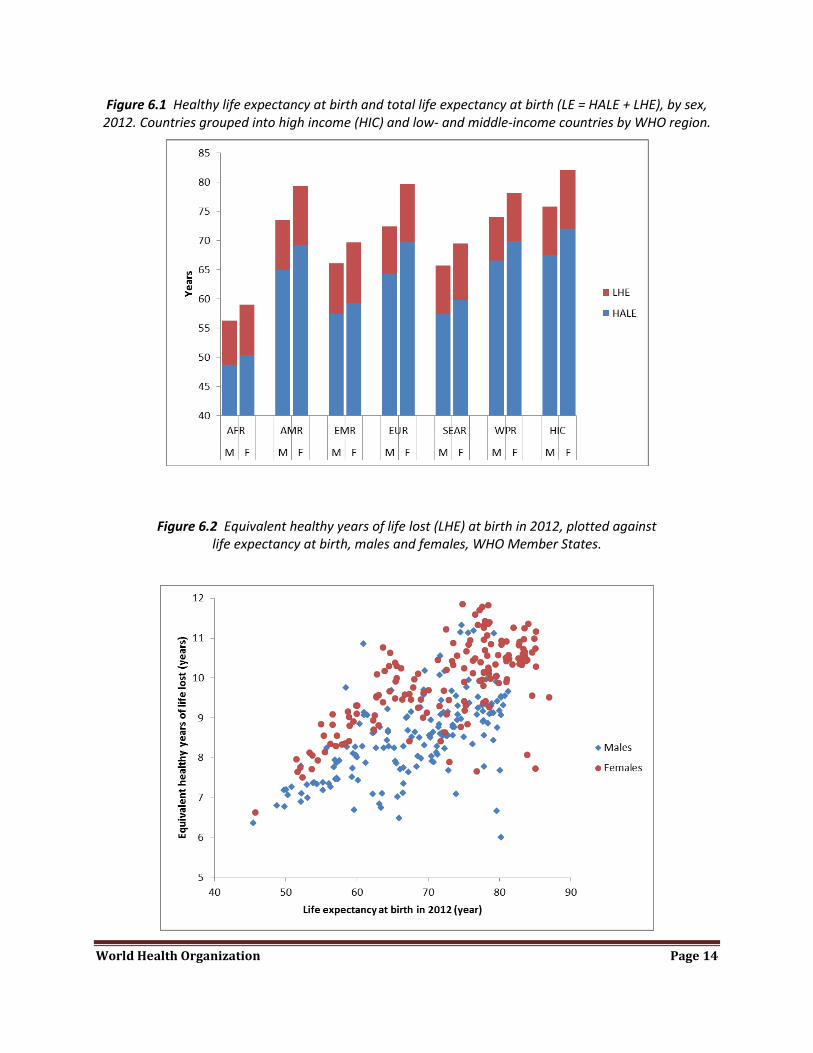
HALE at birth ranged from a low of 49 years for African males to almost 70 years for females in the high income countries (Figure 6.1). The equivalent “lost” healthy years (LHE = total life expectancy minus HALE) ranged from 14% of total life expectancy at birth in Africa to 10-11% in the European region and the Western Pacific region. The sex gap was highest for the low and middle income countries of Europe and lowest in Africa and North Africa and the Middle East.
There was an enormous difference between the world’s highest HALE at birth of around 77.5 years (for females in Japan) and the lowest of 39.1 years (for males in Sierra Leone) in 2012. In Sierra Leone, people both lived shorter lives (male life expectancy at birth was estimated at 45.5 years), and had higher levels of disease and disability at all ages. The probability of a male child dying before his 5th birthday was 18% in Sierra Leone, compared with less than 0.3% in Japan. The low levels of HALE in sub-Saharan Africa reflect the additional impact of the HIV-AIDS epidemic, as well as long-term impacts of war and conflict in some countries such as Sierra Leone.
Figure 6.2 plots country estimates of lost years of healthy life in 2012 (LHE) against life expectancy at birth. There are substantial variations in LHE across countries with similar levels of life expectancy at birth.
World Health Organization Page 13
Table 6.1 Global and regional life expectancies and healthy life expectancies, 2000 and 2012
HALE at birth (years)
Life expectancy at birth (years)
Sex Region 2000 2012 2000 2012
Both sexes combined
World 58.0 61.7 66.2 70.3
High income countries 67.3 69.8 76.0 78.9
Low and middle income countries
African Region 43.1 49.6 50.2 57.7
Region of the Americas 64.9 67.1 73.9 76.4
Eastern Mediterranean Region 55.4 58.3 64.9 67.8
European Region 63.9 66.9 72.4 76.1
South East Asian Region 54.2 58.5 62.9 67.5
Western Pacific Region 64.8 68.1 72.3 75.9
Males
World 56.4 60.1 63.9 68.1
High income countries 64.7 67.5 72.4 75.8
Low and middle income countries
African Region 42.4 48.8 49.0 56.3
Region of the Americas 62.7 64.9 70.8 73.5
Eastern Mediterranean Region 54.8 57.4 63.6 66.1
European Region 60.7 64.2 68.2 72.4
South East Asian Region 53.5 57.4 61.6 65.7
Western Pacific Region 63.0 66.6 70.0 73.9
Females
World 59.7 63.4 68.5 72.7
High income countries 70.0 72.0 79.6 82.0
Low and middle income countries
African Region 43.8 50.4 51.4 59.0
Region of the Americas 67.2 69.1 77.0 79.3
Eastern Mediterranean Region 56.1 59.2 66.4 69.7
European Region 67.1 69.6 76.7 79.6
South East Asian Region 55.0 59.7 64.3 69.4
Western Pacific Region 66.7 69.8 74.8 78.1
World Health Organization Page 14
Figure 6.1 Healthy life expectancy at birth and total life expectancy at birth (LE = HALE + LHE), by sex, 2012. Countries grouped into high income (HIC) and low- and middle-income countries by WHO region.
Figure 6.2 Equivalent healthy years of life lost (LHE) at birth in 2012, plotted against life expectancy at birth, males and females, WHO Member States.
World Health Organization Page 15
References (1) World Health Organization. Global health observatory.
(http://www.who.int/gho/mortality_burden_disease/life_tables/en/index.html)
(2) World Health Organization. World Health Statistics. (http://www.who.int/gho/publications/world_health_statistics/en/index.html)
(3) Silva R (2012) Child Mortality Estimation: Consistency of Under-Five Mortality Rate Estimates Using Full Birth Histories and Summary Birth Histories. PLoS Med 9(8): e1001296. doi:10.1371/journal.pmed.1001296
(4) United Nations Inter-agency Group for Child Mortality Estimation (2013). UN IGME Total Under-5 Mortality Rate and Infant Mortality Rate database 2013. (http://www.childmortality.org/files_v15/download/UN%20IGME%20Total%20U5MR%20and%20IMR%20Database%202013.xls)
(5) Walker N, Hill K, Zhao F (2012) Child Mortality Estimation: Methods Used to Adjust for Bias due to AIDS in Estimating Trends in Under-Five Mortality. PLoS Med 9(8): e1001298. doi:10.1371/journal.pmed.1001298
(6) Alkema L, New JR (2013). Estimating levels and trends in under-5 mortality: an assessment of biases in data series and an improved estimation method. Paper to be presented at the XXVII IUSSP International Population Conference, Busan, Republic of Korea.
(7) Guillot M, Gerland P, Pelletier F, Saabneh A (2012) Child Mortality Estimation: A Global Overview of Infant and Child Mortality Age Patterns in Light of New Empirical Data. PLoS Med 9(8): e1001299. doi:10.1371/journal.pmed.1001299
(8) Alkema L, Chao F, Sawyer CC (2013). Sex Differences in U5MR: Estimation and identification of countries with outlying levels or trends. Paper to be presented at the XXVII IUSSP International Population Conference, Busan, Republic of Korea.
(9) Oestergaard MZ, et al. (2011) Neonatal Mortality Levels for 193 Countries in 2009 with Trends since 1990: A Systematic Analysis of Progress, Projections, and Priorities. PLoS Medicine 8(8): e1001080. doi:10.1371/journal.pmed.1001080
(10) United Nations, Department of Economic and Social Affairs, Population Division (2013). World Population Prospects: The 2012 Revision.
(11) World Health Organization. Mortality Database. Available at: http://www.who.int/healthinfo/mortality_data/en/index.html
(12) Thatcher AR, Kannisto V, Vaupel JW. The force of mortality at ages 80 to 120. Odense: Odense University Press; 1998.
(13) Wilmoth JR, Andreev KF, Jdaov DA, Glei DA. Methods Protocol for the Human Mortality Database. Version 5. University of California, Berkeley and Max Planck Institute for Demographic Research; 2007.
(14) Preston S, Heuveline P, Guillot M. Demography: measuring and modeling population processes. Malden, Massachusetts: Blackwell Publishers Inc.; 2002.
(15) Human Mortality Database. University of California, Berkeley (USA), and Max Planck Institute for Demographic Research (Germany). Available at www.mortality.org or www.humanmortality.de (data downloaded on 13 September, 2013).
World Health Organization Page 16
(16) Murray CJL, Ferguson BD, Lopez AD, Guillot M, Salomon JA, Ahmad O. Modified logit life table system: principles, empirical validation and application. Population Studies, 2003; 57(2):1-18.
(17) UN Population Division (2013). File 0-2 Latest data sources used to derive estimates for total population, fertility, mortality and migrations by countries or areas in WPP 2012 revisions. (http://esa.un.org/wpp/Excel-Data/WPP2012_F02_METAINFO.xls)
(18) UNAIDS. 2012 UNAIDS Report on the Global AIDS Epidemic. Geneva: UNAIDS; 2012.
(19) UNAIDS. 2013 UNAIDS Report on the Global AIDS Epidemic. Geneva: UNAIDS; 2013.
(20) CRED. EM-DAT: The OFDA/CRED International Disaster Database. 2013. Belgium, Université Catholique de Louvain.
(21) World Health Organization. WHO methods and data sources for global causes of death 2000-2011 (Global Health Estimates Technical Paper WHO/HIS/HSI/GHE/2013.3). (http://www.who.int/healthinfo/global_health_estimates/en/)
(22) International Peace Research Institute 2012. UCDP/PRIO Battle-Related Deaths Dataset v. 5-2012b, 1989-2011. Oslo: PRIO (http://www.pcr.uu.se/research/ucdp/datasets/ucdp_battle-related_deaths_dataset/ accessed 4 February 2013).
(23) International Peace Research Institute 2012. UCDP/PRIO Non-State Conflict Dataset v. 2.4-2012, 1989-2011. Oslo: UCDP (http://www.pcr.uu.se/research/ucdp/datasets/ucdp_non-state_conflict_dataset_/ accessed 4 February 2013).
(24) International Peace Research Institute 2012. UCDP/PRIO One-Sided Violence Dataset v. 1.4-2012, 1989-2011. Oslo: PRIO (http://www.pcr.uu.se/research/ucdp/datasets/ucdp_one-sided_violence_dataset/ accessed 4 February 2013).
(25) Garfield, R, Blore J. (2009), Direct Conflict Deaths. Unpublished report prepared on behalf of the Collective Violence Expert Group for the Global Burden of Disease Study.
(26) Price M, et al (2013). Preliminary Statistical Analysis of Documentation of Killings in Syria. UN OHCHR commissioned report, January 2013. (http://www.ohchr.org/Documents/Countries/SY/PreliminaryStatAnalysisKillingsInSyria.pdf1)
(27) Iraq Family Health Survey Study Group. Violence-Related Mortality in Iraq from 2002 to 2006. N Engl J Med 2008 January 9;NEJMsa0707782.
(28) Iraq Body Count. Iraqi deaths from violence 2003–2012. (http://www.iraqbodycount.org/)
(29) International Campaign to Ban Landmines. Landmine monitor. (http://www.the-monitor.org/)
(30) UNICEF, WHO, The World Bank and UN Population Division. Levels and Trends of Child Mortality - Report 2013, Estimates developed by the UN Inter-agency Group for Child Mortality Estimation. UNICEF, New York, 2013
World Health Organization Page 17
(31) Sanders BS. Measuring community health levels. American Journal of Public Health 1964; 54:1063-1070.
(32) Sullivan DF. A single index of mortality and morbidity. HSMHA Health Reports 86, 347-354. 1971.
(33) Robine JM, Jagger C, Mathers CD, Crimmins EM, Suzman RM (eds.). Determining health expectancies. John Wiley & Sons, Chichester, 2003.
(34) World Health Organization: World Health Report 2000. Health Systems: Improving Performance. Geneva: WHO (2000).
(35) Mathers CD, Sadana R, Salomon J, Murray CJL, Lopez AD. Healthy life expectancy in 191 countries, 1999. The Lancet Vol 357: 1685-1691 (2001).
(36) Mathers CD, Murray CJL, Salomon JA. Methods for Measuring Healthy Life Expectancy. In: Murray CJL, Evans D (eds.) Health systems performance assessment: debates, methods and empiricism. Geneva: World Health Organization, pp 437-470 (2003)
(37) Mathers CD, Iburg KM, Begg S. Adjusting for dependent comorbidity in the calculation of healthy life expectancy. Population Health Metrics 2006; 4:4.
(38) World Health Organization. World Health Statistics 2009. Geneva: WHO (2009).
(39) Salomon JA, Wang H, Freeman MK, et al 2012. Healthy life expectancy for 187 countries, 1990–2010: a systematic analysis for the Global Burden Disease Study 2010. The Lancet. 2012 Dec 13; 380: 2144-2162).
(40) World Health Organization 2012. Measurement of Healthy Life Expectancy and Wellbeing: report of a Technical Meeting. WHO: Geneva 10-11 Dec 2012. Available at http://www.who.int/healthinfo/sage/meeting_reports/en/
(41) Murray CJ, Ezzati M, Flaxman AD, et al. GBD 2010: a multi-investigator collaboration for global comparative descriptive epidemiology. Lancet 2012 Dec 15; 380(9859): 2055-8.
(42) World Health Organization. WHO methods and data sources for global burden of disease estimates 2000-2011. Global Health Estimates Technical Paper WHO/HIS/HSI/GHE/2013.4
(43) Mathers CD, Salomon J, Murray CJL, Lopez A: Alternative summary measures of average population health. In Health systems performance assessment: debates, methods and empiricism. Edited by Murray CJL, Evans D. Geneva: World Health Organisation; 2003.
World Health Organization Page 18
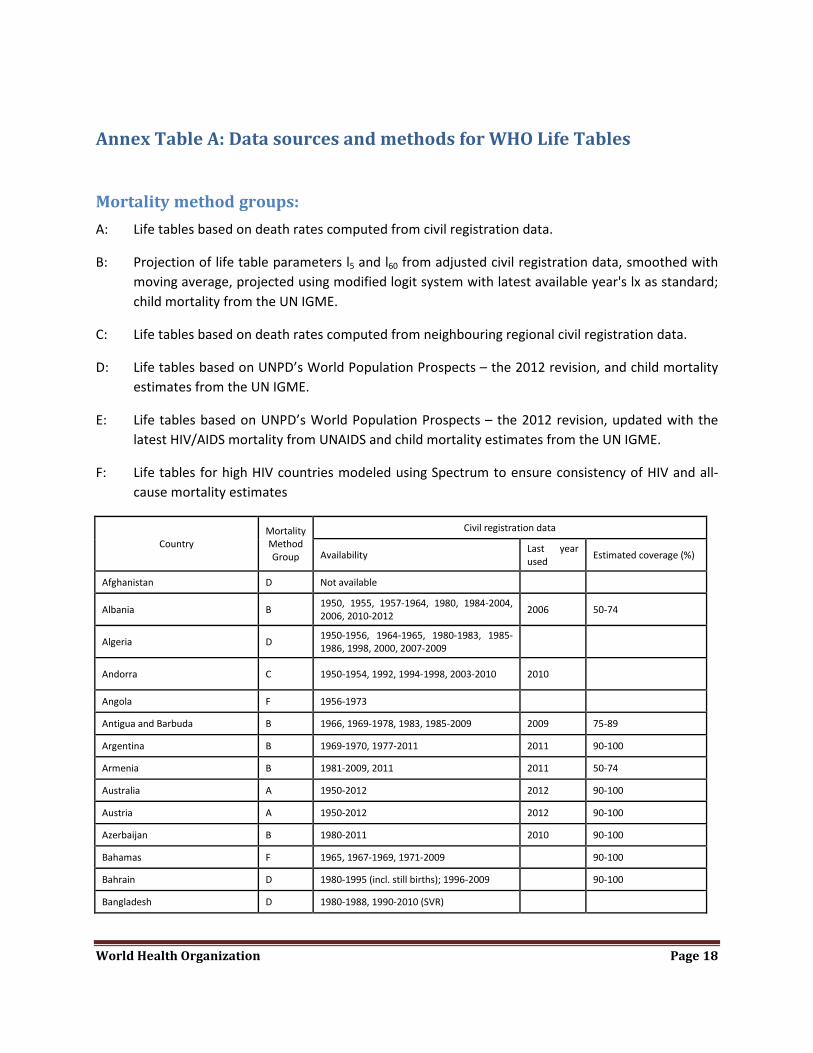
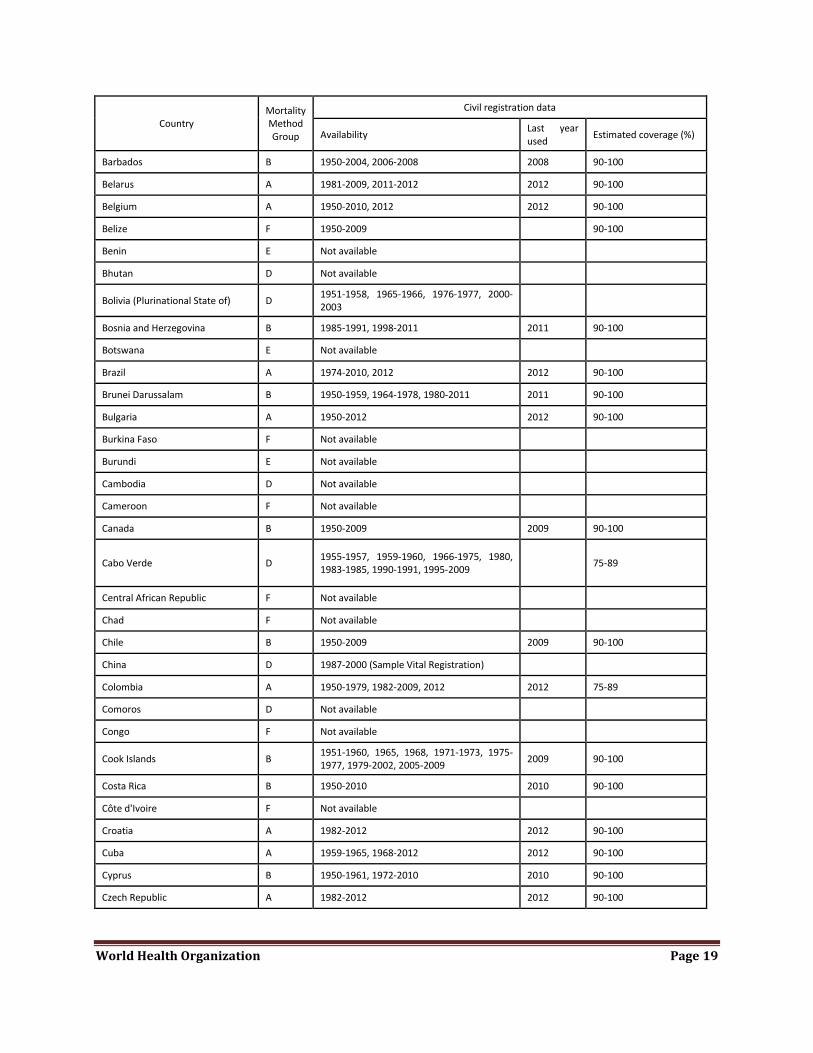
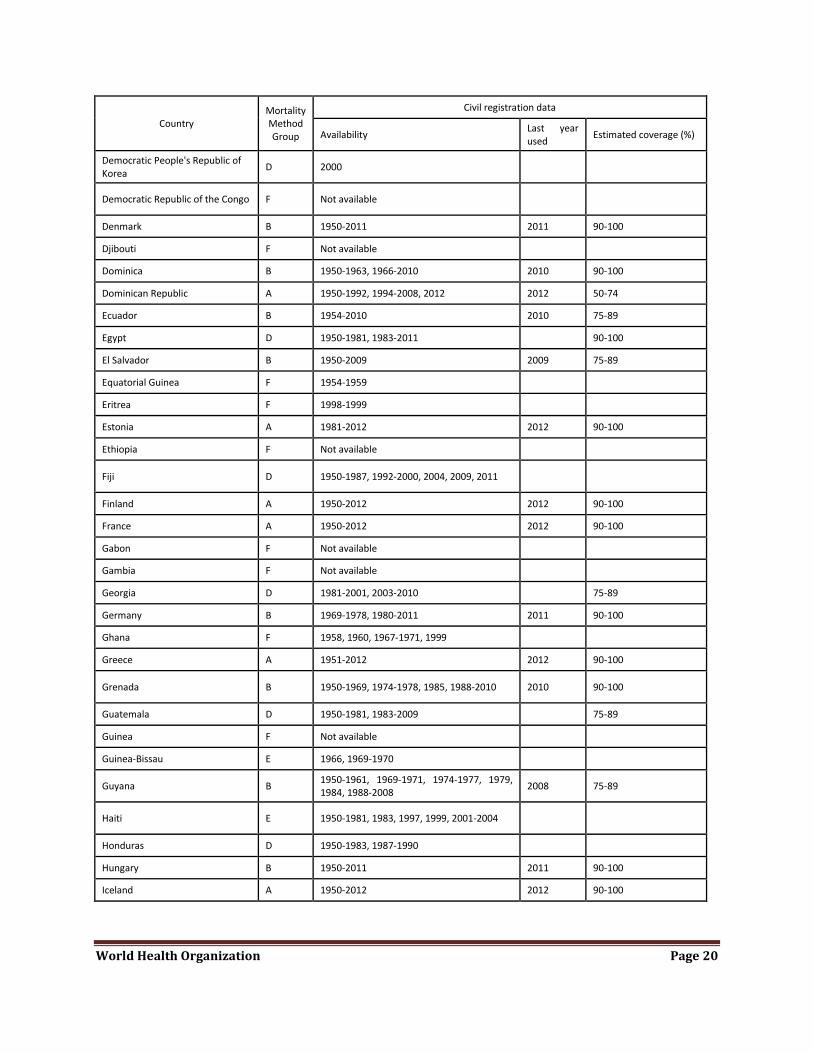
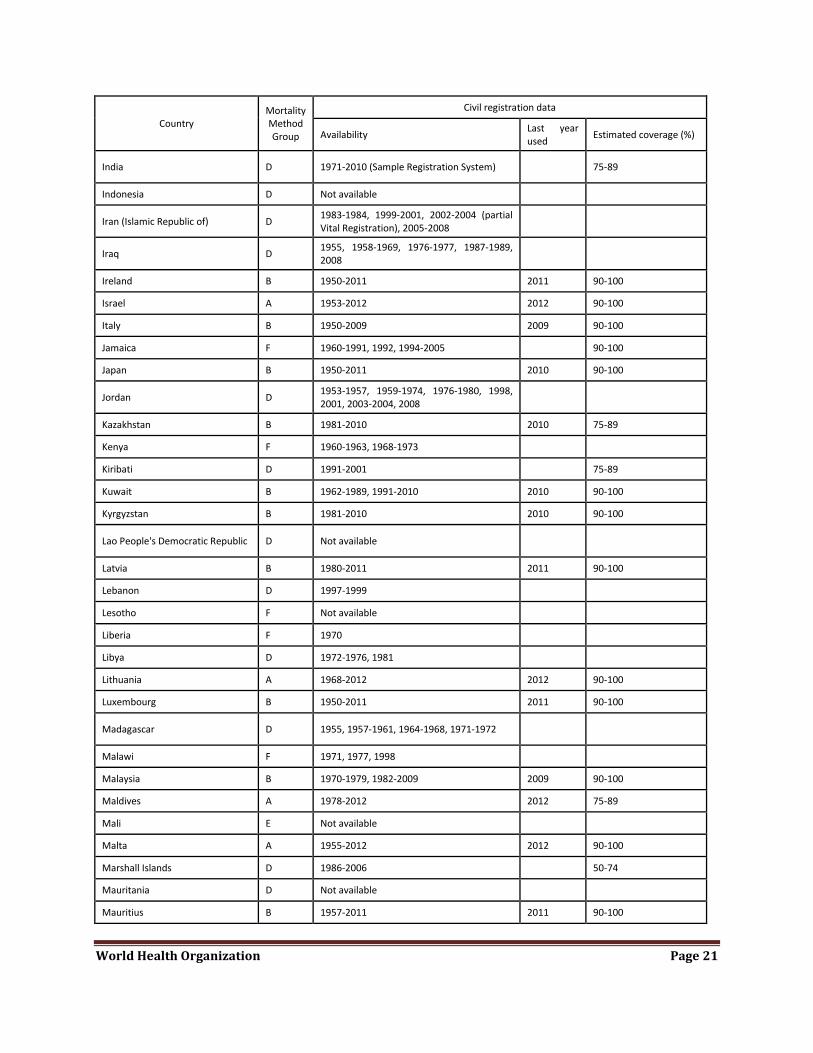
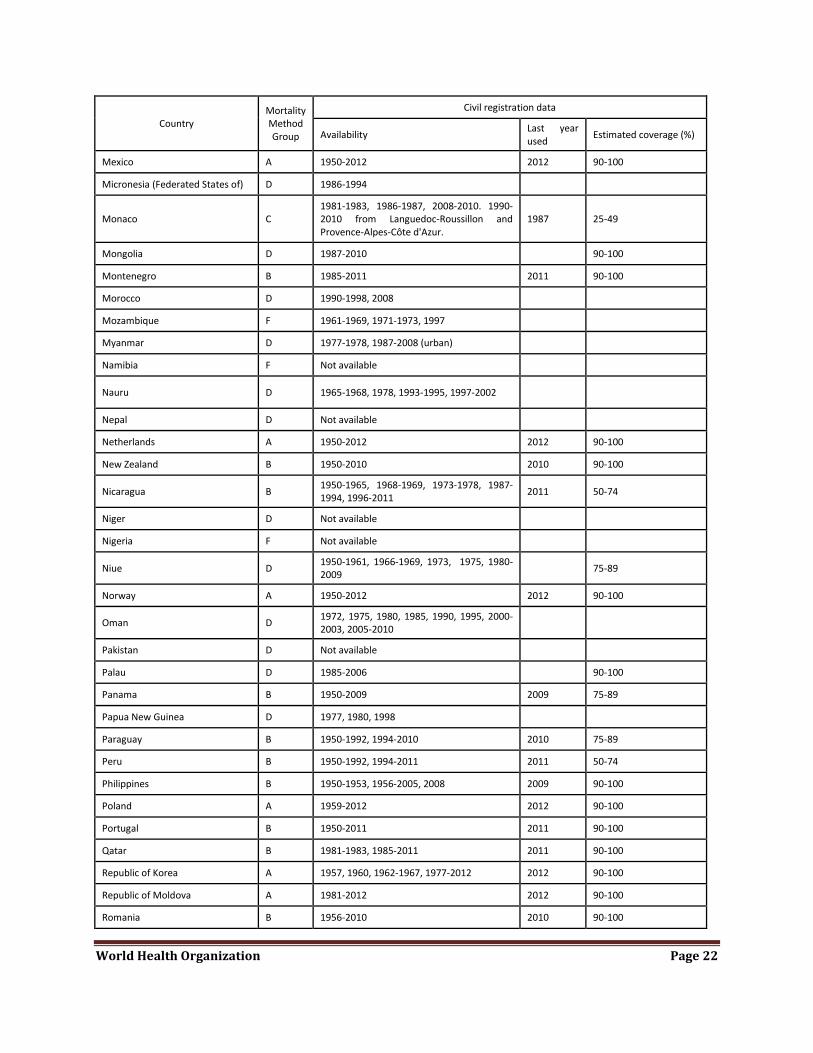
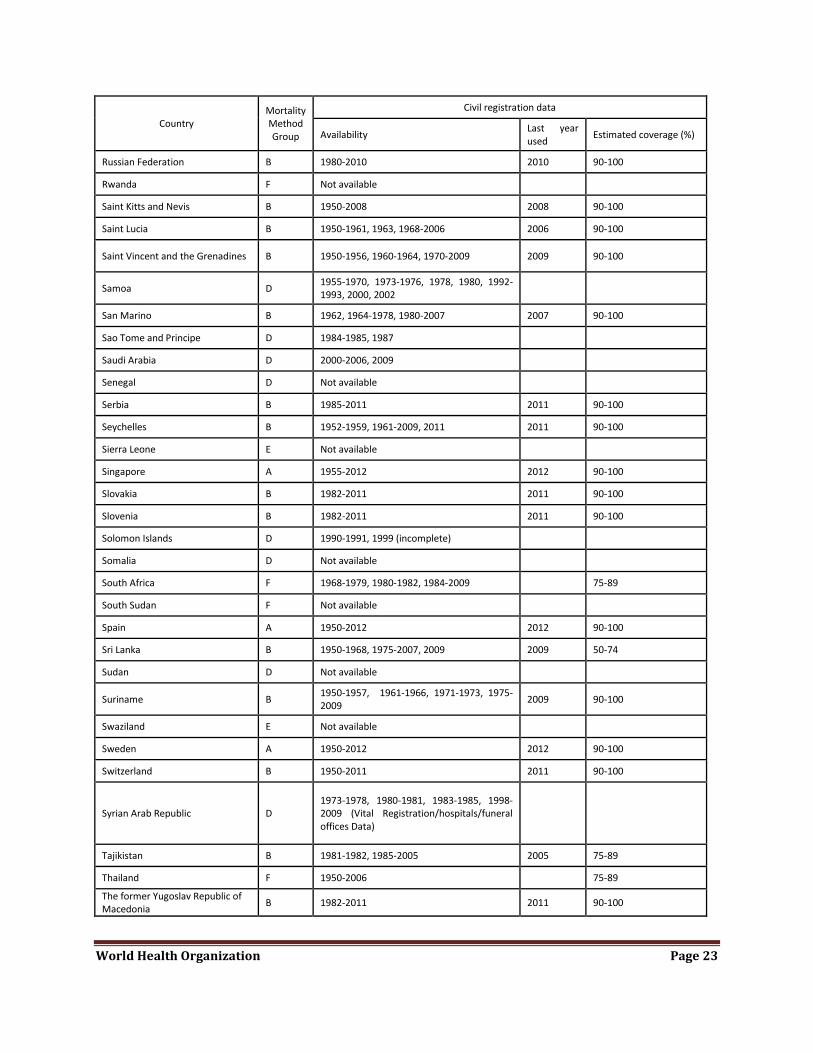
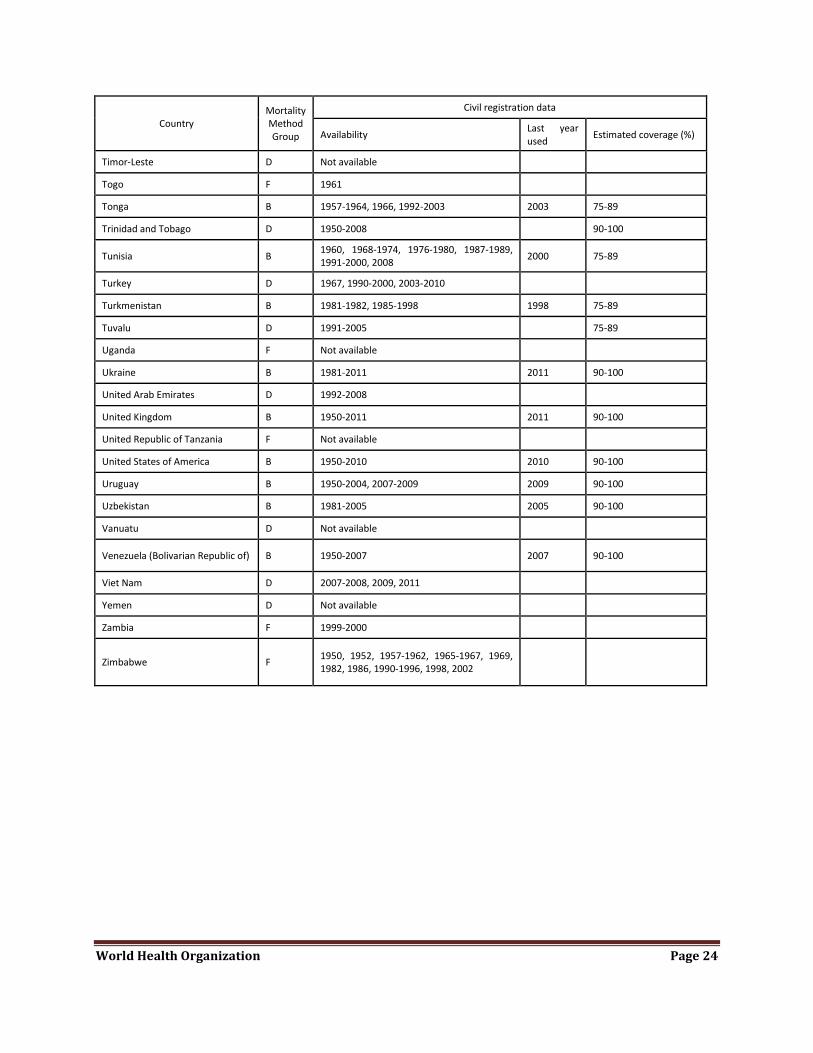
Annex Table A: Data sources and methods for WHO Life Tables
Mortality method groups: A: Life tables based on death rates computed from civil registration data.
B: Projection of life table parameters l5 and l60 from adjusted civil registration data, smoothed with moving average, projected using modified logit system with latest available year's lx as standard; child mortality from the UN IGME.
C: Life tables based on death rates computed from neighbouring regional civil registration data.
D: Life tables based on UNPD’s World Population Prospects – the 2012 revision, and child mortality estimates from the UN IGME.
E: Life tables based on UNPD’s World Population Prospects – the 2012 revision, updated with the latest HIV/AIDS mortality from UNAIDS and child mortality estimates from the UN IGME.
F: Life tables for high HIV countries modeled using Spectrum to ensure consistency of HIV and all-cause mortality estimates
Country Mortality Method Group
Civil registration data
Availability Last year used Estimated coverage (%)
Afghanistan D Not available
Albania B 1950, 1955, 1957-1964, 1980, 1984-2004, 2006, 2010-2012 2006 50-74
Algeria D 1950-1956, 1964-1965, 1980-1983, 1985-1986, 1998, 2000, 2007-2009
Andorra C 1950-1954, 1992, 1994-1998, 2003-2010 2010
Angola F 1956-1973
Antigua and Barbuda B 1966, 1969-1978, 1983, 1985-2009 2009 75-89
Argentina B 1969-1970, 1977-2011 2011 90-100
Armenia B 1981-2009, 2011 2011 50-74
Australia A 1950-2012 2012 90-100
Austria A 1950-2012 2012 90-100
Azerbaijan B 1980-2011 2010 90-100
Bahamas F 1965, 1967-1969, 1971-2009 90-100
Bahrain D 1980-1995 (incl. still births); 1996-2009 90-100
Bangladesh D 1980-1988, 1990-2010 (SVR)
World Health Organization Page 19
Country Mortality Method Group
Civil registration data
Availability Last year used Estimated coverage (%)
Barbados B 1950-2004, 2006-2008 2008 90-100
Belarus A 1981-2009, 2011-2012 2012 90-100
Belgium A 1950-2010, 2012 2012 90-100
Belize F 1950-2009 90-100
Benin E Not available
Bhutan D Not available
Bolivia (Plurinational State of) D 1951-1958, 1965-1966, 1976-1977, 2000-2003
Bosnia and Herzegovina B 1985-1991, 1998-2011 2011 90-100
Botswana E Not available
Brazil A 1974-2010, 2012 2012 90-100
Brunei Darussalam B 1950-1959, 1964-1978, 1980-2011 2011 90-100
Bulgaria A 1950-2012 2012 90-100
Burkina Faso F Not available
Burundi E Not available
Cambodia D Not available
Cameroon F Not available
Canada B 1950-2009 2009 90-100
Cabo Verde D 1955-1957, 1959-1960, 1966-1975, 1980, 1983-1985, 1990-1991, 1995-2009 75-89
Central African Republic F Not available
Chad F Not available
Chile B 1950-2009 2009 90-100
China D 1987-2000 (Sample Vital Registration)
Colombia A 1950-1979, 1982-2009, 2012 2012 75-89
Comoros D Not available
Congo F Not available
Cook Islands B 1951-1960, 1965, 1968, 1971-1973, 1975-1977, 1979-2002, 2005-2009 2009 90-100
Costa Rica B 1950-2010 2010 90-100
Côte d'Ivoire F Not available
Croatia A 1982-2012 2012 90-100
Cuba A 1959-1965, 1968-2012 2012 90-100
Cyprus B 1950-1961, 1972-2010 2010 90-100
Czech Republic A 1982-2012 2012 90-100
World Health Organization Page 20
Country Mortality Method Group
Civil registration data
Availability Last year used Estimated coverage (%)
Democratic People's Republic of Korea D 2000
Democratic Republic of the Congo F Not available
Denmark B 1950-2011 2011 90-100
Djibouti F Not available
Dominica B 1950-1963, 1966-2010 2010 90-100
Dominican Republic A 1950-1992, 1994-2008, 2012 2012 50-74
Ecuador B 1954-2010 2010 75-89
Egypt D 1950-1981, 1983-2011 90-100
El Salvador B 1950-2009 2009 75-89
Equatorial Guinea F 1954-1959
Eritrea F 1998-1999
Estonia A 1981-2012 2012 90-100
Ethiopia F Not available
Fiji D 1950-1987, 1992-2000, 2004, 2009, 2011
Finland A 1950-2012 2012 90-100
France A 1950-2012 2012 90-100
Gabon F Not available
Gambia F Not available
Georgia D 1981-2001, 2003-2010 75-89
Germany B 1969-1978, 1980-2011 2011 90-100
Ghana F 1958, 1960, 1967-1971, 1999
Greece A 1951-2012 2012 90-100
Grenada B 1950-1969, 1974-1978, 1985, 1988-2010 2010 90-100
Guatemala D 1950-1981, 1983-2009 75-89
Guinea F Not available
Guinea-Bissau E 1966, 1969-1970
Guyana B 1950-1961, 1969-1971, 1974-1977, 1979, 1984, 1988-2008 2008 75-89
Haiti E 1950-1981, 1983, 1997, 1999, 2001-2004
Honduras D 1950-1983, 1987-1990
Hungary B 1950-2011 2011 90-100
Iceland A 1950-2012 2012 90-100
World Health Organization Page 21
Country Mortality Method Group
Civil registration data
Availability Last year used Estimated coverage (%)
India D 1971-2010 (Sample Registration System) 75-89
Indonesia D Not available
Iran (Islamic Republic of) D 1983-1984, 1999-2001, 2002-2004 (partial Vital Registration), 2005-2008
Iraq D 1955, 1958-1969, 1976-1977, 1987-1989, 2008
Ireland B 1950-2011 2011 90-100
Israel A 1953-2012 2012 90-100
Italy B 1950-2009 2009 90-100
Jamaica F 1960-1991, 1992, 1994-2005 90-100
Japan B 1950-2011 2010 90-100
Jordan D 1953-1957, 1959-1974, 1976-1980, 1998, 2001, 2003-2004, 2008
Kazakhstan B 1981-2010 2010 75-89
Kenya F 1960-1963, 1968-1973
Kiribati D 1991-2001 75-89
Kuwait B 1962-1989, 1991-2010 2010 90-100
Kyrgyzstan B 1981-2010 2010 90-100
Lao People's Democratic Republic D Not available
Latvia B 1980-2011 2011 90-100
Lebanon D 1997-1999
Lesotho F Not available
Liberia F 1970
Libya D 1972-1976, 1981
Lithuania A 1968-2012 2012 90-100
Luxembourg B 1950-2011 2011 90-100
Madagascar D 1955, 1957-1961, 1964-1968, 1971-1972
Malawi F 1971, 1977, 1998
Malaysia B 1970-1979, 1982-2009 2009 90-100
Maldives A 1978-2012 2012 75-89
Mali E Not available
Malta A 1955-2012 2012 90-100
Marshall Islands D 1986-2006 50-74
Mauritania D Not available
Mauritius B 1957-2011 2011 90-100
World Health Organization Page 22
Country Mortality Method Group
Civil registration data
Availability Last year used Estimated coverage (%)
Mexico A 1950-2012 2012 90-100
Micronesia (Federated States of) D 1986-1994
Monaco C 1981-1983, 1986-1987, 2008-2010. 1990-2010 from Languedoc-Roussillon and Provence-Alpes-Côte d'Azur.
1987 25-49
Mongolia D 1987-2010 90-100
Montenegro B 1985-2011 2011 90-100
Morocco D 1990-1998, 2008
Mozambique F 1961-1969, 1971-1973, 1997
Myanmar D 1977-1978, 1987-2008 (urban)
Namibia F Not available
Nauru D 1965-1968, 1978, 1993-1995, 1997-2002
Nepal D Not available
Netherlands A 1950-2012 2012 90-100
New Zealand B 1950-2010 2010 90-100
Nicaragua B 1950-1965, 1968-1969, 1973-1978, 1987-1994, 1996-2011 2011 50-74
Niger D Not available
Nigeria F Not available
Niue D 1950-1961, 1966-1969, 1973, 1975, 1980-2009
75-89
Norway A 1950-2012 2012 90-100
Oman D 1972, 1975, 1980, 1985, 1990, 1995, 2000-2003, 2005-2010
Pakistan D Not available
Palau D 1985-2006 90-100
Panama B 1950-2009 2009 75-89
Papua New Guinea D 1977, 1980, 1998
Paraguay B 1950-1992, 1994-2010 2010 75-89
Peru B 1950-1992, 1994-2011 2011 50-74
Philippines B 1950-1953, 1956-2005, 2008 2009 90-100
Poland A 1959-2012 2012 90-100
Portugal B 1950-2011 2011 90-100
Qatar B 1981-1983, 1985-2011 2011 90-100
Republic of Korea A 1957, 1960, 1962-1967, 1977-2012 2012 90-100
Republic of Moldova A 1981-2012 2012 90-100
Romania B 1956-2010 2010 90-100
World Health Organization Page 23
Country Mortality Method Group
Civil registration data
Availability Last year used Estimated coverage (%)
Russian Federation B 1980-2010 2010 90-100
Rwanda F Not available
Saint Kitts and Nevis B 1950-2008 2008 90-100
Saint Lucia B 1950-1961, 1963, 1968-2006 2006 90-100
Saint Vincent and the Grenadines B 1950-1956, 1960-1964, 1970-2009 2009 90-100
Samoa D 1955-1970, 1973-1976, 1978, 1980, 1992-1993, 2000, 2002
San Marino B 1962, 1964-1978, 1980-2007 2007 90-100
Sao Tome and Principe D 1984-1985, 1987
Saudi Arabia D 2000-2006, 2009
Senegal D Not available
Serbia B 1985-2011 2011 90-100
Seychelles B 1952-1959, 1961-2009, 2011 2011 90-100
Sierra Leone E Not available
Singapore A 1955-2012 2012 90-100
Slovakia B 1982-2011 2011 90-100
Slovenia B 1982-2011 2011 90-100
Solomon Islands D 1990-1991, 1999 (incomplete)
Somalia D Not available
South Africa F 1968-1979, 1980-1982, 1984-2009 75-89
South Sudan F Not available
Spain A 1950-2012 2012 90-100
Sri Lanka B 1950-1968, 1975-2007, 2009 2009 50-74
Sudan D Not available
Suriname B 1950-1957, 1961-1966, 1971-1973, 1975-2009 2009 90-100
Swaziland E Not available
Sweden A 1950-2012 2012 90-100
Switzerland B 1950-2011 2011 90-100
Syrian Arab Republic D 1973-1978, 1980-1981, 1983-1985, 1998-2009 (Vital Registration/hospitals/funeral offices Data)
Tajikistan B 1981-1982, 1985-2005 2005 75-89
Thailand F 1950-2006 75-89
The former Yugoslav Republic of Macedonia B 1982-2011 2011 90-100
World Health Organization Page 24
Country Mortality Method Group
Civil registration data
Availability Last year used Estimated coverage (%)
Timor-Leste D Not available
Togo F 1961
Tonga B 1957-1964, 1966, 1992-2003 2003 75-89
Trinidad and Tobago D 1950-2008 90-100
Tunisia B 1960, 1968-1974, 1976-1980, 1987-1989, 1991-2000, 2008 2000 75-89
Turkey D 1967, 1990-2000, 2003-2010
Turkmenistan B 1981-1982, 1985-1998 1998 75-89
Tuvalu D 1991-2005 75-89
Uganda F Not available
Ukraine B 1981-2011 2011 90-100
United Arab Emirates D 1992-2008
United Kingdom B 1950-2011 2011 90-100
United Republic of Tanzania F Not available
United States of America B 1950-2010 2010 90-100
Uruguay B 1950-2004, 2007-2009 2009 90-100
Uzbekistan B 1981-2005 2005 90-100
Vanuatu D Not available
Venezuela (Bolivarian Republic of) B 1950-2007 2007 90-100
Viet Nam D 2007-2008, 2009, 2011
Yemen D Not available
Zambia F 1999-2000
Zimbabwe F 1950, 1952, 1957-1962, 1965-1967, 1969, 1982, 1986, 1990-1996, 1998, 2002
Related Documents