White certificates in industry: the Italian experience Dario Di Santo, FIRE, Roma, Italy Giuseppe Tomassetti, FIRE, Roma, Italy Enrico Biele, FIRE, Roma, Italy Stefano D'Ambrosio, FIRE, Roma, Italy Abstract The Italian white certificates scheme (WhC) has been in place for nine years and a lot of experience has been gathered. More than this, it has become an effective mechanism, mostly based on measured energy savings, to promote and implement energy efficiency in industry. The scheme is based on an energy efficiency obligation, imposed on electricity and gas distributors, and on a tradable market for certificates, thus acting as an incentive for medium and large end-users and energy service companies (the voluntary parties). The WhC targets shall reach 7.6 Mtoe/year in 2016 and are expected to cover around 60% of the national target set by the EU Energy Efficiency directive (2012/27/EU). After the first phase dominated by deemed saving projects - in particular CFL lamps and other civil sector applications - "progetti a consuntivo" (a.k.a. monitoring plans) in the industrial sector have started to rise under the effect of the "tau" coefficient, the multiplier introduced in 2011 that adds to the yearly additional savings the discounted future savings for technologies with a lifespan of more than 5 years (WhCs are usually released for a lifetime of 5 years). The result has been dramatic: in 2013 around 95% of the certificates due to new projects were related to energy efficiency in the industrial sector. The paper shows in detail this transformation and how a WhC scheme has been able to become effective for industrial energy efficiency projects. The paper is based on extensive research carried on by the Italian Federation for the Rational Use of Energy (FIRE) on monitoring plans, under a contract with ENEA, the Italian national energy agency. The Italian white certificates scheme: how it works The Italian WhC scheme 1 was created in 2001, but started effectively in 2005, with the opening of the market to exchange the certificates among obliged and voluntary parties. Its main purpose is to promote energy efficiency among end-users, but other important objectives include to strengthen the ESCO market and to permit the accounting of the energy savings. In the transposition of the 2012/27/EU directive (legislative decree 4 July 2014 n. 102) the WhC scheme is addressed as the policy measure to implement art. 7, and it is expected to give a contribution to 60% of the national target in 2020 (as indicated in the notification from the Italian government to the European Commission on December 2013. It acts both as an energy efficiency obligation scheme and as an incentive, due to the presence of a market to trade white certificates. The system is based on the obligation, imposed on electricity and natural gas distributors with more than 50,000 customers, to meet specific targets, expressed as primary energy savings and increasing over the years as shown in Figure 1. These savings can be achieved through energy efficiency actions among end-users and are assessed using tons of oil equivalent (toe) as measurement unit 2 . 1 The scheme is also known as TEE, acronym of the Italian legislative definition “titoli di efficienza energetica”, meaning “energy efficiency certificates”. 2 The saving are expressed in primary energy. Conversion factors used within the scheme are 0.187 toe/MWh e and 0.086 toe/MWh t .

Welcome message from author
This document is posted to help you gain knowledge. Please leave a comment to let me know what you think about it! Share it to your friends and learn new things together.
Transcript
White certificates in industry: the Italian experience
Dario Di Santo, FIRE, Roma, Italy Giuseppe Tomassetti, FIRE, Roma, Italy
Enrico Biele, FIRE, Roma, Italy Stefano D'Ambrosio, FIRE, Roma, Italy
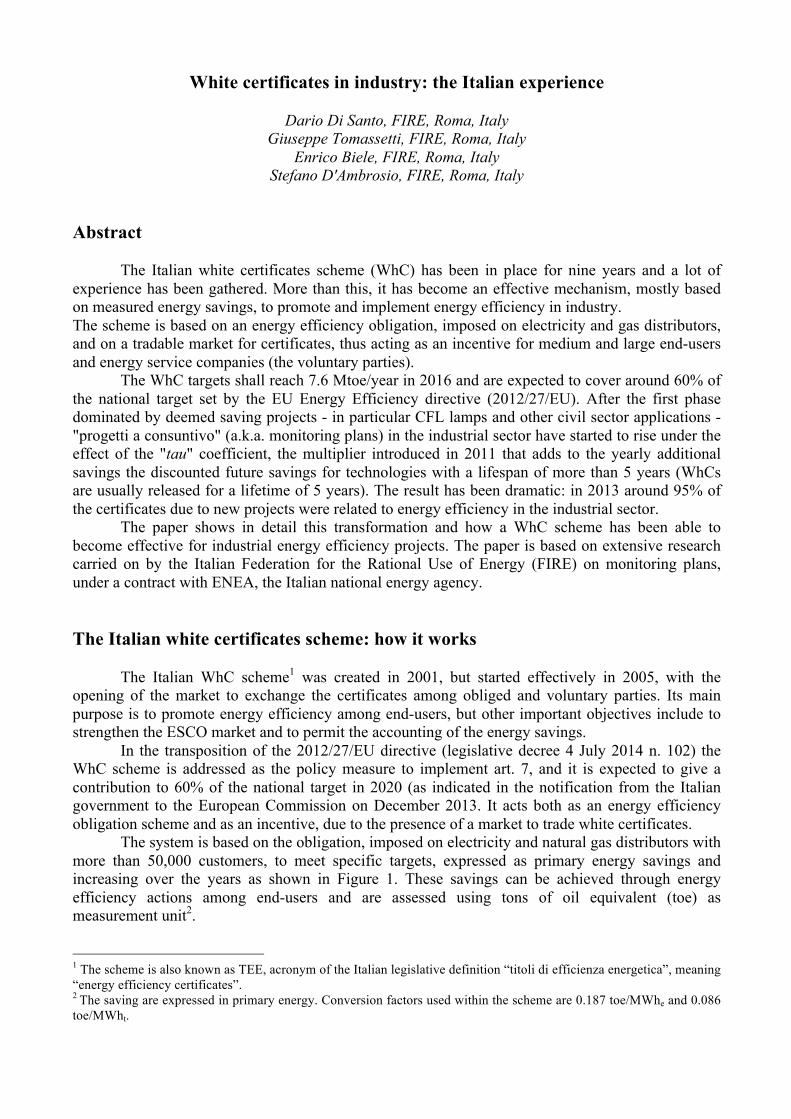
Abstract The Italian white certificates scheme (WhC) has been in place for nine years and a lot of experience has been gathered. More than this, it has become an effective mechanism, mostly based on measured energy savings, to promote and implement energy efficiency in industry. The scheme is based on an energy efficiency obligation, imposed on electricity and gas distributors, and on a tradable market for certificates, thus acting as an incentive for medium and large end-users and energy service companies (the voluntary parties). The WhC targets shall reach 7.6 Mtoe/year in 2016 and are expected to cover around 60% of the national target set by the EU Energy Efficiency directive (2012/27/EU). After the first phase dominated by deemed saving projects - in particular CFL lamps and other civil sector applications - "progetti a consuntivo" (a.k.a. monitoring plans) in the industrial sector have started to rise under the effect of the "tau" coefficient, the multiplier introduced in 2011 that adds to the yearly additional savings the discounted future savings for technologies with a lifespan of more than 5 years (WhCs are usually released for a lifetime of 5 years). The result has been dramatic: in 2013 around 95% of the certificates due to new projects were related to energy efficiency in the industrial sector. The paper shows in detail this transformation and how a WhC scheme has been able to become effective for industrial energy efficiency projects. The paper is based on extensive research carried on by the Italian Federation for the Rational Use of Energy (FIRE) on monitoring plans, under a contract with ENEA, the Italian national energy agency. The Italian white certificates scheme: how it works The Italian WhC scheme1 was created in 2001, but started effectively in 2005, with the opening of the market to exchange the certificates among obliged and voluntary parties. Its main purpose is to promote energy efficiency among end-users, but other important objectives include to strengthen the ESCO market and to permit the accounting of the energy savings. In the transposition of the 2012/27/EU directive (legislative decree 4 July 2014 n. 102) the WhC scheme is addressed as the policy measure to implement art. 7, and it is expected to give a contribution to 60% of the national target in 2020 (as indicated in the notification from the Italian government to the European Commission on December 2013. It acts both as an energy efficiency obligation scheme and as an incentive, due to the presence of a market to trade white certificates. The system is based on the obligation, imposed on electricity and natural gas distributors with more than 50,000 customers, to meet specific targets, expressed as primary energy savings and increasing over the years as shown in Figure 1. These savings can be achieved through energy efficiency actions among end-users and are assessed using tons of oil equivalent (toe) as measurement unit2.
1 The scheme is also known as TEE, acronym of the Italian legislative definition “titoli di efficienza energetica”, meaning “energy efficiency certificates”. 2 The saving are expressed in primary energy. Conversion factors used within the scheme are 0.187 toe/MWhe and 0.086 toe/MWht.
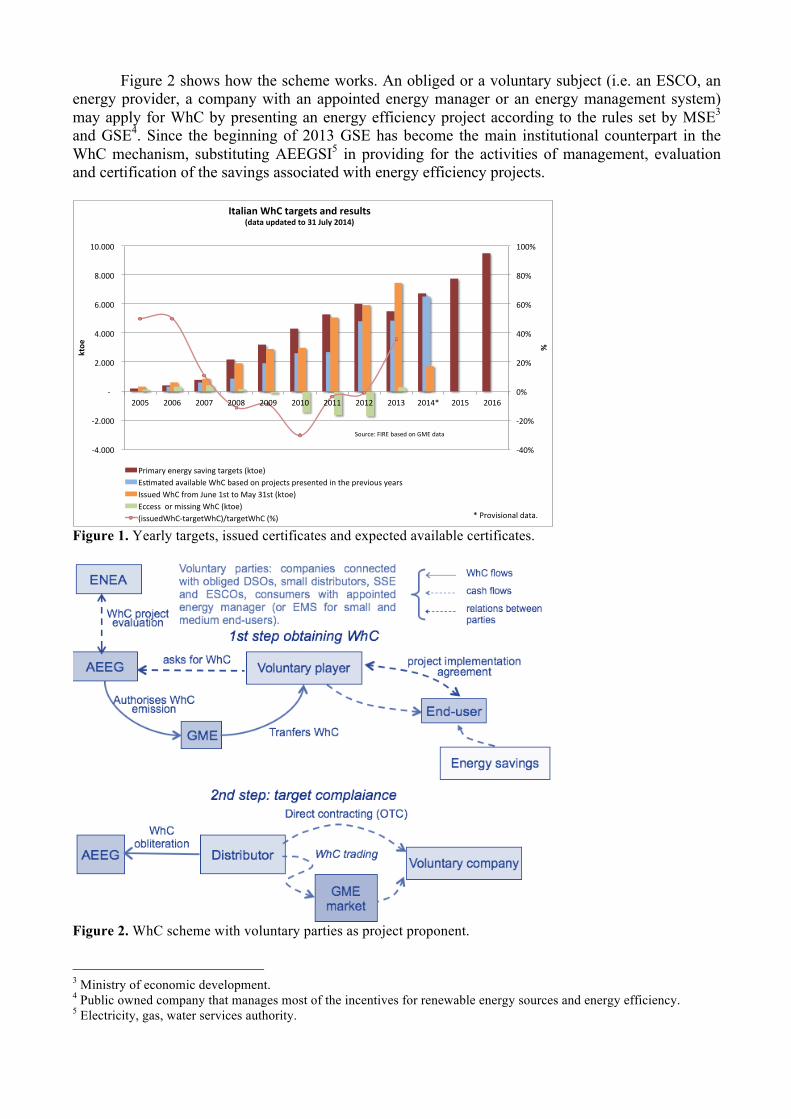
Figure 2 shows how the scheme works. An obliged or a voluntary subject (i.e. an ESCO, an energy provider, a company with an appointed energy manager or an energy management system) may apply for WhC by presenting an energy efficiency project according to the rules set by MSE3 and GSE4. Since the beginning of 2013 GSE has become the main institutional counterpart in the WhC mechanism, substituting AEEGSI5 in providing for the activities of management, evaluation and certification of the savings associated with energy efficiency projects.
Figure 1. Yearly targets, issued certificates and expected available certificates.
Figure 2. WhC scheme with voluntary parties as project proponent.
3 Ministry of economic development. 4 Public owned company that manages most of the incentives for renewable energy sources and energy efficiency. 5 Electricity, gas, water services authority.
!40%%
!20%%
0%%
20%%
40%%
60%%
80%%
100%%
!4.000%%
!2.000%%
%!%%%%
%2.000%%
%4.000%%
%6.000%%
%8.000%%
%10.000%%
2005% 2006% 2007% 2008% 2009% 2010% 2011% 2012% 2013% 2014*% 2015% 2016%
%"
ktoe
"
Italian"WhC"targets"and"results"(data"updated"to"31"July"2014)"
Primary%energy%saving%targets%(ktoe)%EsAmated%available%WhC%based%on%projects%presented%in%the%previous%years%Issued%WhC%from%June%1st%to%May%31st%(ktoe)%Eccess%%or%missing%WhC%(ktoe)%(issuedWhC!targetWhC)/targetWhC%(%)%
Source:%FIRE%based%on%GME%data%
*%Provisional%data.%
Almost every project involving an improved efficiency in the final consumption of energy is eligible under the scheme – from boilers to lighting systems, from solar thermal to cogeneration, from electric motors to industrial process projects – with the exception of projects aimed at increasing efficiency in electricity generation. Each of the eligible projects is expected to issue white certificates for a period of five years (eight years for building envelope related projects and ten years for high efficiency cogeneration). The Italian WhC scheme considers only additional savings (also referred to as “additionality”). It means that a market and regulatory baseline is defined for every technology. Savings are first evaluated as the difference between the ex-ante and ex-post situations and then reduced if the ex-ante level is below the baseline. If the project is approved the proponent receives from GME6 a number of WhC corresponding to the recognized savings on its account (one White Certificate equals to one toe of additional savings). The certificates can then be traded with obliged parties (or, if obtained by distributors, directly used to fulfil their targets). See (Di Santo et al. 2011; Di Santo, Forni & Biele 2012; Di Santo et al. 2014) for more information about the scheme basis. Savings evaluation, monitoring and verification There are three methods to evaluate the savings:
• Deemed savings projects are projects that don't require meters because the savings are recognised depending on the number of installed units (e.g. number of lamps or small boilers, square meters of solar thermal collectors, kW of installed high efficiency engines, etc.). The corresponding savings are indicated in the related file issued by the GSE, which also set the baseline for the additionality, the corrective factors (e.g. geographical location, climate zone, etc.), and the documentation that shall be presented by the proponent.
• Simplified monitoring projects are projects that require one or more meters and whose savings are granted based on the monitoring plan indicated in the related file issued by the GSE, which also set the baseline for the additionality, the algorithm to calculate the savings, and the documentation that shall be presented by the proponent;
• Monitoring plans projects are projects for which deemed savings and simplified monitoring projects are not applicable. In this case the proponent shall previously present a proposal that defines the baseline for additionality, the algorithm to evaluate the savings, the required meters, and the documentation to be presented for the energy efficiency project (known as a PPPM). After the PPPM is approved by GSE the proponent can seek the WhC.
• Documentation and on-site controls are provided to verify the correctness of the proposals and to avoid frauds.
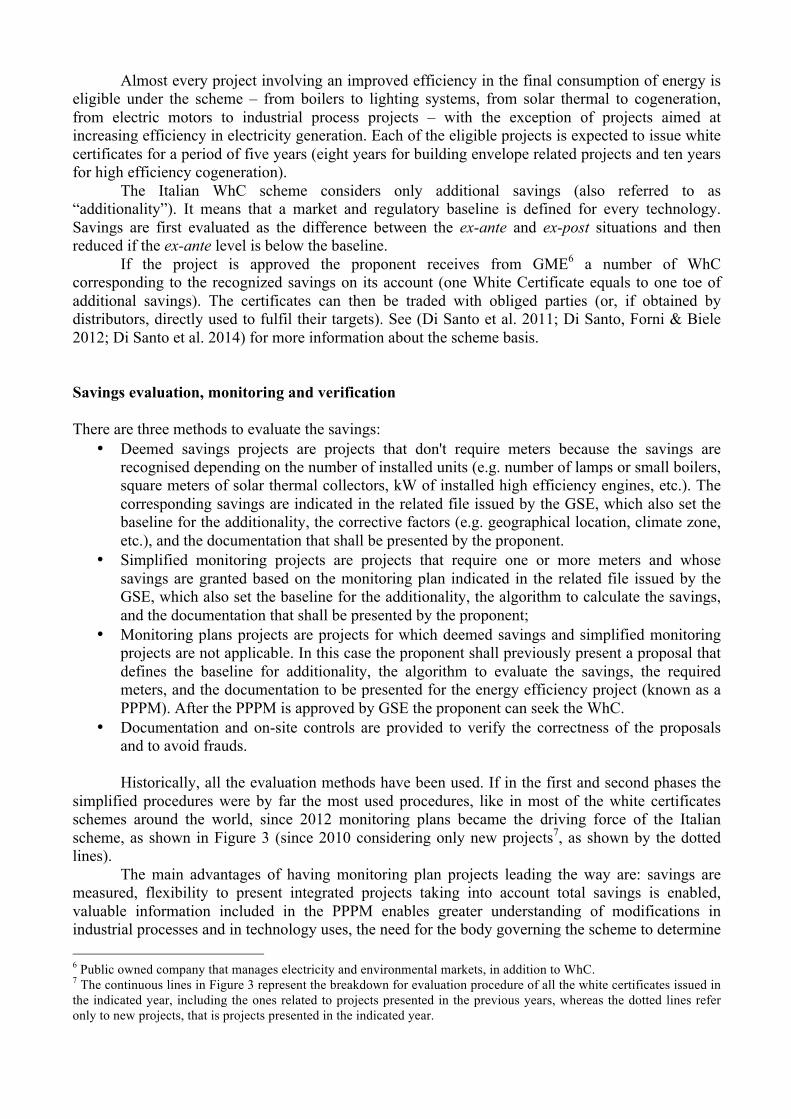
Historically, all the evaluation methods have been used. If in the first and second phases the simplified procedures were by far the most used procedures, like in most of the white certificates schemes around the world, since 2012 monitoring plans became the driving force of the Italian scheme, as shown in Figure 3 (since 2010 considering only new projects7, as shown by the dotted lines). The main advantages of having monitoring plan projects leading the way are: savings are measured, flexibility to present integrated projects taking into account total savings is enabled, valuable information included in the PPPM enables greater understanding of modifications in industrial processes and in technology uses, the need for the body governing the scheme to determine 6 Public owned company that manages electricity and environmental markets, in addition to WhC. 7 The continuous lines in Figure 3 represent the breakdown for evaluation procedure of all the white certificates issued in the indicated year, including the ones related to projects presented in the previous years, whereas the dotted lines refer only to new projects, that is projects presented in the indicated year.
in advance market baselines, metering systems and saving algorithms for every technology and solution is reduced. Monitoring plans are complex to present, but with an adequate information and training support actions market players can learn how to deal with them. In a scheme with high saving objectives, as the Italian one, it is quite difficult to manage the growing targets with deemed savings projects. Monitoring plans played a very important role in fulfilling the savings goals set by the National energy efficiency action plans. The reason behind their fast growth since 2012, despite the complexity, is the important economic value associated with white certificates starting from the introduction of the tau coefficient that is described in the next chapter.
Figure 3. Breakdown of issued certificates by saving evaluation methodology.
Italian WhC economics The Italian scheme is both an EEO, with the Distribution System Operators (DSOs) acting as obliged parties, and an incentive for the voluntary parties (energy service providers and medium and large consumers) based on the possibility to trade white certificates on the market. As an EEO, the WhC scheme contributes to the 2020 energy efficiency targets (Figure 3). The global target in Italy has been set around 20 Mtoe/year, of which 60% is expected to be linked to the WhC scheme (those targets are presently set till 2016). As an incentive, it is working well especially where the energy efficiency project is fully additional, as happens many times in the industrial sector for process enhancements. This is helping end-users to implement forgotten or set aside projects and companies acting as voluntary parties to strengthen and evolve toward the ESCO model. An important driver with tradable WhC is the price of the certificates and its trend over time. The Italian experience can be divided in four phases. During the first phase the mix of low targets and availability of deemed savings for compact fluorescent lamps determined a strong excess of certificates on the market and thus a fall of the WhC price that reached its minimum at around 30 euro/toe. Then, after three years of substantial equilibrium, there was the crisis of the sixth year. The effect of deemed savings was tampered by the elimination of the most favourable technologies, and the system was not yet ready to devote to complex projects that require the use of monitoring plans.
0"
100.000"
200.000"
300.000"
400.000"
500.000"
600.000"
700.000"
800.000"
900.000"
1.000.000"
0"
500.000"
1.000.000"
1.500.000"
2.000.000"
2.500.000"
3.000.000"
3.500.000"
4.000.000"
4.500.000"
5.000.000"
2006" 2007" 2008" 2009" 2010" 2011" 2012" 2013"
Savings(related(to(new(projects((toe)(
Total(savings((toe
)(
Breakdown(of(issued(WhC(by(saving(evalua?on(methodology(
Deemed"savings"projects" Simplified"monitoring"projects" Monitoring"plan"projects"New"deemed"savings"projects" New"simplified"monitoring"projects" New"monitoring"plan"projects"
Source:"FIRE"on"GSE"data."
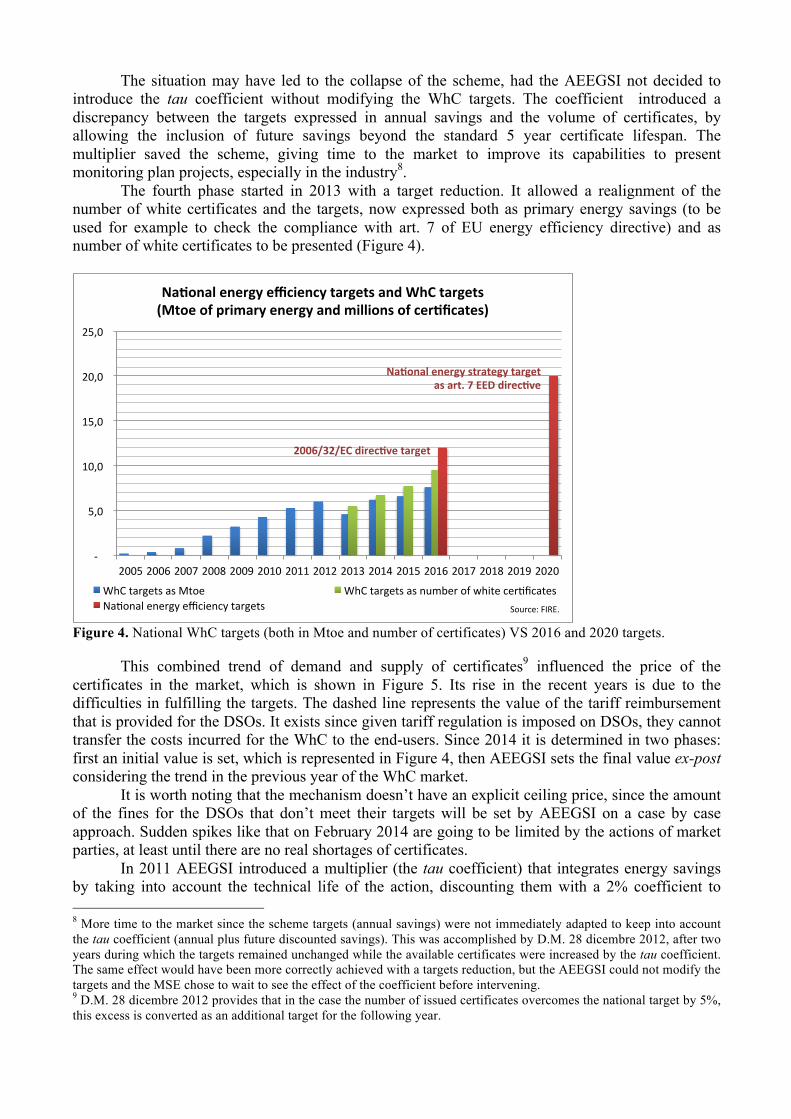
The situation may have led to the collapse of the scheme, had the AEEGSI not decided to introduce the tau coefficient without modifying the WhC targets. The coefficient introduced a discrepancy between the targets expressed in annual savings and the volume of certificates, by allowing the inclusion of future savings beyond the standard 5 year certificate lifespan. The multiplier saved the scheme, giving time to the market to improve its capabilities to present monitoring plan projects, especially in the industry8. The fourth phase started in 2013 with a target reduction. It allowed a realignment of the number of white certificates and the targets, now expressed both as primary energy savings (to be used for example to check the compliance with art. 7 of EU energy efficiency directive) and as number of white certificates to be presented (Figure 4).
Figure 4. National WhC targets (both in Mtoe and number of certificates) VS 2016 and 2020 targets.
This combined trend of demand and supply of certificates9 influenced the price of the certificates in the market, which is shown in Figure 5. Its rise in the recent years is due to the difficulties in fulfilling the targets. The dashed line represents the value of the tariff reimbursement that is provided for the DSOs. It exists since given tariff regulation is imposed on DSOs, they cannot transfer the costs incurred for the WhC to the end-users. Since 2014 it is determined in two phases: first an initial value is set, which is represented in Figure 4, then AEEGSI sets the final value ex-post considering the trend in the previous year of the WhC market. It is worth noting that the mechanism doesn’t have an explicit ceiling price, since the amount of the fines for the DSOs that don’t meet their targets will be set by AEEGSI on a case by case approach. Sudden spikes like that on February 2014 are going to be limited by the actions of market parties, at least until there are no real shortages of certificates.
In 2011 AEEGSI introduced a multiplier (the tau coefficient) that integrates energy savings by taking into account the technical life of the action, discounting them with a 2% coefficient to 8 More time to the market since the scheme targets (annual savings) were not immediately adapted to keep into account the tau coefficient (annual plus future discounted savings). This was accomplished by D.M. 28 dicembre 2012, after two years during which the targets remained unchanged while the available certificates were increased by the tau coefficient. The same effect would have been more correctly achieved with a targets reduction, but the AEEGSI could not modify the targets and the MSE chose to wait to see the effect of the coefficient before intervening. 9 D.M. 28 dicembre 2012 provides that in the case the number of issued certificates overcomes the national target by 5%, this excess is converted as an additional target for the following year.
!"!!!!
!5,0!!
!10,0!!
!15,0!!
!20,0!!
!25,0!!
2005!2006!2007!2008!2009!2010!2011!2012!2013!2014!2015!2016!2017!2018!2019!2020!
Na#onal'energy'efficiency'targets'and'WhC'targets''(Mtoe'of'primary'energy'and'millions'of'cer#ficates)'
WhC!targets!as!Mtoe! WhC!targets!as!number!of!white!cerAficates!NaAonal!energy!efficiency!targets! Source:!FIRE.!
Na#onal'energy'strategy'target'as'art.'7'EED'direc#ve'
2006/32/EC'direc#ve'target'
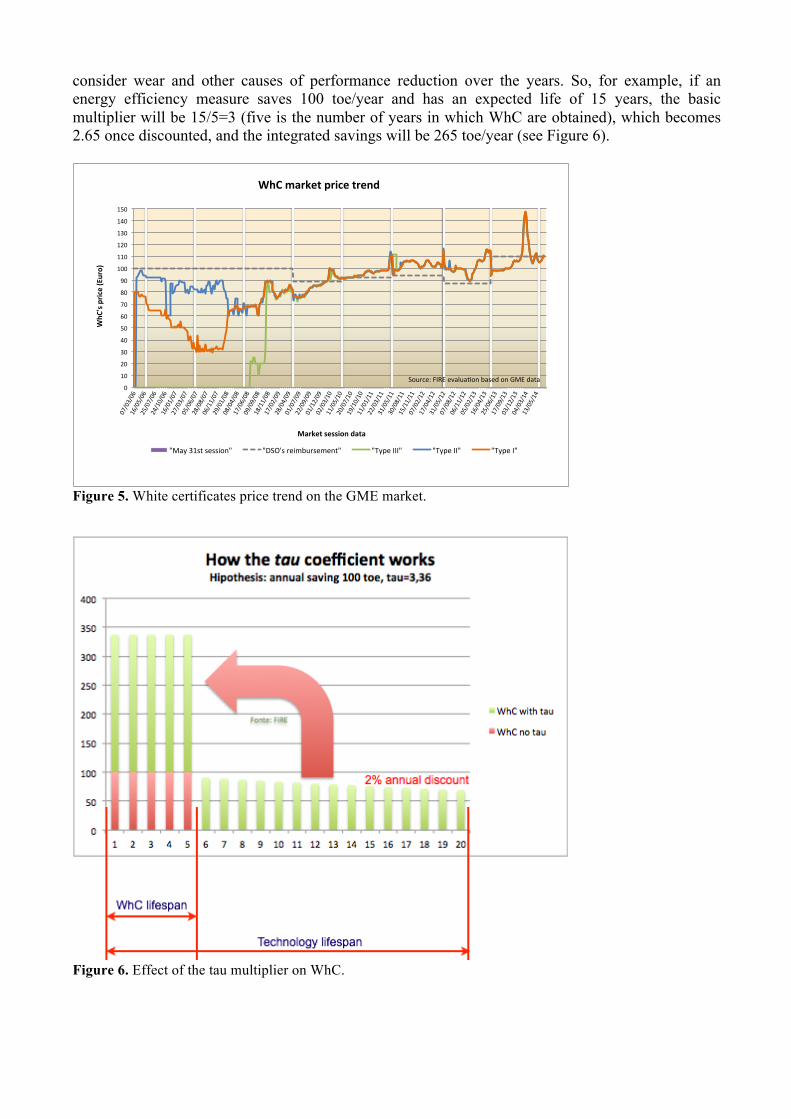
consider wear and other causes of performance reduction over the years. So, for example, if an energy efficiency measure saves 100 toe/year and has an expected life of 15 years, the basic multiplier will be 15/5=3 (five is the number of years in which WhC are obtained), which becomes 2.65 once discounted, and the integrated savings will be 265 toe/year (see Figure 6).
Figure 5. White certificates price trend on the GME market.
Figure 6. Effect of the tau multiplier on WhC.
0"
10"
20"
30"
40"
50"
60"
70"
80"
90"
100"
110"
120"
130"
140"
150"
07/03/06"
16/05/06"
25/07/06"
24/10/06"
16/01/07"
27/03/07"
05/06/07"
28/08/07"
06/11/07"
29/01/08"
08/04/08"
17/06/08"
09/09/08"
18/11/08"
17/02/09"
28/04/09"
01/07/09"
22/09/09"
01/12/09"
02/03/10"
11/05/10"
20/07/10"
19/10/10"
11/01/11"
22/03/11"
31/05/11"
30/08/11"
15/11/11"
07/02/12"
17/04/12"
31/05/12"
07/08/12"
06/11/12"
05/02/13"
16/04/13"
25/06/13"
17/09/13"
03/12/13"
04/03/14"
13/05/14"
WhC
's&price&(Euro)&
Market&session&data&
WhC&market&price&trend&
"May"31st"session"" "DSO's"reimbursement"" "Type"III"" "Type"II"" "Type"I""
Source:"FIRE"evaluaIon"based"on"GME"data"
In this example the energy efficiency measure will get in its “WhC life” 265x5=1,325 toe VS 100x5=500 toe/year of the previous rules considering only yearly savings. The coefficients vary with the solution implemented, ranging from 1.00 to 4.58. The capability of the scheme to promote the implementation of projects that otherwise would not be realised varies a lot depending on the economic performance of the considered technology and its additionality, as discussed for deemed savings in (Di Santo 2010; Di Santo et al. 2011). Generally speaking, the coefficient helps longer term projects to be more attractive, but the main driver is the pay back-time of the investment combined with the additionality, as shown by the calculation illustrated below. The ratio between the incentive cumulated on the 5 years lifetime and discounted at 5% and the capital cost of the energy efficiency investment (CAPEX) can be used as an indicator of this type of performance. It can be quite interesting, especially where full additionality is recognised to the project. Thus it can be defined the following indicator:
!!!!! =!!!!"#$(!!!)!
!!!!
!"#$% = !.!!×!!!!"#$!"#$%
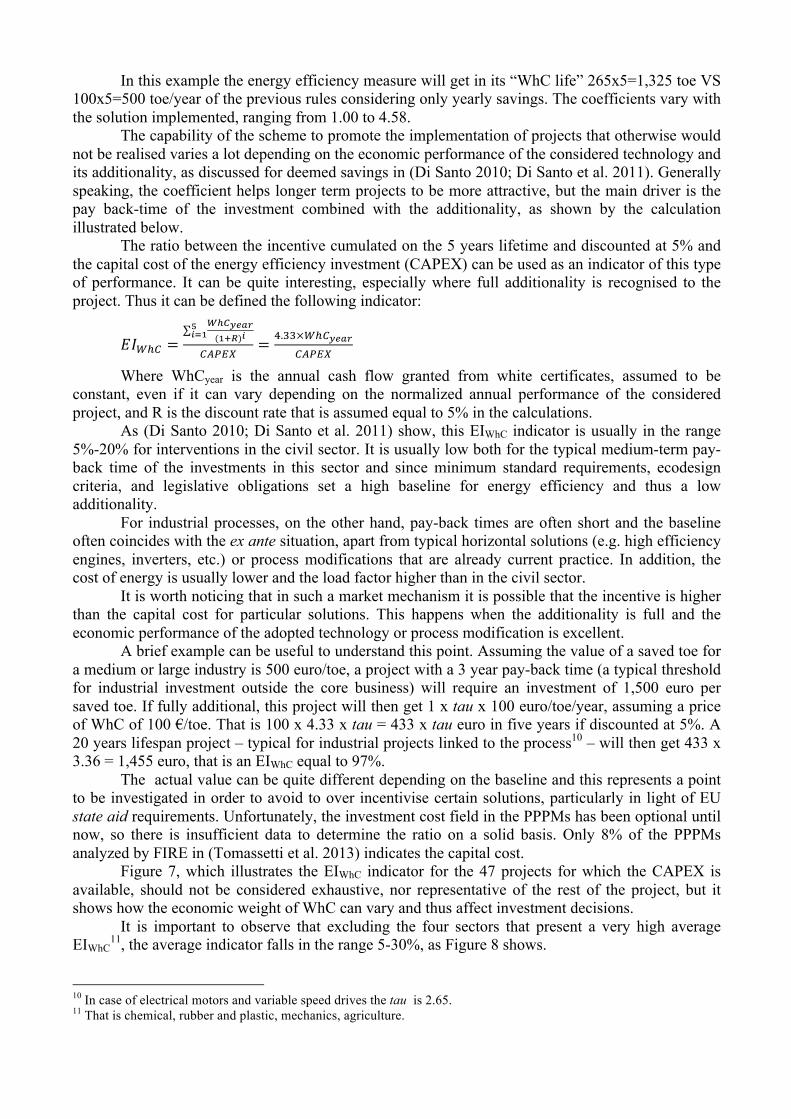
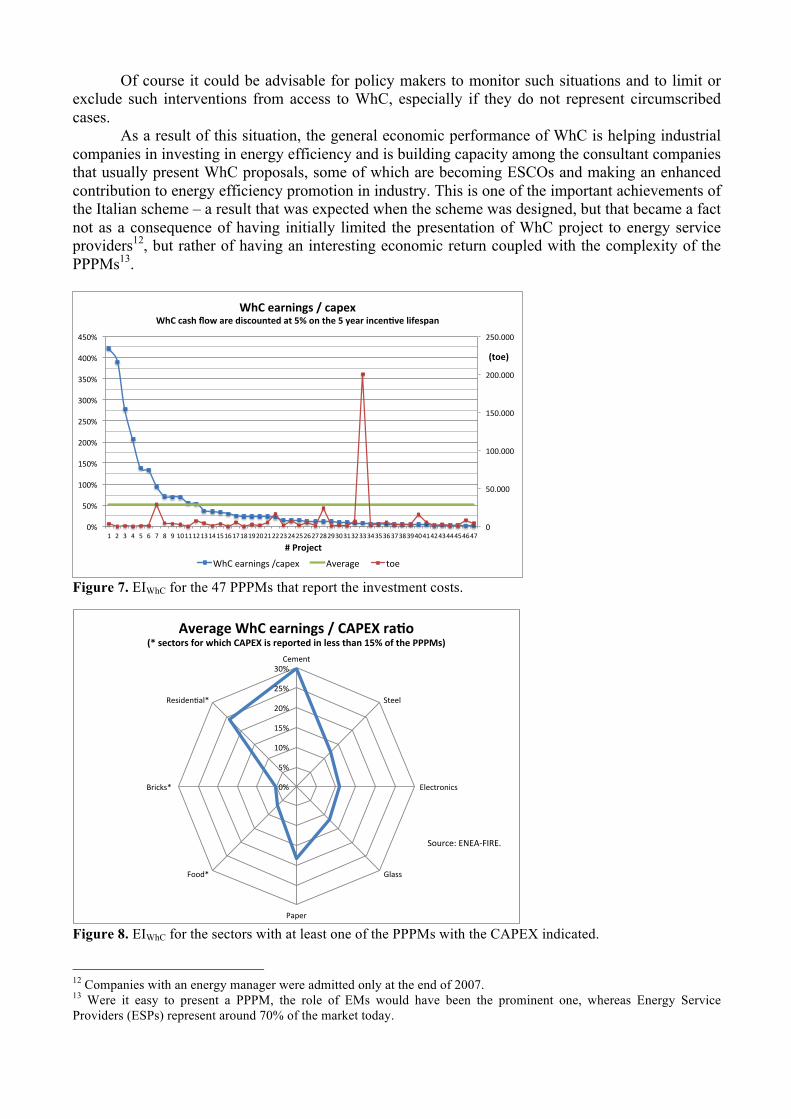
Where WhCyear is the annual cash flow granted from white certificates, assumed to be constant, even if it can vary depending on the normalized annual performance of the considered project, and R is the discount rate that is assumed equal to 5% in the calculations. As (Di Santo 2010; Di Santo et al. 2011) show, this EIWhC indicator is usually in the range 5%-20% for interventions in the civil sector. It is usually low both for the typical medium-term pay-back time of the investments in this sector and since minimum standard requirements, ecodesign criteria, and legislative obligations set a high baseline for energy efficiency and thus a low additionality. For industrial processes, on the other hand, pay-back times are often short and the baseline often coincides with the ex ante situation, apart from typical horizontal solutions (e.g. high efficiency engines, inverters, etc.) or process modifications that are already current practice. In addition, the cost of energy is usually lower and the load factor higher than in the civil sector. It is worth noticing that in such a market mechanism it is possible that the incentive is higher than the capital cost for particular solutions. This happens when the additionality is full and the economic performance of the adopted technology or process modification is excellent. A brief example can be useful to understand this point. Assuming the value of a saved toe for a medium or large industry is 500 euro/toe, a project with a 3 year pay-back time (a typical threshold for industrial investment outside the core business) will require an investment of 1,500 euro per saved toe. If fully additional, this project will then get 1 x tau x 100 euro/toe/year, assuming a price of WhC of 100 €/toe. That is 100 x 4.33 x tau = 433 x tau euro in five years if discounted at 5%. A 20 years lifespan project – typical for industrial projects linked to the process10 – will then get 433 x 3.36 = 1,455 euro, that is an EIWhC equal to 97%. The actual value can be quite different depending on the baseline and this represents a point to be investigated in order to avoid to over incentivise certain solutions, particularly in light of EU state aid requirements. Unfortunately, the investment cost field in the PPPMs has been optional until now, so there is insufficient data to determine the ratio on a solid basis. Only 8% of the PPPMs analyzed by FIRE in (Tomassetti et al. 2013) indicates the capital cost. Figure 7, which illustrates the EIWhC indicator for the 47 projects for which the CAPEX is available, should not be considered exhaustive, nor representative of the rest of the project, but it shows how the economic weight of WhC can vary and thus affect investment decisions. It is important to observe that excluding the four sectors that present a very high average EIWhC
11, the average indicator falls in the range 5-30%, as Figure 8 shows.
10 In case of electrical motors and variable speed drives the tau is 2.65. 11 That is chemical, rubber and plastic, mechanics, agriculture.
Of course it could be advisable for policy makers to monitor such situations and to limit or exclude such interventions from access to WhC, especially if they do not represent circumscribed cases. As a result of this situation, the general economic performance of WhC is helping industrial companies in investing in energy efficiency and is building capacity among the consultant companies that usually present WhC proposals, some of which are becoming ESCOs and making an enhanced contribution to energy efficiency promotion in industry. This is one of the important achievements of the Italian scheme – a result that was expected when the scheme was designed, but that became a fact not as a consequence of having initially limited the presentation of WhC project to energy service providers12, but rather of having an interesting economic return coupled with the complexity of the PPPMs13.
Figure 7. EIWhC for the 47 PPPMs that report the investment costs.
Figure 8. EIWhC for the sectors with at least one of the PPPMs with the CAPEX indicated.
12 Companies with an energy manager were admitted only at the end of 2007. 13 Were it easy to present a PPPM, the role of EMs would have been the prominent one, whereas Energy Service Providers (ESPs) represent around 70% of the market today.
0"
50.000"
100.000"
150.000"
200.000"
250.000"
0%"
50%"
100%"
150%"
200%"
250%"
300%"
350%"
400%"
450%"
1" 2" 3" 4" 5" 6" 7" 8" 9"10"11"12"13"14"15"16"17"18"19"20"21"22"23"24"25"26"27"28"29"30"31"32"33"34"35"36"37"38"39"40"41"42"43"44"45"46"47"
(toe)&
#&Project&
WhC&earnings&/&capex&WhC&cash&flow&are&discounted&at&5%&on&the&5&year&incen>ve&lifespan&
WhC"earnings"/capex" Average" toe"
0%#
5%#
10%#
15%#
20%#
25%#
30%#Cement#
Steel#
Electronics#
Glass#
Paper#
Food*#
Bricks*##
Residen?al*#
Average'WhC'earnings'/'CAPEX'ra2o'(*'sectors'for'which'CAPEX'is'reported'in'less'than'15%'of'the'PPPMs)'
Source:#ENEADFIRE.#
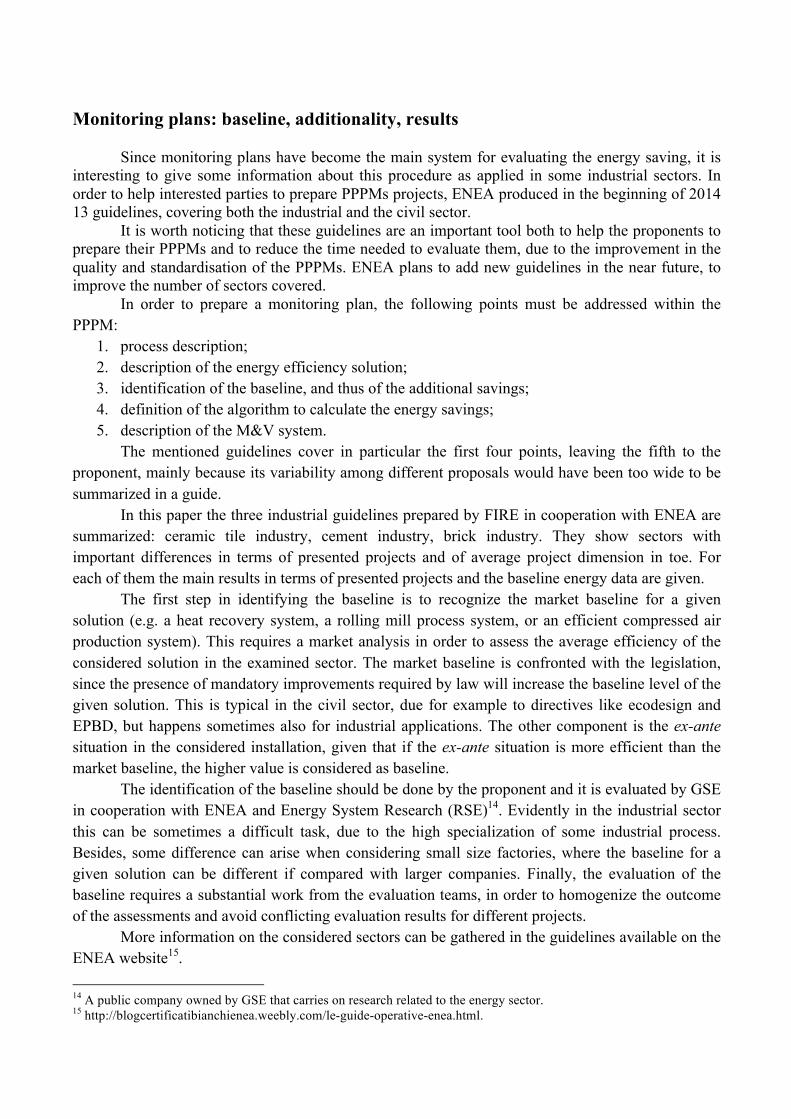
Monitoring plans: baseline, additionality, results Since monitoring plans have become the main system for evaluating the energy saving, it is interesting to give some information about this procedure as applied in some industrial sectors. In order to help interested parties to prepare PPPMs projects, ENEA produced in the beginning of 2014 13 guidelines, covering both the industrial and the civil sector. It is worth noticing that these guidelines are an important tool both to help the proponents to prepare their PPPMs and to reduce the time needed to evaluate them, due to the improvement in the quality and standardisation of the PPPMs. ENEA plans to add new guidelines in the near future, to improve the number of sectors covered. In order to prepare a monitoring plan, the following points must be addressed within the PPPM:
1. process description; 2. description of the energy efficiency solution; 3. identification of the baseline, and thus of the additional savings; 4. definition of the algorithm to calculate the energy savings; 5. description of the M&V system.
The mentioned guidelines cover in particular the first four points, leaving the fifth to the proponent, mainly because its variability among different proposals would have been too wide to be summarized in a guide.
In this paper the three industrial guidelines prepared by FIRE in cooperation with ENEA are summarized: ceramic tile industry, cement industry, brick industry. They show sectors with important differences in terms of presented projects and of average project dimension in toe. For each of them the main results in terms of presented projects and the baseline energy data are given.
The first step in identifying the baseline is to recognize the market baseline for a given solution (e.g. a heat recovery system, a rolling mill process system, or an efficient compressed air production system). This requires a market analysis in order to assess the average efficiency of the considered solution in the examined sector. The market baseline is confronted with the legislation, since the presence of mandatory improvements required by law will increase the baseline level of the given solution. This is typical in the civil sector, due for example to directives like ecodesign and EPBD, but happens sometimes also for industrial applications. The other component is the ex-ante situation in the considered installation, given that if the ex-ante situation is more efficient than the market baseline, the higher value is considered as baseline.
The identification of the baseline should be done by the proponent and it is evaluated by GSE in cooperation with ENEA and Energy System Research (RSE)14. Evidently in the industrial sector this can be sometimes a difficult task, due to the high specialization of some industrial process. Besides, some difference can arise when considering small size factories, where the baseline for a given solution can be different if compared with larger companies. Finally, the evaluation of the baseline requires a substantial work from the evaluation teams, in order to homogenize the outcome of the assessments and avoid conflicting evaluation results for different projects.
More information on the considered sectors can be gathered in the guidelines available on the ENEA website15. 14 A public company owned by GSE that carries on research related to the energy sector. 15 http://blogcertificatibianchienea.weebly.com/le-guide-operative-enea.html.
Ceramic tile industry
The types of ceramic tiles manufactured in the EU are basically similar among the different countries, according to the sectorial Best available techniques Reference (BREF) document (Various authors 2007)16, but some differences can be found in typical characteristics due to local, cultural, functional, formal and technical reasons.
Referring to 2012, there were in Italy 159 companies with 21,500 employees. The overall production in the same year has been 385 million square meters of wall and floor tiles. The 80% of the sales volume was for exports and the investments increased of 14% between 2010 and 2012.
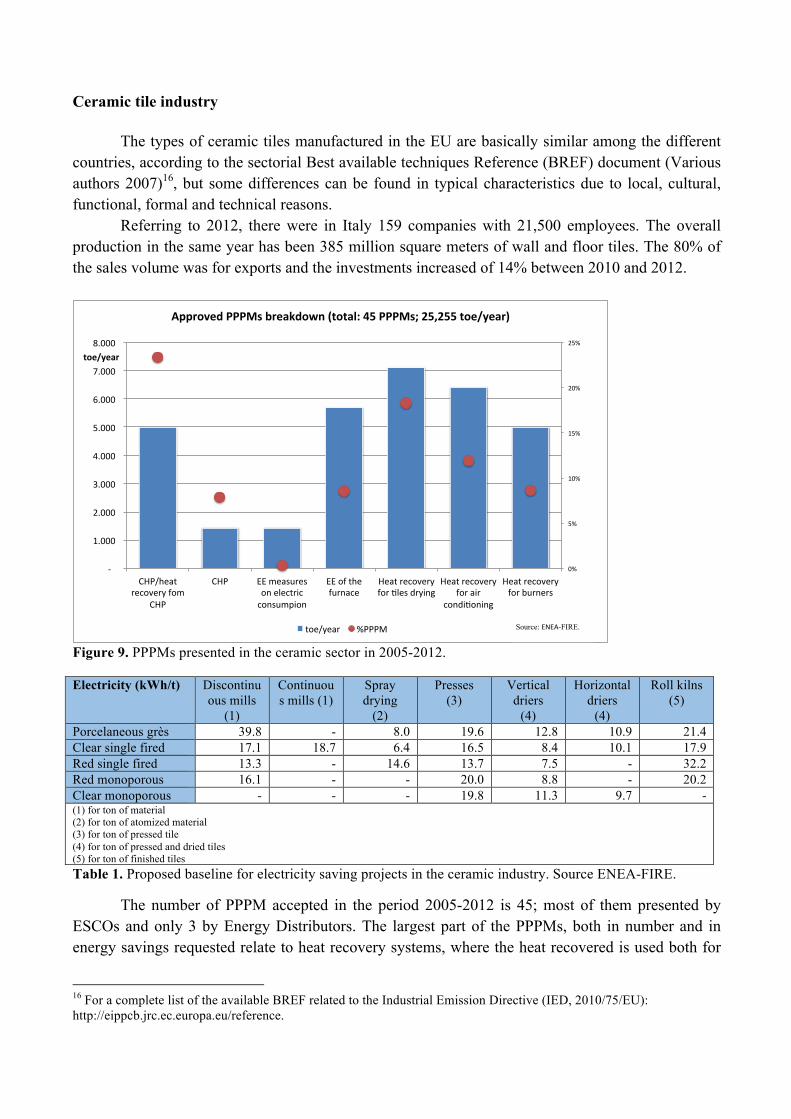
Figure 9. PPPMs presented in the ceramic sector in 2005-2012.
Electricity (kWh/t) Discontinuous mills
(1)
Continuous mills (1)
Spray drying
(2)
Presses (3)
Vertical driers
(4)
Horizontal driers
(4)
Roll kilns (5)
Porcelaneous grès 39.8 - 8.0 19.6 12.8 10.9 21.4 Clear single fired 17.1 18.7 6.4 16.5 8.4 10.1 17.9 Red single fired 13.3 - 14.6 13.7 7.5 - 32.2 Red monoporous 16.1 - - 20.0 8.8 - 20.2 Clear monoporous - - - 19.8 11.3 9.7 - (1) for ton of material (2) for ton of atomized material (3) for ton of pressed tile (4) for ton of pressed and dried tiles (5) for ton of finished tiles Table 1. Proposed baseline for electricity saving projects in the ceramic industry. Source ENEA-FIRE.
The number of PPPM accepted in the period 2005-2012 is 45; most of them presented by ESCOs and only 3 by Energy Distributors. The largest part of the PPPMs, both in number and in energy savings requested relate to heat recovery systems, where the heat recovered is used both for
16 For a complete list of the available BREF related to the Industrial Emission Directive (IED, 2010/75/EU): http://eippcb.jrc.ec.europa.eu/reference.
0%#
5%#
10%#
15%#
20%#
25%#
#'####
#1.000##
#2.000##
#3.000##
#4.000##
#5.000##
#6.000##
#7.000##
#8.000##
CHP/heat#recovery#fom#
CHP#
CHP# EE#measures#on#electric#consumpion#
EE#of#the#furnace#
Heat#recovery#for#Dles#drying#
Heat#recovery#for#air#
condiDoning#
Heat#recovery#for#burners#
toe/year(
Approved(PPPMs(breakdown((total:(45(PPPMs;(25,255(toe/year)(
toe/year# %PPPM# Source: ENEA-FIRE.
process and for services (e.g. air conditioning). An interesting number of PPPMs is related to CHP systems, in particular in terms of toes requested (almost 30% on the total amount of white certificates requested in the tiles industry).
The ceramic sector has been an active one in terms of participation to the WhC scheme. This depends both on a traditional attention to energy management and on a good average dimension of related energy efficiency projects.
The market and the national law have been analyzed in order to give the proponent a scheme with some reference values to adopt in the construction of the PPPM, the so called baseline. These values can be directly used for new plants, but they must be compared to measured values in case of substitution or in case of any energy efficiency measure implemented on an existing system. For all the hypothesis adopted in the guidelines and more details see (Biele 2014). Thermal energy (kWh/t) Spray drying (1) Vertical driers
(2) Horizontal driers
(2) Roll kilns
(3) Porcelaneous grès 1,316 423 476 2,889 Clear single fired 1,305 449 495 2,623 Red single fired 2,000 415 - 2,903 Red monoporous - 486 - 2,769 Clear monoporous - 470 394 - (1) for kg of atomized material (2) for ton of pressed and dried tiles (3) for ton of finished tiles Table 2. Proposed baseline for thermal energy saving projects in the ceramic industry. Source ENEA-FIRE.
Brick industry
The Italian brick industry has produced less than 7.5 million tons of product in 2012, for an overall value of 700 million euro. The number of companies in the same year was 125 with 147 plants and 5,000 employees. Most of the production has been used for the residential buildings.
Comparing 2007 and 2012 data, the production has considerably decreased (in 2007 was almost the double) and also the number of active companies (186 companies with 231 plants) and the number of employees (10,000 in 2007).
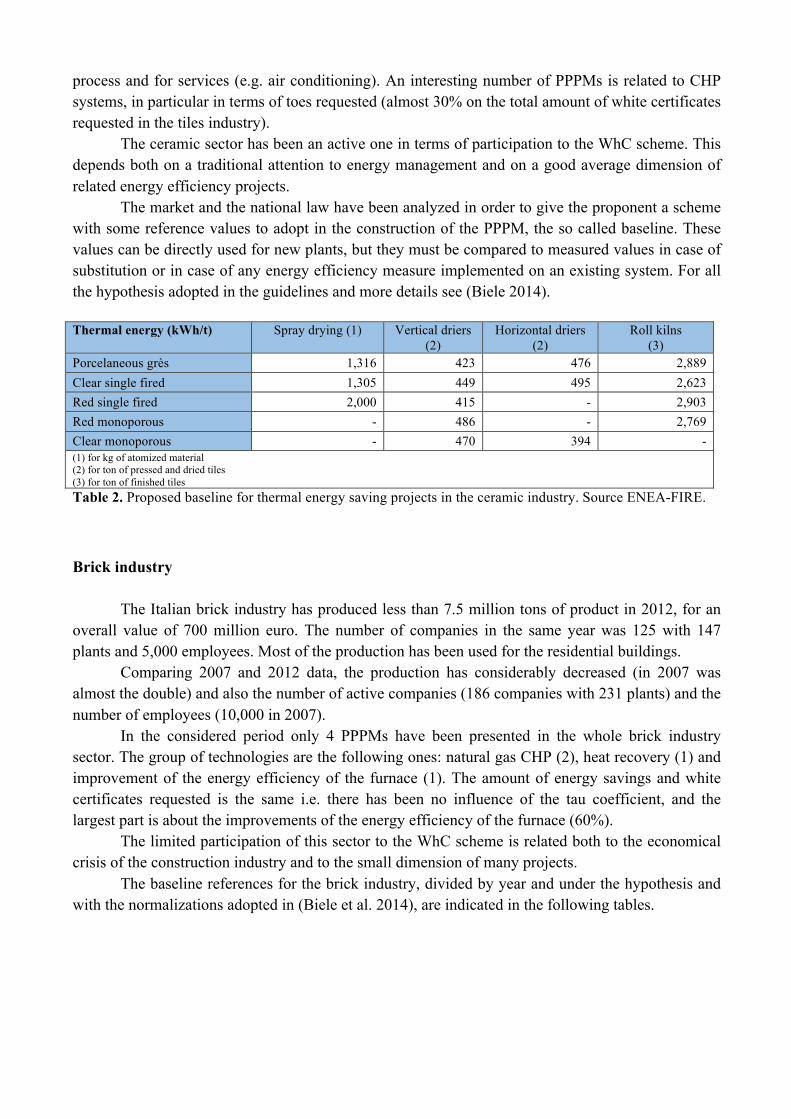
In the considered period only 4 PPPMs have been presented in the whole brick industry sector. The group of technologies are the following ones: natural gas CHP (2), heat recovery (1) and improvement of the energy efficiency of the furnace (1). The amount of energy savings and white certificates requested is the same i.e. there has been no influence of the tau coefficient, and the largest part is about the improvements of the energy efficiency of the furnace (60%).
The limited participation of this sector to the WhC scheme is related both to the economical crisis of the construction industry and to the small dimension of many projects.
The baseline references for the brick industry, divided by year and under the hypothesis and with the normalizations adopted in (Biele et al. 2014), are indicated in the following tables.
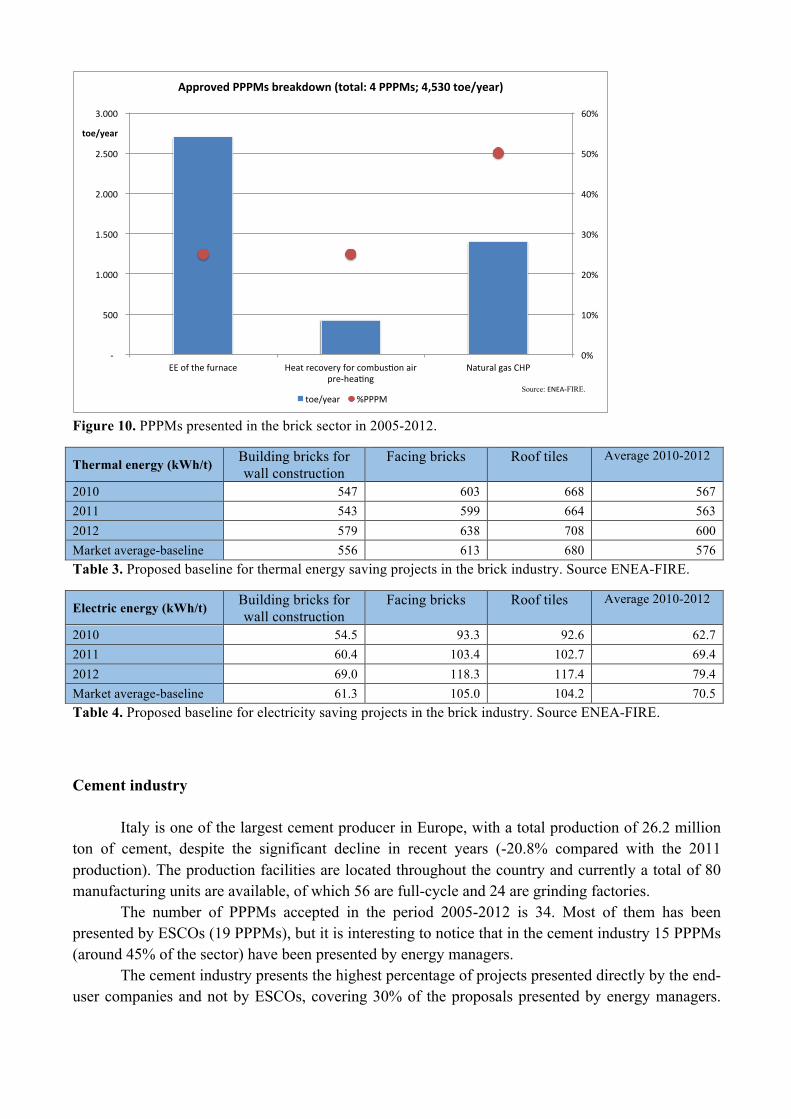
Figure 10. PPPMs presented in the brick sector in 2005-2012.
Thermal energy (kWh/t) Building bricks for wall construction
Facing bricks Roof tiles Average 2010-2012
2010 547 603 668 567 2011 543 599 664 563 2012 579 638 708 600 Market average-baseline 556 613 680 576 Table 3. Proposed baseline for thermal energy saving projects in the brick industry. Source ENEA-FIRE.
Electric energy (kWh/t) Building bricks for wall construction
Facing bricks Roof tiles Average 2010-2012
2010 54.5 93.3 92.6 62.7 2011 60.4 103.4 102.7 69.4 2012 69.0 118.3 117.4 79.4 Market average-baseline 61.3 105.0 104.2 70.5 Table 4. Proposed baseline for electricity saving projects in the brick industry. Source ENEA-FIRE.
Cement industry
Italy is one of the largest cement producer in Europe, with a total production of 26.2 million ton of cement, despite the significant decline in recent years (-20.8% compared with the 2011 production). The production facilities are located throughout the country and currently a total of 80 manufacturing units are available, of which 56 are full-cycle and 24 are grinding factories.
The number of PPPMs accepted in the period 2005-2012 is 34. Most of them has been presented by ESCOs (19 PPPMs), but it is interesting to notice that in the cement industry 15 PPPMs (around 45% of the sector) have been presented by energy managers.
The cement industry presents the highest percentage of projects presented directly by the end-user companies and not by ESCOs, covering 30% of the proposals presented by energy managers.
0%#
10%#
20%#
30%#
40%#
50%#
60%#
#*####
#500##
#1.000##
#1.500##
#2.000##
#2.500##
#3.000##
EE#of#the#furnace# Heat#recovery#for#combus=on#air#pre*hea=ng##
Natural#gas#CHP#
toe/year(
Approved(PPPMs(breakdown((total:(4(PPPMs;(4,530(toe/year)(
toe/year# %PPPM#Source: ENEA-FIRE.
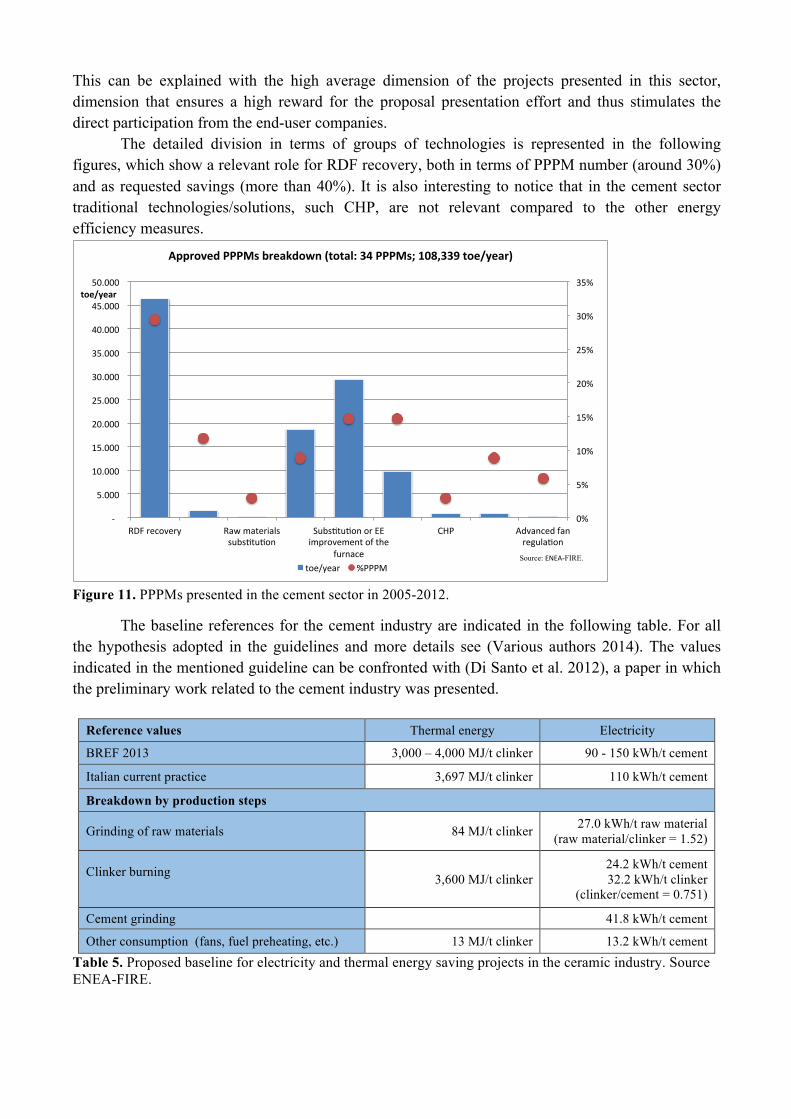
This can be explained with the high average dimension of the projects presented in this sector, dimension that ensures a high reward for the proposal presentation effort and thus stimulates the direct participation from the end-user companies.
The detailed division in terms of groups of technologies is represented in the following figures, which show a relevant role for RDF recovery, both in terms of PPPM number (around 30%) and as requested savings (more than 40%). It is also interesting to notice that in the cement sector traditional technologies/solutions, such CHP, are not relevant compared to the other energy efficiency measures.
Figure 11. PPPMs presented in the cement sector in 2005-2012.
The baseline references for the cement industry are indicated in the following table. For all the hypothesis adopted in the guidelines and more details see (Various authors 2014). The values indicated in the mentioned guideline can be confronted with (Di Santo et al. 2012), a paper in which the preliminary work related to the cement industry was presented.
Reference values Thermal energy Electricity
BREF 2013 3,000 – 4,000 MJ/t clinker 90 - 150 kWh/t cement
Italian current practice 3,697 MJ/t clinker 110 kWh/t cement
Breakdown by production steps
Grinding of raw materials 84 MJ/t clinker 27.0 kWh/t raw material (raw material/clinker = 1.52)
Clinker burning 3,600 MJ/t clinker
24.2 kWh/t cement 32.2 kWh/t clinker
(clinker/cement = 0.751)
Cement grinding 41.8 kWh/t cement
Other consumption (fans, fuel preheating, etc.) 13 MJ/t clinker 13.2 kWh/t cement Table 5. Proposed baseline for electricity and thermal energy saving projects in the ceramic industry. Source ENEA-FIRE.
0%#
5%#
10%#
15%#
20%#
25%#
30%#
35%#
#(####
#5.000##
#10.000##
#15.000##
#20.000##
#25.000##
#30.000##
#35.000##
#40.000##
#45.000##
#50.000##
RDF#recovery# Raw#materials#subs=tu=on#
Subs=tu=on#or#EE#improvement#of#the#
furnace#
CHP# Advanced#fan#regula=on#
toe/year(
Approved(PPPMs(breakdown((total:(34(PPPMs;(108,339(toe/year)(
toe/year# %PPPM#Source: ENEA-FIRE.
Conclusions The brief considerations illustrated in this paper show how the Italian WhC scheme has been successful on several fronts, such as:
• Progressive evolution of some consultants and energy service providers to ESCOs (although presently limited to 10-20 versus around 3,000 companies listed on the GSE website). This transformation has not been globally quantified or deeply investigated, but the reasons behind this evolution are likely linked to the complexity of PPPMs and the need to thoroughly understand the presented projects in terms of operation, required meters, algorithm, baseline, and additionality.
• Effective promotion of energy efficiency investments and of integrated industrial projects, especially after the introduction of the tau coefficient.
• Delivering of around 6 Mtoe of additional savings at a cost in the order of 600 million euro/year (DSO tariff reimbursement multiplied by the yearly target). This is considered a very good result in terms of cost effectiveness. The free riding effect is present, but is going to be reduced in 2014 thanks to new rules allowing proposals for new energy efficiency solutions only, rather than including those already in operation.
Some ESCOs and DSOs have developed financial instruments dedicated to energy efficiency project financing.17 This has occurred as a consequence of the high value of the incentive compared with the investment CAPEX, together with the relative stability of WhC prices in the recent years, and a move to support energy efficiency through third party financing. Among the benefit linked to PPPMs and monitoring plans the following can be indicated:
• PPPMs give interesting information on the industrial processes, the technologies used and market trends;
• ESCOs gradually acquire expertise on industrial processes, which can be replicated on other companies with clear benefits for the market;
• this process helps energy efficiency to become more integrated in industrial processes, since ESCOs can diffuse the industrial best practice and since energy renovations present a high additionality;
• end-users are stimulated to evolve towards a smart approach to energy use, such as that promoted by ISO 50001 energy management systems and, more generally, by the 2012/27/UE directive on energy efficiency. The guidelines developed by ENEA illustrate the results for the investigated sectors and offer
information on the baseline, the additionality and the algorithms for the typical energy efficiency solutions. The guidelines give also some information about the performance of the investigated sectors and on the prevalence of core business or services energy efficiency solutions. The three examples illustrated in this papers show how the results differ among different sectors. The reasons can be different (e.g. average dimension of the enterprises in a given sector, presence of energy management systems or of skilled energy managers, active role of the corresponding industrial association, trend of the sector, etc.) and have not yet been analysed. Nevertheless both the guidelines and the different projects presented in the ceramics, bricks, and cement sectors illustrated in this paper show the flexibility of the monitoring plan procedure and its capabilities of involving energy efficiency projects integrated with the core business and of allowing the collection of a high number of toe of savings, in line with the requirements of art. 7 of the 2012/27/EU directive on energy efficiency18. It would also appear important to establish an open dialog between the
17 As illustrated for example in the proceedings of FIRE annual conference on white certificates (“Certificati bianchi: titoli di efficienza energetica a portata di mano”). 18 Other useful information can be found in (Di Santo et al. 2014).
evaluators and the proponents, in order to reduce the risk of conflicts and to facilitate the presentation of quality proposals. A final important aspect: the real trigger to success of the scheme and of the involvement of industry is information and training. It is fundamental to devote sufficient economic and personnel resources to these activities, such as workshops, training courses, guidelines and examples. The advantages for the system in general are enormous compared with the cost of implementing these actions. Useful links Links of institutions and associations related to white certificates in Italy: MSE, Ministry of Economic Development, www.sviluppoeconomico.gov.it AEEGSI, Italian electricity, gas and hydric services authority, www.autorita.energia.it GSE, Italian energy services operator, www.gse.it ENEA, Italian Agency for new technologies, energy and environment, www.enea.it RSE, Energy System Research center, www.rse-web.it GME, Italian energy market operator, www.mercatoelettrico.org Federutility, Federation of DSOs, www.federutility.it Assistal, www.assistal.it, Assoesco, www.assoesco.org, Federesco, www.federesco.org, ESCOs associations FIRE, Italian Federation for the Rational Use of Energy, www.fire-italia.org, Federation in charge of the energy manager network References Bertoldi, P., and S. Rezessy. 2006. Tradable certificates for energy savings (white certificates) -
theory and practice. http://bookshop.europa.eu/en/tradable-certificates-for-energy-savings-white-certificates--pbLBNA22196. European Commission Joint Research Centre, Institute for Environment and Sustainability.
Biele, E. 2014. Guidelines for PPPMs: ceramic industry.
http://blogcertificatibianchienea.weebly.com/guide-settoriali.html. ENEA. Biele, E., and N. Di Franco. 2014. Guidelines for PPPMs: bricks industry.
http://blogcertificatibianchienea.weebly.com/guide-settoriali.html. ENEA. Di Santo, D. 2010 “Osservazioni sul meccanismo dei certificati bianchi e spunti per
l’aggiornamento”. http://old.enea.it/attivita_ricerca/energia/sistema_elettrico/Elettrotecnologie/6%20Osservazioni%20meccanismo%20CB_10.09.2010.pdf. ENEA.
Di Santo, D., D. Forni, and E. Biele. 2012. White certificate for the industrial sector. ECEEE
Summer Study - Industry: A third of Europe’s energy use. ECEEE. Di Santo, D., G. Tomassetti, E. Biele, and S. D’Ambrosio. 2014. Italian white certificates scheme:
the shift toward industry. ECEEE Summer Study - Retool for a competitive and sustainable industry. ECEEE.
Di Santo, D., D. Forni, V. Venturini, and E. Biele. 2011. The White Certificate scheme: the Italian experience and proposals for improvement. ECEEE Summer Study - Energy efficiency first: The foundation of a low-carbon society. ECEEE.
Eyre, N., M. Pavan, and L. Bodineau. 2009. Energy company obligations to save energy in Italy, the
UK and France: what have we learnt?. ECEEE Summer Study - Act! Innovate! Deliver! Reducing energy demand sustainably. ECEEE.
Tomassetti, G., D. Di Santo, D. Forni, E. Biele, and S. D’Ambrosio. 2013. Metodo a consuntivo:
analisi delle proposte di progetto e di programma di misura 2005-2012. http://blogcertificatibianchienea.weebly.com/uploads/1/9/4/8/19485057/pppm_fire_rev10.pdf. ENEA.
Various authors. 2007. Reference Document on Best Available Techniques in the Ceramic
Manufacturing Industry. http://eippcb.jrc.ec.europa.eu/reference/BREF/cer_bref_0807.pdf. JRC.
Various authors. 2012. Best Practices in Designing and Implementing Energy Efficiency Obligation
Schemes. Research Report Task XXII of the International Energy Agency Demand Side Management Programme. IEA DSM.
Various authors. 2013. White certificates. CEN/CLC/TR 16567. CEN. Various authors. 2014. Guidelines for PPPMs: cement industry.
http://blogcertificatibianchienea.weebly.com/guide-settoriali.html. ENEA.
Related Documents