1 When The Turbines Stop Turning: Examining The Impacts of Drought On Power Production at Hoover Dam and Its Consequences for Entities in Arizona Surabhi Karambelkar PhD Student, University of Arizona Abstract Since its operation in 1936, Hoover Dam has served as an indispensable power source for over 29 million people in the states of Arizona, California and Nevada. However, sustained drought conditions in the arid southwest have raised concerns over the future of power production at Hoover. While scholarly consensus indicates the recognition of this concern, there is limited comprehensive research at present on the implications of reduction of Hoover power generation for users in the state of Arizona. To address this research gap, this paper undertakes three main tasks. First, the paper reviews the potential impacts of the changing drought scenarios on power generation capacity and associated cost of power at Hoover Dam. Second, the paper charts the key federal and state regulatory provisions governing Hoover power allocation. The paper also maps the existing entities that have access to power from this source. Additionally, in light of the passage of Hoover Power Allocation Act of 2011, the paper also discusses the power reallocation process post-2017 and the ensuing changes in the number/type of entities that will have access to this power in the future. Third, based on literature review of the drought impacts and the regulatory framework, and interviews with practitioners working with municipal water utilities, state power authorities, electrical and irrigation districts, the paper examines the consequences of power reduction at Hoover for power users in Arizona. The implications of power reduction are first discussed at a broader level for Schedule A, B and D users, followed by a detailed examination of the repercussions for the Central Arizona Project (CAP) and Irrigation Districts in Arizona. The study suggests that at the broader level, impacts will be a function of not only the amount of power that a specific entity receives from the Dam, but also the share of this power source in the entity’s total energy portfolio. Nonetheless, energy bills will inevitably escalate as users will need to pay for the operating costs of the dam, along with supplemental power from the spot market. For the Central Arizona Project, where Hoover Power serves a unique load regulation function, reduction in power supply will translate to increasing pumping costs, and associated increase in price of water for its customers. The revenues of the Central Arizona Water Conservation District (CAWCD) will also potentially be impacted, in turn exacerbating CAWCD’s current structural deficit and undermining its repayment obligations for the CAP. For Irrigation Districts on the other hand, reduction in power availability can potentially increase groundwater pumping in some areas and result in absolute fallowing in others. Given the importance of Hoover’s inexpensive power for Arizona’s users and its economy, the paper finally concludes by suggesting policy recommendations, which include creating flexibility in the existing regulatory structure to manage power through a collective pool of its users, increasing the share of renewable energy in the state’s energy generation portfolio, and undertaking technical upgradation.

Welcome message from author
This document is posted to help you gain knowledge. Please leave a comment to let me know what you think about it! Share it to your friends and learn new things together.
Transcript
1
When The Turbines Stop Turning: Examining The Impacts of Drought On Power Production at Hoover Dam and Its
Consequences for Entities in Arizona Surabhi Karambelkar PhD Student, University of Arizona
Abstract
Since its operation in 1936, Hoover Dam has served as an indispensable power source for over 29 million people in the states of Arizona, California and Nevada. However, sustained drought conditions in the arid southwest have raised concerns over the future of power production at Hoover. While scholarly consensus indicates the recognition of this concern, there is limited comprehensive research at present on the implications of reduction of Hoover power generation for users in the state of Arizona. To address this research gap, this paper undertakes three main tasks. First, the paper reviews the potential impacts of the changing drought scenarios on power generation capacity and associated cost of power at Hoover Dam. Second, the paper charts the key federal and state regulatory provisions governing Hoover power allocation. The paper also maps the existing entities that have access to power from this source. Additionally, in light of the passage of Hoover Power Allocation Act of 2011, the paper also discusses the power reallocation process post-2017 and the ensuing changes in the number/type of entities that will have access to this power in the future. Third, based on literature review of the drought impacts and the regulatory framework, and interviews with practitioners working with municipal water utilities, state power authorities, electrical and irrigation districts, the paper examines the consequences of power reduction at Hoover for power users in Arizona. The implications of power reduction are first discussed at a broader level for Schedule A, B and D users, followed by a detailed examination of the repercussions for the Central Arizona Project (CAP) and Irrigation Districts in Arizona. The study suggests that at the broader level, impacts will be a function of not only the amount of power that a specific entity receives from the Dam, but also the share of this power source in the entity’s total energy portfolio. Nonetheless, energy bills will inevitably escalate as users will need to pay for the operating costs of the dam, along with supplemental power from the spot market. For the Central Arizona Project, where Hoover Power serves a unique load regulation function, reduction in power supply will translate to increasing pumping costs, and associated increase in price of water for its customers. The revenues of the Central Arizona Water Conservation District (CAWCD) will also potentially be impacted, in turn exacerbating CAWCD’s current structural deficit and undermining its repayment obligations for the CAP. For Irrigation Districts on the other hand, reduction in power availability can potentially increase groundwater pumping in some areas and result in absolute fallowing in others. Given the importance of Hoover’s inexpensive power for Arizona’s users and its economy, the paper finally concludes by suggesting policy recommendations, which include creating flexibility in the existing regulatory structure to manage power through a collective pool of its users, increasing the share of renewable energy in the state’s energy generation portfolio, and undertaking technical upgradation.
2
1. Introduction
Since the time of river explorers such as Lt. Joseph Christmas Ives and John Wesley Powell,
the Colorado River has been considered the lynchpin of growth and development in the arid
Southwestern United States. With the passage of the Reclamation Act of 1902, the U.S.
Reclamation Service (renamed Bureau of Reclamation) was established, which propelled taming
the river to make the desert bloom. Today, every drop of the river is guarded and regulated to serve
the needs of nearly 40 million people in the U.S. Southwest (USBR, 2012).
While primarily serving the functions of flood regulation and water provision for irrigation
and drinking, the Colorado River is also a storehouse of hydropower potential. Developed under
the auspices of the Bureau of Reclamation (hereafter referred to as USBR), Hoover Dam, was the
first structure built on the river that had the potential to generate inexpensive power for the growing
energy needs of the U.S. Southwest. Ever since, several other dams have been constructed on the
river with the total estimated electricity generating potential of 4200 MW (USBR, 2012).
However, as water and energy are inextricably linked, this potential faces a direct threat of
diminution with sustained drought conditions in the region. According to the Colorado River Basin
Study published by the USBR (2012), the drought conditions are expected to intensify over the
next few years, with one of the scenarios predicting “droughts lasting 5 or more years” over “50
percent of the time over the next 50 years” (p. 7). The drought conditions coupled with increasing
temperatures and reducing snowpack are predicted to reduce the overall hydropower potential in
the river basin by 16-19% (Christensen & Lettenmeier, 2007).
Given that Hoover Dam has one of the largest power generating capacities in the basin, the
impacts of drought will be tangible and significant for the large number of users of the Dam’s
hydropower. While scholars, decision-makers, and policy-makers acknowledge the negative
effects of such a reduction in hydropower generation, research exploring the implications of
reduction in power generation at the Dam for users in the state of Arizona remains wanting. Only
one study has been undertaken so far by the Bren School of Environmental Science and
Management at the University of California, Santa Barbara that looks at the broader implications
of reduction in Lake Mead levels on water deliveries, hydropower generation, recreational water
uses, and ecosystem water needs in the U.S. Southwest (Jiang et al., 2015).
Consequently, to address this knowledge gap, this paper aims to undertake three main tasks:
3
1. Review the potential impacts of the drought on power generation capacity and associated cost
of power at Hoover Dam.
2. Chart the key regulatory provisions governing Hoover power allocation, with a specific focus
on the state of Arizona. Map the existing entities that have access to power from this source,
and in light of the passage of Hoover Power Allocation Act of 2011, discuss the power
reallocation post-2017 and the ensuing changes in the number/type of entities that will have
access to this power in the future.
3. Based on the discussion of drought impacts and the regulatory framework, examine the
consequences of power reduction at Hoover Dam for Arizona, particularly focusing on how
power cuts will be instituted in the state, the entities/sectors that will be most at risk, and the
potential pathways in addressing these impacts.
The remainder of the paper is structured in five main parts. Section two discusses the
methodology adopted for the study. Section three provides a brief background of power generation
at Hoover Dam, changing hydropower potential with drought conditions and ongoing efforts to
recover some of the lost potential. Section four gives an overview of the regulatory framework
guiding the allocation of Hoover power. Section five examines the implications of power reduction
at Hoover Dam for specific entities, based on the background provided by sections three and four
and interviews conducted with experts. Finally, section six briefly discusses the policy measures
to mitigate the impacts of power reduction that will be experienced in Arizona.
2. Methodology adopted for the study
This study was primarily based on literature review, and interviews with practitioners with
practical experience and topical knowledge on the production, allocation, and use of power
generated at Hoover Dam.
A variety of published and unpublished sources were used to undertake the literature review.
These sources included journal articles, reports and information on websites published by
government agencies such as the USBR, Arizona Power Authority (hereafter referred to as APA),
Central Arizona Water Conservation District (hereafter referred to as CAWCD), newspaper
articles, policy briefs, weekly academic newsletters, formal letters/correspondences etc.
Interviews that were part of the study were largely semi-structured in nature. Interviewees
were identified based on their background, topical knowledge, engagement and experience with
4
Hoover power allocation, experience with regulatory processes associated with power allocation
and distribution, along with experience in managing issues arising from uncertainties in the power
sector. To aid the inclusion of the different perspectives from various sectors, an attempt was made
to interview people working in the field of municipal (and regional) water supply, agriculture, and
electricity distribution.
For the purpose of the study, telephonic interviews were conducted with the the following
people:
• Power Programs Manager of the Central Arizona Project
• Interim Executive Director of the Arizona Power Authority
• General Manager of Maricopa Stanfield Irrigation & Drainage District
• Chief Financial Officer of Electrical District Number 3
• Director of the Water Services Department at the City of Phoenix
• Water Resources Policy Advisor at the City of Phoenix
The inputs and feedback from the interviewees were used to carry out the analysis of
impacts of reduction in Hoover power, in conjunction with secondary literature analysis.
Given the time constraints, an attempt was made to quantify impacts to the extent feasible.
However, as data on aspects such as cost, pricing, and use of energy and water, as well as legal
contractors between parties are confidential information, these could not be accessed in the
available timeframe. As limited research exists on this topic, there is significant scope to expand
on the quantitative analysis, which can help ascertain the overall economic impacts for specific
entities, as well as the state of Arizona, from reduction in Hoover power production.
3. Background and Impacts of Drought on Power Generation at Hoover Dam
3.1 Background on Power Generation at Hoover Dam
Extensive flooding caused by snow-melt in spring and summer, followed by a period of low
water availability in the fall, propelled the need to regulate the flow on the Colorado River.
However, prior to regulating the flow, representatives from each of the six basin states1- Colorado,
Utah, Wyoming, New Mexico, Nevada, and California- and the federal government, signed the
Colorado River Compact in 1922 to equitably divide the basin into upper and lower halves (USRB,
1 While Arizona was a part of the early negotiations for the Colorado River Company, the state ratified the Compact in 1944.
5
2016a). Article I of this Compact (Colorado River Compact, 1922) created the provision for storing
water in the river basin, thereby heralding the construction of dams on the main stem of Colorado
River. In 1928, Congress signed the Boulder Canyon Project Act, which authorized the
construction of Hoover Dam (USBR, 2016a).
The first turbines at the dam started commercial operation in 1936 and since then, the power
production at the dam has served an estimated 29 million people, primarily in Arizona, California,
and Nevada (Colorado River Commission, 2013). The dam has 19 generating units with an
installed nameplate capacity of 2080 MW, and an annual average power generation of about 4
billion kilowatthours (USBR, 2016b). The dam’s power has traditionally been marketed and sold
by the Western Area Power Administration (WAPA), to 15 entities in California, Nevada and
Arizona, with the existing contracts expiring in 2017 (USBR, 2016a).
3.2 Impacts of Drought on Power Production and Ongoing Efforts to Recover the Loss in Power
Production Capacity
The power generation capacity at Hoover Dam is a function of the quantity of water stored
behind the dam in Lake Mead, which determines the amount of head that can be created. The
nameplate capacity at the dam is based on the elevation of 1221 feet of water stored in the reservoir
(USBR, 2016b). In 1999, the year that drought was declared in the Southwest, the elevation of the
dam was 1214 feet (Arizona Energy, 2013). Ever since, the elevation at Lake Mead has been
declining to the extent that over the last six years from 2010 to 2016, the storage at the reservoir
has not crossed the 39% mark. As of April 17 2016, the elevation at Lake Mead was 1077.7 feet
with the reservoir at 38% of its capacity (USBR, 2016c).
This reduction in storage spells bad news for power generation as “every foot of elevation
lost in Lake Mead” results in a concurrent reduction of 5.7MW of generation capacity at Hoover
Dam, at all elevation levels (U. S. Department of Energy, 2011, p. 24). The reduction in capacity
is caused due to the flow of air bubbles through the turbines at the power station, which in turn
lowers the turbine efficiency (U. S. Department of Energy, 2011). The U.S. Department of Energy
(2011) estimated that the total reduction in capacity since 1980 has been 29%, and discussions
with the Interim Executive Director at the Arizona Power Authority, indicated that the drought
could lead to a further reduction of 20% (Johnson, 2016).
6
As hydropower generation holds a lower priority to flood control and water supply functions
of the diversion structures on the Colorado (discussed further in Section 3), in case of exacerbating
drought conditions, the water stored in Lake Mead will first be allocated to fulfil water demands
in the Lower Basin States.
To counter the challenge posed by lowering reservoir elevations, the USBR ordered the
installation of a low-head turbine in 2012 at one of the 17 units, to test the feasibility of
performance improvement in power generation at Hoover Dam (U. S. Department of Energy,
2011; Walton, 2010). With this turbine technology, power production is envisaged to continue at
elevations as low as 950 feet (Thompson, 2015). The turbine installed in 2012 reported an initial
improvement in efficiency at 2%, translating to $200-300 million in economic gains (Jiang et al.,
2015). Given these economic gains, the Bureau retrofitted a total of four turbines in 2015, and is
expected to upgrade two more in the near future (Brean, 2015). The Bureau also installed new
stainless steel wicket gates, as well as digital control systems since 2005, to allow the recovery of
roughly 88 MW of lost capacity (Walton, 2010). This roughly equates to the recovery of $2.8
million dollars of revenue at conservative wholesale market price calculated at $2,700 per MW-
month2 (Hydro Review, 2009). Overall, an estimated $1.3 billion have been invested by current
Hoover power contractors since 1935 in construction, operation and maintenance, and upgradation
of equipment and facilities at Hoover Dam and the Visitor Centre, and an additional $600 million
is expected to be invested by the same contractors till 2017 (Colorado River Commission, 2013).
4. Overview of Regulations Governing Power Allocation from Hoover Dam
4.1 Federal Regulations
The Boulder Canyon Project Act of 1928 was passed with the intent of “controlling the
floods, improving navigation and regulating the flow of the Colorado River” by creating storage
and providing “for the delivery of stored water… for reclamation of public lands and other
beneficial uses” (Boulder Canyon Project Act, 1928, Section 1). The act authorized the Secretary
of the Interior to construct, operate and maintain Hoover Dam. Given that the primary purpose of
the dam was flood control, navigation, and irrigation, electricity generation at the dam was seen as
a means to generate the revenue to ensure that the project was a “self-supporting and financially
solvent undertaking” (Boulder Canyon Project Act, 1928, Section 6). This feature of electricity
2 estimating 720 hours in a month
7
production for revenue generation earned the dam the title of a “cash register” dam (Reisner, 1986,
p.148).
Under Section 5 of the regulation, the Secretary of the Interior (hereinafter referred to as
Secretary) was granted the power to frame and sign contracts for the storage and delivery of water,
“for irrigation and domestic uses, and generation of electrical energy and delivery … to States,
municipal corporations, political subdivisions, and private corporations of electrical energy”
(Boulder Canyon Project Act, 1928, Section 5). The allocation of power was thus in accordance
with the provisions of the Federal Power Act of 1920, where ‘preference power’ was to be
channeled to multiple classes of users. Within the users, states, and municipalities3, received
preference in case of competing equal applications (GAO, 2001).
The Secretary also had the authority to charge prices to these entities to support the operation
and maintenance activities at the dam. Additionally, Section 5 (a) set the maximum duration of
such contracts between the Secretary and entities at 50 years, with the provision for readjusting
the same every ten years. Section 5 (c) further granted priority to in-state use of the generated
power, with equal priority for the states of Arizona, California and Nevada. The 1928 act also
required the project’s users to repay the federal advances along with the associated interest, and
the time period for the same was 50 from the date of project completion (USBR, 2016b).
In 1984, the Congress passed the Hoover Power Plant Act, which authorized the Secretary
of Interior to “increase the capacity of existing generating equipment” at the power plant (Hoover
Power Plant Act, 1984, Section 101(a)). This act required power users to repay the cost of the
uprating program. Section 105 of the act required the Secretary of Energy to renew contacts with
project contractors for a period of 30 years for existing and additional power generated through
the uprating program. In accordance with Section 105 (A), the power contracts signed with existing
users were categorized as ‘Schedule A’ power. The additional power generated through the
uprating program was contracted as ‘Schedule B’ as per Section 105 (B). In case of power
generation in excess of 4501.001 million kilowatthours in any year starting 1987, the contracts
were signed under ‘Schedule C’, with first preference given to Arizona. Overall, the act allocated
56% of the power to California, 25% to Nevada and the remaining 19% to Arizona.
3 Municipalities in this case included “city, county, irrigation district, drainage district, or other political subdivision or agency of a state competent under law to develop, transmit, utilize, or distribute power” (GAO, 2001, p. 3).
8
In addition, in accordance with Section 301 (a) of the Colorado River Basin Project Act of
1968, Section 102 (c) of the Hoover Power Plant Act 1984 authorized the Secretary of Energy to
include an equivalent of 4.5 mills per kilowatthour in the rates charged to power purchasers in
Arizona, to pay for a part of the construction costs of the Central Arizona Project.
As the provisions of the Hoover Power Plant Act of 1984 will remain in effect till 2017, in
case of reduction in power generation at Hoover Dam below the 4527.001 million kilowatthour
level, Schedule A and B users will face power cuts in “the ratio that the sum of the quantities of
firm energy to which each contactor is entitled pursuant to said schedules bears to 4527.001 million
kilowatthours” pursuant to Section 105 (2) of the act. However, in case of such cuts, Section 105
(2) has created the provision of purchase of power in the energy market by the Secretary of Energy,
to meet the deficiency in the power supplied to any given contractor at the contractor’s expense.
To guide the power allocation process post 2017 (the period after expiration of the existing
power contracts under Hoover Power Plant Act 1984), Congress passed the Hoover Power
Allocation Act in 2011. The act maintained the same list of contractors for Schedule A power, and
the same set of priority entitlements for Schedule C power. As per Section 2 (b) on the other hand,
Schedule B power was to be contracted to the states of Arizona and Nevada, along with 9 cities in
California (as opposed to the entire state as per the act in 1984). The 2011 act also created a
“resource pool equal to 5 percent of the full rated capacity of 2,074,000 kilowatts, and associated
firm energy” called ‘Schedule D’ power that was to be reserved for new allottees (Hoover Power
Allocation Act, 2011, Section 2 A).
Under Section 2 (C) (II) of this act, the Secretary of Energy was given the authority to allot
the Schedule D power through the Western Area Power Administration, to federally recognized
Indian tribes. This was called D-1 power. However, in the case of Arizona, the authority to allot
Schedule D power to new allottees, other than Indian tribes, was vested in the Arizona Power
Authority. Section 2 (D), granted 11.1% of the Schedule D power, called D-2 power, directly to
the Arizona Power Authority. The act also created the provision of reallocating the unused power
in the Schedule D category to Schedule A and B users. With respect to D-1 power, the “final
marketing criteria” were published by WAPA on December 30, 2013 (Arizona Power Authority,
2015, p. 4). Thereafter, WAPA accepted applications for this power category until March 31, 2014.
The final allocation decision was published by WAPA on December 18, 2014.
9
As provisions of the Hoover Power Allocation Act, 2011 will guide power allocation post
2017, power cuts in case of reduction of power generation at Hoover Dam will be in accordance
with these provisions. Section 2 (j) of the act specifies that “in the event that water is not available
to produce the contingent capacity and firm energy set forth in Schedule A, Schedule B, and
Schedule D, the Secretary of Energy shall adjust the contingent capacity and firm energy offered
under those Schedules in the same proportion as those contractors’ allocations of Schedule A,
Schedule B, and Schedule D contingent capacity and firm energy bears to the full rated contingent
capacity and firm energy obligations” (Hoover Power Allocation Act 2011, Section 2(j)).
4.2 State Regulations
Given that power allocation in Arizona is governed by Arizona Revised Statutes (A.R.S.)
in additional to federal regulations, A.R.S. Title 30 (Power) and A.R.S. Title 45 (Waters) informed
power allocation decision-making in the state on part of the Arizona Power Authority post 2017.
In this regard, Title 30 sets out the provisions pertaining to disposition of electric power (A.R.S. §
30-124), power purchase certificates (A.R.S. § 30-151), preference power allocation in case of
insufficient supplies (A.R.S. § 30-125). In accordance with Title 30, only retail power purchasers
that have obtained power purchase certificates from APA are allowed to “become a purchaser of
electrical power generated by the waters of the main stream of the Colorado river” (A.R.S. § 30-
151 A). Further, the entities that receive preference for power allocation include districts,
incorporated cities or towns or cooperatives, applicants other than districts that use power
primarily for irrigation or drainage or both, and in case of the absence of these three categories,
other qualified applicants (A.R.S. § 30-125). By and large, the provisions set out in Title 30 can
be construed as being applicable to the allocation of Schedule A power by the APA.
In case of Title 45 on the other hand, A.R.S. § 45-1703 (C) recognizes the authority of APA
to allocate the power generated through the uprating program at Hoover Dam (which is termed
Schedule B). This said, in case of conflicts between the provisions of Title 30 and Title 45 on the
allocation of power, A.R.S. § 45-1722 indicates that provisions of Title 30 supersede those under
Title 45. Given that Schedule D power did not find mention in Title 30 or Title 45, the Final
Marketing Plan by the Arizona Power Authority provided the approach to allocating power in this
category (Arizona Power Authority, 2015, p. 7). A key feature of this approach was that Schedule
10
D power could neither be allocated to any entity already receiving Schedule A or B power4, nor
municipal and industrial entities that were receiving water from the Central Arizona Project at the
time of reallocation5.
Based on the Final Marketing Plan published by the Arizona Power Authority in 2015, a
total of 68 entities were allocated power. Of the total entities, 33 new entities received power,
which included 14 cities/towns, 2 Indian tribes and 17 new districts, which accounted for
approximately 4% of the total capacity allocation provided to Arizona. The districts that qualified
for preference power under A.R.S. § 30-125 included power districts, electrical districts,
agricultural improvement districts, drainage districts, irrigation water delivery districts, irrigation
districts, flood control districts, and multi-county water conservation districts (Arizona Power
Authority, 2015, p. 24).
While the provisions of Hoover Power Plant Act 1984 and Hoover Power Allocation Act
2011 indicate that power reduction will be proportional to existing allocations, for all users in all
categories, this does not translate to uniform impacts. In this regard, therefore, the following
section explores the implication of Hoover power reduction focusing on entities that may be at
more impacted due to such a reduction.
5. Implications of Hoover Power Reduction for Entities in Arizona
5.1 Broader Implications of Hoover Power Reduction
Hydropower supplied by Hoover Dam is inexpensive due to the fact that the price charged
by Western Area Power Administration to the users, covers primarily the “operating costs of
Hoover Dam and Powerplant” as opposed to other sources, where users may be charged higher
rates to cover profits (Jiang et al, 2015, p. 41). Consequently, reduction in power generation at the
dam will result in an overall reduction in the available power from this inexpensive source for
Schedule A, B and D users. Schedule C power will not be impacted, as this power has not been
apportioned given the protracted drought and non-availability of excess power at the dam.
4 The rationale behind this restriction, was to broaden the availability of Hoover power to new entities, and allow them to file an application and receive a portion of the power. 5 Municipal and Industrial entities were considered as indirect beneficiaries of Hoover power, as they had to pay lower water charges due to Hoover power allocation to Central Arizona Water Conservation District. Consequently, they were restricted from applying for Schedule D power.
11
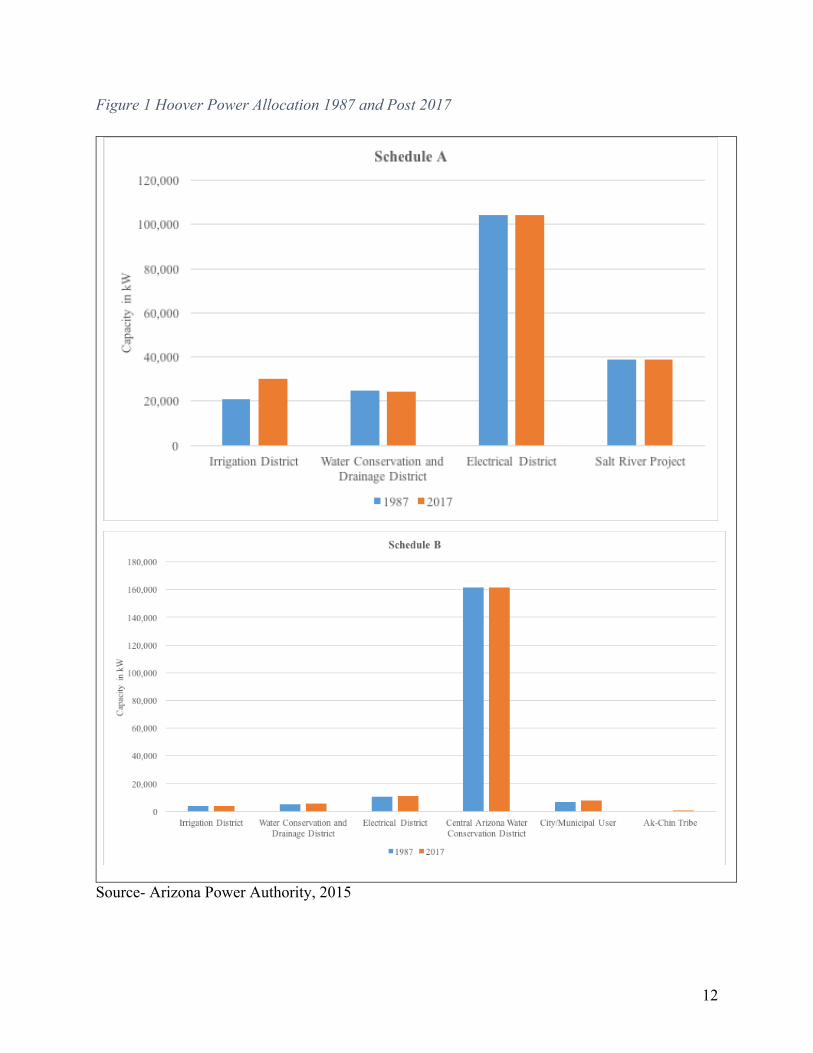
The impact felt by reduction in Hoover power will not only be a function of the amount of
power that a specific entity receives from the Dam, but also the share of this power source in the
entity’s total energy portfolio. With regards the amount of power that entities receive, Figure 1
indicates that irrigation districts, electrical districts, Salt River Project and Central Arizona Water
Conservation District will be most impacted from reduction in Hoover Power. Given that users of
Hoover power have to pay a fixed percentage of the operating costs of the dam and power plant
annually, regardless of the energy generated (Jiang et al., 2015), reduction in power generation
will still require users to pay for this fixed cost even when they may be unable to receive
proportionate economic returns. Moreover, these entities will need to supplement this power
deficit from purchases in the spot market, which may drive up their energy bills (discussed further
in Section 5.2).
While the impacts resulting from the share of Hoover power in an entity’s power portfolio
could not be estimated given the confidentiality of such information, discussions with the Chief
Financial Officer of Electrical District No. 3 suggested that most electrical districts have a
diversified portfolio of power sources (Benedict, 2016). Consequently, in case of shortage, these
districts will be in a position to source power from other market and non-market sources allowing
them to abate the deficit with lower financial implications (Benedict, 2016). On the other hand,
discussions with the General Manager of Maricopa Stanfield Irrigation & Drainage District,
indicated that of the approximately 65 irrigation districts in the state, only a few have linkages with
electrical districts for their power supply (Betcher, 2016). The majority of the other irrigation
districts have to rely on limited sources, with the dominant being Hoover power. In this case, given
the limited options available to such irrigation districts that are delinked from electrical districts,
the impacts from reduction in power generation at Hoover will be significant. The CAWCD, which
manages and operates the Central Arizona Project, will also be impacted given that it is the largest
allottee of Hoover power in the state.
As a result, the subsequent sections further focus on Central Arizona Project, and Irrigation
Districts. The SRP will be impacted, however given the paucity of information on the impacts and
limited timeframe, the implications of Hoover power reduction for this entity will be an area of
further research.
12
Figure 1 Hoover Power Allocation 1987 and Post 2017
Source- Arizona Power Authority, 2015
13
5.2 Implications for the Central Arizona Project
The Central Arizona Project (CAP) receives most of the electricity required for its operation
from the Navajo Generating Station (NGS), and a comparatively smaller portion from Hoover
Dam6 (Central Arizona Project, 2016). The CAP currently receives 161.6 MW of contingent
capacity Schedule B power as per Hoover Power Plant Act, 1984. In the post-2017 period, the
CAP will continue to receive 161.6 MW of contingent capacity Schedule B power under the
Hoover Power Allocation Act, 2011, however, the firm energy will be 5% lower than the 1984
allocation (Lunt, 2016; Arizona Power Authority, 2015). Firm energy generally refers to the
energy that is guaranteed to a purchaser by the distributor, and in case of a shortfall, the distributor
is liable to compensate the user for the cost of replacement power. For contingent energy, on the
other hand, the distributor is not liable to compensate the user for any shortfall in supply. In case
of CAP, therefore, the 5% reduction in firm power indicates a cut to the guaranteed amount of
power that CAP will receive post 2017.
Although CAP only sources a small portion of its power needs from Hoover, this power
serves an important and unique function of matching the load generation requirement at CAP’s
pumping stations on demand (Lunt, 2016). Therefore, in case of reduction in Hoover Power
generation, the CAP will be impacted in two main ways, as discussed below:
i. Increase in the Cost of Pumping CAP Water and Associated Cost of Water for Users
Losing access to inexpensive power that has the ability to provide firm energy on demand
will concurrently raise the cost of pumping water. The Power Programs Manager suggested that
very few energy sources are capable of providing the requisite firm energy required for load
generation balancing for the CAP (Lunt, 2016). Consequently, CAP will need to fill this deficit in
the energy requirement through market purchases, or through purchasing a back-up power
generation unit (Lunt, 2016), with similar capabilities as Hoover power in terms of regulating load.
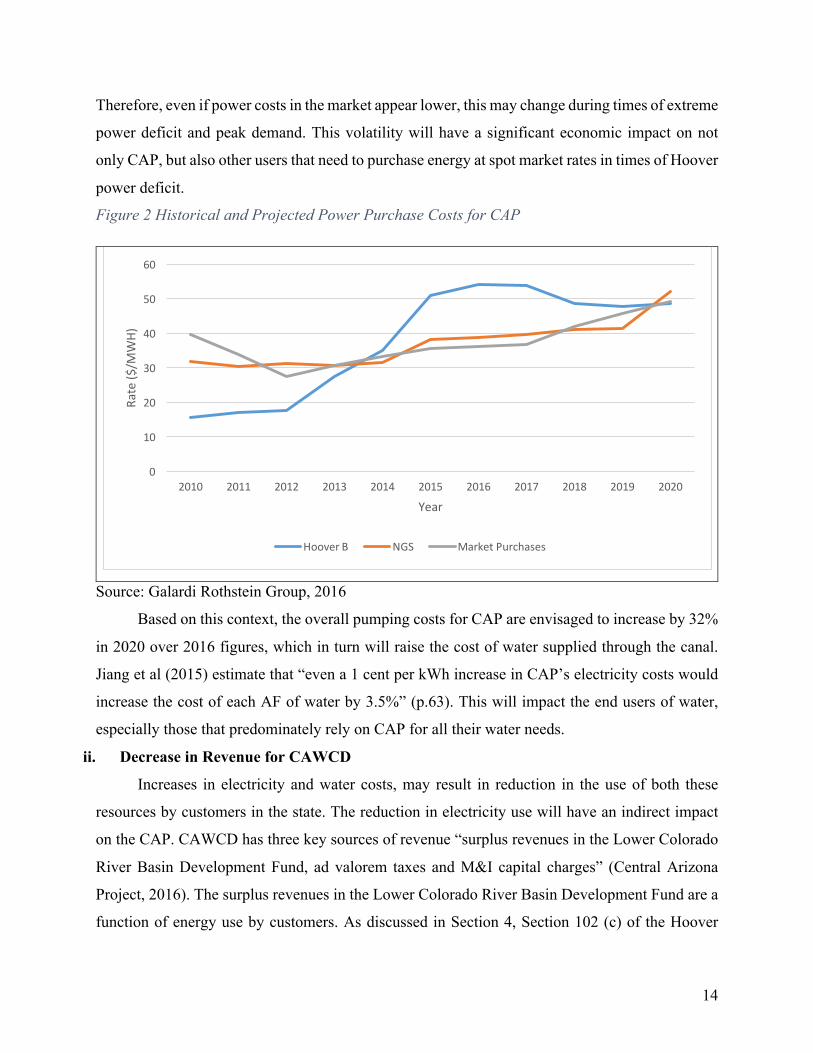
Figure 2 shows the historical and projected power purchase costs. It can be seen that at present,
the cost of power from Hoover Dam as well as Navajo Generating Station (NGS) is higher
compared to the market purchases. The main reason for this difference is the plummeting of natural
gas prices, resulting in lowering of cost of electricity available on the market. However, it must be
noted that this power available on the market may not serve the load regulation function that
Hoover power provides. Moreover, market prices are subject to change based on market demand.
6 This is the allocation made to CAWCD
14
Therefore, even if power costs in the market appear lower, this may change during times of extreme
power deficit and peak demand. This volatility will have a significant economic impact on not
only CAP, but also other users that need to purchase energy at spot market rates in times of Hoover
power deficit.
Figure 2 Historical and Projected Power Purchase Costs for CAP
Source: Galardi Rothstein Group, 2016
Based on this context, the overall pumping costs for CAP are envisaged to increase by 32%
in 2020 over 2016 figures, which in turn will raise the cost of water supplied through the canal.
Jiang et al (2015) estimate that “even a 1 cent per kWh increase in CAP’s electricity costs would
increase the cost of each AF of water by 3.5%” (p.63). This will impact the end users of water,
especially those that predominately rely on CAP for all their water needs.
ii. Decrease in Revenue for CAWCD
Increases in electricity and water costs, may result in reduction in the use of both these
resources by customers in the state. The reduction in electricity use will have an indirect impact
on the CAP. CAWCD has three key sources of revenue “surplus revenues in the Lower Colorado
River Basin Development Fund, ad valorem taxes and M&I capital charges” (Central Arizona
Project, 2016). The surplus revenues in the Lower Colorado River Basin Development Fund are a
function of energy use by customers. As discussed in Section 4, Section 102 (c) of the Hoover
0
10
20
30
40
50
60
2010 2011 2012 2013 2014 2015 2016 2017 2018 2019 2020
Rate($
/MWH)
Year
HooverB NGS MarketPurchases
15
Power Act, 1984 stipulated the addition of 4.5 mills per kilowatthour in the rates charged to Hoover
power users in Arizona and 2.5 mills per kilowatthour in the rates of California and Nevada.
Therefore, if the energy use decreases, the payment of surcharge as stipulated in the Hoover Power
Act, 1984 will decrease, thereby decreasing the contribution of this revenue source towards
repayment for the CAP.
The CAWCD maintains a ‘Strategic Reserve’ of funds to help pay for the ongoing operation
and maintenance of the CAP as well as make payments in lieu of its repayment obligation of
$1,646,462,500 under the Master Repayment Contract,1972 and Arizona Water Settlements Act,
2004 (Galardi Rothstein Group, 2016; Central Arizona Project, 2016). Over the last few years,
there have been significant structural deficits in this Strategic Reserve, as the revenues have not
been able to cover the operation and maintenance cost of the CAP, and due to increase in the cost
of the Agricultural Settlement Program and untimely reduction in M&I capital charges7 (Central
Arizona Project, 2016). As opposed to cyclical deficits, there is a very low probability of the deficit
in the Strategic Reserve correcting itself in the current scenario. In 2015, the structural deficit in
the Strategic Reserves was estimated at $54 million, which is expected to increase further going
forward (Central Arizona Project, 2016). In this context, the reduction in energy use and water use
can potentially exacerbate the existing structural deficit.
5.3 Implications for Irrigation Districts
For irrigation districts, the impact of reduction in power will be twofold. One, reduced
power from Hoover will require purchasing power at the market rate, which may potentially
increase their cost of production (the challenges associated with purchasing power at the market
rate are discussed in Section 5.2). Two, increasing cost of CAP water may also require irrigation
districts to resort to pumping groundwater in some cases and cease production in other, which
could have significant environmental impacts, as well as economic impacts for the irrigators and
the state.
7 The CAWCD decided to lower its rates for M&I capital charges with the expectation of receiving greater revenues from power sales from the NGS. The power sales from NGS contribute towards the Lower Colorado Basin Development Fund, which in turn supports the fulfillment of repayment obligation of the CAP. However, the sharp decline in energy prices since 2008, resulted in plummeting of sales from the NGS, thereby reducing the contribution of its revenues to the Basin Development Fund (Galardi Rothstein Group, 2016).
16
Given the history of groundwater pumping in the state and associated issues linked to
groundwater depletion and subsidence, Arizona State Legislature passed the Arizona Groundwater
Management Act in 1980 to regulate the use and management of groundwater in Active
Management Areas (AMAs). This law created a permit system for extraction of groundwater in
these AMAs where new wells, above a certain threshold, required a permit before they could be
constructed and operated. There was however an exception to this requirement; irrigators that used
groundwater prior to implementation of the law did not require a permit as they were considered
to have “grandfathered” rights to pump a designated quantity of water (Eden et al, 2008). As a
large number of irrigators had such rights, several schemes were instituted to reduce groundwater
pumping in these AMAs that promoted the use of CAP water in place of groundwater. For
example, irrigators could use CAP water ‘in lieu’ of groundwater and receive credits for the same
(A.R.S. $45-812.01). These credits could then be used at a later date to recover groundwater from
designated wells in the AMA or Irrigation Non-Expansion Areas. CAWCD instituted the
agricultural incentive program that aimed to subsidize the cost of CAP water, and keep the price
of this water at a level competitive with the cost of pumping water (Arizona Municipal Water
Users Association, 2013).
Discussion with the General Manager of the Maricopa Stanfield Irrigation & Drainage
District (MSIDD) indicated that 25% of a farmer’s expenditure in terms of input of production is
the cost of water (Betcher, 2016). In MSIDD, most farmers are engaged in the production of non-
cash crops8 such as alfalfa, which have a narrow profit margin. In such a scenario, the increase in
the price of CAP water by just 15% has the potential to make farming economically unfeasible for
the non-cash crop growing farmers like the ones in MSIDD (Betcher, 2016). The impact may
however not be the same for growers that have both the diversity of crop production and economic
capability to sustain increases in input costs.
The General Manager at MSIDD stated that for some irrigators, such a drastic change in
cost would serve as a trigger to pump groundwater that they had not been using due to the
incentives stated in the aforementioned paragraphs (Betcher, 2016). This in turn could potentially
reverse the efforts carried out by Arizona Department of Water Resources and CAWCD to protect
8 Low value crops that have smaller profit margins
17
the groundwater reserves in case of an extreme drought, and subsequently revive issues linked to
subsidence9.
While some contend that electrical pumping costs are high for groundwater pumping
compared to surface deliveries of CAP water, the Manager of MSIDD suggested that the lower
rates of natural gas make it feasible to procure energy at competitive rates thereby keeping the
pumping costs in check (Betcher, 2016). While this argument holds merit, there is nonetheless a
need to explore this correlation further10.
Given that majority of the farmers in the state are small-scale producers, with 85% of the
farms reporting annual sales receipts for less than $25,000 (Kerna & Frisvold, 2014, p. 9), increase
in the cost of water as well as electricity, could also potentially force these farmers to stop
production and fallow their farms. For a sector that contributes approximately $17 billion to
Arizona’s economy (Sigg, 2015), such fallowing could have a detrimental impact on the overall
revenues for the state as well as significant livelihood impacts for the individual farmers.
Going forward, there will be a need to institute policies that address these issues, a brief
discussion of which is provided in the next section.
6. Policy Recommendations and Way Forward
Given the central role of electricity in the smooth functioning of the economy and provision
of basic services, it will be imperative to ensure that this resource is available to users at an
affordable cost. In the current scenario, a few supply-side policy options can be considered:
a. Creating Flexibility in Regulatory Structures to Manage Power through a
Formal/Collective Pool
In Arizona, entities with excess power (from most sources) can sell the same on the
spot market. However, the option to sell does not always translate to the ability to sell,
primarily due to the fact that the cost of wheeling this excess power may be prohibitive as
indicated by the Chief Financial Officer at Electrical District Number 3 (Benedict, 2016).
Moreover, there are regulatory restrictions on the sale of certain categories of Hoover power.
9 This impact however will be more relevant until a shortage on the Colorado River is declared. This is due to the fact that once shortage is declared, the water deliveries within the CAP system will take place based on priorities. As Non-Indian Agricultural Water holds the lowest priority (Jiang et al. 2015), the irrigation districts using such water will inevitably be cut from receiving supplies and will need to resort to groundwater pumping. 10 Given that electricity and water use data are confidential information, they could not be examined first hand to substantiate the argument made by the General Manager at MSIDD.
18
For example, Schedule D power that goes unused cannot be sold on the electricity market
as suggested by the Water Resources Policy Advisor at the City of Phoenix (Campbell,
2016). These limitations obviate the potential to pool resources, which can be transmitted
to users efficiently based on their needs.
Therefore, policies that allow willing entities to collectively manage their resources
within the state will ensure that electricity is dispatched to the requisite uses/users when
most required. An effort in this direction by users is the creation of the Southwest Public
Power Agency, Inc. (SPPA) (Benedict, 2016). The SPPA is a “Joint Action Agency,
authorized by Arizona state law, which will manage through a formal pool all or most of its
members’ power resources and facilitate the supply of additional energy needed to meet
their customers’ loads” (SPPA, 2016). At present, the members of this SPPA are not-for-
profit public utilities that include electrical and irrigation districts, municipal electrical
utilities and tribal utilities (SPPA, 2016).
In case of private sector utilities, the opportunity to balance the energy market is
being explored through programs such as the energy imbalance market (EIM) operated by
California Independent System Operator (ISO). The EIM was launched in 2014 with the
aim of balancing the energy market in real time. Of the utilities in Arizona, Arizona Public
Service Company (APS) is expected to join the EIM in 2016. An independent study carried
out for APS, indicates that such participation will “create dispatch efficiency and flexibility
reserve savings of $7.0 to $18.1 million per year for APS” (Energy and Environmental
Economics Inc., 2015a, p. 1). Such interconnections across the grid will not only allow
balancing energy needs within the state but also across states in the western U.S.
b. Increasing the Share of Renewable Supply in the Power Portfolio
The state of Arizona was ranked second in the United States in 2014 for utility-scale
solar power generation (Energy Information Administration, 2015). As per the Renewable
Environmental Standard for the state, 15% of the total energy consumed in Arizona is
required to be sourced from renewable sources by 2025 (Energy Information
Administration, 2015). In 2014, roughly 8.9% of the state’s net generation was from
renewable sources; however, hydropower from Hoover Dam and Glen Canyon Dam was
the primary contributors to this figure, pointing to the need for augmenting power generation
from solar energy (Energy Information Administration, 2015).
19
Arizona can institute specific minimum power purchase obligations for in-state
renewable energy generation for each renewable source such as biomass and solar, along
with the broader Renewable Environmental Standard. Additionally, the state can also
provide administrative support to the renewable sector in terms of obtaining the requisite
clearances to set up the projects. These measures will provide investors the requisite
regulatory backing to invest in these sectors, which in turn can help enhance the power
generation and meet the deficit caused due to Hoover power reduction.
At a regional level, Western Electricity Coordinating Council is undertaking an
assessment to ascertain the feasibility of increasing the amount of renewable energy
connection to the western grid (Energy and Environmental Economics Inc., 2015b). Such
interconnection will not only help meet peak energy demands in the western region, but also
ensure that these demands are met through clean sources. The assessment aims at identifying
potential physical as well as institutional barriers for such enabling such an increase in
renewable power sourcing for the western grid and potential ways to address the same.
c. Technical Upgradation
A hard path policy approach can include making investments to upgrade the power
generation facilities (proportionate to their rate of economic return). As discussed in Section
3, the USBR and entities that receive Hoover power are currently making significant
investments in upgrading facilities at Hoover Dam to ensure power generation even at lower
elevation at Lake Mead; however, this only includes a few turbines at the dam. Therefore,
going forward, an additional number of turbines can be retrofitted with the low-head
technology. This technology can also be implemented in other hydropower generating
facilities such as the one at Roosevelt Dam, to augment hydropower production.
Along with the aforementioned policy measures, there is significant scope of conducting
further research on quantifying economic impacts of Hoover Power reduction for each sector (i.e.
agriculture, municipal, industrial etc.). This impact information can be used in conjunction with
peak energy usage statistics for each sector, to better balance/allocate power among all users. This
will be important, specifically for those entities that are not a part of collaborative efforts such as
the Joint Action Agency.

20
Power from Hoover Dam has played a crucial role in the the growth of Arizona. Even
though the drought may cause the turbines at the dam to stop turning, the aforementioned policy
measures have the potential to ensure that entities in Arizona are in a position to manage the
implications of such an eventuality.
21
References
Arizona Energy. (2013). Record Drought Reducing Hoover Dam Output. Retrieved from
http://arizonaenergy.org/News_13/News_Sep13/RecordDroughtReducingHooverDamOutp
ut.html
Arizona Power Authority. (2015). Final Hoover Power Marketing Plan Post-2017. Phoenix,
Arizona.
Arizona Municipal Water Users Association. (2013). Summary of the CAP Agriculutral Water
Incentive Pricing Program. Retrieved from
http://www.amwua.org/pdfs/40_201305_mgmt_item5b.pdf
A.R.S. §§ 30-124, 151, 125
A.R.S. §§ 45-1703, 1722, 812.01
Benedict, B. (2016). Phone interview with Brett Benedict, March 21 2016.
Betcher, B. (2016). Phone interview with Brian Betcher, March 18 2016.
Boulder Canyon Project Act of 1928, §§ 1, 5, 6
Brean, H. (2015). Lake Mead’s low levels could trigger federal shortage by 2017. Retrieved
April 4, 2016, from http://www.reviewjournal.com/news/water-environment/lake-mead-s-
low-levels-could-trigger-federal-shortage-2017
Campbell, C. (2016). Phone interview with Cynthia Campbell, April 5 2016.
Central Arizona Project. (2016). Information Brief- Report on Rate Setting Process.
Christensen, N. S., & D.P. Lettenmeier. (2007). A multimodel ensemble approach to assessment
of climate change impacts on the hydrology and water resources of the Colorado River
basin. Hydrological Earth Science, 11, 1417-1434.
22
Colorado River Compact of 1922, §1
Colorado River Commission. (2013). The Hoover Power Allocation Act Fact Sheet. Retrieved
from http://crc.nv.gov/2017hooverallocation/files/Hoover factsheet - 20130801.pdf
Eden, S., Glennon, R., Ker, A., Libecap, G., Megdal, S., & Shipman, T. (2008). Agricultural
Water to Municipal Use.
Energy and Environmental Economics Inc. (2015a). APS Energy Imbalance Market
Participation: Economic Benefits Assessment. San Francisco, CA.
Energy and Environmental Economics Inc. (2015b). Western Interconnection Flexibility
Assessment.
Energy Information Administration. (2015). Arizona State Profile and Energy Estimates.
Retrieved March 28, 2016, from http://www.eia.gov/state/?sid=AZ#tabs-1
Galardi Rothstein Group. (2016). Bond Feasibility Study for Water Delivery Operation and
Maintenance Revenue Bonds, Series 2016.
GAO. (2001). FEDERAL POWER The Evolution of Preference in Marketing Federal Power.
Washington, D.C.
Hoover Power Plant Act of 1984, §§101, 102, 105
Hoover Power Allocation Act of 2011, § 2
Hydro Review. (2009). EQUIPMENT: Turbine Improvements at Hoover Dam. Retrieved April
4, 2016, from http://www.hydroworld.com/articles/hr/print/volume-28/issue-6/featured-
articles/cover-story/equipment--turbine.html
Jiang, N., Martin, S., Morton, J., & Murphy, S. (2015). The Bathtub Ring: Implications of Low
Water Levels in Lake Mead on Water Supply, Hydropower, Recreation, and the
Environment.
23
Johnson, R. (2016). Phone interview with Robert Johnson, April 7 2016.
Kerna, A., & Frisvold, G. (2014). Agriculture in Arizona’ s Economy: An Economic
Contribution Analysis.
Lunt, R. (2016). Phone interview with Ron Lunt, March 30 2016.
Reisner, M. (1986). Cadillac desert: The American West and its disappearing water. New York,
N.Y., U.S.A: Viking.
Sigg, J. (2015). The Economic Contributions of Arizona Agriculture. Retrieved March 28, 2016,
from http://info.azfb.org/blog/the-economic-contributions-of-arizona-agriculture
Southwest Public Power Agency. (2016). About us. Retrieved April 4, 2016, from
http://www.sppa.biz/default.aspx
Thompson, J. (2015, July 7). Mapping drought’s impact on electricity generation. Retrieved from
https://www.hcn.org/articles/hydropower-california-drought-water-energy-electricity-dams
U.S. Department of Energy. (2011). Dams and Energy Sectors Interdependency Study.
United States Bureau of Reclamation. (2012). Colorado River Basin Water Supply and Demand
Study Executive Summary.
United States Bureau of Reclamation. (2016a). Hoover Dam and Powerplant. Retrieved March
28, 2016, from http://www.usbr.gov/lc/region/pao/brochures/hoover.html
United States Bureau of Reclamation. (2016b). Background. Retrieved March 28, 2016, from
http://www.usbr.gov/lc/region/programs/contracts/BCP-Background.pdf
United States Bureau of Reclamation. (2016c). Lower Colorado River Operations Schedule.
Retrieved April 17, 2016, from http://www.usbr.gov/lc/region/g4000/hourly/rivops.html
Walton, B. (2010). Low Water May Halt Hoover Dam’s Power. Retrieved April 4, 2016, from
http://www.circleofblue.org/2010/world/low-water-may-still-hoover-dam’s-power

24
Related Documents