What to Expect When you’re Expecting an Infant from a “Mother of Size” BORN Provincial Rounds May 16, 2013 Laura Gaudet, MSc, MD, FRCS

Welcome message from author
This document is posted to help you gain knowledge. Please leave a comment to let me know what you think about it! Share it to your friends and learn new things together.
Transcript
What to Expect When you’re Expecting
an Infant from a “Mother of Size”
BORN Provincial Rounds
May 16, 2013
Laura Gaudet,MSc, MD, FRCS
ObjectivesThrough participation in today’s
webinar, attendees will:
1. Be aware of the impact of a mother’s excess weight on her infant’s birthweight
2. Explore whether infants born to heavier mothers require additional resuscitative support
3. Discuss preventative measures to reduce newborn complications when the mother carries excess weight
Background
Obesity is common in Canada, In all age groups
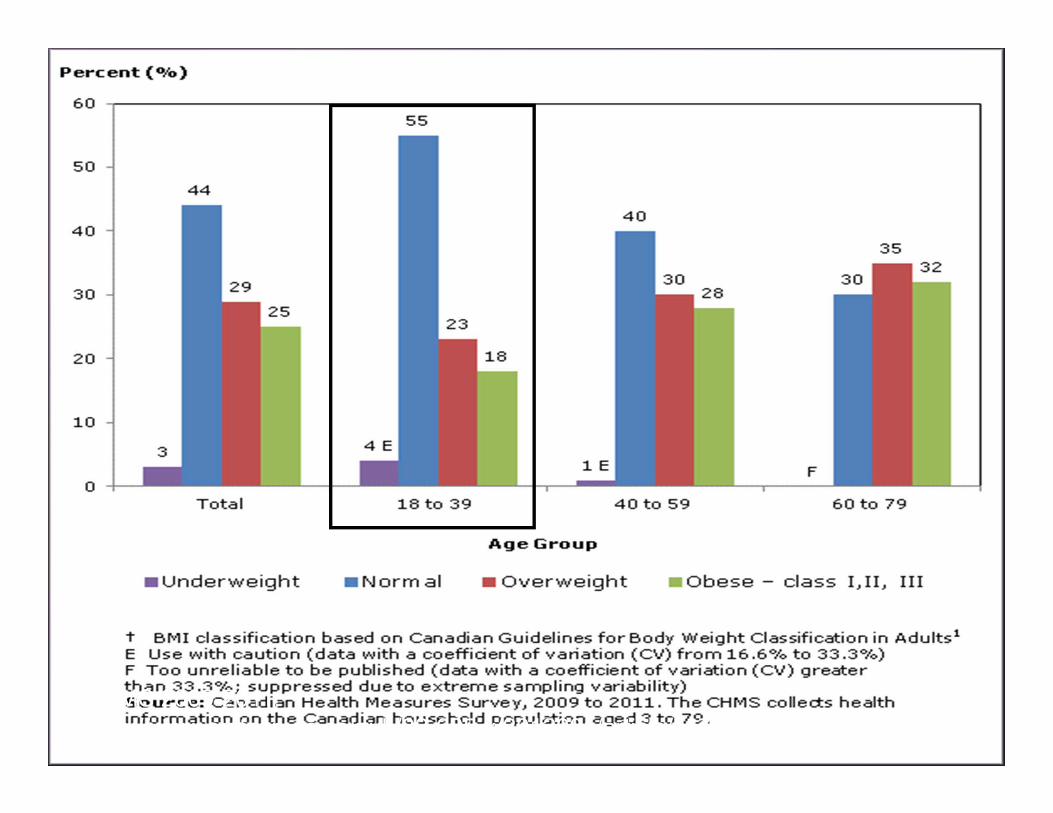
Background
Distribution of Canadian adult females by BMI2009-2011 CHMS
CHMS 2009-2011: http://www.statcan.gc.ca/pub/82-625-x/2012001/article/11708-eng.htm
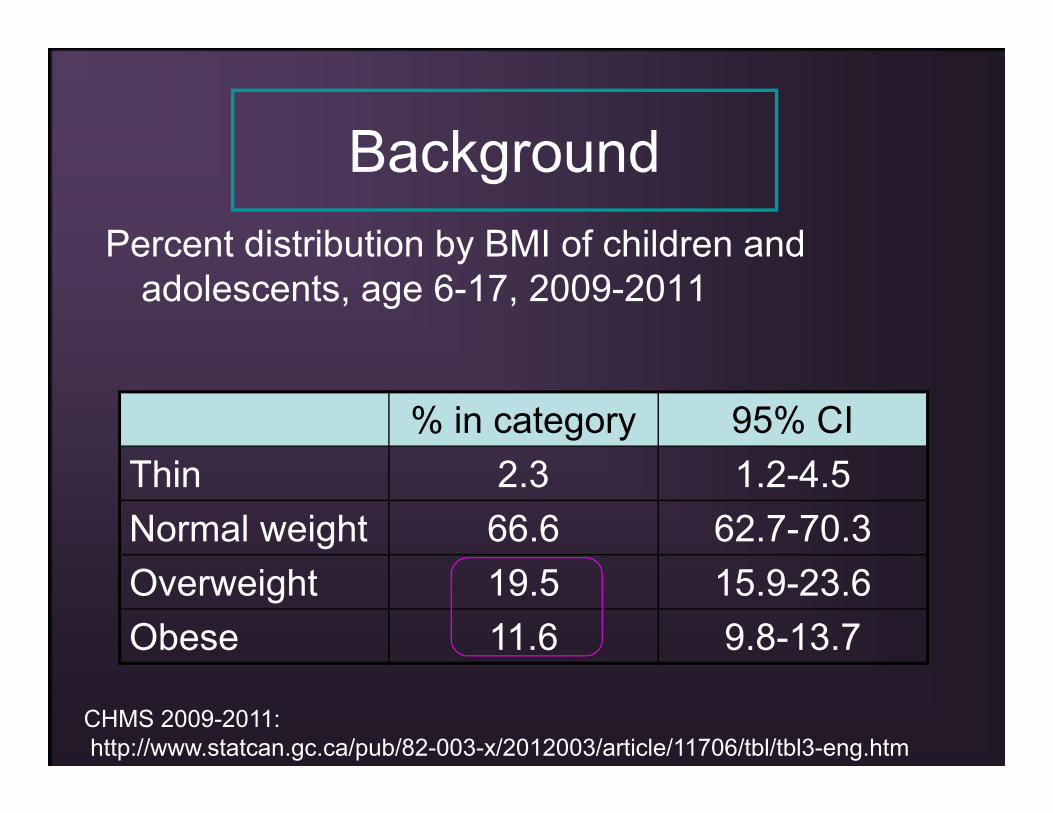
BackgroundPercent distribution by BMI of children and
adolescents, age 6-17, 2009-2011
% in category 95% CIThin 2.3 1.2-4.5Normal weight 66.6 62.7-70.3Overweight 19.5 15.9-23.6Obese 11.6 9.8-13.7
CHMS 2009-2011: http://www.statcan.gc.ca/pub/82-003-x/2012003/article/11706/tbl/tbl3-eng.htm
Background
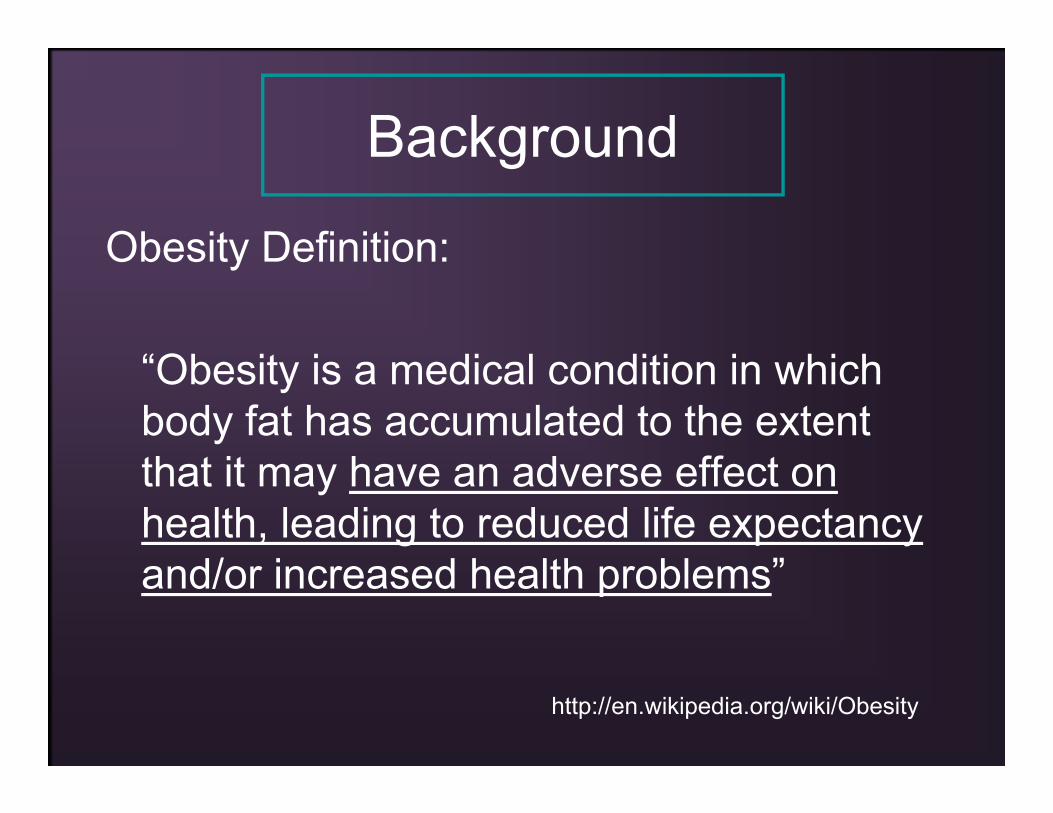
Obesity Definition:
“Obesity is a medical condition in which body fat has accumulated to the extent that it may have an adverse effect on health, leading to reduced life expectancy and/or increased health problems”
http://en.wikipedia.org/wiki/Obesity
Background
Obesity causes “increased health problems” in pregnancy, including
• Hypertensive disorders• Diabetes• Macrosomia• Intrauterine fetal death• Delivery by Caesarean section• Admission to NICU
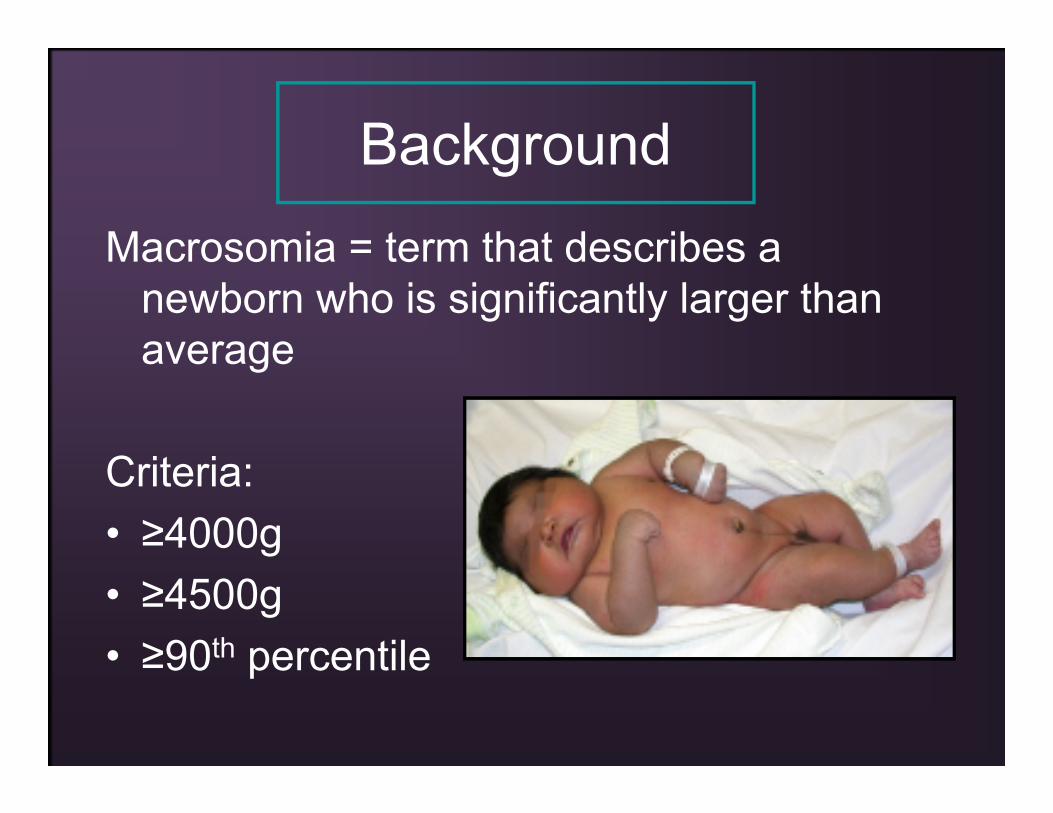
BackgroundMacrosomia = term that describes a
newborn who is significantly larger than average
Criteria:• ≥4000g• ≥4500g• ≥90th percentile
Background
Risk factorsHistory, diabetes, post-term pregnancy, maternal obesity, gender, non-smoking
ComplicationsMaternal, offspring
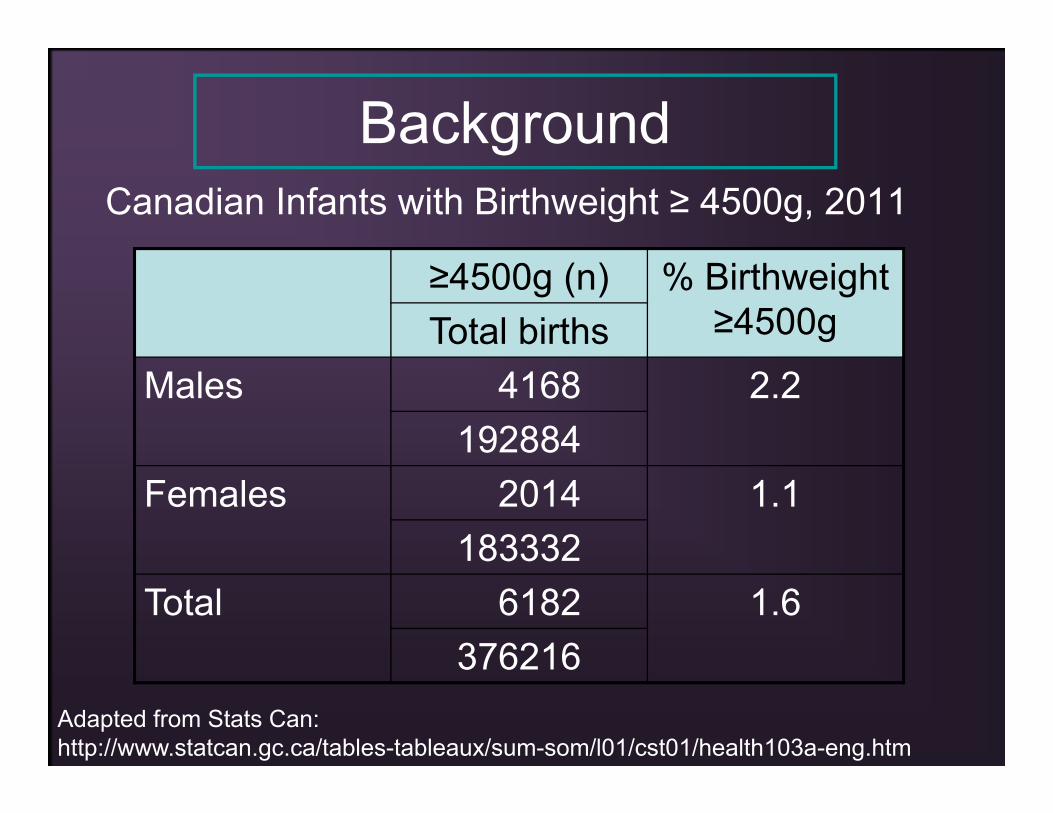
BackgroundCanadian Infants with Birthweight ≥ 4500g, 2011
≥4500g (n) % Birthweight ≥4500g Total births
Males 4168 2.2192884
Females 2014 1.1183332
Total 6182 1.6376216
Adapted from Stats Can: http://www.statcan.gc.ca/tables-tableaux/sum-som/l01/cst01/health103a-eng.htm
Food for Thought
Given that:
“Obesity is a medical condition in which body fat has accumulated to the extent that it may have an adverse effect on health, leading to reduced life expectancy and/or increased health problems”
Could fetal macrosomia be thought of as “fetal obesity”?
Background
Theme“improving the health of pregnant Canadian women who carry extra body weight and their offspring”
Background
We wondered:
A. How large the effect of excess maternal weight is in increasing birthweight
B. Whether immediate neonatal complications were more common when babies had mothers who were obese
Photo credit:USA Today
Mother’s Weight and Macrosomia
It has been shown previously that, in general, birthweights are higher for babies whose mothers are heavier
Systematic review of the literature was performed with the hypothesis that maternal obesity is associated with a significant increase in the prevalence of fetal macrosomia (birthweight ≥4000g, ≥4500g, ≥90th
percentile)
Mother’s Weight and Macrosomia
Included: observational studies that defined obesity as BMI ≥ 30 kg/m2, had a control group of women with BMI ≤ 25 kg/m2 and reported usable numbers
Excluded: articles without an English abstract
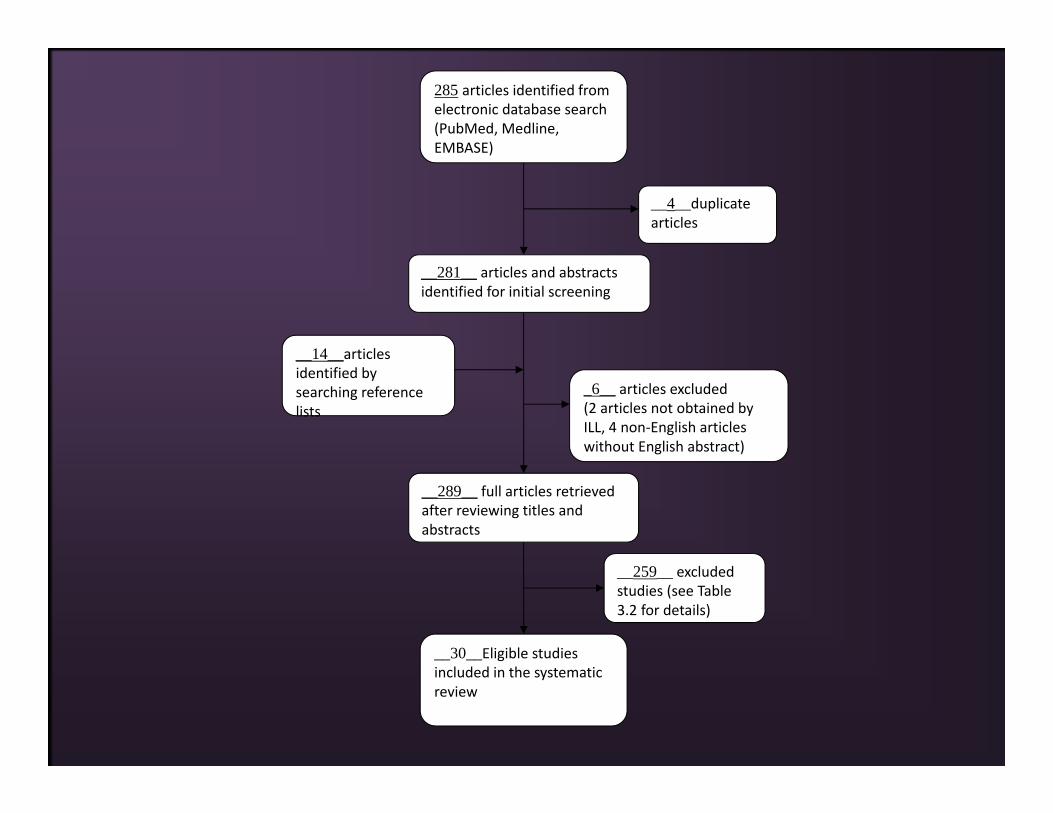
285 articles identified from electronic database search (PubMed, Medline, EMBASE)
__4__duplicate articles
__281__ articles and abstracts identified for initial screening
__14__articles identified by searching reference lists
_6__ articles excluded(2 articles not obtained by ILL, 4 non‐English articles without English abstract)
__289__ full articles retrieved after reviewing titles and abstracts
__259__ excluded studies (see Table 3.2 for details)
__30__Eligible studies included in the systematic review
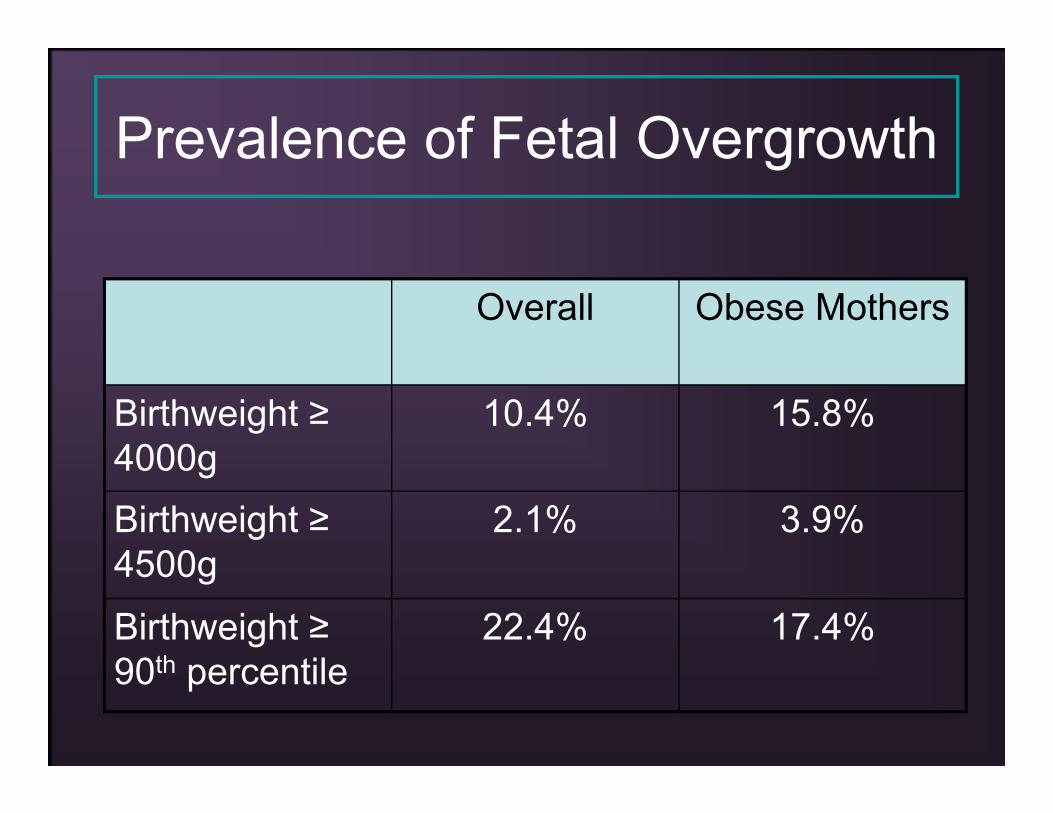
Prevalence of Fetal Overgrowth
Overall Obese Mothers
Birthweight ≥ 4000g
10.4% 15.8%
Birthweight ≥ 4500g
2.1% 3.9%
Birthweight ≥ 90th percentile
22.4% 17.4%
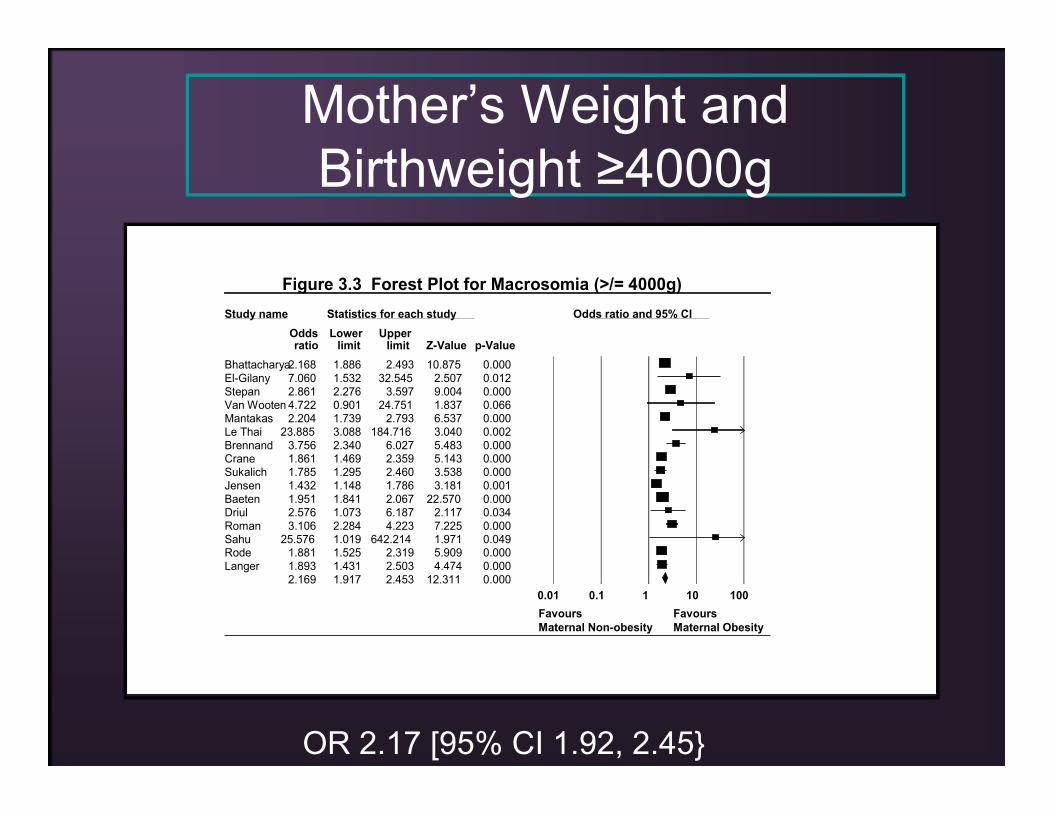
Mother’s Weight and Birthweight ≥4000g
Study name Statistics for each study Odds ratio and 95% CIOdds Lower Upper ratio limit limit Z-Value p-Value
Bhattacharya2.168 1.886 2.493 10.875 0.000El-Gilany 7.060 1.532 32.545 2.507 0.012Stepan 2.861 2.276 3.597 9.004 0.000Van Wooten 4.722 0.901 24.751 1.837 0.066Mantakas 2.204 1.739 2.793 6.537 0.000Le Thai 23.885 3.088 184.716 3.040 0.002Brennand 3.756 2.340 6.027 5.483 0.000Crane 1.861 1.469 2.359 5.143 0.000Sukalich 1.785 1.295 2.460 3.538 0.000Jensen 1.432 1.148 1.786 3.181 0.001Baeten 1.951 1.841 2.067 22.570 0.000Driul 2.576 1.073 6.187 2.117 0.034Roman 3.106 2.284 4.223 7.225 0.000Sahu 25.576 1.019 642.214 1.971 0.049Rode 1.881 1.525 2.319 5.909 0.000Langer 1.893 1.431 2.503 4.474 0.000
2.169 1.917 2.453 12.311 0.0000.01 0.1 1 10 100Favours Maternal Non-obesity
Favours Maternal Obesity
Figure 3.3 Forest Plot for Macrosomia (>/= 4000g)Study name Statistics for each study Odds ratio and 95% CI
Odds Lower Upper ratio limit limit Z-Value p-Value
Bhattacharya2.168 1.886 2.493 10.875 0.000El-Gilany 7.060 1.532 32.545 2.507 0.012Stepan 2.861 2.276 3.597 9.004 0.000Van Wooten 4.722 0.901 24.751 1.837 0.066Mantakas 2.204 1.739 2.793 6.537 0.000Le Thai 23.885 3.088 184.716 3.040 0.002Brennand 3.756 2.340 6.027 5.483 0.000Crane 1.861 1.469 2.359 5.143 0.000Sukalich 1.785 1.295 2.460 3.538 0.000Jensen 1.432 1.148 1.786 3.181 0.001Baeten 1.951 1.841 2.067 22.570 0.000Driul 2.576 1.073 6.187 2.117 0.034Roman 3.106 2.284 4.223 7.225 0.000Sahu 25.576 1.019 642.214 1.971 0.049Rode 1.881 1.525 2.319 5.909 0.000Langer 1.893 1.431 2.503 4.474 0.000
2.169 1.917 2.453 12.311 0.0000.01 0.1 1 10 100Favours Maternal Non-obesity
Favours Maternal Obesity
Figure 3.3 Forest Plot for Macrosomia (>/= 4000g)
OR 2.17 [95% CI 1.92, 2.45}
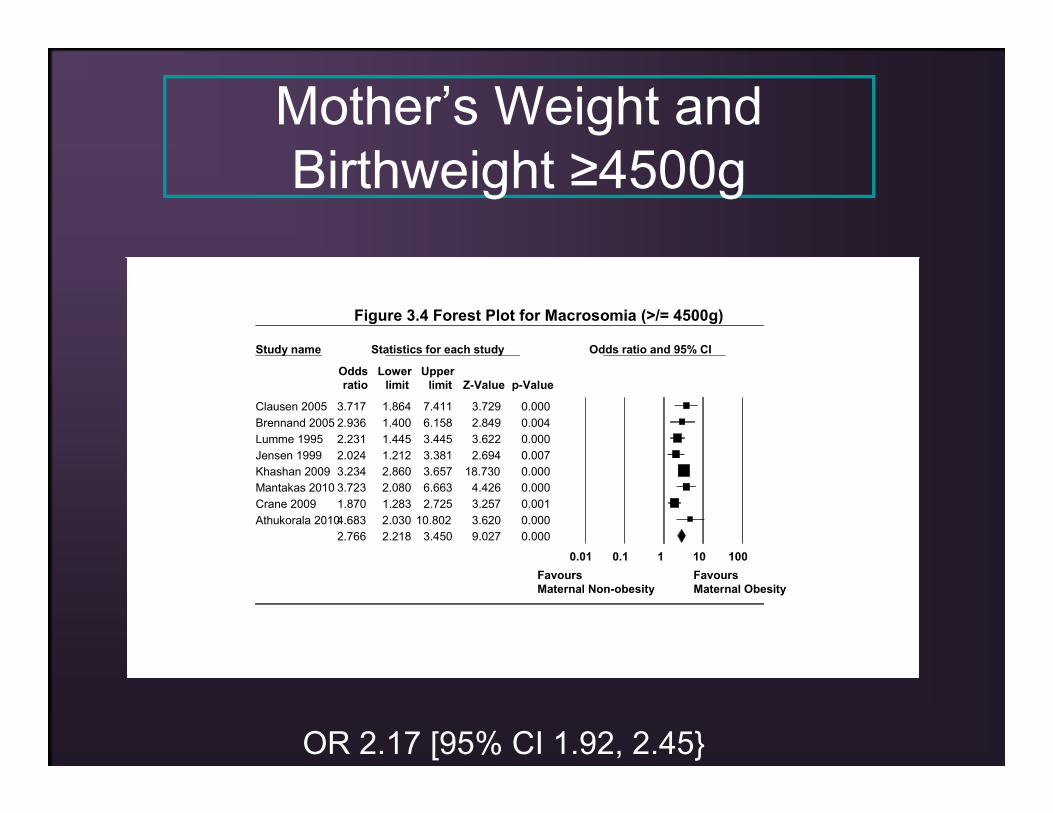
Mother’s Weight and Birthweight ≥4500g
OR 2.17 [95% CI 1.92, 2.45}
Study name Statistics for each study Odds ratio and 95% CI
Odds Lower Upper ratio limit limit Z-Value p-Value
Clausen 2005 3.717 1.864 7.411 3.729 0.000Brennand 2005 2.936 1.400 6.158 2.849 0.004Lumme 1995 2.231 1.445 3.445 3.622 0.000Jensen 1999 2.024 1.212 3.381 2.694 0.007Khashan 2009 3.234 2.860 3.657 18.730 0.000Mantakas 2010 3.723 2.080 6.663 4.426 0.000Crane 2009 1.870 1.283 2.725 3.257 0.001Athukorala 20104.683 2.030 10.802 3.620 0.000
2.766 2.218 3.450 9.027 0.000
0.01 0.1 1 10 100FavoursMaternal Non-obesity
FavoursMaternal Obesity
Figure 3.4 Forest Plot for Macrosomia (>/= 4500g)
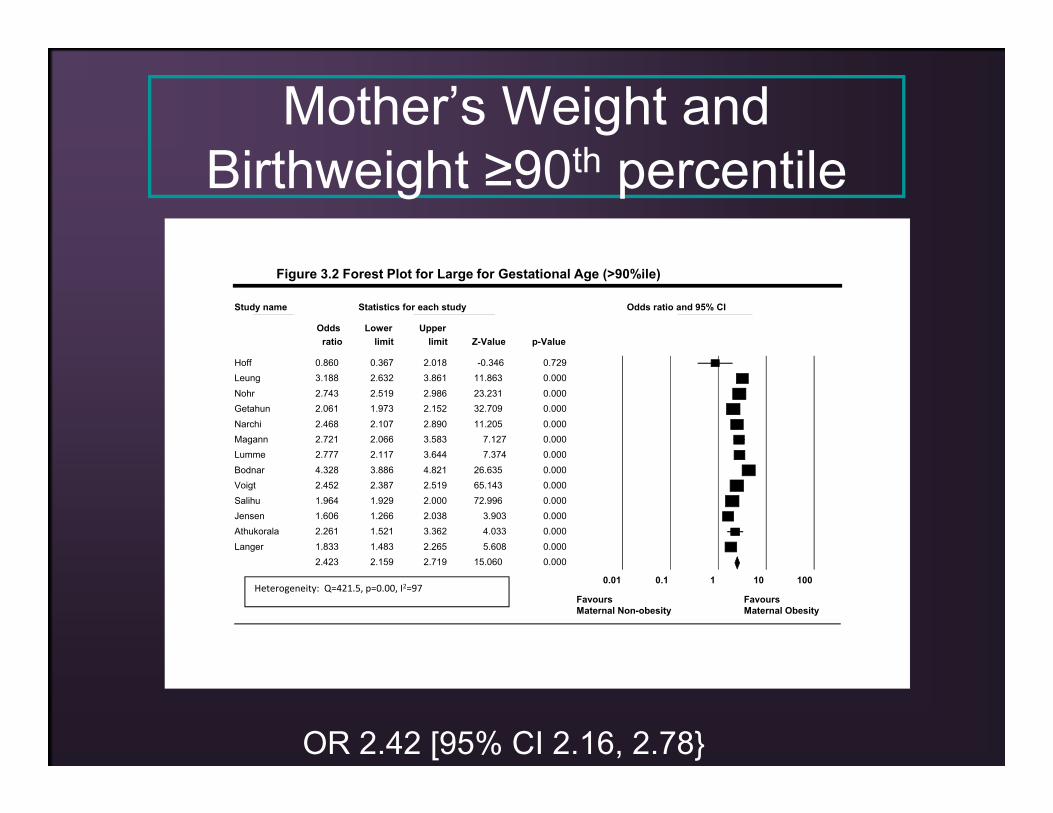
Mother’s Weight and Birthweight ≥90th percentile
Study name Statistics for each study Odds ratio and 95% CI
Odds Lower Upper ratio limit limit Z-Value p-Value
Hoff 0.860 0.367 2.018 -0.346 0.729Leung 3.188 2.632 3.861 11.863 0.000Nohr 2.743 2.519 2.986 23.231 0.000Getahun 2.061 1.973 2.152 32.709 0.000Narchi 2.468 2.107 2.890 11.205 0.000Magann 2.721 2.066 3.583 7.127 0.000Lumme 2.777 2.117 3.644 7.374 0.000Bodnar 4.328 3.886 4.821 26.635 0.000Voigt 2.452 2.387 2.519 65.143 0.000Salihu 1.964 1.929 2.000 72.996 0.000Jensen 1.606 1.266 2.038 3.903 0.000Athukorala 2.261 1.521 3.362 4.033 0.000Langer 1.833 1.483 2.265 5.608 0.000
2.423 2.159 2.719 15.060 0.000
0.01 0.1 1 10 100
Favours Maternal Non-obesity
Favours Maternal Obesity
Figure 3.2 Forest Plot for Large for Gestational Age (>90%ile)
Heterogeneity: Q=421.5, p=0.00, I2=97
OR 2.42 [95% CI 2.16, 2.78}
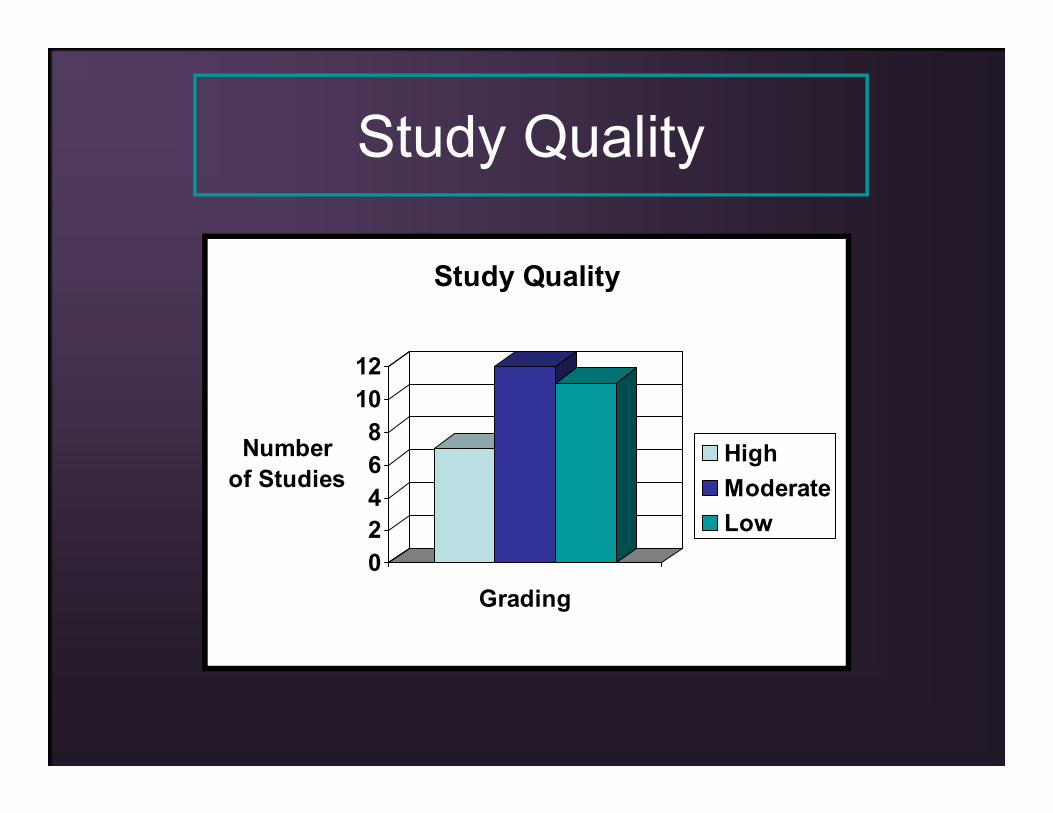
Study Quality
02468
1012
Number of Studies
Grading
Study Quality
HighModerateLow
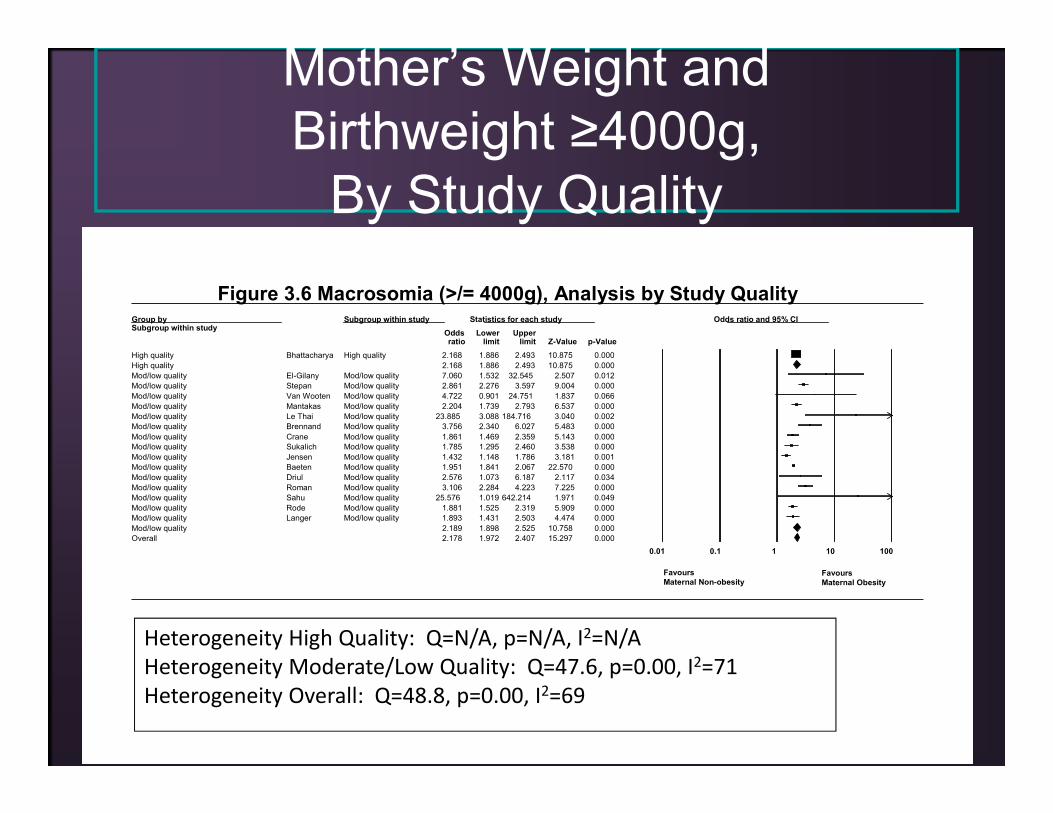
Mother’s Weight and Birthweight ≥4000g,
By Study Quality
Group bySubgroup within study
Subgroup within study Statistics for each study Odds ratio and 95% CIOdds Lower Upper ratio limit limit Z-Value p-Value
High quality Bhattacharya High quality 2.168 1.886 2.493 10.875 0.000High quality 2.168 1.886 2.493 10.875 0.000Mod/low quality El-Gilany Mod/low quality 7.060 1.532 32.545 2.507 0.012Mod/low quality Stepan Mod/low quality 2.861 2.276 3.597 9.004 0.000Mod/low quality Van Wooten Mod/low quality 4.722 0.901 24.751 1.837 0.066Mod/low quality Mantakas Mod/low quality 2.204 1.739 2.793 6.537 0.000Mod/low quality Le Thai Mod/low quality 23.885 3.088 184.716 3.040 0.002Mod/low quality Brennand Mod/low quality 3.756 2.340 6.027 5.483 0.000Mod/low quality Crane Mod/low quality 1.861 1.469 2.359 5.143 0.000Mod/low quality Sukalich Mod/low quality 1.785 1.295 2.460 3.538 0.000Mod/low quality Jensen Mod/low quality 1.432 1.148 1.786 3.181 0.001Mod/low quality Baeten Mod/low quality 1.951 1.841 2.067 22.570 0.000Mod/low quality Driul Mod/low quality 2.576 1.073 6.187 2.117 0.034Mod/low quality Roman Mod/low quality 3.106 2.284 4.223 7.225 0.000Mod/low quality Sahu Mod/low quality 25.576 1.019 642.214 1.971 0.049Mod/low quality Rode Mod/low quality 1.881 1.525 2.319 5.909 0.000Mod/low quality Langer Mod/low quality 1.893 1.431 2.503 4.474 0.000Mod/low quality 2.189 1.898 2.525 10.758 0.000Overall 2.178 1.972 2.407 15.297 0.000
0.01 0.1 1 10 100
Favours Maternal Non-obesity
Favours Maternal Obesity
Figure 3.6 Macrosomia (>/= 4000g), Analysis by Study QualityGroup bySubgroup within study
Subgroup within study Statistics for each study Odds ratio and 95% CIOdds Lower Upper ratio limit limit Z-Value p-Value
High quality Bhattacharya High quality 2.168 1.886 2.493 10.875 0.000High quality 2.168 1.886 2.493 10.875 0.000Mod/low quality El-Gilany Mod/low quality 7.060 1.532 32.545 2.507 0.012Mod/low quality Stepan Mod/low quality 2.861 2.276 3.597 9.004 0.000Mod/low quality Van Wooten Mod/low quality 4.722 0.901 24.751 1.837 0.066Mod/low quality Mantakas Mod/low quality 2.204 1.739 2.793 6.537 0.000Mod/low quality Le Thai Mod/low quality 23.885 3.088 184.716 3.040 0.002Mod/low quality Brennand Mod/low quality 3.756 2.340 6.027 5.483 0.000Mod/low quality Crane Mod/low quality 1.861 1.469 2.359 5.143 0.000Mod/low quality Sukalich Mod/low quality 1.785 1.295 2.460 3.538 0.000Mod/low quality Jensen Mod/low quality 1.432 1.148 1.786 3.181 0.001Mod/low quality Baeten Mod/low quality 1.951 1.841 2.067 22.570 0.000Mod/low quality Driul Mod/low quality 2.576 1.073 6.187 2.117 0.034Mod/low quality Roman Mod/low quality 3.106 2.284 4.223 7.225 0.000Mod/low quality Sahu Mod/low quality 25.576 1.019 642.214 1.971 0.049Mod/low quality Rode Mod/low quality 1.881 1.525 2.319 5.909 0.000Mod/low quality Langer Mod/low quality 1.893 1.431 2.503 4.474 0.000Mod/low quality 2.189 1.898 2.525 10.758 0.000Overall 2.178 1.972 2.407 15.297 0.000
0.01 0.1 1 10 100
Group bySubgroup within study
Subgroup within study Statistics for each study Odds ratio and 95% CIOdds Lower Upper ratio limit limit Z-Value p-Value
High quality Bhattacharya High quality 2.168 1.886 2.493 10.875 0.000High quality 2.168 1.886 2.493 10.875 0.000Mod/low quality El-Gilany Mod/low quality 7.060 1.532 32.545 2.507 0.012Mod/low quality Stepan Mod/low quality 2.861 2.276 3.597 9.004 0.000Mod/low quality Van Wooten Mod/low quality 4.722 0.901 24.751 1.837 0.066Mod/low quality Mantakas Mod/low quality 2.204 1.739 2.793 6.537 0.000Mod/low quality Le Thai Mod/low quality 23.885 3.088 184.716 3.040 0.002Mod/low quality Brennand Mod/low quality 3.756 2.340 6.027 5.483 0.000Mod/low quality Crane Mod/low quality 1.861 1.469 2.359 5.143 0.000Mod/low quality Sukalich Mod/low quality 1.785 1.295 2.460 3.538 0.000Mod/low quality Jensen Mod/low quality 1.432 1.148 1.786 3.181 0.001Mod/low quality Baeten Mod/low quality 1.951 1.841 2.067 22.570 0.000Mod/low quality Driul Mod/low quality 2.576 1.073 6.187 2.117 0.034Mod/low quality Roman Mod/low quality 3.106 2.284 4.223 7.225 0.000Mod/low quality Sahu Mod/low quality 25.576 1.019 642.214 1.971 0.049Mod/low quality Rode Mod/low quality 1.881 1.525 2.319 5.909 0.000Mod/low quality Langer Mod/low quality 1.893 1.431 2.503 4.474 0.000Mod/low quality 2.189 1.898 2.525 10.758 0.000Overall 2.178 1.972 2.407 15.297 0.000
0.01 0.1 1 10 100
Favours Maternal Non-obesity
Favours Maternal Obesity
Figure 3.6 Macrosomia (>/= 4000g), Analysis by Study Quality
Heterogeneity High Quality: Q=N/A, p=N/A, I2=N/AHeterogeneity Moderate/Low Quality: Q=47.6, p=0.00, I2=71Heterogeneity Overall: Q=48.8, p=0.00, I2=69
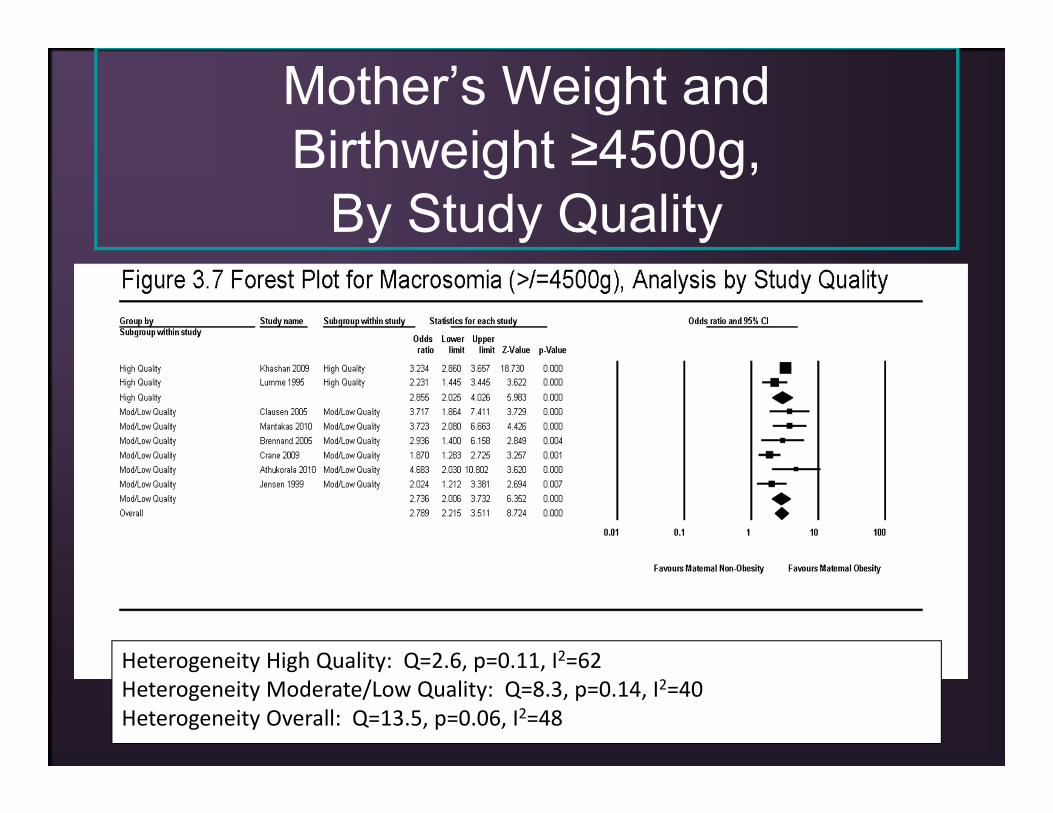
Mother’s Weight and Birthweight ≥4500g,
By Study Quality
Heterogeneity High Quality: Q=2.6, p=0.11, I2=62Heterogeneity Moderate/Low Quality: Q=8.3, p=0.14, I2=40Heterogeneity Overall: Q=13.5, p=0.06, I2=48
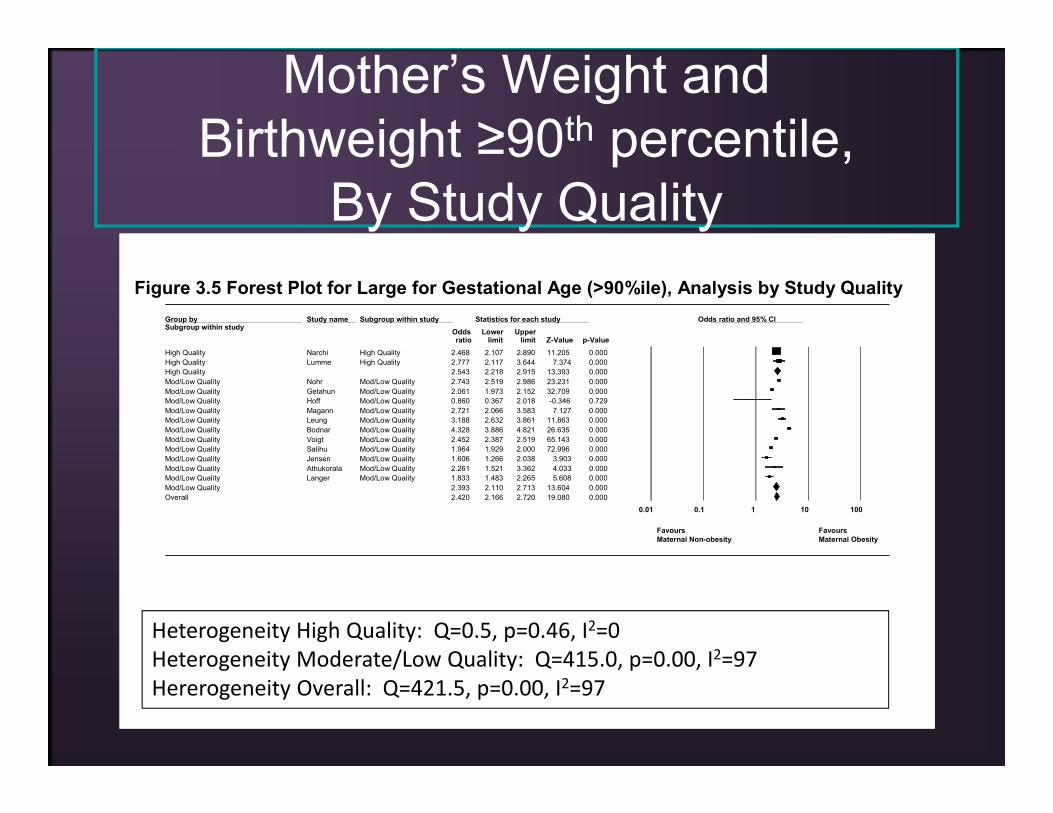
Mother’s Weight and Birthweight ≥90th percentile,
By Study Quality
Group bySubgroup within study
Study name Subgroup within study Statistics for each study Odds ratio and 95% CIOdds Lower Upper ratio limit limit Z-Value p-Value
High Quality Narchi High Quality 2.468 2.107 2.890 11.205 0.000High Quality Lumme High Quality 2.777 2.117 3.644 7.374 0.000High Quality 2.543 2.218 2.915 13.393 0.000Mod/Low Quality Nohr Mod/Low Quality 2.743 2.519 2.986 23.231 0.000Mod/Low Quality Getahun Mod/Low Quality 2.061 1.973 2.152 32.709 0.000Mod/Low Quality Hoff Mod/Low Quality 0.860 0.367 2.018 -0.346 0.729Mod/Low Quality Magann Mod/Low Quality 2.721 2.066 3.583 7.127 0.000Mod/Low Quality Leung Mod/Low Quality 3.188 2.632 3.861 11.863 0.000Mod/Low Quality Bodnar Mod/Low Quality 4.328 3.886 4.821 26.635 0.000Mod/Low Quality Voigt Mod/Low Quality 2.452 2.387 2.519 65.143 0.000Mod/Low Quality Salihu Mod/Low Quality 1.964 1.929 2.000 72.996 0.000Mod/Low Quality Jensen Mod/Low Quality 1.606 1.266 2.038 3.903 0.000Mod/Low Quality Athukorala Mod/Low Quality 2.261 1.521 3.362 4.033 0.000Mod/Low Quality Langer Mod/Low Quality 1.833 1.483 2.265 5.608 0.000Mod/Low Quality 2.393 2.110 2.713 13.604 0.000Overall 2.420 2.166 2.720 19.080 0.000
0.01 0.1 1 10 100
Favours Maternal Non-obesity
Favours Maternal Obesity
Figure 3.5 Forest Plot for Large for Gestational Age (>90%ile), Analysis by Study QualityGroup bySubgroup within study
Study name Subgroup within study Statistics for each study Odds ratio and 95% CIOdds Lower Upper ratio limit limit Z-Value p-Value
High Quality Narchi High Quality 2.468 2.107 2.890 11.205 0.000High Quality Lumme High Quality 2.777 2.117 3.644 7.374 0.000High Quality 2.543 2.218 2.915 13.393 0.000Mod/Low Quality Nohr Mod/Low Quality 2.743 2.519 2.986 23.231 0.000Mod/Low Quality Getahun Mod/Low Quality 2.061 1.973 2.152 32.709 0.000Mod/Low Quality Hoff Mod/Low Quality 0.860 0.367 2.018 -0.346 0.729Mod/Low Quality Magann Mod/Low Quality 2.721 2.066 3.583 7.127 0.000Mod/Low Quality Leung Mod/Low Quality 3.188 2.632 3.861 11.863 0.000Mod/Low Quality Bodnar Mod/Low Quality 4.328 3.886 4.821 26.635 0.000Mod/Low Quality Voigt Mod/Low Quality 2.452 2.387 2.519 65.143 0.000Mod/Low Quality Salihu Mod/Low Quality 1.964 1.929 2.000 72.996 0.000Mod/Low Quality Jensen Mod/Low Quality 1.606 1.266 2.038 3.903 0.000Mod/Low Quality Athukorala Mod/Low Quality 2.261 1.521 3.362 4.033 0.000Mod/Low Quality Langer Mod/Low Quality 1.833 1.483 2.265 5.608 0.000Mod/Low Quality 2.393 2.110 2.713 13.604 0.000Overall 2.420 2.166 2.720 19.080 0.000
0.01 0.1 1 10 100
Favours Maternal Non-obesity
Favours Maternal Obesity
Figure 3.5 Forest Plot for Large for Gestational Age (>90%ile), Analysis by Study Quality
Heterogeneity High Quality: Q=0.5, p=0.46, I2=0Heterogeneity Moderate/Low Quality: Q=415.0, p=0.00, I2=97Hererogeneity Overall: Q=421.5, p=0.00, I2=97
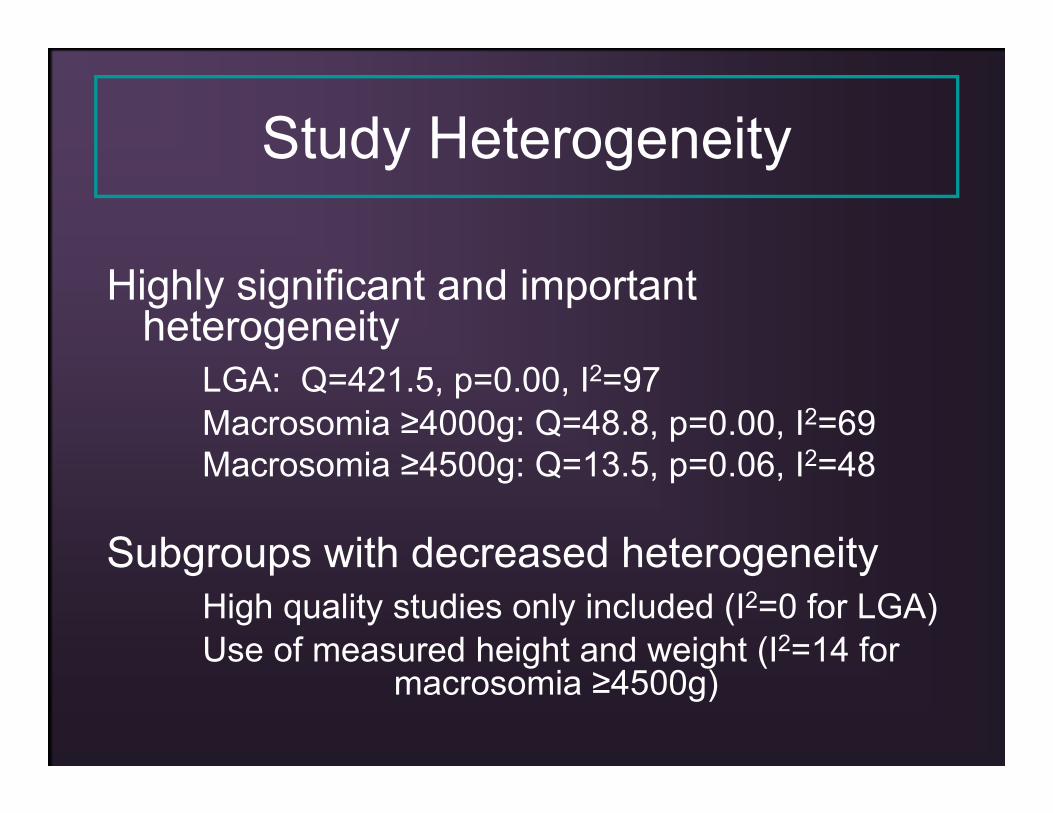
Study Heterogeneity
Highly significant and important heterogeneity
LGA: Q=421.5, p=0.00, I2=97Macrosomia ≥4000g: Q=48.8, p=0.00, I2=69Macrosomia ≥4500g: Q=13.5, p=0.06, I2=48
Subgroups with decreased heterogeneityHigh quality studies only included (I2=0 for LGA)Use of measured height and weight (I2=14 for
macrosomia ≥4500g)
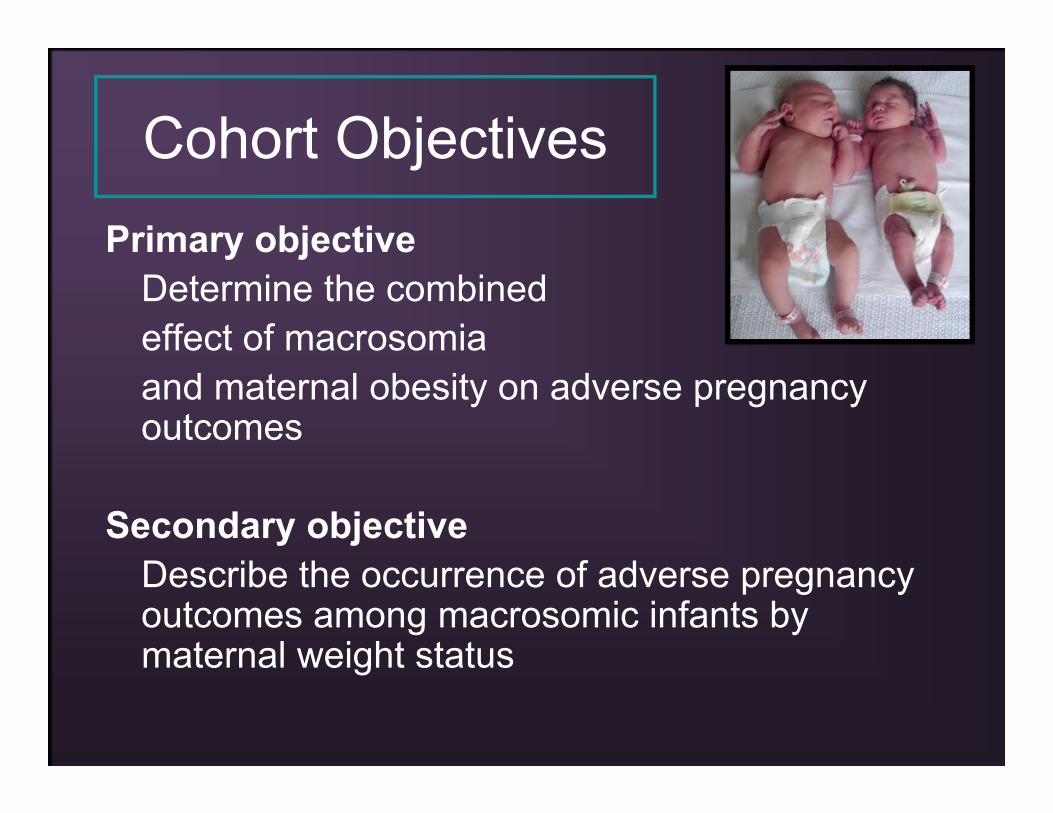
Cohort ObjectivesPrimary objective
Determine the combined effect of macrosomia and maternal obesity on adverse pregnancy outcomes
Secondary objectiveDescribe the occurrence of adverse pregnancy outcomes among macrosomic infants by maternal weight status
Cohort Methodology
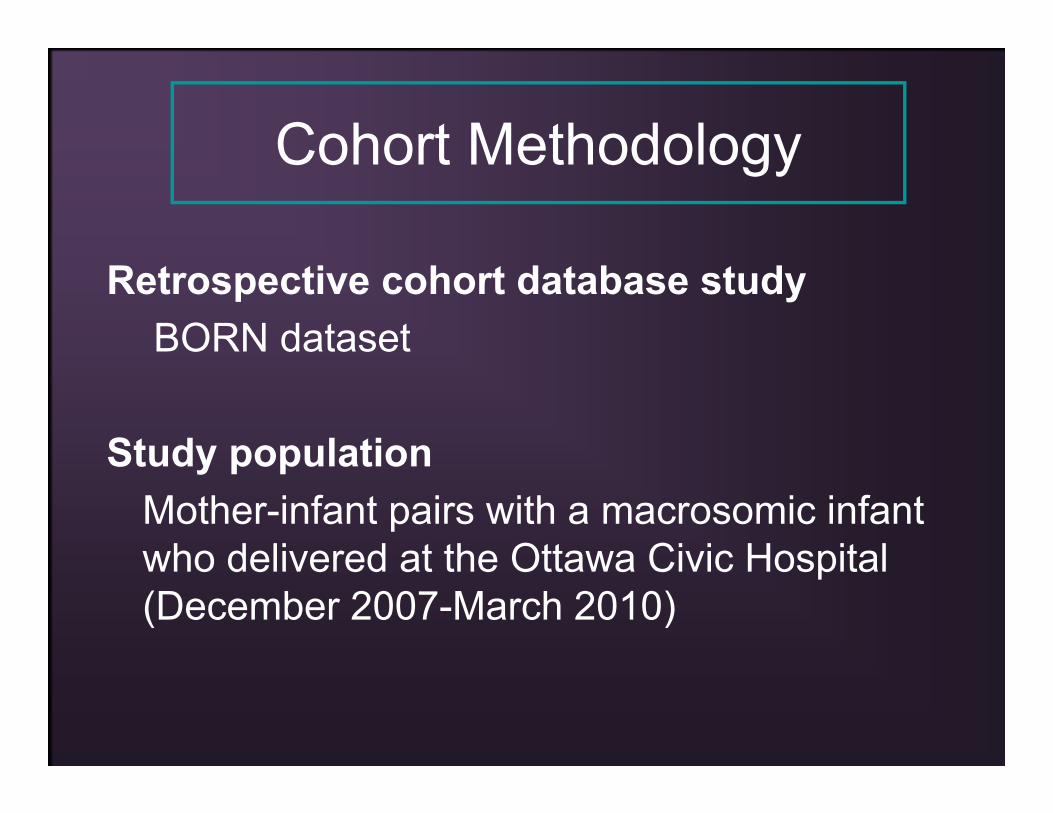
Retrospective cohort database studyBORN dataset
Study populationMother-infant pairs with a macrosomic infant who delivered at the Ottawa Civic Hospital (December 2007-March 2010)
Cohort Methodology
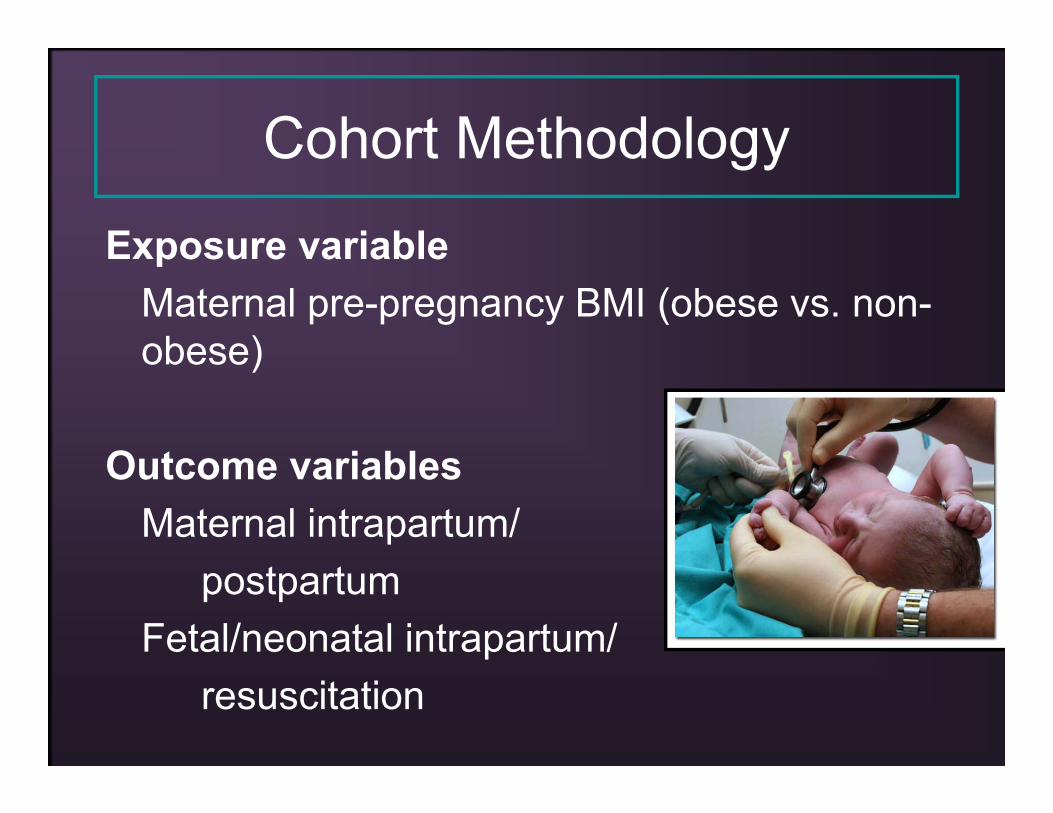
Exposure variableMaternal pre-pregnancy BMI (obese vs. non-obese)
Outcome variablesMaternal intrapartum/
postpartumFetal/neonatal intrapartum/
resuscitation
Cohort Methodology
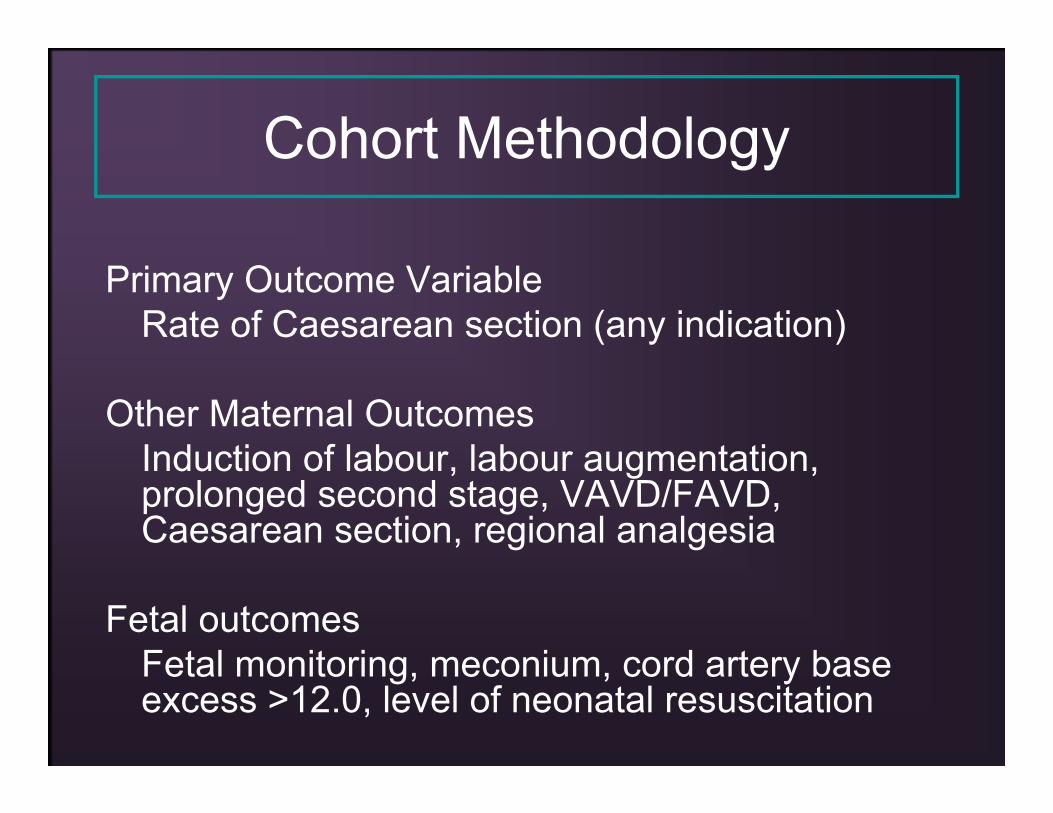
Primary Outcome VariableRate of Caesarean section (any indication)
Other Maternal OutcomesInduction of labour, labour augmentation, prolonged second stage, VAVD/FAVD, Caesarean section, regional analgesia
Fetal outcomesFetal monitoring, meconium, cord artery base excess >12.0, level of neonatal resuscitation
Cohort Methodology
Statistical Analyses
Descriptive: Fisher’s exact and t-test
Multivariate logistic regression modelling
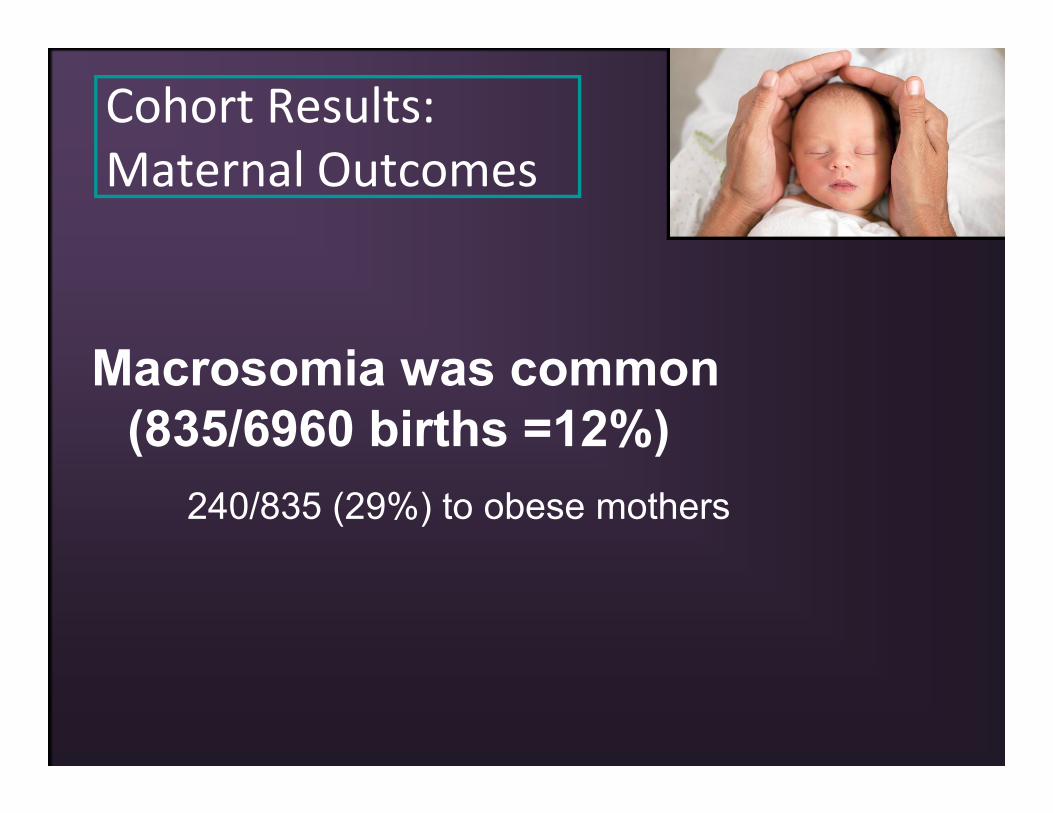
Cohort Results: Maternal Outcomes
Macrosomia was common (835/6960 births =12%)
240/835 (29%) to obese mothers
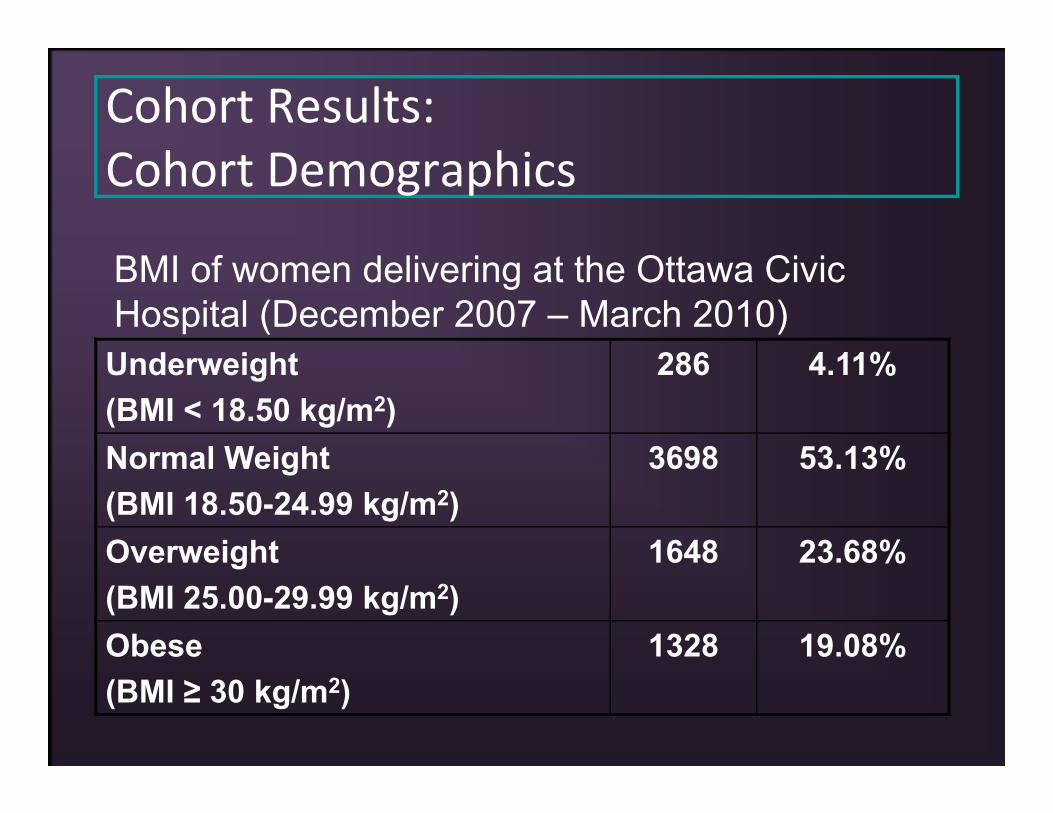
Cohort Results: Cohort Demographics
Underweight(BMI < 18.50 kg/m2)
286 4.11%
Normal Weight(BMI 18.50-24.99 kg/m2)
3698 53.13%
Overweight(BMI 25.00-29.99 kg/m2)
1648 23.68%
Obese(BMI ≥ 30 kg/m2)
1328 19.08%
BMI of women delivering at the Ottawa Civic Hospital (December 2007 – March 2010)
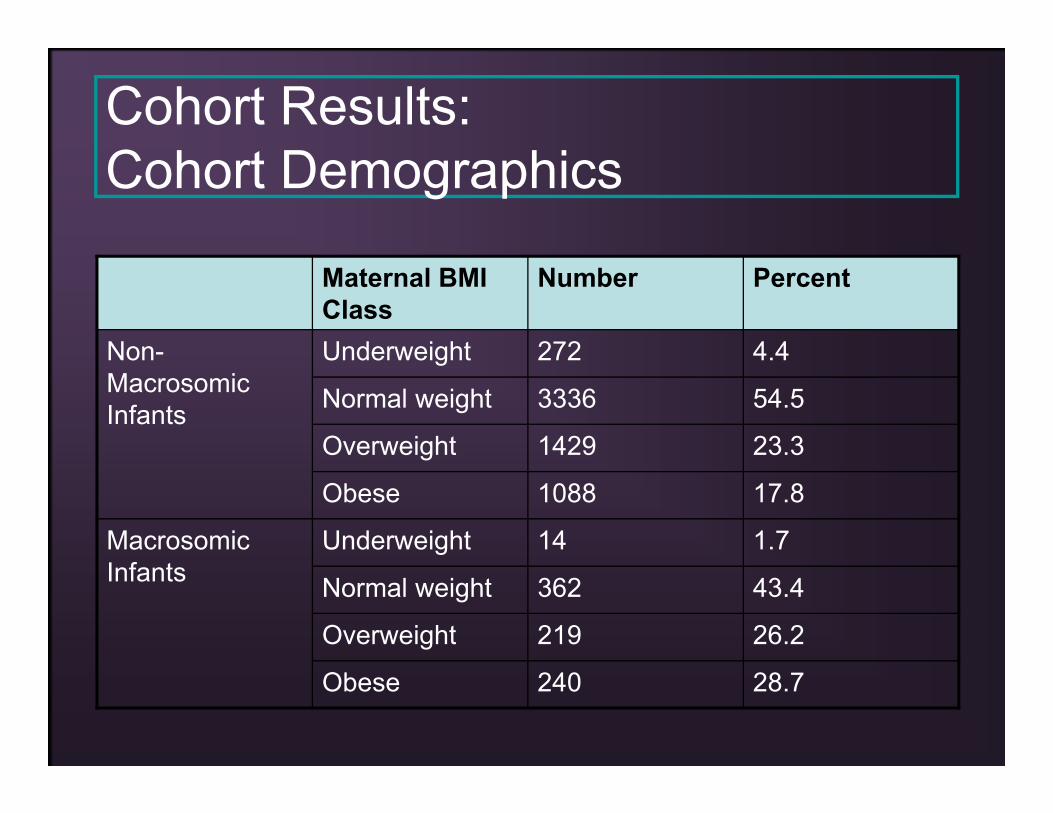
Cohort Results: Cohort Demographics
Maternal BMI Class
Number Percent
Non-Macrosomic Infants
Underweight 272 4.4
Normal weight 3336 54.5
Overweight 1429 23.3
Obese 1088 17.8
Macrosomic Infants
Underweight 14 1.7
Normal weight 362 43.4
Overweight 219 26.2
Obese 240 28.7
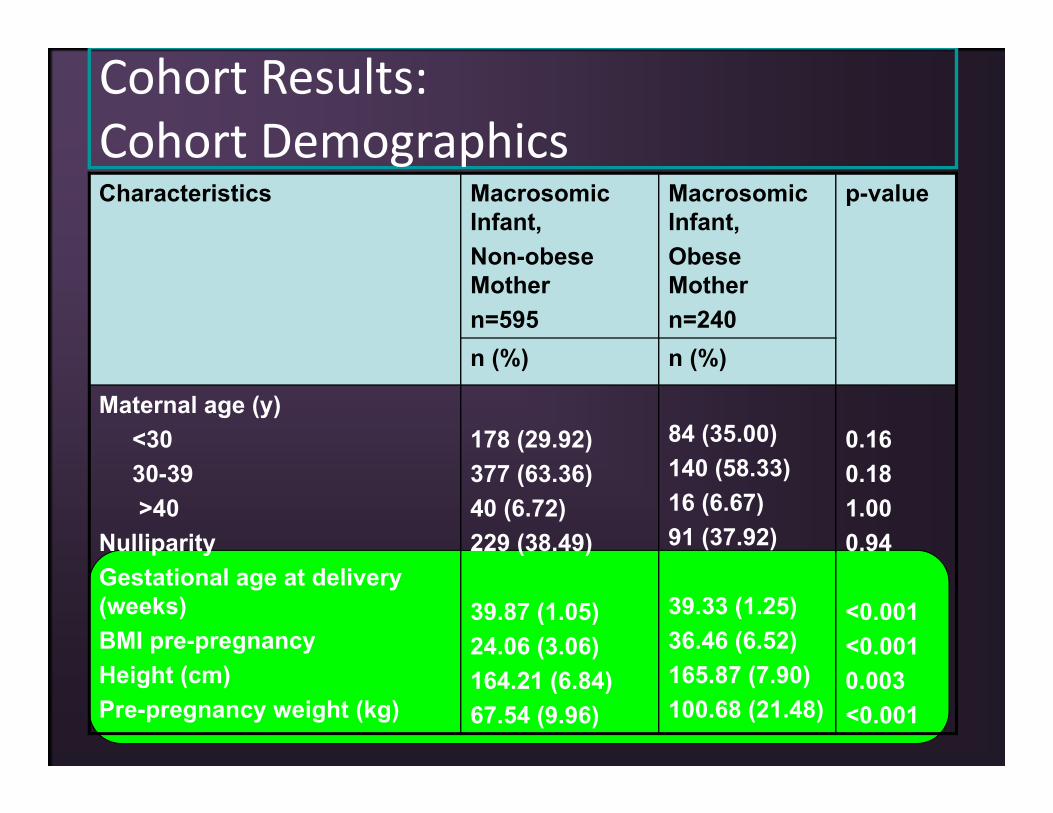
Characteristics Macrosomic Infant,Non-obese Mothern=595
Macrosomic Infant, Obese Mothern=240
p-value
n (%) n (%)
Maternal age (y)<3030-39>40
NulliparityGestational age at delivery (weeks)BMI pre-pregnancyHeight (cm)Pre-pregnancy weight (kg)
178 (29.92)377 (63.36)40 (6.72)229 (38.49)
39.87 (1.05)24.06 (3.06)164.21 (6.84)67.54 (9.96)
84 (35.00)140 (58.33)16 (6.67)91 (37.92)
39.33 (1.25)36.46 (6.52)165.87 (7.90)100.68 (21.48)
0.160.181.000.94
<0.001<0.0010.003<0.001
Cohort Results: Cohort Demographics
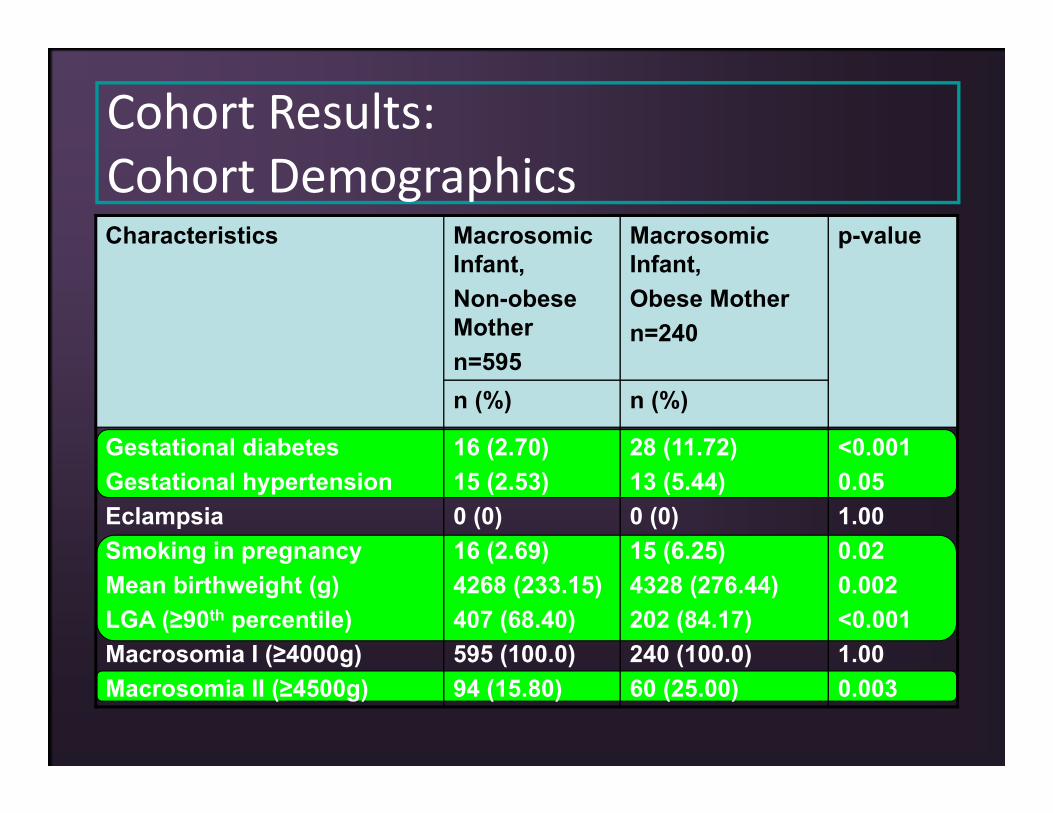
Characteristics Macrosomic Infant,Non-obese Mothern=595
Macrosomic Infant, Obese Mothern=240
p-value
n (%) n (%)
Gestational diabetesGestational hypertensionEclampsiaSmoking in pregnancyMean birthweight (g)LGA (≥90th percentile)Macrosomia I (≥4000g)Macrosomia II (≥4500g)
16 (2.70)15 (2.53)0 (0)16 (2.69)4268 (233.15)407 (68.40)595 (100.0)94 (15.80)
28 (11.72)13 (5.44)0 (0)15 (6.25)4328 (276.44)202 (84.17)240 (100.0)60 (25.00)
<0.0010.051.000.020.002<0.0011.000.003
Cohort Results: Cohort Demographics
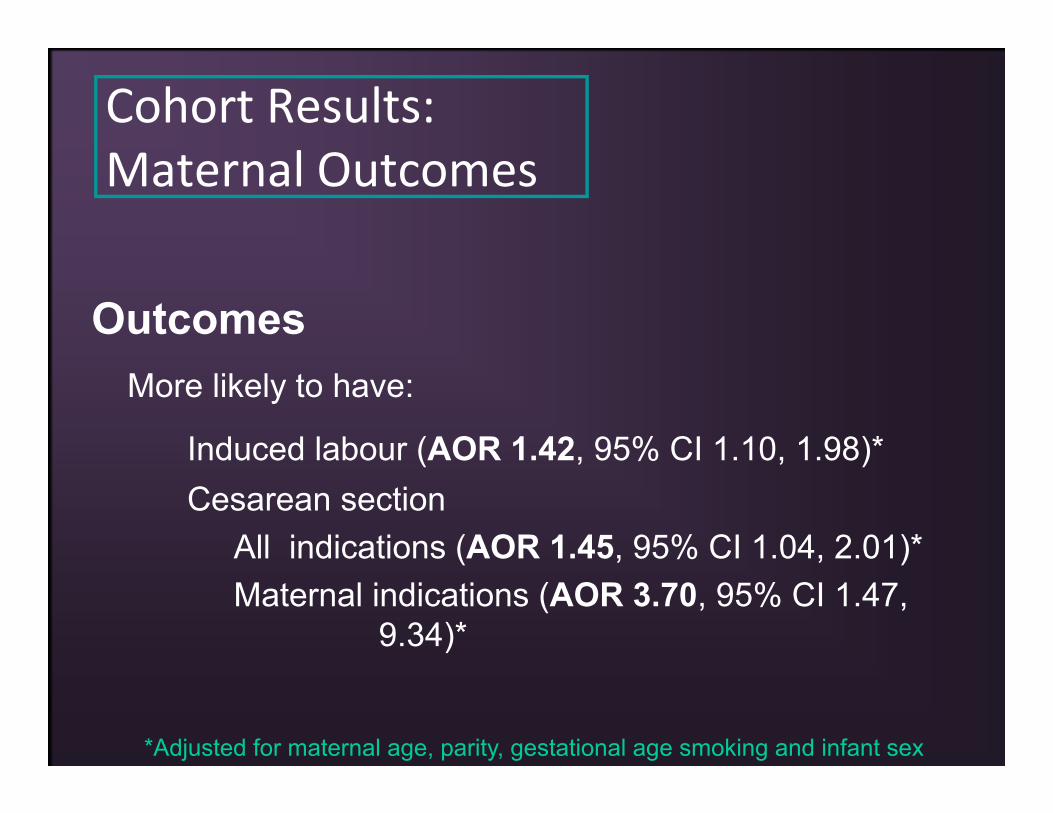
Cohort Results: Maternal Outcomes
OutcomesMore likely to have:
Induced labour (AOR 1.42, 95% CI 1.10, 1.98)*Cesarean section
All indications (AOR 1.45, 95% CI 1.04, 2.01)*Maternal indications (AOR 3.70, 95% CI 1.47,
9.34)*
*Adjusted for maternal age, parity, gestational age smoking and infant sex
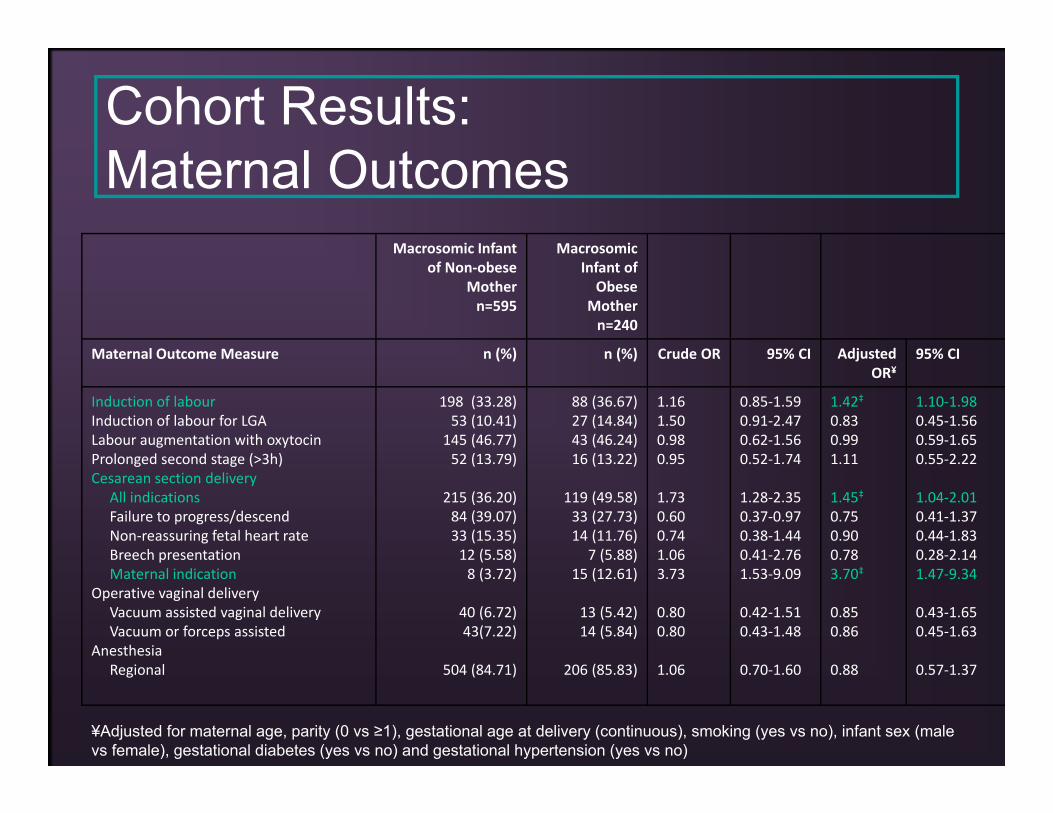
Cohort Results: Maternal Outcomes
Macrosomic Infant of Non‐obese
Mothern=595
Macrosomic Infant of Obese
Mothern=240
Maternal Outcome Measure n (%) n (%) Crude OR 95% CI Adjusted OR¥
95% CI
Induction of labourInduction of labour for LGALabour augmentation with oxytocinProlonged second stage (>3h)Cesarean section delivery
All indicationsFailure to progress/descendNon‐reassuring fetal heart rateBreech presentationMaternal indication
Operative vaginal deliveryVacuum assisted vaginal deliveryVacuum or forceps assisted
AnesthesiaRegional
198 (33.28)53 (10.41)
145 (46.77)52 (13.79)
215 (36.20)84 (39.07) 33 (15.35) 12 (5.58) 8 (3.72)
40 (6.72) 43(7.22)
504 (84.71)
88 (36.67)27 (14.84)43 (46.24)16 (13.22)
119 (49.58)33 (27.73) 14 (11.76)
7 (5.88)15 (12.61)
13 (5.42) 14 (5.84)
206 (85.83)
1.161.500.980.95
1.730.600.741.063.73
0.800.80
1.06
0.85‐1.590.91‐2.470.62‐1.560.52‐1.74
1.28‐2.350.37‐0.970.38‐1.440.41‐2.761.53‐9.09
0.42‐1.510.43‐1.48
0.70‐1.60
1.42‡0.830.991.11
1.45‡0.750.900.783.70‡
0.850.86
0.88
1.10‐1.980.45‐1.560.59‐1.650.55‐2.22
1.04‐2.010.41‐1.370.44‐1.830.28‐2.141.47‐9.34
0.43‐1.650.45‐1.63
0.57‐1.37
¥Adjusted for maternal age, parity (0 vs ≥1), gestational age at delivery (continuous), smoking (yes vs no), infant sex (malevs female), gestational diabetes (yes vs no) and gestational hypertension (yes vs no)
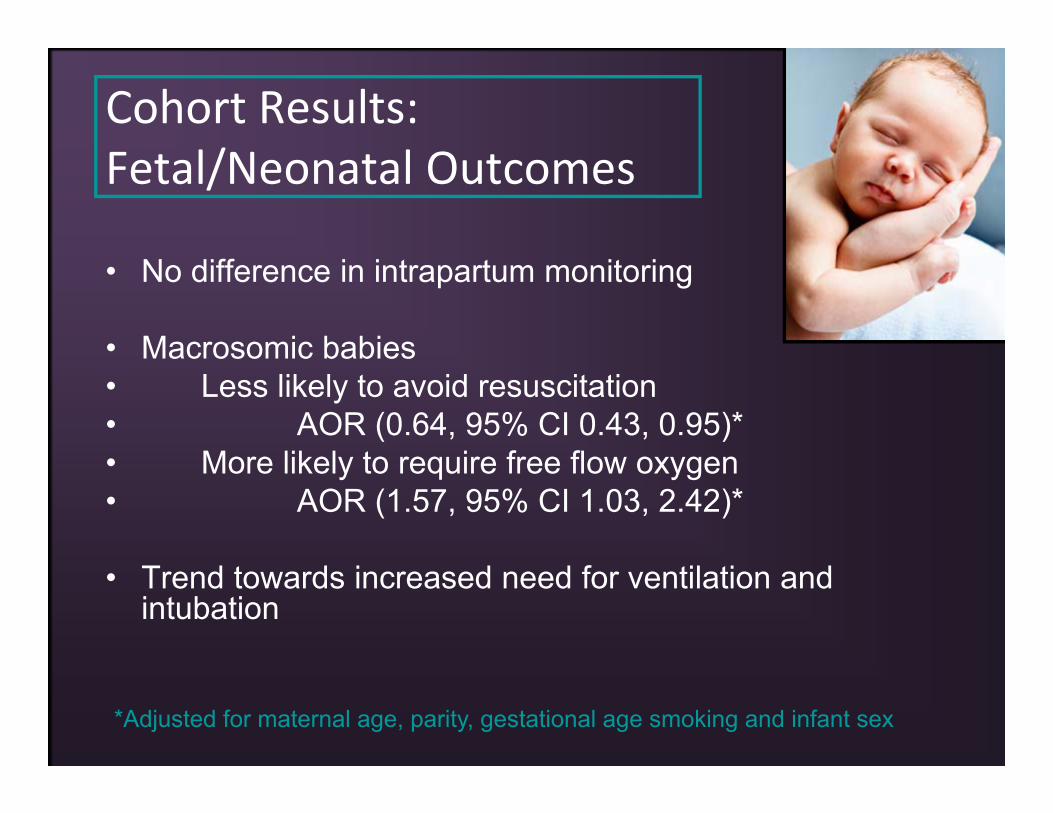
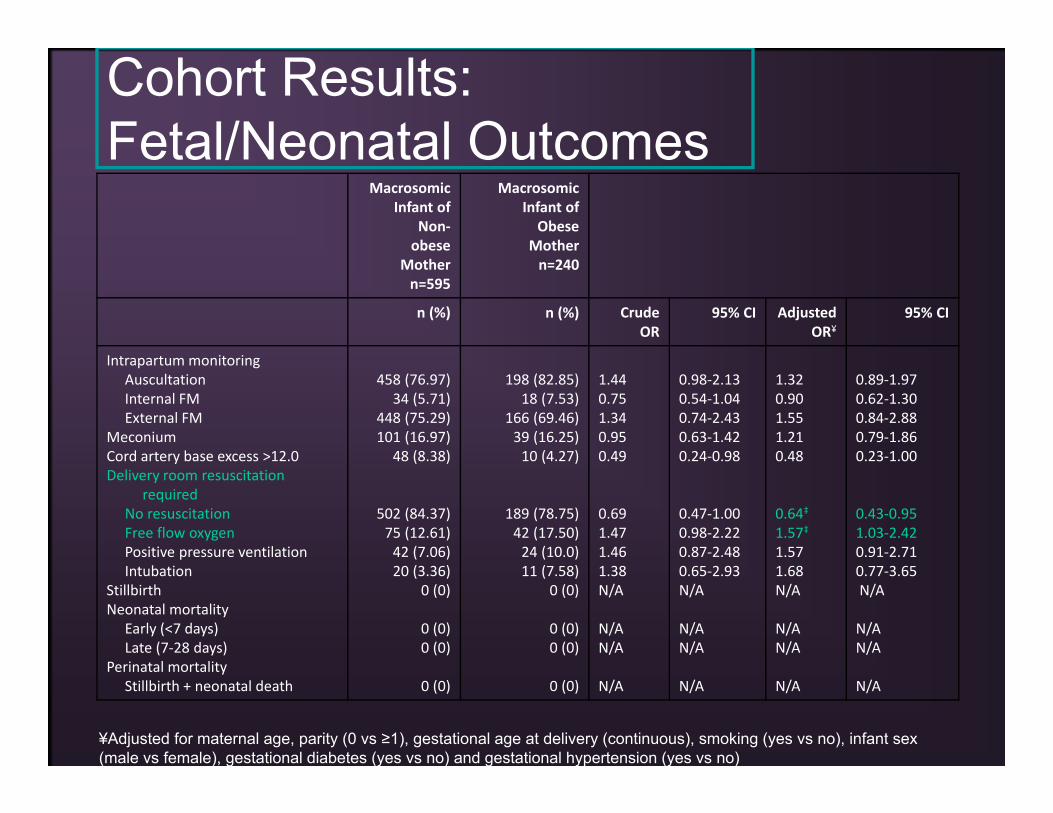
Cohort Results: Fetal/Neonatal Outcomes
• No difference in intrapartum monitoring
• Macrosomic babies• Less likely to avoid resuscitation• AOR (0.64, 95% CI 0.43, 0.95)*• More likely to require free flow oxygen• AOR (1.57, 95% CI 1.03, 2.42)*
• Trend towards increased need for ventilation and intubation
*Adjusted for maternal age, parity, gestational age smoking and infant sex
Cohort Results: Fetal/Neonatal Outcomes
Macrosomic Infant of
Non‐obese
Mothern=595
Macrosomic Infant of Obese
Mothern=240
n (%) n (%) Crude OR
95% CI Adjusted OR¥
95% CI
Intrapartum monitoringAuscultationInternal FMExternal FM
MeconiumCord artery base excess >12.0Delivery room resuscitation
requiredNo resuscitation Free flow oxygenPositive pressure ventilationIntubation
Stillbirth Neonatal mortality
Early (<7 days)Late (7‐28 days)
Perinatal mortalityStillbirth + neonatal death
458 (76.97)34 (5.71)
448 (75.29)101 (16.97)
48 (8.38)
502 (84.37)75 (12.61)42 (7.06)20 (3.36)
0 (0)
0 (0)0 (0)
0 (0)
198 (82.85)18 (7.53)
166 (69.46)39 (16.25)10 (4.27)
189 (78.75)42 (17.50)24 (10.0)11 (7.58)
0 (0)
0 (0)0 (0)
0 (0)
1.440.751.340.950.49
0.691.471.461.38N/A
N/AN/A
N/A
0.98‐2.130.54‐1.040.74‐2.430.63‐1.420.24‐0.98
0.47‐1.000.98‐2.220.87‐2.480.65‐2.93N/A
N/AN/A
N/A
1.320.901.551.210.48
0.64‡1.57‡1.571.68N/A
N/AN/A
N/A
0.89‐1.970.62‐1.300.84‐2.880.79‐1.860.23‐1.00
0.43‐0.951.03‐2.420.91‐2.710.77‐3.65N/A
N/AN/A
N/A
¥Adjusted for maternal age, parity (0 vs ≥1), gestational age at delivery (continuous), smoking (yes vs no), infant sex (male vs female), gestational diabetes (yes vs no) and gestational hypertension (yes vs no)
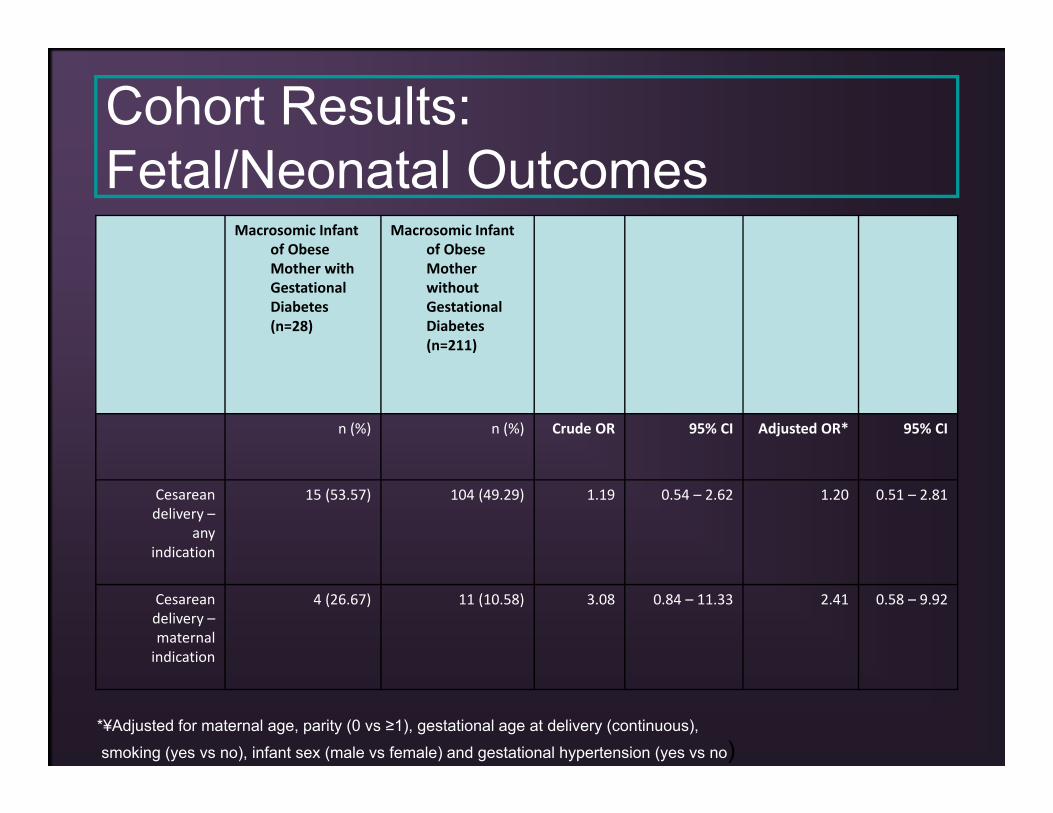
Cohort Results: Fetal/Neonatal Outcomes
Macrosomic Infant of Obese Mother with Gestational Diabetes (n=28)
Macrosomic Infant of Obese Mother without Gestational Diabetes (n=211)
n (%) n (%) Crude OR 95% CI Adjusted OR* 95% CI
Cesarean delivery –
any indication
15 (53.57) 104 (49.29) 1.19 0.54 – 2.62 1.20 0.51 – 2.81
Cesarean delivery –maternal indication
4 (26.67) 11 (10.58) 3.08 0.84 – 11.33 2.41 0.58 – 9.92
*¥Adjusted for maternal age, parity (0 vs ≥1), gestational age at delivery (continuous),
smoking (yes vs no), infant sex (male vs female) and gestational hypertension (yes vs no)
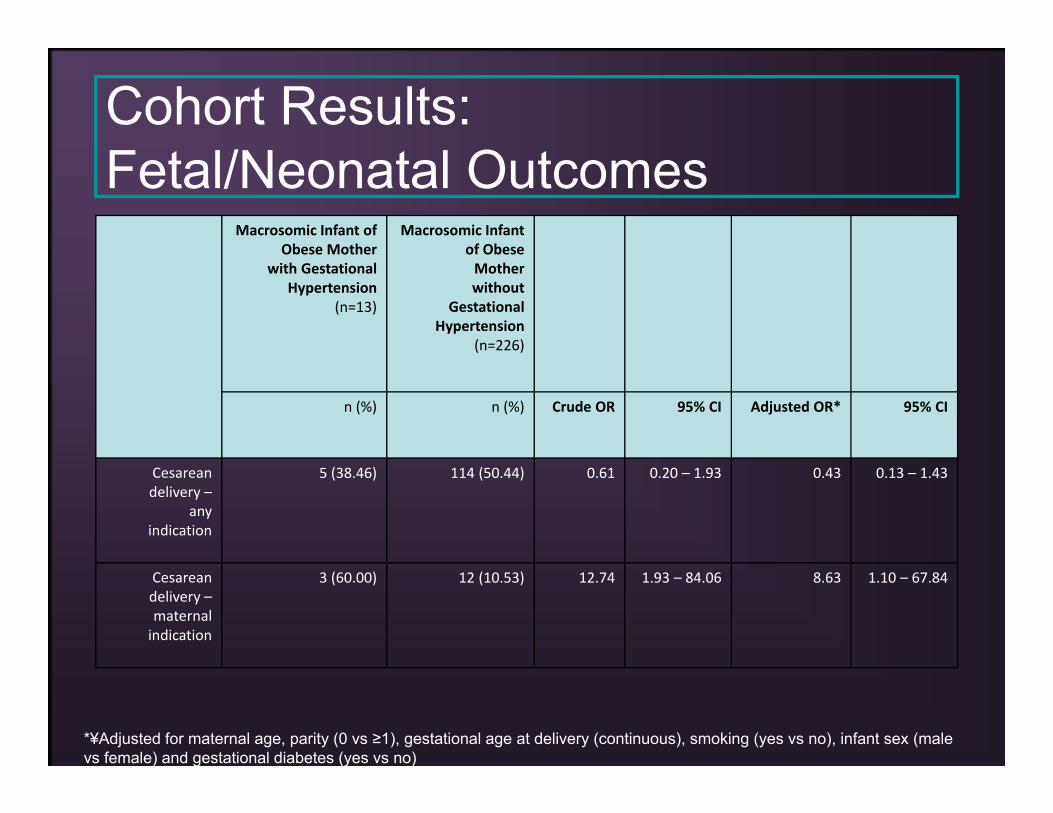
Cohort Results: Fetal/Neonatal Outcomes
Macrosomic Infant of Obese Mother
with Gestational Hypertension
(n=13)
Macrosomic Infant of Obese Mother without
Gestational Hypertension
(n=226)
n (%) n (%) Crude OR 95% CI Adjusted OR* 95% CI
Cesarean delivery –
any indication
5 (38.46) 114 (50.44) 0.61 0.20 – 1.93 0.43 0.13 – 1.43
Cesarean delivery –maternal indication
3 (60.00) 12 (10.53) 12.74 1.93 – 84.06 8.63 1.10 – 67.84
*¥Adjusted for maternal age, parity (0 vs ≥1), gestational age at delivery (continuous), smoking (yes vs no), infant sex (male vs female) and gestational diabetes (yes vs no)
Can we improve neonatal outcomes for these mothers and
infants?
1. Encourage a healthy lifestyle during pregnancy (diet + physical activity) = lower gestational weight gain

2. Anticipate fetal macrosomia among women who are obese, particularly if they are undergoing induction of labour or Cesarean section
Can we improve neonatal outcomes for these mothers and
infants?
Can we improve neonatal outcomes for these mothers and
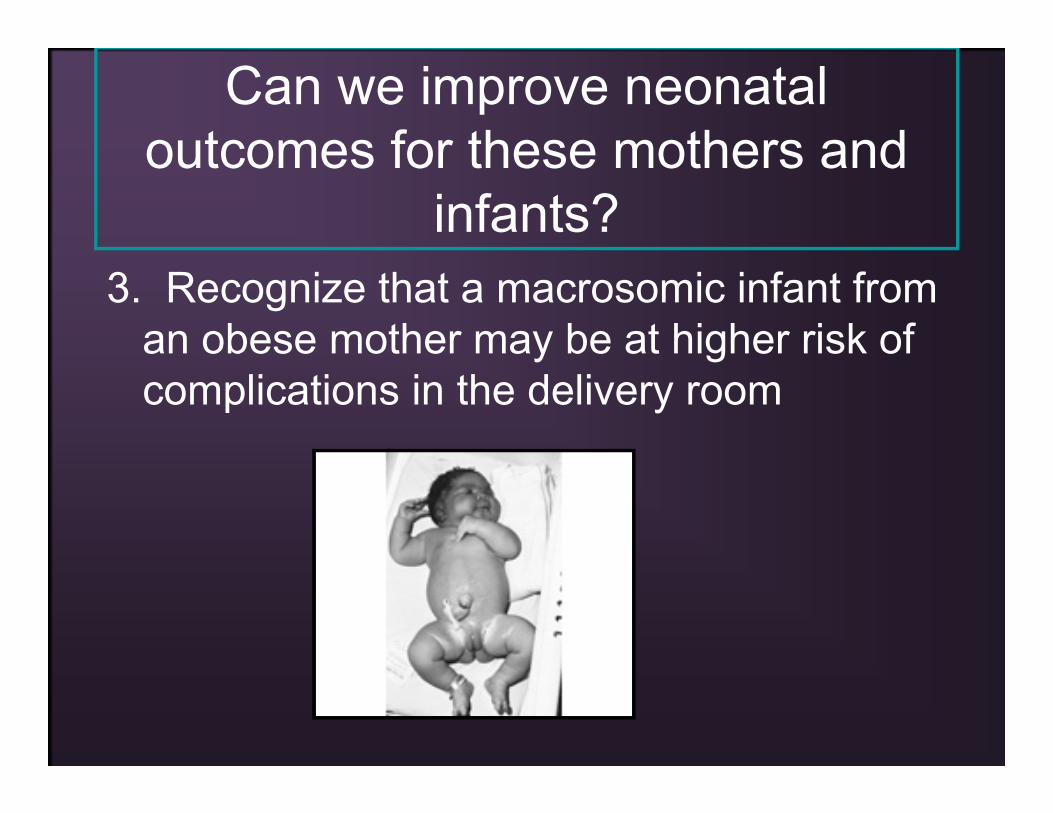
infants?3. Recognize that a macrosomic infant from
an obese mother may be at higher risk of complications in the delivery room
Conclusions and Future Work1. Maternal obesity is clearly associated with fetal
overgrowth
2. There appears to be an additive effect of obesity and fetal overgrowth on adverse outcomes
Induction of labourCesarean section (overall and maternal indication)Need for neonatal resuscitation
Goals of future research → Decrease incidence of maternal obesity and macrosomia
Ron Mueck, 2006 “A Girl”

Acknowledgements
Thesis Supervisors:Dr. Mark WalkerDr. Shi Wu Wen
Others:Mr. Zach FerraroDr. Xiaowen Tu and Ms. Huiling CaoMs. Ann Sprague

Questions and Discussion
Related Documents