What I’ve Learned From Implementing Drip Irrigation On My Farm Nate Ray, DeJager Farms

Welcome message from author
This document is posted to help you gain knowledge. Please leave a comment to let me know what you think about it! Share it to your friends and learn new things together.
Transcript
WhatI’veLearnedFromImplementingDripIrrigationOnMyFarm
NateRay,DeJagerFarms
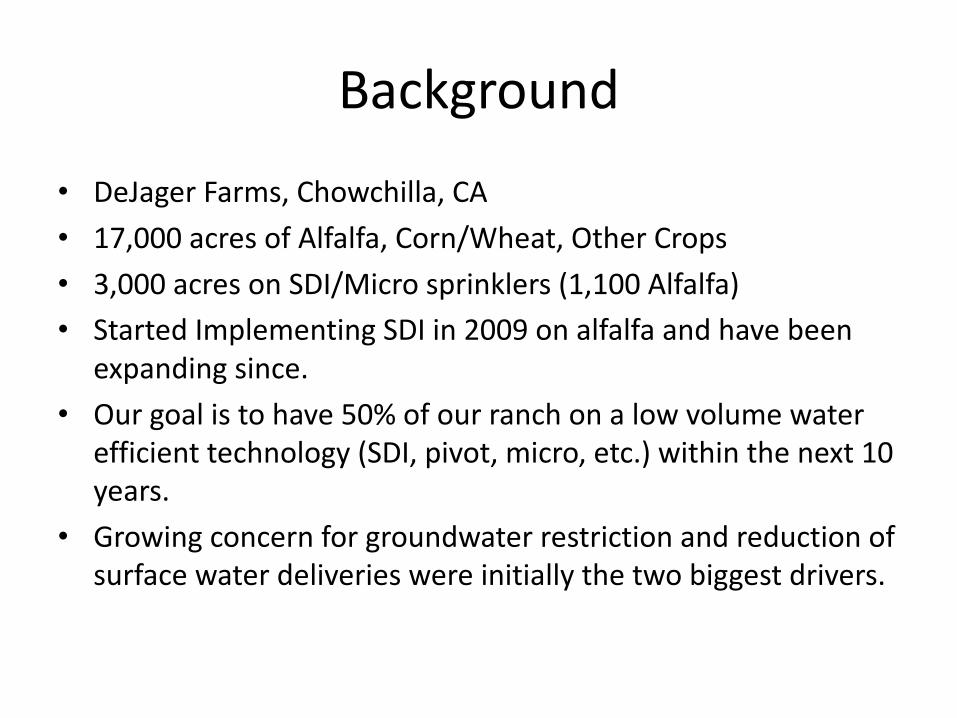
Background• DeJagerFarms,Chowchilla,CA• 17,000acresofAlfalfa,Corn/Wheat,OtherCrops• 3,000acresonSDI/Microsprinklers(1,100Alfalfa)• StartedImplementingSDIin2009onalfalfaandhavebeen
expandingsince.• Ourgoalistohave50%ofourranchonalowvolumewater
efficienttechnology(SDI,pivot,micro,etc.)withinthenext10years.
• Growingconcernforgroundwaterrestrictionandreductionofsurfacewaterdeliverieswereinitiallythetwobiggestdrivers.

Topics
SiteSelectionIrrigationScheduling
CutSchedulingandYield/Quality

SiteSelection
• Littletonopreviouspopulationtostart• Littletonorefugesitesaroundsite.• Historicallyfloodirrigatedandconventionallytilled
isbeneficial

InstallationqProductQualityqCulturalPracticesqMinimizingTripsovertheField
FlowFlow
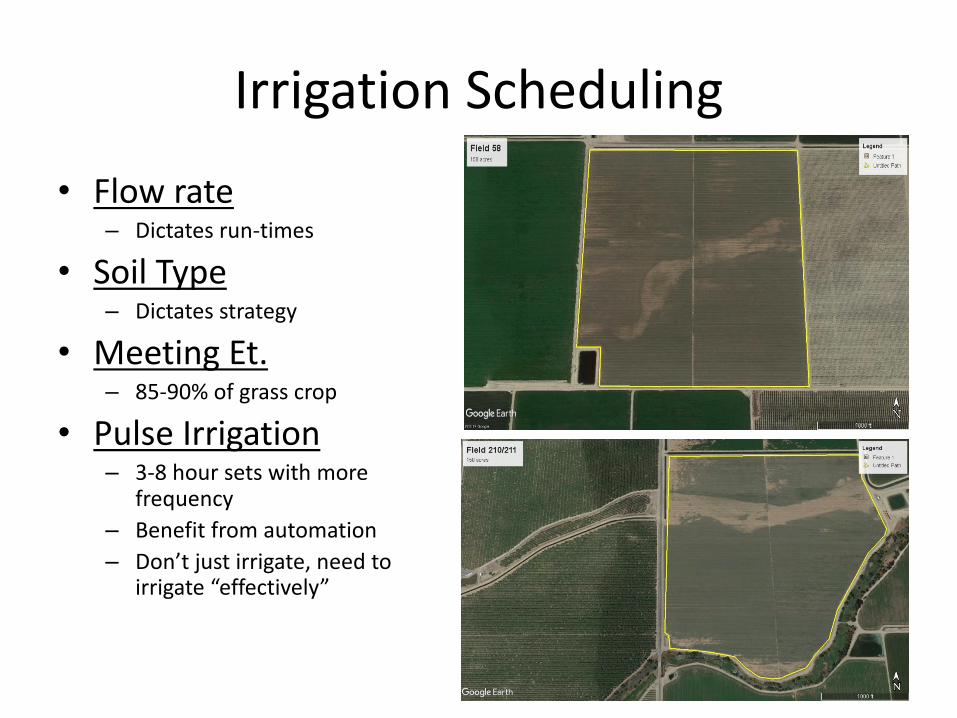
IrrigationScheduling
• Flowrate– Dictatesrun-times
• SoilType– Dictatesstrategy
• MeetingEt.– 85-90%ofgrasscrop
• PulseIrrigation– 3-8hoursetswithmore
frequency– Benefitfromautomation– Don’tjustirrigate,needto
irrigate“effectively”

IrrigationScheduling
5th Cutting30days 6thcutting28days

IrrigationScheduling

IrrigationSchedulingField#65IrrigationRecordMonth: September
Day Pump# NorthSide SouthSide Total AcreInches EffectiveRainfall 3StationHours Hours Hours Applied/Acre TotalInches Ave.ET(In.)
1 DW76 0 0 0.22 DW76 0 0 0.2073 DW76 0 0 0.2104 DW76 0 0 0.2235 DW76 0 0 0.1976 DW76 0 0 0.1777 DW76 12 12 0.4416 0.2138 DW76 12 12 0.4416 0.2209 DW76 0 0 0.24010 DW76 6 6 12 0.4416 0.21311 DW76 6 6 12 0.4416 0.20312 DW76 6 6 12 0.4416 0.21013 DW76 6 2 8 0.2944 0.19314 DW76 0 0 0.20315 DW76 0 0 0.20716 DW76 0 0 0.19717 DW76 0 0 0.19718 DW76 0 0 0.19719 DW76 0 0 0.19720 DW76 3.5 3.5 7 0.2576 0.18321 DW76 2 2 4 0.1472 0.17022 DW76 0 0 0.16023 DW76 0 0 0.18724 DW76 0 0 0.18725 DW76 0 0 0.17026 DW76 0 0 0.16327 DW76 12 12 0.4416 0.17028 DW76 12 12 0.4416 0.18029 DW76 12 12 0.4416 0.16330 DW76 12 12 0.4416 0.167
Total 127 4.6736 0 5.8

2010 2011 2012 2013 2014 2015 2016 2017DripTapeAc/InApplied 40.92 37.56 42.84 45.00 41.76 40.80 42.72 38.68
ControlFieldAc/InApplied 60.00 57.00 60.00 57.00 57.00 50.40
35.0
40.0
45.0
50.0
55.0
60.0
65.0
AC/IN
.OFWATER
APP
LIED
Dripvs.FloodWaterApplied
4th yearofdroughtconditions.
§ Averagewaterapplied(flood)– 57.1”§ Averagewaterapplied(SDI)– 41.3”§ Averagewaterapplied(diff)– 15.8”27.7%

YearlyRainfall
5.2 6.2
1.47
4.41
0.48
4.5 4.09 3.48
8.739.17
5.19
2.48
3.8
2.03
8.59
6.74
0
2
4
6
8
10
12
14
16
18
09-10 10-11 11-12 12-13 13-14 14-15 15-16 16-17
Spring
Fall
13.93 15.37 6.66 6.89 4.28 6.53 12.68 10.22

CutScheduleandYield/Quality• CutSchedule– Goalis50-60%oftotalproductioncutforHighQuality– 7-8cuttingsperyear– CutDayRange24-35days– SampleCutdays
– 1st – Chopped(Apr.1st)– 2nd – 33days(MC)– 3rd – 27days(MC)– 4th – 35days(DC)– 5th – 35days(DC)– 6th – 24days(MC)– 7th – 30days(MC)– 8th – 35days(chopped)

CutScheduleandYield/Quality
2010 2011 2012 2013 2014 2015 2016 2017DripTapeTon/Acre 12.13 12.33 11.66 10.14 10.58 10.90 9.96 9.77
ControlFieldTon/Acre 9.42 9.68 9.27 8.31 7.69 7.07
5.0
5.5
6.0
6.5
7.0
7.5
8.0
8.5
9.0
9.5
10.0
10.5
11.0
11.5
12.0
12.5
13.0Tons/Acre
DripTapevs.FloodIrrigation
CutScheduleandYield/Quality
• Yield/Quality– Yield• Increasingyieldgapovertime
– %increaseinyear4=26%– %increaseinyear6=32%
• YieldSpikefromyear4-6dueto:– Changeincutscheduletowardmanagingforstandlongevity– Supplementingcommercialfertilizerasmineralizationstartedtodecline.

CutScheduleandYield/Quality
• Yield/Quality– Quality
• ThereisasharperdecliningcorrelationinqualityforSDIalfalfafieldsduetomeetingEtandfertilitydemandsmoreeasily.
• Somestrategieshavehelpedwiththisproblem– Turningwateroffearlierbeforecuttingtoslightlyinducestress– Fertilizingaheadoflongerdaycuttingsinsteadofduringqualitycuttings

SDITwinRowCornPlanting40”
12”
7-8”
28”
- HigherPlantPopulation- HigherProduction- BetterQuality- LessCompetition- ClosertoDripTape


WhatI’veLearnedFromImplementingDripIrrigationOnMyFarm
NateRay,DeJagerFarms
Related Documents