REPORT FOR THE DOMGAS ALLIANCE WESTERN AUSTRALIA NATURAL GAS DEMAND AND SUPPLY – A FORECAST June 2010

Welcome message from author
This document is posted to help you gain knowledge. Please leave a comment to let me know what you think about it! Share it to your friends and learn new things together.
Transcript
REPORT FOR THE DOMGAS ALLIANCE
WESTERN AUSTRALIA NATURAL GAS DEMAND AND SUPPLY – A FORECAST
June 2010
C O M M E R C I A L A N D E C O N O M I C R E P O R T F O R T H E D O M G A S A L L I A N C E
© Economics Consulting Services Level 1, 1 The Esplanade, Mt Pleasant WA 6153
Phone (08) 9315 9969
This Publication This report has been prepared for the DomGas Alliance to assist in review of the impact of natural gas supply issues in Western Australia.
This report aims to provide an assessment of the economic impact of potential shortages in natural gas availability.
This report is based on information verified by Economics Consulting Services where possible. Only broad details are included in this report and no investment decisions should be made based on the information included.
Table of Contents EXECUTIVE SUMMARY - 1 -
1. BACKGROUND - 3 -
1.1 INTRODUCTION - 3 - 1.2 NATURAL GAS PRODUCTION HISTORY - 3 - 1.3 NATURAL GAS USE - 5 -
2. GAS SUPPLY - 8 -
2.1 INTRODUCTION - 8 - 2.2 GAS PROCESSING FACILITIES - 8 - 2.3 GAS PRODUCING FIELDS - 9 - 2.4 NEW PROJECT POTENTIAL - 13 - 2.5 FORECAST SUPPLY - 16 -
3. GAS DEMAND - 19 -
3.1 INTRODUCTION - 19 - 3.2 TREND ANALYSIS - 19 - 3.3 DEPARTMENT OF MINES AND PETROLEUM FORECAST - 20 - 3.4 PROJECT ANALYSIS - 20 -
4. ECONOMIC IMPACTS - 27 -
4.1 INTRODUCTION - 27 - 4.2 POTENTIAL ECONOMIC BENEFITS - 28 -
W E S T E R N A U S T R A L I A N N A T U R A L G A S D E M A N D
E C O N O M I C S C O N S U L T I N G S E R V I C E S P A G E - 1 -
Executive Summary This report has been prepared by Economics Consulting Services for the DomGas Alliance. The Alliance represents natural gas users, infrastructure investors and prospective domestic gas producers in Western Australia.
Natural gas is vital to the Western Australian economy. It is a dominant energy source for industry and electricity generation. The dynamics of the gas market have fundamentally changed in the last five years and this report looks at the outlook for the decade to 2020.
The availability of plentiful and competitive natural gas has provided a foundation for economic growth in the State with substantial employment flowing from energy intensive processes. Gas use has increased by a factor of 12 over the 27 years since large gas volumes became available. Gas use grew at an average of 10.6% per annum in that period. While slowing from the early highs, growth has averaged 5.5% since 2000. In only eight of the last 25 years has the annual increase been less than 4%.
Future use will depend on the linked factors of demand, supply and price. Recent supply constraints, a jump in prices and the risks over future carbon emission prices have increased uncertainty among gas users and made forecasting challenging.
Current fields are declining and known gas reserves appear fully committed under sale contracts. LNG export contracts have been on terms of up to 25 years. Gas committed to such contracts is not available to meet existing or future domestic demand – regardless of the domestic gas price.
Forecasts of production from current gas fields indicate a decline from around 1,000 TJ/day to between 300 and 500 TJ/day in 2020. This decline will need to be replaced by production from new fields or enhanced recovery from existing fields. Between 500 and 700 TJ/day of new production is needed to maintain existing consumption without any growth in demand.
Over 99% of Western Australian natural gas is supplied from the offshore Carnarvon Basin. Ten years ago, the majority of the gas from this Basin was sold into the domestic market. The majority is now sold overseas as LNG and recent sales have substantially increased overseas commitments. This means that domestic gas supply is tight and gas prices have increased dramatically.
New LNG plants in the Pilbara provide the opportunity for additional gas fields to be processed and exported as LNG. This means that smaller fields that may have been suited to domestic markets are now being absorbed into LNG projects.
Demand growth will depend on prices both for the gas and the commodities being produced. Gas consumption in Western Australia is dominated by mineral processing, minesite and grid electricity generation. All sectors have the potential for significant growth in the next ten years.
Demand and supply forecasts indicate a potential shortfall of 300 to 600 TJ/day by 2015 and between zero and 600 TJ/day by 2020. More optimistic demand forecasts suggest a greater shortfall than this conservative estimate.
The combination of growth and replacement production indicate a need to source at least 1,100 TJ/day of new production by 2020.

W E S T E R N A U S T R A L I A N N A T U R A L G A S D E M A N D
E C O N O M I C S C O N S U L T I N G S E R V I C E S P A G E - 2 -
New projects that will supply gas include Reindeer/Devil’s Creek (110 TJ/day), Macedon (220 TJ/day) and Gorgon (150 TJ/day). There are other possible projects but they are yet to be proven commercial or have uncertainties over the domestic gas commitment by the companies involved. The latter group includes Pluto, Wheatstone, Warro, Halyard/Spar, Browse Basin and Scarborough.
There is clearly a large gap of up to 600 TJ/day between known new production and potential demand in the next decade. To place this in perspective, this is equivalent to more than half of the State’s current domestic gas consumption.
Any rise in gas prices as a result of the shortfall will change the composition of the energy market in the State. In the South West Interconnected electricity grid, coal will become the only realistic fuel for base load electricity with gas confined to peak supply power plants and to plants providing back up to wind farms.
In the North West Interconnected electricity grid and for resource projects near the Goldfields Pipeline, gas will be the dominant fuel for electricity generation and mineral processing. It will remain highly competitive with diesel with the only alternative being to use coal imported into the region.
The net effect will be to see an increased proportion of gas use in the Pilbara and remote areas and a lower proportion into the south west region.
Rising gas prices suggest a slower rate of growth for mineral processing and electricity generation than in the past. Companies engaged in mineral processing will face the option of switching to coal rather than gas for any expansion or moving to lower cost energy countries over time. Expansions in alumina refining or new magnetite processing in the south of the State appear unlikely to be based on gas.
W E S T E R N A U S T R A L I A N N A T U R A L G A S D E M A N D
E C O N O M I C S C O N S U L T I N G S E R V I C E S P A G E - 3 -
1. Background 1.1 Introduction This report has been prepared by Economics Consulting Services for the DomGas Alliance. The Alliance represents natural gas users, infrastructure investors and prospective domestic gas producers in Western Australia. The group was formed to work with State and Federal governments, regulators and gas producers to ensure a long-term supply of competitively priced gas. The aims of the Alliance are to promote security, affordability and diversity of gas supply for industry and households.
This report has been prepared with assistance from Alliance members and producers. Much of the information provided is commercially sensitive, and Economics Consulting Services appreciates the willingness of the companies to discuss the issues as part of natural gas policy development.
The content of this report has been carefully constructed to minimise the release of sensitive information. Hence the report includes less substantiation for the forecasts than desirable but the authors believe the key findings are realistic and defendable.
The report begins with a review of past production and gas markets. This provides context and demonstrates why consideration of large resource projects is essential.
1.2 Natural Gas Production History Natural gas began flowing into markets in Western Australia with the completion of a pipeline from the Dongara gas fields to Perth in 1971. The Western Australian Natural Gas Pipeline (WANG) supplied the only gas to consumers until completion of the Dampier to Bunbury Natural Gas pipeline from the North West Shelf project in 1984.
The huge gas resources located in the offshore North West Shelf area accessed by the Dampier to Bunbury Natural Gas pipeline allowed a dramatic increase in gas consumption (Figure 1). Since that time, gas has come from the North West Shelf Joint Venture project at the Burrup Peninsula, the Varanus Island processing hub and a number of other projects in the offshore Carnarvon and Perth Basins.
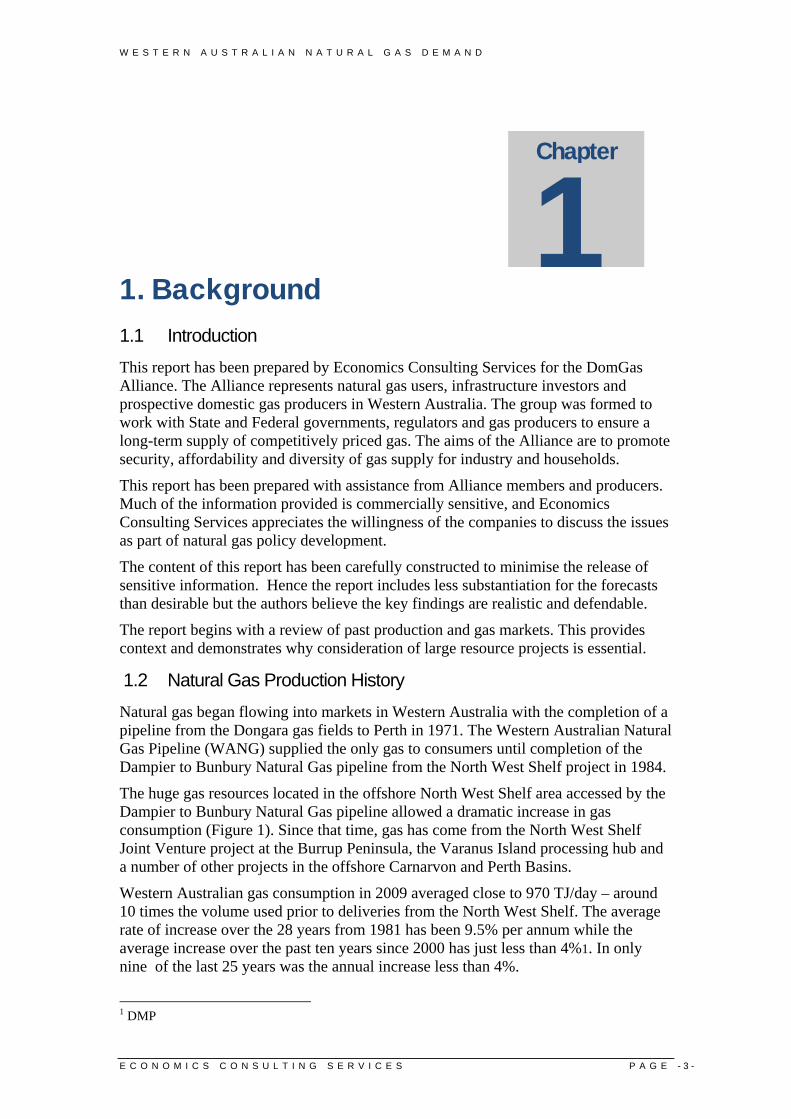
Western Australian gas consumption in 2009 averaged close to 970 TJ/day – around 10 times the volume used prior to deliveries from the North West Shelf. The average rate of increase over the 28 years from 1981 has been 9.5% per annum while the average increase over the past ten years since 2000 has just less than 4%1. In only nine of the last 25 years was the annual increase less than 4%.
1 DMP
Chapter
1
W E S T E R N A U S T R A L I A N N A T U R A L G A S D E M A N D
E C O N O M I C S C O N S U L T I N G S E R V I C E S P A G E - 4 -
Figure 1: Western Australian gas production, 1980 to 2009 (TJ/day)
Source: Department of Minerals and Petroleum, Quantity and Values
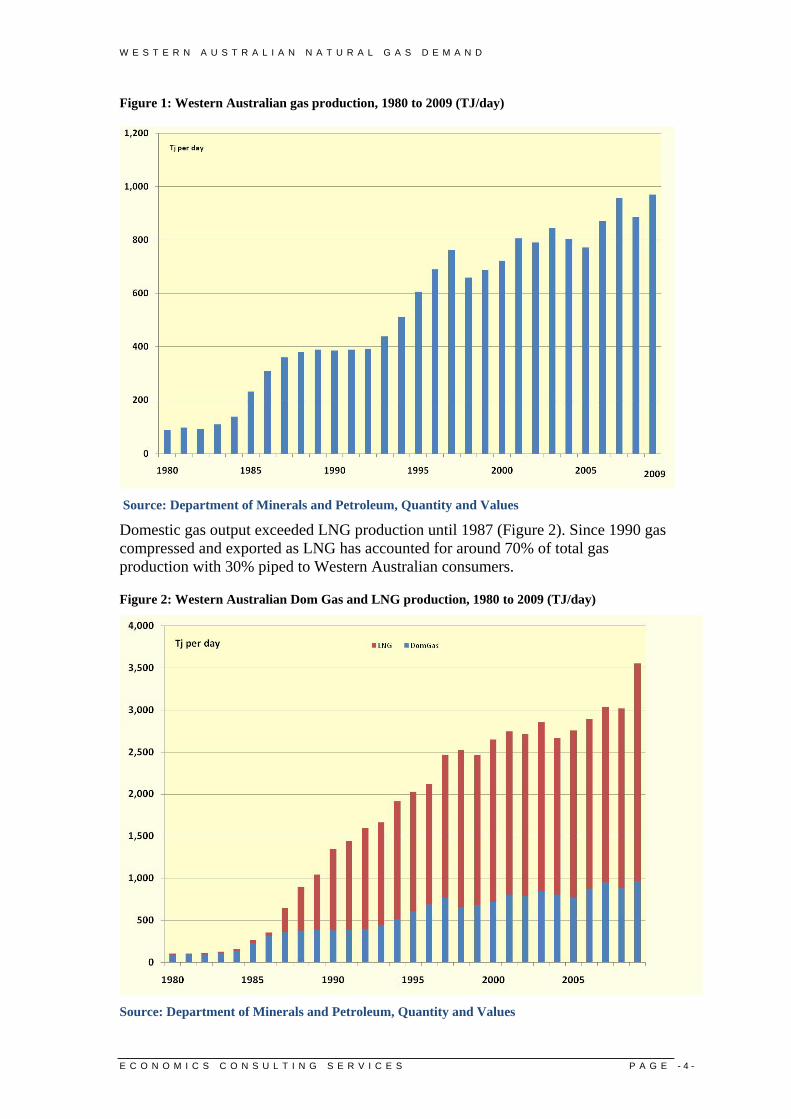
Domestic gas output exceeded LNG production until 1987 (Figure 2). Since 1990 gas compressed and exported as LNG has accounted for around 70% of total gas production with 30% piped to Western Australian consumers.
Figure 2: Western Australian Dom Gas and LNG production, 1980 to 2009 (TJ/day)
Source: Department of Minerals and Petroleum, Quantity and Values
W E S T E R N A U S T R A L I A N N A T U R A L G A S D E M A N D
E C O N O M I C S C O N S U L T I N G S E R V I C E S P A G E - 5 -
1.3 Natural Gas Use
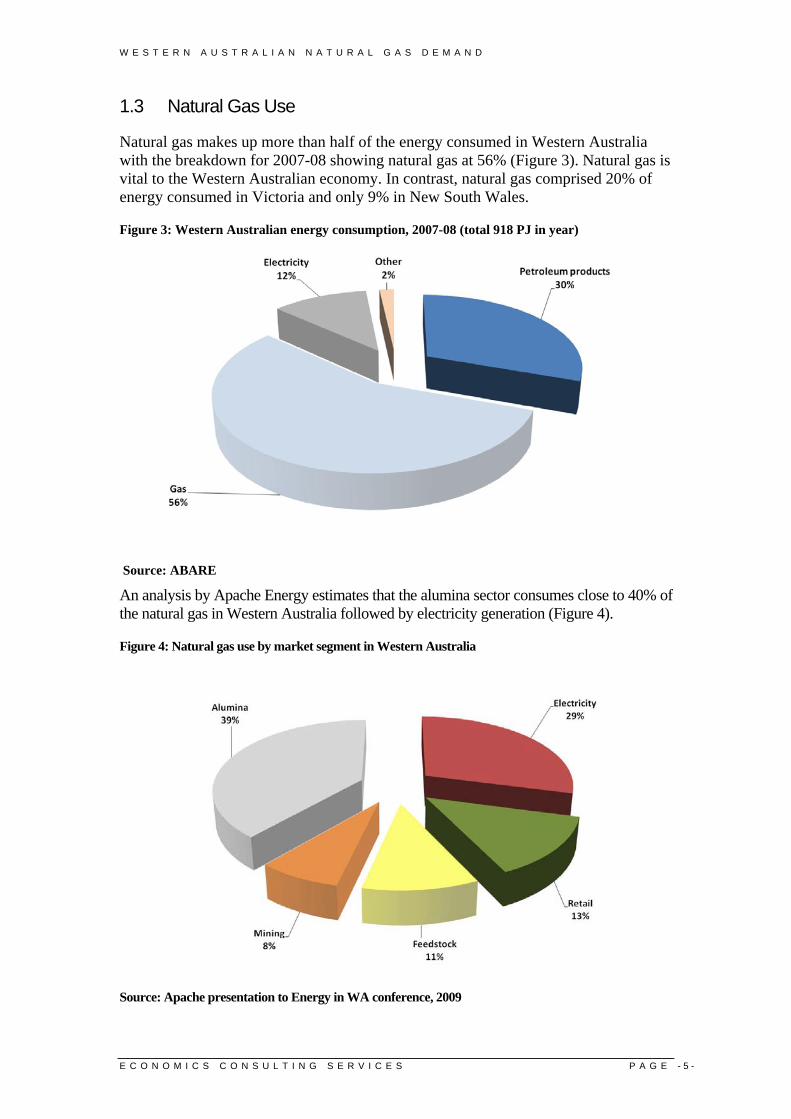
Natural gas makes up more than half of the energy consumed in Western Australia with the breakdown for 2007-08 showing natural gas at 56% (Figure 3). Natural gas is vital to the Western Australian economy. In contrast, natural gas comprised 20% of energy consumed in Victoria and only 9% in New South Wales.
Figure 3: Western Australian energy consumption, 2007-08 (total 918 PJ in year)
Source: ABARE
An analysis by Apache Energy estimates that the alumina sector consumes close to 40% of the natural gas in Western Australia followed by electricity generation (Figure 4).
Figure 4: Natural gas use by market segment in Western Australia
Source: Apache presentation to Energy in WA conference, 2009
W E S T E R N A U S T R A L I A N N A T U R A L G A S D E M A N D
E C O N O M I C S C O N S U L T I N G S E R V I C E S P A G E - 6 -
The alumina sector effectively underwrote the development of the Dampier to Bunbury Natural Gas Pipeline and has remained the dominant consumption sector for over 25 years.
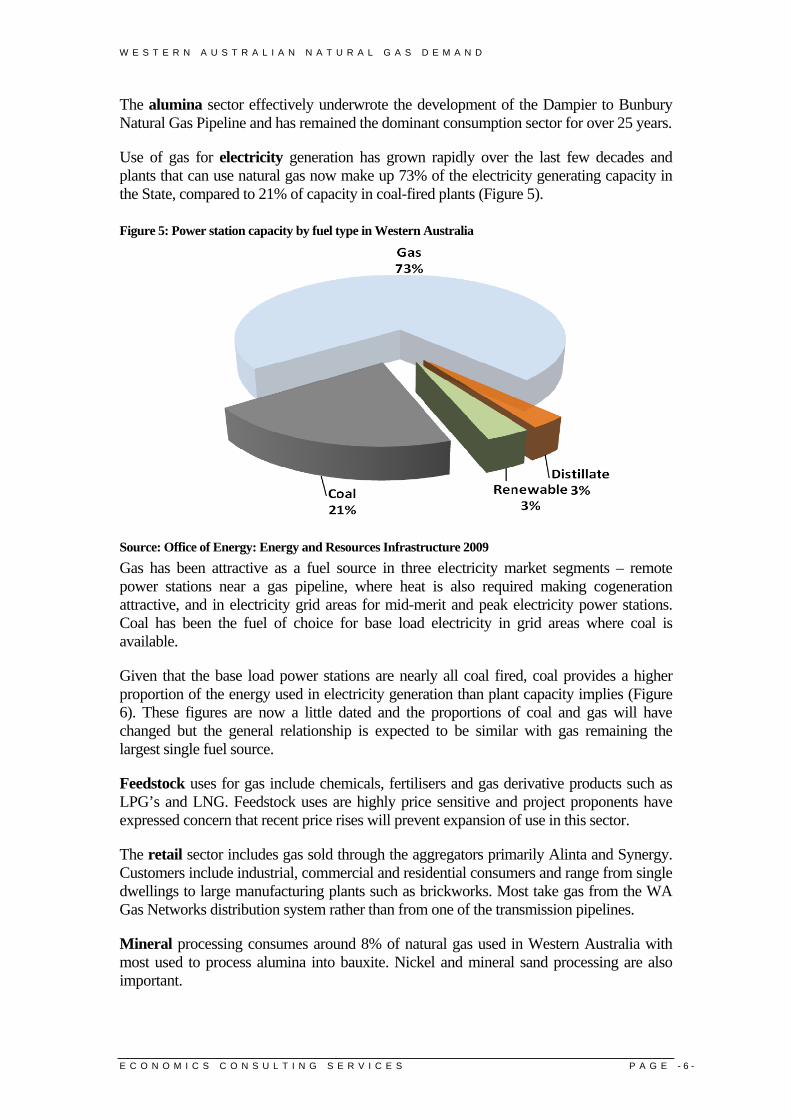
Use of gas for electricity generation has grown rapidly over the last few decades and plants that can use natural gas now make up 73% of the electricity generating capacity in the State, compared to 21% of capacity in coal-fired plants (Figure 5).
Figure 5: Power station capacity by fuel type in Western Australia
Source: Office of Energy: Energy and Resources Infrastructure 2009 Gas has been attractive as a fuel source in three electricity market segments – remote power stations near a gas pipeline, where heat is also required making cogeneration attractive, and in electricity grid areas for mid-merit and peak electricity power stations. Coal has been the fuel of choice for base load electricity in grid areas where coal is available.
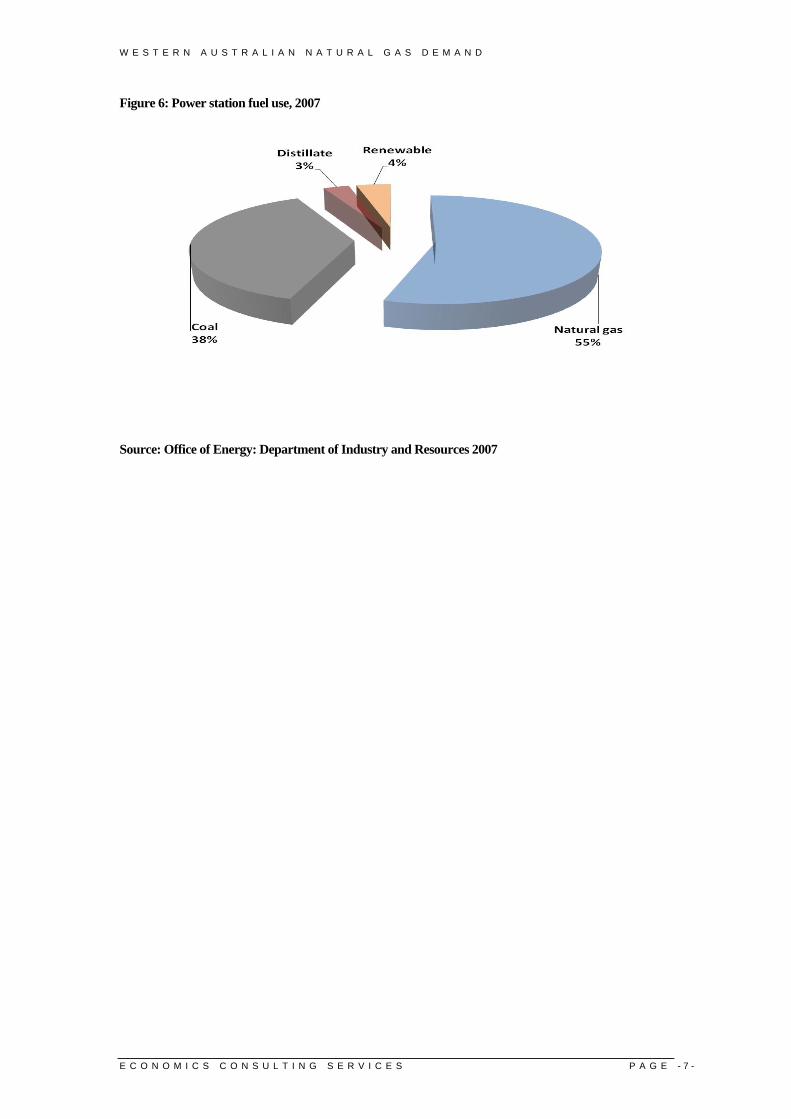
Given that the base load power stations are nearly all coal fired, coal provides a higher proportion of the energy used in electricity generation than plant capacity implies (Figure 6). These figures are now a little dated and the proportions of coal and gas will have changed but the general relationship is expected to be similar with gas remaining the largest single fuel source.
Feedstock uses for gas include chemicals, fertilisers and gas derivative products such as LPG’s and LNG. Feedstock uses are highly price sensitive and project proponents have expressed concern that recent price rises will prevent expansion of use in this sector.
The retail sector includes gas sold through the aggregators primarily Alinta and Synergy. Customers include industrial, commercial and residential consumers and range from single dwellings to large manufacturing plants such as brickworks. Most take gas from the WA Gas Networks distribution system rather than from one of the transmission pipelines.
Mineral processing consumes around 8% of natural gas used in Western Australia with most used to process alumina into bauxite. Nickel and mineral sand processing are also important.
W E S T E R N A U S T R A L I A N N A T U R A L G A S D E M A N D
E C O N O M I C S C O N S U L T I N G S E R V I C E S P A G E - 7 -
Figure 6: Power station fuel use, 2007
Source: Office of Energy: Department of Industry and Resources 2007
W E S T E R N A U S T R A L I A N N A T U R A L G A S D E M A N D
E C O N O M I C S C O N S U L T I N G S E R V I C E S P A G E - 8 -
2. Gas Supply 2.1 Introduction This chapter looks at potential gas supply based on existing fields and known discoveries.
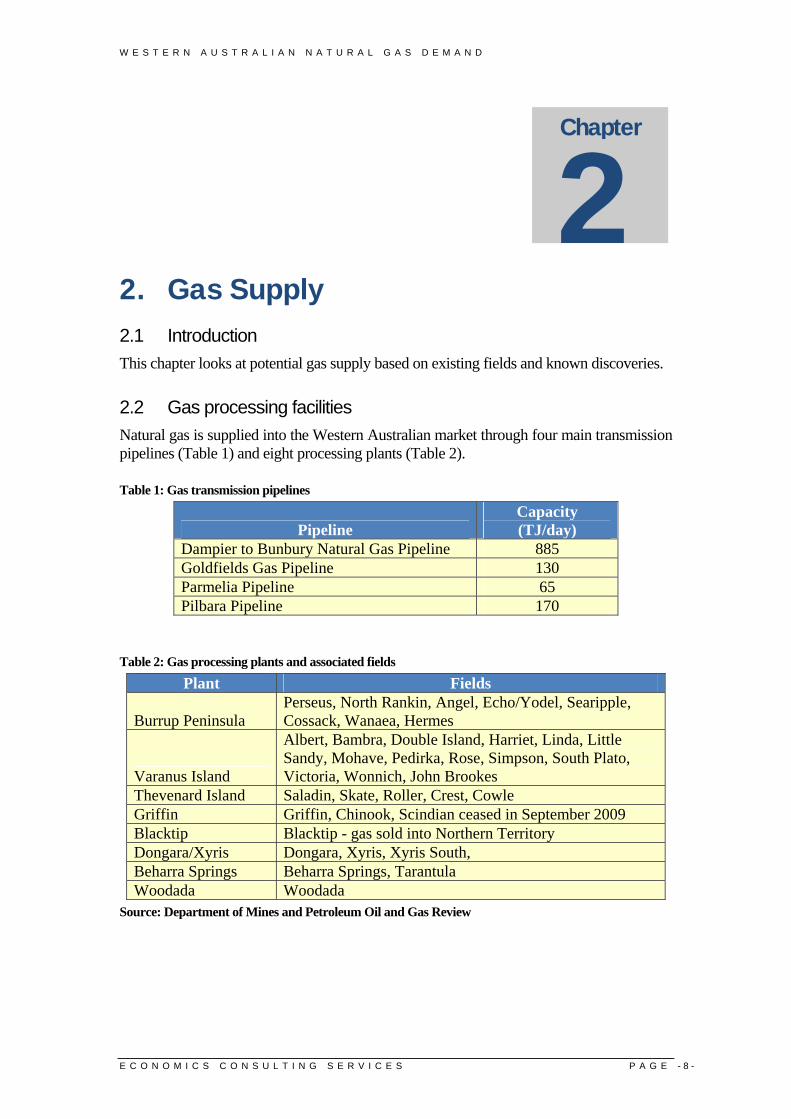
2.2 Gas processing facilities Natural gas is supplied into the Western Australian market through four main transmission pipelines (Table 1) and eight processing plants (Table 2).
Table 1: Gas transmission pipelines
Pipeline Capacity (TJ/day)
Dampier to Bunbury Natural Gas Pipeline 885 Goldfields Gas Pipeline 130 Parmelia Pipeline 65 Pilbara Pipeline 170
Table 2: Gas processing plants and associated fields
Plant Fields
Burrup Peninsula Perseus, North Rankin, Angel, Echo/Yodel, Searipple, Cossack, Wanaea, Hermes
Varanus Island
Albert, Bambra, Double Island, Harriet, Linda, Little Sandy, Mohave, Pedirka, Rose, Simpson, South Plato, Victoria, Wonnich, John Brookes
Thevenard Island Saladin, Skate, Roller, Crest, Cowle Griffin Griffin, Chinook, Scindian ceased in September 2009 Blacktip Blacktip - gas sold into Northern Territory Dongara/Xyris Dongara, Xyris, Xyris South, Beharra Springs Beharra Springs, Tarantula Woodada Woodada
Source: Department of Mines and Petroleum Oil and Gas Review
Chapter
2
W E S T E R N A U S T R A L I A N N A T U R A L G A S D E M A N D
E C O N O M I C S C O N S U L T I N G S E R V I C E S P A G E - 9 -
2.3 Gas producing fields The first natural gas fields supplying towns and large consumers were developed in 1971 followed by the large North West Shelf fields commencing in 1984. The early fields in both areas are now more than 25 years old and most have stopped production or are at low levels. New fields have been discovered in both regions to supplement supplies and exploration continues across wide areas.
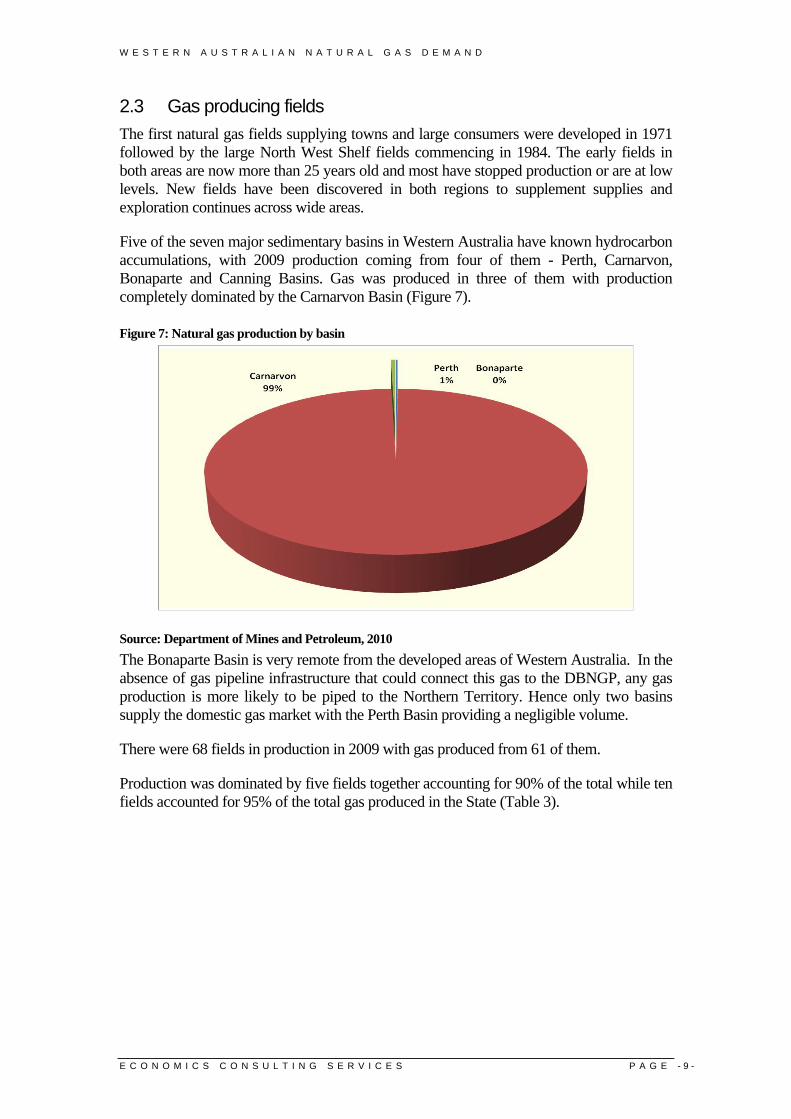
Five of the seven major sedimentary basins in Western Australia have known hydrocarbon accumulations, with 2009 production coming from four of them - Perth, Carnarvon, Bonaparte and Canning Basins. Gas was produced in three of them with production completely dominated by the Carnarvon Basin (Figure 7).
Figure 7: Natural gas production by basin
Source: Department of Mines and Petroleum, 2010 The Bonaparte Basin is very remote from the developed areas of Western Australia. In the absence of gas pipeline infrastructure that could connect this gas to the DBNGP, any gas production is more likely to be piped to the Northern Territory. Hence only two basins supply the domestic gas market with the Perth Basin providing a negligible volume.
There were 68 fields in production in 2009 with gas produced from 61 of them.
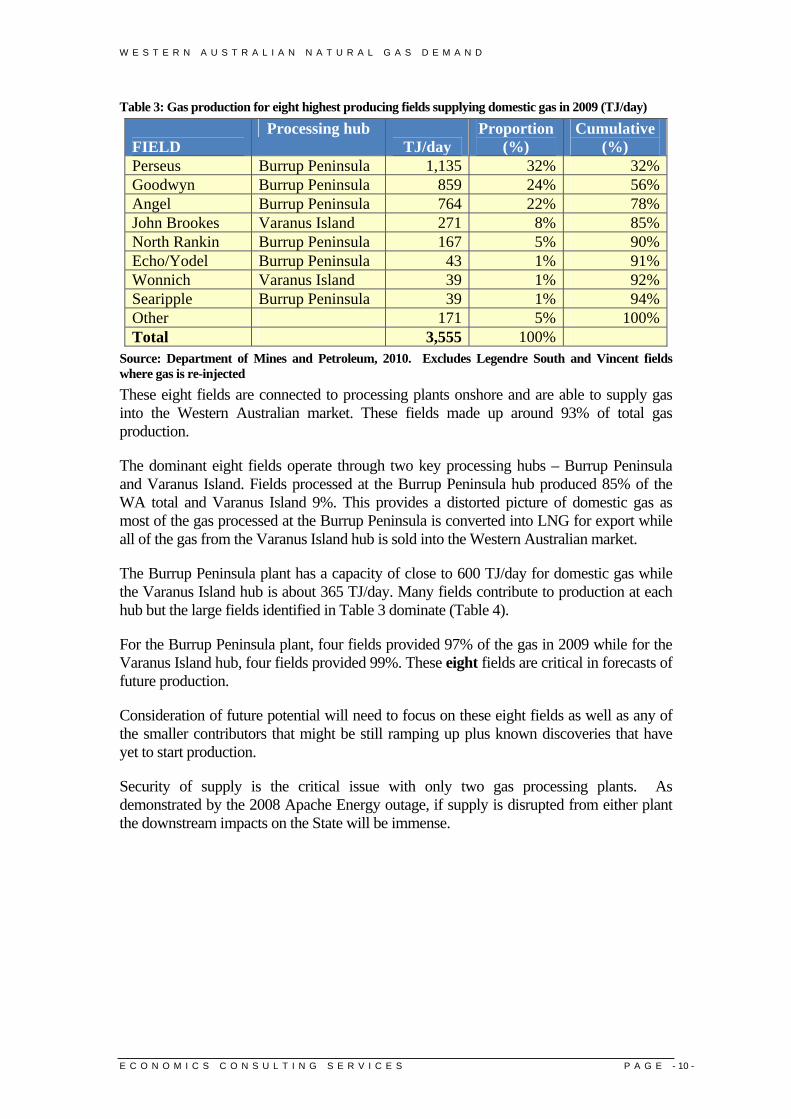
Production was dominated by five fields together accounting for 90% of the total while ten fields accounted for 95% of the total gas produced in the State (Table 3).
W E S T E R N A U S T R A L I A N N A T U R A L G A S D E M A N D
E C O N O M I C S C O N S U L T I N G S E R V I C E S P A G E - 10 -
Table 3: Gas production for eight highest producing fields supplying domestic gas in 2009 (TJ/day)
FIELD Processing hub
TJ/day Proportion
(%) Cumulative
(%) Perseus Burrup Peninsula 1,135 32% 32%Goodwyn Burrup Peninsula 859 24% 56%Angel Burrup Peninsula 764 22% 78%John Brookes Varanus Island 271 8% 85%North Rankin Burrup Peninsula 167 5% 90%Echo/Yodel Burrup Peninsula 43 1% 91%Wonnich Varanus Island 39 1% 92%Searipple Burrup Peninsula 39 1% 94%Other 171 5% 100%Total 3,555 100%
Source: Department of Mines and Petroleum, 2010. Excludes Legendre South and Vincent fields where gas is re-injected These eight fields are connected to processing plants onshore and are able to supply gas into the Western Australian market. These fields made up around 93% of total gas production.
The dominant eight fields operate through two key processing hubs – Burrup Peninsula and Varanus Island. Fields processed at the Burrup Peninsula hub produced 85% of the WA total and Varanus Island 9%. This provides a distorted picture of domestic gas as most of the gas processed at the Burrup Peninsula is converted into LNG for export while all of the gas from the Varanus Island hub is sold into the Western Australian market.
The Burrup Peninsula plant has a capacity of close to 600 TJ/day for domestic gas while the Varanus Island hub is about 365 TJ/day. Many fields contribute to production at each hub but the large fields identified in Table 3 dominate (Table 4).
For the Burrup Peninsula plant, four fields provided 97% of the gas in 2009 while for the Varanus Island hub, four fields provided 99%. These eight fields are critical in forecasts of future production.
Consideration of future potential will need to focus on these eight fields as well as any of the smaller contributors that might be still ramping up plus known discoveries that have yet to start production.
Security of supply is the critical issue with only two gas processing plants. As demonstrated by the 2008 Apache Energy outage, if supply is disrupted from either plant the downstream impacts on the State will be immense.
W E S T E R N A U S T R A L I A N N A T U R A L G A S D E M A N D
E C O N O M I C S C O N S U L T I N G S E R V I C E S P A G E - 11 -
Table 4: Gas production in 2009 and processing hubs
FIELD Production
(TJ/day)
Hub proportion
(%)
Gas producing age (years)
Burrup Peninsula Perseus 1,135 37 19 Goodwyn 859 28 25 Angel 764 25 2 North Rankin 167 5 26 Echo/Yodel 43 1 8 Searipple 39 1 3 Cossack/Wanaea 16 1 15 Hermes 9 Total 3,032 100 Varanus Island John Brookes 271.4 79 5 Wonnich 39.5 12 11 Bambra 21.6 6 4 Rose 6.7 2 5 North Alkimos 0.8 4 Harriet 0.4 18 Double Island 0.4 7 Pedirka 0.4 8 Simpson 0.4 9 South Plato 0.4 7 Albert 0.2 4 Little Sandy 0.1 8 Mohave 0.1 5 Victoria 0.1 8 Total 342.5 99
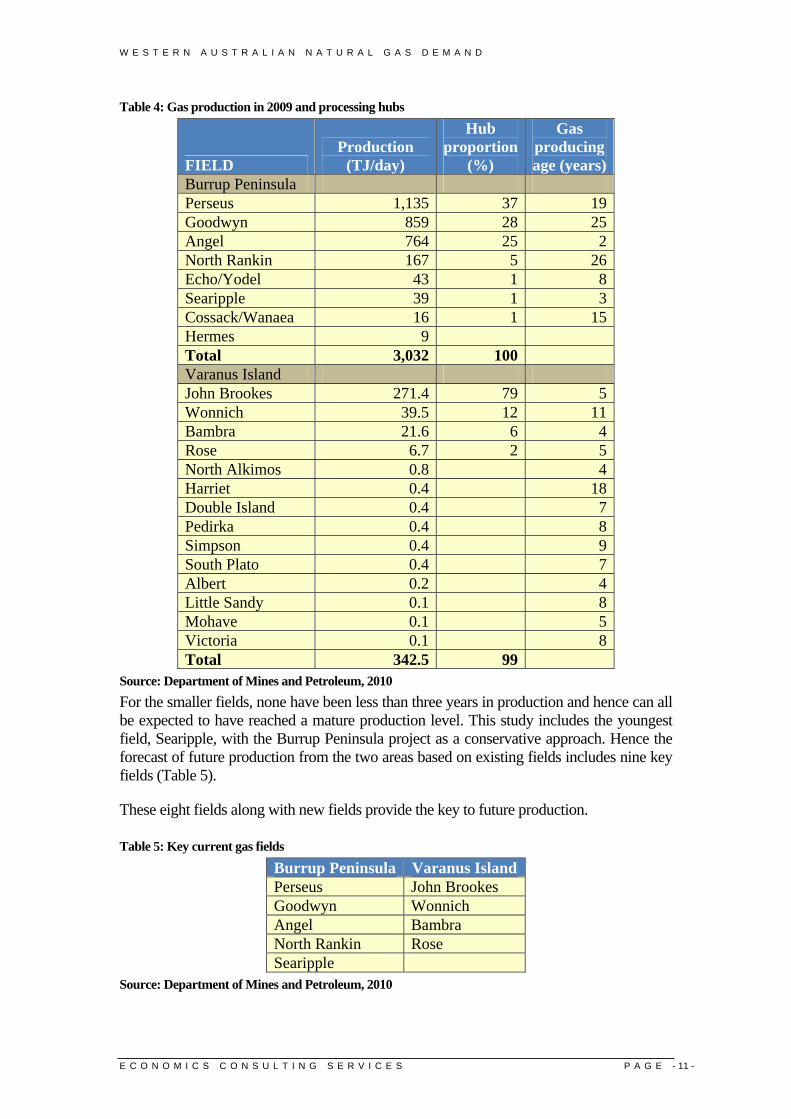
Source: Department of Mines and Petroleum, 2010 For the smaller fields, none have been less than three years in production and hence can all be expected to have reached a mature production level. This study includes the youngest field, Searipple, with the Burrup Peninsula project as a conservative approach. Hence the forecast of future production from the two areas based on existing fields includes nine key fields (Table 5).
These eight fields along with new fields provide the key to future production.
Table 5: Key current gas fields
Burrup Peninsula Varanus IslandPerseus John Brookes Goodwyn Wonnich Angel Bambra North Rankin Rose Searipple
Source: Department of Mines and Petroleum, 2010
W E S T E R N A U S T R A L I A N N A T U R A L G A S D E M A N D
E C O N O M I C S C O N S U L T I N G S E R V I C E S P A G E - 12 -
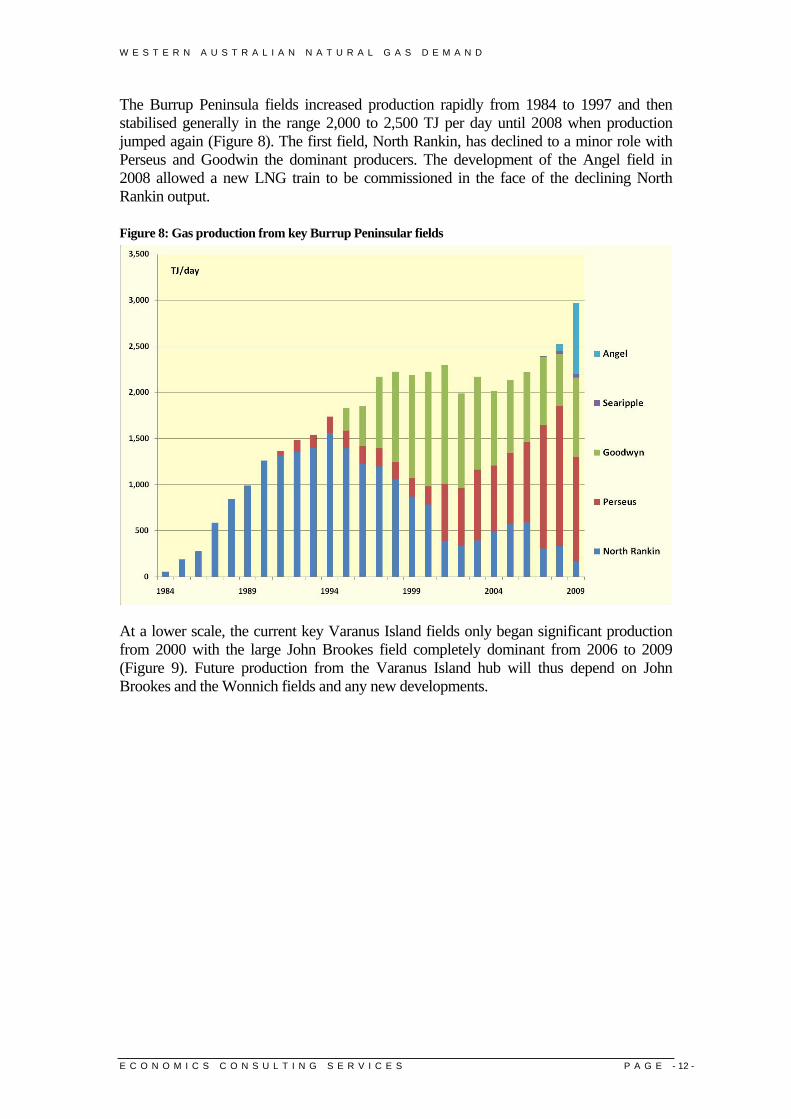
The Burrup Peninsula fields increased production rapidly from 1984 to 1997 and then stabilised generally in the range 2,000 to 2,500 TJ per day until 2008 when production jumped again (Figure 8). The first field, North Rankin, has declined to a minor role with Perseus and Goodwin the dominant producers. The development of the Angel field in 2008 allowed a new LNG train to be commissioned in the face of the declining North Rankin output.
Figure 8: Gas production from key Burrup Peninsular fields
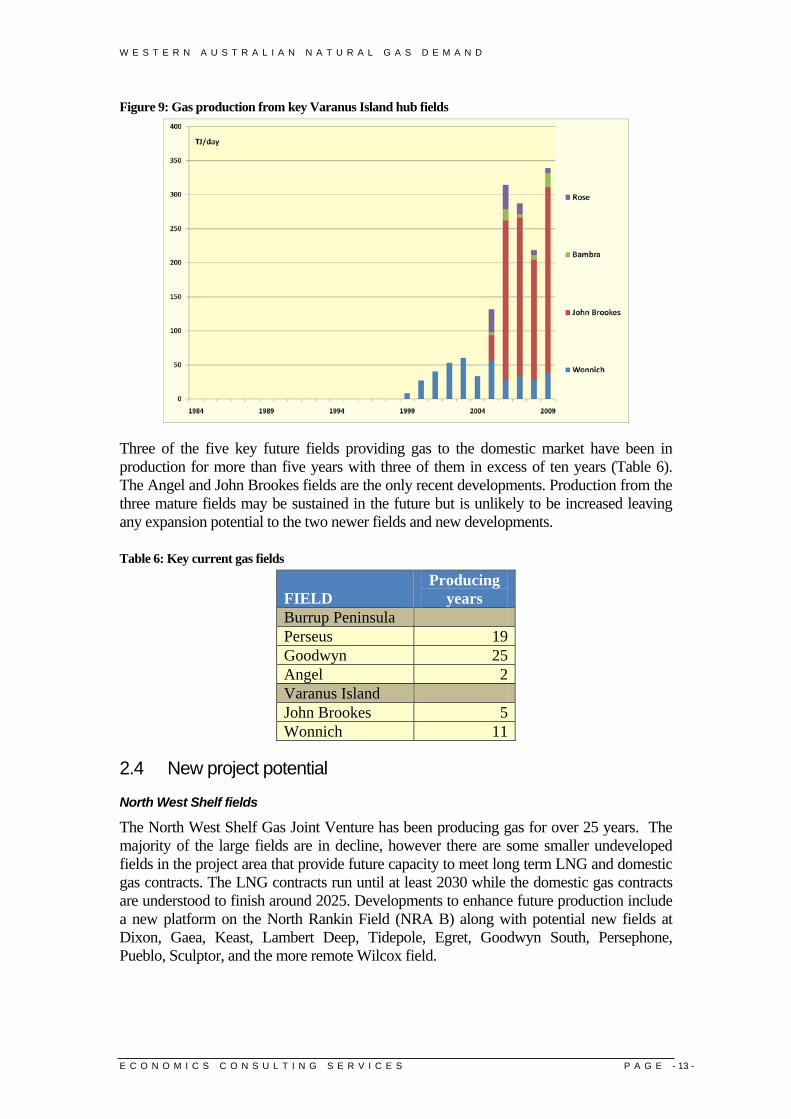
At a lower scale, the current key Varanus Island fields only began significant production from 2000 with the large John Brookes field completely dominant from 2006 to 2009 (Figure 9). Future production from the Varanus Island hub will thus depend on John Brookes and the Wonnich fields and any new developments.
W E S T E R N A U S T R A L I A N N A T U R A L G A S D E M A N D
E C O N O M I C S C O N S U L T I N G S E R V I C E S P A G E - 13 -
Figure 9: Gas production from key Varanus Island hub fields
Three of the five key future fields providing gas to the domestic market have been in production for more than five years with three of them in excess of ten years (Table 6). The Angel and John Brookes fields are the only recent developments. Production from the three mature fields may be sustained in the future but is unlikely to be increased leaving any expansion potential to the two newer fields and new developments.
Table 6: Key current gas fields
FIELD Producing
years Burrup Peninsula Perseus 19Goodwyn 25Angel 2Varanus Island John Brookes 5Wonnich 11
2.4 New project potential
North West Shelf fields
The North West Shelf Gas Joint Venture has been producing gas for over 25 years. The majority of the large fields are in decline, however there are some smaller undeveloped fields in the project area that provide future capacity to meet long term LNG and domestic gas contracts. The LNG contracts run until at least 2030 while the domestic gas contracts are understood to finish around 2025. Developments to enhance future production include a new platform on the North Rankin Field (NRA B) along with potential new fields at Dixon, Gaea, Keast, Lambert Deep, Tidepole, Egret, Goodwyn South, Persephone, Pueblo, Sculptor, and the more remote Wilcox field.
W E S T E R N A U S T R A L I A N N A T U R A L G A S D E M A N D
E C O N O M I C S C O N S U L T I N G S E R V I C E S P A G E - 14 -
Pluto
The Pluto and Xena fields were discovered in 2005 and Woodside pursued an aggressive development program. The first LNG processing train at the Burrup Peninsula is reported to be 85% complete with first production anticipated in 2011. The original Woodside announcement in 2007 of project approval did not contain any indication of domestic gas sales2. Other announcements referenced to Woodside referred to the possibility of “a second train and domestic gas facility to help improve the project’s returns”3.
The State government subsequently negotiated with Woodside for a domestic gas reservation subject to a “commerciality” test. Woodside Fact Sheets refer to an area suitable for a domestic gas processing plant but contain no firm plans for such a facility.
While Woodside has committed to a domestic supply at some point, the lack of certainty makes it hard to put a timeline on such a supply. It has been assumed for this study that the supply will not be available until after 2020.
Greater Gorgon Chevron, Shell and ExxonMobil
The Gorgon Project is globally significant with a large resource base and a development life of around 60 years. Chevron, ExxonMobil and Shell have committed to the Project and agreed to provide domestic gas with a condition that such activity be commercial.
The State Agreement Act obliges the Gorgon project to supply 300 TJ/day of domestic gas. The proponents have indicated that they will supply 150 TJ/day from early 2016 and then see how the fields perform in production. A second tranche of 150 TJ/day is forecast to be available from 2021.
While the project has the capacity to supply more than 300 TJ/day, the project’s proposed pipeline from Barrow Island to the DBNGP is limited to this capacity. The 300 TJ/day volume is significantly less than the State government benchmark of 15% of LNG.
Ichthys
The Inpex operated Ichthys project in the Browse Basin will pipe hydrocarbons to Darwin for processing. The project is located in Commonwealth offshore waters and is considered highly unlikely to supply any gas into the Western Australian market.
Reindeer
Apache and Santos are developing this field with a processing plant at Devils Creek. The plant will have a domestic gas supply capacity of 110 TJ/day from 2011.
Macedon
BHP Billiton proposes to develop this field with a processing plant at Onslow. The plant will have a domestic gas supply capacity of 200 TJ/day and is expected to be producing in 2013. It is unclear what percentage of expected production will be made available to the broader market as opposed to meeting BHP Billiton’s own domestic gas energy needs.
2 Woodside press release 27 July 2007 3 Sydney Morning Herald July 28, 2007
W E S T E R N A U S T R A L I A N N A T U R A L G A S D E M A N D
E C O N O M I C S C O N S U L T I N G S E R V I C E S P A G E - 15 -
Wheatstone
Chevron is in advanced pre-feasibility evaluation of this LNG project planned for Onslow. Development is based on the Wheatstone and Iago fields and appears likely to include the Apache operated Julimar and Brunello fields. The proposal is to include a 200 TJ/day pipeline to supply the Western Australian market with first production scheduled for 2015. The State Government has yet to announce a domestic gas reservation commitment on the project.
Julimar/Brunello
Apache is currently delineating these fields for development as part of the Wheatstone project. Any domestic gas sales would be delivered as part of the Wheatstone project.
Spar/Halyard
Apache is in an advanced feasibility evaluation stage for this project with the fields aimed at the domestic market and processing through Varanus Island. The supply will replace the mature fields that are in decline associated with that plant. The two fields are reasonably close to the East Spar platform and could be brought into production relatively easily. This study assumes 50 TJ/day from 2012.
Scarborough
The Scarborough gas field was discovered in 1979 but the isolated location and lack of demand for natural gas at that time prevented development. The operator, Exxon, is now in pre-feasibility with a processing plant being considered for Onslow. The timeline suggests it is unlikely that any gas would be produced before 2021.
Outer Browse Basin
Woodside Energy is the operator of leases covering the Brecknock, Calliance and Torosa gas fields. A significant program of appraisal has been underway since 2005 to better define the commercial potential of these resources and to determine an optimum development strategy. The company has identified James Price Point north of Broome as the preferred processing site and is attempting to negotiate a land access agreement with the local and regional Indigenous community. The State government supports the project. Woodside had indicated possible production by 2013-14 but the recent cancellation of indicative sale contracts with a Chinese customer has shown that this timeline will not be met. The other partners with Woodside in the project have been less enthusiastic about development and appear to view the project as a long term proposition. This study assumes that first production will be after 2021.
BHP Billiton is the operator of five permits in the deepwater Outer Browse Basin, located west of the Brecknock and Torosa discoveries. The Outer Browse is a relatively high-risk frontier basin with the potential to deliver large volumes of gas for LNG supply in the future. These Outer Browse fields are very remote and this study assumes that first production will be after 2021.
The State Government has yet to announce a domestic gas reservation commitment on the Browse project.
W E S T E R N A U S T R A L I A N N A T U R A L G A S D E M A N D
E C O N O M I C S C O N S U L T I N G S E R V I C E S P A G E - 16 -
2.5 Forecast Supply The Department of Mines and Petroleum (DMP) has forecast gas supply for Western Australia over the period to 2030. With an overwhelming volume of domestic gas consumed by the mining, manufacturing and electricity generation industry, future growth is dependent on the extent to which new projects are developed and/or expanded.
Supply was determined by summing existing supply agreements (State Agreement gas from North West Shelf Gas and Gorgon projects), and anticipated gas from the development of new fields either for domestic gas (as in the case of Macedon and Reindeer), or for LNG with a domestic gas reservation applied. This supply forecast does not take into account potential price changes that might influence supply and is hence a forecast based largely on published projections of supply for new projects and the estimated decline in current producing fields.
The DMP forecast was based on a number of published assumptions but insufficient data exists to replicate the graphs accurately. Economics Consulting Services has attempted to replicate the graph by adjusting the assumptions and including projects for which timing or volumes were not stated (Table 7).
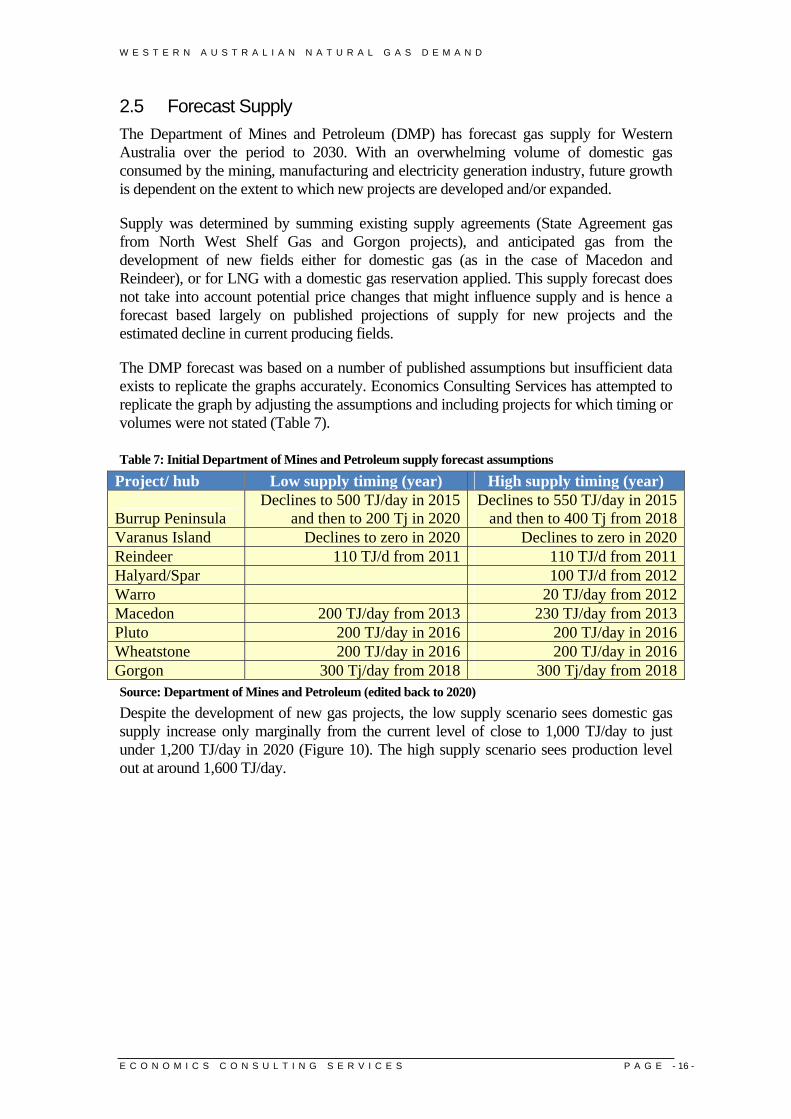
Table 7: Initial Department of Mines and Petroleum supply forecast assumptions
Project/ hub Low supply timing (year) High supply timing (year)
Burrup Peninsula Declines to 500 TJ/day in 2015
and then to 200 Tj in 2020Declines to 550 TJ/day in 2015
and then to 400 Tj from 2018Varanus Island Declines to zero in 2020 Declines to zero in 2020Reindeer 110 TJ/d from 2011 110 TJ/d from 2011Halyard/Spar 100 TJ/d from 2012Warro 20 TJ/day from 2012Macedon 200 TJ/day from 2013 230 TJ/day from 2013Pluto 200 TJ/day in 2016 200 TJ/day in 2016Wheatstone 200 TJ/day in 2016 200 TJ/day in 2016Gorgon 300 Tj/day from 2018 300 Tj/day from 2018Source: Department of Mines and Petroleum (edited back to 2020) Despite the development of new gas projects, the low supply scenario sees domestic gas supply increase only marginally from the current level of close to 1,000 TJ/day to just under 1,200 TJ/day in 2020 (Figure 10). The high supply scenario sees production level out at around 1,600 TJ/day.
W E S T E R N A U S T R A L I A N N A T U R A L G A S D E M A N D
E C O N O M I C S C O N S U L T I N G S E R V I C E S P A G E - 17 -
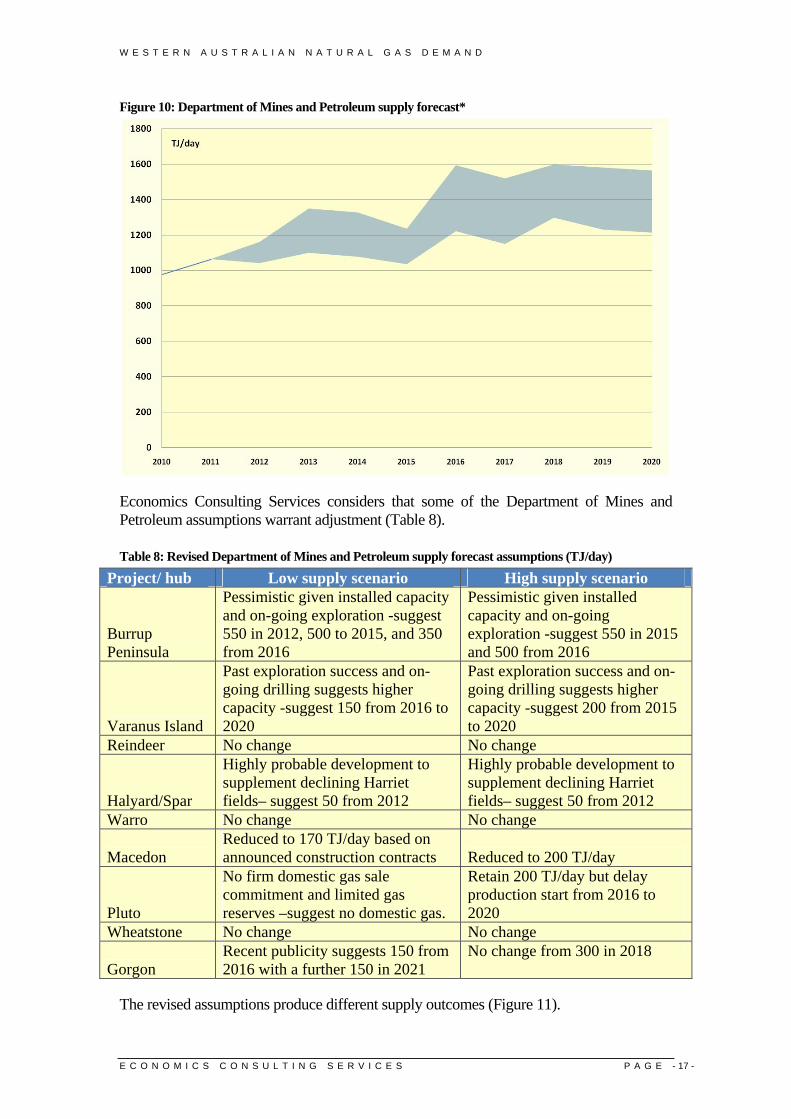
Figure 10: Department of Mines and Petroleum supply forecast*
Economics Consulting Services considers that some of the Department of Mines and Petroleum assumptions warrant adjustment (Table 8).
Table 8: Revised Department of Mines and Petroleum supply forecast assumptions (TJ/day)
Project/ hub Low supply scenario High supply scenario
Burrup Peninsula
Pessimistic given installed capacity and on-going exploration -suggest 550 in 2012, 500 to 2015, and 350 from 2016
Pessimistic given installed capacity and on-going exploration -suggest 550 in 2015 and 500 from 2016
Varanus Island
Past exploration success and on-going drilling suggests higher capacity -suggest 150 from 2016 to 2020
Past exploration success and on-going drilling suggests higher capacity -suggest 200 from 2015 to 2020
Reindeer No change No change
Halyard/Spar
Highly probable development to supplement declining Harriet fields– suggest 50 from 2012
Highly probable development to supplement declining Harriet fields– suggest 50 from 2012
Warro No change No change
Macedon Reduced to 170 TJ/day based on announced construction contracts Reduced to 200 TJ/day
Pluto
No firm domestic gas sale commitment and limited gas reserves –suggest no domestic gas.
Retain 200 TJ/day but delay production start from 2016 to 2020
Wheatstone No change No change
Gorgon Recent publicity suggests 150 from 2016 with a further 150 in 2021
No change from 300 in 2018
The revised assumptions produce different supply outcomes (Figure 11).
W E S T E R N A U S T R A L I A N N A T U R A L G A S D E M A N D
E C O N O M I C S C O N S U L T I N G S E R V I C E S P A G E - 18 -
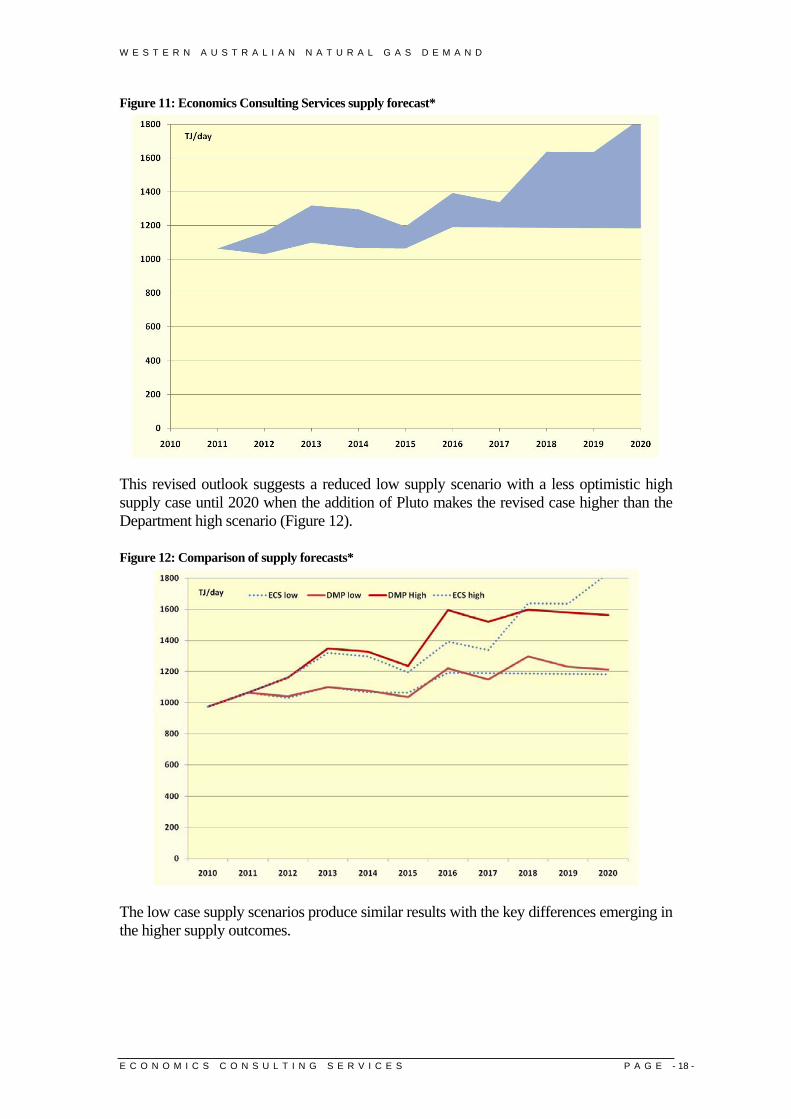
Figure 11: Economics Consulting Services supply forecast*
This revised outlook suggests a reduced low supply scenario with a less optimistic high supply case until 2020 when the addition of Pluto makes the revised case higher than the Department high scenario (Figure 12).
Figure 12: Comparison of supply forecasts*
The low case supply scenarios produce similar results with the key differences emerging in the higher supply outcomes.
W E S T E R N A U S T R A L I A N N A T U R A L G A S D E M A N D
E C O N O M I C S C O N S U L T I N G S E R V I C E S P A G E - 19 -
3. Gas Demand 3.1 Introduction This report looks at potential gas demand from a project perspective and compares this with forecasts based on past consumption patterns.
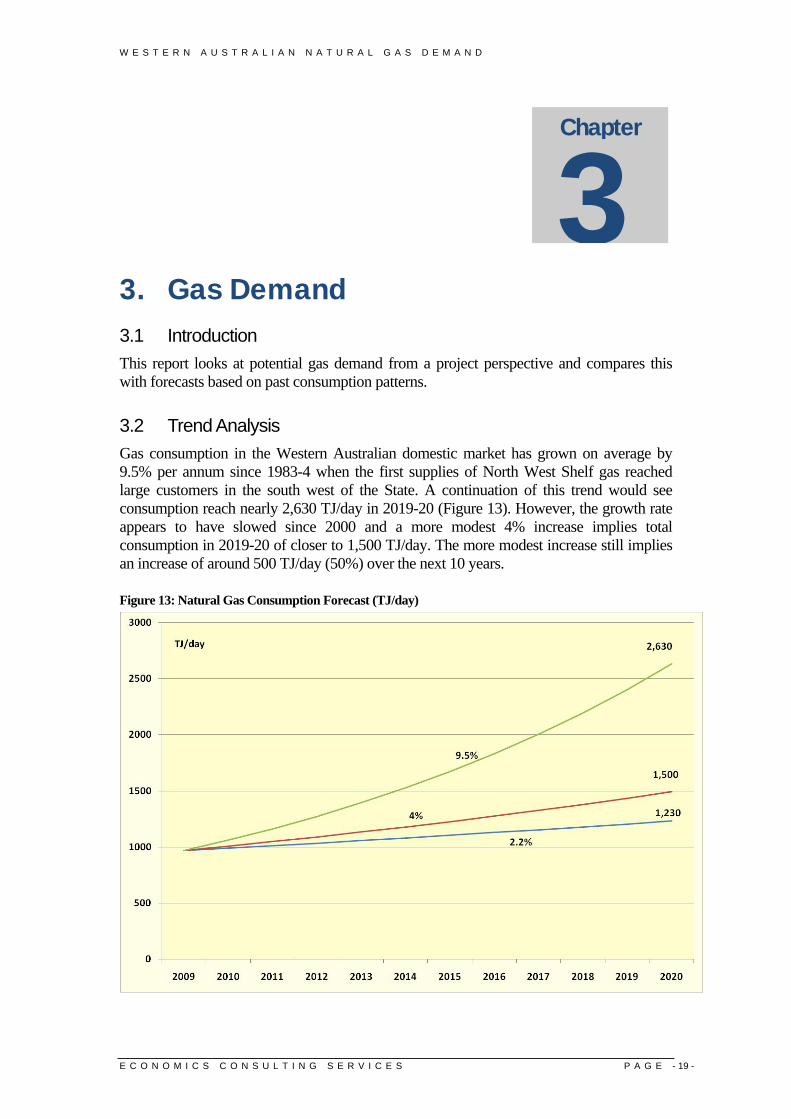
3.2 Trend Analysis Gas consumption in the Western Australian domestic market has grown on average by 9.5% per annum since 1983-4 when the first supplies of North West Shelf gas reached large customers in the south west of the State. A continuation of this trend would see consumption reach nearly 2,630 TJ/day in 2019-20 (Figure 13). However, the growth rate appears to have slowed since 2000 and a more modest 4% increase implies total consumption in 2019-20 of closer to 1,500 TJ/day. The more modest increase still implies an increase of around 500 TJ/day (50%) over the next 10 years.
Figure 13: Natural Gas Consumption Forecast (TJ/day)
Chapter
3
W E S T E R N A U S T R A L I A N N A T U R A L G A S D E M A N D
E C O N O M I C S C O N S U L T I N G S E R V I C E S P A G E - 20 -
ABARE has forecast a growth rate for gas production of 7.1% per annum from 2009 to 2030 but this is primarily driven by export demand for LNG. Primary energy consumption in Western Australia is forecast to be the highest in the nation at 2.2% per annum to 2029-30. Electricity generation is forecast to grow at 2.2% per annum. ABARE propose that much of the electricity growth will come from gas which will account for 68% of the expansion in the generation increase. Applying a 2.2% rate of growth to natural gas would see consumption increase to 1,230 TJ/day in 2019-20 (Figure 13).
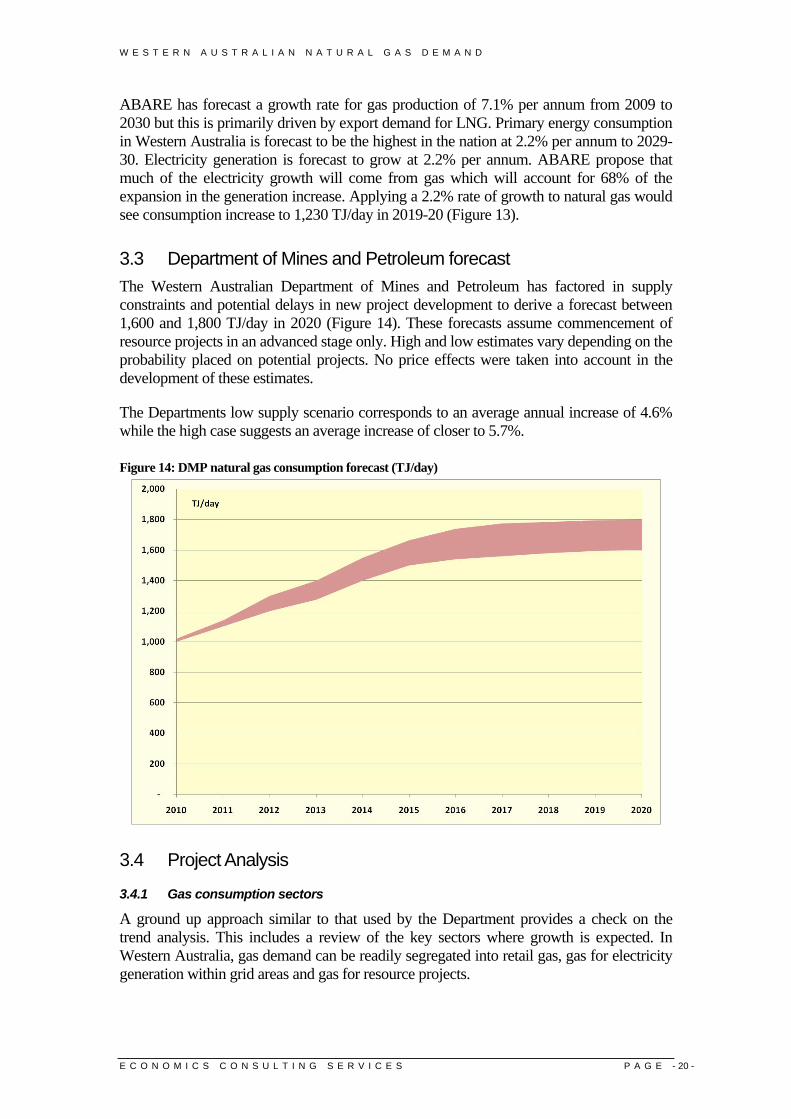
3.3 Department of Mines and Petroleum forecast The Western Australian Department of Mines and Petroleum has factored in supply constraints and potential delays in new project development to derive a forecast between 1,600 and 1,800 TJ/day in 2020 (Figure 14). These forecasts assume commencement of resource projects in an advanced stage only. High and low estimates vary depending on the probability placed on potential projects. No price effects were taken into account in the development of these estimates.
The Departments low supply scenario corresponds to an average annual increase of 4.6% while the high case suggests an average increase of closer to 5.7%.
Figure 14: DMP natural gas consumption forecast (TJ/day)
3.4 Project Analysis
3.4.1 Gas consumption sectors
A ground up approach similar to that used by the Department provides a check on the trend analysis. This includes a review of the key sectors where growth is expected. In Western Australia, gas demand can be readily segregated into retail gas, gas for electricity generation within grid areas and gas for resource projects.
W E S T E R N A U S T R A L I A N N A T U R A L G A S D E M A N D
E C O N O M I C S C O N S U L T I N G S E R V I C E S P A G E - 21 -
3.4.2 Retail Gas
Retail gas makes up an estimated 14% of gas use or around 133 TJ/day of consumption. This use is closely tied to the population of the state and hence to economic growth. The Western Australian population has grown strongly over the last decade and is forecast to continue to expand at a rate above the national average. For this study, a conservative 2% population growth rate is assumed compared to rates in excess of this level for the last four years. This expansion would cause an increase of 15 TJ/day by 2015 and 30 TJ/day by 2020.
3.4.3 Electricity Generation
Energy sources for electricity generation primarily depend on the location of the power station and the purpose for which it is intended. In the interconnected grid servicing the south west of the State (SWIS), coal and natural gas have been the dominant fuel sources. In the Pilbara grid, natural gas and prior to that, fuel oil, were the only sources. Regional towns not connected to either grid have traditionally been diesel fired. Gas (in the form of LNG) is now being used as an alternative in a number of Kimberly power stations with small local grids. Mine sites were traditionally diesel fired with gas emerging as a major fuel source following the construction of the Goldfields Gas Transmission pipeline in 1996.
Coal and fuel oil were the dominant sources of primary energy in the SWIS until gas arrived in large volumes with the Dampier to Bunbury Natural Gas Pipeline. Coal remained the preferred option for base load generation with gas use in peak electricity generation plants. Over time, relative price changes allowed some mid-merit, and more recently baseload, electricity generation plant to operate profitably on gas and the proportion of installed capacity able to operate on gas gradually increased.
Future gas use depends on changing price relativities. Coal is now significantly cheaper than the gas prices on offer and will be the dominant fuel of choice for power generation where it is suitable. This suggests that gas use will be confined to the following situations:
1. SWIS - peak electricity generation plants where the speed of response is important and where generation use will be limited to peak periods in the year. Also “spinning reserve” plants as backup for renewable energy sources such as wind and solar
2. Pilbara grid - Power plants on mine sites and towns 3. Off-grid power stations – mostly remote towns and minesites within
reasonable proximity of gas pipeline or remote towns where LNG can be obtained
SWIS The State Government has committed to a renewable energy target of 20% of grid output being from renewable sources by 2020. This energy source requires “spinning reserve” as backup for periods when the energy source is not available. An estimate is that about 80% of the installed renewable capacity is required as backup and gas is the most suitable fuel. Such backup may not be necessary during periods of low electricity demand. Calculation of the gas required for backup is complex depending on peak demand cycles, renewable availability, electricity transmission stability, and the level of desired electricity supply security.
W E S T E R N A U S T R A L I A N N A T U R A L G A S D E M A N D
E C O N O M I C S C O N S U L T I N G S E R V I C E S P A G E - 22 -
The government Independent Market Operator forecasts that electricity consumption in the SWIS will grow at 3.3% per annum on average over the period to 2019-20, while peak demand is forecast to grow at 4.3% over this period. The forecast of additional reserve generation demand in the SWIS is:
• 2015-16 – 1,240 MW
• 2019-20 – 2,000 MW These are conservative forecasts based on a low economic growth scenario. That scenario prepared in 2009 now appears dismal given the recovery in the State economy. A more optimistic outlook provides estimates of 1,430 MW in 2015-16 and 2,300 MW in 2019-20. This study assumes the base case to ensure a conservative outcome.
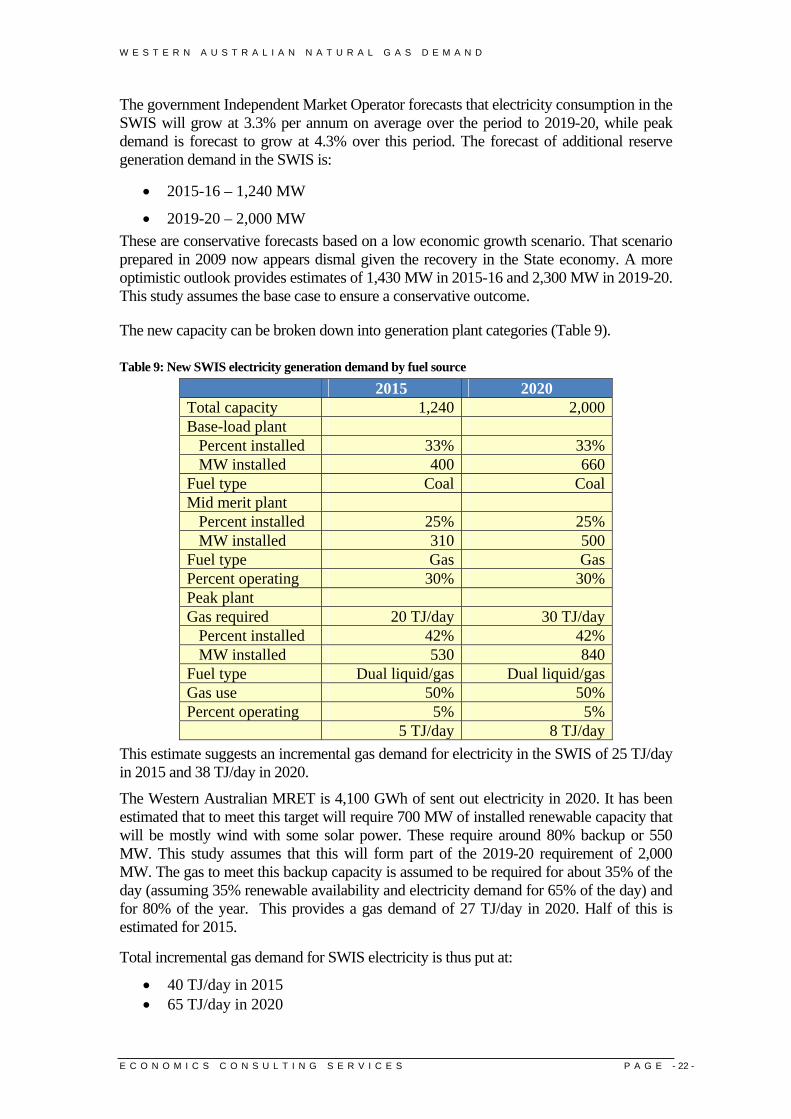
The new capacity can be broken down into generation plant categories (Table 9).
Table 9: New SWIS electricity generation demand by fuel source
2015 2020 Total capacity 1,240 2,000 Base-load plant Percent installed 33% 33% MW installed 400 660 Fuel type Coal Coal Mid merit plant Percent installed 25% 25% MW installed 310 500 Fuel type Gas Gas Percent operating 30% 30% Peak plant Gas required 20 TJ/day 30 TJ/day Percent installed 42% 42% MW installed 530 840 Fuel type Dual liquid/gas Dual liquid/gas Gas use 50% 50% Percent operating 5% 5% 5 TJ/day 8 TJ/day
This estimate suggests an incremental gas demand for electricity in the SWIS of 25 TJ/day in 2015 and 38 TJ/day in 2020.
The Western Australian MRET is 4,100 GWh of sent out electricity in 2020. It has been estimated that to meet this target will require 700 MW of installed renewable capacity that will be mostly wind with some solar power. These require around 80% backup or 550 MW. This study assumes that this will form part of the 2019-20 requirement of 2,000 MW. The gas to meet this backup capacity is assumed to be required for about 35% of the day (assuming 35% renewable availability and electricity demand for 65% of the day) and for 80% of the year. This provides a gas demand of 27 TJ/day in 2020. Half of this is estimated for 2015.
Total incremental gas demand for SWIS electricity is thus put at:
• 40 TJ/day in 2015 • 65 TJ/day in 2020
W E S T E R N A U S T R A L I A N N A T U R A L G A S D E M A N D
E C O N O M I C S C O N S U L T I N G S E R V I C E S P A G E - 23 -
Pilbara grid Power demand in the Pilbara has grown dramatically in recent years with the expansion of the iron ore sector and in particular with the development of high energy iron magnetite projects. Virtually all power stations in the North West grid are gas fired with some capable of operating on diesel as well. A few smaller power stations associated with small mining projects and remote communities are diesel fired.
Horizon Power proposed an integrated Pilbara grid and estimated a potential demand for about 1,600 MW of new electricity generation. Over half of this was associated with magnetite production. In the new higher gas price energy environment, this outlook now appears optimistic and this study assumes only half the forecast growth representing 120 TJ/day in 2015 and 240 TJ/day by 2020. This demand will all be associated with mine projects and the flow on consequences for port and town services in the Pilbara. More detail on the actual mining projects is included in the next section.
Off-grid power stations This category includes power stations outside the Pilbara and a small number in the South West area that are not grid connected. There are 28 facilities with a capacity in excess of 10 MW, 18 of them are gas fired, 9 are diesel and 1 is coal. Gas accounts for 76% of the total installed capacity in these locations with diesel firing the others.
A total of 83% of the installed capacity is associated with mining projects and the expansion of this sector will primarily determine future energy demand. Gas turbines make up 80% of the mining capacity which means that across the State, gas power generation on mining and mineral processing plants makes up 67 % of the capacity installed in off-grid locations. Coal fuels one large power station (9%) and diesel capacity accounts for 7% of the total.
Given the dominance of the mining and mineral processing sector, gas demand estimates are covered in the next section.
3.4.4 New Mining and Mineral Processing Projects
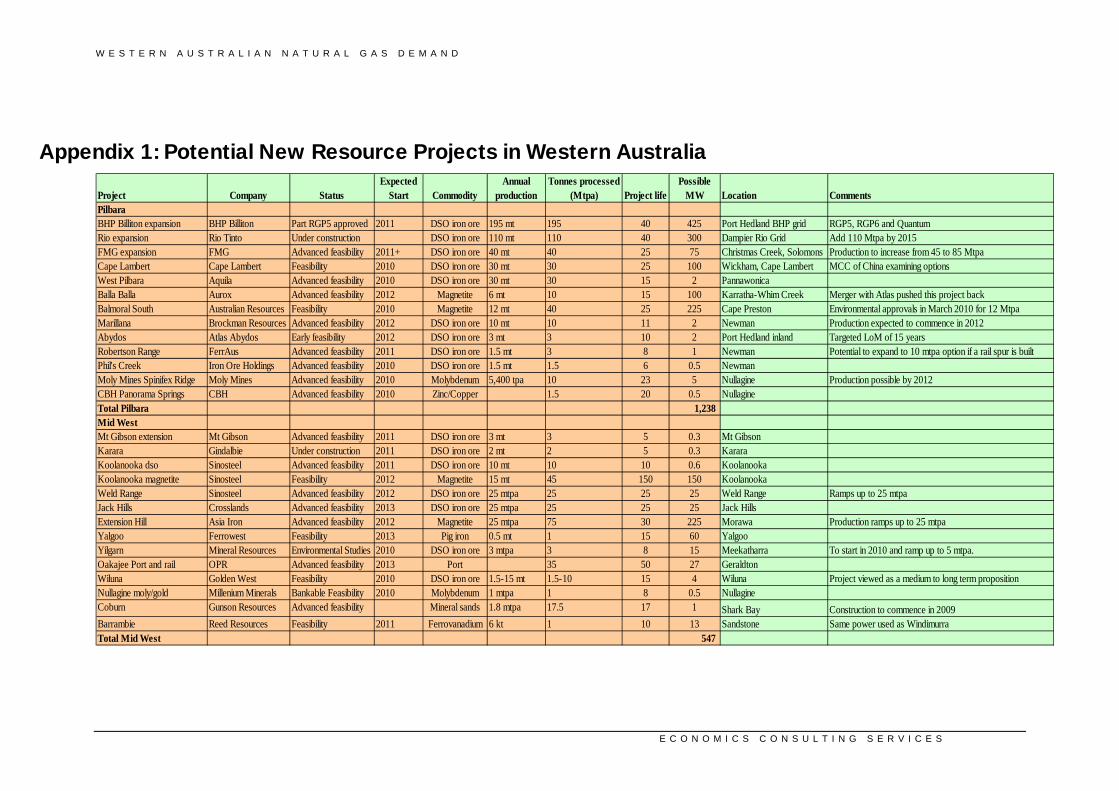
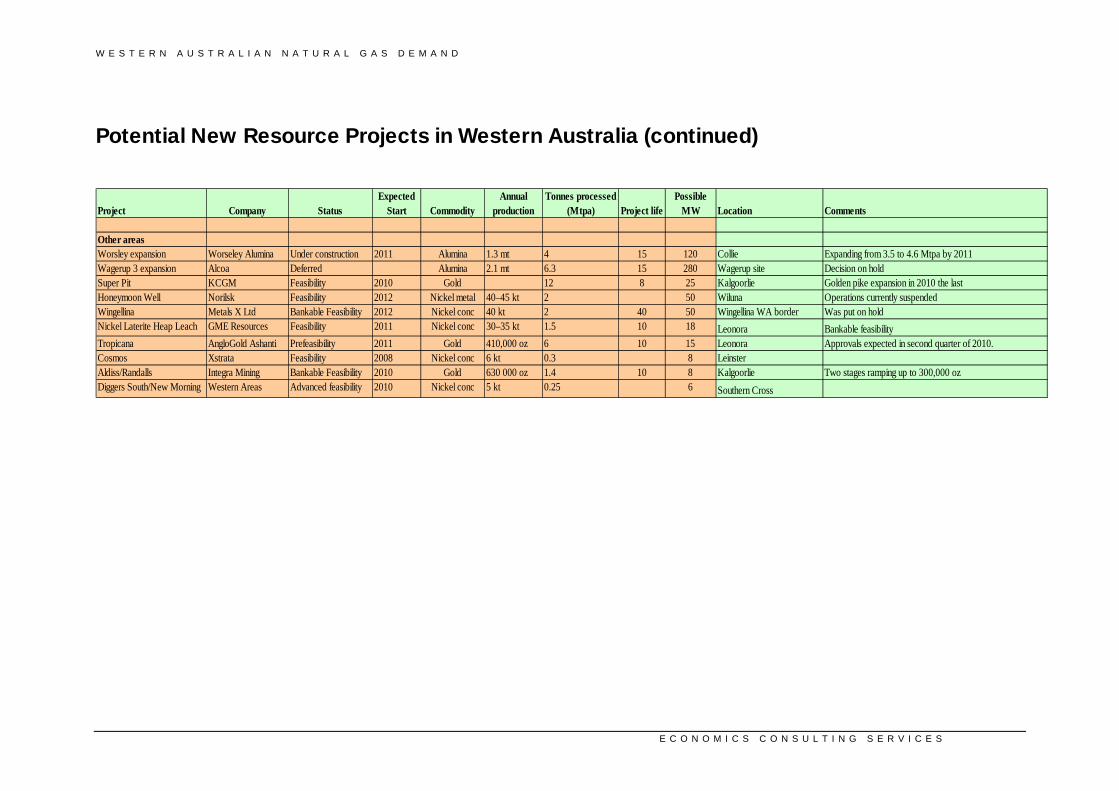
There are a large number of resource projects under consideration for Western Australia over the next five or so years. A list of potential projects is included here to illustrate the demand (Table 10). Not all of these projects will proceed and a number that have not been listed are also possible. This is illustrative only. A more detailed list with an estimated electricity demand range is included as Attachment 1 to this report. In total 41 projects are considered, with a combined estimated power demand of 3,127 MW.
Many projects have not been included for a range of reasons. Some projects will turn to coal due to lack of a competitively priced gas. Some Mid-West iron ore producers have already committed to coal and other fuel sources. Other projects which might use gas if available are difficult to forecast at this stage.
The supply of LNG to two Eastern Goldfields mines has opened up new possibilities for gas producers. Wesfarmers LNG plant at Kwinana points the way to new gas supply options in that region.
W E S T E R N A U S T R A L I A N N A T U R A L G A S D E M A N D
E C O N O M I C S C O N S U L T I N G S E R V I C E S P A G E - 24 -
Table 10: Potential Projects with significant new gas demand in the next five to ten years
Pilbara BHP Billiton iron ore expansion Rio Tinto iron ore expansion FMG expansion Citic Pacific Cape Preston Moly Mines molybdenum Aurox Balla Balla vanadium Australasian Resources Balmoral South Mid West Sinosteel Koolanooka Asia Iron Extension Hill Ferrowest Yalgoo pig iron Gindalbie Karara Midwest Weld Range Oakajee port Goldfields Worsley expansion Newmont Super pit expansion Wagerup 3 Anglo Gold Tropicana South Laverton gold (Saracen Gold) Wingellina nickel Honeymoon Well nickel metal Sinclair nickel concentrate Aldiss/Randalls gold Mt Windarra nickel concentrate Other CSBP ammonium nitrate
A conservative approach has been adopted for this study with only projects in an advanced stage of evaluation included in the base case while all projects are included in a total opportunity scenario. All projects are being planned to start production by 2015.
The base case estimate is 435 TJ/day by 2015 while the total opportunity scenario is 525 TJ/day. The base case forecast demand from this sector in the Pilbara is 230 TJ/day and the remainder of the State being 205 TJ/day.
There are no resource projects included beyond 2015 as this is beyond the planning horizon for most companies and would be purely speculative. Only trend analysis can provide an estimate from 2015 to 2020.
W E S T E R N A U S T R A L I A N N A T U R A L G A S D E M A N D
E C O N O M I C S C O N S U L T I N G S E R V I C E S P A G E - 25 -
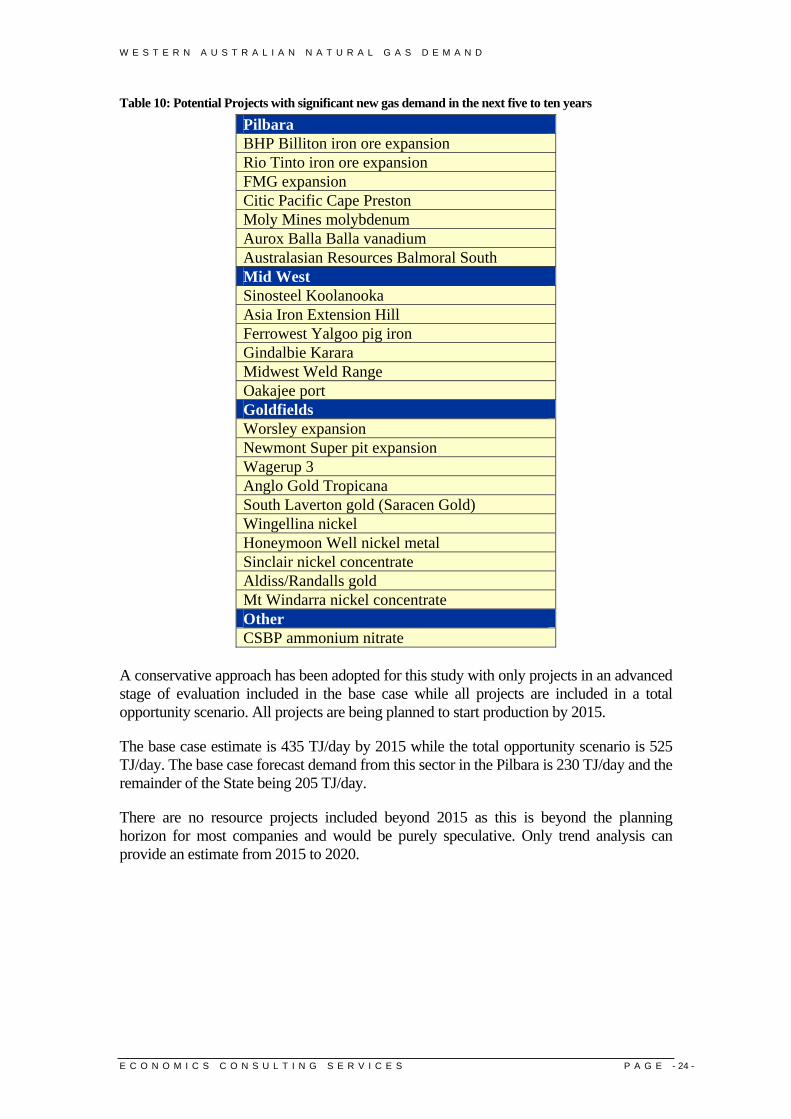
2.3.5 Project analysis total gas demand summary
2015 2020 Retail 15 30 SWIS 40 65 Mining sector 435 525 Total demand 490 620
The project analysis provides a similar outcome to that completed by the Department of Mines and Petroleum with the single point estimates (blue dots estimated by Economics Consulting Services) within the band proposed by the Department (Figure 15).
Figure 15: Forecast supply shortfall (TJ/day)
Comparison of this study forecast gas supply and DMP consumption levels suggests that for virtually all of the next decade potential consumption exceeds the expected supply (Figure 16). From 2018, the high supply scenario provides enough gas to meet the low consumption scenario.
W E S T E R N A U S T R A L I A N N A T U R A L G A S D E M A N D
E C O N O M I C S C O N S U L T I N G S E R V I C E S P A G E - 26 -
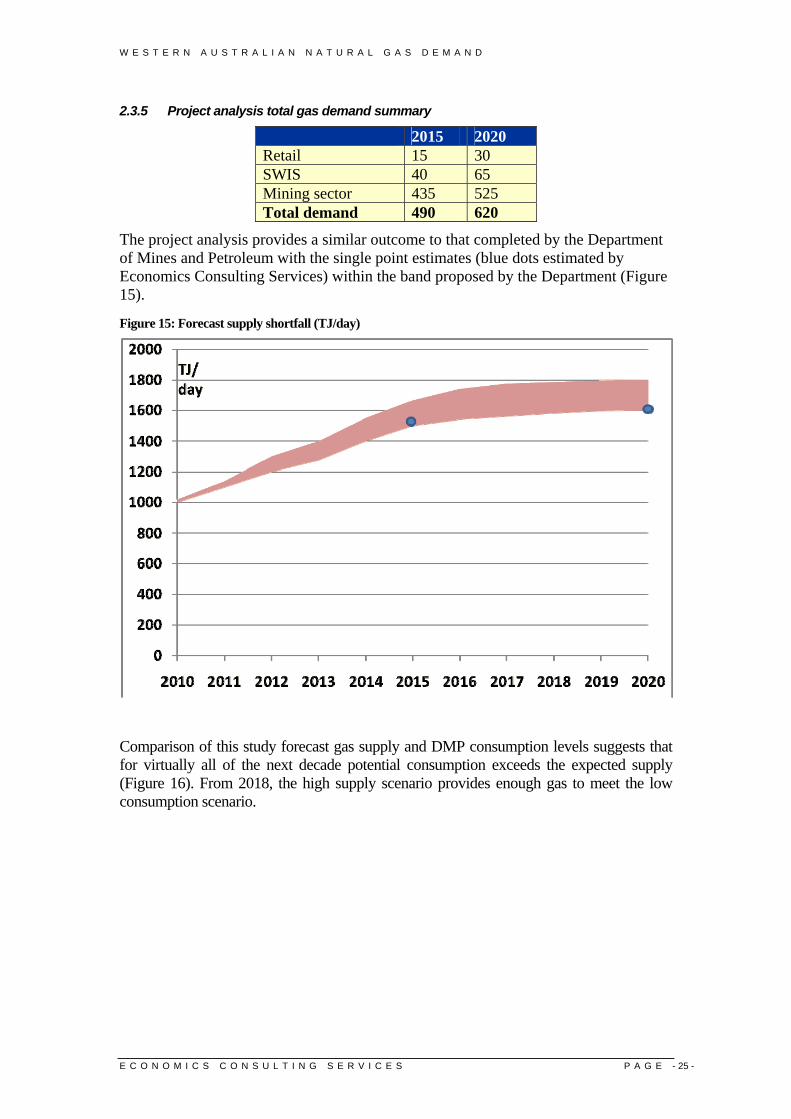
Figure 16: Forecast supply and DMP natural gas consumption (TJ/day)
The supply shortfall at 2015 is between 300 and 600 TJ/day while at 2020 the shortfall is between zero and 600 TJ/day. The potential shortfall at both 2015 and 2020 is therefore up to 600 TJ/day. To place this in perspective, this is equivalent to more than half of the State’s current domestic gas consumption.
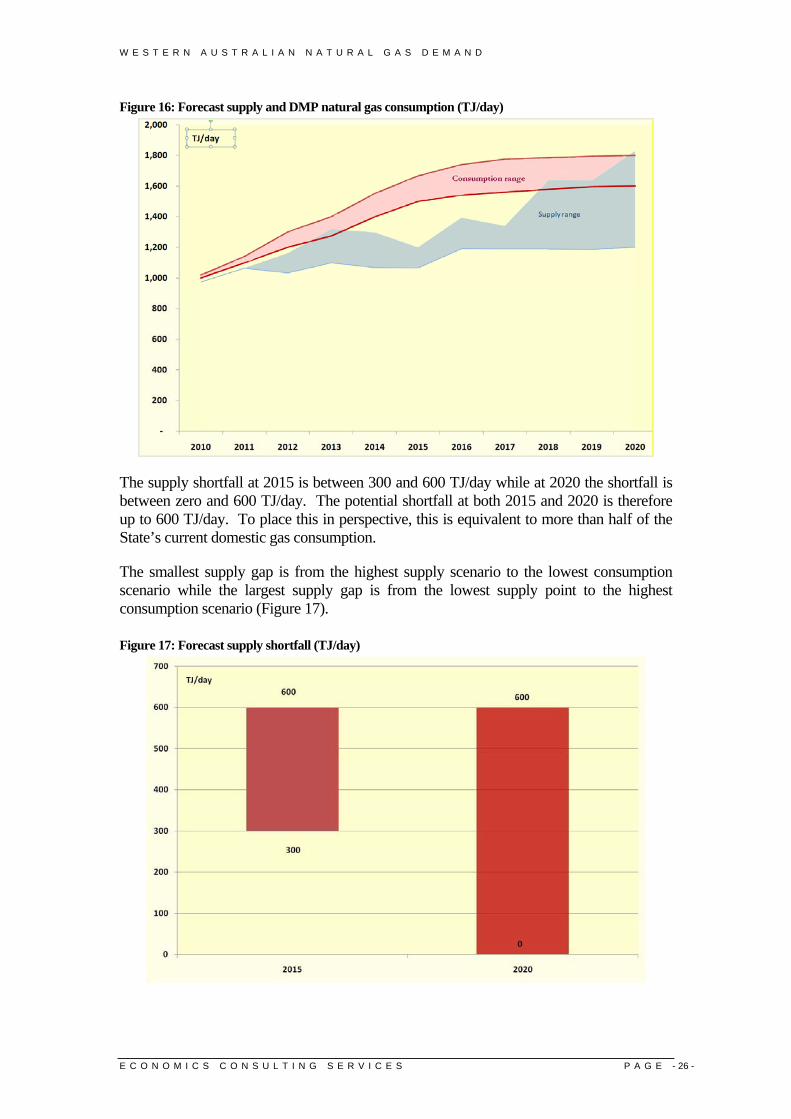
The smallest supply gap is from the highest supply scenario to the lowest consumption scenario while the largest supply gap is from the lowest supply point to the highest consumption scenario (Figure 17).
Figure 17: Forecast supply shortfall (TJ/day)
W E S T E R N A U S T R A L I A N N A T U R A L G A S D E M A N D
E C O N O M I C S C O N S U L T I N G S E R V I C E S P A G E - 27 -
4. Economic Impacts 4.1 Introduction Natural gas underpins electricity generation, mining and mineral processing in Western Australia. Consumers have moved to this energy source in response to a range of factors including convenience of use, technical advantages, price, and environmental advantages. Each industry has options for alternative energy sources except those that are based on gas conversion or chemical processing using gas as feedstock. The suitability of the alternatives will vary with industry and project location. For example, electricity generation can be based on coal in the south west of the State or diesel in areas remote from an electricity grid.
For some industries, the conversion to other energy sources will be relatively inexpensive while for others, the alternatives may prevent the project proceeding. For example, iron ore projects based on magnetite with pellet production require substantial energy inputs may not be viable in the Pilbara where the only alternative to natural gas appears to be imported coal or imported fuel oil. Magnetite production may be profitable in the Mid West region where there are coal resources.
The Apache Energy Varanus Island processing hub outage underlined the price sensitivity of many industries to alternative fuel supply and their dependence on competitively priced gas. Gas offered to the market above certain prices was not purchased, demonstrating that there is a very finite price elasticity to gas demand in the industrial and commercial markets in Western Australia.
A comprehensive analysis of the potential impact of a lack of natural gas on the Western Australian economy would examine each industry sector and potential project; review the alternative energy sources and the potential for that project to operate profitably under a range of commodity price scenarios. Such a comprehensive approach would be difficult to undertake and would rely on many assumptions about future relative prices and industry technical options. It is beyond the scope of this study.
An alternative approach is to assume that a lack of gas prevents some projects from proceeding at this time. The best case would be simply a deferral until gas became available while the worst outcome would be the loss of that development completely. Implicit in the first assumption is that commodity prices will continue at levels that enable profitable development when gas becomes available. The second outcome implies that the supply to international markets is met by a competitor outside Western Australia and is not
Chapter
4
W E S T E R N A U S T R A L I A N N A T U R A L G A S D E M A N D
E C O N O M I C S C O N S U L T I N G S E R V I C E S P A G E - 28 -
recovered or that the current “price bubble” is not repeated for the foreseeable future. There are commodity forecasters that hold both views.
4.2 Potential Economic Benefits The projects with new gas demand have the potential to deliver significant economic benefits to the State:
• Construction capital investment - $46 billion • Construction workforce – 32,000 people • Operating workforce – 19,500 jobs • Economic output - $25 billion per annum when all new projects operational
Economic output has been conservatively estimated using long term prices. No value has been ascribed to the increased gas use in the DBNGP or the replacement gas that continues current economic activity.
The economic output of $25 billion a year appears high at first consideration. For comparison, the State Department of Treasury and Finance has estimated a loss over six months for the State economy of $2 billion from the Varanus Island gas disruption. This outage involved a net gas loss of around 250 TJ/day for two months with some gas made up from other projects to cover the full loss of 350 TJ/day. The new project demand forecast here of 851 TJ/day for a full year is 20 times the Varanus Island loss. The implication is that the $19 billion does not appear to be overstating the potential economic impact.
In addition to the potential benefits forgone if adequate gas supplies are not available, existing consumers will also be adversely affected. Some users will be able to convert to electricity or other fossil fuels at relatively low cost while others will face significant conversion and operational disadvantages. While relatively small overall gas consumers, residential dwellings illustrate the options. Houses have water and home heating options that include wood, liquid fossil fuels (heating oil), town gas (from coal) and electricity from a range of energy sources. Houses have, and continue to use, most of these sources and while natural gas has become a preferred option in most urban houses; it would be possible to convert to other sources of heat albeit with inconvenience, cost and environmental consequences.
W E S T E R N A U S T R A L I A N N A T U R A L G A S D E M A N D
E C O N O M I C S C O N S U L T I N G S E R V I C E S
Appendix 1: Potential New Resource Projects in Western Australia
Project Company Status Expected
Start CommodityAnnual
productionTonnes processed
(Mtpa) Project lifePossible
MW Location CommentsPilbara BHP Billiton expansion BHP Billiton Part RGP5 approved 2011 DSO iron ore 195 mt 195 40 425 Port Hedland BHP grid RGP5, RGP6 and QuantumRio expansion Rio Tinto Under construction DSO iron ore 110 mt 110 40 300 Dampier Rio Grid Add 110 Mtpa by 2015 FMG expansion FMG Advanced feasibility 2011+ DSO iron ore 40 mt 40 25 75 Christmas Creek, Solomons Production to increase from 45 to 85 MtpaCape Lambert Cape Lambert Feasibility 2010 DSO iron ore 30 mt 30 25 100 Wickham, Cape Lambert MCC of China examining optionsWest Pilbara Aquila Advanced feasibility 2010 DSO iron ore 30 mt 30 15 2 PannawonicaBalla Balla Aurox Advanced feasibility 2012 Magnetite 6 mt 10 15 100 Karratha-Whim Creek Merger with Atlas pushed this project backBalmoral South Australian Resources Feasibility 2010 Magnetite 12 mt 40 25 225 Cape Preston Environmental approvals in March 2010 for 12 Mtpa Marillana Brockman Resources Advanced feasibility 2012 DSO iron ore 10 mt 10 11 2 Newman Production expected to commence in 2012Abydos Atlas Abydos Early feasibility 2012 DSO iron ore 3 mt 3 10 2 Port Hedland inland Targeted LoM of 15 yearsRobertson Range FerrAus Advanced feasibility 2011 DSO iron ore 1.5 mt 3 8 1 Newman Potential to expand to 10 mtpa option if a rail spur is builtPhil's Creek Iron Ore Holdings Advanced feasibility 2010 DSO iron ore 1.5 mt 1.5 6 0.5 NewmanMoly Mines Spinifex Ridge Moly Mines Advanced feasibility 2010 Molybdenum 5,400 tpa 10 23 5 Nullagine Production possible by 2012CBH Panorama Springs CBH Advanced feasibility 2010 Zinc/Copper 1.5 20 0.5 NullagineTotal Pilbara 1,238 Mid West Mt Gibson extension Mt Gibson Advanced feasibility 2011 DSO iron ore 3 mt 3 5 0.3 Mt GibsonKarara Gindalbie Under construction 2011 DSO iron ore 2 mt 2 5 0.3 KararaKoolanooka dso Sinosteel Advanced feasibility 2011 DSO iron ore 10 mt 10 10 0.6 KoolanookaKoolanooka magnetite Sinosteel Feasibility 2012 Magnetite 15 mt 45 150 150 KoolanookaWeld Range Sinosteel Advanced feasibility 2012 DSO iron ore 25 mtpa 25 25 25 Weld Range Ramps up to 25 mtpaJack Hills Crosslands Advanced feasibility 2013 DSO iron ore 25 mtpa 25 25 25 Jack HillsExtension Hill Asia Iron Advanced feasibility 2012 Magnetite 25 mtpa 75 30 225 Morawa Production ramps up to 25 mtpaYalgoo Ferrowest Feasibility 2013 Pig iron 0.5 mt 1 15 60 YalgooYilgarn Mineral Resources Environmental Studies 2010 DSO iron ore 3 mtpa 3 8 15 Meekatharra To start in 2010 and ramp up to 5 mtpa.Oakajee Port and rail OPR Advanced feasibility 2013 Port 35 50 27 GeraldtonWiluna Golden West Feasibility 2010 DSO iron ore 1.5-15 mt 1.5-10 15 4 Wiluna Project viewed as a medium to long term propositionNullagine moly/gold Millenium Minerals Bankable Feasibility 2010 Molybdenum 1 mtpa 1 8 0.5 NullagineCoburn Gunson Resources Advanced feasibility Mineral sands 1.8 mtpa 17.5 17 1 Shark Bay Construction to commence in 2009Barrambie Reed Resources Feasibility 2011 Ferrovanadium 6 kt 1 10 13 Sandstone Same power used as WindimurraTotal Mid West 547
W E S T E R N A U S T R A L I A N N A T U R A L G A S D E M A N D
E C O N O M I C S C O N S U L T I N G S E R V I C E S
Potential New Resource Projects in Western Australia (continued)
Project Company Status Expected
Start CommodityAnnual
productionTonnes processed
(Mtpa) Project lifePossible
MW Location Comments
Other areasWorsley expansion Worseley Alumina Under construction 2011 Alumina 1.3 mt 4 15 120 Collie Expanding from 3.5 to 4.6 Mtpa by 2011Wagerup 3 expansion Alcoa Deferred Alumina 2.1 mt 6.3 15 280 Wagerup site Decision on holdSuper Pit KCGM Feasibility 2010 Gold 12 8 25 Kalgoorlie Golden pike expansion in 2010 the last Honeymoon Well Norilsk Feasibility 2012 Nickel metal 40–45 kt 2 50 Wiluna Operations currently suspendedWingellina Metals X Ltd Bankable Feasibility 2012 Nickel conc 40 kt 2 40 50 Wingellina WA border Was put on hold Nickel Laterite Heap Leach GME Resources Feasibility 2011 Nickel conc 30–35 kt 1.5 10 18 Leonora Bankable feasibility Tropicana AngloGold Ashanti Prefeasibility 2011 Gold 410,000 oz 6 10 15 Leonora Approvals expected in second quarter of 2010.Cosmos Xstrata Feasibility 2008 Nickel conc 6 kt 0.3 8 LeinsterAldiss/Randalls Integra Mining Bankable Feasibility 2010 Gold 630 000 oz 1.4 10 8 Kalgoorlie Two stages ramping up to 300,000 ozDiggers South/New Morning Western Areas Advanced feasibility 2010 Nickel conc 5 kt 0.25 6 Southern Cross
Related Documents