Water co-produced with coalbed methane in the Powder River Basin, Wyoming: preliminary compositional data by Rice, C.A. 1 , Ellis, M.S. 1 , and Bullock, J.H., Jr. 1 ______________________________________________________ Open-File Report 00-372 2000 This report is preliminary and has not been reviewed for conformity with the U.S. Geological Survey editorial standards or with the North American Stratigraphic Code. Any use of trade names is for descriptive purposes only and does not imply endorsement by the U.S. Government. U.S. DEPARTMENT OF THE INTERIOR U.S. GEOLOGICAL SURVEY 1 Denver, Colorado

Welcome message from author
This document is posted to help you gain knowledge. Please leave a comment to let me know what you think about it! Share it to your friends and learn new things together.
Transcript

Water co-produced with coalbed methane inthe Powder River Basin, Wyoming:preliminary compositional data
by Rice, C.A.1, Ellis, M.S.1, and Bullock, J.H., Jr.1
______________________________________________________
Open-File Report 00-372
2000
This report is preliminary and has not been reviewed for conformity with the U.S. Geological Surveyeditorial standards or with the North American Stratigraphic Code. Any use of trade names is fordescriptive purposes only and does not imply endorsement by the U.S. Government.
U.S. DEPARTMENT OF THE INTERIORU.S. GEOLOGICAL SURVEY
1Denver, Colorado

i
Table of Contents
Introduction .......................................................................................................................... 1Geologic Setting................................................................................................................... 2Methods................................................................................................................................ 3Results and Discussion ........................................................................................................ 4Acknowledgments................................................................................................................ 5References ............................................................................................................................ 5
List of Figures
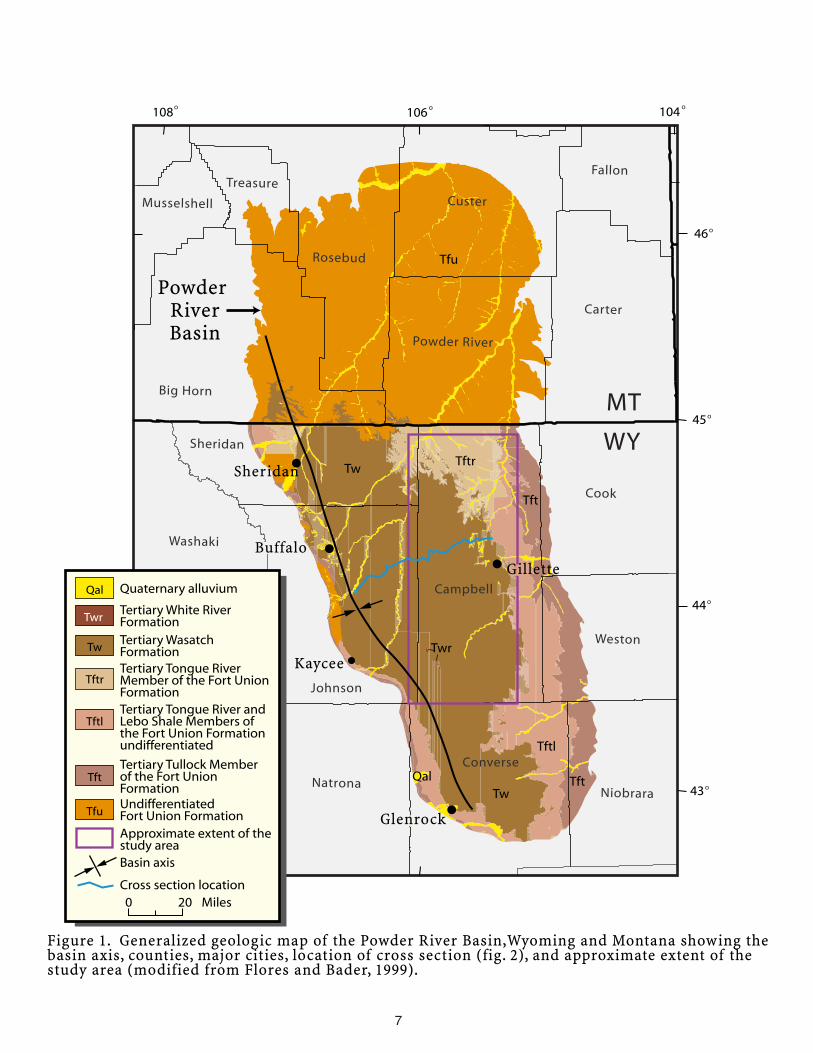
Figure 1. Generalized geologic map of the Powder River Basin, Wyoming and Montanashowing the basin axis, counties, major cities, location of cross section (Fig. 2),and approximate extent of the study area (modified from Flores and Bader,1999).................................................................................................................... 7
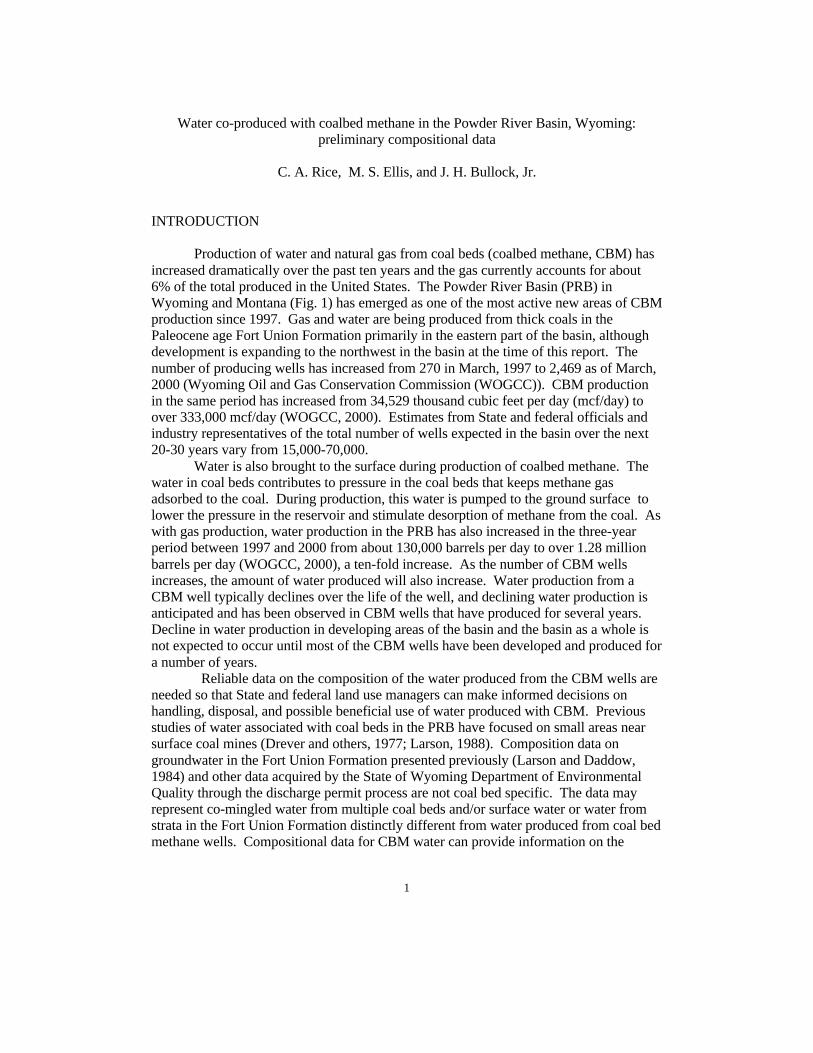
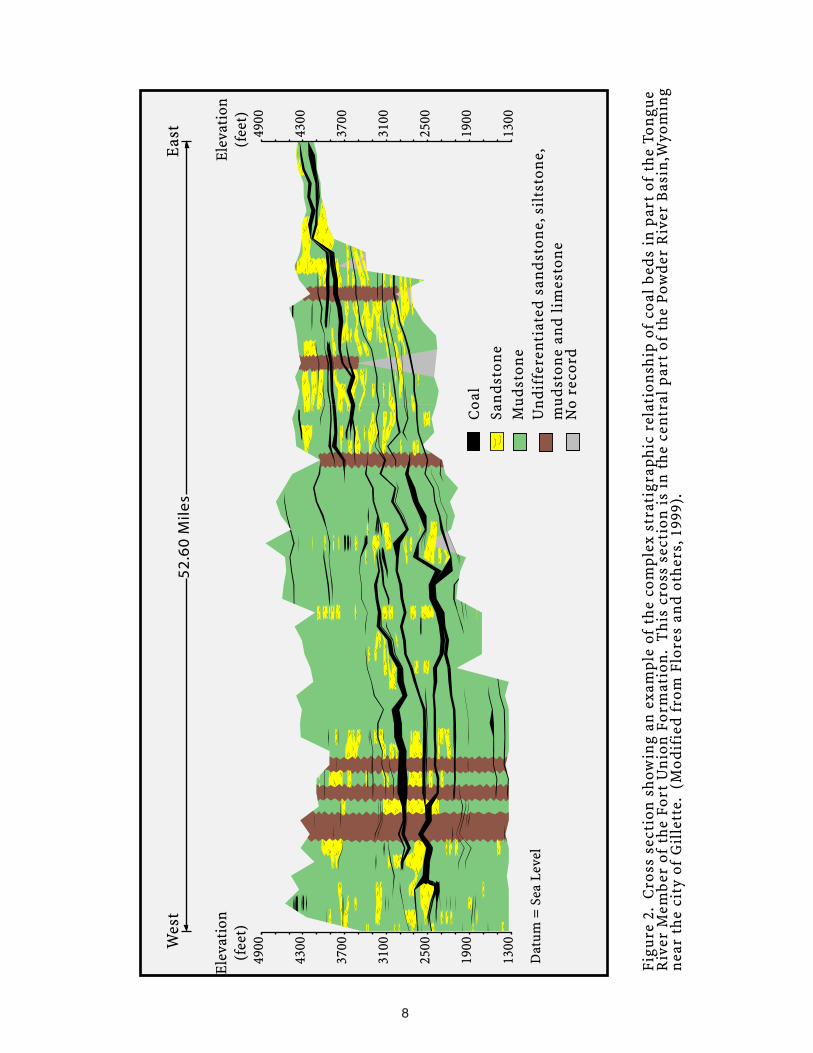
Figure 2. Cross section showing an example of the complex stratigraphic relationship ofcoal beds in part of the Tongue River Member of the Fort Union Formation.This cross section is in the central part of the Powder River Basin, Wyomingnear the city of Gillette. (Modified from Flores and others, 1999). .................. 8
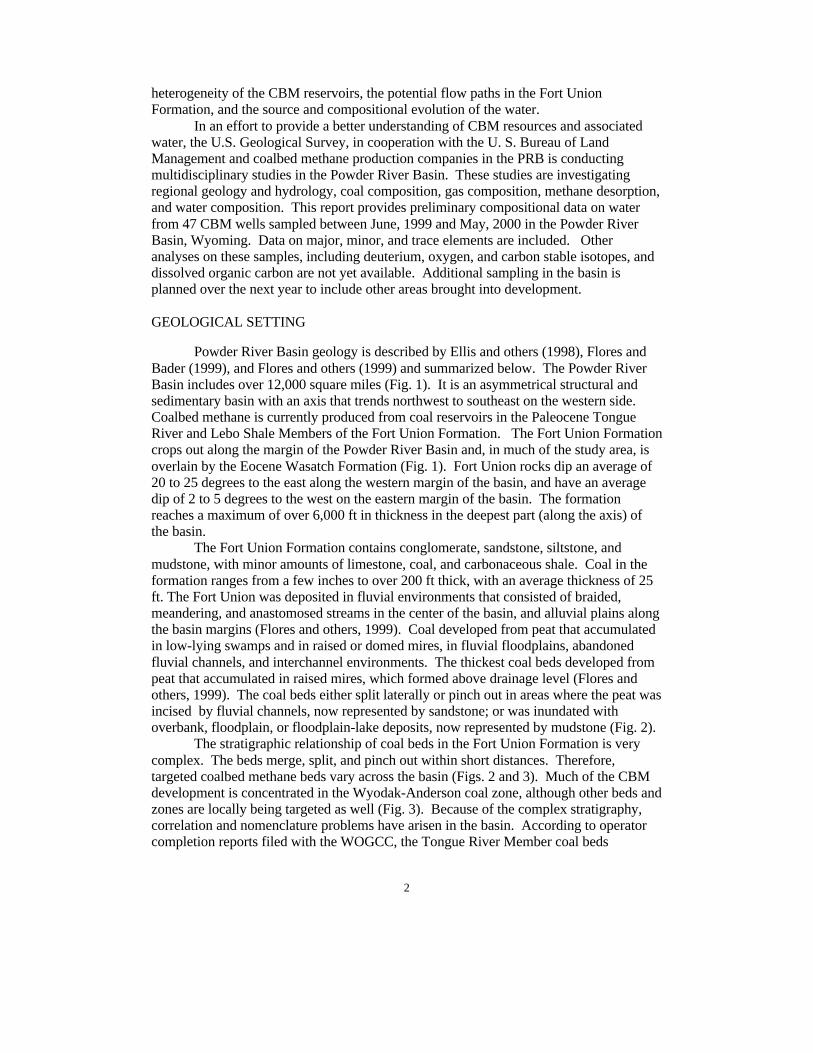
Figure 3. Composite stratigraphic column showing the Upper Cretaceous LanceFormation (part) and Tertiary Fort Union and Wasatch Formations in thePowder River Basin, Wyoming and Montana. Major coal beds and zones inthe Fort Union Formation are identified. Coal zones or beds targeted forcoalbed methane are bold. (Modified from Flores and Bader, 1999). .............. 9
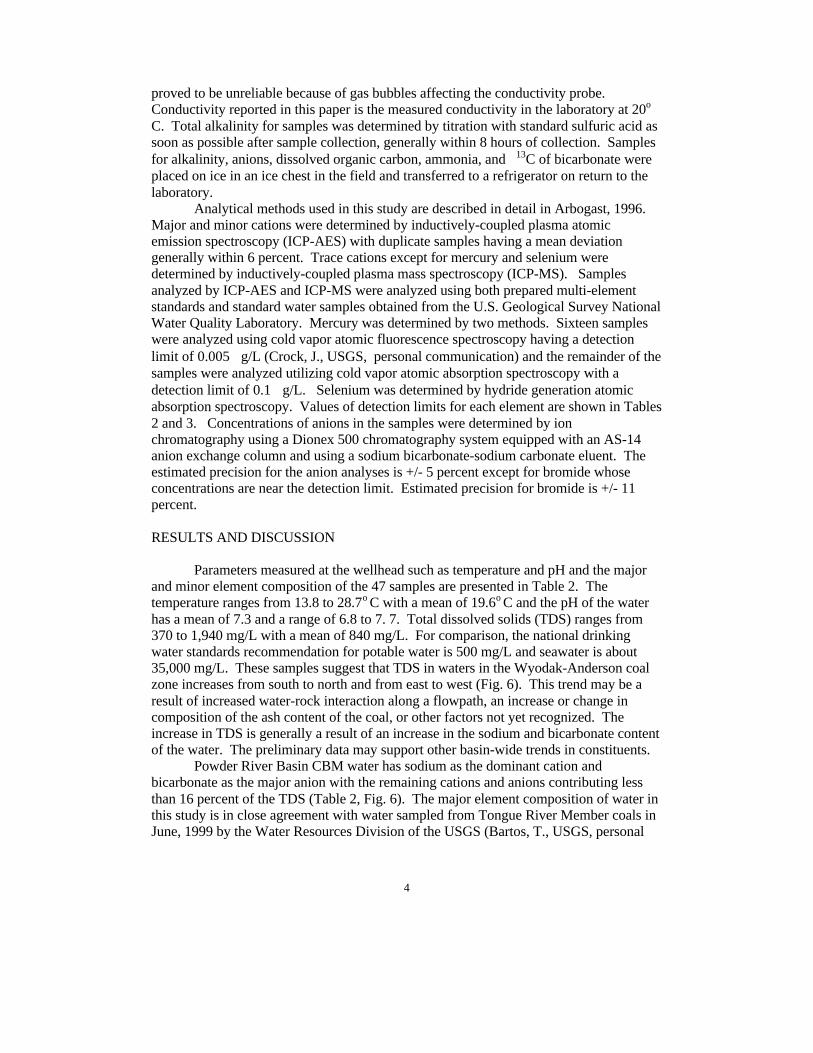
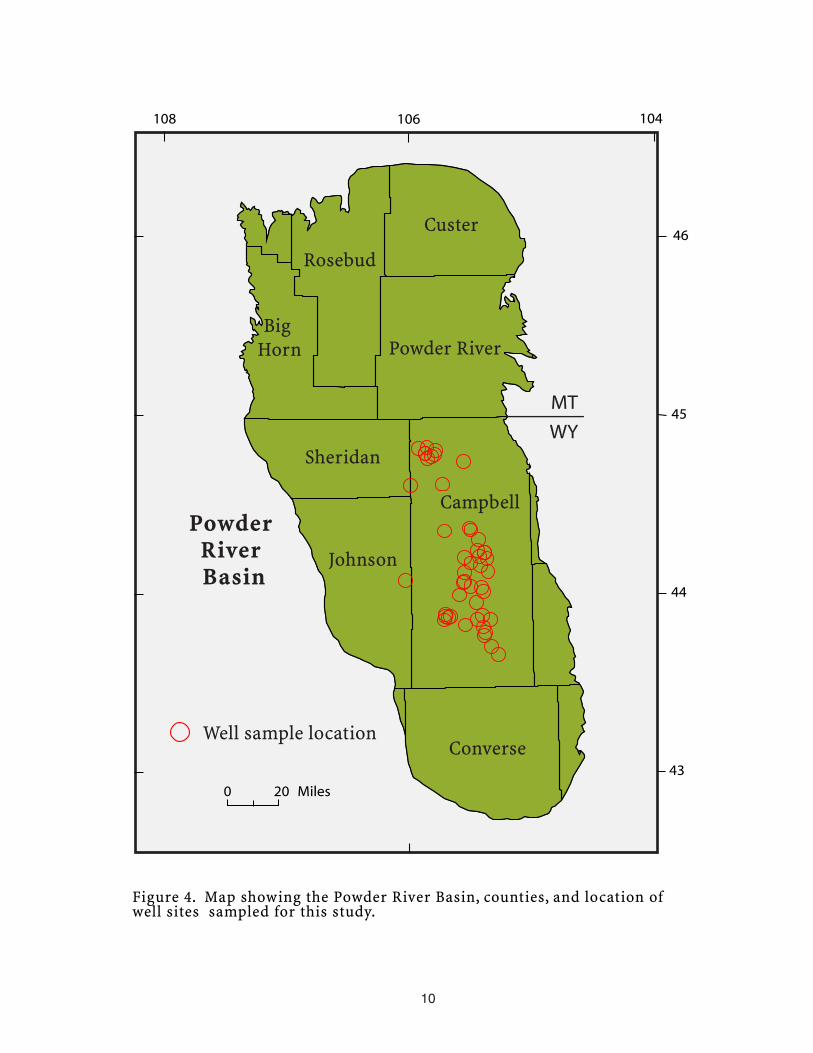
Figure 4. Map showing the Powder River Basin, counties, and location of well sitessampled for this study. ......................................................................................10
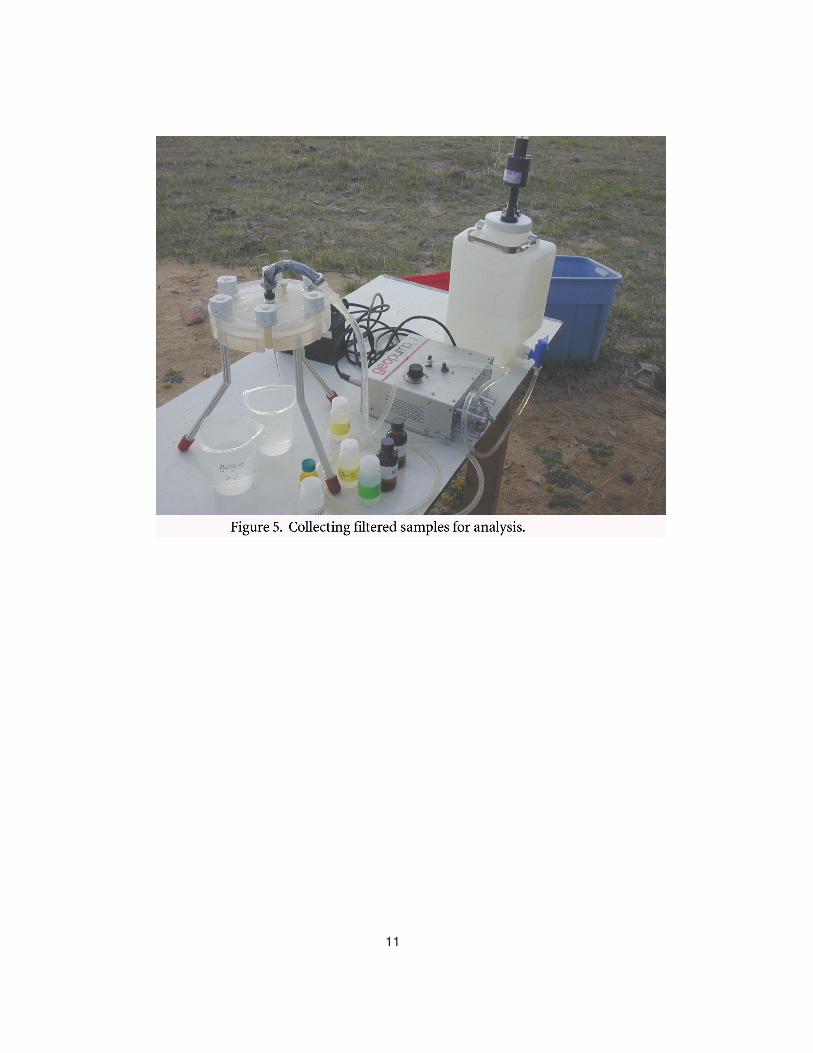
Figure 5. Collecting filtered samples for analysis. ...........................................................11Figure 6. Distribution of total dissolved solids in water co-produced with coalbed
methane from the Wyodak-Anderson coal zone. Composition of selectedsamples indicated by Stiff diagrams. ................................................................12
List of Tables
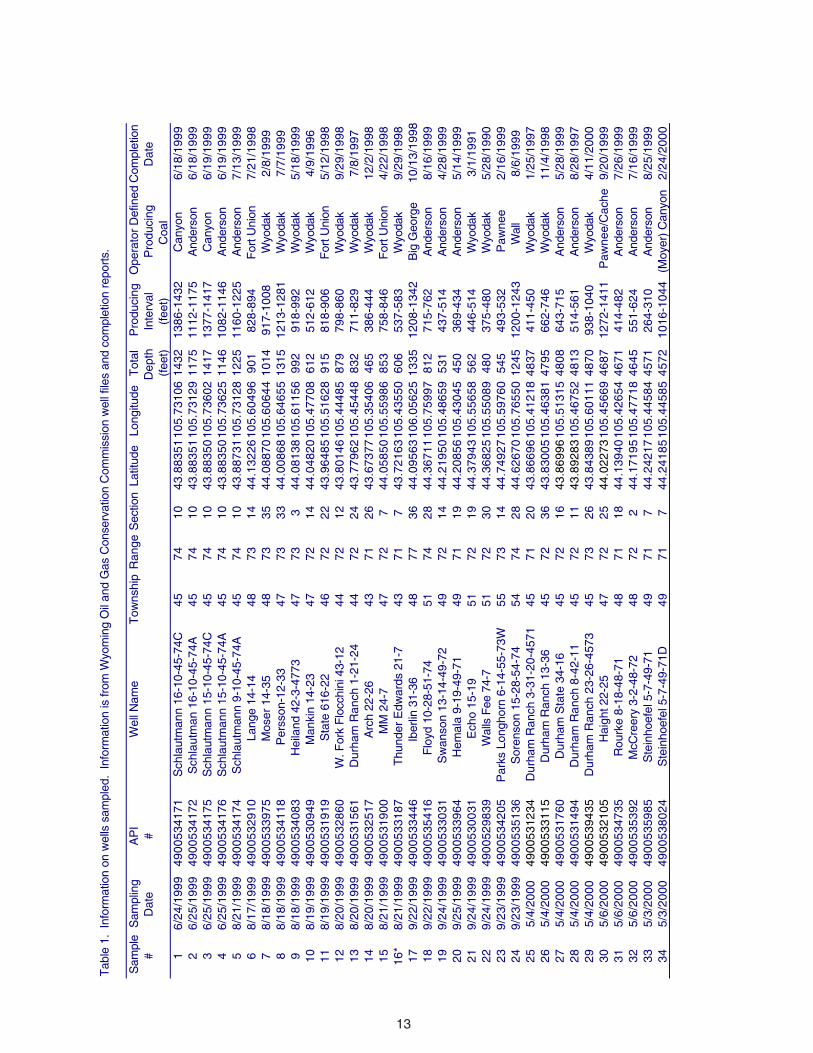
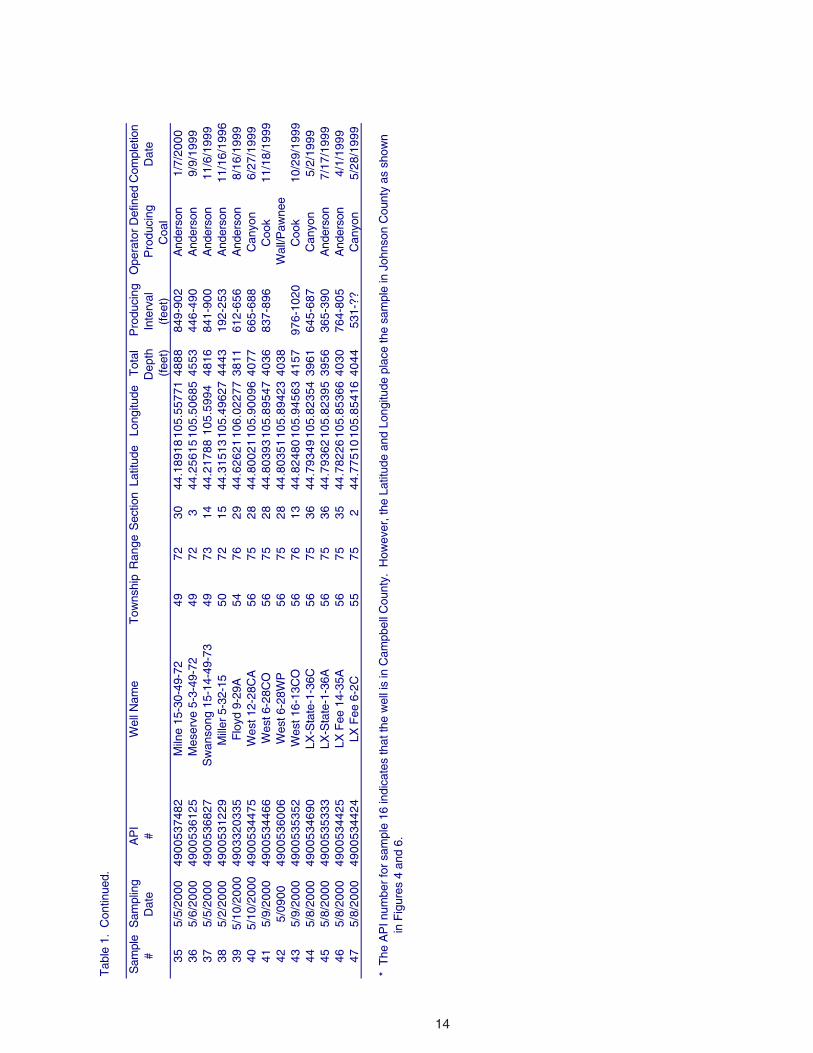
Table 1. Information on wells sampled. Information is from Wyoming Oil and GasConservation Commission well files and completion reports..........................13
Table 2. Measured parameters and major and minor element concentrations in watersproduced with coalbed methane from wells in the Powder River Basin,Wyoming. ..........................................................................................................15
Table 3. Trace element concentrations in water produced with coalbed methane fromwells in the Powder River Basin, Wyoming.....................................................17
1
Water co-produced with coalbed methane in the Powder River Basin, Wyoming:preliminary compositional data
C. A. Rice, M. S. Ellis, and J. H. Bullock, Jr.
INTRODUCTION
Production of water and natural gas from coal beds (coalbed methane, CBM) hasincreased dramatically over the past ten years and the gas currently accounts for about6% of the total produced in the United States. The Powder River Basin (PRB) inWyoming and Montana (Fig. 1) has emerged as one of the most active new areas of CBMproduction since 1997. Gas and water are being produced from thick coals in thePaleocene age Fort Union Formation primarily in the eastern part of the basin, althoughdevelopment is expanding to the northwest in the basin at the time of this report. Thenumber of producing wells has increased from 270 in March, 1997 to 2,469 as of March,2000 (Wyoming Oil and Gas Conservation Commission (WOGCC)). CBM productionin the same period has increased from 34,529 thousand cubic feet per day (mcf/day) toover 333,000 mcf/day (WOGCC, 2000). Estimates from State and federal officials andindustry representatives of the total number of wells expected in the basin over the next20-30 years vary from 15,000-70,000.
Water is also brought to the surface during production of coalbed methane. Thewater in coal beds contributes to pressure in the coal beds that keeps methane gasadsorbed to the coal. During production, this water is pumped to the ground surface tolower the pressure in the reservoir and stimulate desorption of methane from the coal. Aswith gas production, water production in the PRB has also increased in the three-yearperiod between 1997 and 2000 from about 130,000 barrels per day to over 1.28 millionbarrels per day (WOGCC, 2000), a ten-fold increase. As the number of CBM wellsincreases, the amount of water produced will also increase. Water production from aCBM well typically declines over the life of the well, and declining water production isanticipated and has been observed in CBM wells that have produced for several years.Decline in water production in developing areas of the basin and the basin as a whole isnot expected to occur until most of the CBM wells have been developed and produced fora number of years.
Reliable data on the composition of the water produced from the CBM wells areneeded so that State and federal land use managers can make informed decisions onhandling, disposal, and possible beneficial use of water produced with CBM. Previousstudies of water associated with coal beds in the PRB have focused on small areas nearsurface coal mines (Drever and others, 1977; Larson, 1988). Composition data ongroundwater in the Fort Union Formation presented previously (Larson and Daddow,1984) and other data acquired by the State of Wyoming Department of EnvironmentalQuality through the discharge permit process are not coal bed specific. The data mayrepresent co-mingled water from multiple coal beds and/or surface water or water fromstrata in the Fort Union Formation distinctly different from water produced from coal bedmethane wells. Compositional data for CBM water can provide information on the
2
heterogeneity of the CBM reservoirs, the potential flow paths in the Fort UnionFormation, and the source and compositional evolution of the water.
In an effort to provide a better understanding of CBM resources and associatedwater, the U.S. Geological Survey, in cooperation with the U. S. Bureau of LandManagement and coalbed methane production companies in the PRB is conductingmultidisciplinary studies in the Powder River Basin. These studies are investigatingregional geology and hydrology, coal composition, gas composition, methane desorption,and water composition. This report provides preliminary compositional data on waterfrom 47 CBM wells sampled between June, 1999 and May, 2000 in the Powder RiverBasin, Wyoming. Data on major, minor, and trace elements are included. Otheranalyses on these samples, including deuterium, oxygen, and carbon stable isotopes, anddissolved organic carbon are not yet available. Additional sampling in the basin isplanned over the next year to include other areas brought into development.
GEOLOGICAL SETTING
Powder River Basin geology is described by Ellis and others (1998), Flores andBader (1999), and Flores and others (1999) and summarized below. The Powder RiverBasin includes over 12,000 square miles (Fig. 1). It is an asymmetrical structural andsedimentary basin with an axis that trends northwest to southeast on the western side.Coalbed methane is currently produced from coal reservoirs in the Paleocene TongueRiver and Lebo Shale Members of the Fort Union Formation. The Fort Union Formationcrops out along the margin of the Powder River Basin and, in much of the study area, isoverlain by the Eocene Wasatch Formation (Fig. 1). Fort Union rocks dip an average of20 to 25 degrees to the east along the western margin of the basin, and have an averagedip of 2 to 5 degrees to the west on the eastern margin of the basin. The formationreaches a maximum of over 6,000 ft in thickness in the deepest part (along the axis) ofthe basin.
The Fort Union Formation contains conglomerate, sandstone, siltstone, andmudstone, with minor amounts of limestone, coal, and carbonaceous shale. Coal in theformation ranges from a few inches to over 200 ft thick, with an average thickness of 25ft. The Fort Union was deposited in fluvial environments that consisted of braided,meandering, and anastomosed streams in the center of the basin, and alluvial plains alongthe basin margins (Flores and others, 1999). Coal developed from peat that accumulatedin low-lying swamps and in raised or domed mires, in fluvial floodplains, abandonedfluvial channels, and interchannel environments. The thickest coal beds developed frompeat that accumulated in raised mires, which formed above drainage level (Flores andothers, 1999). The coal beds either split laterally or pinch out in areas where the peat wasincised by fluvial channels, now represented by sandstone; or was inundated withoverbank, floodplain, or floodplain-lake deposits, now represented by mudstone (Fig. 2).
The stratigraphic relationship of coal beds in the Fort Union Formation is verycomplex. The beds merge, split, and pinch out within short distances. Therefore,targeted coalbed methane beds vary across the basin (Figs. 2 and 3). Much of the CBMdevelopment is concentrated in the Wyodak-Anderson coal zone, although other beds andzones are locally being targeted as well (Fig. 3). Because of the complex stratigraphy,correlation and nomenclature problems have arisen in the basin. According to operatorcompletion reports filed with the WOGCC, the Tongue River Member coal beds

3
producing coalbed methane in the sampled wells include the Wyodak, Anderson,Canyon, Cook, Big George, Wall, and Pawnee. Two of the reservoirs, identified as theCache and Moyer, are in the Lebo Shale Member. Also, in the operator completionreports, if the name of the coal bed was not known, the operator designated the producingunit as Fort Union. In an effort to clarify some of the correlation and nomenclatureproblems, the U.S. Geological Survey is currently working with the U.S. Bureau of LandManagement and the WOGCC to standardize coalbed nomenclature (Flores, R.M.,personal communication).
METHODS
Wells were selected for water sampling according to the distribution and the ageof the wells. Sufficient time (minimum 1-2 weeks) past completion or workover isneeded to ensure that formation water uncontaminated by drilling and completion fluidsis sampled. Two wells per township were sampled to represent each producing coalseam. From June, 1999 through May, 2000, 47 wells were sampled for water (Fig. 4).Wells sampled, the date of sampling, and other pertinent information is listed in Table 1and was obtained from the WOGCC well files and drilling completion reports. Theproducing coal listed in Table 1 for each sample is the well operator’s designation (fromwell completion reports) and identification of coal seams or coal seam names may neitherbe consistent among operators nor consistent with nomenclature used by others.
Water samples were collected following guidelines of Lico and others (1988).Wells were allowed to flow through the tubing and fittings prior to collection of watersamples to ensure flushing of the sample ports and collection of a representative sample.Most wells were pumping nearly continuously so water in the well bore was constantlybeing replaced. Water was collected directly from the wellhead by attaching tygontubing to a port on the wellhead tee. The pressure on the port was generally less than 60psi. Both gas and water were expelled from the well, but the amount of gas expelled wasgenerally small relative to the amount of water. The water was allowed to collect in 5gallon buckets while flushing the well and into a clean, rinsed polyethylene carboy withspigot or directly to the filter setup during sampling. Clean sample bottles were rinsedwith well water at least twice prior to collection of a sample. For those analyses that didnot require filtering (total inorganic carbon, alkalinity, and conductivity) samples weretaken directly from the tygon tubing.
Water in the carboy was immediately filtered through a 0.1 µm polyethersulfonemembrane filter utilizing a peristaltic pump, tygon tubing, and an acrylic filter holder(Fig. 5). Polyethylene bottles for major, minor, and trace cation analyses were prewashedwith a mixture of 1.6 N nitric and 3.6 N sulfuric acid followed by a rinse with deionizedwater. Polyethylene bottles used for anions were prewashed with deionized water.Samples for major, minor, and trace cations, deuterium, oxygen, and carbon stableisotopes, and anions were collected from filtered water. The major, minor, and tracecation samples, except for mercury, were acidified with Ultrex nitric acid to a pH <2.Samples analyzed for mercury were collected in 30 mL glass bottles containing 1.5 mLof a sodium dichromate-ultrapure nitric acid mixture.
Temperature and pH were measured while the well flowed prior to collection ofsamples. The pH meter and electrode were calibrated using standard buffers before eachmeasurement. Conductivity of the water was measured at the well, but measurements
4
proved to be unreliable because of gas bubbles affecting the conductivity probe.Conductivity reported in this paper is the measured conductivity in the laboratory at 20o
C. Total alkalinity for samples was determined by titration with standard sulfuric acid assoon as possible after sample collection, generally within 8 hours of collection. Samplesfor alkalinity, anions, dissolved organic carbon, ammonia, and δ13C of bicarbonate wereplaced on ice in an ice chest in the field and transferred to a refrigerator on return to thelaboratory.
Analytical methods used in this study are described in detail in Arbogast, 1996.Major and minor cations were determined by inductively-coupled plasma atomicemission spectroscopy (ICP-AES) with duplicate samples having a mean deviationgenerally within 6 percent. Trace cations except for mercury and selenium weredetermined by inductively-coupled plasma mass spectroscopy (ICP-MS). Samplesanalyzed by ICP-AES and ICP-MS were analyzed using both prepared multi-elementstandards and standard water samples obtained from the U.S. Geological Survey NationalWater Quality Laboratory. Mercury was determined by two methods. Sixteen sampleswere analyzed using cold vapor atomic fluorescence spectroscopy having a detectionlimit of 0.005 µg/L (Crock, J., USGS, personal communication) and the remainder of thesamples were analyzed utilizing cold vapor atomic absorption spectroscopy with adetection limit of 0.1 µg/L. Selenium was determined by hydride generation atomicabsorption spectroscopy. Values of detection limits for each element are shown in Tables2 and 3. Concentrations of anions in the samples were determined by ionchromatography using a Dionex 500 chromatography system equipped with an AS-14anion exchange column and using a sodium bicarbonate-sodium carbonate eluent. Theestimated precision for the anion analyses is +/- 5 percent except for bromide whoseconcentrations are near the detection limit. Estimated precision for bromide is +/- 11percent.
RESULTS AND DISCUSSION
Parameters measured at the wellhead such as temperature and pH and the majorand minor element composition of the 47 samples are presented in Table 2. Thetemperature ranges from 13.8 to 28.7o C with a mean of 19.6o C and the pH of the waterhas a mean of 7.3 and a range of 6.8 to 7. 7. Total dissolved solids (TDS) ranges from370 to 1,940 mg/L with a mean of 840 mg/L. For comparison, the national drinkingwater standards recommendation for potable water is 500 mg/L and seawater is about35,000 mg/L. These samples suggest that TDS in waters in the Wyodak-Anderson coalzone increases from south to north and from east to west (Fig. 6). This trend may be aresult of increased water-rock interaction along a flowpath, an increase or change incomposition of the ash content of the coal, or other factors not yet recognized. Theincrease in TDS is generally a result of an increase in the sodium and bicarbonate contentof the water. The preliminary data may support other basin-wide trends in constituents.
Powder River Basin CBM water has sodium as the dominant cation andbicarbonate as the major anion with the remaining cations and anions contributing lessthan 16 percent of the TDS (Table 2, Fig. 6). The major element composition of water inthis study is in close agreement with water sampled from Tongue River Member coals inJune, 1999 by the Water Resources Division of the USGS (Bartos, T., USGS, personal

5
communication; Swanson and others, 1999). The data differ significantly from valuesreported in Larson and Daddow, 1984 for waters from the Fort Union Formation inCampbell County. In particular, many of the water analyses in Larson and Daddow havesulfate concentrations in the hundreds to thousands of mg/L, whereas sulfateconcentrations in waters from Tongue River Member coals collected in this study rangefrom <0.01 to 12 mg/L with a mean of 2.4 mg/L. As mentioned earlier, data from Larsonand Daddow may not represent water from specific coal beds or zones in the Fort UnionFormation.
Low values of sulfate in the CBM waters analyzed in this report are consistentwith water in contact with a coal reservoir that has undergone or is undergoingmethanogenesis. Sulfate concentrations in the CBM water have a direct influence on theamount of barium found in the water because barite (barium sulfate) generally controlsthe solubility of barium in most natural waters (Hem, 1992). Barium concentrations inthe water analyzed in this study are relatively high compared to most groundwaterbecause of the low sulfate concentrations. During coalification and methanogenesis,water in contact with the coals is anoxic and reducing. Elements such as iron andmanganese, which are soluble as reduced species (Fe2+ and Mn2+), have concentrationsthat are relatively high compared to surface water values as a result of the reducingenvironment. On contact with oxygen in the atmosphere at the surface, the dissolvedconcentrations of these elements may be expected to decrease significantly.
Trace element concentrations in water from the 47 CBM wells sampled in thisstudy are given in Table 3. Concentrations for most of the elements are at or belowdetection limits. All of the concentrations for elements in Table 3 are below themaximum contaminant level (MCL) given by the Environmental Protection Agency(EPA) in the Drinking Water Standards (EPA, 1996). No noticeable trends in traceelement concentrations are apparent.
ACKNOWLEDGMENTS
This study would not be possible without the cooperation of many of thecompanies and operators in the Powder River Basin who kindly gave permission tosample their coalbed methane wells and provided support in locating well sites andsometimes replumbing wellhead configurations. Thanks to Ocean Energy, BarrettResources, Pennaco Energy, CMS Energy, Hi-Pro Production, Western Gas Resources,and Big Basin Petroleum. Jim Crock of the U. S. Geological Survey Mineral ResourcesTeam kindly provided analyses of mercury in water samples by fluorescencespectroscopy.
REFERENCES
Arbogast, B. F., ed.,1996, Analytical methods manual for the Mineral Resources SurveysProgram, U. S. Geological Survey Open-File Report 96-525, 248 p.
Drever, J. I., Murphy, J. W., and Surdam, R. C., 1977, The distribution of As, Be, Cd, Cu,Hg, Mo, Pb, and U associated with the Wyodak coal seam, Powder River Basin,Wyoming: Contributions to Geology, University of Wyoming, Vol. 15, pp. 93-101.
6
Ellis, M.S., Stricker, G.D., Flores, R.M., and Bader, L.R., 1998, Sulfur and ash inPaleocene Wyodak-Anderson coal in the Powder River Basin, Wyoming andMontana: A non-sequitur to externalities beyond 2000: Proceedings of the 23rd
International Technical Conference on Coal Utilization, Clearwater, FL, March 9-13, 1998.
Flores, R.M. and Bader, L.R., 1999, Fort Union coal in the Powder River Basin,Wyoming and Montana: A synthesis: U.S. Geological Survey Professional Paper1625-A, Chapter PS, 49 p., on CD-ROM.
Flores, R.M., Ochs, A.M., Bader, L.R., Johnson, R.C., and Vogler, Daniel, 1999,Framework geology of the Fort Union coal in the Powder River Basin: U.S.Geological Survey Professional Paper 1625-A, Chapter PF, 17 p., on CD-ROM.
Hem, J. D., 1992, Study and interpretation of the chemical characteristics of naturalwater: U. S. Geological Survey Water Supply Paper 2254, 263 p.
Larson, L. R., 1988, Coal-spoil and ground-water chemical data from two coal mines;Hanna Basin and Powder River Basin, Wyoming: U.S. Geological Survey Open-file report 88-481, 18 p.
Larson, L. R. and Daddow, R. L., 1984, Ground-water-quality data from the PowderRiver structural basin and adjacent areas, northeastern Wyoming: U.S.Geological Survey Open-file report 83-939, 56 p.
Lico, M. S., Kharaka, Y. K., Carothers, W. W., and Wright, V. A., 1988, Methods forcollection and analysis of geopressured geothermal and oil field waters:Geological Survey Water Supply Paper 2194, 21 p.
Swanson, R. B., Mason, J. P., and Miller, D. T., eds., 1999, Water Resources Data,Wyoming, Water Year 1999, Volume 2, Groundwater: U. S. Geological SurveyWater-Data Report WY-99-2, 125 p.
Wyoming Oil and Gas Conservation Commission (WOGCC), 2000, On-line databaseaccessible at http://wogcc.state.wy.us.
43
Powder RiverBasin
o
44o
46o
45o
106o108 o 104 o
Sheridan
Johnson
Campbell
Converse
Big HornMT
WY
Cook
Washaki
NiobraraNatrona
Powder River
Rosebud
Weston
Custer
Carter
Fallon
Musselshell
Treasure
Miles
Tftl
Tft
Tft
Tftr
Tfu
Tw
Tw
Qal
Twr
0 20 Miles
Tertiary Wasatch FormationTertiary Tongue River Member of the Fort Union FormationTertiary Tongue River and Lebo Shale Members of the Fort Union Formationundifferentiated
Tertiary Tullock Memberof the Fort Union FormationUndifferentiatedFort Union Formation
Twr
Tftl
Tft
Tftr
Tfu
Tw
Quaternary alluvium
Tertiary White River Formation
Qal
Approximate extent of the study areaBasin axis
Cross section location
Glenrock
Sheridan
Buffalo
Kaycee
Gillette
Figure 1. Generalized geologic map of the Powder River Basin,Wyoming and Montana showing the basin axis, counties, major cities, location of cross section (fig. 2), and approximate extent of the study area (modified from Flores and Bader, 1999).
7
Coa
lSa
nds
ton
eM
udst
one
Un
diff
eren
tiat
ed s
ands
ton
e, s
ilts
ton
e,m
udst
one
and
lim
esto
ne
No
reco
rd
Wes
tEa
st5
2.6
0 M
iles
Elev
atio
n(f
eet)
3700
3100
2500
1900
1300
4900
4300
Elev
atio
n(f
eet)
3700
3100
2500
1900
1300
4900
4300
Dat
um =
Sea
Lev
el
Figu
re 2
. C
ross
sec
tion
sho
win
g an
exa
mpl
e of
the
com
plex
str
atig
raph
ic r
elat
ions
hip
of c
oal b
eds
in p
art
of t
he T
ongu
e R
iver
Mem
ber
of t
he F
ort
Un
ion
For
mat
ion
. T
his
cros
s se
ctio
n i
s in
the
cen
tral
par
t of
the
Pow
der
Riv
er B
asin
,Wyo
min
g n
ear
the
city
of
Gil
lett
e. (
Mod
ifie
d fr
om F
lore
s an
d ot
hers
, 199
9).
8

Conglomerate
Sandstone
Sandstone, siltstone,mudstone, and limestoneCoal and carbonaceousshale
0 0
1000feet
300meters
EoceneWasatch
Formation
Pale
ocen
e
Fort
Un
ion
For
mat
ion
Ton
gue
Riv
er
Mem
ber
Lebo
Sha
le
Mem
ber
Tull
ock
Mem
ber
Upper Cretaceous Lance Formation
(part)
Wyodak-Andersoncoal zone
Knoblochcoal zone
Sawyer coal
Wall coalPawnee coal
Terret coalBroadus coal
Rosebud coal zoneBrewster-Arnold coal
Burley coal
Smith (Swartz) coalAnderson (Dietz 1, 2, & 3, Big George, Sussex) coalCanyon (Monarch) coalWerner (Cook) coal
Knobloch coalCalvert coalNance coalFlowers-Goodale coal
Sawyer coalLay Creek coalKing coal
Moyer coalCache coal
}
}}
- OR -
Figure 3. Composite stratigraphic column showing the Upper Cretaceous Lance Formation (part), and Tertiary Fort Union and Wasatch Formations in the Powder River Basin, Wyomingand Montana. Major coal beds and zones in the Fort Union Formation are identified. Coal zones or beds targeted for coalbed methane are bold. (Modified from Flores and Bader, 1999)
9
43
44
46
45
106108 104
0 20 Miles
Figure 4. Map showing the Powder River Basin, counties, and location of well sites sampled for this study.
Powder River Basin
MT
WY
Well sample location
Johnson
Campbell
Converse
Sheridan
Powder River
Custer
Rosebud
Big Horn
10
11

Figure 6. Distribution of total dissolved solids in water co-produced with coalbed methane from the Wyodak-Anderson coal zone. Composition of selected samples indicated by Stiff diagrams.
Johnson
0 50
MilesTotal Dissolved Solids
MTWY
Campbell
Converse
Sheridan
Powder River
CusterRosebud
Big Horn
mg/L
370-500
501-10001001-1500
1501-2010
Na + KCaMg
40 20 0 20 40
ClHCO3SO4
Na + KCaMg
40 20 0 20 40
ClHCO3SO4
Na + KCaMg
40 20 0 20 40
ClHCO3SO4
Na + KCaMg
40 20 0 20 40
ClHCO3SO4
Cationsmeq/L
Anions
Na + KCaMg
40 20 0 20 40
ClHCO3SO4
Na + KCaMg
40 20 0 20 40
ClHCO3SO4
Na + KCaMg
40 20 0 20 40
ClHCO3SO4
Na + KCaMg
40 20 0 20 40
ClHCO3SO4
Cationsmeq/L
Anions
Sample 2
Sample 10
Sample 16
Sample 17
Sample 27
Sample 39Sample 45
Sample 21
12
Tab
le 1
. In
form
atio
n on
wel
ls s
ampl
ed.
Info
rmat
ion
is fr
om W
yom
ing
Oil
and
Gas
Con
serv
atio
n C
omm
issi
on w
ell f
iles
and
com
plet
ion
repo
rts.
Sam
ple
Sam
plin
gA
PI
Wel
l Nam
eT
owns
hip
Ran
geS
ectio
nLa
titud
eLo
ngitu
deT
otal
Pro
duci
ngO
pera
tor
Def
ined
Com
plet
ion
#D
ate
#D
epth
In
terv
alP
rodu
cing
Dat
e(f
eet)
(fee
t)C
oal
1
6/24
/199
949
0053
4171
Sch
laut
man
n 16
-10-
45-7
4C45
7410
43.8
8351
105.
7310
614
3213
86-1
432
Can
yon
6/18
/199
92
6/25
/199
949
0053
4172
Sch
laut
man
16-
10-4
5-74
A45
7410
43.8
8351
105.
7312
911
7511
12-1
175
And
erso
n6/
18/1
999
36/
25/1
999
4900
5341
75S
chla
utm
ann
15-1
0-45
-74C
4574
1043
.883
5010
5.73
602
1417
1377
-141
7C
anyo
n6/
19/1
999
46/
25/1
999
4900
5341
76S
chla
utm
ann
15-1
0-45
-74A
4574
1043
.883
5010
5.73
625
1146
1082
-114
6A
nder
son
6/19
/199
95
8/21
/199
949
0053
4174
Sch
laut
man
n 9-
10-4
5-74
A45
7410
43.8
8731
105.
7312
812
2511
60-1
225
And
erso
n7/
13/1
999
68/
17/1
999
4900
5329
10La
nge
14-1
448
7314
44.1
3226
105.
6049
690
182
8-89
4F
ort U
nion
7/21
/199
87
8/18
/199
949
0053
3975
Mos
er 1
4-35
4873
3544
.088
7010
5.60
644
1014
917-
1008
Wyo
dak
2/8/
1999
88/
18/1
999
4900
5341
18P
erss
on-1
2-33
4773
3344
.008
6810
5.64
655
1315
1213
-128
1W
yoda
k7/
7/19
999
8/18
/199
949
0053
4083
Hei
land
42-
3-47
7347
733
44.0
8138
105.
6115
699
291
8-99
2W
yoda
k5/
18/1
999
108/
19/1
999
4900
5309
49M
anki
n 14
-23
4772
1444
.048
2010
5.47
708
612
512-
612
Wyo
dak
4/9/
1996
118/
19/1
999
4900
5319
19S
tate
616
-22
4672
2243
.964
8510
5.51
628
915
818-
906
For
t Uni
on5/
12/1
998
128/
20/1
999
4900
5328
60W
. For
k F
locc
hini
43-
1244
7212
43.8
0146
105.
4448
587
979
8-86
0W
yoda
k9/
29/1
998
138/
20/1
999
4900
5315
61D
urha
m R
anch
1-2
1-24
4472
2443
.779
6210
5.45
448
832
711-
829
Wyo
dak
7/8/
1997
148/
20/1
999
4900
5325
17A
rch
22-2
643
7126
43.6
7377
105.
3540
646
538
6-44
4W
yoda
k12
/2/1
998
158/
21/1
999
4900
5319
00M
M 2
4-7
4772
744
.058
5010
5.55
986
853
758-
846
For
t Uni
on4/
22/1
998
16*
8/21
/199
949
0053
3187
Thu
nder
Edw
ards
21-
743
717
43.7
2163
105.
4355
060
653
7-58
3W
yoda
k9/
29/1
998
179/
22/1
999
4900
5334
46Ib
erlin
31-
3648
7736
44.0
9563
106.
0562
513
3512
08-1
342
Big
Geo
rge
10/1
3/19
9818
9/22
/199
949
0053
5416
Flo
yd 1
0-28
-51-
7451
7428
44.3
6711
105.
7599
781
271
5-76
2A
nder
son
8/16
/199
919
9/24
/199
949
0053
3031
Sw
anso
n 13
-14-
49-7
249
7214
44.2
1950
105.
4865
953
143
7-51
4A
nder
son
4/28
/199
920
9/25
/199
949
0053
3964
Hem
ala
9-19
-49-
7149
7119
44.2
0856
105.
4304
545
036
9-43
4A
nder
son
5/14
/199
921
9/24
/199
949
0053
0031
Ech
o 15
-19
5172
1944
.379
4310
5.55
658
562
446-
514
Wyo
dak
3/1/
1991
229/
24/1
999
4900
5298
39W
alls
Fee
74-
751
7230
44.3
6825
105.
5508
948
037
5-48
0W
yoda
k5/
28/1
990
239/
23/1
999
4900
5342
05P
arks
Lon
ghor
n 6-
14-5
5-73
W55
7314
44.7
4927
105.
5976
054
549
3-53
2P
awne
e2/
16/1
999
249/
23/1
999
4900
5351
36S
oren
son
15-2
8-54
-74
5474
2844
.626
7010
5.76
550
1245
1200
-124
3W
all
8/6/
1999
255/
4/20
0049
0053
1234
Dur
ham
Ran
ch 3
-31-
20-4
571
4571
2043
.866
9610
5.41
218
4837
411-
450
Wyo
dak
1/25
/199
726
5/4/
2000
4900
5331
15D
urha
m R
anch
13-
3645
7236
43.8
3005
105.
4638
147
9566
2-74
6W
yoda
k11
/4/1
998
275/
4/20
0049
0053
1760
Dur
ham
Sta
te 3
4-16
4572
1643
.869
9610
5.51
315
4808
643-
715
And
erso
n5/
28/1
999
285/
4/20
0049
0053
1494
Dur
ham
Ran
ch 8
-42-
1145
7211
43.8
9283
105.
4675
248
1351
4-56
1A
nder
son
8/28
/199
729
5/4/
2000
4900
5394
35D
urha
m R
anch
23-
26-4
573
4573
2643
.843
8910
5.60
111
4870
938-
1040
Wyo
dak
4/11
/200
030
5/6/
2000
4900
5321
05H
aigh
t 22-
2547
7225
44.0
2273
105.
4566
946
8712
72-1
411
Paw
nee/
Cac
he9/
20/1
999
315/
6/20
0049
0053
4735
Rou
rke
8-18
-48-
7148
7118
44.1
3940
105.
4265
446
7141
4-48
2A
nder
son
7/26
/199
932
5/6/
2000
4900
5353
92M
cCre
ery
3-2-
48-7
248
722
44.1
7195
105.
4771
846
4555
1-62
4A
nder
son
7/16
/199
933
5/3/
2000
4900
5359
85S
tein
hoef
el 5
-7-4
9-71
4971
744
.242
1710
5.44
584
4571
264-
310
And
erso
n8/
25/1
999
345/
3/20
0049
0053
8024
Ste
inho
efel
5-7
-49-
71D
4971
744
.241
8510
5.44
585
4572
1016
-104
4(M
oyer
) C
anyo
n2/
24/2
000
13
Tab
le 1
. C
ontin
ued.
Sam
ple
Sam
plin
gA
PI
Wel
l Nam
eT
owns
hip
Ran
geS
ectio
nLa
titud
eLo
ngitu
deT
otal
Pro
duci
ngO
pera
tor
Def
ined
Com
plet
ion
#D
ate
#D
epth
In
terv
alP
rodu
cing
Dat
e(f
eet)
(fee
t)C
oal
35
5/5/
2000
4900
5374
82M
ilne
15-3
0-49
-72
4972
3044
.189
1810
5.55
771
4888
849-
902
And
erso
n1/
7/20
0036
5/6/
2000
4900
5361
25M
eser
ve 5
-3-4
9-72
4972
344
.256
1510
5.50
685
4553
446-
490
And
erso
n9/
9/19
9937
5/5/
2000
4900
5368
27S
wan
song
15-
14-4
9-73
4973
1444
.217
8810
5.59
9448
1684
1-90
0A
nder
son
11/6
/199
938
5/2/
2000
4900
5312
29M
iller
5-3
2-15
5072
1544
.315
1310
5.49
627
4443
192-
253
And
erso
n11
/16/
1996
395/
10/2
000
4903
3203
35F
loyd
9-2
9A54
7629
44.6
2621
106.
0227
738
1161
2-65
6A
nder
son
8/16
/199
940
5/10
/200
049
0053
4475
Wes
t 12-
28C
A56
7528
44.8
0021
105.
9009
640
7766
5-68
8C
anyo
n6/
27/1
999
415/
9/20
0049
0053
4466
Wes
t 6-2
8CO
5675
2844
.803
9310
5.89
547
4036
837-
896
Coo
k11
/18/
1999
425/
0900
4900
5360
06W
est 6
-28W
P56
7528
44.8
0351
105.
8942
340
38W
all/P
awne
e43
5/9/
2000
4900
5353
52W
est 1
6-13
CO
5676
1344
.824
8010
5.94
563
4157
976-
1020
Coo
k10
/29/
1999
445/
8/20
0049
0053
4690
LX-S
tate
-1-3
6C56
7536
44.7
9349
105.
8235
439
6164
5-68
7C
anyo
n5/
2/19
9945
5/8/
2000
4900
5353
33LX
-Sta
te-1
-36A
5675
3644
.793
6210
5.82
395
3956
365-
390
And
erso
n7/
17/1
999
465/
8/20
0049
0053
4425
LX F
ee 1
4-35
A56
7535
44.7
8226
105.
8536
640
3076
4-80
5A
nder
son
4/1/
1999
475/
8/20
0049
0053
4424
LX F
ee 6
-2C
5575
244
.775
1010
5.85
416
4044
531-
??C
anyo
n5/
28/1
999
* T
he A
PI n
umbe
r fo
r sa
mpl
e 16
indi
cate
s th
at th
e w
ell i
s in
Cam
pbel
l Cou
nty.
How
ever
, the
Lat
itude
and
Lon
gitu
de p
lace
the
sam
ple
in J
ohns
on C
ount
y as
sho
wn
in F
igur
es 4
and
6.
14

Tabl
e 2.
Mea
sure
d pa
ram
eter
s an
d m
ajor
and
min
or e
lem
ent c
once
ntra
tions
in w
ater
s pr
oduc
ed w
ith c
oalb
ed m
etha
ne fr
om w
ells
in
the
Pow
der R
iver
Bas
in, W
Y.
Alk
alin
ity is
repo
rted
as m
g/L
HC
O3- .
Tota
l dis
solv
ed s
olid
s (T
DS)
is c
alcu
late
d as
sum
ing
appr
oxim
atel
y
half
of th
e bi
carb
onat
e is
lost
on
evap
orat
ion
(Hem
, 199
2).
Con
duct
ivity
mea
sure
d in
lab
at 2
0.0
o C.
Tem
p=te
mpe
ratu
re; C
ond=
Con
duct
ivity
; N
D=n
ot d
eter
min
ed; S
AR
=Sod
ium
Ads
orpt
ion
Rat
io; µ
S/cm
=mic
rosi
emen
s pe
r cen
timet
er; m
g/L=
mill
igra
m p
er li
ter;
<=de
tect
ion
limit.
Sam
ple
Tem
pC
ond
TD
SF
Cl
SO4
Br
Alk
alin
ityN
H4+
Ca
KM
gN
aB
aFe
SiSr
SAR
#pH
o CµS
/cm
mg/
Lm
g/L
mg/
Lm
g/L
mg/
Lm
g/L
mg/
Lm
g/L
mg/
Lm
g/L
mg/
Lm
g/L
mg/
Lm
g/L
mg/
L1
7.3
25.3
1280
900
0.77
9.2
120.
1410
001.
552
6.9
1630
00.
590.
755.
31.
09.
32
7.3
22.1
1640
1050
0.55
648.
40.
8011
002.
049
5.9
1835
00.
790.
524.
41.
611
37.
325
.711
3073
00.
637.
83.
40.
0784
01.
539
4.7
9.0
240
0.42
1.0
5.1
0.82
9.0
47.
323
.016
4011
200.
5060
1.5
0.85
1170
1.9
565.
918
390
0.80
1.1
4.6
1.8
125
7.4
21.7
1480
970
0.61
485.
10.
6810
202.
038
6.1
1834
00.
801.
24.
71.
211
67.
021
.212
8084
00.
809.
5<0
.01
0.08
950
3.1
4214
2527
01.
30.
794.
60.
958.
17
7.0
21.9
1040
660
0.68
8.6
<0.0
10.
0976
03.
234
1218
210
0.67
4.9
4.8
0.71
7.3
87.
124
.810
8070
01.
09.
40.
890.
0880
02.
341
9.2
1523
00.
623.
85.
20.
857.
89
7.2
23.6
1090
710
1.3
141.
90.
0880
02.
937
1224
220
0.83
0.66
5.1
0.75
7.0
107.
218
.884
053
01.
112
<0.0
10.
0960
01.
926
7.2
1217
00.
450.
294.
20.
527.
011
6.9
21.2
860
550
1.7
11<0
.01
0.10
610
2.0
2610
1617
00.
550.
554.
90.
526.
512
7.1
19.4
770
480
0.99
100.
750.
1755
02.
127
7.0
1115
00.
521.
74.
40.
566.
113
7.0
19.8
650
400
1.3
9.9
<0.0
10.
0846
01.
820
5.8
8.2
130
0.32
0.70
4.5
0.38
6.2
147.
115
.964
039
01.
66.
30.
730.
0444
02.
419
7.3
9.8
130
0.37
2.4
4.3
0.35
6.0
156.
921
.499
062
01.
19.
00.
730.
0768
02.
533
1119
200
0.71
0.42
4.7
0.65
6.9
167.
117
.777
047
01.
610
170.
0949
02.
432
5.9
1315
00.
230.
585.
30.
565.
717
7.6
11.7
3020
2010
ND
16<0
.01
0.11
2320
4.8
9.1
1828
780
0.69
2.8
7.1
0.84
2918
7.5
24.8
860
540
0.77
120.
780.
1058
01.
114
3.9
4.9
220
0.24
0.02
5.8
0.25
1319
7.4
15.3
1090
780
1.2
8.9
8.6
0.08
890
2.5
448.
621
240
0.62
0.12
3.9
0.85
7.4
207.
217
.110
1062
01.
110
4.0
0.08
690
2.1
366.
314
200
0.55
0.15
3.8
0.66
7.1
217.
017
.816
6012
600.
608.
90.
810.
0715
205.
369
1546
360
1.4
0.82
4.8
1.9
8.2
226.
816
.115
4099
01.
08.
90.
810.
0811
304.
057
1336
300
0.95
0.71
4.2
1.3
7.7
237.
615
.612
5080
00.
7110
3.0
0.08
880
2.3
308.
114
290
0.47
0.42
3.7
0.45
1124
7.3
26.5
1610
1060
0.50
121.
30.
0712
203.
450
1422
350
1.6
0.55
5.6
0.92
10.4
257.
314
.910
6066
00.
8312
<0.0
10.
0472
02.
050
9.6
1820
00.
970.
634.
31.
06.
326
7.1
18.6
650
390
1.2
9.2
0.82
0.05
420
1.7
197.
39.
513
00.
380.
264.
50.
406.
127
7.2
19.3
780
510
0.67
170.
030.
0957
01.
423
6.3
1117
00.
470.
304.
80.
527.
328
7.3
16.4
630
410
1.1
120.
010.
0945
01.
117
6.1
8.7
140
0.34
0.17
4.9
0.40
6.9

Tabl
e 2.
Con
tinue
d.
Sam
ple
Tem
pC
ond
TD
SF
Cl
SO4
Br
Alk
alin
ityN
H4+
Ca
KM
gN
aB
aFe
SiSr
SAR
#pH
o Cm
S/cm
mg/
Lm
g/L
mg/
Lm
g/L
mg/
Lm
g/L
mg/
Lm
g/L
mg/
Lm
g/L
mg/
Lm
g/L
mg/
Lm
g/L
mg/
L29
7.0
22.1
1200
810
0.88
7.1
1.8
0.02
930
2.5
598.
019
250
0.77
0.84
5.1
1.2
7.1
307.
428
.747
027
01.
45.
40.
040.
0329
01.
15.
93.
81.
611
00.
140.
305.
80.
1010
.331
7.2
15.8
660
420
1.2
9.4
2.9
0.05
460
1.4
185.
97.
815
00.
330.
284.
20.
367.
332
7.1
15.9
750
460
1.0
7.9
1.1
0.03
500
1.3
185.
18.
217
00.
260.
364.
10.
328.
333
7.3
13.8
1230
850
0.91
9.8
2.4
0.08
980
2.7
459.
021
270
0.76
0.39
4.1
0.99
8.3
347.
521
.757
037
00.
985.
20.
220.
0243
01.
210
5.1
4.0
130
0.19
0.91
5.2
0.17
8.8
357.
118
.213
0080
00.
799.
00.
060.
0490
02.
546
1122
260
0.86
0.79
4.6
0.94
8.0
367.
314
.510
8077
00.
9611
0.07
0.05
850
2.7
449.
724
250
0.66
0.36
3.9
0.95
7.6
377.
222
.414
3094
00.
8011
0.83
0.05
1090
2.6
4314
2530
00.
870.
344.
80.
959.
138
7.4
13.9
1070
720
0.99
9.5
0.08
0.06
810
2.1
328.
418
240
0.52
0.27
4.1
0.70
8.4
397.
718
.418
5012
400.
5111
0.12
0.06
1380
2.0
196.
68.
650
00.
350.
204.
70.
3824
407.
619
.323
2015
500.
477.
70.
92<0
.02
1760
2.3
277.
018
610
0.59
0.81
4.8
0.42
2241
7.6
20.1
1860
1270
0.48
138.
10.
0714
102.
620
7.3
1251
00.
470.
805.
20.
3022
427.
523
.722
6015
501.
418
0.07
0.09
1740
2.9
158.
48.
763
00.
580.
265.
60.
2732
437.
520
.428
1020
001.
014
0.16
0.07
2260
3.4
2411
1580
00.
750.
555.
10.
3332
447.
418
.715
8010
500.
6411
0.16
0.06
1160
2.3
156.
28.
243
00.
370.
284.
70.
2622
457.
615
.720
5013
900.
426.
41.
9<0
.02
1570
2.4
357.
519
530
0.62
0.32
4.6
0.69
1846
7.4
20.5
2380
1600
0.85
6.7
1.6
<0.0
218
102.
426
7.7
1964
00.
730.
194.
70.
5323
477.
621
.020
8013
200.
5613
1.2
0.05
1440
3.1
198.
314
540
0.54
0.03
5.1
0.29
23
Mea
n7.
319
.613
0085
00.
9213
2.4
0.12
950
2.4
328.
416
300
0.62
0.8
4.8
0.70
12
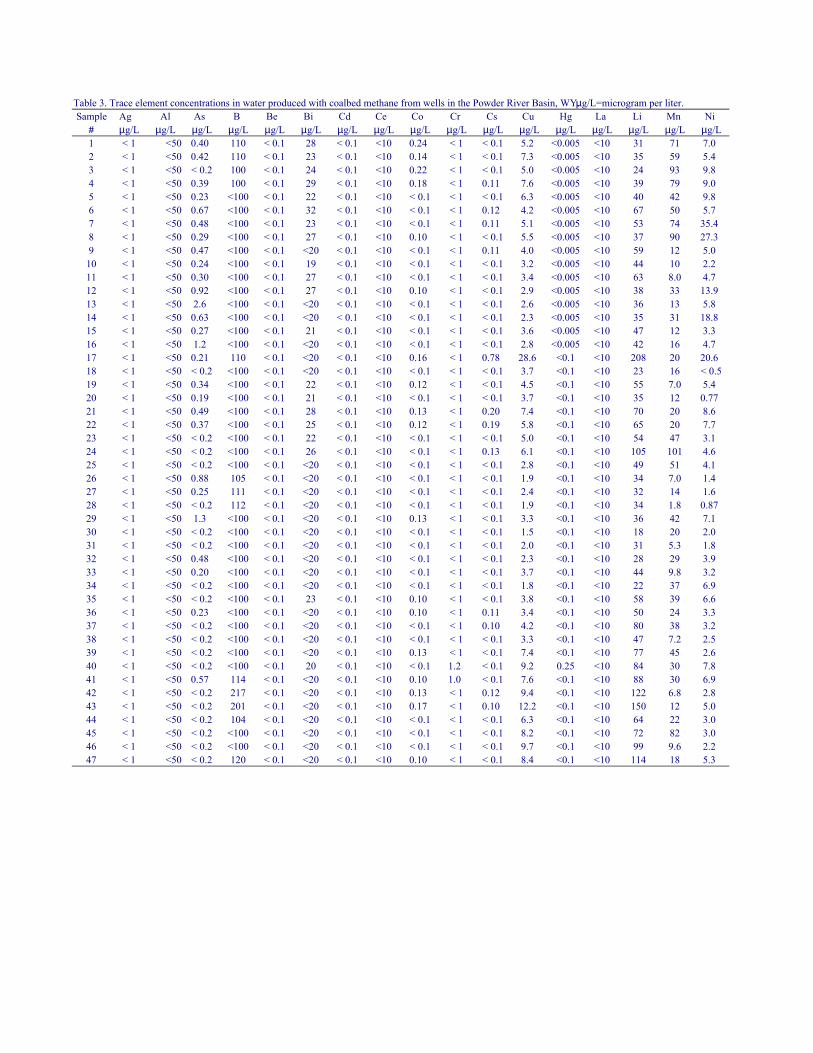
Table 3. Trace element concentrations in water produced with coalbed methane from wells in the Powder River Basin, WY. µg/L=microgram per liter.Sample Ag Al As B Be Bi Cd Ce Co Cr Cs Cu Hg La Li Mn Ni # µg/L µg/L µg/L µg/L µg/L µg/L µg/L µg/L µg/L µg/L µg/L µg/L µg/L µg/L µg/L µg/L µg/L1 < 1 <50 0.40 110 < 0.1 28 < 0.1 <10 0.24 < 1 < 0.1 5.2 <0.005 <10 31 71 7.02 < 1 <50 0.42 110 < 0.1 23 < 0.1 <10 0.14 < 1 < 0.1 7.3 <0.005 <10 35 59 5.43 < 1 <50 < 0.2 100 < 0.1 24 < 0.1 <10 0.22 < 1 < 0.1 5.0 <0.005 <10 24 93 9.84 < 1 <50 0.39 100 < 0.1 29 < 0.1 <10 0.18 < 1 0.11 7.6 <0.005 <10 39 79 9.05 < 1 <50 0.23 <100 < 0.1 22 < 0.1 <10 < 0.1 < 1 < 0.1 6.3 <0.005 <10 40 42 9.86 < 1 <50 0.67 <100 < 0.1 32 < 0.1 <10 < 0.1 < 1 0.12 4.2 <0.005 <10 67 50 5.77 < 1 <50 0.48 <100 < 0.1 23 < 0.1 <10 < 0.1 < 1 0.11 5.1 <0.005 <10 53 74 35.48 < 1 <50 0.29 <100 < 0.1 27 < 0.1 <10 0.10 < 1 < 0.1 5.5 <0.005 <10 37 90 27.39 < 1 <50 0.47 <100 < 0.1 <20 < 0.1 <10 < 0.1 < 1 0.11 4.0 <0.005 <10 59 12 5.010 < 1 <50 0.24 <100 < 0.1 19 < 0.1 <10 < 0.1 < 1 < 0.1 3.2 <0.005 <10 44 10 2.211 < 1 <50 0.30 <100 < 0.1 27 < 0.1 <10 < 0.1 < 1 < 0.1 3.4 <0.005 <10 63 8.0 4.712 < 1 <50 0.92 <100 < 0.1 27 < 0.1 <10 0.10 < 1 < 0.1 2.9 <0.005 <10 38 33 13.913 < 1 <50 2.6 <100 < 0.1 <20 < 0.1 <10 < 0.1 < 1 < 0.1 2.6 <0.005 <10 36 13 5.814 < 1 <50 0.63 <100 < 0.1 <20 < 0.1 <10 < 0.1 < 1 < 0.1 2.3 <0.005 <10 35 31 18.815 < 1 <50 0.27 <100 < 0.1 21 < 0.1 <10 < 0.1 < 1 < 0.1 3.6 <0.005 <10 47 12 3.316 < 1 <50 1.2 <100 < 0.1 <20 < 0.1 <10 < 0.1 < 1 < 0.1 2.8 <0.005 <10 42 16 4.717 < 1 <50 0.21 110 < 0.1 <20 < 0.1 <10 0.16 < 1 0.78 28.6 <0.1 <10 208 20 20.618 < 1 <50 < 0.2 <100 < 0.1 <20 < 0.1 <10 < 0.1 < 1 < 0.1 3.7 <0.1 <10 23 16 < 0.519 < 1 <50 0.34 <100 < 0.1 22 < 0.1 <10 0.12 < 1 < 0.1 4.5 <0.1 <10 55 7.0 5.420 < 1 <50 0.19 <100 < 0.1 21 < 0.1 <10 < 0.1 < 1 < 0.1 3.7 <0.1 <10 35 12 0.7721 < 1 <50 0.49 <100 < 0.1 28 < 0.1 <10 0.13 < 1 0.20 7.4 <0.1 <10 70 20 8.622 < 1 <50 0.37 <100 < 0.1 25 < 0.1 <10 0.12 < 1 0.19 5.8 <0.1 <10 65 20 7.723 < 1 <50 < 0.2 <100 < 0.1 22 < 0.1 <10 < 0.1 < 1 < 0.1 5.0 <0.1 <10 54 47 3.124 < 1 <50 < 0.2 <100 < 0.1 26 < 0.1 <10 < 0.1 < 1 0.13 6.1 <0.1 <10 105 101 4.625 < 1 <50 < 0.2 <100 < 0.1 <20 < 0.1 <10 < 0.1 < 1 < 0.1 2.8 <0.1 <10 49 51 4.126 < 1 <50 0.88 105 < 0.1 <20 < 0.1 <10 < 0.1 < 1 < 0.1 1.9 <0.1 <10 34 7.0 1.427 < 1 <50 0.25 111 < 0.1 <20 < 0.1 <10 < 0.1 < 1 < 0.1 2.4 <0.1 <10 32 14 1.628 < 1 <50 < 0.2 112 < 0.1 <20 < 0.1 <10 < 0.1 < 1 < 0.1 1.9 <0.1 <10 34 1.8 0.8729 < 1 <50 1.3 <100 < 0.1 <20 < 0.1 <10 0.13 < 1 < 0.1 3.3 <0.1 <10 36 42 7.130 < 1 <50 < 0.2 <100 < 0.1 <20 < 0.1 <10 < 0.1 < 1 < 0.1 1.5 <0.1 <10 18 20 2.031 < 1 <50 < 0.2 <100 < 0.1 <20 < 0.1 <10 < 0.1 < 1 < 0.1 2.0 <0.1 <10 31 5.3 1.832 < 1 <50 0.48 <100 < 0.1 <20 < 0.1 <10 < 0.1 < 1 < 0.1 2.3 <0.1 <10 28 29 3.933 < 1 <50 0.20 <100 < 0.1 <20 < 0.1 <10 < 0.1 < 1 < 0.1 3.7 <0.1 <10 44 9.8 3.234 < 1 <50 < 0.2 <100 < 0.1 <20 < 0.1 <10 < 0.1 < 1 < 0.1 1.8 <0.1 <10 22 37 6.935 < 1 <50 < 0.2 <100 < 0.1 23 < 0.1 <10 0.10 < 1 < 0.1 3.8 <0.1 <10 58 39 6.636 < 1 <50 0.23 <100 < 0.1 <20 < 0.1 <10 0.10 < 1 0.11 3.4 <0.1 <10 50 24 3.337 < 1 <50 < 0.2 <100 < 0.1 <20 < 0.1 <10 < 0.1 < 1 0.10 4.2 <0.1 <10 80 38 3.238 < 1 <50 < 0.2 <100 < 0.1 <20 < 0.1 <10 < 0.1 < 1 < 0.1 3.3 <0.1 <10 47 7.2 2.539 < 1 <50 < 0.2 <100 < 0.1 <20 < 0.1 <10 0.13 < 1 < 0.1 7.4 <0.1 <10 77 45 2.640 < 1 <50 < 0.2 <100 < 0.1 20 < 0.1 <10 < 0.1 1.2 < 0.1 9.2 0.25 <10 84 30 7.841 < 1 <50 0.57 114 < 0.1 <20 < 0.1 <10 0.10 1.0 < 0.1 7.6 <0.1 <10 88 30 6.942 < 1 <50 < 0.2 217 < 0.1 <20 < 0.1 <10 0.13 < 1 0.12 9.4 <0.1 <10 122 6.8 2.843 < 1 <50 < 0.2 201 < 0.1 <20 < 0.1 <10 0.17 < 1 0.10 12.2 <0.1 <10 150 12 5.044 < 1 <50 < 0.2 104 < 0.1 <20 < 0.1 <10 < 0.1 < 1 < 0.1 6.3 <0.1 <10 64 22 3.045 < 1 <50 < 0.2 <100 < 0.1 <20 < 0.1 <10 < 0.1 < 1 < 0.1 8.2 <0.1 <10 72 82 3.046 < 1 <50 < 0.2 <100 < 0.1 <20 < 0.1 <10 < 0.1 < 1 < 0.1 9.7 <0.1 <10 99 9.6 2.247 < 1 <50 < 0.2 120 < 0.1 <20 < 0.1 <10 0.10 < 1 < 0.1 8.4 <0.1 <10 114 18 5.3

Table 3. Continued.Sample P Pb Rb Sb Sc Se Sn Th Ti Tl U V W Y Zn Zr # µg/L µg/L µg/L µg/L µg/L µg/L µg/L µg/L µg/L µg/L µg/L µg/L µg/L µg/L µg/L µg/L1 <50 0.43 9.0 < 2 2.0 <2 0.1 <20 <50 0.34 < 0.1 < 0.2 <20 <10 80.4 <502 <50 0.19 8.8 < 2 2.0 <2 1.1 <20 <50 < 0.2 < 0.1 < 0.2 <20 <10 11.7 <503 <50 < 0.1 6.4 < 2 3.0 <2 < 0.1 <20 <50 < 0.2 < 0.1 < 0.2 <20 <10 6.7 <504 <50 0.23 9.0 < 2 3.0 <2 5.5 <20 <50 < 0.2 < 0.1 < 0.2 <20 <10 4.8 <505 <50 < 0.1 9.6 < 2 3.0 <2 0.1 <20 <50 < 0.2 < 0.1 < 0.2 <20 <10 2.5 <506 <50 < 0.1 20.8 < 2 2.0 <2 0.2 <20 <50 < 0.2 < 0.1 < 0.2 <20 <10 2.3 <507 <50 < 0.1 19.2 < 2 1.0 <2 < 0.1 <20 <50 < 0.2 < 0.1 < 0.2 <20 <10 2.5 <508 <50 < 0.1 15.7 < 2 1.0 <2 1.3 <20 <50 < 0.2 < 0.1 < 0.2 <20 <10 1.8 <509 <50 < 0.1 21.2 < 2 1.0 <2 < 0.1 <20 <50 < 0.2 < 0.1 < 0.2 <20 <10 1.3 <5010 <50 < 0.1 10.1 < 2 1.0 <2 0.8 <20 <50 < 0.2 < 0.1 < 0.2 <20 <10 < 1 <5011 <50 < 0.1 19.0 < 2 1.0 <2 < 0.1 <20 <50 < 0.2 < 0.1 < 0.2 <20 <10 < 1 <5012 <50 < 0.1 11.6 < 2 2.0 <2 < 0.1 <20 <50 < 0.2 < 0.1 < 0.2 <20 <10 < 1 <5013 <50 < 0.1 9.7 < 2 2.0 <2 < 0.1 <20 <50 < 0.2 < 0.1 < 0.2 <20 <10 4.6 <5014 <50 < 0.1 11.6 < 2 2.0 <2 < 0.1 <20 <50 < 0.2 < 0.1 < 0.2 <20 <10 < 1 <5015 <50 < 0.1 19.8 < 2 2.0 <2 < 0.1 <20 <50 < 0.2 < 0.1 < 0.2 <20 <10 < 1 <5016 <50 < 0.1 9.5 < 2 3.0 <2 < 0.1 <20 <50 < 0.2 < 0.1 < 0.2 <20 <10 1.6 <5017 <50 < 0.1 38.2 < 2 2.0 <2 < 0.1 <20 <50 < 0.2 < 0.1 < 0.2 <20 <10 9.8 <5018 <50 < 0.1 5.2 < 2 < 0.1 <2 < 0.1 <20 <50 < 0.2 < 0.1 < 0.2 <20 <10 2.7 <5019 <50 < 0.1 10.7 < 2 < 0.1 <2 < 0.1 <20 <50 < 0.2 < 0.1 < 0.2 <20 <10 5.6 <5020 <50 < 0.1 7.6 < 2 < 0.1 <2 < 0.1 <20 <50 < 0.2 < 0.1 < 0.2 <20 <10 1.1 <5021 <50 < 0.1 19.3 < 2 1.0 <2 < 0.1 <20 <50 < 0.2 < 0.1 < 0.2 <20 <10 4.1 <5022 <50 < 0.1 17.9 < 2 1.0 <2 < 0.1 <20 <50 < 0.2 < 0.1 < 0.2 <20 <10 3.8 <5023 <50 < 0.1 8.8 < 2 < 0.1 <2 < 0.1 <20 <50 < 0.2 < 0.1 < 0.2 <20 <10 4.7 <5024 <50 < 0.1 18.7 < 2 1.0 <2 < 0.1 <20 <50 < 0.2 < 0.1 < 0.2 <20 <10 3.6 <5025 <50 < 0.1 11.9 < 2 0.4 <2 < 0.1 <20 <50 < 0.2 < 0.1 < 0.2 <20 <10 1.2 <5026 <50 < 0.1 11.1 < 2 0.5 <2 < 0.1 <20 <50 < 0.2 < 0.1 < 0.2 <20 <10 < 1 <5027 <50 < 0.1 8.1 < 2 0.5 <2 < 0.1 <20 <50 < 0.2 < 0.1 < 0.2 <20 <10 < 1 <5028 <50 < 0.1 6.7 < 2 0.4 <2 < 0.1 <20 <50 < 0.2 < 0.1 < 0.2 <20 <10 < 1 <5029 <50 0.12 11.3 < 2 0.7 <2 < 0.1 <20 <50 < 0.2 < 0.1 < 0.2 <20 <10 < 1 <5030 <50 < 0.1 4.1 < 2 1.0 <2 < 0.1 <20 <50 < 0.2 < 0.1 < 0.2 <20 <10 < 1 <5031 <50 < 0.1 6.3 < 2 0.6 <2 < 0.1 <20 <50 < 0.2 < 0.1 < 0.2 <20 <10 1.1 <5032 <50 < 0.1 5.5 < 2 0.6 <2 < 0.1 <20 <50 < 0.2 < 0.1 < 0.2 <20 <10 1.8 <5033 <50 < 0.1 9.6 < 2 0.4 <2 < 0.1 <20 <50 < 0.2 < 0.1 < 0.2 <20 <10 1.2 <5034 <50 < 0.1 5.2 < 2 0.7 <2 < 0.1 <20 <50 < 0.2 < 0.1 < 0.2 <20 <10 < 1 <5035 <50 < 0.1 13.8 < 2 0.6 <2 < 0.1 <20 <50 < 0.2 < 0.1 < 0.2 <20 <10 2.8 <5036 <50 < 0.1 10.0 < 2 1.0 <2 < 0.1 <20 <50 < 0.2 < 0.1 < 0.2 <20 <10 2.7 <5037 <50 < 0.1 18.2 < 2 1.1 <2 < 0.1 <20 <50 < 0.2 < 0.1 < 0.2 <20 <10 1.7 <5038 <50 < 0.1 9.2 < 2 1.0 <2 < 0.1 <20 <50 < 0.2 < 0.1 < 0.2 <20 <10 1.2 <5039 <50 < 0.1 8.0 < 2 1.4 <2 < 0.1 <20 <50 < 0.2 < 0.1 < 0.2 <20 <10 1.0 <5040 94 < 0.1 9.0 < 2 1.5 <2 < 0.1 <20 <50 < 0.2 < 0.1 < 0.2 <20 <10 1.6 <5041 83 < 0.1 9.1 < 2 1.5 <2 < 0.1 <20 <50 < 0.2 < 0.1 0.19 <20 <10 1.0 <5042 71 < 0.1 10.6 < 2 1.5 <2 < 0.1 <20 <50 < 0.2 < 0.1 < 0.2 <20 <10 < 1 <5043 88 < 0.1 13.8 < 2 1.4 <2 < 0.1 <20 <50 < 0.2 < 0.1 < 0.2 <20 <10 1.6 <5044 <50 < 0.1 7.4 < 2 1.2 <2 < 0.1 <20 <50 < 0.2 < 0.1 < 0.2 <20 <10 < 1 <5045 <50 < 0.1 8.0 < 2 1.2 <2 < 0.1 <20 <50 < 0.2 < 0.1 < 0.2 <20 <10 < 1 <5046 <50 < 0.1 9.6 < 2 1.2 <2 < 0.1 <20 <50 < 0.2 < 0.1 < 0.2 <20 <10 < 1 <5047 <50 < 0.1 10.2 < 2 1.3 <2 < 0.1 <20 <50 < 0.2 < 0.1 < 0.2 <20 <10 1.4 <50
Related Documents