STATE OF WASHINGTON DEPARTMENT OF COMMERCE 1011 Plum St SE y PO Box 42525 y Olympia, Washington 98504-2525 y (360) 725-4000 www.commerce.wa.gov December 8, 2011 Dear Readers: It is my pleasure to deliver the 2012 Washington State Energy Strategy to Governor Gregoire and the Legislature. Nearly 20 years have gone by since Washington State last developed such a strategy based on a comprehensive look at our energy system. Over that period, our population increased 26 percent while our overall energy bill, adjusted for inflation, increased by 70 percent. Overall energy use did not increase dramatically over that period, but rising prices, especially for petroleum, mean citizens and businesses are spending billions more on energy. Our energy system has also become increasingly complex with climate change obligations and the emergence of new energy technologies. The primary focus of the strategy is energy use in the transportation sector – where we use the most energy, emit the most greenhouse gases and spend the majority of our energy dollars. Our transportation system is also our least efficient energy sector – presenting real opportunities to improve efficiency and keep more dollars and jobs in Washington. Beyond transportation, the strategy examines ways that we can expand our successes in the efficiency of buildings and diversify our energy supply. While the department is very proud of this strategy, we know it will be out of date from the minute we publish it given the incredible amount of energy-related investment going on around the world. We also know there are important energy topics that are not addressed in this document given time and resource constraints. So please know we intend to continue investing in research, analysis and support for our policymakers and this document is the foundation on which we will continue evolving the state’s views on how our energy system should evolve. Finally, I want to recognize the exceptional work that produced the 2012 Washington State Energy Strategy. We would not have been able to produce this strategy without the thoughtful and dedicated efforts of our advisory and technical committee members, the general public, and the staff from this and other state agencies. Sincerely, Rogers Weed Director

Welcome message from author
This document is posted to help you gain knowledge. Please leave a comment to let me know what you think about it! Share it to your friends and learn new things together.
Transcript
STATE OF WASHINGTON
DEPARTMENT OF COMMERCE 1011 Plum St SE PO Box 42525 Olympia, Washington 98504-2525 (360) 725-4000
www.commerce.wa.gov
December 8, 2011 Dear Readers: It is my pleasure to deliver the 2012 Washington State Energy Strategy to Governor Gregoire and the Legislature. Nearly 20 years have gone by since Washington State last developed such a strategy based on a comprehensive look at our energy system. Over that period, our population increased 26 percent while our overall energy bill, adjusted for inflation, increased by 70 percent. Overall energy use did not increase dramatically over that period, but rising prices, especially for petroleum, mean citizens and businesses are spending billions more on energy. Our energy system has also become increasingly complex with climate change obligations and the emergence of new energy technologies. The primary focus of the strategy is energy use in the transportation sector – where we use the most energy, emit the most greenhouse gases and spend the majority of our energy dollars. Our transportation system is also our least efficient energy sector – presenting real opportunities to improve efficiency and keep more dollars and jobs in Washington. Beyond transportation, the strategy examines ways that we can expand our successes in the efficiency of buildings and diversify our energy supply. While the department is very proud of this strategy, we know it will be out of date from the minute we publish it given the incredible amount of energy-related investment going on around the world. We also know there are important energy topics that are not addressed in this document given time and resource constraints. So please know we intend to continue investing in research, analysis and support for our policymakers and this document is the foundation on which we will continue evolving the state’s views on how our energy system should evolve. Finally, I want to recognize the exceptional work that produced the 2012 Washington State Energy Strategy. We would not have been able to produce this strategy without the thoughtful and dedicated efforts of our advisory and technical committee members, the general public, and the staff from this and other state agencies. Sincerely,
Rogers Weed Director
!"#!$%&'()*+,-*$.,&,/$0*/1+2$.,1&,/+2%),($3-1/4&','$!"#!5!"67
Issues and Analysis for the Washington State Legislature and Governor
8/4/9:/1$!"##Rogers Weed, Director
2012 Washington State Energy Strategy page i
!"#$%&'()*(+($,-
This document was authored by the Washington Department of Commerce, State EnergyOffice; Tony Usibelli, Energy Office Director; and staff.
Glenn Blackmon topic specialist (efficiency financing)Angela Burrell analysisGustavo Collantes topic specialist (transportation)Roel Hammerschlag project managementKeibun Mori analysisJennifer Motteler administrative supportPeter Moulton interagency coordinationDarleen Muhly cartographyChuck Murray topic specialist (buildings efficiency)Greg Nothstein analysisMeg O Leary Advisory Committee coordinationCarolee Sharp administrative supportRebecca Stillings communications
Additional assistance was provided by the Washington State Departments of Transportation,Natural Resources and Ecology, the Washington State Transportation Commission, theWashington Utilities and Transportation Commission, and the members of the AdvisoryCommittee and the Technical Experts Panel.
Washington State Department of CommerceEnergy Office1011 Plum Street SEP.O. Box 43173Olympia, WA 98504-3173commerce.wa.gov/energy
To obtain a copy of this report in an alternate format, please call (360) 725-2895 or TTY/TDD (800) 634-4473 or FAX(360) 586-7176.
2012 Washington State Energy Strategy page ii
!"#$%&'(&)'*+%*+,
-./*'0$%12%3%*+,&4444444444444444444444444444444444444444444444444444444444444444444444444444444444444444444444444444444444444444444444444444444444444444444444444444444444444&5-##6%75"+5'*,&"*1&8%(5*5+5'*,&44444444444444444444444444444444444444444444444444444444444444444444444444444444444444444444444444444444444444444444444444444444444444444&579:%.;+57%&<;33"6=&44444444444444444444444444444444444444444444444444444444444444444444444444444444444444444444444444444444444444444444444444444444444444444444444444444444444&75)>"?+%6&@& &)'*+%:+&444444444444444444444444444444444444444444444444444444444444444444444444444444444444444444444444444444444444444444444444444444444444444444444444444444444444&@
1.1 Background ......................................................................................................................................................... 11.2 Goals and Principles ........................................................................................................................................... 11.3 Getting Public and Expert Input ......................................................................................................................... 31.4 Washington s Energy Landscape ...................................................................................................................... 4
)>"?+%6&A& &)>'',5*2&"*1&-*"$=B5*2&C'$5.=&)>'5.%,&444444444444444444444444444444444444444444444444444444444444444444444444444444444444444444444444&@D2.1 Resources and Demands Today ..................................................................................................................... 132.2 Scenario Planning ............................................................................................................................................. 152.3 Forecasting Energy Indicators Through 2035 ................................................................................................. 162.4 Policy Options and Policy Focus...................................................................................................................... 222.5 Near-Term and Long-Term Options ................................................................................................................ 222.6 Analysis Principles ............................................................................................................................................ 23
)>"?+%6&D& &-17"*.5*2&!6"*,?'6+"+5'*&9((5.5%*.=&444444444444444444444444444444444444444444444444444444444444444444444444444444444444444444444444444444&AE3.1 Why Transportation Efficiency? ....................................................................................................................... 243.2 Building on Prior Work ...................................................................................................................................... 253.3 A Transportation Policy Package ..................................................................................................................... 293.4 Near-Term Recommendations ......................................................................................................................... 31
D4E4@ Electric Vehicle Support .......................................................................................................................... 31D4E4A Renewable Fuels Standard ..................................................................................................................... 34D4E4D Diesel Engine Fuel Efficiency Improvements......................................................................................... 38D4E4E Commute Trip Reduction Program Expansion ...................................................................................... 40D4E4F Smart Growth and Transportation Planning ........................................................................................... 45D4E4G Transportation Systems Management ................................................................................................... 51D4E4H Regional Mobility Grants ......................................................................................................................... 55D4E4I Electric Vehicle Mileage Pricing Pilot ..................................................................................................... 57D4E4J Car Sharing and Mileage Based Insurance ........................................................................................... 58
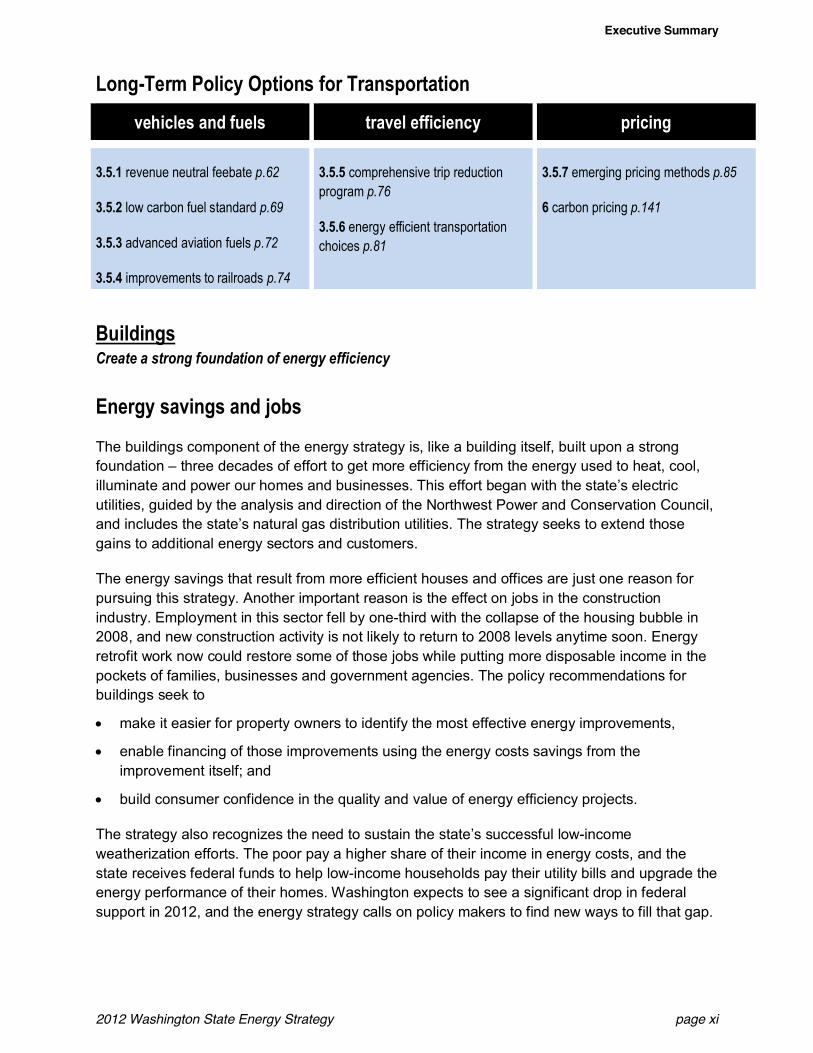
3.5 Long-Term Policy Options ................................................................................................................................ 62D4F4@ Revenue Neutral Feebate ....................................................................................................................... 62D4F4A Low Carbon Fuel Standard ..................................................................................................................... 69D4F4D Advanced Aviation Fuels ......................................................................................................................... 72D4F4E Improvements to Railroads ..................................................................................................................... 74D4F4F Comprehensive Trip Reduction Program ............................................................................................... 76D4F4G Energy Efficient Transportation Choices ................................................................................................ 81D4F4H Emerging Pricing Methods ...................................................................................................................... 85
)>"?+%6&E& &K"/5*2&L;5$15*2,&K'6%&9((5.5%*+&444444444444444444444444444444444444444444444444444444444444444444444444444444444444444444444444444444444444444&JA4.1 Why Building Efficiency? .................................................................................................................................. 924.2 Building on Prior Work ...................................................................................................................................... 934.3 Buildings Efficiency Policy Package ................................................................................................................ 994.4 Near-Term Recommendations ....................................................................................................................... 100
2012 Washington State Energy Strategy page iii
E4E4@ Non-Residential Disclosure ................................................................................................................... 100E4E4A Residential Disclosure ........................................................................................................................... 103E4E4D Marketing and Quality Assurance ......................................................................................................... 107E4E4E Meter-Based Financing ......................................................................................................................... 109E4E4F Energy Efficient Property Conversions................................................................................................. 113E4E4G Minimum Standards for Rental Housing .............................................................................................. 114E4E4H Sustaining Investment in Low-Income Weatherization Programs ...................................................... 116E4E4I Prevailing Wage Class for Weatherization ........................................................................................... 117
4.5 Combined Assessment of Residential Potential ........................................................................................... 119
)>"?+%6&F& &85,+65#;+%1&9*%62=&444444444444444444444444444444444444444444444444444444444444444444444444444444444444444444444444444444444444444444444444444444444444&@AE5.1 What is Distributed Energy and Why Is It Important? ................................................................................... 1245.2 Distributed Energy Policy Package................................................................................................................ 1265.3 Near-Term Recommendations ....................................................................................................................... 128
F4D4@ Interconnection Standards .................................................................................................................... 128F4D4A Net Metering Policies............................................................................................................................. 130F4D4D Streamlining Permitting for Distributed Energy .................................................................................... 132
5.4 Long-Term Policy Options .............................................................................................................................. 134F4E4@ DE-Compliant Power Purchase Agreements ....................................................................................... 134F4E4A Distributed Energy in I-937.................................................................................................................... 136F4E4D Rationalize Distributed Energy Incentives............................................................................................ 138
5.5 Future Trends for Distributed Energy ............................................................................................................ 140
)>"?+%6&G& &-*&M*+%26"+%1&C65.5*2&-??6'".>&4444444444444444444444444444444444444444444444444444444444444444444444444444444444444444444444444444444444444&@[email protected] Carbon Pricing ................................................................................................................................................ 1416.2 Analysis of a Revenue-Neutral Carbon Tax Option ...................................................................................... 1416.3 A Test for Scenario Planning ......................................................................................................................... 1446.4 Next Steps ....................................................................................................................................................... 145
)>"?+%6&H& &M*5+5"+57%&<+"+;,&(6'3&+>%&AN@@&O?1"+%&444444444444444444444444444444444444444444444444444444444444444444444444444444444444444444444444444&@EH7.1 The 2011 Energy Strategy Update ................................................................................................................ 1477.2 Residential & Commercial Buildings Efficiency............................................................................................. 1477.3 Industrial Energy Efficiency ............................................................................................................................ 1497.4 Transportation Efficiency and Technology .................................................................................................... 1507.5 Streamlined Permitting for Clean and Advanced Energy Technologies...................................................... 154
)>"?+%6&I& &<;33"6=&"*1&)'*.$;,5'*&444444444444444444444444444444444444444444444444444444444444444444444444444444444444444444444444444444444444444444444444&@FI8.1 Near-Term Recommendations Summary...................................................................................................... 1588.2 Comparing the Long-Term Policy Options .................................................................................................... 1618.3 Toward the 2015 Energy Strategy ................................................................................................................. 1658.4 Conclusion ....................................................................................................................................................... 171
-??%*15:&-&& &&<.%*"65'&C$"**5*2&P'6/,>'?&Q%?'6+-??%*15:&L&& &&AN@@&-1R;,+3%*+,&+'&<+"+%&S6%%*>';,%&S",&T'6%.",+-??%*15:&)&& &&C'$5.=&U?+5'*,&L6"5*,+'63&V5,+-??%*15:&8&& &&-*"$=+5.&T6"3%0'6/
!""#$%&'#()*+#)*,*&-*.-#)*/ www.commerce.wa.gov/energystrategy
2012 Washington State Energy Strategy page iv
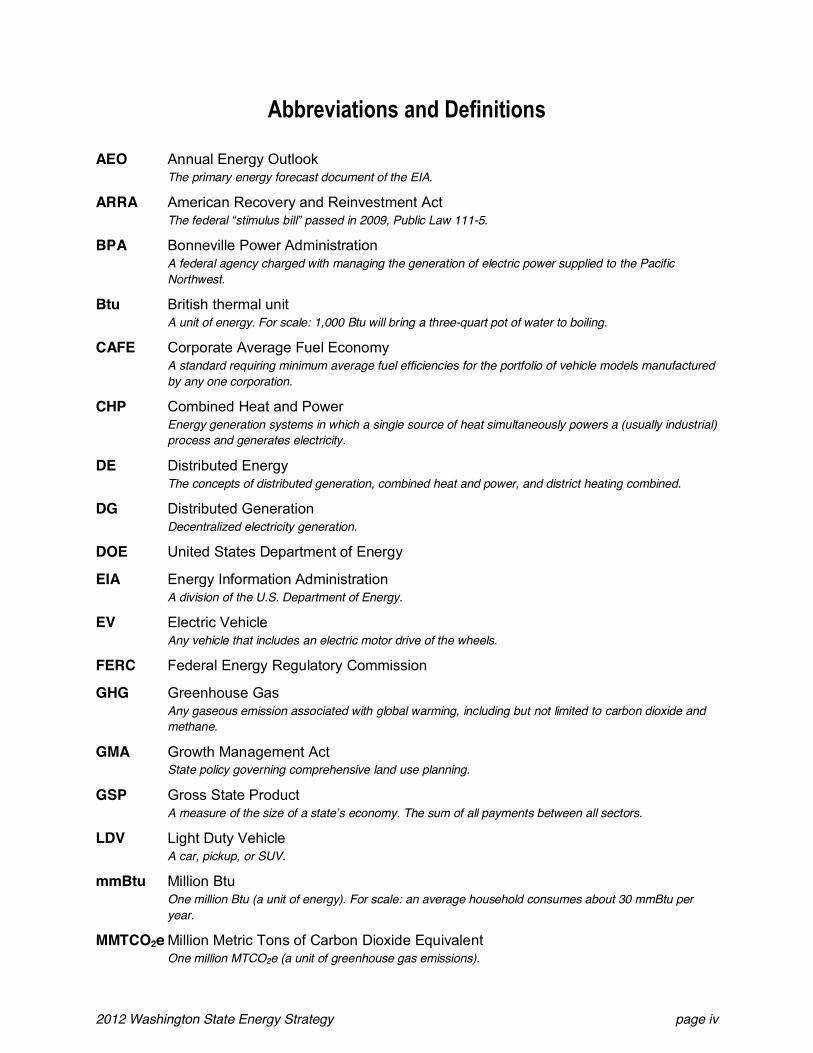
-##6%75"+5'*,&"*1&8%(5*5+5'*,
AEO Annual Energy OutlookThe primary energy forecast document of the EIA.
ARRA American Recovery and Reinvestment ActThe federal stimulus bill passed in 2009, Public Law 111-5.
BPA Bonneville Power AdministrationA federal agency charged with managing the generation of electric power supplied to the PacificNorthwest.
Btu British thermal unitA unit of energy. For scale: 1,000 Btu will bring a three-quart pot of water to boiling.
CAFE Corporate Average Fuel EconomyA standard requiring minimum average fuel efficiencies for the portfolio of vehicle models manufacturedby any one corporation.
CHP Combined Heat and PowerEnergy generation systems in which a single source of heat simultaneously powers a (usually industrial)process and generates electricity.
DE Distributed EnergyThe concepts of distributed generation, combined heat and power, and district heating combined.
DG Distributed GenerationDecentralized electricity generation.
DOE United States Department of Energy
EIA Energy Information AdministrationA division of the U.S. Department of Energy.
EV Electric VehicleAny vehicle that includes an electric motor drive of the wheels.
FERC Federal Energy Regulatory Commission
GHG Greenhouse GasAny gaseous emission associated with global warming, including but not limited to carbon dioxide andmethane.
GMA Growth Management ActState policy governing comprehensive land use planning.
GSP Gross State ProductA measure of the size of a state s economy. The sum of all payments between all sectors.
LDV Light Duty VehicleA car, pickup, or SUV.
mmBtu Million BtuOne million Btu (a unit of energy). For scale: an average household consumes about 30 mmBtu peryear.
MMTCO2e Million Metric Tons of Carbon Dioxide EquivalentOne million MTCO2e (a unit of greenhouse gas emissions).
2012 Washington State Energy Strategy page v
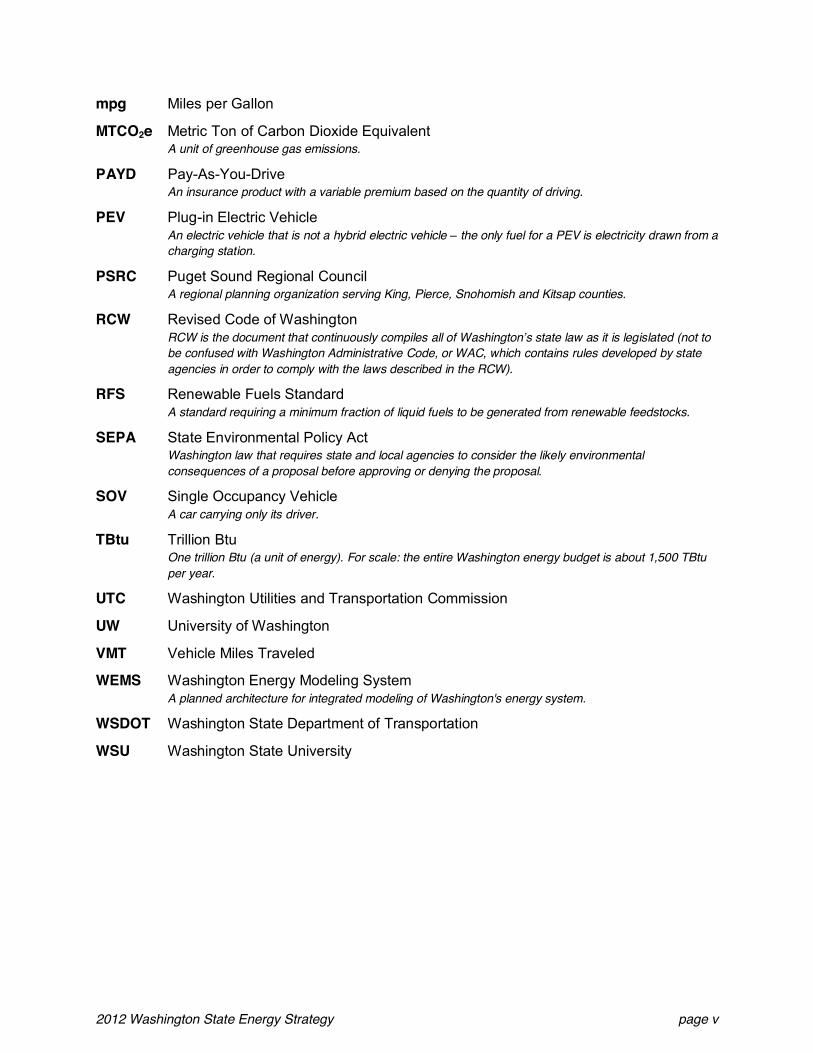
mpg Miles per Gallon
MTCO2e Metric Ton of Carbon Dioxide EquivalentA unit of greenhouse gas emissions.
PAYD Pay-As-You-DriveAn insurance product with a variable premium based on the quantity of driving.
PEV Plug-in Electric VehicleAn electric vehicle that is not a hybrid electric vehicle the only fuel for a PEV is electricity drawn from acharging station.
PSRC Puget Sound Regional CouncilA regional planning organization serving King, Pierce, Snohomish and Kitsap counties.
RCW Revised Code of WashingtonRCW is the document that continuously compiles all of Washington s state law as it is legislated (not tobe confused with Washington Administrative Code, or WAC, which contains rules developed by stateagencies in order to comply with the laws described in the RCW).
RFS Renewable Fuels StandardA standard requiring a minimum fraction of liquid fuels to be generated from renewable feedstocks.
SEPA State Environmental Policy ActWashington law that requires state and local agencies to consider the likely environmentalconsequences of a proposal before approving or denying the proposal.
SOV Single Occupancy VehicleA car carrying only its driver.
TBtu Trillion BtuOne trillion Btu (a unit of energy). For scale: the entire Washington energy budget is about 1,500 TBtuper year.
UTC Washington Utilities and Transportation Commission
UW University of Washington
VMT Vehicle Miles Traveled
WEMS Washington Energy Modeling SystemA planned architecture for integrated modeling of Washington's energy system.
WSDOT Washington State Department of Transportation
WSU Washington State University
9:%.;+57%&<;33"6=
!>%&P",>5*2+'*&<+"+%&9*%62=&<+6"+%2=!"#$%&'()*"('+,"-*)&"%)$."-"/01)2"3*)4-5).(,/4+$
-&3'3%*+&'(&'??'6+;*5+=
The 2012 Washington State Energy Strategy comes at a moment of opportunity, a time whenour state s policy makers can look to the long-term priorities for energy, economic vitality andclimate stability.
We have this opportunity because in the near term our state faces no great crisis in energysupply. There are exceptions, especially in volatile gasoline prices, but since 2008 the typicalWashington family energy bill has been stable or even declining. Natural gas prices have fallenas new technologies have opened up substantial reserves in the U.S. and Canada. The publichas embraced renewable energy and conservation, requiring that electric utilities include theseresources in their portfolios. Even after decades of growth, we continue to lead the nation inlow-cost industrial electricity rates, providing an enduring competitive advantage for industrialgrowth and employment.
Innovation and investment have expanded our range of options. Tens of billions of dollars inrecent global investments in energy technologies are now paying dividends, to the point thatwind and other renewable energy systems are challenging conventional power resources oncost. Consumers have greater choice among fuel-efficient vehicles, including hybrids and all-electric vehicles. Boeing delivered its first 787 airliner this fall, 20 percent more fuel-efficient than itspredecessor, and Alaska Airlines is making 75 flights a week using a biofuel blend based oncooking oil. Consumers have options for high-efficiency lighting systems, heat pumps and waterheaters that were just engineering concepts a few years ago.
The path ahead, however, is not obvious or simple. We still spend more than $20 billion peryear on energy more than 6 percent of the state s economy. Most of that money leaves thestate to cover fossil fuel costs. Moreover, global events add volatility to crude oil prices, creatingenergy cost risks. The energy supply system has grown more complex over time. Wind farmsand photovoltaic systems require coordination with the legacy power system. Our energyindustry must meet the voter-mandated standards for renewable and conservation resources. Itmust recharge new electric vehicles and reliably energize internet server farms. It must supply amulti-fuel transportation system. Carbon footprints must be measured and reduced.
The economic recession heavily influences the priorities and strategies in the 2012 EnergyStrategy. Washington s economy was thumped hard in 2008, and the experts say full recoveryis still years away. Energy prices are a potential drag on that recovery. At the same time electricrates in Cowlitz County increased 18 percent this fall, and millions of other customers felt theeffect of an 8 percent wholesale price increase by the Bonneville Power Administration. Thedownturn dampened projected growth in energy demand and greenhouse gas emissions, butthat is not how we intend to save energy.
Executive Summary
2012 Washington State Energy Strategy page vii
We aim to grow the economy by creating clean energy jobs through greater energy efficiencyand renewable energy. This is the path of the 2010 Clean Energy Leadership Council. We havea growing regional expertise in integrating wind into the electric grid and turning our abundantbiomass into energy, which can serve as a foundation for job growth.
Our approach to a comprehensive energy strategy is also motivated by concern about climatechange. Policy makers and the public have recognized the effect of climate change on our lives,and Washington is committed to reducing its contribution to the global problem. In just the shorttime since the Legislature authorized the 2012 Energy Strategy in 2010, evidence hasaccumulated of damage to health, safety and economic well-being caused by climate change.Just as energy production and consumption drive climate effects, environmental concerns mustdrive energy policy.
As decision-makers set a direction for the state s energy future, the choices are complex andsometimes contradictory, but the desired outcomes are clear. We seek a set of energy policiesthat will supply the muscle behind our state s economy, maintain affordable energy prices for ourfamilies and businesses and protect our global environment from the adverse effects of fossil fuels.
In short, we want an energy strategy that promotes clean job growth, competitive prices andlower greenhouse gas emissions.
!>%&?"+>&">%"1
Energy affects virtually every aspect of daily life; as the Legislature said in initiating this work,energy drives the entire modern economy. From universities to espresso stands, wheat farmsto ferries, everybody has an energy bill and is affected by energy availability and cost. Withenergy so pervasive in our lives, there is practically no end to the range of possible policies toinclude in a strategy. From this wide array several common themes emerged, perhaps nonemore strongly than the emphasis on energy efficiency. We can reduce our consumption ofenergy, particularly fossil fuels, and still improve our economic well-being if we increase ourefficiency. This is a long-standing public policy in Washington, beginning with the first, voluntarybuilding energy efficiency code in 1977, and it runs throughout the 2012 Energy Strategy.
The Energy Strategy also reflects the state s commitment to remain a leader in energyefficiency, sustainability and innovation and to build a clean energy economy. Our expertise inseemingly unrelated sectors, such as information technology and material sciences, canadvance our competitive advantage in electric vehicles, bioenergy and smart grid systems. Theimportance of well-informed consumer choice is another common theme within this energystrategy. We are, by economic necessity, in a time of smaller government. Tax revenues fornew government programs are scarce, but much can be accomplished by ensuring thatindividual consumers of energy have information and tools to make wise energy choices.Market-based policies that rely on individual choice include setting prices to reflectenvironmental effects and promoting assessment and disclosure of building energyperformance. The strategy also calls for standards that reflect desired outcomes. Efficiencystandards have been very effective in improving the performance of our vehicles and ourbuildings, and consistent use of standards provides a sound base for competition.
Executive Summary
2012 Washington State Energy Strategy page viii
For the 2012 Energy Strategy we considered many ideas but chose one major area of emphasis transportation and two significant other topics, buildings efficiency and distributed energy.
These areas of emphasis represent our greatest potential to transform energy use in ways thatpromote jobs, fair prices, and climate stability:
! A more efficient and coordinated system of transportation.
! A broader approach to energy efficiency in buildings.
! A more diverse supply portfolio through distributed energy.
!6"*,?'6+"+5'*6-.%$4*$)+%4-*7"%+4+,"-)$&&,.,$-.0)#8,($)%$5'.,-9).4%3"-)$/,**,"-*
K'75*2&?%'?$%&"*1&2''1,
The emphasis of this energy strategy on transportation issues reflects the dominant andgrowing burden that energy for transportation places on our economy, our household budgetsand our environment. This is not meant to suggest that transportation problems are exclusivelyan energy issue. The gridlocked Puget Sound traffic map is a mobility problem for transportationplanners and an emissions problem for environmental planners. It, and the rest of thetransportation system, is also an energy problem, since more than half of the state s energyexpenditures go to move people and goods within the state. Beginning with the first WashingtonState Energy Strategy in 1993, policy makers recognized the key role of transportation in energyplanning, and we continue this emphasis here.
Transportation is not just the state s largest energy use sector but also its least efficient sector.Buses, cars, trucks and aircraft are more efficient than they used to be, yet they still turn more oftheir fuel into heat and fumes than into useful movement. Motor fuels also have a bigger carbonfootprint than natural gas, emitting 30 percent more carbon per unit of useful energy. Finally,petroleum is also the most economically and politically volatile of all energy resources; wereduce risk to our economy and families when we reduce our reliance on petroleum.
To make progress in the transportation sector, the energy strategy recommends a policypackage based on multiple approaches to improve our use of energy to move people andgoods. The strategy would encourage more efficient vehicles, improve the fuels used intransportation and reduce the number of trips and driving miles required by families andbusinesses.
M3?6'7%1&7%>5.$%,&"*1&(;%$,
Electric vehicles are a reality and our state s policy approach can make a meaningful differencein how quickly they are adopted by consumers and businesses. Encouraging public chargingstations, for example, is key to consumer support of electric vehicles. These policyrecommendations build on the Legislature s 2009 decision to create an alternative fuel corridorpilot project and to exempt charging stations from public utility regulation. The state Plug-inElectric Vehicle Task Force is helping develop this corridor. More work lies ahead in deploying a
Executive Summary
2012 Washington State Energy Strategy page ix
robust charging network, and success will bring the need to integrate a significant new electricitydemand into our power grid.
Other recommended policies support increasing the efficiency of diesel fuel use by improvingtruck aerodynamics and using low-friction engine lubricants. These approaches apply existingtechnologies and can improve public health along with our economy and climate.
In addition, policy changes can champion new technologies that improve the fuel itself bymaking it burn cleaner and more efficiently or by manufacturing it from renewable resources.For example, the strategy recommends a near-term policy to require using more biodiesel inmotor fuels mixes. In the longer term the state should examine ways to reduce carbon in thefuel cycle. This latter effort would look at the entire process of acquiring and using fuels, ratherthan just focusing on the content of fuels at the pump.
K'6%&%((5.5%*+&+6"7%$
A comprehensive understanding of energy efficiency in transportation requires that we look notjust at the efficiency of the vehicles and fuels but also at the efficiency of travel itself. Anunnecessary trip in a high-efficiency car is still a waste of energy and money. Potential policiesrange from immediate actions such as encouraging carpooling to long-term decisions about howbest to plan and organize cities for travel and energy efficiency.
Public programs to manage and reduce commute trips should be expanded. Washingtonalready has a successful commute trip reduction program that works through employers toencourage car pools and public transportation use, as well as telecommuting and compressedwork schedules. Commute trip reduction programs are a proven strategy in our state to reducework trip vehicle miles traveled. To increase savings, programs must expand to include smalleremployers and non-commute trips. The state Department of Transportation has alreadydemonstrated the value of this approach through its Growth and Transportation EfficiencyCenter (GTEC) program.
The strategy identifies smart growth as the long-term key to more efficient travel. Communitiesthat are compact and transit-oriented will need less transportation and consume fewer energyresources. The energy strategy recommends smart growth approaches that would:
! Promote housing and employment density in urban areas.
! Provide parking incentives and management.
! Encourage bicycle and pedestrian accessibility.
! Increase urban brownfield redevelopment.
! Develop integrated multimodal transportation systems.
L%++%6&?65.5*2&'(&+65?,
Each time a consumer or worker makes a decision about when, how or whether to make a trip,that decision has the potential to impose congestion and pollution costs on fellow citizens. The
Executive Summary
2012 Washington State Energy Strategy page x
strategy recommends a close look at how travel pricing can be used to influence those millionsof individual travel decisions. A near-term possibility is to pilot the conversion of fixedtransportation charges to expenses that vary with the number of trips taken or miles driven.Potential examples include an electric vehicle mileage charge or mileage-based auto insurance.Longer-term approaches to consider include implementing direct charges on road use andcarbon emissions, possibly including a revenue-neutral tax on carbon, offset by reductions inother state taxes.
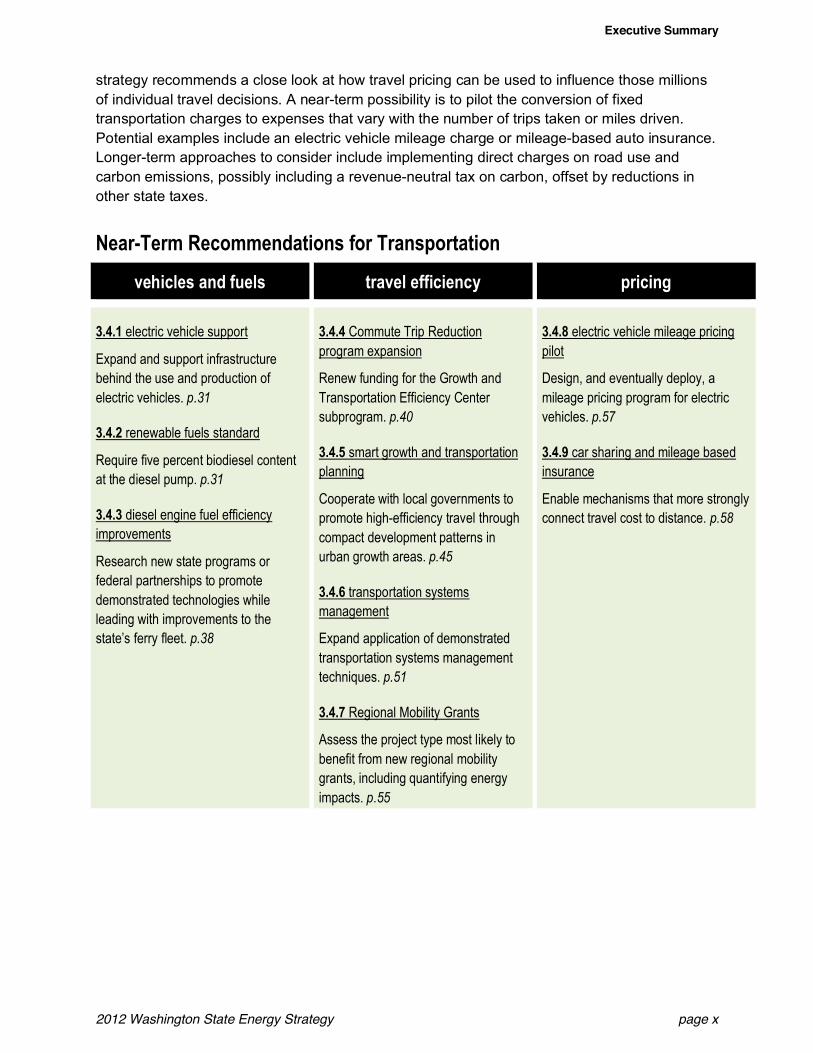
W%"6X!%63&Q%.'33%*1"+5'*,&('6&!6"*,?'6+"+5'*
7%>5.$%,&"*1&(;%$, +6"7%$&%((5.5%*.= ?65.5*2
D4E4@ electric vehicle support
Expand and support infrastructurebehind the use and production ofelectric vehicles. "012
D4E4A renewable fuels standard
Require five percent biodiesel contentat the diesel pump. "012
D4E4D diesel engine fuel efficiencyimprovements
Research new state programs orfederal partnerships to promotedemonstrated technologies whileleading with improvements to thestate s ferry fleet. "013
D4E4E Commute Trip Reductionprogram expansion
Renew funding for the Growth andTransportation Efficiency Centersubprogram. "045
D4E4F smart growth and transportationplanning
Cooperate with local governments topromote high-efficiency travel throughcompact development patterns inurban growth areas. "046
D4E4G transportation systemsmanagement
Expand application of demonstratedtransportation systems managementtechniques. "062
D4E4H Regional Mobility Grants
Assess the project type most likely tobenefit from new regional mobilitygrants, including quantifying energyimpacts. "066
D4E4I electric vehicle mileage pricingpilot
Design, and eventually deploy, amileage pricing program for electricvehicles. "067
D4E4J car sharing and mileage basedinsurance
Enable mechanisms that more stronglyconnect travel cost to distance. "063
Executive Summary
2012 Washington State Energy Strategy page xi
V'*2X!%63&C'$5.=&U?+5'*,&('6&!6"*,?'6+"+5'*7%>5.$%,&"*1&(;%$, +6"7%$&%((5.5%*.= ?65.5*2
D4F4@ revenue neutral feebate "089
D4F4A low carbon fuel standard "08:
D4F4D advanced aviation fuels "079
D4F4E improvements to railroads "074
D4F4F comprehensive trip reductionprogram "078
D4F4G energy efficient transportationchoices "032
D4F4H emerging pricing methods "036
G carbon pricing "0242
L;5$15*2,:%$4+$)4)*+%"-9)&"'-54+,"-)"&)$-$%90)$&&,.,$-.0
9*%62=&,"75*2,&"*1&R'#,
The buildings component of the energy strategy is, like a building itself, built upon a strongfoundation three decades of effort to get more efficiency from the energy used to heat, cool,illuminate and power our homes and businesses. This effort began with the state s electricutilities, guided by the analysis and direction of the Northwest Power and Conservation Council,and includes the state s natural gas distribution utilities. The strategy seeks to extend thosegains to additional energy sectors and customers.
The energy savings that result from more efficient houses and offices are just one reason forpursuing this strategy. Another important reason is the effect on jobs in the constructionindustry. Employment in this sector fell by one-third with the collapse of the housing bubble in2008, and new construction activity is not likely to return to 2008 levels anytime soon. Energyretrofit work now could restore some of those jobs while putting more disposable income in thepockets of families, businesses and government agencies. The policy recommendations forbuildings seek to
! make it easier for property owners to identify the most effective energy improvements,
! enable financing of those improvements using the energy costs savings from theimprovement itself; and
! build consumer confidence in the quality and value of energy efficiency projects.
The strategy also recognizes the need to sustain the state s successful low-incomeweatherization efforts. The poor pay a higher share of their income in energy costs, and thestate receives federal funds to help low-income households pay their utility bills and upgrade theenergy performance of their homes. Washington expects to see a significant drop in federalsupport in 2012, and the energy strategy calls on policy makers to find new ways to fill that gap.
Executive Summary
2012 Washington State Energy Strategy page xii
Y"$;5*2&%*%62=&?%6('63"*.%
Property owners will be more willing to improve their buildings if they can be confident thatprospective tenants and buyers will recognize the value of those improvements. We recommendmechanisms to increase disclosure and valuation of energy performance. Even a simple annualenergy statement could help customers monitor performance, focus attention and encourageaction. Another policy would improve coordination among utility, government and private-sectorparticipants in the energy efficiency building retrofit industry, with a focus on marketing andquality assurance for building energy efficiency contractors.
The disclosure strategy would build on a requirement adopted by the Legislature in 2009. Thelegislation now applies to non-residential buildings larger than 10,000 square feet. Owners mustdisclose the building s energy performance to prospective tenants, buyers and lenders. Anexpanded approach would make energy performance information more broadly available,making it easier to compare buildings and find the most efficient locations. Research shows thatbusinesses are willing to pay higher rents for energy efficient space.
We recommend a more modest start to disclosure of residential energy performance. Utilitieswould provide residential customers with an annual statement of their energy consumption andcosts, along with information on the benefits of retrofits.
The strategy also proposes a greater effort to build consumer confidence in residential energyretrofit services. This voluntary approach would include consistent marketing of energyefficiency services and stronger quality assurance of contractors services.
T5*"*.5*2&53?6'7%3%*+,
The energy strategy also calls for alternatives to conventional bank financing of residential andcommercial energy efficiency projects. Cost-effective efficiency improvements pay forthemselves over time through savings on heating and cooling costs, but many property ownerslack the capital to make the initial investment. Conventional financing also suffered with the lossof home equity caused by the downturn in real estate prices. Even when owners have thecapital, they may not see a positive return before they would move to another house.
The strategy recommends an approach that ties efficiency financing to the utility service ratherthan to the individual borrower. This meter-based financing recovers the investment through autility service charge applied to current and future customers, enabling everyone who benefitsfrom a property improvement to share in the repayment of that investment.
The meter-based approach would rely on utilities to collect payments for efficiency upgrades,but it does not require their investment capital. One possibility is to create an investment fundthrough the state Housing Finance Commission as part of its sustainable energy program.Meter-based financing could even reduce the cost of energy efficiency for utility customers,since it would allow the direct program participants to pay more of their own retrofit costs.
Executive Summary
2012 Washington State Energy Strategy page xiii
A second approach to financing energy efficiency upgrades would focus on the inventory ofdistressed properties in the state. The policy would provide a small tax credit to developers whopurchase a property, make energy efficiency upgrades and resell it.
V'0X5*.'3%&"*1&6%*+"$&?6'?%6+5%,
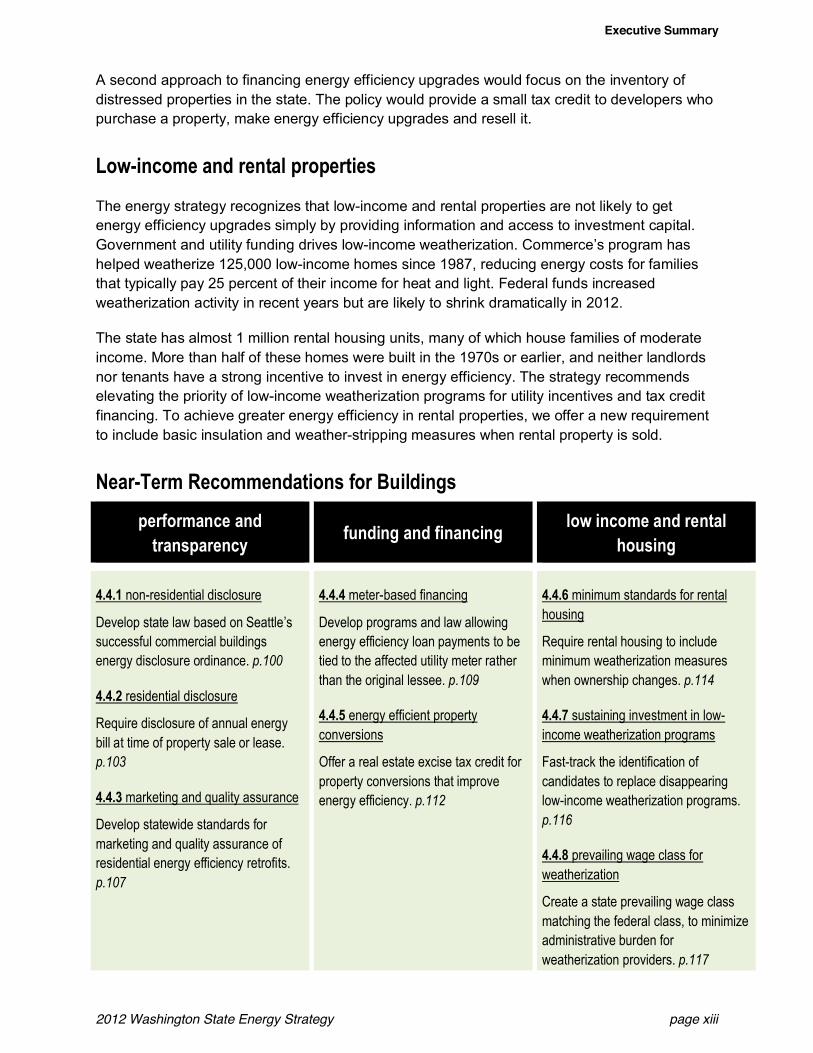
The energy strategy recognizes that low-income and rental properties are not likely to getenergy efficiency upgrades simply by providing information and access to investment capital.Government and utility funding drives low-income weatherization. Commerce s program hashelped weatherize 125,000 low-income homes since 1987, reducing energy costs for familiesthat typically pay 25 percent of their income for heat and light. Federal funds increasedweatherization activity in recent years but are likely to shrink dramatically in 2012.
The state has almost 1 million rental housing units, many of which house families of moderateincome. More than half of these homes were built in the 1970s or earlier, and neither landlordsnor tenants have a strong incentive to invest in energy efficiency. The strategy recommendselevating the priority of low-income weatherization programs for utility incentives and tax creditfinancing. To achieve greater energy efficiency in rental properties, we offer a new requirementto include basic insulation and weather-stripping measures when rental property is sold.
W%"6X!%63&Q%.'33%*1"+5'*,&('6&L;5$15*2,
?%6('63"*.%&"*1+6"*,?"6%*.= (;*15*2&"*1&(5*"*.5*2 $'0&5*.'3%&"*1&6%*+"$
>';,5*2
E4E4@ non-residential disclosure
Develop state law based on Seattle ssuccessful commercial buildingsenergy disclosure ordinance. "0255
E4E4A residential disclosure
Require disclosure of annual energybill at time of property sale or lease."0251
E4E4D marketing and quality assurance
Develop statewide standards formarketing and quality assurance ofresidential energy efficiency retrofits."0257
E4E4E meter-based financing
Develop programs and law allowingenergy efficiency loan payments to betied to the affected utility meter ratherthan the original lessee. "025:
E4E4F energy efficient propertyconversions
Offer a real estate excise tax credit forproperty conversions that improveenergy efficiency. "0229
E4E4G minimum standards for rentalhousing
Require rental housing to includeminimum weatherization measureswhen ownership changes. "0224
E4E4H sustaining investment in low-income weatherization programs
Fast-track the identification ofcandidates to replace disappearinglow-income weatherization programs."0228
E4E4I prevailing wage class forweatherization
Create a state prevailing wage classmatching the federal class, to minimizeadministrative burden forweatherization providers. "0227
Executive Summary
2012 Washington State Energy Strategy page xiv
85,+65#;+%1&9*%62=6-.%$4*$)'*$)"&)4(+$%-4+,;$)4-5)%$-$#43($)$-$%90)%$*"'%.$*
9*%62=&,;??$=
The third emphasis area for the 2012 Energy Strategy focuses on energy supply, specifically thegrowing interest in energy production using smaller, alternative energy resources instead oflarge utility-owned plants. These distributed energy resources come in many forms, includingsolar, wind, manure and waste industrial heat. Manufacturing plants can increase efficiency byinstalling combined heat and power (cogeneration) projects. Cities and neighborhoods couldheat and cool their buildings with district energy systems. Agricultural and forest products canfuel small power plants. Thousands of small scale solar projects are being installed on homes,businesses and government buildings. Many owners of distributed energy systems value theindependence provided by the system as well as the energy that is produced.
Distributed energy resources can align with the goals to increase jobs in new clean energyindustries and to reduce negative climate impacts by displacing fossil fuels. Realizing thispotential will require that we improve our ability to integrate alternative resources into the state soverall energy supply system and address concerns about any adverse effects of thesesystems.
C%635+,&"*1&,+"*1"61,
Distributed energy projects raise interconnection and land-use concerns for utilities andneighbors. Integrating production and distribution of power from facilities whose output varieswith seasons and weather such as hydroelectric, solar or wind projects can presentchallenges for the region s power managers.
Consistent and straightforward permitting processes and standards can protect legitimate land-use interests while ensuring that good projects move quickly to development. Planning andstandards for integrating alternative resources into the energy distribution system will be necessaryto prevent conflicts, waste and system overloads. The Washington Utilities and TransportationCommission will be a key partner in the streamlining effort.
9((%.+57%&5*.%*+57%,
State policy encourages distributed energy projects through various mechanisms, includingseveral tax incentives and extra weighting under the state s Energy Independence Act (Initiative937), which created a renewable portfolio standard for most electric utilities.
The state tax incentives are based on good intentions but tend to be complex and not well-coordinated with each other. The strategy recommends examining the state s distributed energyincentives to assess their effectiveness and their financial impacts on the state s tax revenues
Executive Summary
2012 Washington State Energy Strategy page xv
!>%&6%*%0"#$%&?'6+('$5'&,+"*1"61
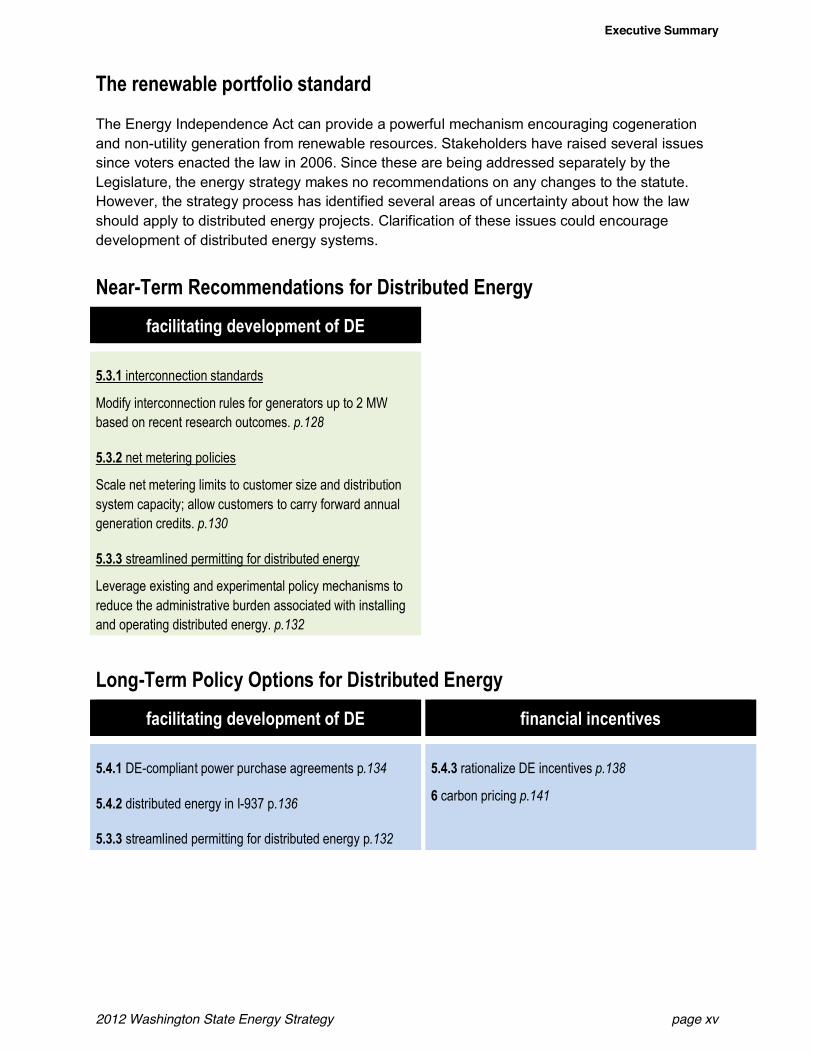
The Energy Independence Act can provide a powerful mechanism encouraging cogenerationand non-utility generation from renewable resources. Stakeholders have raised several issuessince voters enacted the law in 2006. Since these are being addressed separately by theLegislature, the energy strategy makes no recommendations on any changes to the statute.However, the strategy process has identified several areas of uncertainty about how the lawshould apply to distributed energy projects. Clarification of these issues could encouragedevelopment of distributed energy systems.
W%"6X!%63&Q%.'33%*1"+5'*,&('6&85,+65#;+%1&9*%62=
(".5$5+"+5*2&1%7%$'?3%*+&'(&89
F4D4@ interconnection standards
Modify interconnection rules for generators up to 2 MWbased on recent research outcomes. "0293
F4D4A net metering policies
Scale net metering limits to customer size and distributionsystem capacity; allow customers to carry forward annualgeneration credits. "0215
F4D4D streamlined permitting for distributed energy
Leverage existing and experimental policy mechanisms toreduce the administrative burden associated with installingand operating distributed energy. "0219
V'*2X!%63&C'$5.=&U?+5'*,&('6&85,+65#;+%1&9*%62=
(".5$5+"+5*2&1%7%$'?3%*+&'(&89 (5*"*.5"$&5*.%*+57%,
F4E4@ DE-compliant power purchase agreements p0214
F4E4A distributed energy in I-937 p0218
F4D4D streamlined permitting for distributed energy p0219
F4E4D rationalize DE incentives "0213
G carbon pricing "0242
Executive Summary
2012 Washington State Energy Strategy page xvi
9*%62=&C$"**5*2&T'6&+>%&T;+;6%<',(5)4)34(4-.$5)$-$%90)*+%4+$90)#,+8)%,9"%"'*)4-4(0*,*)4-5)$=+$-*,;$)*+4>$8"(5$%)#"%>
C$"**5*2&?6'.%,,
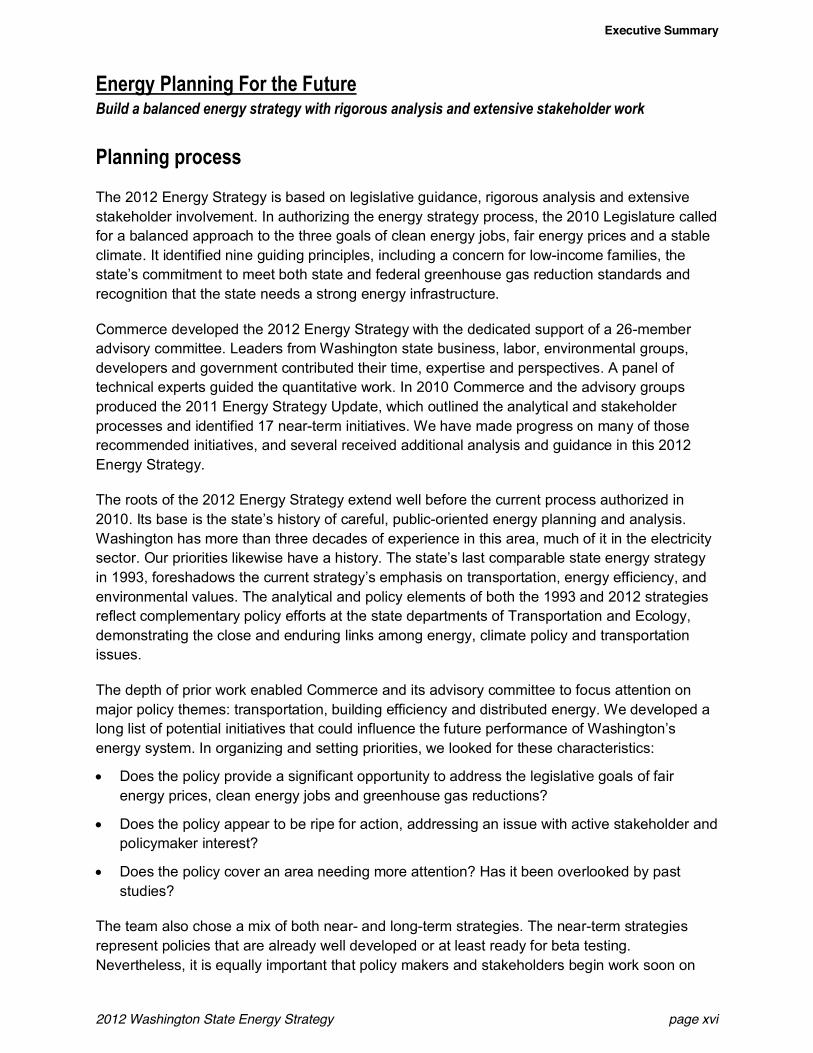
The 2012 Energy Strategy is based on legislative guidance, rigorous analysis and extensivestakeholder involvement. In authorizing the energy strategy process, the 2010 Legislature calledfor a balanced approach to the three goals of clean energy jobs, fair energy prices and a stableclimate. It identified nine guiding principles, including a concern for low-income families, thestate s commitment to meet both state and federal greenhouse gas reduction standards andrecognition that the state needs a strong energy infrastructure.
Commerce developed the 2012 Energy Strategy with the dedicated support of a 26-memberadvisory committee. Leaders from Washington state business, labor, environmental groups,developers and government contributed their time, expertise and perspectives. A panel oftechnical experts guided the quantitative work. In 2010 Commerce and the advisory groupsproduced the 2011 Energy Strategy Update, which outlined the analytical and stakeholderprocesses and identified 17 near-term initiatives. We have made progress on many of thoserecommended initiatives, and several received additional analysis and guidance in this 2012Energy Strategy.
The roots of the 2012 Energy Strategy extend well before the current process authorized in2010. Its base is the state s history of careful, public-oriented energy planning and analysis.Washington has more than three decades of experience in this area, much of it in the electricitysector. Our priorities likewise have a history. The state s last comparable state energy strategyin 1993, foreshadows the current strategy s emphasis on transportation, energy efficiency, andenvironmental values. The analytical and policy elements of both the 1993 and 2012 strategiesreflect complementary policy efforts at the state departments of Transportation and Ecology,demonstrating the close and enduring links among energy, climate policy and transportationissues.
The depth of prior work enabled Commerce and its advisory committee to focus attention onmajor policy themes: transportation, building efficiency and distributed energy. We developed along list of potential initiatives that could influence the future performance of Washington senergy system. In organizing and setting priorities, we looked for these characteristics:
! Does the policy provide a significant opportunity to address the legislative goals of fairenergy prices, clean energy jobs and greenhouse gas reductions?
! Does the policy appear to be ripe for action, addressing an issue with active stakeholder andpolicymaker interest?
! Does the policy cover an area needing more attention? Has it been overlooked by paststudies?
The team also chose a mix of both near- and long-term strategies. The near-term strategiesrepresent policies that are already well developed or at least ready for beta testing.Nevertheless, it is equally important that policy makers and stakeholders begin work soon on
Executive Summary
2012 Washington State Energy Strategy page xvii
the initiatives identified as long-term options. We set our policy objectives looking at the farhorizon, because the toughest issues of how to supply needed energy and preserve theenvironment are fundamental, long-term questions that cannot be asked and answered once.
M3?$%3%*+"+5'*
The 2012 Washington State Energy Strategy outlines a set of policies that can move the statesignificantly closer to its goals of clean job growth, fair energy prices and reduced greenhousegas emissions. Implementation of the strategy will require the support of many stakeholders,including local governments, utilities, the state departments of Agriculture, Commerce, Ecology,Revenue and Transportation, the State Auditor, Insurance Commissioner, and Utilities andTransportation Commission.
Many of the strategy s initiatives do not require legislative action. Indeed, the strategy does notmake specific legislative recommendations. However, because of the complexity of the issuesinvolved, most of the initiatives will require more detailed stakeholder work prior toimplementation or legislative action. The 2012 State Energy Strategy compares the long-termoptions and outlines the next steps for action.
We would emphasize again the continuing nature of good energy policy development. Thisstrategy is informed by many past efforts, and it should not be viewed as the last word. Thestrategy represents a way of thinking about our energy problems as well as a set ofrecommendations for change. The problems will evolve, but the modeling framework used inthis project will help us adapt. This strategy represents one punctuation mark in an ongoingconversation about our state s energy, economic and environmental future.
Ultimately we recognize that it is impossible to predict or forecast perfectly Washington s energyfuture, but we can do our best to anticipate, analyze and drive change in directions that benefitour state s long-term prosperity.
Section 1.1 Background
2012 Washington State Energy Strategy page 1
)>"?+%6&@ &)'*+%:+
@4@ L"./26';*1
Energy heats and cools homes and other buildings, powers Washington s industries, fuels thetransportation of people and goods, and runs the countless tools and appliances on whichWashingtonians depend every day. Energy costs account for 6 percent of Washington seconomy,1 a combination of electricity, heat, natural gas, propane, liquid fuels, coal, wood andmore. Meanwhile, the state s portfolio of energy sources and fuels is changing; energyindependence, climate stabilization, safety concerns and a dwindling supply of cheap crude oilare all driving a global interest in developing clean energy resources to eventually displace fossilfuels.
In the spring of 2010, the Washington State Legislature called for an integrated approach tomaintaining competitive energy prices, while engaging in a meaningful way in the clean energyeconomy.2 The state s Department of Commerce (Commerce) was given responsibility forproducing the 2012 Washington State Energy Strategy (2012 Energy Strategy) by December 1,2011 - the document you are now reading.
This is the first comprehensive Washington State Energy Strategy released since 1993. Sincethen, two updates have been released: a 2003 electricity strategy update that reviewed theimplications of price volatility of that time, and a 2011 Energy Strategy Update that was apreparatory step toward this comprehensive 2012 Energy Strategy. The 2010 legislationdirected that the Energy Strategy be released on a regular basis from this point forward;Commerce will publish the Energy Strategy every four years with every other edition of theexisting Biennial Energy Report, beginning with the 2015 Biennial Report due inDecember 2014.
@4A S'"$,&"*1&C65*.5?$%,
The legislation declares that a successful Energy Strategy will balance three goals3 in order to:
1. Maintain competitive energy prices that are fair and reasonable for consumers andbusinesses and support Washington s continued economic success;
2. Increase competitiveness by fostering a clean energy economy and jobs through businessand workforce development; and
1 Direct expenditures on energy products constitute 6 percent of Washington s gross state product (GSP).2 E2SHB 2658, now codified within Revised Code of Washington (RCW) 43.21F governing the duties of the
Washington State Energy Office. Section 404 of E2SHB 2658, establishing the process Commerce was to followfor the revision to the State Energy Strategy, was vetoed by the Governor due to concerns regarding languageabout the separation of powers between the executive and legislative branches of government. The Governor thenissued Directive 10-07 to the Department of Commerce, instructing Commerce to honor the update process andschedule originally intended in Section 404.
3 RCW 43.21F.010 (4)
Section 1.2 Goals and Principles
2012 Washington State Energy Strategy page 2
3. Meet the state's obligations to reduce greenhouse gas emissions. This goal refers to a 2008state law4 that established the goal of reducing statewide greenhouse gas emissions to1990 levels by 2020, to 25 percent below 1990 levels by 2035, and to 50 percent below by2050.
These three goals have served as the primary guidelines for work done on the 2012 EnergyStrategy the past 18 months.
In addition to the three goals, the legislation provides nine guiding principles:5
1. Pursue all cost-effective energy efficiency and conservation as the state's preferred energyresource, consistent with state law;
2. Ensure that the state's energy system meets the health, welfare, and economic needs of itscitizens with particular emphasis on meeting the needs of low-income and vulnerablepopulations;
3. Maintain and enhance economic competitiveness by ensuring an affordable and reliablesupply of energy resources and by supporting clean energy technology innovation, accessto clean energy markets worldwide, and clean energy business and workforce development;
4. Reduce dependence on fossil fuel energy sources through improved efficiency anddevelopment of cleaner energy sources, such as bioenergy, low carbon energy sources andnatural gas, and leveraging the indigenous resources of the state for the production of cleanenergy;
5. Improve efficiency of transportation energy use through advances in vehicle technology,increased system efficiencies, development of electricity, biofuels and other clean fuels, andregional transportation planning to improve transportation choices;
6. Meet the state's statutory greenhouse gas limits and environmental requirements as thestate develops and uses energy resources;
7. Build on the advantage provided by the state's clean, regional electrical grid by expandingand integrating additional carbon-free and carbon-neutral generation, and improving thetransmission capacity serving the state;
8. Make state government a model for energy efficiency, use of clean and renewable energy,and greenhouse gas-neutral operations; and
9. Maintain and enhance the state's existing energy infrastructure.
These principles outline Washington s values in defining a healthy energy system. Inassembling the policy recommendations in this 2012 Energy Strategy, Commerce constantlystrived to adhere to these principles, assuring that the final set of recommendations addressesall of them.
4 E2SHB 2815 (2008) Sec. 3(1) (a), encoded as RCW 70.235.020 Greenhouse gas emissions reductions Reporting requirements.
5 RCW 43.21F.088 State energy strategy Principles Implementation.
Section 1.3 Getting Public and Expert Input
2012 Washington State Energy Strategy page 3
!"# $%&&'()*+,-.'/*0(1*234%5&*6(4,&
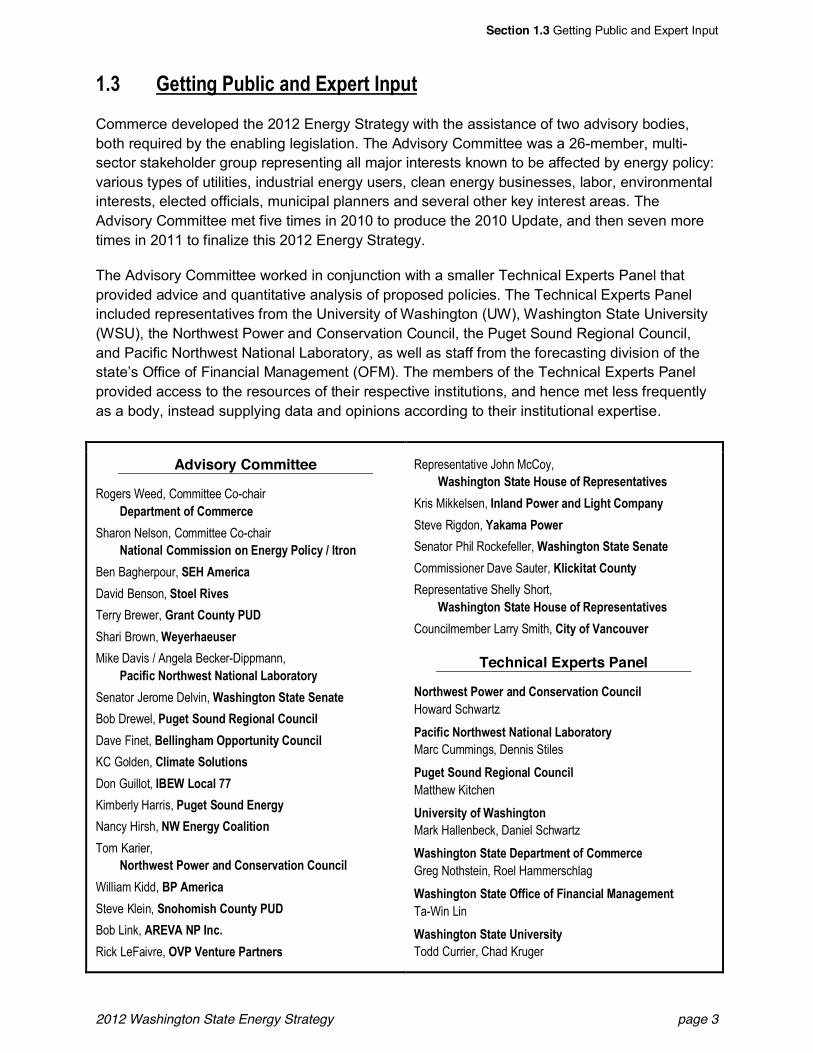
Commerce developed the 2012 Energy Strategy with the assistance of two advisory bodies,both required by the enabling legislation. The Advisory Committee was a 26-member, multi-sector stakeholder group representing all major interests known to be affected by energy policy:various types of utilities, industrial energy users, clean energy businesses, labor, environmentalinterests, elected officials, municipal planners and several other key interest areas. TheAdvisory Committee met five times in 2010 to produce the 2010 Update, and then seven moretimes in 2011 to finalize this 2012 Energy Strategy.
The Advisory Committee worked in conjunction with a smaller Technical Experts Panel thatprovided advice and quantitative analysis of proposed policies. The Technical Experts Panelincluded representatives from the University of Washington (UW), Washington State University(WSU), the Northwest Power and Conservation Council, the Puget Sound Regional Council,and Pacific Northwest National Laboratory, as well as staff from the forecasting division of thestate s Office of Financial Management (OFM). The members of the Technical Experts Panelprovided access to the resources of their respective institutions, and hence met less frequentlyas a body, instead supplying data and opinions according to their institutional expertise.
Advisory Committee
Rogers Weed, Committee Co-chair7%405&8%(&*9:*;988%5/%
Sharon Nelson, Committee Co-chair<0&'9(0.*;988'=='9(*9(*2(%5)>*+9.'/>*?*6&59(
Ben Bagherpour, @2A*B8%5'/0David Benson, @&9%.*C'D%=Terry Brewer, $50(&*;9,(&>*+E7Shari Brown, F%>%5G0%,=%5Mike Davis / Angela Becker-Dippmann,
+0/':'/*<95&GH%=&*<0&'9(0.*I0-950&95>Senator Jerome Delvin, F0=G'()&9(*@&0&%*@%(0&%Bob Drewel, +,)%&*@9,(1*C%)'9(0.*;9,(/'.Dave Finet, J%..'()G08*K4495&,('&>*;9,(/'.KC Golden, ;.'80&%*@9.,&'9(=Don Guillot, 6J2F*I9/0.*LLKimberly Harris, +,)%&*@9,(1*2(%5)>Nancy Hirsh, <F*2(%5)>*;90.'&'9(Tom Karier,
<95&GH%=&*+9H%5*0(1*;9(=%5D0&'9(*;9,(/'.William Kidd, J+*B8%5'/0Steve Klein, @(9G98'=G*;9,(&>*+E7Bob Link, BC2MB*<+*6(/"Rick LeFaivre, KM+*M%(&,5%*+05&(%5=
Representative John McCoy,F0=G'()&9(*@&0&%*A9,=%*9:*C%45%=%(&0&'D%=
Kris Mikkelsen, 6(.0(1*+9H%5*0(1*I')G&*;9840(>Steve Rigdon, N0O080*+9H%5Senator Phil Rockefeller, F0=G'()&9(*@&0&%*@%(0&%Commissioner Dave Sauter, P.'/O'&0&*;9,(&>Representative Shelly Short,
F0=G'()&9(*@&0&%*A9,=%*9:*C%45%=%(&0&'D%=Councilmember Larry Smith, ;'&>*9:*M0(/9,D%5
Technical Experts Panel
<95&GH%=&*+9H%5*0(1*;9(=%5D0&'9(*;9,(/'.Howard Schwartz
+0/':'/*<95&GH%=&*<0&'9(0.*I0-950&95>Marc Cummings, Dennis Stiles
+,)%&*@9,(1*C%)'9(0.*;9,(/'.Matthew Kitchen
E('D%5='&>*9:*F0=G'()&9(Mark Hallenbeck, Daniel Schwartz
F0=G'()&9(*@&0&%*7%405&8%(&*9:*;988%5/%Greg Nothstein, Roel Hammerschlag
F0=G'()&9(*@&0&%*K::'/%*9:*Q'(0(/'0.*R0(0)%8%(&Ta-Win Lin
F0=G'()&9(*@&0&%*E('D%5='&>Todd Currier, Chad Kruger
Section 1.4 Washington s Energy Landscape
2012 Washington State Energy Strategy page 4
A decision was made in January 2011 to focus the 2012 Energy Strategy efforts on thetransportation sector (this decision is described below in more detail). In order to providesufficient opportunities for transportation sector stakeholders not represented on the AdvisoryCommittee to have input on the 2012 Energy Strategy, the Washington State Department ofTransportation (WSDOT) informally convened a third body of stakeholders to advise ontransportation-related strategies. Input from this body was solicited primarily by email andtelephone during the months of June - September 2011, but also included an organized meetingon August 19, 2011.
In addition to the advisory bodies, Commerce invited public comments via open input sessionsat each of the Advisory Committee meetings, through the state Energy Strategy website andthrough public meetings. The public comment period ran October 7 through October 23, 2011.During that time, two public meetings were held, one October 12, 2011, in Tacoma and theother October 20, 2011, in Spokane. Comments were also accepted via email and postal mail.The comments and Commerce's responses are posted on the state Energy Strategy website.
@4E P",>5*2+'* ,&9*%62=&V"*1,."?%Like any other region, Washington is richly endowed in some energy resources and poorly inothers.
9$%.+65.5+=
One resource in particular colors Washington s energy system like no other: water.Washington s mountainous terrain and ample precipitation combine to produce perfectconditions for accumulating snowpack and glaciation during the winters, providing high altitude,running water year-round to power a system of electric generating dams.
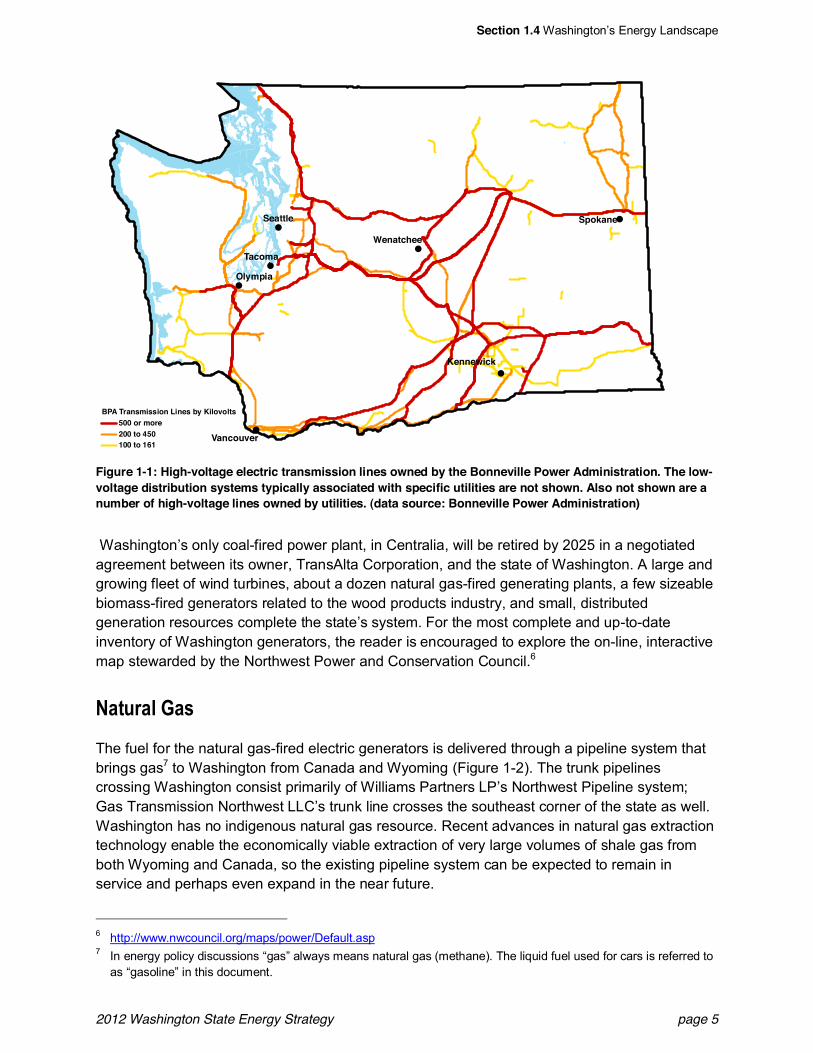
The Bonneville Power Administration (BPA), a federal agency, markets wholesale power in thePacific Northwest. Power marketed by BPA is generated by 31 federal hydroelectric projectsowned and operated by the U.S. Army Corps of Engineers and the Bureau of Reclamation,Energy Northwest s nuclear plant, and a few smaller resources. BPA also owns and operates alarge fraction of the state s electric transmission system (Figure 1-1).
Section 1.4 Washington s Energy Landscape
2012 Washington State Energy Strategy page 5
Figure 1-1: High-voltage electric transmission lines owned by the Bonneville Power Administration. The low-voltage distribution systems typically associated with specific utilities are not shown. Also not shown are anumber of high-voltage lines owned by utilities. (data source: Bonneville Power Administration)
Washington s only coal-fired power plant, in Centralia, will be retired by 2025 in a negotiatedagreement between its owner, TransAlta Corporation, and the state of Washington. A large andgrowing fleet of wind turbines, about a dozen natural gas-fired generating plants, a few sizeablebiomass-fired generators related to the wood products industry, and small, distributedgeneration resources complete the state s system. For the most complete and up-to-dateinventory of Washington generators, the reader is encouraged to explore the on-line, interactivemap stewarded by the Northwest Power and Conservation Council.6
W"+;6"$&S",
The fuel for the natural gas-fired electric generators is delivered through a pipeline system thatbrings gas7 to Washington from Canada and Wyoming (Figure 1-2). The trunk pipelinescrossing Washington consist primarily of Williams Partners LP s Northwest Pipeline system;Gas Transmission Northwest LLC s trunk line crosses the southeast corner of the state as well.Washington has no indigenous natural gas resource. Recent advances in natural gas extractiontechnology enable the economically viable extraction of very large volumes of shale gas fromboth Wyoming and Canada, so the existing pipeline system can be expected to remain inservice and perhaps even expand in the near future.
6 http://www.nwcouncil.org/maps/power/Default.asp7 In energy policy discussions gas always means natural gas (methane). The liquid fuel used for cars is referred to
as gasoline in this document.
!!!
!
!
!
!!
Kennewick
Olympia
Seattle Spokane
Tacoma
Vancouver
Wenatchee
BPA Transmission Lines by Kilovolts500 or more200 to 450100 to 161
Section 1.4 Washington s Energy Landscape
2012 Washington State Energy Strategy page 6
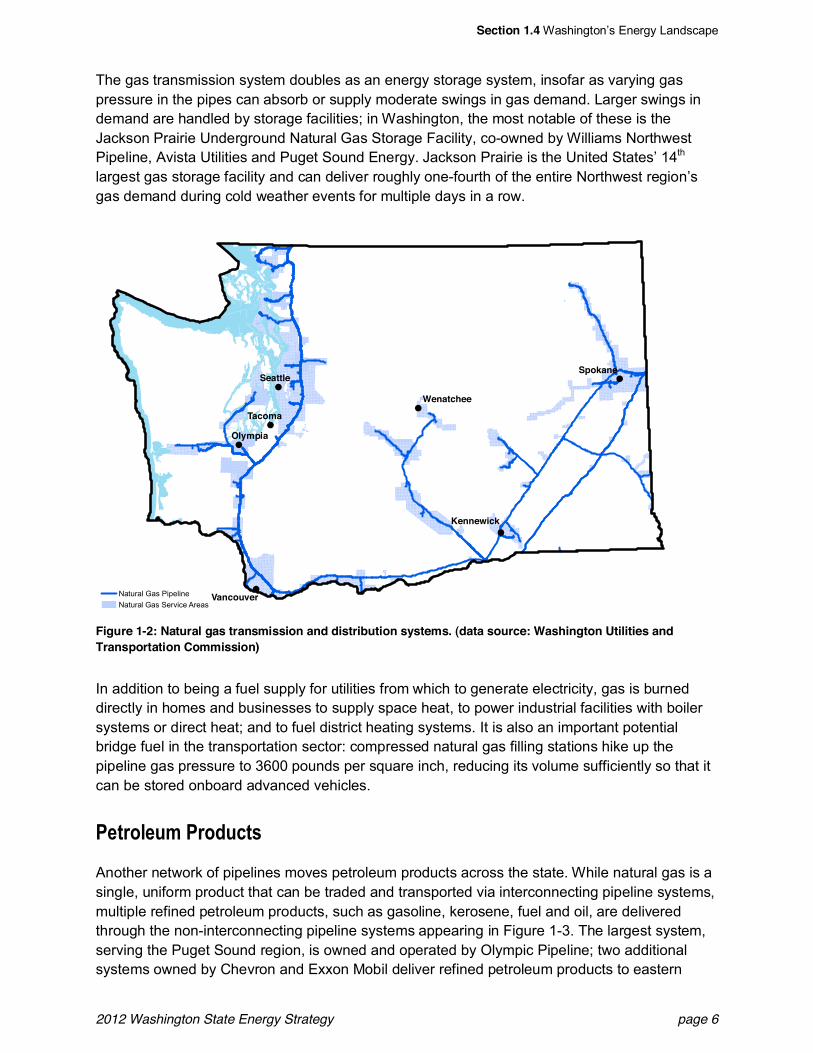
The gas transmission system doubles as an energy storage system, insofar as varying gaspressure in the pipes can absorb or supply moderate swings in gas demand. Larger swings indemand are handled by storage facilities; in Washington, the most notable of these is theJackson Prairie Underground Natural Gas Storage Facility, co-owned by Williams NorthwestPipeline, Avista Utilities and Puget Sound Energy. Jackson Prairie is the United States 14th
largest gas storage facility and can deliver roughly one-fourth of the entire Northwest region sgas demand during cold weather events for multiple days in a row.
Figure 1-2: Natural gas transmission and distribution systems. (data source: Washington Utilities andTransportation Commission)
In addition to being a fuel supply for utilities from which to generate electricity, gas is burneddirectly in homes and businesses to supply space heat, to power industrial facilities with boilersystems or direct heat; and to fuel district heating systems. It is also an important potentialbridge fuel in the transportation sector: compressed natural gas filling stations hike up thepipeline gas pressure to 3600 pounds per square inch, reducing its volume sufficiently so that itcan be stored onboard advanced vehicles.
C%+6'$%;3&C6'1;.+,
Another network of pipelines moves petroleum products across the state. While natural gas is asingle, uniform product that can be traded and transported via interconnecting pipeline systems,multiple refined petroleum products, such as gasoline, kerosene, fuel and oil, are deliveredthrough the non-interconnecting pipeline systems appearing in Figure 1-3. The largest system,serving the Puget Sound region, is owned and operated by Olympic Pipeline; two additionalsystems owned by Chevron and Exxon Mobil deliver refined petroleum products to eastern
!!!
!
!
!
!!
Kennewick
Olympia
Seattle
Tacoma
Vancouver
Wenatchee
Spokane
Natural Gas PipelineNatural Gas Service Areas
Section 1.4 Washington s Energy Landscape
2012 Washington State Energy Strategy page 7
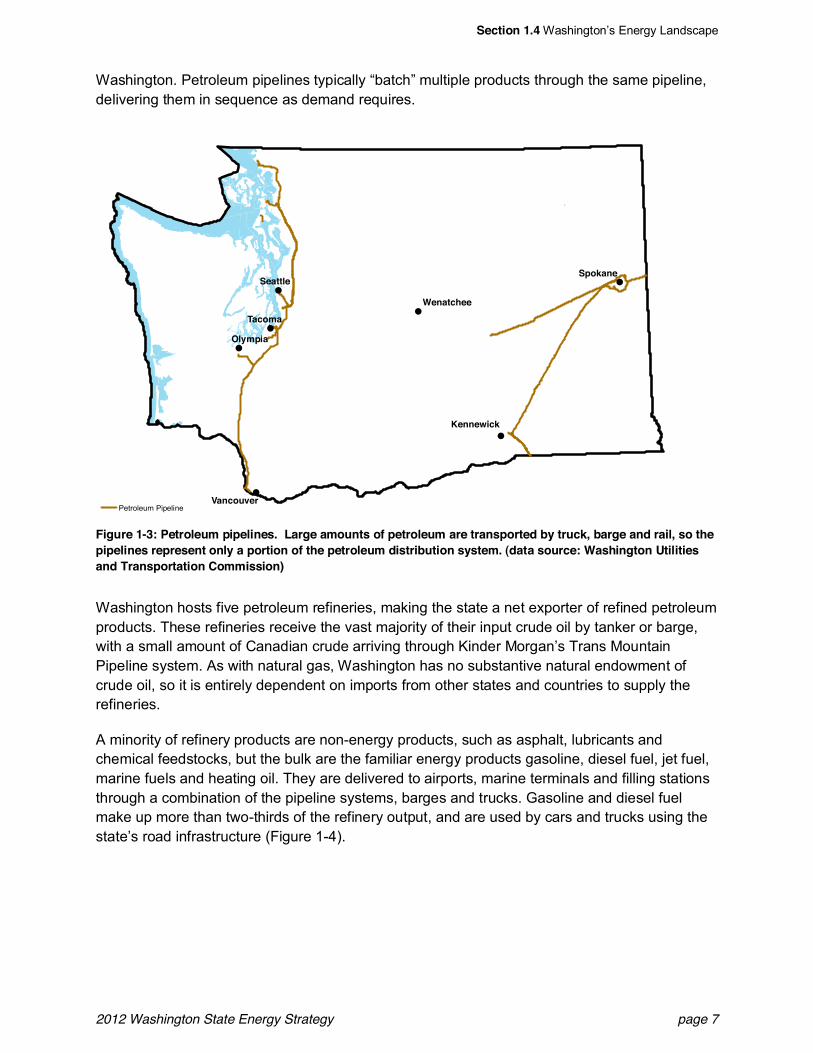
Washington. Petroleum pipelines typically batch multiple products through the same pipeline,delivering them in sequence as demand requires.
Figure 1-3: Petroleum pipelines. Large amounts of petroleum are transported by truck, barge and rail, so thepipelines represent only a portion of the petroleum distribution system. (data source: Washington Utilitiesand Transportation Commission)
Washington hosts five petroleum refineries, making the state a net exporter of refined petroleumproducts. These refineries receive the vast majority of their input crude oil by tanker or barge,with a small amount of Canadian crude arriving through Kinder Morgan s Trans MountainPipeline system. As with natural gas, Washington has no substantive natural endowment ofcrude oil, so it is entirely dependent on imports from other states and countries to supply therefineries.
A minority of refinery products are non-energy products, such as asphalt, lubricants andchemical feedstocks, but the bulk are the familiar energy products gasoline, diesel fuel, jet fuel,marine fuels and heating oil. They are delivered to airports, marine terminals and filling stationsthrough a combination of the pipeline systems, barges and trucks. Gasoline and diesel fuelmake up more than two-thirds of the refinery output, and are used by cars and trucks using thestate s road infrastructure (Figure 1-4).
!!!
!
!
!
!!
Kennewick
Olympia
Seattle
Tacoma
Vancouver
Wenatchee
Spokane
Petroleum Pipeline
Section 1.4 Washington s Energy Landscape
2012 Washington State Energy Strategy page 8
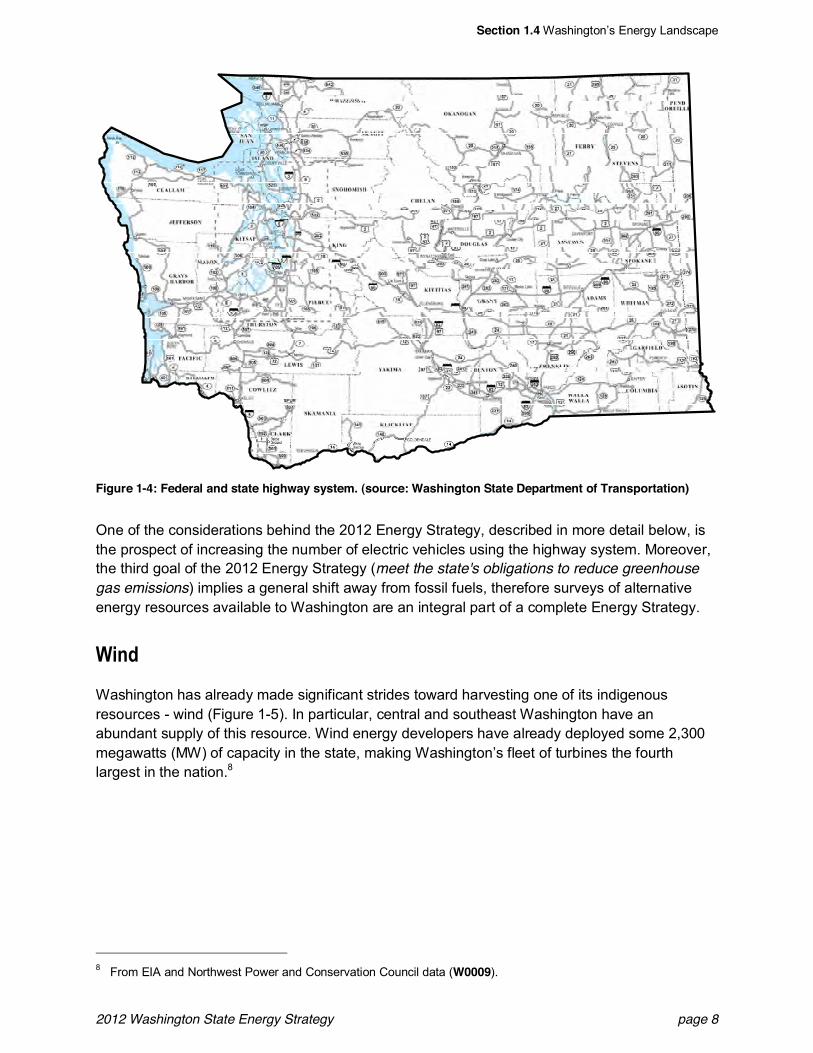
Figure 1-4: Federal and state highway system. (source: Washington State Department of Transportation)
One of the considerations behind the 2012 Energy Strategy, described in more detail below, isthe prospect of increasing the number of electric vehicles using the highway system. Moreover,the third goal of the 2012 Energy Strategy (meet the state's obligations to reduce greenhousegas emissions) implies a general shift away from fossil fuels, therefore surveys of alternativeenergy resources available to Washington are an integral part of a complete Energy Strategy.
P5*1
Washington has already made significant strides toward harvesting one of its indigenousresources - wind (Figure 1-5). In particular, central and southeast Washington have anabundant supply of this resource. Wind energy developers have already deployed some 2,300megawatts (MW) of capacity in the state, making Washington s fleet of turbines the fourthlargest in the nation.8
8 From EIA and Northwest Power and Conservation Council data (W0009).
Section 1.4 Washington s Energy Landscape
2012 Washington State Energy Strategy page 9
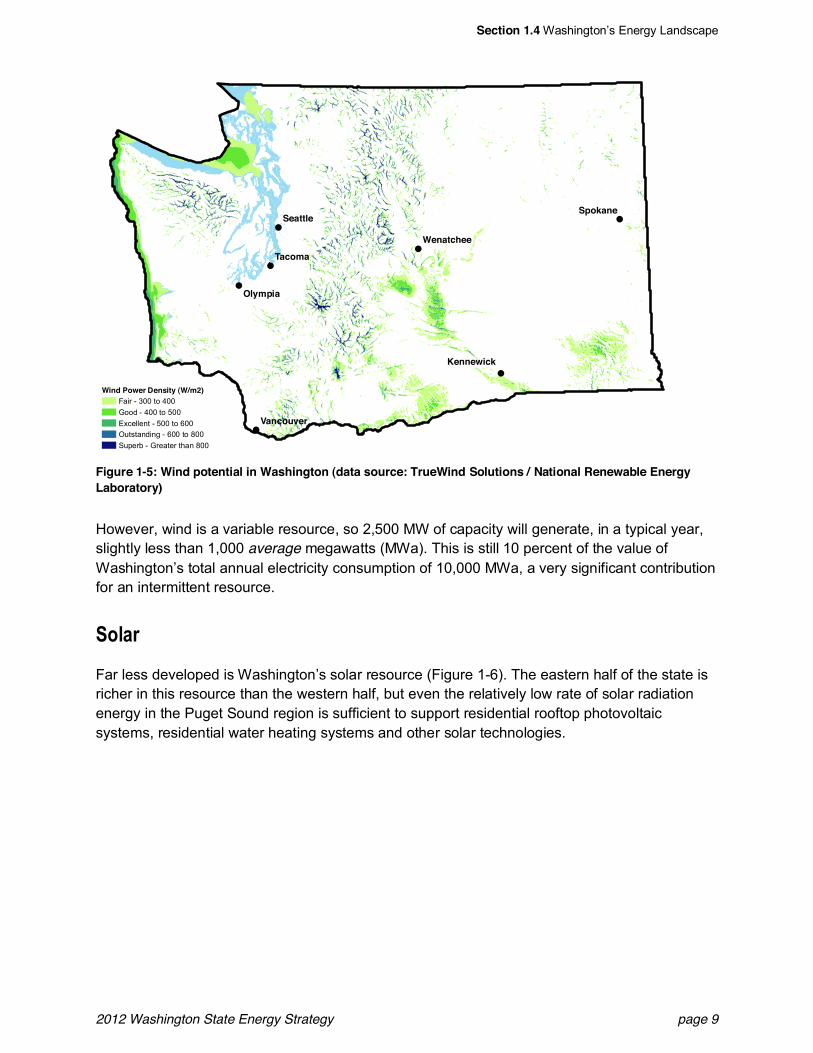
Figure 1-5: Wind potential in Washington (data source: TrueWind Solutions / National Renewable EnergyLaboratory)
However, wind is a variable resource, so 2,500 MW of capacity will generate, in a typical year,slightly less than 1,000 average megawatts (MWa). This is still 10 percent of the value ofWashington s total annual electricity consumption of 10,000 MWa, a very significant contributionfor an intermittent resource.
<'$"6
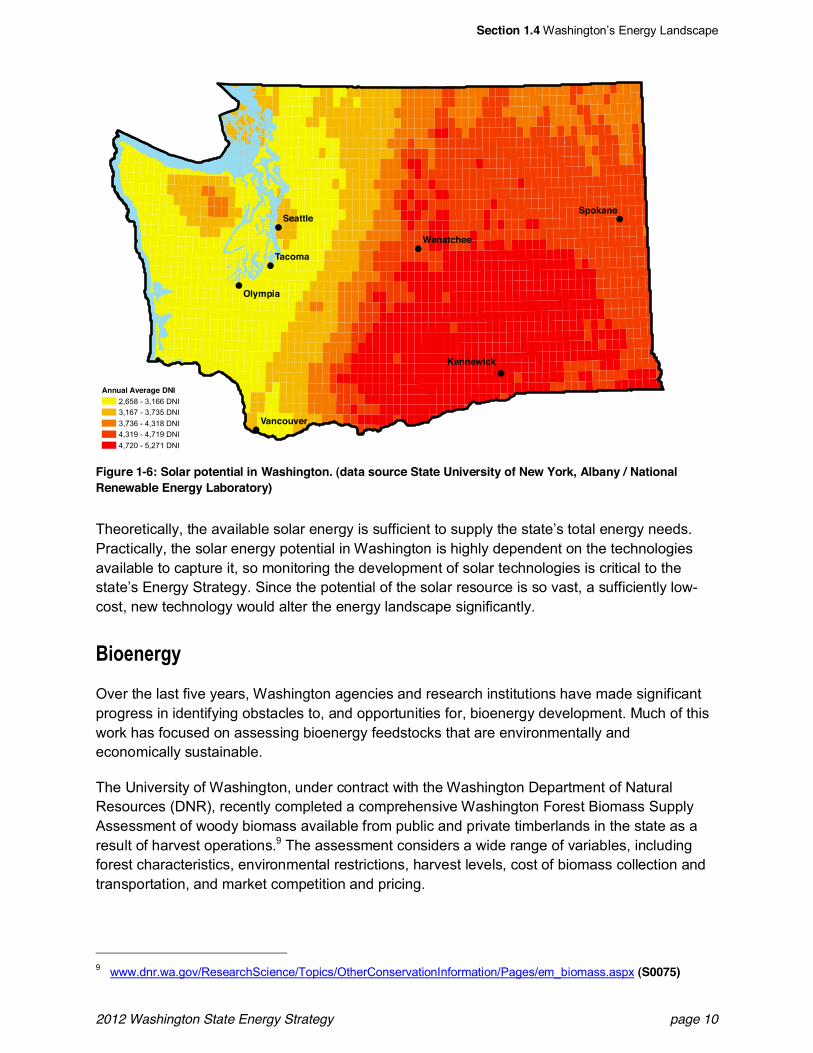
Far less developed is Washington s solar resource (Figure 1-6). The eastern half of the state isricher in this resource than the western half, but even the relatively low rate of solar radiationenergy in the Puget Sound region is sufficient to support residential rooftop photovoltaicsystems, residential water heating systems and other solar technologies.
!!!
!
!
!
!!
Kennewick
Olympia
SeattleSpokane
Tacoma
Vancouver
Wenatchee
Wind Power Density (W/m2)Fair - 300 to 400Good - 400 to 500Excellent - 500 to 600Outstanding - 600 to 800Superb - Greater than 800
Section 1.4 Washington s Energy Landscape
2012 Washington State Energy Strategy page 10
Figure 1-6: Solar potential in Washington. (data source State University of New York, Albany / NationalRenewable Energy Laboratory)
Theoretically, the available solar energy is sufficient to supply the state s total energy needs.Practically, the solar energy potential in Washington is highly dependent on the technologiesavailable to capture it, so monitoring the development of solar technologies is critical to thestate s Energy Strategy. Since the potential of the solar resource is so vast, a sufficiently low-cost, new technology would alter the energy landscape significantly.
L5'%*%62=
Over the last five years, Washington agencies and research institutions have made significantprogress in identifying obstacles to, and opportunities for, bioenergy development. Much of thiswork has focused on assessing bioenergy feedstocks that are environmentally andeconomically sustainable.
The University of Washington, under contract with the Washington Department of NaturalResources (DNR), recently completed a comprehensive Washington Forest Biomass SupplyAssessment of woody biomass available from public and private timberlands in the state as aresult of harvest operations.9 The assessment considers a wide range of variables, includingforest characteristics, environmental restrictions, harvest levels, cost of biomass collection andtransportation, and market competition and pricing.
9 www.dnr.wa.gov/ResearchScience/Topics/OtherConservationInformation/Pages/em_biomass.aspx (S0075)
!!!
!
!
!
!!
Kennewick
Olympia
SeattleSpokane
Tacoma
Vancouver
Wenatchee
Annual Average DNI2,658 - 3,166 DNI3,167 - 3,735 DNI3,736 - 4,318 DNI4,319 - 4,719 DNI4,720 - 5,271 DNI
Section 1.4 Washington s Energy Landscape
2012 Washington State Energy Strategy page 11
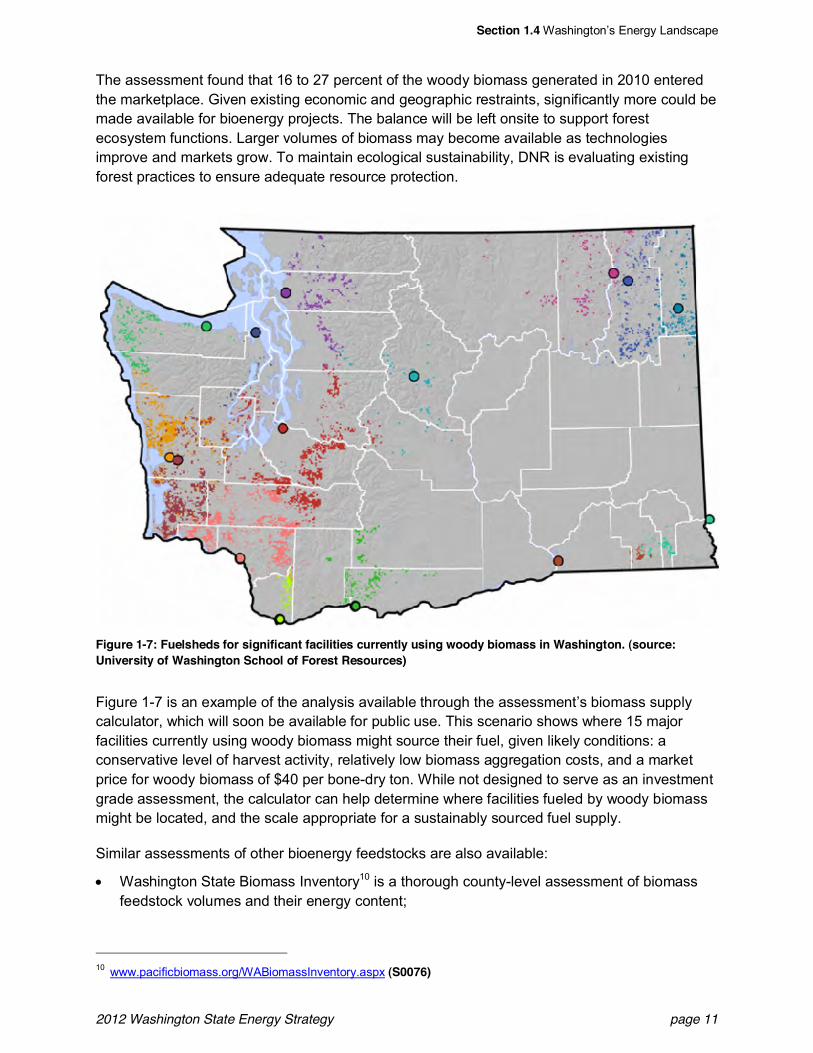
The assessment found that 16 to 27 percent of the woody biomass generated in 2010 enteredthe marketplace. Given existing economic and geographic restraints, significantly more could bemade available for bioenergy projects. The balance will be left onsite to support forestecosystem functions. Larger volumes of biomass may become available as technologiesimprove and markets grow. To maintain ecological sustainability, DNR is evaluating existingforest practices to ensure adequate resource protection.
Figure 1-7: Fuelsheds for significant facilities currently using woody biomass in Washington. (source:University of Washington School of Forest Resources)
Figure 1-7 is an example of the analysis available through the assessment s biomass supplycalculator, which will soon be available for public use. This scenario shows where 15 majorfacilities currently using woody biomass might source their fuel, given likely conditions: aconservative level of harvest activity, relatively low biomass aggregation costs, and a marketprice for woody biomass of $40 per bone-dry ton. While not designed to serve as an investmentgrade assessment, the calculator can help determine where facilities fueled by woody biomassmight be located, and the scale appropriate for a sustainably sourced fuel supply.
Similar assessments of other bioenergy feedstocks are also available:
! Washington State Biomass Inventory10 is a thorough county-level assessment of biomassfeedstock volumes and their energy content;
10 www.pacificbiomass.org/WABiomassInventory.aspx (S0076)
Section 1.4 Washington s Energy Landscape
2012 Washington State Energy Strategy page 12
! WSU Biofuels Cropping Systems Research and Extension Project11 has conductedextensive research on dedicated bioenergy crops for the state s various growing regions;
! Washington State Department of Agriculture Dairy Digester Inventory12 profiles existing on-farm anaerobic digesters and explores the potential for further development; and
! Two additional studies on the use of biomethane from farms, landfills and wastewatertreatment facilities for electrical generation, heating and transportation fuel will be availablefrom Commerce and the WSU Energy Program in the near future.
11 www.css.wsu.edu/biofuels/ (S0077)12 agr.wa.gov/FP/Pubs/docs/343-WashingtonDairiesAndDigesters-web.pdf (S0078)
Section 2.1 Resources and Demands Today
2012 Washington State Energy Strategy page 13
)>"?+%6&A &)>'',5*2&"*1&-*"$=B5*2&C'$5.=&)>'5.%,
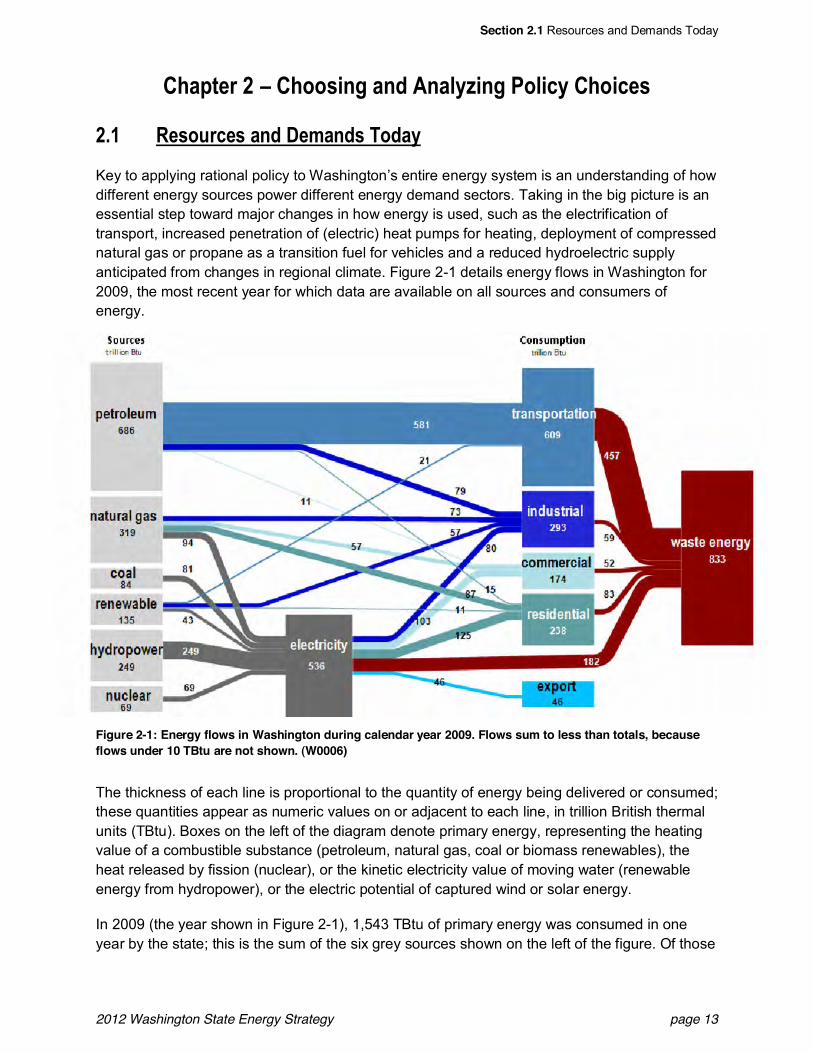
A4@ Q%,';6.%,&"*1&8%3"*1,&!'1"=
Key to applying rational policy to Washington s entire energy system is an understanding of howdifferent energy sources power different energy demand sectors. Taking in the big picture is anessential step toward major changes in how energy is used, such as the electrification oftransport, increased penetration of (electric) heat pumps for heating, deployment of compressednatural gas or propane as a transition fuel for vehicles and a reduced hydroelectric supplyanticipated from changes in regional climate. Figure 2-1 details energy flows in Washington for2009, the most recent year for which data are available on all sources and consumers ofenergy.
Figure 2-1: Energy flows in Washington during calendar year 2009. Flows sum to less than totals, becauseflows under 10 TBtu are not shown. (W0006)
The thickness of each line is proportional to the quantity of energy being delivered or consumed;these quantities appear as numeric values on or adjacent to each line, in trillion British thermalunits (TBtu). Boxes on the left of the diagram denote primary energy, representing the heatingvalue of a combustible substance (petroleum, natural gas, coal or biomass renewables), theheat released by fission (nuclear), or the kinetic electricity value of moving water (renewableenergy from hydropower), or the electric potential of captured wind or solar energy.
In 2009 (the year shown in Figure 2-1), 1,543 TBtu of primary energy was consumed in oneyear by the state; this is the sum of the six grey sources shown on the left of the figure. Of those
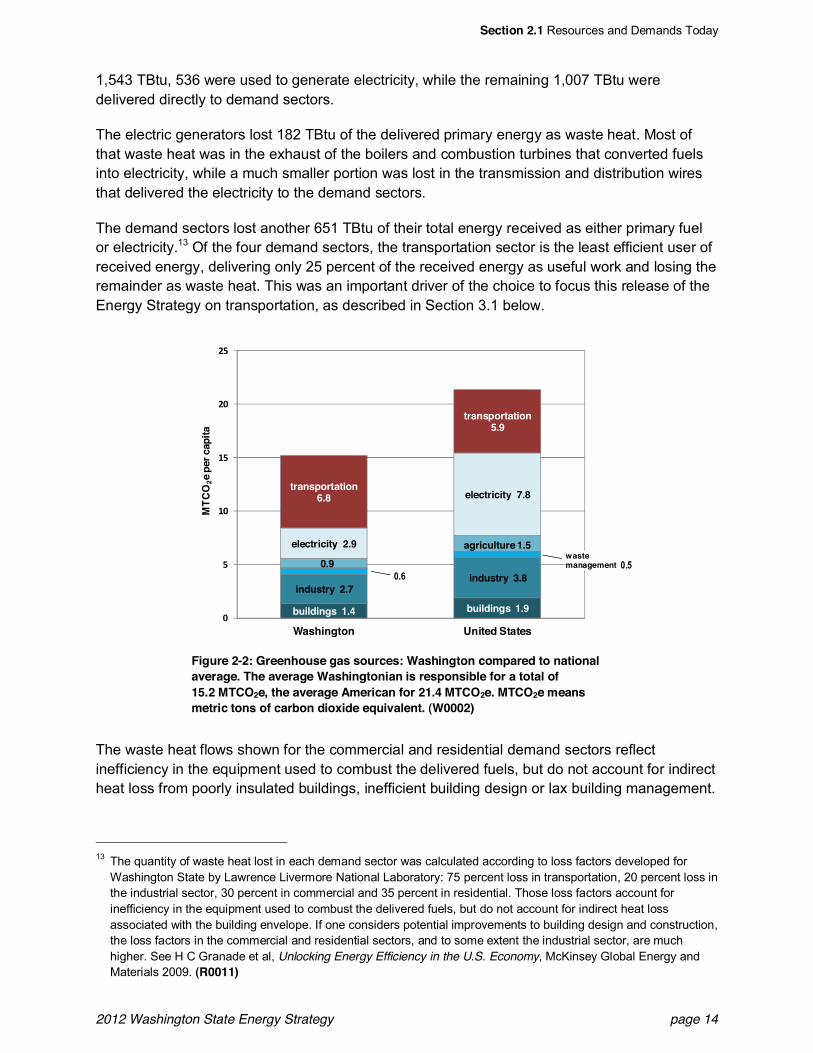
Section 2.1 Resources and Demands Today
2012 Washington State Energy Strategy page 14
1,543 TBtu, 536 were used to generate electricity, while the remaining 1,007 TBtu weredelivered directly to demand sectors.
The electric generators lost 182 TBtu of the delivered primary energy as waste heat. Most ofthat waste heat was in the exhaust of the boilers and combustion turbines that converted fuelsinto electricity, while a much smaller portion was lost in the transmission and distribution wiresthat delivered the electricity to the demand sectors.
The demand sectors lost another 651 TBtu of their total energy received as either primary fuelor electricity.13 Of the four demand sectors, the transportation sector is the least efficient user ofreceived energy, delivering only 25 percent of the received energy as useful work and losing theremainder as waste heat. This was an important driver of the choice to focus this release of theEnergy Strategy on transportation, as described in Section 3.1 below.
Figure 2-2: Greenhouse gas sources: Washington compared to nationalaverage. The average Washingtonian is responsible for a total of15.2 MTCO2e, the average American for 21.4 MTCO2e. MTCO2e meansmetric tons of carbon dioxide equivalent. (W0002)
The waste heat flows shown for the commercial and residential demand sectors reflectinefficiency in the equipment used to combust the delivered fuels, but do not account for indirectheat loss from poorly insulated buildings, inefficient building design or lax building management.
13 The quantity of waste heat lost in each demand sector was calculated according to loss factors developed forWashington State by Lawrence Livermore National Laboratory: 75 percent loss in transportation, 20 percent loss inthe industrial sector, 30 percent in commercial and 35 percent in residential. Those loss factors account forinefficiency in the equipment used to combust the delivered fuels, but do not account for indirect heat lossassociated with the building envelope. If one considers potential improvements to building design and construction,the loss factors in the commercial and residential sectors, and to some extent the industrial sector, are muchhigher. See H C Granade et al, Unlocking Energy Efficiency in the U.S. Economy, McKinsey Global Energy andMaterials 2009. (R0011)
buildings 1.4 buildings 1.9
industry 2.7industry 3.8N4G
N4F0.9
agriculture 1.5electricity 2.9
electricity 7.8transportation
6.8
transportation5.9
!
"
#!
#"
$!
$"
Washington United States
MTC
O2e
per
cap
ita
wastemanagement
Section 2.2 Scenario Planning
2012 Washington State Energy Strategy page 15
If one considers potential improvements tobuilding design and management, the lossfactors in the commercial and residential sectorsare much higher.14
When compared to other states, Washington senergy system is characterized by relativelyclean and low-cost electricity from hydroelectricgenerators; thermal energy with a larger thanusual contribution from biomass; and typicaltransportation energy. Because Washington selectric energy is low-greenhouse gas,transportation energy contributes a largerfraction of the state s greenhouse gases than inmost other states (Figure 2-2). Washington sper-capita transportation emissions are boostedeven further due to large military bases andcommercial operations at busy, international seaports.
A4A <.%*"65'&C$"**5*2
Analyses of policy impacts require forecasts offuture energy flow, prices and greenhouse gasemissions. The Technical Experts Panelconducted such forecasts out to calendar year2035, representing a time horizon of slightly lessthan 25 years. Twenty to 25 years is the typicallong-term time frame of other energy forecastingentities, like the U.S. Department of Energy(DOE) Energy Information Administration (EIA)and the Northwest Power and ConservationCouncil. This period represents the maximumspan of time for which any predictions of thefuture could be considered to have sufficientaccuracy to be useful for energy planningpurposes15 and coincides with one ofWashington s legislated greenhouse gas goals
14 See, e.g. H C Granade et al, Unlocking Energy Efficiency in the U.S. Economy, McKinsey Global Energy andMaterials 2009. (R0011)
15 This statement is obviously subjective to some degree, but is probably a fair summary of opinions held byTechnical Experts Panel members. Some energy analysts might find 10 years a reasonable maximum based oncautionary experiences like, for example, the recent wild growth in estimated, recoverable North American naturalgas reserves that occurred in less than that time span. Others might find forecasts out to 100 years important inorder to capture the impact of commitments we make to future global climate change, or to fully capture theanticipated lifetime of new energy infrastructure.
Natural Gas: Surprise!
There is a limit to how much dramatic change can beenvisioned through a process such as scenario planning.Highly unlikely black swan events can make it achallenge to forecast the future in a useful way. One suchevent is the recent, massive change in the NorthAmerican natural gas prospect. Less than 10 years ago,the continent was thought to be past its peak production.Some new natural gas was available north of the ArcticCircle, but only enough to supply the continent s needsperhaps another decade. Soon, it would becomenecessary to ship liquefied natural gas (LNG) from moredistant locations.
The dwindling reserves increased natural gas prices and,in the early- to mid-2000s, natural gas operators weremotivated to try unconventional extraction technologies.One of these, hydraulic fracturing ( fracking ), openedaccess to a massive reserve of domestic gas previouslyconsidered economically untouchable. In probably themost dramatic sign of this sea change, LNG import facilityplans launched in the late 1990s have been replaced bynew proposals for LNG export facilities in BritishColumbia, Louisiana and elsewhere.
The implications for Washington s Energy Strategy aresignificant. Natural gas releases approximately 25 percentless carbon per unit of energy when compared to gasolineand 44 percent less when compared to coal. When anear-term conversion to renewable fuel is impossible,natural gas can bridge the transition with moderatereductions in greenhouse gases using mature and low-cost combustion technologies. Replacing gasoline inconventional internal combustion engines withcompressed natural gas (CNG) is a quick pathway toreduce greenhouse gases from transportation. Last year sEnergy Strategy Update proposed just that for the state sfleet vehicles.
Still, black swans must be greeted with caution. Frackingcomes with a host of unsolved legal and environmentalquestions. The eventual answers to those questions willaffect the depth of the new resource s penetration into theAmerican market, and Washington s Energy Office will betracking this new resource closely to respond as quicklyas possible to its changing potential.
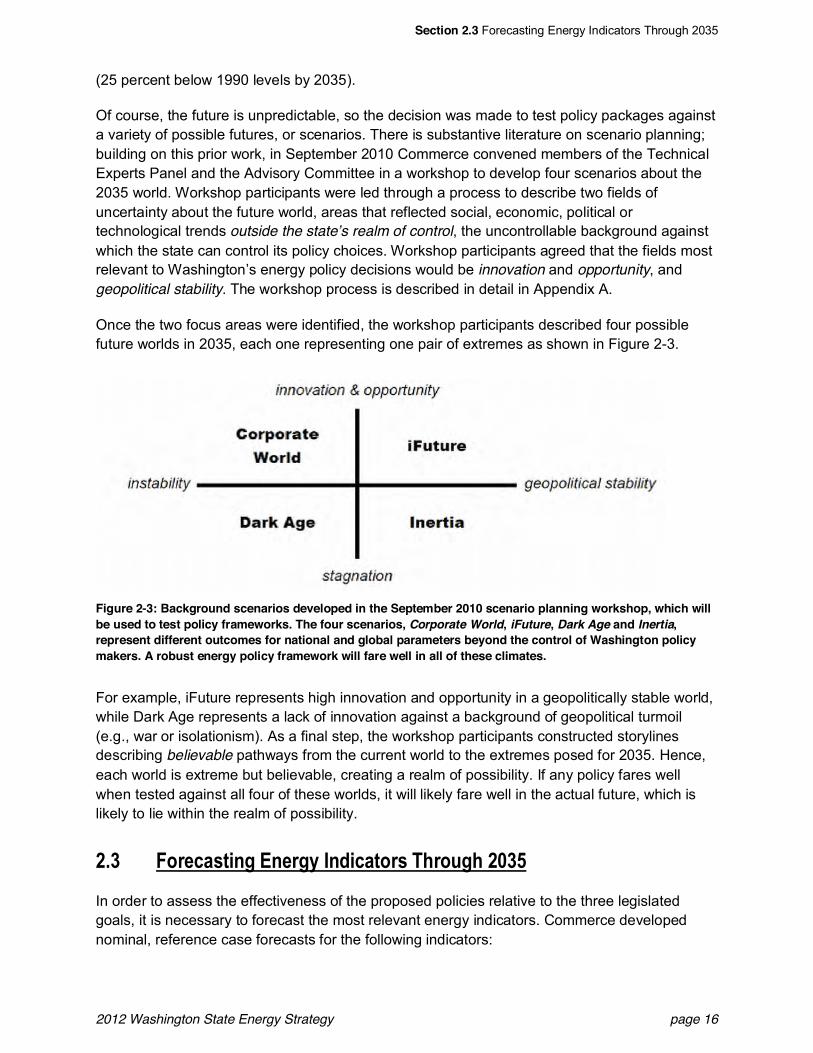
Section 2.3 Forecasting Energy Indicators Through 2035
2012 Washington State Energy Strategy page 16
(25 percent below 1990 levels by 2035).
Of course, the future is unpredictable, so the decision was made to test policy packages againsta variety of possible futures, or scenarios. There is substantive literature on scenario planning;building on this prior work, in September 2010 Commerce convened members of the TechnicalExperts Panel and the Advisory Committee in a workshop to develop four scenarios about the2035 world. Workshop participants were led through a process to describe two fields ofuncertainty about the future world, areas that reflected social, economic, political ortechnological trends outside the state s realm of control, the uncontrollable background againstwhich the state can control its policy choices. Workshop participants agreed that the fields mostrelevant to Washington s energy policy decisions would be innovation and opportunity, andgeopolitical stability. The workshop process is described in detail in Appendix A.
Once the two focus areas were identified, the workshop participants described four possiblefuture worlds in 2035, each one representing one pair of extremes as shown in Figure 2-3.
Figure 2-3: Background scenarios developed in the September 2010 scenario planning workshop, which willbe used to test policy frameworks. The four scenarios, Corporate World, iFuture, Dark Age and Inertia,represent different outcomes for national and global parameters beyond the control of Washington policymakers. A robust energy policy framework will fare well in all of these climates.
For example, iFuture represents high innovation and opportunity in a geopolitically stable world,while Dark Age represents a lack of innovation against a background of geopolitical turmoil(e.g., war or isolationism). As a final step, the workshop participants constructed storylinesdescribing believable pathways from the current world to the extremes posed for 2035. Hence,each world is extreme but believable, creating a realm of possibility. If any policy fares wellwhen tested against all four of these worlds, it will likely fare well in the actual future, which islikely to lie within the realm of possibility.
A4D T'6%.",+5*2&9*%62=&M*15."+'6,&!>6';2>&ANDF
In order to assess the effectiveness of the proposed policies relative to the three legislatedgoals, it is necessary to forecast the most relevant energy indicators. Commerce developednominal, reference case forecasts for the following indicators:
Section 2.3 Forecasting Energy Indicators Through 2035
2012 Washington State Energy Strategy page 17
Primary energy consumption the total quantity of primary energy consumed, per year,within the borders of Washington
Gross energy expenditures the total expenditures on primary energy and electricity in theWashington economy, reported both in inflation-adjusted dollars and as a percentage of grossstate product (GSP)
Average household energy bill the total expenditures on refined fuels and electricity by theaverage Washington household, reported both in inflation-adjusted dollars and as a percentageof the household budget
Gross greenhouse gas emissions greenhouse gas emissions due to combusting solid,liquid and gaseous fuels within the borders of Washington, plus greenhouse gas emissionsascribable to electricity consumed in Washington
The 2012 Energy Strategy forecasts are based on the EIA forecasts delivered in the AnnualEnergy Outlook 2011. The Annual Energy Outlook (AEO) forecasts are well established,sophisticated and appear reliably every year, so they form a solid backbone on which to createcomparable Energy Strategy analyses in future release years. The AEO is primarily a nationalforecast with a significant amount of information available at the regional level. Commerceadapted the Pacific region forecast to Washington, prorating according to population and sectorshares of historical consumption. Additionally, at the advice of the Technical Experts Panel, theEIA s electricity sector sub-forecast was swapped out for the regional electricity sector forecastprepared by the Northwest Power and Conservation Council.
The reference case primary energy consumption forecast for Washington is shown in Figure 2-4and is a modification of the AEO 2011 forecast. It incorporates an estimate from the EIA on theimpact of the recently announced corporate average fuel economy (CAFE) standards, whichrequire a 5 percent annual increase in vehicle fuel efficiency from 2017 to 2025. Transportationenergy consumption is by far the largest individual sector, but exhibits the lowest growth rate(0.25 percent per year) due in large part to federal vehicle fuel efficiency standards andanticipated fuel price increases. Total primary energy use in the reference case grows by about0.8 percent per year, or a bit under the population growth rate of 1 percent per year.
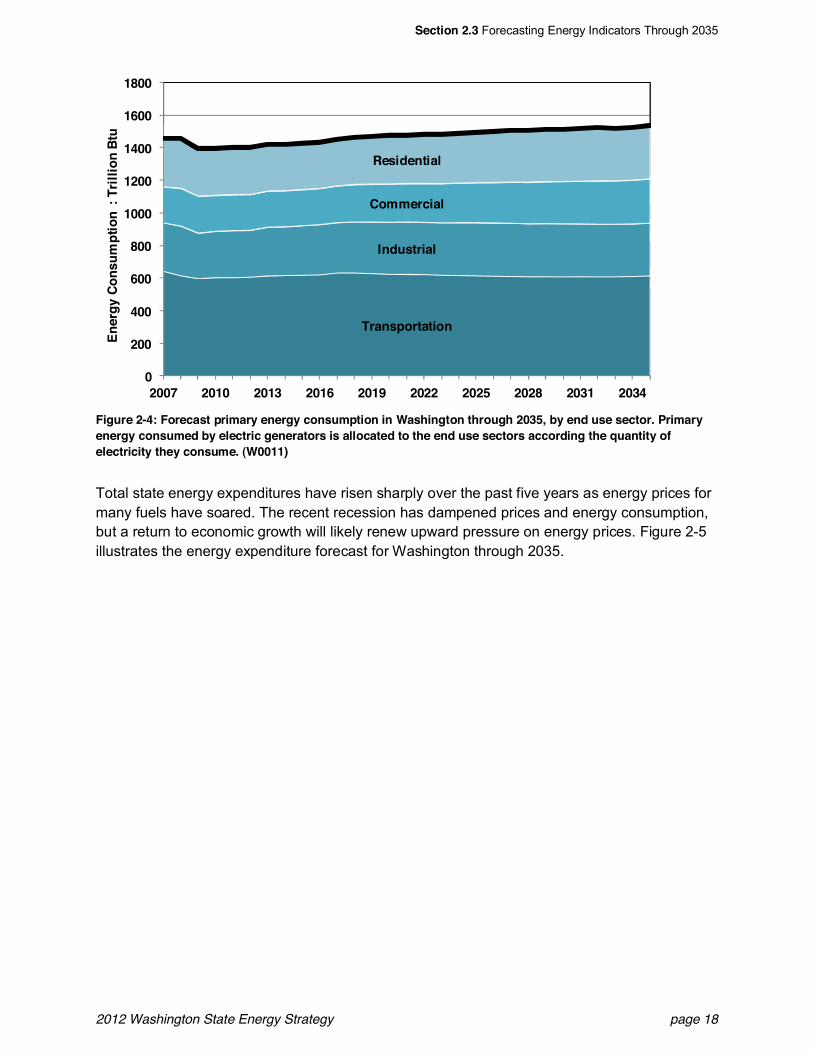
Section 2.3 Forecasting Energy Indicators Through 2035
2012 Washington State Energy Strategy page 18
Figure 2-4: Forecast primary energy consumption in Washington through 2035, by end use sector. Primaryenergy consumed by electric generators is allocated to the end use sectors according the quantity ofelectricity they consume. (W0011)
Total state energy expenditures have risen sharply over the past five years as energy prices formany fuels have soared. The recent recession has dampened prices and energy consumption,but a return to economic growth will likely renew upward pressure on energy prices. Figure 2-5illustrates the energy expenditure forecast for Washington through 2035.
Transportation
Industrial
Commercial
Residential
0
200
400
600
800
1000
1200
1400
1600
1800
2007 2010 2013 2016 2019 2022 2025 2028 2031 2034
Ener
gy C
onsu
mpt
ion
: Tril
lion
Btu
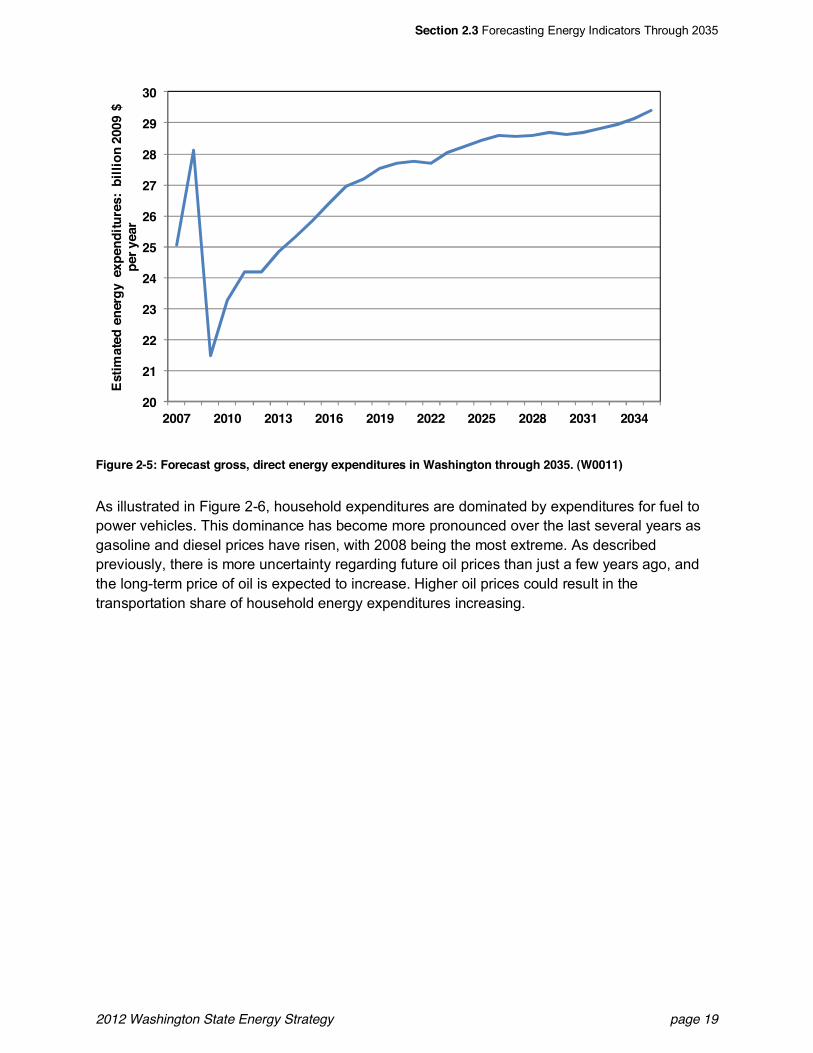
Section 2.3 Forecasting Energy Indicators Through 2035
2012 Washington State Energy Strategy page 19
Figure 2-5: Forecast gross, direct energy expenditures in Washington through 2035. (W0011)
As illustrated in Figure 2-6, household expenditures are dominated by expenditures for fuel topower vehicles. This dominance has become more pronounced over the last several years asgasoline and diesel prices have risen, with 2008 being the most extreme. As describedpreviously, there is more uncertainty regarding future oil prices than just a few years ago, andthe long-term price of oil is expected to increase. Higher oil prices could result in thetransportation share of household energy expenditures increasing.
20
21
22
23
24
25
26
27
28
29
30
2007 2010 2013 2016 2019 2022 2025 2028 2031 2034
Estim
ated
ene
rgy
expe
nditu
res:
bill
ion
2009
$pe
r yea
r
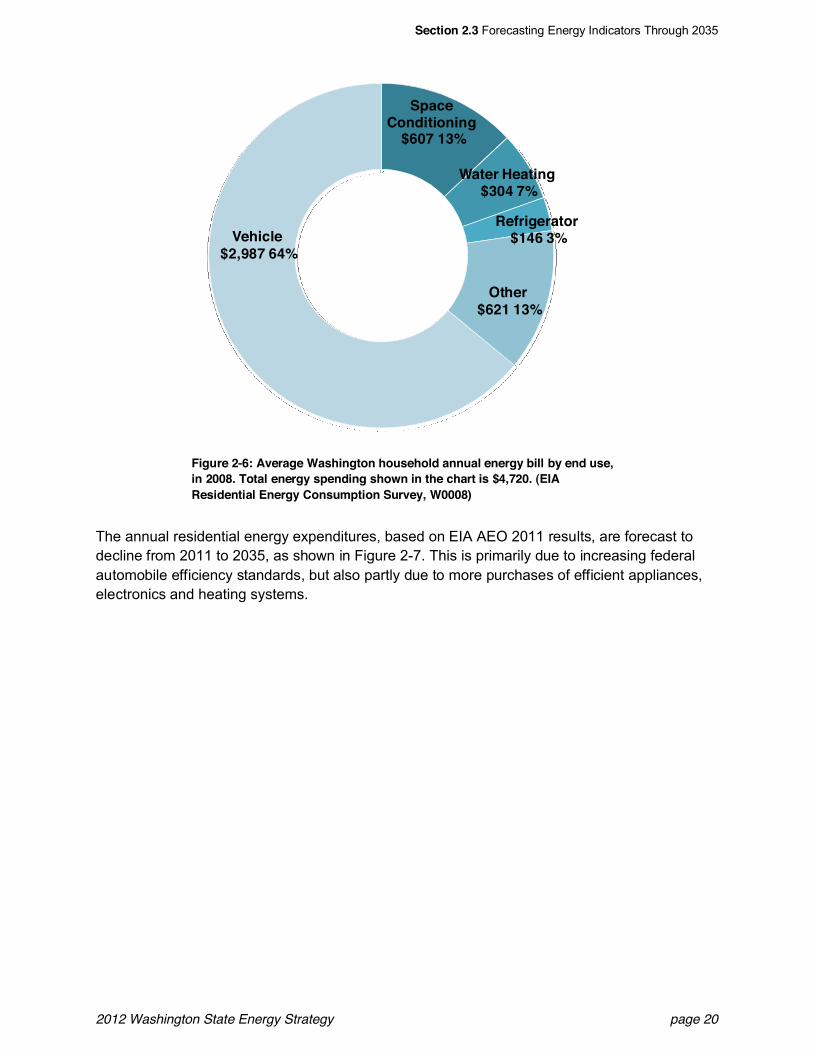
Section 2.3 Forecasting Energy Indicators Through 2035
2012 Washington State Energy Strategy page 20
Figure 2-6: Average Washington household annual energy bill by end use,in 2008. Total energy spending shown in the chart is $4,720. (EIAResidential Energy Consumption Survey, W0008)
The annual residential energy expenditures, based on EIA AEO 2011 results, are forecast todecline from 2011 to 2035, as shown in Figure 2-7. This is primarily due to increasing federalautomobile efficiency standards, but also partly due to more purchases of efficient appliances,electronics and heating systems.
SpaceConditioning
$607 13%
Water Heating$304 7%
Refrigerator$146 3%
Other$621 13%
Vehicle$2,987 64%
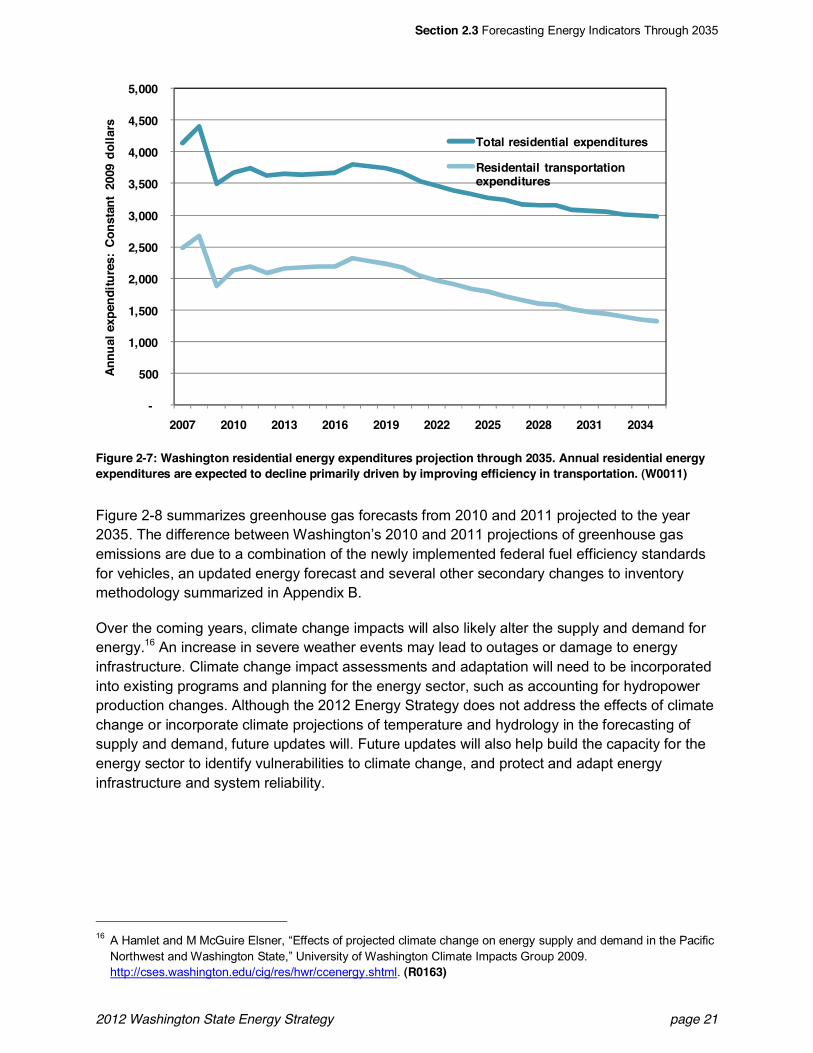
Section 2.3 Forecasting Energy Indicators Through 2035
2012 Washington State Energy Strategy page 21
Figure 2-7: Washington residential energy expenditures projection through 2035. Annual residential energyexpenditures are expected to decline primarily driven by improving efficiency in transportation. (W0011)
Figure 2-8 summarizes greenhouse gas forecasts from 2010 and 2011 projected to the year2035. The difference between Washington s 2010 and 2011 projections of greenhouse gasemissions are due to a combination of the newly implemented federal fuel efficiency standardsfor vehicles, an updated energy forecast and several other secondary changes to inventorymethodology summarized in Appendix B.
Over the coming years, climate change impacts will also likely alter the supply and demand forenergy.16 An increase in severe weather events may lead to outages or damage to energyinfrastructure. Climate change impact assessments and adaptation will need to be incorporatedinto existing programs and planning for the energy sector, such as accounting for hydropowerproduction changes. Although the 2012 Energy Strategy does not address the effects of climatechange or incorporate climate projections of temperature and hydrology in the forecasting ofsupply and demand, future updates will. Future updates will also help build the capacity for theenergy sector to identify vulnerabilities to climate change, and protect and adapt energyinfrastructure and system reliability.
16 A Hamlet and M McGuire Elsner, Effects of projected climate change on energy supply and demand in the PacificNorthwest and Washington State, University of Washington Climate Impacts Group 2009.http://cses.washington.edu/cig/res/hwr/ccenergy.shtml. (R0163)
-
500
1,000
1,500
2,000
2,500
3,000
3,500
4,000
4,500
5,000
2007 2010 2013 2016 2019 2022 2025 2028 2031 2034
Annu
al e
xpen
ditu
res:
Con
stan
t 20
09 d
olla
rs
Total residential expenditures
Residentail transportationexpenditures
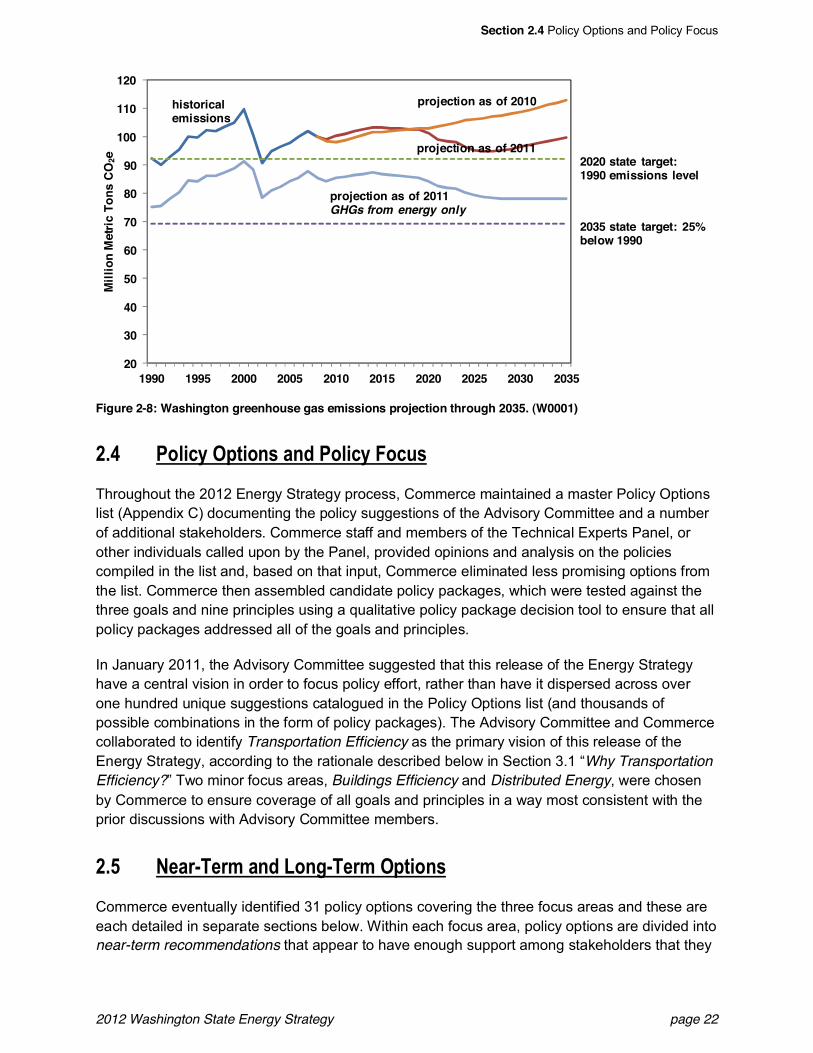
Section 2.4 Policy Options and Policy Focus
2012 Washington State Energy Strategy page 22
Figure 2-8: Washington greenhouse gas emissions projection through 2035. (W0001)
A4E C'$5.=&U?+5'*,&"*1&C'$5.=&T'.;,
Throughout the 2012 Energy Strategy process, Commerce maintained a master Policy Optionslist (Appendix C) documenting the policy suggestions of the Advisory Committee and a numberof additional stakeholders. Commerce staff and members of the Technical Experts Panel, orother individuals called upon by the Panel, provided opinions and analysis on the policiescompiled in the list and, based on that input, Commerce eliminated less promising options fromthe list. Commerce then assembled candidate policy packages, which were tested against thethree goals and nine principles using a qualitative policy package decision tool to ensure that allpolicy packages addressed all of the goals and principles.
In January 2011, the Advisory Committee suggested that this release of the Energy Strategyhave a central vision in order to focus policy effort, rather than have it dispersed across overone hundred unique suggestions catalogued in the Policy Options list (and thousands ofpossible combinations in the form of policy packages). The Advisory Committee and Commercecollaborated to identify Transportation Efficiency as the primary vision of this release of theEnergy Strategy, according to the rationale described below in Section 3.1 Why TransportationEfficiency? Two minor focus areas, Buildings Efficiency and Distributed Energy, were chosenby Commerce to ensure coverage of all goals and principles in a way most consistent with theprior discussions with Advisory Committee members.
A4F W%"6X!%63&"*1&V'*2X!%63&U?+5'*,
Commerce eventually identified 31 policy options covering the three focus areas and these areeach detailed in separate sections below. Within each focus area, policy options are divided intonear-term recommendations that appear to have enough support among stakeholders that they
20
30
40
50
60
70
80
90
100
110
120
1990 1995 2000 2005 2010 2015 2020 2025 2030 2035
Mill
ion
Met
ric T
ons
CO2e
historicalemissions
projection as of 2010
2020 state target:1990 emissions level
projection as of 2011
projection as of 2011GHGs from energy only
2035 state target: 25%below 1990
Section 2.6 Analysis Principles
2012 Washington State Energy Strategy page 23
can be implemented or launched in one to two years, and long-term policy options that requirecontinued analysis, negotiation, or both.
Near-term recommendations conclude with a recommendation for implementation generallyintended for action over the next two years, though some may extend as long as the nextWashington State Energy Strategy in 2015.The recommendations contain a mix of approaches,including the reinforcement or expansion of existing activities ( continue to or increase ),specific new actions ( amend, adopt, launch ) or, in a few instances, a longer listing ofoptions for consideration.
Near-term recommendations are intended to be mutually compatible such that the state couldmove forward on all of them simultaneously, as a complete and consistent package. Somenear-term recommendations can be implemented within existing programs and budgets, whileothers may require new authorizations or appropriations.
Long-term policy options conclude with a recommendation for next steps generally intendedfor action beyond two years. Items in the long-term category are ones that often require moreanalysis, research or pilot testing, may need significant additional funds to undertake, or thatmay require substantial actions by other private or public sector organizations that are not likelyto happen in the next two years.
Long-term policy options are only options, so they may be mutually exclusive. They should notbe envisioned as a policy package the way the near-term recommendations can be. In somecases, the long-term options may even be eventual replacements of one or more near-termrecommendations.
A4G -*"$=,5,&C65*.5?$%,
As the Energy Strategy evolves in future editions, the state s quantitative analysis of competingpolicy options will follow an integrated framework designed by the Technical Experts Panel earlyin the process and described in more detail in Section 8.3.1. For the 2012 Energy Strategy,however, Commerce has depended heavily on existing analyses on a policy-by-policy basis,supplemented by new analysis from the State Energy Office and members of the TechnicalExperts Panel. To keep reported results as sound and consistent as possible, Commerce choseexisting research and designed its own analyses following a few principles.
! Forecasts of policy impacts are based on energy demand and price forecasts supplied bythe EIA, except where more accurate regional data can be supplied by a local organizationsuch as the Northwest Power and Conservation Council or Puget Sound Regional Council;
! Sensitivity of analysis outcomes are tested against the four futures described during theSeptember 2010 Scenario Planning Workshop; and
! Greenhouse gases and economic costs are considered on a lifecycle basis where possible.Renewable energy resources are recognized to have greenhouse gas emissions associatedwith facility construction and fuel refining; indirect economic impacts and job creation areweighed together with the direct cost of energy.
Section 3.1 Why Transportation Efficiency?
2012 Washington State Energy Strategy page 24
)>"?+%6&D &-17"*.5*2&!6"*,?'6+"+5'*&9((5.5%*.=
D4@ P>=&!6"*,?'6+"+5'*&9((5.5%*.=ZIn January 2011, the Advisory Committee decided that this release of the Energy Strategyshould have a central vision in order to focus policy effort in a thoughtful, coordinated andeffective way. During the month of February Commerce brainstormed various possible themesand, on March 10, brought a suggested vision of Transportation Efficiency to the AdvisoryCommittee.
Washington, and the Pacific Northwest in general, has a long and successful history ofdescribing, measuring and implementing electric energy efficiency measures as an energyresource, with strong analytic and policy support from the Northwest Power and ConservationCouncil. The Transportation Efficiency theme is an opportunity to apply that experience andexpertise to the other half of the energy system.
In Washington, utilities with at least 25,000 customers are required by law to obtain all cost-effective conservation. Additionally, the Bonneville Power Administration supplies at least somepower to nearly all utilities in Washington, and is required by federal law to make cost-effectiveenergy efficiency a priority. Hence, a large amount of the low hanging fruit of energy efficiencyhas been picked in the electric sector. There is no similar legal framework in the transportationsector, so there is a large and exciting potential for new analysis and discovery there.
An examination of the primary sources of and demands for energy in Washington (Figure 2-1)highlights the potential for efficiency within the transportation sector. The vast majority of energyused is never applied to moving vehicles and ends up being lost as waste heat. The primaryreason for that loss is that the majority of vehicles in use are direct-drive internal combustionengines, which deliver, on average, barely 25 percent of the energy in the fuel to the wheels onthe road. New federal CAFE standards promise a substantial improvement in that number.Meanwhile, hybrid electric vehicles are becoming commonplace after the introduction of theToyota Prius, while the Nissan Leaf appears to be signaling a similar rollout of consumer-oriented, all-electric vehicles. Significant electrification of the transportation sector seemsimminent, and a focus on this in the 2012 Energy Strategy will help the state to prepare.
Figure 2-1 also shows that 44 percent of the state s end use energy consumption is in thetransportation sector. Not visible in the diagram is the relatively high cost of transportationenergy: 60 percent of the state s energy expenditures are in the transportation sector.17 Thefigure shows that the vast majority of Washington s petroleum use comes from thetransportation sector. Therefore, a significant fraction of that 60 percent of energy spending isleaving the state s economy in the form of imported oil purchases.
National and international energy agencies indicate that there is considerable uncertainty andpotential volatility regarding future oil prices18 and that long-term oil production may be restricted
17 State energy data are all for calendar year 2008, drawn from the U.S. DOE s State Energy Data System, unlessotherwise noted. (R0117)
18 EIA 2011 Annual Energy Outlook, p. 61. (R0090)
Section 3.2 Building on Prior Work
2012 Washington State Energy Strategy page 25
by political decisions and limits on economic access to resources. 19 In the 2010 World EnergyOutlook, the International Energy Agency highlights the need to reduce the demand for oil toreduce the economic burden of oil use and vulnerability to supply disruptions.20 Washington haslittle ability to influence long-term world oil prices, but implementation of this Energy Strategycan make the state less dependent on oil, improve Washington s energy-related resiliency, andhelp keep people and business moving even while energy price volatility increases.
Energy efficiency has particular advantages for low-income and vulnerable populations. In theelectric sector, efficiency is widely known as a way to reduce home energy costs. Transportationefficiency can have an equally significant impact on the household budget, by not only reducingthe fuel requirements for family vehicles, but also by increasing the number of transportationoptions and reducing the number of trips required. However, some strategies to reduce energyconsumption and greenhouse gas emissions in the transportation system could result in costs tolow-income households. Before any strategies are implemented, further analysis of the impactsto low-income and vulnerable populations will be necessary.
Finally, transportation emissions account for 45 percent of the state s entire greenhouse gasinventory, including agricultural and industrial emissions, as well as energy consumption in non-transportation sectors.21
D4A L;5$15*2&'*&C65'6&P'6/
D4A4@ )$53"+%&-.+5'*&!%"3Commerce, in consultation with WSDOT, recommended that the Advisory Committee drawcandidate Energy Strategy policies from the transportation policy recommendations developedduring the state s Climate Action Team process in 2008. The 2008 recommendations are largelyconsistent with many of the policy options identified during the Energy Strategy process and,more importantly, they are the product of intensive stakeholder negotiations coupled withpreliminary analysis of costs and greenhouse gas impacts. The Transportation ImplementationWorking Group, a broad transportation stakeholders sub-group of the Climate Action Team,issued Reducing Greenhouse Gas Emissions and Increasing Transportation Choices for theFuture,22 which featured a set of recommendations as follows:
1. Expanding and Enhancing Transit, Rideshare and Commuter Choice1A: Washington Transportation Access Network1B: Enhancements to Urban Commute Trip Reduction and Rideshare Programs1C: Statewide Residential Trip Reduction Program
19 EIA 2011 Annual Energy Outlook, p. 61. (R0090)20 International Energy Agency, World Energy Outlook 2010, Executive Summary, p. 7. (R0091)21 Washington State Department of Ecology, Washington State Greenhouse Gas Emissions Inventory, 1990-2008.
Available at http://www.ecy.wa.gov/biblio/1002046.html. (S0027)22 See Appendix 4 of report at
http://www.ecy.wa.gov/climatechange/2008CATdocs/IWG/tran/110508_transportation_iwg_final_report.pdf(S0028)
Section 3.2 Building on Prior Work
2012 Washington State Energy Strategy page 26
2. Compact and Transit Oriented Development Recommendations2A: Promote and Support Housing and Employment Density2B: Develop and Provide Parking Incentives and Management2C: Encourage Bicycle and Pedestrian Accessibility2D: Encourage Urban Brownfield Redevelopment2E: Transportation Concurrency
3. Climate Change and Transportation Funding Crisis and Opportunity3A: Align Investments and Operations with the Achievement of the VMT and Greenhouse
Gas Reductions of ESSHB 281523
3B: Pursue New Revenue Sources to Support Transportation Choices
4. Use Transportation Pricing To Meet the Goals
5. Non-VMT Recommendations to Reduce Greenhouse Gas Emissions5A: Improvements to Freight Railroads and Intercity Passenger Railroads5B: Diesel Engine Emission Reductions and Fuel Efficiency Improvements5C: Transportation Systems Management5D: Vehicle Electrification5E: Evaluate and Implement a Low--Carbon Fuel Standard
The Climate Action Team's recommendations were not offered in any particular order of priority.Commerce constructed its preliminary Transportation Efficiency policy package by beginningwith this set of recommendations, reevaluating and adjusting them according to events since theClimate Action Team process took place, and adding new initiatives from the Policy Options list.
D4A4A AN@@&9*%62=&<+6"+%2=&O?1"+%
Several initiatives in the 2011 Energy Strategy Update24 affected transportation energy policy.
! Energy-aware growth management
! Electric vehicle charging station siting
! Uniform regulatory protection for charging stations
! Amending Washington s renewable fuels standard (RFS)
! Compressed natural gas
The third item, uniform regulatory protection for charging stations, has already been fullyimplemented.25 Work on the four remaining initiatives continues and a detailed status update is
23 ESSHB 2815 has since been codified in RCW 47.01.440 relating to VMT goals, and RCW 70.235.020 relating togreenhouse gas targets. VMT means Vehicle Miles Traveled. Climate Action Team recommendation 3A states thattransportation investments and operations need to be aligned both with legislated greenhouse gas targets and withlegislated VMT reduction benchmarks.
24 Available at http://www.commerce.wa.gov/site/1327/default.aspx. (S0029)
Section 3.2 Building on Prior Work
2012 Washington State Energy Strategy page 27
available in Section 7.4 of this document. The 2012 Energy Strategy does not replace ordisplace any of the recommendations made in the 2011 Update, though it does provideadditional recommendations in the cases of growth management and Washington s RFS.
D4A4D ?";,-9)@4*8,-9+"-&"*1&<;,+"5*"#$%&!6"*,?'6+"+5'*The Moving Washington framework and the approach to sustainable transportation connect wellwith the 2012 Energy Strategy s emphasis on transportation efficiency.
K'75*2&P",>5*2+'*
Washington s economic vitality and livability depend on reliable, responsible and sustainabletransportation. Moving Washington is WSDOT s approach for creating an integrated, 21stcentury transportation system. It represents the state s framework for making transparent, cost-effective decisions that keep people and goods moving and support a healthy economy,environment and communities. Moving Washington reflects the state s transportation goals andobjectives for planning, operating and investing. State law directs public investments intransportation to support economic vitality, preservation, safety, mobility, the environment andsystem stewardship.26 The Moving Washington program identifies the state s highesttransportation priority as maintaining and preserving the safe and long-lasting performance ofexisting infrastructure, facilities and services.
Three essential transportation strategies work together to integrate investments, resulting incost-effective solutions: operate efficiently, manage demand and add capacity strategically.Many of these strategies are among those highlighted in the 2012 Energy Strategy.
Operate efficiently Strategies that improve operations get the most out of existing highwaysby using traffic management tools to optimize the flow of traffic and maximize available capacity.These strategies include utilizing traffic technologies such as ramp meters and other controltactics to improve traffic flow and reduce collisions, deploying incident responders to quicklyclear collisions, optimizing traffic signal timing to reduce delay and implementing low-cost, high-value enhancements to address immediate needs.
Manage demand Whether shifting travel times, using public transportation or reducing theneed to travel altogether, managing demand on overburdened routes allows the entire systemto function better. Strategies include variable rate tolling in ways that reduce traffic during themost congested times and balance capacity between express and regular lanes, improving theviability of alternate modes, and providing traveler information to allow users to move efficientlythrough the system.
Add capacity strategically Targeting the worst traffic hotspots or filling critical system gapsto best serve an entire corridor, community or region means fixing bottlenecks that constrain theflow. Upgrading a failing on-ramp merge or hard shoulder running during peak periods can freeup the flow of traffic through a busy corridor. From improving rail crossings and ferry service to
25 SHB 1571, 2011 Regular Session, as codified in RCW 80.28.26 RCW 47.04.280(1).
Section 3.2 Building on Prior Work
2012 Washington State Energy Strategy page 28
working with transit agencies to connect communities, from building direct-access ramps forcarpools and transit to including paths for pedestrians and bicyclists, capacity improvementsrequire strong partnerships with a shared vision for the corridor.
<;,+"5*"#$%&!6"*,?'6+"+5'*&"+&P<8U!
Sustainable transportation supports a healthy economy, environment and community, andadapts to weather extremes, diminished funding and changing priorities. Furthermore, asustainable transportation system is built to last, uses fewer materials and energy and isoperated efficiently.
WSDOT s sustainable transportation approach is consistent with the 2012 Energy Strategy andhelps reduce energy consumption and greenhouse gas emissions by focusing on four primarystrategies:
! Improve fuel - Support efforts to lower the carbon content of fuels and find alternative fuels.
! Advance vehicle and vessel technology - Improved vehicle and vessel technology will leadto vehicles and vessels that run on energy sources other than petroleum with higher rates ofefficiency.
! Support system efficiency - Operate the transportation system to maximize efficiency andimprove traffic flow.
! Manage demand for transportation - Actively support efficient transportation options such ascarpooling, vanpooling, working from home, taking transit, bicycling, walking or conductingactivities closer to home.
WSDOT is currently engaged in many efforts to reduce transportation emissions for the state asa whole. Through public-private partnerships, Washington is leading the charge toward cleanertransportation with a network of publicly accessible electric vehicle (EV) fast charging stationsalong Interstate 5 between Canada and Oregon, creating the nation s first Electric Highway.WSDOT invests in and promotes a variety of strategies for commute options, including the useof carpools, vanpools, buses, bicycling, walking, compressed work hours and working fromhome, for a more efficient transportation system. WSDOT has been administering the CommuteTrip Reduction Program since 1991 and incident response teams clear accidents to keep trafficmoving. The Ferries division deploys several strategies to decrease fuel consumption anddecrease emissions, such as using biodiesel blends and exploring the use of LNG in vessels, aswell as retrofitting a vessel with a hybrid electric engine.
D4A4E T%1%6"$&C'$5.=&M*5+5"+57%,
In July 2011, the Obama administration announced an agreement with automobilemanufacturers and autoworkers to move forward with aggressive new CAFE standards thatrequire a 5 percent annual increase to the average fuel economy of new light duty vehicles from2017 through 2025, and a 3.5 percent annual increase for light trucks. The new CAFEstandards will result in a combined 54.5 miles per gallon (mpg) rating for both classes of lightvehicle by model year 2025.
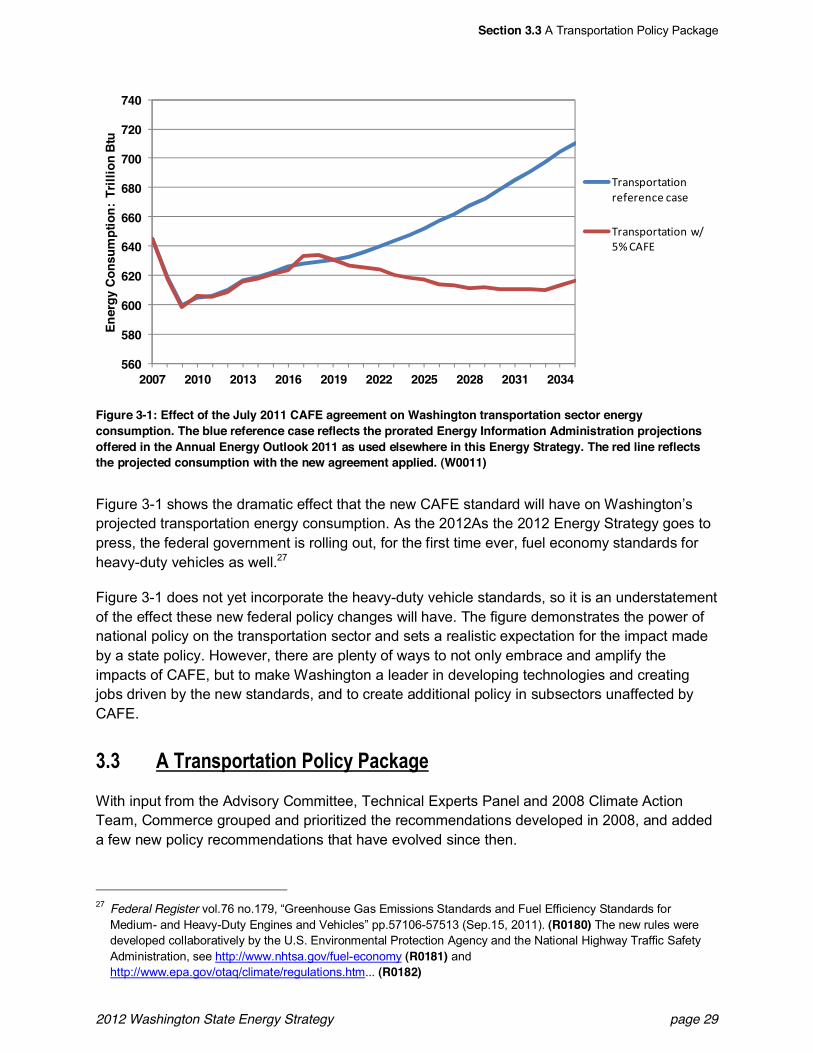
Section 3.3 A Transportation Policy Package
2012 Washington State Energy Strategy page 29
Figure 3-1: Effect of the July 2011 CAFE agreement on Washington transportation sector energyconsumption. The blue reference case reflects the prorated Energy Information Administration projectionsoffered in the Annual Energy Outlook 2011 as used elsewhere in this Energy Strategy. The red line reflectsthe projected consumption with the new agreement applied. (W0011)
Figure 3-1 shows the dramatic effect that the new CAFE standard will have on Washington sprojected transportation energy consumption. As the 2012As the 2012 Energy Strategy goes topress, the federal government is rolling out, for the first time ever, fuel economy standards forheavy-duty vehicles as well.27
Figure 3-1 does not yet incorporate the heavy-duty vehicle standards, so it is an understatementof the effect these new federal policy changes will have. The figure demonstrates the power ofnational policy on the transportation sector and sets a realistic expectation for the impact madeby a state policy. However, there are plenty of ways to not only embrace and amplify theimpacts of CAFE, but to make Washington a leader in developing technologies and creatingjobs driven by the new standards, and to create additional policy in subsectors unaffected byCAFE.
D4D -&!6"*,?'6+"+5'*&C'$5.=&C"./"2%
With input from the Advisory Committee, Technical Experts Panel and 2008 Climate ActionTeam, Commerce grouped and prioritized the recommendations developed in 2008, and addeda few new policy recommendations that have evolved since then.
27 Federal Register vol.76 no.179, Greenhouse Gas Emissions Standards and Fuel Efficiency Standards forMedium- and Heavy-Duty Engines and Vehicles pp.57106-57513 (Sep.15, 2011). (R0180) The new rules weredeveloped collaboratively by the U.S. Environmental Protection Agency and the National Highway Traffic SafetyAdministration, see http://www.nhtsa.gov/fuel-economy (R0181) andhttp://www.epa.gov/otaq/climate/regulations.htm... (R0182)
560
580
600
620
640
660
680
700
720
740
2007 2010 2013 2016 2019 2022 2025 2028 2031 2034
Ener
gy C
onsu
mpt
ion:
Tril
lion
Btu
!"#$%&'"(#()'$"*+*"*$,*-,#%*
!"#$%&'"(#()'$-./01-2345
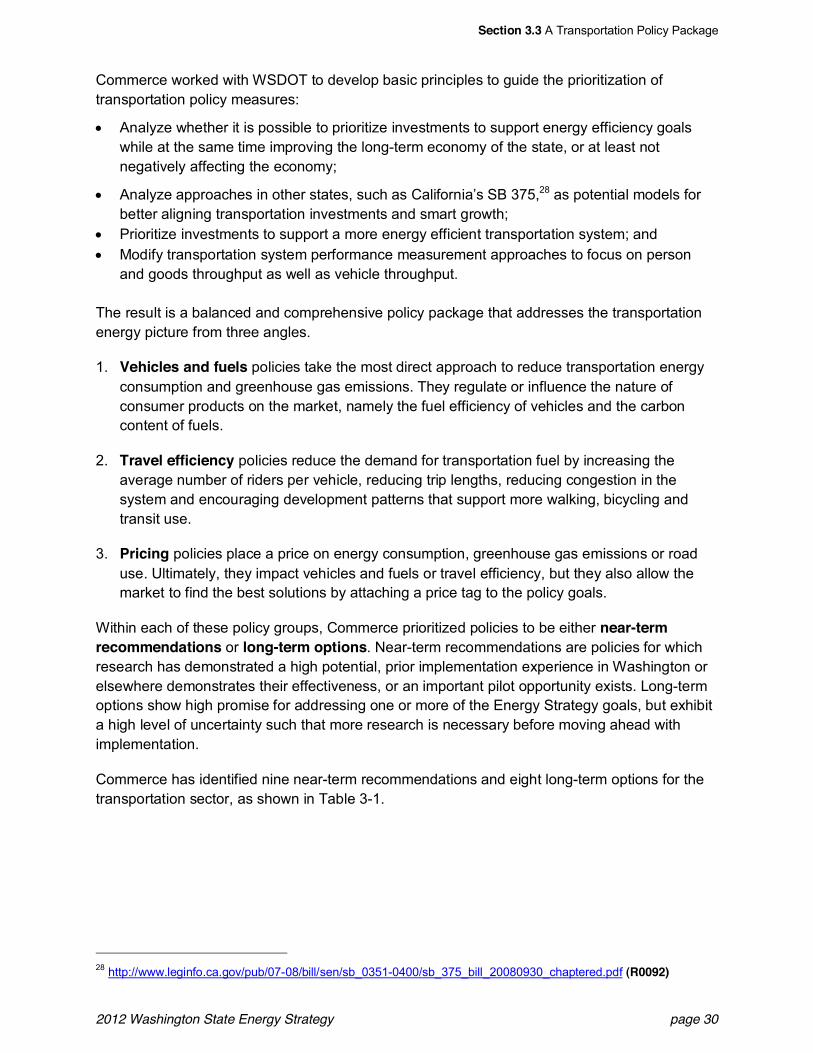
Section 3.3 A Transportation Policy Package
2012 Washington State Energy Strategy page 30
Commerce worked with WSDOT to develop basic principles to guide the prioritization oftransportation policy measures:
! Analyze whether it is possible to prioritize investments to support energy efficiency goalswhile at the same time improving the long-term economy of the state, or at least notnegatively affecting the economy;
! Analyze approaches in other states, such as California s SB 375,28 as potential models forbetter aligning transportation investments and smart growth;
! Prioritize investments to support a more energy efficient transportation system; and! Modify transportation system performance measurement approaches to focus on person
and goods throughput as well as vehicle throughput.
The result is a balanced and comprehensive policy package that addresses the transportationenergy picture from three angles.
1. Vehicles and fuels policies take the most direct approach to reduce transportation energyconsumption and greenhouse gas emissions. They regulate or influence the nature ofconsumer products on the market, namely the fuel efficiency of vehicles and the carboncontent of fuels.
2. Travel efficiency policies reduce the demand for transportation fuel by increasing theaverage number of riders per vehicle, reducing trip lengths, reducing congestion in thesystem and encouraging development patterns that support more walking, bicycling andtransit use.
3. Pricing policies place a price on energy consumption, greenhouse gas emissions or roaduse. Ultimately, they impact vehicles and fuels or travel efficiency, but they also allow themarket to find the best solutions by attaching a price tag to the policy goals.
Within each of these policy groups, Commerce prioritized policies to be either near-termrecommendations or long-term options. Near-term recommendations are policies for whichresearch has demonstrated a high potential, prior implementation experience in Washington orelsewhere demonstrates their effectiveness, or an important pilot opportunity exists. Long-termoptions show high promise for addressing one or more of the Energy Strategy goals, but exhibita high level of uncertainty such that more research is necessary before moving ahead withimplementation.
Commerce has identified nine near-term recommendations and eight long-term options for thetransportation sector, as shown in Table 3-1.
28 http://www.leginfo.ca.gov/pub/07-08/bill/sen/sb_0351-0400/sb_375_bill_20080930_chaptered.pdf (R0092)
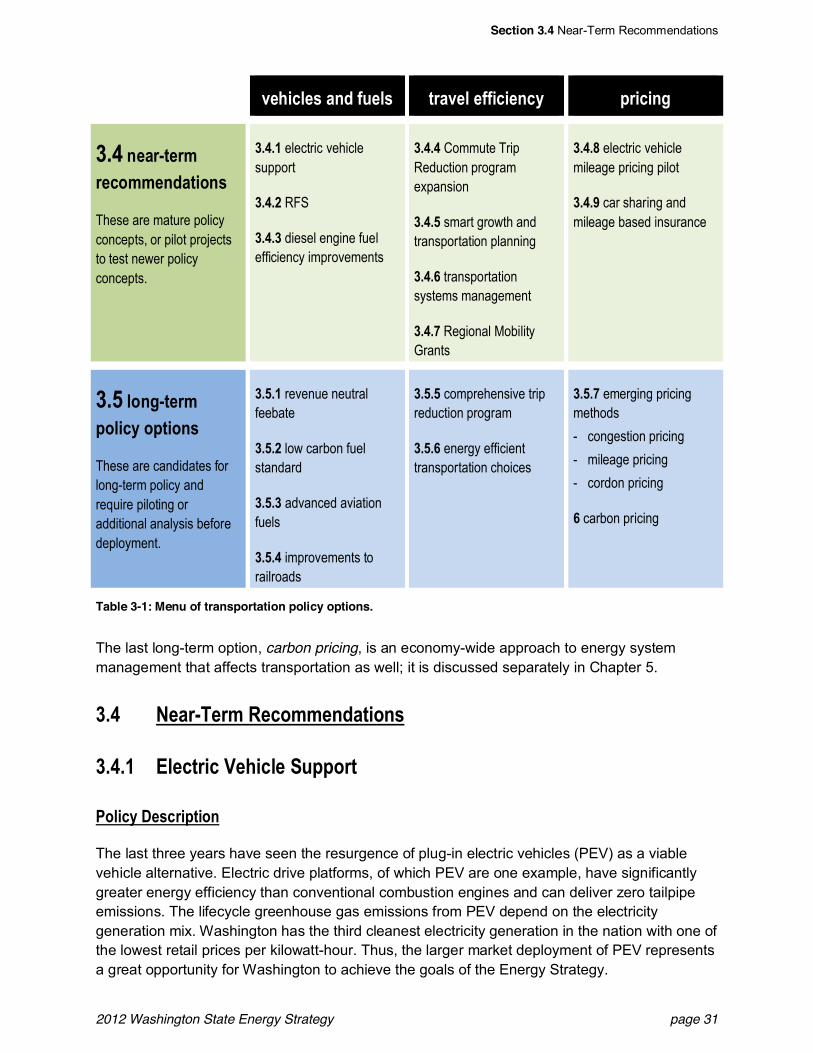
Section 3.4 Near-Term Recommendations
2012 Washington State Energy Strategy page 31
7%>5.$%,&"*1&(;%$, +6"7%$&%((5.5%*.= ?65.5*2
D4E&*%"6X+%636%.'33%*1"+5'*,
These are mature policyconcepts, or pilot projectsto test newer policyconcepts.
D4E4@ electric vehiclesupport
D4E4A RFS
D4E4D diesel engine fuelefficiency improvements
D4E4E Commute TripReduction programexpansion
D4E4F smart growth andtransportation planning
D4E4G transportationsystems management
D4E4H Regional MobilityGrants
D4E4I electric vehiclemileage pricing pilot
D4E4J car sharing andmileage based insurance
D4F&$'*2X+%63?'$5.=&'?+5'*,
These are candidates forlong-term policy andrequire piloting oradditional analysis beforedeployment.
D4F4@ revenue neutralfeebate
D4F4A low carbon fuelstandard
D4F4D advanced aviationfuels
D4F4E improvements torailroads
D4F4F comprehensive tripreduction program
D4F4G energy efficienttransportation choices
D4F4H emerging pricingmethods
- congestion pricing
- mileage pricing
- cordon pricing
G carbon pricing
Table 3-1: Menu of transportation policy options.
The last long-term option, carbon pricing, is an economy-wide approach to energy systemmanagement that affects transportation as well; it is discussed separately in Chapter 5.
D4E W%"6X!%63&Q%.'33%*1"+5'*,
D4E4@ 9$%.+65.&Y%>5.$%&<;??'6+
C'$5.=&8%,.65?+5'*
The last three years have seen the resurgence of plug-in electric vehicles (PEV) as a viablevehicle alternative. Electric drive platforms, of which PEV are one example, have significantlygreater energy efficiency than conventional combustion engines and can deliver zero tailpipeemissions. The lifecycle greenhouse gas emissions from PEV depend on the electricitygeneration mix. Washington has the third cleanest electricity generation in the nation with one ofthe lowest retail prices per kilowatt-hour. Thus, the larger market deployment of PEV representsa great opportunity for Washington to achieve the goals of the Energy Strategy.
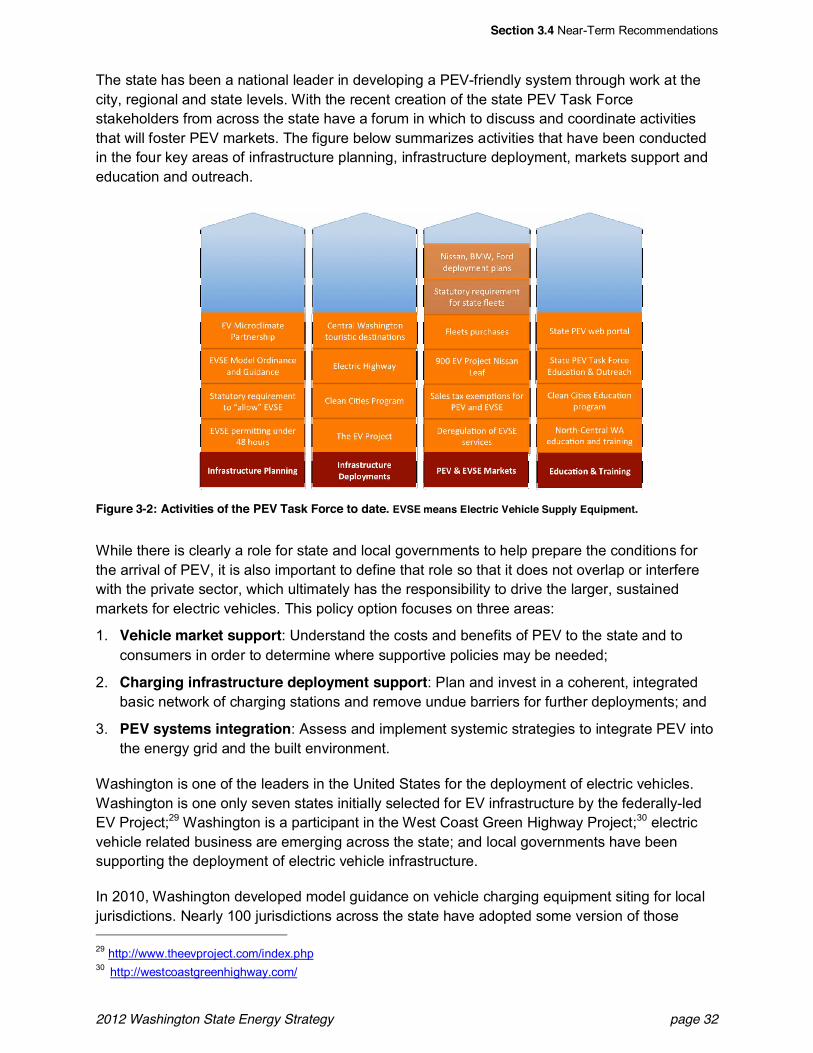
Section 3.4 Near-Term Recommendations
2012 Washington State Energy Strategy page 32
The state has been a national leader in developing a PEV-friendly system through work at thecity, regional and state levels. With the recent creation of the state PEV Task Forcestakeholders from across the state have a forum in which to discuss and coordinate activitiesthat will foster PEV markets. The figure below summarizes activities that have been conductedin the four key areas of infrastructure planning, infrastructure deployment, markets support andeducation and outreach.
Figure 3-2: Activities of the PEV Task Force to date. EVSE means Electric Vehicle Supply Equipment.
While there is clearly a role for state and local governments to help prepare the conditions forthe arrival of PEV, it is also important to define that role so that it does not overlap or interferewith the private sector, which ultimately has the responsibility to drive the larger, sustainedmarkets for electric vehicles. This policy option focuses on three areas:
1. Vehicle market support: Understand the costs and benefits of PEV to the state and toconsumers in order to determine where supportive policies may be needed;
2. Charging infrastructure deployment support: Plan and invest in a coherent, integratedbasic network of charging stations and remove undue barriers for further deployments; and
3. PEV systems integration: Assess and implement systemic strategies to integrate PEV intothe energy grid and the built environment.
Washington is one of the leaders in the United States for the deployment of electric vehicles.Washington is one only seven states initially selected for EV infrastructure by the federally-ledEV Project;29 Washington is a participant in the West Coast Green Highway Project;30 electricvehicle related business are emerging across the state; and local governments have beensupporting the deployment of electric vehicle infrastructure.
In 2010, Washington developed model guidance on vehicle charging equipment siting for localjurisdictions. Nearly 100 jurisdictions across the state have adopted some version of those
29 http://www.theevproject.com/index.php30 http://westcoastgreenhighway.com/
Section 3.4 Near-Term Recommendations
2012 Washington State Energy Strategy page 33
standards. In 2011, Washington enacted legislation to exempt charging facilities from utility-levelregulation an important step in encouraging private sector development of PEV infrastructure.Washington State government is also a major contributor to the deployment of PEV chargingfacilities through creation of the nation s first electric vehicle highways on Interstate 5 and U.S.Highway 2.31,32
Finally, the energy and emissions reductions benefits associated with electric vehicles are notlimited to light duty vehicles. Electrically powered transit vehicles (such as King County s trolleybuses) reduce emissions and energy consumption. The infrastructure to support electricallypowered trolley buses and other electrically powered transit should be expanded as well.
C6%75';,&Q%,%"6.>&"*1&9:?%65%*.%
In 2011, Governor Gregoire asked Commerce to collaborate with WSDOT to convene a statePEV Task Force. The Task Force now serves as the statewide forum for PEV policy anddeployment planning. Since early 2011, the PEV Task Force has discussed the actions neededto support the deployment of PEV in Washington. Most of the Task Force s thinking wasconsolidated into a proposal submitted to the U.S. Department of Energy in June 2011.Although this competitive proposal was not funded, that document outlines in more detail muchof the progress on PEV to date and the gaps moving forward. In addition, the WesternWashington Clean Cities coalition was awarded $15 million from DOE for alternative vehicledevelopment activities including EVs.33
Electrically powered transit can be much more energy efficient than other modes oftransportation. In addition, because Washington s electric power is much cleaner than most ofthe country s, the greenhouse gas emissions associated with electrically powered transit can bevery low. For example, one estimate of the greenhouse gas emissions for King County MetroTransit s electrically powered trolley buses indicates that trolley bus emissions per passengermile are about one-fourth the emissions of standard buses.34
W%0&-*"$=,5,
No new analysis on this topic was conducted for the 2012 Energy Strategy.
M3?$%3%*+"+5'*! To inform policymaking, maintain an updated model of the lifecycle cost of PEV ownership
compared to other vehicle platforms.
31 Light-Duty Vehicle and Fuel Technology, June 2011 athttp://www.commerce.wa.gov/DesktopModules/CTEDPublications/CTEDPublicationsView.aspx?tabID=0&ItemID=9591&MId=863&wversion=Staging
32 For more information on Washington s electric vehicle activities see the Electric Drive WA website atwww.electricdrive.wa.gov
33 www.wwcleancities.org/34 King County Trolley buses emissions per passenger mile:
http://www.dot.state.ri.us/documents/enviro/Climate_Change_Workshop_Presentation_4-14-10.pdf
Section 3.4 Near-Term Recommendations
2012 Washington State Energy Strategy page 34
! Assess the role of government investments in charging infrastructure and determine theinfrastructure needed to support and accompany the larger market deployment of PEV. Aspart of this task, complete installation and assess the impact of the I-5 and Highway 2vehicle charging station program (installation to be completed in late 2011 with assessmentactivities to follow).
! Work with the states and provinces in the Pacific Coast Collaborative to develop a groupelectric vehicle purchase request for public fleets.35 If this effort is successful private fleetswould also be encouraged to acquire electric vehicles.
! Integrate PEV into discussions about electric infrastructure and generation policy in the statein order to identify synergies and potential challenges.
! Compete for federal funding to expand the deployment of electric vehicles and infrastructurein the state, including electrically powered transit.
! Promote the development of electric vehicle equipment manufacturing facilities, followingexamples such as the September 2011 opening of the SGL Automotive Carbon Fiberproduction facilities for BMW electric vehicles in Moses Lake.
D4E4A Q%*%0"#$%&T;%$,&<+"*1"61
C'$5.=&8%,.65?+5'*
In 2006, the Washington State Legislature passed an RFS requiring gross diesel fuel salesstatewide to consist of at least 2 percent biodiesel or renewable diesel, and gasoline sales toconsist of at least 2 percent ethanol, by December 2008. Federal fuel content requirements forethanol have since rendered the state s ethanol standard irrelevant. The biodiesel requirementhas not been met due in part to a lack of legislated enforcement authority, but also due to thehigh administrative burden associated with a volumetric requirement versus the more commonuniversal requirement that has been successfully implemented in other states.36
The incapacity to realize the state s biodiesel consumption goals through a volume-based RFSled to legislative initiatives in the 2010 and 2011 sessions calling for transition to a universalcontent requirement. These efforts were unsuccessful, largely due to concerns over potentiallyhigher fuel prices, fuel quality, engine performance and fuel distribution infrastructure.
As shown by the successful implementation of a universal 5 percent biodiesel (B5) requirementin Oregon, which is dependent upon Washington refineries and wholesale distributors for its fuelsupply, these concerns have largely been addressed. Biodiesel producers are consistentlyproviding high-quality fuel, distributors are becoming familiar with proper storage and handlingpractices, and nearly all major engine manufacturers support the use of low-level biodieselblends in their equipment. Petroleum distributors continue to add biodiesel storage and blending
35 http://www.pacificcoastcollaborative.org/Pages/Welcome.aspx36 A volumetric mandate requires that a minimum fraction of total, annual fuel sales consist of the renewable fuel.
Verifying a volumetric mandate requires certification and tracking of all blendstocks entering the fuel supplythroughout the year. A universal mandate requires that fuel dispensed at any pump at any time contain a minimumfraction of the renewable fuel, and can be verified by random testing.
Section 3.4 Near-Term Recommendations
2012 Washington State Energy Strategy page 35
infrastructure to meet the biodiesel content requirements in Oregon and British Columbia, andB5 is now cost competitive and, in some cases, less expensive than diesel.37
Low-level biodiesel blends are also proving viable in other sectors, from rail and maritime tohome heating and industrial uses. Field trials by Burlington Northern Santa Fe, Amtrak,Canadian Pacific38 and others have demonstrated successful use of biodiesel blends in diesellocomotives, and biodiesel use for home heating (bioheat) is growing rapidly in many northernstates.
Biofuels for aviation are also being developed in Washington; this topic is addressed separatelyin long-term policy option Advanced Aviation Fuels, Section 3.5.3. These advanced processingtechnologies will yield a variety of co-products, including renewable diesel and gasoline,lubricants and precursor chemicals. Building markets for these products will help ensureaviation biofuels become cost-competitive. Both biodiesel and renewable diesel qualify for RFScompliance in Washington. Enabling the RFS to function properly as a universal contentrequirement will help support the development of aviation biofuels.
State agency use of biodiesel is helping to resolve issues associated with fuel distribution,handling and storage. With recent enhancements to the state s procurement process, agenciescontinue to make significant progress toward meeting the requirement for 20 percent annualbiodiesel use under Revised Code of Washington (RCW) 43.19.642. Washington State Ferries,which accounts for 87 percent of agency diesel consumption, conducted extensive field trialsand is successfully using B5 in two-thirds of their fleet. The remaining vessels will begin usingbiodiesel in 2012. Ferries plans to use 20 percent biodiesel in its fuel supply as soon as budgetsallow. Biodiesel use by other state agencies has increased nearly three-fold in the last twoyears. The latest biannual report39 from the Department of Enterprise Services shows biodieseluse by agencies other than Ferries has now reached 12 percent.
Washington is home to an innovative and motivated biodiesel industry; a more successfulbiodiesel standard would encourage further development of this industry in the state. Thoughthere is ongoing debate about the exact degree of reductions, biofuels can reasonably beexpected to deliver at least modest greenhouse gas emissions reductions relative to fossilfuels.40 Commerce proposes to support reasonable legislation in the 2012 legislative sessionthat converts the existing, volume-based RFS to the universal standard that has provensuccessful in other states.
37 Analysis by the Washington Trucking Associations documented a price premium of 4.7¢/gal for B2 relative to ultralow sulfur diesel (ULSD) in Spokane, WA over an 8-month period beginning in June 2010 (March 3 2011 memo onSSB 5478, S0091). Energy Office tracking of diesel and biodiesel prices (W0012) shows the magnitude of pricevolatility to eclipse the magnitude of the systematic difference. Moreover, prices for B5 are likely to be slightlylower than B2 due to the existing, large market for this product in Oregon, and due to the absence of handlingcharges that would come with a universal (rather than volumetric) standard.
38 www.cpr.ca/en/in-your-community/environment/Documents/CP-Biodiesel-Demonstration-Final-Report-June-2010.pdf(R0183)
39 www.ga.wa.gov/News/2011-01-BiodieselReport.pdf (S0079)40 Biodiesel blends can also provide fuel efficiency improvements to engines by increasing fuel lubricity.
Section 3.4 Near-Term Recommendations
2012 Washington State Energy Strategy page 36
C6%75';,&Q%,%"6.>&"*1&9:?%65%*.%
The U.S. Environmental Protection Agency (EPA) is implementing a federal RFS as part of theEnergy Independence and Security Act of 2007 (EISA). The federal approach includes not onlyrequirements on the content of renewable fuel by volume, but also on the carbon intensity ofthese fuels. Carbon intensity is the total amount of carbon emitted into the atmosphere for eachgallon of fuel, including extraction, refining, and ultimately combustion in the vehicle. In an effortto obtain better estimates of carbon intensity, the EPA has analyzed numerous fuel productionpathways. For example, canola oil is a key raw material for biodiesel produced in Washington.In 2010, the EPA published its determination that canola oil biodiesel meets the lifecyclegreenhouse gas emission reduction threshold of 50 percent required by the EISA, putting it onequal footing with biodiesel made from soy oil, algal oil and waste oils, fats and greases.
A number of additional incentives for biofuels available in Washington provide important relatedexperience, including:41
-$+%6*"+57%&T;%$&V'"*,&"*1&S6"*+,! The Energy Freedom Program was established in 2006 through the Washington State
Department of Agriculture to promote public research and development in bioenergy and tostimulate the construction of facilities in Washington to generate energy from farm sourcesor convert organic matter into fuels. Nearly $11 million was appropriated for the EnergyFreedom Account, primarily in low-interest loans, to support oilseed crushing and biodieselprocessing around the state. Responsibility for future awards was transferred to Commercein 2007, but no additional appropriations have been made and all repayments of initial loanshave been recaptured for the state General Fund. The Program also includes the GreenEnergy Incentive Account, which provides financial assistance for alternative fuelinginfrastructure along Interstate corridors. Funds have yet to be appropriated for this account.The Program is set to expire June 30, 2016.42
! Biofuel Distribution Incentives
! Equipment and related services used for the retail sale of B20 or higher biodiesel blends orE85 motor fuel are exempt from state sales and use taxes. Fuel delivery vehicles andrelated services are exempt from state sales and use taxes if at least 75 percent of the fuelis B20 or higher biodiesel blends or E85 motor fuel. These exemptions expire July 1, 2015.43
! A business and occupation tax deduction is available for the sale or distribution of biodieselor E85 motor fuel. This deduction is available until July 1, 2015.44
! Sales and use of non-highway biodiesel and biodiesel blends by farm fuel users is exemptfrom retail sales and use taxes.45
41A summary of these incentives can be found on the website of the Alternative Fuels and Advanced Vehicles DataCenter of the U.S. Department of Energy (http://www.afdc.energy.gov/afdc/laws/laws/WA/tech/3251). (R0093)42 RCW 43.32543 RCW 82.08.955 and 82.12.95544 RCW 82.04.433445 RCW 82.08.865 and 82.12.865
Section 3.4 Near-Term Recommendations
2012 Washington State Energy Strategy page 37
L5'(;%$,&C6'1;.+5'*&M*.%*+57%,! Qualifying buildings, equipment and land used in the manufacturing of alcohol fuel, biodiesel
or wood biomass fuels or for biodiesel feedstocks are exempt from state and local propertyand leasehold excise taxes for a period of six years from the date the facility becomesoperational. This incentive expires December 31, 2015.46
! A reduced business and occupation tax rate is available to manufacturers of wood biomassfuel.47
! Waste vegetable oil, specifically cooking oil gathered from restaurants or commercial foodprocessors, used to produce biodiesel for personal use is exempt from state sales and usetaxes.48
! A business and occupation tax credit of $3 per ton through June 30, 2013, then $5 per tonthrough June 30, 2015, is provided for forest-derived biomass used for the production ofbiofuel.49
! The sale and use of forest materials for biofuel production is exempt from state sales anduse taxes through June 30, 2013.50
W%0&-*"$=,5,
No new analysis of this policy option was conducted for the 2012 Energy Strategy.
M3?$%3%*+"+5'*! Amend existing law to require universal 5 percent biodiesel or renewable diesel content in
diesel.
! Exempt emergency backup generators due to long-term fuel storage concerns.
! Consider provisions allowing for seasonal or geographic exemptions for blends below the 5percent requirement due to addition of cold weather fuel treatments.
! Explore the benefits of restoring the recently expired B&O tax rate reduction for biodieseland renewable diesel producers in order to stimulate advanced biofuel industrydevelopment.
! Conduct a comprehensive biofuel incentives study toward rationalizing Washington s biofuelpolicy.
46 RCW 82.29A.135 and 84.36.63547 RCW 82.04.260(1)(f)48 RCW 82.08.0205 and 82.12.020549 RCW 82.04.449450 RCW 82.08.956, 82.08.957, 82.12.956 and 82.12.957
Section 3.4 Near-Term Recommendations
2012 Washington State Energy Strategy page 38
D4E4D 85%,%$&9*25*%&T;%$&9((5.5%*.=&M3?6'7%3%*+,
C'$5.=&8%,.65?+5'*
The Department of Ecology (Ecology) identified a variety of technology-based strategies thatimprove the fuel efficiency of diesel-powered vehicles or provide alternatives to diesel fuel use.These strategies include:
! Eliminating unnecessary engine idle time by introducing or expanding the use of anti-idlingtechnologies;
! Improving the fuel efficiency of existing diesel vehicles and equipment by replacinginefficient older engines with new, more fuel efficient engines; or by modifying existingengines to increase their efficiency;
! Increasing the use of low viscosity lubricants and technologies that reduce rolling resistance(such as single wide tires), reducing weight and improving aerodynamics;
! Replacing freight handling equipment with battery electric, hybrid or plug-in electric hybridequipment;
! Installing electrification infrastructure for the goods movement sector, such as providingaccess to electricity pedestals for truckers at rest stops across interstate highways;
! Increase use of more efficient diesel buses, such as hybrid buses;
! As discussed in other sections of the 2012 Energy Strategy, augmenting or replacingpetroleum fuel use with biodiesel, biogas, natural gas or other low carbon fuels; and
! Basic maintenance.
Additionally, Washington State Ferries has identified diesel engine emission reductions and fuelefficiency improvements for its ferry fleet.51
In addition to reducing energy consumption and greenhouse gases, these strategies alsoreduce toxic air pollution. Ecology s Clean Diesel Program and the Puget Sound Clean AirAgency s Diesel Solutions Program are providing funding assistance to diesel fleets toimplement some of these strategies. Specific public and private sector fleets include vehiclesand equipment that move freight (trains, trucks and port cargo handling equipment), masstransit vehicles (ferries, transit buses and school buses), public works vehicles (WSDOT,counties, cities and PUDs), and emergency response vehicles (fire engines, aid trucks andambulances). WSDOT has conducted cost benefit analyses of several strategies to conservefuel used by the state ferry fleet, including operating on fewer engines, slowing boat speeds,implementing passive restraint systems at the dock, loading and unloading procedures andexploring the use of liquefied natural gas.52
51 Source: Washington State Ferries, email communication, October 18, 2011. (S0070)52 Updated Report on Fuel Cost Mitigation Plan, Washington State Department of Transportation, February 2011.
(S0031)
Section 3.4 Near-Term Recommendations
2012 Washington State Energy Strategy page 39
C6%75';,&Q%,%"6.>&"*1&9:?%65%*.%
Basic maintenance such as regular oil changes, tire pressure checks and tune-ups can alsoimprove efficiency by to 2 to 5 percent. In the Puget Sound Clean Air Agency s experience, fleetowners have enthusiastically implemented these strategies. For example, Darigold implementeda tire pressure check program in partnership with Les Schwab. Over a 12-month period,Darigold improved efficiency and reduced tire blowouts, saving the company over $230,000 inone year.
Ecology partnered with 18 school districts and two transit authorities to install diesel fueledengine pre-heaters and cabin heaters on more than 300 buses. These heaters eliminate theneed to idle the bus engine while de-icing and defrosting the windows on cold mornings. At anaverage cost of about $2,500 per bus, the heaters annually save about 140 gallons of diesel fora school bus and about 240 gallons for a transit bus. Those savings will equal the cost of theheaters in 2.5 to 4.5 years. For these 300 buses, Ecology estimates these technologies willconserve more than 500,000 gallons of fuel over the expected 10-year life of the heaters.Ecology will fund the installation of these heaters on another 400 school buses in 2012.
The Poulsbo Fire District and Ecology recently completed a demonstration project that installedauxiliary generator systems on two fire trucks and auxiliary battery systems on two aid trucks.These auxiliary systems eliminate the need to idle the primary engine to power emergencylights and electrical systems. The Poulsbo Fire District estimates an annual savings of4,000 gallons of fuel. At a cost of about $18,000 per generator system and $3,000 per batterysystem, the Poulsbo Fire District expects to save about $20,000 annually in fuel andmaintenance costs. Ecology will fund an expanded demonstration project for another fifteen totwenty fire districts in 2012.
Ecology has partnered to install idle reduction technologies on four switchyard locomotivesowned by Tacoma Rail and three switchyard locomotives owned by TEMCO, LLC. Thetechnologies circulate engine oil and heating/coolant system fluids, keep the batteries chargedand start and stop the engine based on ambient air temperature and air pressure in the brakesystem.
Tacoma Rail saved 59,000 gallons of fuel during the first year of operation. At a total technologycost of $221,000 for the four engines, the systems paid for themselves in the first year ofoperation. TEMCO saved 312 gallons of fuel and $1,215 for one week of operation on the firstengine retrofitted. At a total technology cost of $75,000 for three engines, Ecology expectsTEMCO to save about $190,000 annually.
For transit agencies, which typically rely on standard diesel buses, the increased use of hybridbuses can reduce fuel consumption by 30 percent compared to standard coaches, according toKing County Metro Transit.
W%0&-*"$=,5,
No new analysis of this policy option was conducted for the 2012 Energy Strategy.
Section 3.4 Near-Term Recommendations
2012 Washington State Energy Strategy page 40
M3?$%3%*+"+5'*! Seek a dedicated source of funds to pursue the strategies outlined above;
! Support continued use of state funds, such as the Model Toxic Control Account (MTCA), tofund projects that reduce air toxins, conserve energy and reduce greenhouse gases;
! Seek federal funds to supplement the use of dedicated state funds;
! Develop an education and outreach program to promote the use of technologies thatconserve energy and reduce fuel consumption;
! Explore the benefits of an assertive, statewide, voluntary program versus a state regulationto reduce unnecessary engine idle time; and
! Implement Washington State Ferries efficiency improvements:
-- Modify Jumbo Class (two vessels) from operating on four engines during transit to threeengines and modify the Jumbo Mark II Class (three vessels) from three engines to twoengines during transit;
-- Slow vessel speeds on selected routes (Edmonds-Kingston and Seattle-Bainbridge) tosave fuel;
-- Reduce the energy used to hold the vessel at dock through passive restraint systemsand by investigating the limits of safely reducing propeller turns while maintaining thevessel in position for loading and unloading;
-- Increase the use of biodiesel up to 20 percent in the fuel mix as budget becomesavailable;
-- Adopt hybrid diesel-electric technologies as feasible and as money becomes available(currently Washington State Ferries has a grant application to retrofit one vessel);
-- Optimize fuel efficiencies on 144 new vessels through efficient hull design, optimizedpropellers and the use of heat recovery;
-- Retrofit Electromotor Division (EMD) engines with 1042 Powerhead Kits to reduce theuse of engine lube oil and particulate emissions. EMD engines are installed in 13 of the22 vessels in the Washington State Ferries fleet. These retrofits reduce particulateemissions by a minimum of 25 percent; and
-- Install fuel flow meters to monitor and manage fuel consumption.
D4E4E )'33;+%&!65?&Q%1;.+5'*&C6'26"3&9:?"*,5'*
C'$5.=&8%,.65?+5'*
The Washington State Legislature passed the Commute Trip Reduction (CTR) Law in 199153 toimprove air quality, reduce traffic congestion and reduce fuel consumption through employer-based commute programs aimed at encouraging the use of alternatives to driving alone. Under
53 RCW 70.94.521-555
Section 3.4 Near-Term Recommendations
2012 Washington State Energy Strategy page 41
this law, local governments in the most congested areas of the state establish goals for reducingsingle occupancy vehicle (SOV) trips and vehicle miles traveled (VMT), and develop plans andpolicies to achieve those goals. The major employers (worksites with 100 or more full-timeemployees) in these jurisdictions are mandated to draft and implement a plan to reduce SOVtrips by providing various incentives and mechanisms, such as parking cash-out, transit subsidy,telecommuting and a compressed work schedule. The program affects approximately 1,050worksites in six regions of the state. Other employers, such as small businesses, K-12 schools,seasonal agriculture, construction or employers with swing shift schedules, are not required toparticipate. The state is responsible for monitoring and reporting on these plans, and providestechnical assistance and grants through the CTR program. All employers in the state are eligiblefor tax credits if they provide commute subsidies to their employees, capped at $60 peremployee per year. The state funding for WSDOT to provide grants and technical assistance isabout $6.2 million for the 2011 - 2013 Biennium; the Department of Revenue administers anadditional $5.5 million directed toward the tax credit program. In each biennium, localmunicipalities spend about $1.8 million and employers invest about $98 million in the program.The program s performance is measured through employee surveys conducted every other yearat participating worksites.
The Energy Strategy aims to increase the number of employees subject to the CTR program inorder to further reduce energy consumption and greenhouse gas emissions associated withcommute trips. Doing so would build on current success and outcomes with commute trips whileproviding a means to pilot approaches to other types of trips (see discussion of acomprehensive trip reduction program in Section 3.5.5).
Several different options can be deployed to achieve this goal. One option is to lower thethreshold of eligibility, requiring more employers participate in the program. This change mayface various operational issues, as these worksites may lack adequate financial and staffresources to implement the program. The CTR Board has examined this approach to programexpansion. Analysis in 2005 showed that including employers of 50 or more would add nearlysix times the worksites while doubling the number of covered employees. The CTR Boarddetermined that this approach was too unwieldy and expensive under the current programstructure.
An alternative method to program expansion, believed by the CTR Board to be more effective,is to provide funding to continue the Growth and Transportation Efficiency Center (GTEC)program (authorized by RCW 70.94.528), which targets small employers, schools,neighborhoods and others in dense employment centers. These organizations are not requiredto participate in CTR, but encouraged to change commute behavior through various incentives,such as improved infrastructure, campaign programs and fare subsidies. The state provided $2million in the 2007 - 2009 Biennium to seven cities around the state to develop and implementGTECs, but additional funding has not been appropriated. Since the loss of state funding, mostof these cities have continued elements of their programs using a dwindling combination of localand federal funds, but continued performance and expansion is not possible without statesupport. This option provides a more flexible and efficient implementation model for programexpansion. GTECs also provide a mechanism to test approaches to reducing other trip marketsbesides the commute. Due to a lack of funding, however, less data has been collected on theeffectiveness of the GTEC program. Qualitative feedback from local partners, such as transit
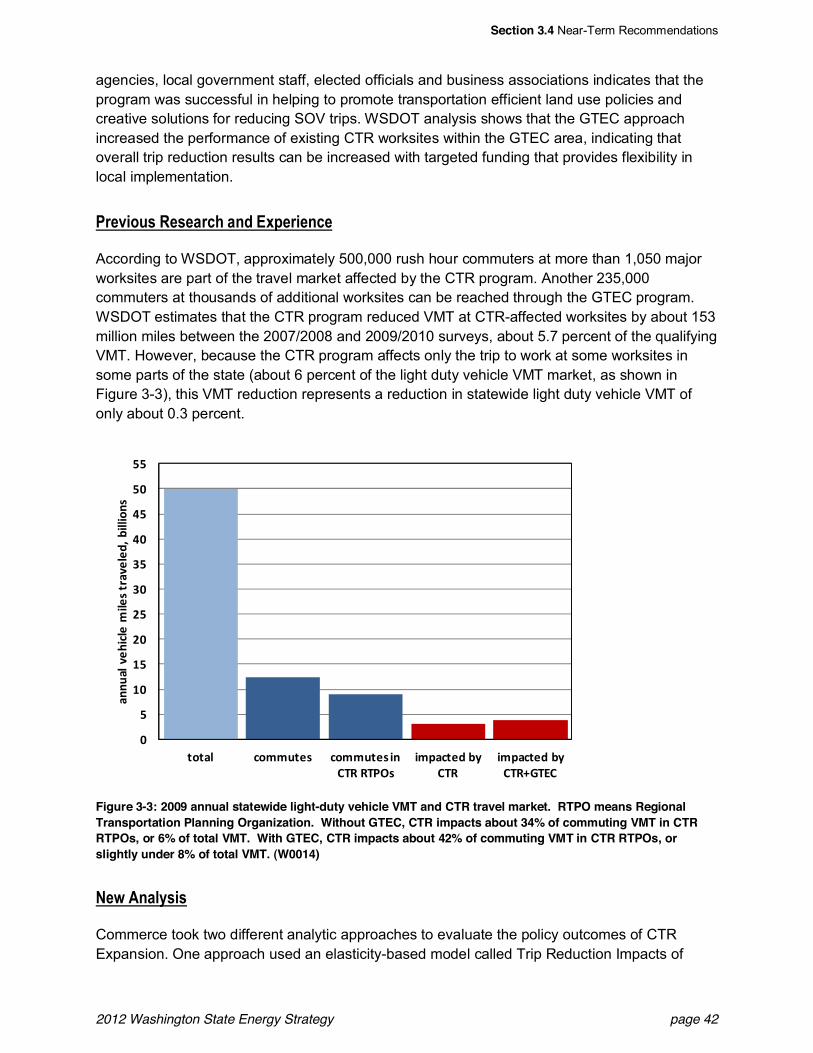
Section 3.4 Near-Term Recommendations
2012 Washington State Energy Strategy page 42
agencies, local government staff, elected officials and business associations indicates that theprogram was successful in helping to promote transportation efficient land use policies andcreative solutions for reducing SOV trips. WSDOT analysis shows that the GTEC approachincreased the performance of existing CTR worksites within the GTEC area, indicating thatoverall trip reduction results can be increased with targeted funding that provides flexibility inlocal implementation.
C6%75';,&Q%,%"6.>&"*1&9:?%65%*.%
According to WSDOT, approximately 500,000 rush hour commuters at more than 1,050 majorworksites are part of the travel market affected by the CTR program. Another 235,000commuters at thousands of additional worksites can be reached through the GTEC program.WSDOT estimates that the CTR program reduced VMT at CTR-affected worksites by about 153million miles between the 2007/2008 and 2009/2010 surveys, about 5.7 percent of the qualifyingVMT. However, because the CTR program affects only the trip to work at some worksites insome parts of the state (about 6 percent of the light duty vehicle VMT market, as shown inFigure 3-3), this VMT reduction represents a reduction in statewide light duty vehicle VMT ofonly about 0.3 percent.
Figure 3-3: 2009 annual statewide light-duty vehicle VMT and CTR travel market. RTPO means RegionalTransportation Planning Organization. Without GTEC, CTR impacts about 34% of commuting VMT in CTRRTPOs, or 6% of total VMT. With GTEC, CTR impacts about 42% of commuting VMT in CTR RTPOs, orslightly under 8% of total VMT. (W0014)
W%0&-*"$=,5,
Commerce took two different analytic approaches to evaluate the policy outcomes of CTRExpansion. One approach used an elasticity-based model called Trip Reduction Impacts of
!
"
#!
#"
$!
$"
%!
%"
&!
&"
"!
""
'(')* +(,,-'./ +(,,-'./01234505467/
1,8)+'.90:;345
1,8)+'.90:;345<=4>3
)22-
)*0?.@
1+*.0,
1*./0'A)?.*.9
B0:1**1(2/
Section 3.4 Near-Term Recommendations
2012 Washington State Energy Strategy page 43
Mobility Management Strategies (TRIMMS).54 The University of South Florida, under thesponsorship of the Florida State Department of Transportation, developed the model. Its mostrecent version incorporates the geographical and socio-economical features of majormetropolitan areas, including three major areas of the CTR program: Seattle-Tacoma-Bremerton CMSA, Spokane MSA and Portland-Salem MSA. These three metropolitan regionscover most of the current targeted areas. Furthermore, the elasticities used in the model arebased on regression analysis on the past performance of Washington s CTR programs. Thesefeatures make the model suitable to estimate the effects of the expansion for Washington. Themodel requires the user to provide various assumptions, such as the number of programparticipants and availability of incentives.
The other approach assumed that the CTR expansion will result in the same level of VMT andgreenhouse gas reductions per employee for newly eligible participants as has beenexperienced historically by the program. In reporting results for the 2007/2008 to 2009/2010program period, WSDOT estimated the total VMT change based on the difference in averageVMT per employee between the 2007/2008 and 2009/2010 survey cycles. This difference inaverage VMT per employee was multiplied by the number of employees and the number ofworkdays annually. While this approach is straightforward, it does not consider how othervariables, such as fuel costs and economic conditions, may affect results. For example, gasprices have been fluctuating significantly in recent years and affected commuting behaviorsnationally. Gas prices, however, actually declined between the survey cycles so they are not alikely cause of the VMT change. In addition, a severe national recession began in late 2007,which may have affected how commuters perceive the costs of driving and the merits of variousincentives provided by the CTR program.
The CTR program reduced VMT in the affected travel market by 5.7 percent over a two-yearperiod for a total two-year reduction of almost 154 million VMT. Comparable TRIMMS analysisindicated a reduction in VMT of 2.4 percent per year, for a total two-year VMT reduction of over92 million VMT. Table 3-2 below summarizes the estimated VMT reduction from CTR expansionbased on results from the two-year program cycle. To make outcomes from both analysismethodologies comparable, Commerce set assumptions for both to simulate a doubling of thenumber of commuters participating in CTR.
54 Sisinnio Concas and Philip L Winters, Quantifying the Net Social Benefits of Vehicle Trip Reduction: Guidance forCustomizing the TRIMMS Model, Center for Urban Transportation Research, University of South Florida, April2009, http://www.nctr.usf.edu/pdf/77805.pdf (R0094)
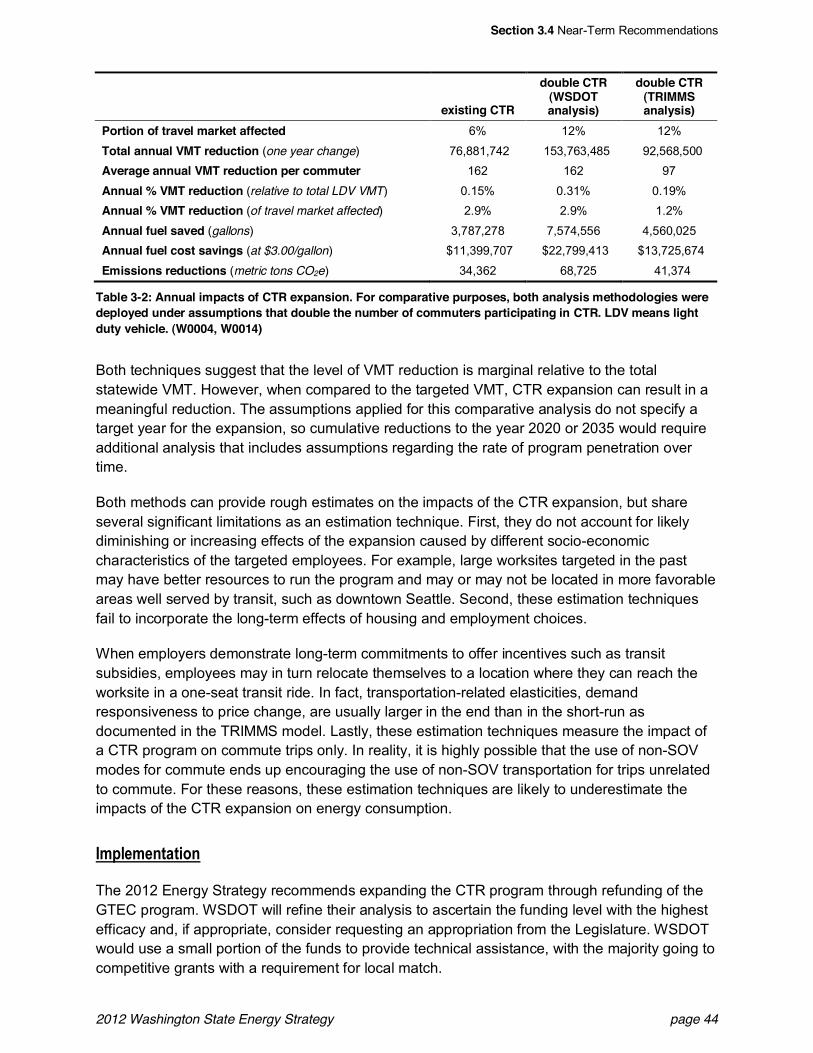
Section 3.4 Near-Term Recommendations
2012 Washington State Energy Strategy page 44
existing CTR
double CTR(WSDOTanalysis)
double CTR(TRIMMSanalysis)
Portion of travel market affected 6% 12% 12%Total annual VMT reduction (one year change) 76,881,742 153,763,485 92,568,500Average annual VMT reduction per commuter 162 162 97Annual % VMT reduction (relative to total LDV VMT) 0.15% 0.31% 0.19%Annual % VMT reduction (of travel market affected) 2.9% 2.9% 1.2%Annual fuel saved (gallons) 3,787,278 7,574,556 4,560,025Annual fuel cost savings (at $3.00/gallon) $11,399,707 $22,799,413 $13,725,674Emissions reductions (metric tons CO2e) 34,362 68,725 41,374
Table 3-2: Annual impacts of CTR expansion. For comparative purposes, both analysis methodologies weredeployed under assumptions that double the number of commuters participating in CTR. LDV means lightduty vehicle. (W0004, W0014)
Both techniques suggest that the level of VMT reduction is marginal relative to the totalstatewide VMT. However, when compared to the targeted VMT, CTR expansion can result in ameaningful reduction. The assumptions applied for this comparative analysis do not specify atarget year for the expansion, so cumulative reductions to the year 2020 or 2035 would requireadditional analysis that includes assumptions regarding the rate of program penetration overtime.
Both methods can provide rough estimates on the impacts of the CTR expansion, but shareseveral significant limitations as an estimation technique. First, they do not account for likelydiminishing or increasing effects of the expansion caused by different socio-economiccharacteristics of the targeted employees. For example, large worksites targeted in the pastmay have better resources to run the program and may or may not be located in more favorableareas well served by transit, such as downtown Seattle. Second, these estimation techniquesfail to incorporate the long-term effects of housing and employment choices.
When employers demonstrate long-term commitments to offer incentives such as transitsubsidies, employees may in turn relocate themselves to a location where they can reach theworksite in a one-seat transit ride. In fact, transportation-related elasticities, demandresponsiveness to price change, are usually larger in the end than in the short-run asdocumented in the TRIMMS model. Lastly, these estimation techniques measure the impact ofa CTR program on commute trips only. In reality, it is highly possible that the use of non-SOVmodes for commute ends up encouraging the use of non-SOV transportation for trips unrelatedto commute. For these reasons, these estimation techniques are likely to underestimate theimpacts of the CTR expansion on energy consumption.
M3?$%3%*+"+5'*
The 2012 Energy Strategy recommends expanding the CTR program through refunding of theGTEC program. WSDOT will refine their analysis to ascertain the funding level with the highestefficacy and, if appropriate, consider requesting an appropriation from the Legislature. WSDOTwould use a small portion of the funds to provide technical assistance, with the majority going tocompetitive grants with a requirement for local match.
Section 3.4 Near-Term Recommendations
2012 Washington State Energy Strategy page 45
A portion of the grant funding would go to local governments with existing GTEC plans toupdate and implement the activities in their plans. The remaining portion of the grant fundingwould go to local governments to develop and implement new GTEC plans.
WSDOT would provide planning models and tools, technical assistance and measurementsupport to certified GTECs, and would report on program performance, including reduced tripsand VMT, fuel and emissions savings.
To develop a more comprehensive program that addresses all trip types (a comprehensive tripreduction program as described in the set of long-term strategies), the following steps arerecommended for implementation:
! Provide funding support for new and ongoing GTEC programs as a way to test trip reductionstrategies for the non-commute travel market, such as individualized marketing;
! Fund preliminary pilot studies through a competitive grant program to address all trip types(to help the state begin to define a broader program);
! As part of these pilot studies, test measurement and evaluation methods to evaluate theimpact of strategies and programs on all trip types; and
! Create an advisory group to begin defining a statewide comprehensive trip reductionprogram. This could be framed around overall mode share goals, at least for urban areas.
D4E4F <3"6+&S6'0+>&"*1&!6"*,?'6+"+5'*&C$"**5*2
C'$5.=&8%,.65?+5'*
Smart growth55 encompasses several facets of comprehensive planning and implementationand is a vital aspect of the Energy Strategy s energy efficient transportation theme.
Smart growth means different things to different people. There is no single definition of smartgrowth; its meaning depends on context, perspective and timeframe. The common thread amongdifferent views of smart growth is development that revitalizes central cities and older suburbs,supports and enhances public transit, promotes walking and bicycling, and preserves open spacesand agricultural lands. Smart growth is not no growth; rather, it seeks to revitalize the already-builtenvironment and, to the extent necessary, to foster efficient development at the edges of theregion, in the process creating more livable communities. (Association of Bay Area Governmentswebsite)
Local comprehensive plans and development regulations have a direct impact on howcommunities grow and function. Plans and regulations that incorporate smart growth principlesreduce energy use, primarily by supporting travel that is more efficient. Compact, mixed-usecommunities can provide greater housing and employment balances, increased transportationoptions and shorter travel distances between destinations. Implementing smart growthstrategies also provides additional benefits, such as improving human health by enablingaccess to more walking and biking facilities, allowing more efficient delivery of urban services,preserving productive farm and forestlands and increasing community livability.56 Smart growth
55 For a list of the ten smart growth principles, visit http://www.epa.gov/smartgrowth/about_sg.htm (R0096)56 http://www.fhwa.dot.gov/livability/index.cfm (R0097)
Section 3.4 Near-Term Recommendations
2012 Washington State Energy Strategy page 46
strategies are synergistic; implementing multiple smart growth strategies together providesgreater benefits than the sum of the benefits of individual strategies.
Approximately two-thirds of total development on the ground in 2050 will have been builtbetween now and then, which creates great opportunities and responsibilities to developin a manner that addresses the resiliency of communities to respond to the impacts of achanging climate and resource demand and production equitably and sustainably.57
Smart growth strategies reduce greenhouse gas emissions through reduced energyconsumption. Emissions from transportation-related activities account for nearly half of the totalgreenhouse gas emissions in the state. In Land Use and Driving: The Role CompactDevelopment Can Play in Reducing Greenhouse Gas Emissions, the Urban Land Institute (ULI)reviews the evidence from three separate studies that documented the effect of compactdevelopment on driving and greenhouse gas emissions. All three studies concluded that,"Compact development strategies can decrease driving enough to produce meaningfulreductions in national levels of greenhouse gas emissions by 2050."
According to the ULI Land Use and Driving report, "The demographic trends between now and2050 will lead to major metropolitan growth. This development pressure could result insprawling, automobile-oriented suburbs - the type of development that increases both the needfor driving and corresponding greenhouse gas emissions. Yet, because this development hasnot yet been built, it represents an opportunity to shape resulting land use patterns and achievebroader greenhouse gas emissions reduction targets."58
Smart growth is a long-term strategy because the built environment changes gradually. Yet it isalso an immediate opportunity - Washington cities and counties will be completing their thirdround of periodic updates to their comprehensive plans between 2015 and 2018. These planswill guide urban form in our state. By 2030, OFM estimates an additional 1.7 million people willcall Washington home, increasing the total state population by about 26 percent.59 Localcomprehensive plans will influence where these people live and work, which in turn will affectwhere and how they travel.
Compact and Transit Oriented Development is a form of smart growth that is an integral part ofthe recommendations in the 2012 Energy Strategy, as it was in the 2008 TransportationImplementation Working Group60 of the Climate Action Team.61 The recommended strategiesinclude:
! Promote and Support Housing and Employment Density
57 Smart Growth Guidelines for Sustainable Design & Development, Jonathan Rose Companies LLC & WallaceRoberts and Todd, 2009, page 1, based on Leadership in a New Era, Nelson, A.C., Journal of the AmericanPlanning Association, Vol. 72, no. 4, 2006, pp. 393-409. (R0184)
58 Land Use and Driving: The Role Compact Development Can Plan in Reducing Greenhouse Emissions, The UrbanLand Institute, 2010, p. 13. (R0095)
59 Office of Financial Management Forecasting Division. Forecast of the State Population: November 2009 Forecast.November 2009: 50. (S0034)
60 Background information regarding the working group is available at:http://www.ecy.wa.gov/climatechange/2008CAT_iwg_tran.htm (S0035)
61 Background information regarding the Climate Action Team is available at:http://www.ecy.wa.gov/climatechange/2008CAT_overview.htm (S0036)
Section 3.4 Near-Term Recommendations
2012 Washington State Energy Strategy page 47
! Develop and Provide Parking Incentives and Management
! Encourage Bicycle and Pedestrian Accessibility
! Encourage Urban Brownfield Redevelopment
! Transportation Concurrency
Smart growth strategies that increase transportation energy efficiency are consistent with thestate s transportation system policy goals in RCW 47.04.280.
C6%75';,&Q%,%"6.>&"*1&9:?%65%*.%
Elements of this 2012 Energy Strategy recommendation are based on earlier research andconclusions from the following sources:
! The 2008 Climate Action Team report, Leading the Way: Implementing Practical Solutionsto the Climate Change Challenge, which had broad stakeholder participation in developingthe recommendations. The Transportation Implementation Working Group made specificrecommendations, which are included in Appendix 4 of that report.
! In WSDOT s 2010 Sustainable Transportation report, Appendix C includes strategies toreduce emissions from the transportation sector, thereby decreasing energy/fuel use.Appendix C is also known as the Executive Order 09-05 Section 2(a) Report, whichspecifically addresses reductions in vehicle miles traveled. Notably, Figures F-14 and F-15provide strategies to reduce vehicle miles traveled.
! The Washington Transportation Plan 2030, a long-range transportation plan prepared by theWashington Transportation Commission.
! The 2008 Land Use and Climate Change (LUCC) Advisory Committee made policyrecommendations regarding transportation and land use planning, which were included inthe Department of Commerce's Planning for Climate Change: Addressing Climate Changethrough Comprehensive Planning under the Growth Management Act report.
! In California, the Sustainable Communities and Climate Protection Act of 2008 (SB 375)requires the state s Air Resources Board to develop regional greenhouse gas emissionreduction targets for passenger vehicles. ARB is to establish targets for 2020 and 2035 foreach region covered by one of the state s 18 metropolitan planning organizations.
W%0&-*"$=,5,
No new analysis of this Smart Growth and Transportation Planning policy option was conductedfor the 2012 Energy Strategy. However, analysis is planned for 2012 per the implementationsteps below.
M3?$%3%*+"+5'*
There are multiple ways to implement the recommended strategies. According to Planning for aNew Energy and Climate Future (American Planning Association, 2010), Examining
Section 3.4 Near-Term Recommendations
2012 Washington State Energy Strategy page 48
comprehensive plans and other planning documents to see if energy and climate change issuesare addressed and integrated is an important step the importance of addressing energy andclimate in the comprehensive plan should not be overlooked.
Some implementation actions are already underway:
Commerce is in the process of updating its Transportation Guidebook to recommend bestpractices for reducing greenhouse gas emissions and promoting energy efficiency intransportation planning and decision making.62 The update will address the newer requirementto include a pedestrian and bicycle component in the transportation element of comprehensiveplans prepared under the Growth Management Act, as well as examples of multimodal planningand transportation concurrency provisions. The updated guidebook is expected to be releasedin early 2012.
Commerce Growth Management Services will provide a technical assistance webpage devotedto planning for energy aware communities, addressing such topics as smart growth, compactcommunities, transportation, infrastructure, economic development, brownfield redevelopmentand parking. The webpage will be available by December 31, 2011.
Other policy options and implementation steps that merit further analysis and considerationinclude:
C6'3'+%&"*1&<;??'6+&[';,5*2&"*1&93?$'=3%*+&8%*,5+=&5*&O6#"*&S6'0+>&-6%",! State, regional and local governments should work cooperatively to support density
increases in urban growth areas, in designated centers and transfer of development rightsrecipients. These efforts could include establishing new revenue sources (tax credits, loans,revolving funds), expanding finance incentives (such as the Multi-Family Tax Exemption),prioritizing infrastructure investments in these areas and comprehensive planning to providefor adequate public services.
! Educate and reach out to elected officials, the public, stakeholders and decision makers toovercome barriers to Compact and Transit-Oriented Development.
! Develop measures to reduce vehicle miles traveled though compact and transit orienteddevelopment. Some of the most promising opportunities include:
-- Combine land use policy, siting decisions, demand management and transportationneeds to leverage the value of existing infrastructure investments and futuretransportation investments (e.g., incentives to concentrate jobs, housing andgovernment facilities and services close to transit hubs).
-- Make significant progress toward meeting statewide greenhouse gas reduction goals bydeveloping and coordinating a mix of innovative transportation strategies, with a focuson alternative energy sources and technologies, while managing congestion through
62 The guidebook is geared toward local government planners and developing or updating the transportation elementof a comprehensive plan under the state s Growth Management Act and is being prepared in a public process withstakeholder participation.
Section 3.4 Near-Term Recommendations
2012 Washington State Energy Strategy page 49
transportation demand management, land use policy and pricing and providingtransportation choices.
-- Improve integration of transportation and land use planning, such as supporting infill andredevelopment in transit-supported corridors, with the goal of reducing vehicle milestraveled and greenhouse gas emissions.
-- Require use of multi-modal level of service standards and concurrency approaches,where possible, to promote density and reduce the development costs of infrastructureto the public.
-- Public transportation support should be recognized as a significant component of smartgrowth and transportation planning in the communities served by transit.
! Coordinate these smart growth and transportation planning strategies fully with the relatedpolicies of CTR Expansion in Section 3.4.4 and the Residential Trip Reduction Program inSection 3.5.4. Specifically, strategies related to growth and transportation efficiency centersare well suited to enhance smart growth and transportation planning under the GrowthManagement Act.
8%7%$'?&"*1&C6'751%&C"6/5*2&M*.%*+57%,&"*1&K"*"2%3%*+! State agencies should provide guidance and education at the state level that recognizes the
importance of parking management in Compact and Transit-Oriented Developments.Examples of parking management policies include discouraging the construction of principaluse long-term parking, encouraging shared parking, providing preferential parking stalls forshared vehicles and pricing street parking in retail and employment centers.
! Provide funding for transit and multimodal infrastructure facilities, such as park and ridefacilities, pedestrian access between parking areas and transit services and provisions ofbicycle parking and storage facilities at multimodal infrastructure facilities.
9*.';6"2%&L5.=.$%&"*1&C%1%,+65"*&-..%,,5#5$5+=! Adopt a complete streets policy for Washington that focuses on facilities that would be
utilized effectively and improve mobility and safety. A complete streets policy recognizes thatcity streets are key public spaces that often make up much of the developed land in theurban environment. However, they are frequently built to facilitate the movement of motorvehicles above all other users. Over the years, less attention has been paid to designfeatures like sidewalks and bike lanes that make streets safe and pleasant places to walk orbike. Complete streets are designed and built for all users (those using automobiles andtransit, as well as pedestrians and bicyclists) and therefore serve everyone.63
! Regional Transportation Planning Organizations (RTPOs) and local governments shoulddevelop multimodal transportation plans that provide regional bicycling networks thatcoordinate with public transportation services in the region. The plans should identify howimprovements will be made, when and by which party. Local governments should address
63 http://www.cascade.org/Advocacy/pdf/Complete-Streets-Guide_2011.pdf (R0166)
Section 3.4 Near-Term Recommendations
2012 Washington State Energy Strategy page 50
any specific requirements in their development regulations, such as bicycle parking/storagerequirements, crosswalk surfacing, transit stop amenities and so on.
! Improve bicycle and pedestrian infrastructure:
-- In denser urban neighborhoods, provide traffic calming measures to shorten streetcrossing distances.
-- Buses should be fitted with bicycle carriers, rapid transit stations should have bicycleparking/storage and all rapid transit lines should be bike-accessible during off-peakhours, with a long-term goal of extending such accessibility to peak hours as well.
-- Consider providing bike stations at major activity centers, transit hubs and in CentralBusiness Districts.
9*.';6"2%&O6#"*&L6'0*(5%$1&Q%1%7%$'?3%*+GE
! Include state funding for urban brownfield redevelopment and add a grants component thataugments the state s brownfield revolving loan. These actions will result in opportunities forland aggregation, promoting town centers and compact development.
! State and local governments should coordinate to encourage greater brownfieldredevelopment by supporting the policy recommendations in the 2011 Ecology report,Washington State Brownfield Policy Recommendations.
!6"*,?'6+"+5'*&)'*.;66%*.=! The state should provide guidance to help local governments increase the use of multimodal
transportation planning, establish level of service standards for all modes and the use ofconcurrency requirements to address all modes. This could include detailed guidance onincorporating multimodal issues into comprehensive plans and development regulations, aswell as providing examples from local governments that have adopted such provisions.
! Encourage local governments over a certain size, or in certain regions, to adopt multimodaltransportation system levels of service standards and concurrency regulations. An exampleof multimodal concurrency provisions could be to allow a fee in lieu of payment to supportmultiple transportation modes (such as adding bicycle lanes, providing bicycle parking, fillingsidewalk gaps, making crosswalk improvements and increasing transit amenities) indesignated centers or other locally predetermined locations. The intent is to allow forcontinued infill development, without causing concurrency failures, where transportationoptions are available to supplement personal vehicle use.
64 See the Department of Ecology publication: Guide to Leveraging Brownfield Redevelopment for CommunityRevitalization (S0040)
Section 3.4 Near-Term Recommendations
2012 Washington State Energy Strategy page 51
D4E4G !6"*,?'6+"+5'*&<=,+%3,&K"*"2%3%*+
C'$5.=&8%,.65?+5'*
Transportation Systems Management (TSM) strategies help to improve transportation systemefficiency. As described in more detail in WSDOT s report on the Governor s Executive Order09-05,65 improving system efficiency will help reduce greenhouse gas emissions from thetransportation sector by smoothing the flow of traffic to prevent stop-and-go driving and bymaintaining vehicle speeds at 45 - 65 mph (the optimal range for reducing greenhouse gasemissions). System efficiency strategies include ramp metering, incident response, signaltiming, traveler information, travel management center (TMC) operations, active trafficmanagement (ATM), transit signal priority, eco-driving and roundabouts (these terms aredescribed below). Most system efficiency strategies are based on congestion management andwill therefore be most effective in the urban areas where congestion occurs regularly. However,some strategies such as signal timing, roundabouts and eco-driving will be effective inrural areas as well. Those strategies are designed to minimize any type of stopping event,regardless of whether there is congestion or not, and therefore will be effective on rural andother types of low traffic volume roads.
Compared to some other strategies to reduce energy consumption and greenhouse gasemissions, system efficiency strategies are relatively easy to implement, very low cost and willbegin reducing energy consumption and greenhouse gas emissions almost immediately. Theability to implement these strategies immediately means that their cumulative effects could, overtime, outweigh some longer-term greenhouse gas emission reduction strategies. Thesestrategies also reduce individual and transit travel times and increase safety.
C6%75';,&Q%,%"6.>&"*1&9:?%65%*.%
Q'"1,&<=,+%3&<+6"+%25%,
WSDOT and local governments are already pursuing several system efficiency strategies tohelp relieve congestion, but with additional funding WSDOT and local governments couldaccomplish more to reduce congestion, energy consumption and greenhouse gas emissions.Following are some of the system efficiency strategies recommended based on their ability toprovide immediate benefits with a relatively high reduction rate:
! Signal Timing. Signal timing involves calibrating signals in order to produce the optimal flowof traffic at intersections and through corridors. WSDOT and local governments currentlyrecalibrate signals regularly, but with additional funding may be able to match the newesttraffic patterns more frequently on key corridors. A recent study done by the WSDOTEnvironmental Office found that the retiming of 347 signals in the most congested regionwould result in an annual decrease of 57,420 metric tons of CO2 (Leth and Sexton, 2009).
There are 6,700 total traffic signals in Washington; of these:
65 See Appendix H in report: http://www.wsdot.wa.gov/NR/rdonlyres/7CE0134C-9E0F-41DC-BE5F-0363D046245B/0/04Appendixc.pdf (S0072)
Section 3.4 Near-Term Recommendations
2012 Washington State Energy Strategy page 52
-- 931 are WSDOT owned and operated
-- 106 are owned by WSDOT and operated by others
-- 195 are owned by others and operated by WSDOT
! Incident Response (IR). Incident response drivers respond to the scene of disabledvehicles and collisions and remove those blockages from the road, allowing traffic to flowfreely. WSDOT already has approximately 55 IR vehicles around the state. With additionalfunding for greenhouse gas reduction, WSDOT would be able to concentrate more IR teamsin congested areas, allowing traffic to flow more smoothly and enabling the system to runmore efficiently.
! Ramp Metering. Ramp meters control the rate at which cars enter the mainline, whichresults in a more smoothly flowing mainline. WSDOT has approximately 140 metered rampsaround the state. According to a 2002 Minnesota study in which the city turned off all 420Twin City ramp meters for approximately a month, Ramp metering results in a net annualsavings of 1,160 tons of emissions (Twin Cities Metro Area Ramp Meter Study,Appendix D, p. 1-1 and 4-4, 2002). Strategically adding ramp meters to key highway highvolume on-ramps during congested times will result in higher speeds on mainlines andgreater greenhouse gas reductions.
! Traveler information and funding for Traffic Management Center (TMC) operations.Traveler information allows travelers to make informed choices about when to leave, whatroute to take and what mode to take to ensure the smoothest possible trip. WSDOTcurrently hosts a website, a 5-1-1 phone line and cellular phone applications, among severalother sources of traveler information. Expanded TMC operations would allow WSDOT andlocal governments to better manage new equipment added to the system. These strategieswould work best combined with signal timing, incident response and/or ramp metering.
! Active Traffic Management. ATM involves the use of technology to harmonize speed, warndrivers of back-ups ahead, close and open lanes, and provide for dynamic rerouting. ATMwill be added to parts of I-5, I-90 and SR 520 over the next few years. Reductions ingreenhouse gases stem from reducing start and stop traffic and congestion.
! Roundabouts. Using roundabouts to replace signals at selected intersections aids indirecting traffic flow, often providing a congestion reduction benefit. There are approximately218 roundabouts statewide, with 57 of those on state routes.66 Roundabouts frequentlyreduce the need to come to a complete halt, thus reducing the acceleration events thatproduce higher emissions. A Swedish study calculated that a roundabout put in place of asignalized intersection resulted in an average decrease of 29 percent in CO emissions and21 percent in NOx emissions (Varhelyi 2002). Another study found a 30 percent decrease infuel consumption at a roundabout intersection compared to a signalized one (Niittymaki1999).
! Eco-driving. Eco-driving involves training people to drive in ways that minimize emissions;for instance, by accelerating gently and by maintaining speeds in the ideal range. Thisstrategy would most likely benefit from leadership by a non-governmental advocacy group. It
66 Source: personal communication, WSDOT, October 26, 2011.
Section 3.4 Near-Term Recommendations
2012 Washington State Energy Strategy page 53
is recommended that eco-driving be promoted through a widespread public educationcampaign, as described in Section 3.5.5.
!6"*,5+&"*1&T$%%+&Q%$"+%1&<+6"+%25%,
A number of strategies can also help transit systems and fleets to operate more efficiently.These include transit signal priority, automatic vehicle location, and computer-aided dispatchingsystems.
! Transit signal priority is an operational strategy that facilitates the movement of transitvehicles through traffic-signal controlled intersections. By reducing the time that transitvehicles spend delayed at traffic signals, transit signal priority can reduce transit delay,travel time, energy consumption and emissions.
! Automatic vehicle location is a computer-based vehicle tracking system that typically usesGPS satellites to locate equipped transit vehicles and transmit the vehicle location data backto the transit center. When combined with other technologies or processes, such as acomputer-aided dispatching system, automatic vehicle location can deliver many benefits inthe areas of fleet management, systems planning, safety and security, traveler information,fare payment and data collection.
! Vehicle telematics, including a host of readily available tools such as GPS and mobilesensors, help fleets operate their vehicles more efficiently. The Puget Sound Clean AirAgency s initial research suggests that some of these tools can reduce fuel consumptionfrom 5 to 15 percent, depending on the fleet and, in some cases, can reduce collisions andfatalities.
Q"5$&"*1&K"65*%&<+6"+%25%,
These long-term options require further research and do not yet qualify as recommendations.However, they are included here due to fitting in the Transportation Systems Managementcategory.
! Replace some long distance I-5 corridor commercial road transport with marine transport toreduce fuel consumption per ton of freight.67
! Generally, increase use of domestic marine transport where possible.68
! Seek interstate export opportunities to fill empty covered hopper grain cars returning tointerior states.69
67 Center for the Commercial Deployment of Transportation Technologies, California State University, Final Report:Feasibility Assessment of Short Sea Shipping to Service the Pacific Coast, Office of Naval Research February 20,2007, pp.150-160. Available at http://www.ccdott.org/transfer/projresults/2005/task%203.21/task%203.21_8a.pdf.(R0185)
68 The price of domestic marine transport is elevated by Section 27 of the Merchant Marine Act of 1920 (the JonesAct ), which requires equipment and staff used for domestic shipping to be of U.S. origin. Pursuit of marinecommercial transport strategies would likely require engagement in an existing political debate regarding themerits of this federal law.
69 Biofuel feedstocks have been suggested as one possibility, but this may conflict with Washington s interest insupporting a local biofuel refining industry as described in Sections 0.0.0 and 3.5.3.
Section 3.4 Near-Term Recommendations
2012 Washington State Energy Strategy page 54
M3?".+,&'(&<+6"+%25%,
Figure H-1 in WSDOT s report on the Governor s Executive Order 09-05 summarizes thepotential impacts and barriers for a number of system efficiency strategies.70 Moving Cooler, theonly comprehensive attempt to quantify system efficiency greenhouse gas reduction measures,has estimated an approximate one percent reduction in transportation-related emissions fromsystem efficiency strategies. However, the modeling in Moving Cooler analyzed national levelimpacts and more investigation is necessary on the degree to which these national assumptionsare applicable in Washington, where targeted investments throughout the roadway system mayresult in greater impacts than indicated in the Moving Cooler study.
This is an under studied area and various studies (including some in-house studies by WSDOT)have pegged the improvement from some system efficiencies as higher. When studies ofsystem efficiency and energy consumption/greenhouse gas reductions do exist, they often focuson individual locations; for example, the installation of one new ramp meter or the effects of asingle retimed signal. None of these studies consider the impacts to the full transportationsystem. It is challenging to extrapolate from an individual study to a system-wide improvement.
A number of studies have been conducted evaluating the impacts of transit operations and fleetmanagement systems.71 For example, an evaluation of a south Snohomish County regionaltransit signal priority project showed that the system reduced transit travel time by about5 percent, with insignificant negative impacts to local traffic on cross streets.72 Other studieshave found that transit signal priority systems can reduce travel time by six to 27 percent.73
Fleet management systems, such as automatic vehicle location systems, also improve theefficiency of transit operations. One study in Portland found that an automatic vehicle locationsystem with computer-aided dispatching improved on-time bus performance by 9 percent,reduced headway variability between buses by 5 percent and decreased run-time by3 percent.74
W%0&-*"$=,5,
No new analysis of Transportation Systems Management was conducted for the 2012 EnergyStrategy. Though sufficient previous research exists to justify moving forward on the measuresdescribed above, Commerce has found some researchers to have concerns that reboundeffects might reduce the greenhouse gas reductions associated with Transportation SystemEfficiency measures, since increased system efficiency encourages increased use of thesystem, especially in areas of growing population. An accurate quantification of greenhouse gasimpacts will require additional supporting research on this topic.
70 http://www.wsdot.wa.gov/NR/rdonlyres/7CE0134C-9E0F-41DC-BE5F-0363D046245B/0/04Appendixc.pdf (S0072)71 See many examples of studies here, under the tab Operations & Fleet Management :
http://www.itscosts.its.dot.gov/its/benecost.nsf/SingleTax?OpenForm&Query=Transit%20Management (R0186)72 See http://www.wsdot.wa.gov/research/reports/fullreports/699.1.pdf (S0080)73 See
http://www.itscosts.its.dot.gov/its/benecost.nsf/ID/F1A967F0D3CD5DE58525733A006D4B07?OpenDocument&Query=Home (R0187)
74 http://www.itscosts.its.dot.gov/its/benecost.nsf/ID/22A13F3DC6531533852569610051E2F3?OpenDocument&Query=BApp (R0188)
Section 3.4 Near-Term Recommendations
2012 Washington State Energy Strategy page 55
M3?$%3%*+"+5'*
System efficiency strategies are practical, proven strategies that can be implemented relativelyeasily. WSDOT and local governments have control over their deployment and do not facemajor policy or technological hurdles to implementation. The largest barrier to further reducinggreenhouse gas emissions using system efficiency strategies is funding for those strategies.
WSDOT will continue to deploy system efficiency strategies such as ramp metering, incidentresponse, signal synchronization, traveler information, TMC operations, ATM and roundaboutsunder its existing plans. If the agency receives additional funding to use system efficiencystrategies to reduce energy consumption and greenhouse gases, WSDOT will deploy thestrategies in locations that would focus on providing decreases in energy consumption andemissions. These strategies can be implemented or expanded quickly. The cost range for theseoperating activities for WSDOT is between a few million to tens of millions of dollars. Installationof area wide ramp meters, intelligent transportation system devices and active trafficmanagement projects are more expensive. For local governments, the cost could be less. Otheroperating strategies, such as the incident response and signal timing review and improvements,are relatively inexpensive and can be implemented more quickly.
With additional funding, transit agencies can further implement transit signal priority and othertransit management systems to improve operations and reduce energy consumption andgreenhouse gas emissions.
D4E4H Q%25'*"$&K'#5$5+=&S6"*+,
C'$5.=&8%,.65?+5'*
The Regional Mobility Grant program provides money to cities, counties, transit agencies andport authorities to deliver transit mobility projects that are cost-effective, reduce travel delay forpeople and goods, improve connectivity between counties and regional population centers andare consistent with local and regional transportation and land use plans. Funds are primarilyused for capital construction projects, new or expanded transit service and new equipmentpurchases. Projects are competitively evaluated and a ranked list is submitted to the Legislaturefor appropriation. The program is funded through the Multimodal Transportation Fund.
The Connecting Washington Task Force75 will be developing a 10-year investing and fundingplan for the state s transportation system and presenting it to the 2012 Legislature. This effortrepresents an important opportunity for the state to adequately fund transportation strategiesthat can help keep people moving consistent with state energy goals. Previous researchdemonstrates that the energy efficiency of various transit expansions can vary considerably(see Previous Research and Experience in Section 3.5.6), so the 2012 Energy Strategyrecommends that energy efficiency be considered as a key criterion in selecting those RegionalMobility Grants to be awarded.
75 http://www.governor.wa.gov/priorities/transportation/connectwa.asp (S0073)
Section 3.4 Near-Term Recommendations
2012 Washington State Energy Strategy page 56
C6%75';,&Q%,%"6.>&"*1&9:?%65%*.%
The Regional Mobility Grant program funded 31 projects from 2006 through September 30,2011. These completed projects include:
! 14 park and ride lots constructed or expanded;
! More than 4,700 new park and ride lot parking stalls built;
! Four new or expanded transit centers;
! Six high occupancy vehicle and business access and transit lane projects;
! 11 equipment and/or operating new or expanded transit service; and
! 42 new buses purchased.
A summary of benefits from these projects include:76
! Four projects saving over 135,000 hours annually in travel delays;
! 142 million VMT reduced annually;
! 7.1 million vehicle trips reduced annually; and
! 62,000 metric tons of CO2 reduced annually.
In addition, 25 projects currently underway include:
! Five park and ride lots under construction or expansion with 1,525 new parking stalls;
! Eight high occupancy vehicle and business access and transit lanes projects;
! Six new or improved transit centers;
! Four new or extended bus routes; and
! Eight projects improving speed and reliability through transit signal prioritization.
Anticipated estimated benefits from these 25 projects include:
! 94.5 million miles annual reduction in VMT;
! 6.1 million annual reduction in vehicle trips;
! 34,300 hour reduction in travel delays; and
! 41,000 metric tons of CO2 reduced annually.
W%0&-*"$=,5,
No new analysis of the Regional Mobility Grants program was conducted for the 2012 EnergyStrategy.
76 Source: WSDOT Regional Mobility Grants Program office, October 2011.
Section 3.4 Near-Term Recommendations
2012 Washington State Energy Strategy page 57
M3?$%3%*+"+5'*
For the Regional Mobility Grant Program, WSDOT will execute a comparative analysis todetermine whether a program expansion should be targeted at a specific type of project, orwhether such an expansion should allow funding for all types of qualifying projects. Thecomparative analysis shall include energy impacts of the program choices. One possible targetfor the narrower type of expansion is park and ride lot projects. Many King County Metro andSound Transit park and ride lots along the I-5, I-405, I-90 and SR-520 corridors are operating at100 percent capacity due to very high demand. As a result, people planning to ride the bus ortrain may be forced to drive when there are no parking stalls available at the desired park andride locations, increasing transportation energy consumption. Alternatively, the increasedfunding could focus on more energy efficient transit approaches. Once the comparative analysisis complete, WSDOT may consider formulating a funding request to the Legislature.
In addition, to support other near-term transit service needs, the Connecting Washington TaskForce should be in alignment with the Energy Strategy, and prioritize transit funding in the 10-year investing and funding plan for the state s transportation system.
D4E4I 9$%.+65.&Y%>5.$%&K5$%"2%&C65.5*2&C5$'+
C'$5.=&8%,.65?+5'*
Long-term policy option 3.5.7 Emerging Pricing Methods examines alternatives to fuel taxes thatcould, in the long run, help to align the state s transportation policy with a changing automotiveenergy picture characterized by higher efficiency vehicles and electric vehicles. The changesdescribed in policy option 3.5.7 are profound and early piloting can play an important role ininforming future decisions. The Electric Vehicle Mileage Pricing Pilot takes advantage of aunique opportunity offered by emerging consumer electric vehicles to pilot at least one of thealternatives to fuel taxes described in Section 3.5.7. The pilot leverages a legislative interest ingenerating roads revenue from EVs,77 and leverages early adopters of EVs who may be morewilling to manage the less refined data collection systems that are inevitably associated with anypilot.
C6%75';,&Q%,%"6.>&"*1&9:?%65%*.%
The Federal Highway Administration s office of Innovative Program Delivery maintains a recordof prior experience with mileage-based user fees.78 As of this writing, the record includes a 12-state study conducted by the University of Iowa Public Policy Center; pilots deployed in theurban areas of Atlanta, Georgia, Twin Cities, Minnesota and the greater Seattle area; and statepilots deployed in Nevada, Oregon and Texas.
77 See legislative history of 2ESSB 5251 (2011 legislative session), Concerning Electric Vehicle License Fees.(S0042)
78 http://www.fhwa.dot.gov/ipd/revenue/road_pricing/study_reports/auto_use_costs.htm (R0100)
Section 3.4 Near-Term Recommendations
2012 Washington State Energy Strategy page 58
The large number of pilots and studies deployed in the past mean that Washington could makean especially sophisticated step forward into mileage pricing and design a pilot well tailored tothe state s specific needs. The Oregon effort began 10 years ago, when the 2001 OregonLegislature established the Road User Fee Task Force to develop a design for revenuecollection for Oregon s roads and highways that could replace the current system for revenuecollection. The Task Force considered some 28 different funding ideas before launching a 12-month pilot program in April 2006, hinting at the sophisticated understanding of mileage pricingoptions available today.
W%0&-*"$=,5,
No new analysis of this policy option was conducted for the 2012 Energy Strategy.
M3?$%3%*+"+5'*
WSDOT will:
! Develop a strategy to explore VMT fees, and a schedule for when such a fee system couldbe made market ready; and
! Launch a coordinated effort to design a mileage pricing pilot project, focused on electricvehicles, to demonstrate and test the technologies and impacts of a mileage-based pricingstrategy. Among other considerations, the pilot project could include an assessment ofwhether rates could vary from area to area, by type of road, and/or by time of day.
D4E4J )"6&<>"65*2&"*1&K5$%"2%&L",%1&M*,;6"*.%
C'$5.=&8%,.65?+5'*
Car sharing, mileage-based insurance and pay-as-you-drive (PAYD) scale the cost of drivingwith the amount of driving. By attaching the cost to per-mile use, instead of paying for it inoccasional lump sums, drivers have an incentive to make the most efficient travel choices.
Mileage-based auto insurance is priced at least partially on driving distance. Unlike traditionalinsurance, which offers a fixed monthly or annual premium, mileage-based insurance features avariable premium correlated to driving distance. The rates charged may take into account anynumber of additional factors, such as driver age, driving record, geographic location and soforth. Covered drivers can save money by reducing their driving.
PAYD means that the insurance premium is calculated dynamically, typically according to thedistance driven, and on other data collected from the vehicle, including speed and time of day.
PAYD/mileage-based insurance was originally advocated as a more equitable insuranceproduct for low-mileage drivers. Low-mileage drivers may be subsidizing the accident costs ofhigh-mileage drivers because the number of automobile accidents per person is stronglycorrelated with driving distance. More recently, mileage-based insurance has also beenadvanced as a means to reduce other negative impacts of driving such as accidents, pollution
Section 3.4 Near-Term Recommendations
2012 Washington State Energy Strategy page 59
and congestion, without increasing the total cost of driving. The 2012 Energy Strategyadvocates mileage-based insurance as a way to curb energy consumption and reducegreenhouse gas emissions.
Though pure mileage-based insurance is available in Texas through Mile Meter and as anoption to drivers in several states - at least one insurer has indicated it will not offer the option inWashington because state transparency laws require insurance providers to file such policieswith the Insurance Commissioner in a process that exposes trade secrets to the public, andhence to their competitors.79 Insurance companies are not willing to bring the product toWashington without proper trade secret protection. Though there is no explicit prohibition ofmileage-based insurance in Washington, the trade secret issue compounds other obstaclesincluding, but not limited to, the costs of monitoring driving distance.
Car sharing is an approach that allows people to rent cars that are conveniently located for shortperiods, such as by the hour. Car sharing can be an attractive way for households to get by withone less car, knowing that they can rent a car easily for short periods when needed. Theorganization renting the cars may be a commercial business. Another form of car sharing, inwhich individuals rent out their own cars, is called personal car sharing. Under the personal car-sharing model, private car owners make their cars available to friends, neighbors or to the widerpublic.
C6%75';,&Q%,%"6.>&"*1&C6".+5.%
Washington s Climate Action Team estimated the potential impacts of PAYD insurance ongreenhouse gas emissions in Washington CAT Policy Options Analysis (2007).80 This estimatewas based on findings by the Arizona PIRG Education Fund, which indicated that when 80percent of an existing premium becomes distance-based, light duty vehicle mileage would bereduced by 8 percent. By using this figure, the Climate Action Team estimated that PAYDinsurance would reduce Washington s emissions by 1 percent based on an assumed 20 percentmarket penetration rate in 2020.
There are also more sophisticated estimates using price elasticity of demand. Bordoff and Noel(2008) estimated the potential impacts of PAYD insurance by using the elasticity of demand anda general equilibrium model developed by Parry (2005).81,82 The study estimated mileagereductions for each state and concluded that it would reduce Washington s light-duty vehiclemileage by 8.3 percent. Another study by Ferreira and Minikel (2010) indicated that fullymileage-based insurance could reduce light-duty vehicle mileage by 9.5 percent (with a rangefrom 3 percent to 14 percent), while a hybrid product with a flat yearly rate plus per-mile pricing
79 Washington State Senate, Senate Bill Report: ESB 5730, Mar 2011,http://apps.leg.wa.gov/documents/billdocs/2011-12/Pdf/Bill%20Reports/Senate/5730.E%20SBR%20APS%2011.pdf (S0043)
80 Washington State Climate Action Team, Transportation Sector Technical Work Group Policy OptionRecommendations, Dec 2007, http://www.ecy.wa.gov/climatechange/interimreport/122107_TWG_trans.pdf(S0044)
81 Jason E. Bordoff and Pascal J. Noel (R0101)82 Ian W. H. Parry, Is Pay-as-You-Drive Insurance a Better Way to Reduce Gasoline Than Gasoline Taxes? AEA
Papers and Proceedings 95 (2): 287 93, May 2005, http://www.rff.org/Documents/RFF-DP-05-15.pdf (R0102)
Section 3.4 Near-Term Recommendations
2012 Washington State Energy Strategy page 60
after the first 2,000 miles could reduce mileage by about 5 percent.83 Lastly, CambridgeSystematics Moving Cooler (2009) indicates a more modest reduction of 4.5 percent (based onan assumption that 50 percent of premiums are paid on a mileage basis and the marketpenetration is 75 percent), or 6.0 percent (if 75 percent of premiums are paid on a mileage basisand market penetration is 100 percent).
In a real world experiment in Texas, Progressive County Mutual Insurance Company conducteda demonstration project in 2006 and found that drivers with PAYD insurance drove 10 percentfewer miles.84 Another field experiment in Minnesota yielded a total reduction in driving of 8percent.85 However, these field experiments are based on relatively small sample sizes and mayor may not be applicable for statewide or nationwide implementation.
King County currently has a PAYD pilot project under development, but it is not yet underway.86
A few U.S. states, such as Texas, allow insurance companies to offer limited types of PAYDinsurance products, while PAYD insurance is widely offered in countries such as England andJapan.
In 2010, California passed a law rationalizing insurance policy with the needs of car sharingcompanies and individuals.87 Insurance companies cannot exempt owners of cars used in car-sharing programs from their policies. Under the law, car owners are not liable for damagescaused while someone else is driving the car; rather, the car-sharing program can insure the carat the times that it is being driven by a non-owner.
W%0&-*"$=,5,
Commerce analyzed one example PAYD insurance product. The analysis assumes variablepremiums for collision, liability and uninsured motorist protection. These insurance premiumsrepresent about 84 percent of the current total premium and amount to 7.5 cents per mile foraverage drivers in Washington.88 In turn, the base premium will be reduced to reflect thischange. For the purpose of analysis, the costs of insurance premiums will change at the rate ofinflation for the analysis period.
83 Joseph Ferreira Jr. and Eric Minikel, Pay-As!You!Drive Auto Insurance in Massachusetts: A Risk Assessment andReport on Consumer, Industry and Environmental Benefits, Conservation Law Foundation and EnvironmentalInsurance Agency, Nov 2010, http://www.clf.org/wp-content/uploads/2010/12/CLF-PAYD-Study_November-2010.pdf (R0103)
84 Progressive County Mutual Insurance Company, Pay As You Drive (PAYD) Insurance Pilot Program Phase 2 Mid-Course Project Report, Mar 2007, http://www.nctcog.org/trans/air/programs/payd/MidTermResults.pdf (R0104)
85 Cambridge Systematics, Inc., Mileage-Based User Fee Demonstration Project: Potential Public Policy Implicationsof Pay-As-You-Drive Leasing and Insurance Products, Mar 2006, http://www.lrrb.org/pdf/200639C.pdf (R0105)
86 King County Department of Transportation, Pay-as-You-Drive (PAYD) Insurance Pilot Project,http://your.kingcounty.gov/exec/news/2007/pdf/Payasyougofacts.pdf (R0106)
87 AB 1871. (R0120)88 Jason E. Bordoff and Pascal J. Noel, Pay-As-You-Drive Auto Insurance: A Simple Way to Reduce Driving-Related
Harms and Increase Equity, Brookings Institute Press, July 2008,http://www.brookings.edu/~/media/Files/rc/papers/2008/07_payd_bordoffnoel/07_payd_bordoffnoel.pdf (R0101)
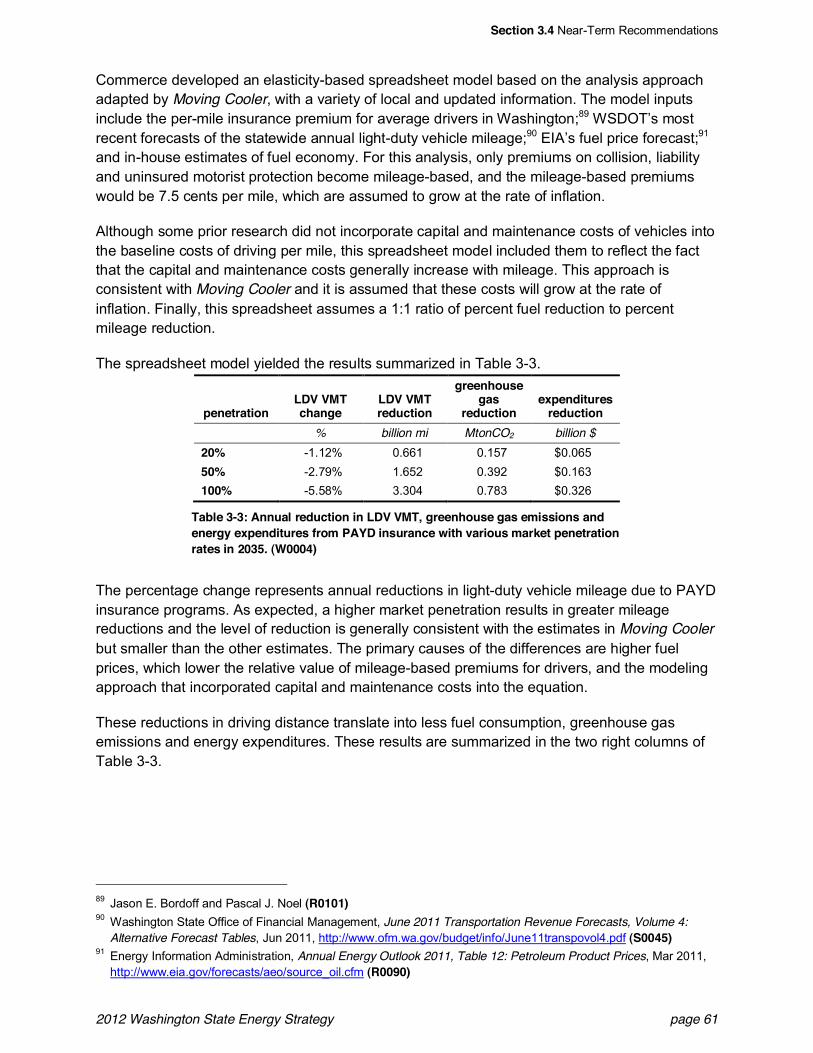
Section 3.4 Near-Term Recommendations
2012 Washington State Energy Strategy page 61
Commerce developed an elasticity-based spreadsheet model based on the analysis approachadapted by Moving Cooler, with a variety of local and updated information. The model inputsinclude the per-mile insurance premium for average drivers in Washington;89 WSDOT s mostrecent forecasts of the statewide annual light-duty vehicle mileage;90 EIA s fuel price forecast;91
and in-house estimates of fuel economy. For this analysis, only premiums on collision, liabilityand uninsured motorist protection become mileage-based, and the mileage-based premiumswould be 7.5 cents per mile, which are assumed to grow at the rate of inflation.
Although some prior research did not incorporate capital and maintenance costs of vehicles intothe baseline costs of driving per mile, this spreadsheet model included them to reflect the factthat the capital and maintenance costs generally increase with mileage. This approach isconsistent with Moving Cooler and it is assumed that these costs will grow at the rate ofinflation. Finally, this spreadsheet assumes a 1:1 ratio of percent fuel reduction to percentmileage reduction.
The spreadsheet model yielded the results summarized in Table 3-3.
penetrationLDV VMTchange
LDV VMTreduction
greenhousegas
reductionexpenditures
reduction% billion mi MtonCO2 billion $
20% -1.12% 0.661 0.157 $0.06550% -2.79% 1.652 0.392 $0.163100% -5.58% 3.304 0.783 $0.326
Table 3-3: Annual reduction in LDV VMT, greenhouse gas emissions andenergy expenditures from PAYD insurance with various market penetrationrates in 2035. (W0004)
The percentage change represents annual reductions in light-duty vehicle mileage due to PAYDinsurance programs. As expected, a higher market penetration results in greater mileagereductions and the level of reduction is generally consistent with the estimates in Moving Coolerbut smaller than the other estimates. The primary causes of the differences are higher fuelprices, which lower the relative value of mileage-based premiums for drivers, and the modelingapproach that incorporated capital and maintenance costs into the equation.
These reductions in driving distance translate into less fuel consumption, greenhouse gasemissions and energy expenditures. These results are summarized in the two right columns ofTable 3-3.
89 Jason E. Bordoff and Pascal J. Noel (R0101)90 Washington State Office of Financial Management, June 2011 Transportation Revenue Forecasts, Volume 4:
Alternative Forecast Tables, Jun 2011, http://www.ofm.wa.gov/budget/info/June11transpovol4.pdf (S0045)91 Energy Information Administration, Annual Energy Outlook 2011, Table 12: Petroleum Product Prices, Mar 2011,
http://www.eia.gov/forecasts/aeo/source_oil.cfm (R0090)
Section 3.5 Long-Term Policy Options
2012 Washington State Energy Strategy page 62
M3?$%3%*+"+5'*! Identify and implement changes in the insurance law to enable voluntary PAYD insurance
and to ensure that the policy achieves the transportation efficiency reductions expected fromthis policy.
! Monitor pilot project in King County to identify lessons learned that might be applicablestatewide.
! Design program to avoid disproportionate impacts to rural areas.
! Identify legislative barriers to implementing private car sharing and seek changes in laws asnecessary.
D4F V'*2X!%63&C'$5.=&U?+5'*,
D4F4@ Q%7%*;%&W%;+6"$&T%%#"+%
C'$5.=&U?+5'*
Feebates are market-based programs designed to influence consumer behavior at the time ofpurchase. These programs are intended to influence a consumer s choice of a new vehicle andthereby increase the collective vehicle fuel economy and/or reduce greenhouse gas emissions.Typically, they are revenue neutral and levy fees at initial purchase on relatively inefficientvehicles and rebates on efficient vehicles. The fee/rebate provides an incentive for consumersto purchase a more efficient vehicle. Over the long run, this feebate provides an incentive formanufacturers to design efficient vehicles.
The two primary reasons to consider a feebate program are to reduce state expenditures ongasoline and diesel and to reduce state greenhouse gas emissions. In 2009, residents andbusinesses spent $16 billion on purchases of gasoline and diesel; a majority of this expenditurewent out of state. A feebate program can be a cost-effective way to reduce state fuelexpenditures and greenhouse gas emissions, thereby meeting the state s reduction targetswhile saving consumers money.
Put simply, feebate programs provide the highest rebates for the most efficient vehicles, and thehighest fees for the least efficient. The exact relationship between fuel efficiencies, rebates andfees includes many parameters, all of which must be considered when designing the program:
1. Benchmark: Define which vehicles are in the program and whether there are vehiclesubcategories in the program. A single benchmark (single category) that includes all light-duty vehicles (cars, vans, SUVs and light trucks) is the most direct and effective approach.Another approach is to categorize by vehicle class; for instance, one feebate program forcars and another for the light truck category.92 Feebate programs may also be categorizedby vehicle footprint (correlates to vehicle volume and weight), in which two or more footprint
92 The federal CAFE standards are bifurcated into car and light truck categories, and a third category is beingdeveloped for the largest pickup trucks, which are not currently regulated by CAFE.
Section 3.5 Long-Term Policy Options
2012 Washington State Energy Strategy page 63
categories would be established and vehicle efficiency would then be compared within eachfootprint category. The footprint approach is the most challenging to understand andadminister, the single benchmark approach is the simplest and the vehicle class approach isof intermediate complexity.
2. Pivot point: An efficiency point must be selected above which a vehicle receives a rebateand below which it would be levied a fee at initial purchase. An emission or fuelconsumption range can also be used instead of a single point; for example, a fuel economyrange of 30 to 40 mpg might be exempt from fees or rebates. Typically, feebates are scaledto the grams of carbon dioxide emitted per mile (grams CO2/mile) or kilometer, and not fuelefficiency (miles per gallon).93 As an example, the 2016 fleet CAFE standard, 35 mpg, isequivalent to an emission rate of about 250 grams per mile. Under a feebate program,higher emission rates (lower fuel efficiency) are penalized and lower rates (higher fuelefficiency) are rewarded. See Figure 1.
3. Functional form: A second design element is how the fees or rebates vary as they moveaway from the pivot point. A single straight line might be used or two straight lines withdifferent slopes above and below the pivot point. The slope of the line is the rate at whichthe fee or rebate increases as vehicle fuel efficiency moves away from the pivot point,typically expressed as dollars per gram CO2 per mile ($/g/mi). For example, a vehicle 50g/mi below the pivot point under a $20/g/mi feebate rate would receive a $1,000 rebate.Other functional forms might include zero rebate zones until a certain number of g/mi belowthe pivot point, or a staircase of increasing, flat rebates rather than a smooth line.
4. Static pivot point or continuous improvement: Advances in automotive technology andincreasing CAFE standards make it reasonable to continuously increase the benchmarkpoint for each vehicle category.
5. Point of regulation: The fee or rebate can be applied at the consumer, auto dealer or automanufacturer level.
C6%75';,&Q%,%"6.>&"*1&9:?%65%*.%
Four nations - Denmark, Norway, France and the Netherlands - have implemented feebateprograms in the last five years. In addition, several nations have sliding scale registration feesfor vehicles based on weight, engine displacement or horsepower. These fees have typicallyserved as incentives to buy vehicles that are more efficient.
8%*3"6/! Introduced June 2007 as a modified registration tax
! Single benchmark = 150 g/km (241 g/mi)
! Benchmark expressed to the public in terms of fuel economy
! Two straight lines (linear) - different rates (slopes) for fees and rebates:
93 It is possible to incorporate indirect emissions associated with the vehicle s fuel type as well, for exampleemissions associated with electric generation used to fuel an electric vehicle. However. this requires complex fuellife-cycle analysis similar to what is required for a low carbon fuel standard.
Section 3.5 Long-Term Policy Options
2012 Washington State Energy Strategy page 64
! Rebate = $50/g/mi
! Fees = $13/g/mi
W'60"=! Began taxing CO2 in January 2007 with a rate change in January 2008
! Rebate added in January 2009 to yield a full feebate system
! Single benchmark = 120 g/km (193 g/mi)
! Functional form is four line segments with different rates
! Rebate = $52/g/mi
! Initial fee rate = $55/g/mi
! Fees increase to a maximum rate of $259/g/mi
W%+>%6$"*1,! Introduced July 2006, revised February 2008
! Benchmarks based on footprint/class of vehicle
! Step function with seven steps
! Complexity precludes simple description of a feebate rate
! While this study was being completed in 2009, it was announced that the system would beabandoned in 2010 in favor of a single benchmark
T6"*.%! Introduced December 2007 (rebate only)
! Fee part added January 2008
! Benchmark in 2009: Donut hole from 130-160 g/km (193 257 g/mi)
! Benchmark in 2012: Donut hole from 130-140 g/km (193 225 g/mi)
! Functional form is a step function with nine levels
! Shape of step function yields an approximate rate of $16.5/g/mi
Three of the four programs have a single benchmark, the simplest approach, which means thatall light duty vehicles are treated as a single group. It should be noted that the European carmarket does not have much of a light truck segment and so weight extremes are lesspronounced. With regard to applying the fee or rebate, France uses a step function, whileDenmark and Norway use multiple linear lines (piecewise approach), meaning that fees andrebates are applied at different rates. The Netherlands use a footprint based benchmark system
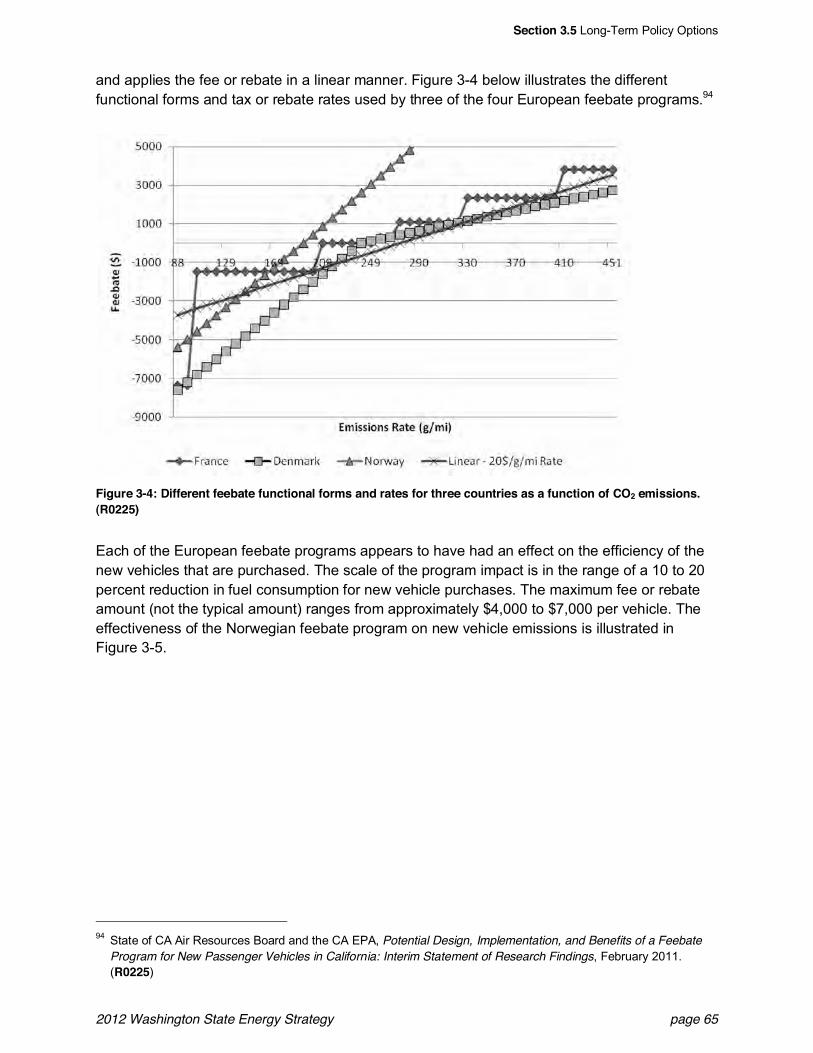
Section 3.5 Long-Term Policy Options
2012 Washington State Energy Strategy page 65
and applies the fee or rebate in a linear manner. Figure 3-4 below illustrates the differentfunctional forms and tax or rebate rates used by three of the four European feebate programs.94
Figure 3-4: Different feebate functional forms and rates for three countries as a function of CO2 emissions.(R0225)
Each of the European feebate programs appears to have had an effect on the efficiency of thenew vehicles that are purchased. The scale of the program impact is in the range of a 10 to 20percent reduction in fuel consumption for new vehicle purchases. The maximum fee or rebateamount (not the typical amount) ranges from approximately $4,000 to $7,000 per vehicle. Theeffectiveness of the Norwegian feebate program on new vehicle emissions is illustrated inFigure 3-5.
94 State of CA Air Resources Board and the CA EPA, Potential Design, Implementation, and Benefits of a FeebateProgram for New Passenger Vehicles in California: Interim Statement of Research Findings, February 2011.(R0225)

Section 3.5 Long-Term Policy Options
2012 Washington State Energy Strategy page 66
Figure 3-5: Effect of Norwegian feebate program on average new vehicle emissions through Jan. 2010.Bensin means Gasoline. (R0225)
C6%75';,&Q%,%"6.>&"*1&8%7%$'?3%*+&5*&+>%&O*5+%1&<+"+%,
As part of its AB32 (greenhouse gas emission reduction program) rule development, Californiahas done extensive research on feebate program design, implementation, effectiveness andeconomic impacts. The research was done by the University of California, Davis, for theCalifornia Resources Board (CARB). The research utilized several models and analyzed severalfactors, such as:
! One, two, or footprint based vehicle categorization
! Two rates of fee and rebate increase
! California, multistate, or national program
! Scenarios developed including static or increasing CAFE standards (2 percent per year)
! Interactive effects with CAFE and LCFS
! Assessed overall effectiveness at reducing emissions and saving fuel
! Economic impacts of several feebate scenarios including consumer welfare
The key findings of the California feebate research were:
! Single benchmark (cars and trucks combined) feebate programs delivered the greatest fuelsavings of 5 percent when compared to no feebate. The footprint benchmarking deliveredthe least at 3 percent and separate car and truck benchmarks saw an intermediate savingsof 4 percent.
! Feebate systems reduce fuel consumption primarily by changing the mix of modelspurchased by consumers; only a moderate fraction is due to vehicle redesign bymanufacturers. This is especially true for the California-only feebate modeling scenario.
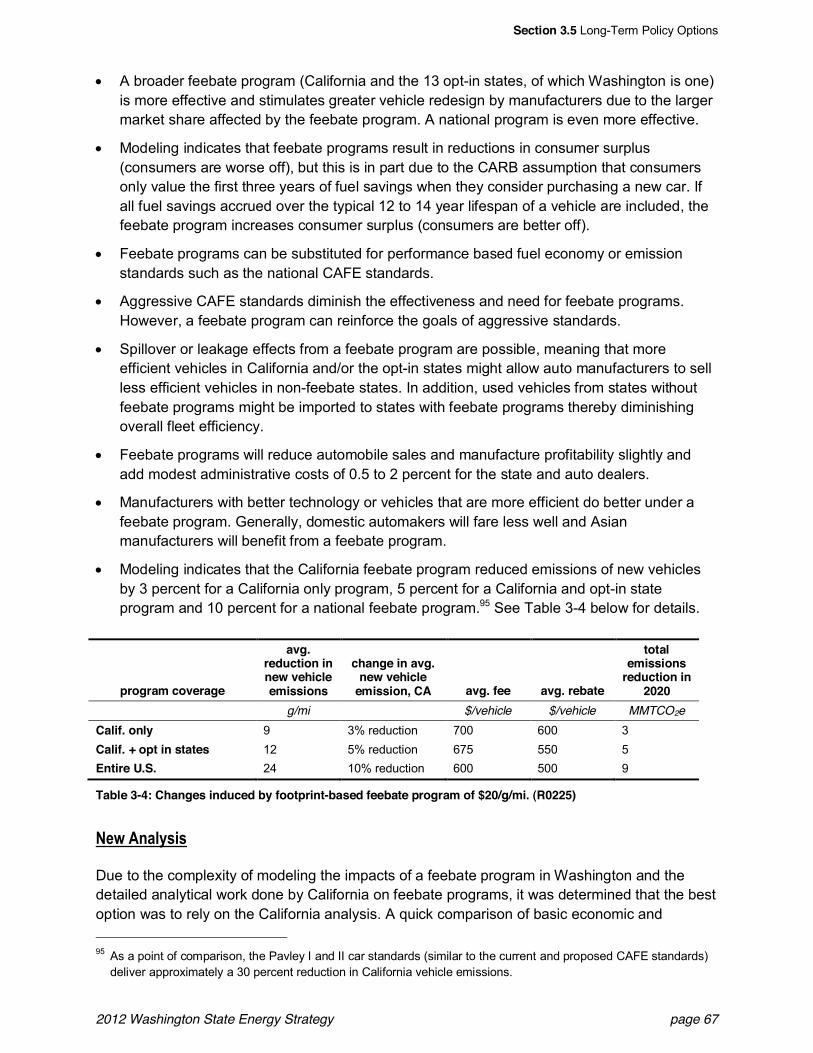
Section 3.5 Long-Term Policy Options
2012 Washington State Energy Strategy page 67
! A broader feebate program (California and the 13 opt-in states, of which Washington is one)is more effective and stimulates greater vehicle redesign by manufacturers due to the largermarket share affected by the feebate program. A national program is even more effective.
! Modeling indicates that feebate programs result in reductions in consumer surplus(consumers are worse off), but this is in part due to the CARB assumption that consumersonly value the first three years of fuel savings when they consider purchasing a new car. Ifall fuel savings accrued over the typical 12 to 14 year lifespan of a vehicle are included, thefeebate program increases consumer surplus (consumers are better off).
! Feebate programs can be substituted for performance based fuel economy or emissionstandards such as the national CAFE standards.
! Aggressive CAFE standards diminish the effectiveness and need for feebate programs.However, a feebate program can reinforce the goals of aggressive standards.
! Spillover or leakage effects from a feebate program are possible, meaning that moreefficient vehicles in California and/or the opt-in states might allow auto manufacturers to sellless efficient vehicles in non-feebate states. In addition, used vehicles from states withoutfeebate programs might be imported to states with feebate programs thereby diminishingoverall fleet efficiency.
! Feebate programs will reduce automobile sales and manufacture profitability slightly andadd modest administrative costs of 0.5 to 2 percent for the state and auto dealers.
! Manufacturers with better technology or vehicles that are more efficient do better under afeebate program. Generally, domestic automakers will fare less well and Asianmanufacturers will benefit from a feebate program.
! Modeling indicates that the California feebate program reduced emissions of new vehiclesby 3 percent for a California only program, 5 percent for a California and opt-in stateprogram and 10 percent for a national feebate program.95 See Table 3-4 below for details.
program coverage
avg.reduction innew vehicleemissions
change in avg.new vehicle
emission, CA avg. fee avg. rebate
totalemissions
reduction in2020
g/mi $/vehicle $/vehicle MMTCO2eCalif. only 9 3% reduction 700 600 3Calif. + opt in states 12 5% reduction 675 550 5Entire U.S. 24 10% reduction 600 500 9
Table 3-4: Changes induced by footprint-based feebate program of $20/g/mi. (R0225)
W%0&-*"$=,5,
Due to the complexity of modeling the impacts of a feebate program in Washington and thedetailed analytical work done by California on feebate programs, it was determined that the bestoption was to rely on the California analysis. A quick comparison of basic economic and
95 As a point of comparison, the Pavley I and II car standards (similar to the current and proposed CAFE standards)deliver approximately a 30 percent reduction in California vehicle emissions.
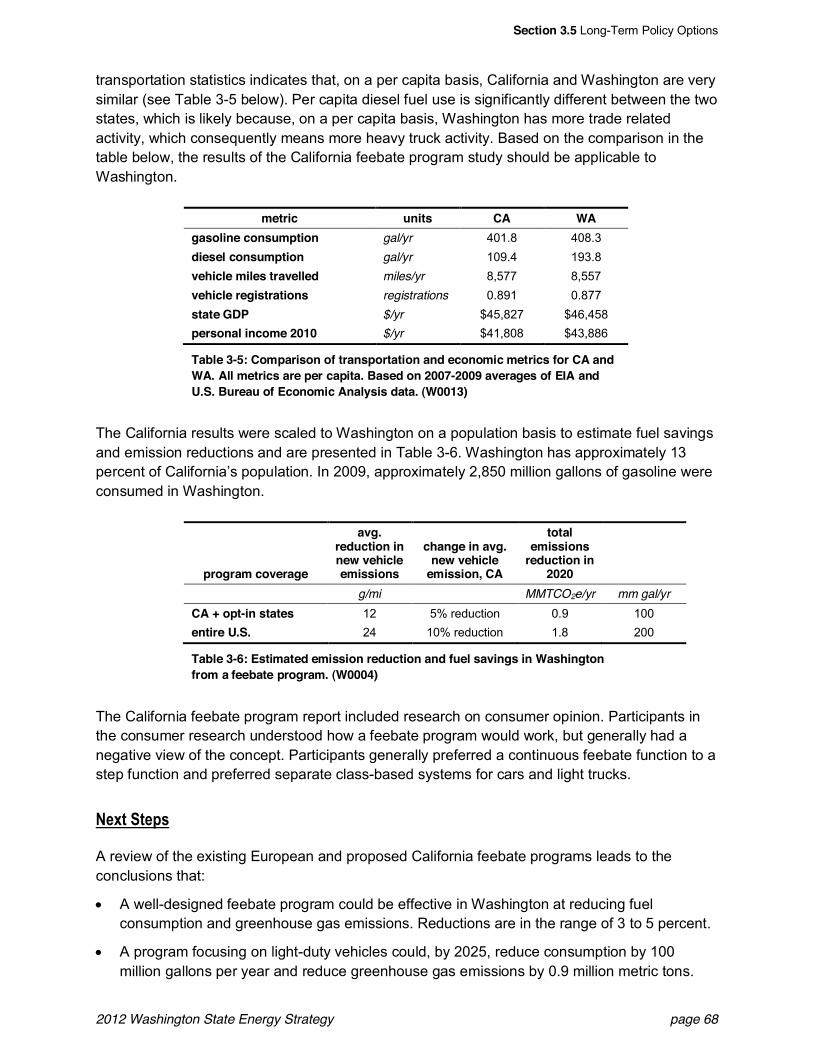
Section 3.5 Long-Term Policy Options
2012 Washington State Energy Strategy page 68
transportation statistics indicates that, on a per capita basis, California and Washington are verysimilar (see Table 3-5 below). Per capita diesel fuel use is significantly different between the twostates, which is likely because, on a per capita basis, Washington has more trade relatedactivity, which consequently means more heavy truck activity. Based on the comparison in thetable below, the results of the California feebate program study should be applicable toWashington.
metric units CA WAgasoline consumption gal/yr 401.8 408.3diesel consumption gal/yr 109.4 193.8vehicle miles travelled miles/yr 8,577 8,557vehicle registrations registrations 0.891 0.877state GDP $/yr $45,827 $46,458personal income 2010 $/yr $41,808 $43,886
Table 3-5: Comparison of transportation and economic metrics for CA andWA. All metrics are per capita. Based on 2007-2009 averages of EIA andU.S. Bureau of Economic Analysis data. (W0013)
The California results were scaled to Washington on a population basis to estimate fuel savingsand emission reductions and are presented in Table 3-6. Washington has approximately 13percent of California s population. In 2009, approximately 2,850 million gallons of gasoline wereconsumed in Washington.
program coverage
avg.reduction innew vehicleemissions
change in avg.new vehicle
emission, CA
totalemissions
reduction in2020
g/mi MMTCO2e/yr mm gal/yrCA + opt-in states 12 5% reduction 0.9 100entire U.S. 24 10% reduction 1.8 200
Table 3-6: Estimated emission reduction and fuel savings in Washingtonfrom a feebate program. (W0004)
The California feebate program report included research on consumer opinion. Participants inthe consumer research understood how a feebate program would work, but generally had anegative view of the concept. Participants generally preferred a continuous feebate function to astep function and preferred separate class-based systems for cars and light trucks.
W%:+&<+%?,
A review of the existing European and proposed California feebate programs leads to theconclusions that:
! A well-designed feebate program could be effective in Washington at reducing fuelconsumption and greenhouse gas emissions. Reductions are in the range of 3 to 5 percent.
! A program focusing on light-duty vehicles could, by 2025, reduce consumption by 100million gallons per year and reduce greenhouse gas emissions by 0.9 million metric tons.
Section 3.5 Long-Term Policy Options
2012 Washington State Energy Strategy page 69
! The effectiveness of a feebate program is dependent on California and other states adoptingsimilar programs.
! Aggressive CAFE standards reduce the quantitative effect of a feebate program on fuelconsumption, though a continuous improvement pivot point can allow the two programs towork together neatly.
! A feebate program with two or three categories is likely the most viable and equitable for thestate. Relying on federal CAFE categorizations would be the most direct approach.
! The rate at which the fee or rebate rises or falls with fuel efficiency must be high enough toinduce behavior change in consumers. California research indicated that a fee of $20/gramof CO2 would be effective. Further research is required in this area.
! The most efficient point to collect the vehicle fee or rebate is at the automotive dealership.
! Administrative costs are anticipated to be small: 0.5 to 2 percent of total fee and rebates.
Feebates deserve ongoing attention as the state continues to develop its energy policy.
D4F4A V'0&)"6#'*&T;%$&<+"*1"61
C'$5.=&U?+5'*
An LCFS is a policy framework for reducing greenhouse gas emissions by setting standards forthe carbon intensity of transportation fuels. Carbon intensity is a measurement of the lifecycleemissions of greenhouse gas per unit of delivered energy or, alternatively, per unit of distancedriven. An LCFS is designed to be technology neutral: it does not boost specific fuels but rathersets a performance standard that regulated parties must meet.
C6%75';,&Q%,%"6.>&"*1&9:?%65%*.%
The first LCFS in the world was designed, analyzed and implemented by California following a2007 executive order by Governor Arnold Schwarzenegger.96 Links to the significant body ofwork by CARB on California s LCFS can be found at the program s website.97 Since fuel carbonintensity depends on many parameters whose values may vary from state to state, it is notpossible to extrapolate the California analysis to Washington. Hence, Ecology led its own in-depth assessment of the feasibility of adopting a California-style LCFS to help achieve thestate s greenhouse gas reduction goals.98 Ecology collaborated with TIAX LLC to perform theanalysis of possible implementation pathways and their environmental impacts, and with OFMto analyze the economic effects.99
96 Executive Order S-1-07, January 19, 2007. (R0108)97 http://www.arb.ca.gov/fuels/lcfs/lcfs.htm (R0109)98 Pursuant to Washington State Executive Order 09-05. The report is A Low Carbon Fuel Standard in Washington:
Informing the Decision, Washington State Department of Ecology, February 18 2011, available athttp://www.ecy.wa.gov/climatechange/fuelstandards.htm. (S0014)
99 Ecology & TIAX adapted the GREET and VISION models, both from Argonne National Laboratory, as the vehicleand fuel modeling platform. For the macroeconomic analysis, they used REMI.
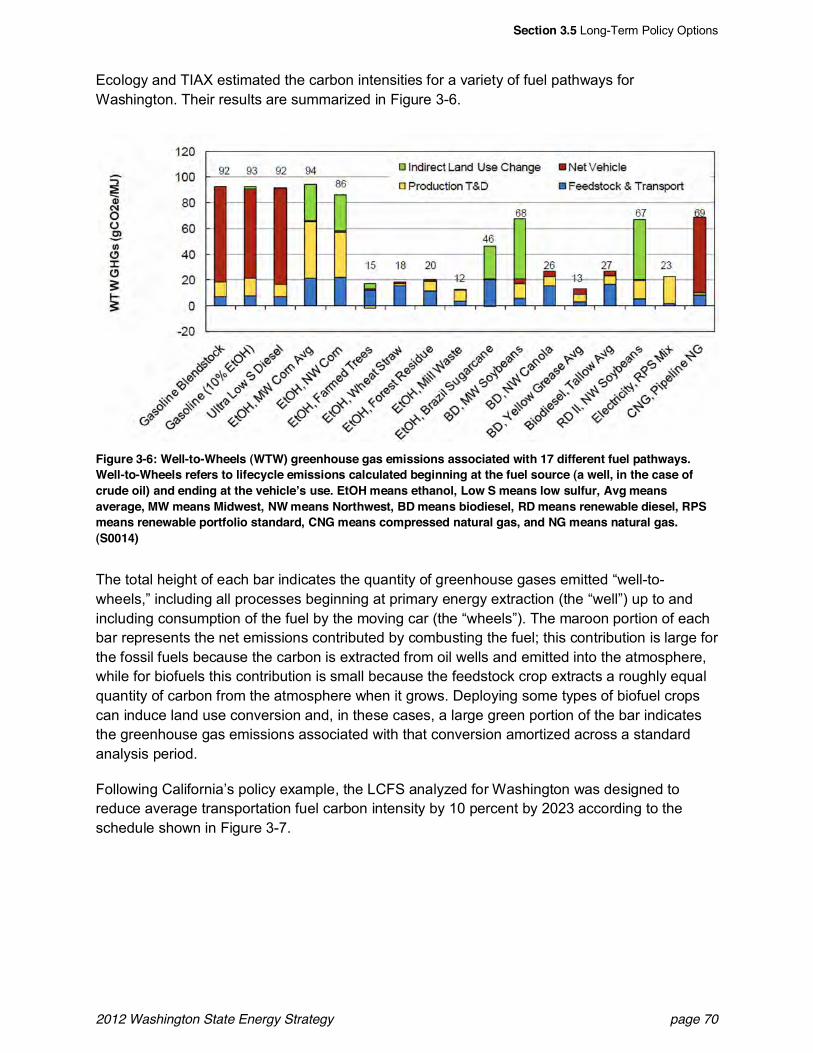
Section 3.5 Long-Term Policy Options
2012 Washington State Energy Strategy page 70
Ecology and TIAX estimated the carbon intensities for a variety of fuel pathways forWashington. Their results are summarized in Figure 3-6.
Figure 3-6: Well-to-Wheels (WTW) greenhouse gas emissions associated with 17 different fuel pathways.Well-to-Wheels refers to lifecycle emissions calculated beginning at the fuel source (a well, in the case ofcrude oil) and ending at the vehicle s use. EtOH means ethanol, Low S means low sulfur, Avg meansaverage, MW means Midwest, NW means Northwest, BD means biodiesel, RD means renewable diesel, RPSmeans renewable portfolio standard, CNG means compressed natural gas, and NG means natural gas.(S0014)
The total height of each bar indicates the quantity of greenhouse gases emitted well-to-wheels, including all processes beginning at primary energy extraction (the well ) up to andincluding consumption of the fuel by the moving car (the wheels ). The maroon portion of eachbar represents the net emissions contributed by combusting the fuel; this contribution is large forthe fossil fuels because the carbon is extracted from oil wells and emitted into the atmosphere,while for biofuels this contribution is small because the feedstock crop extracts a roughly equalquantity of carbon from the atmosphere when it grows. Deploying some types of biofuel cropscan induce land use conversion and, in these cases, a large green portion of the bar indicatesthe greenhouse gas emissions associated with that conversion amortized across a standardanalysis period.
Following California s policy example, the LCFS analyzed for Washington was designed toreduce average transportation fuel carbon intensity by 10 percent by 2023 according to theschedule shown in Figure 3-7.
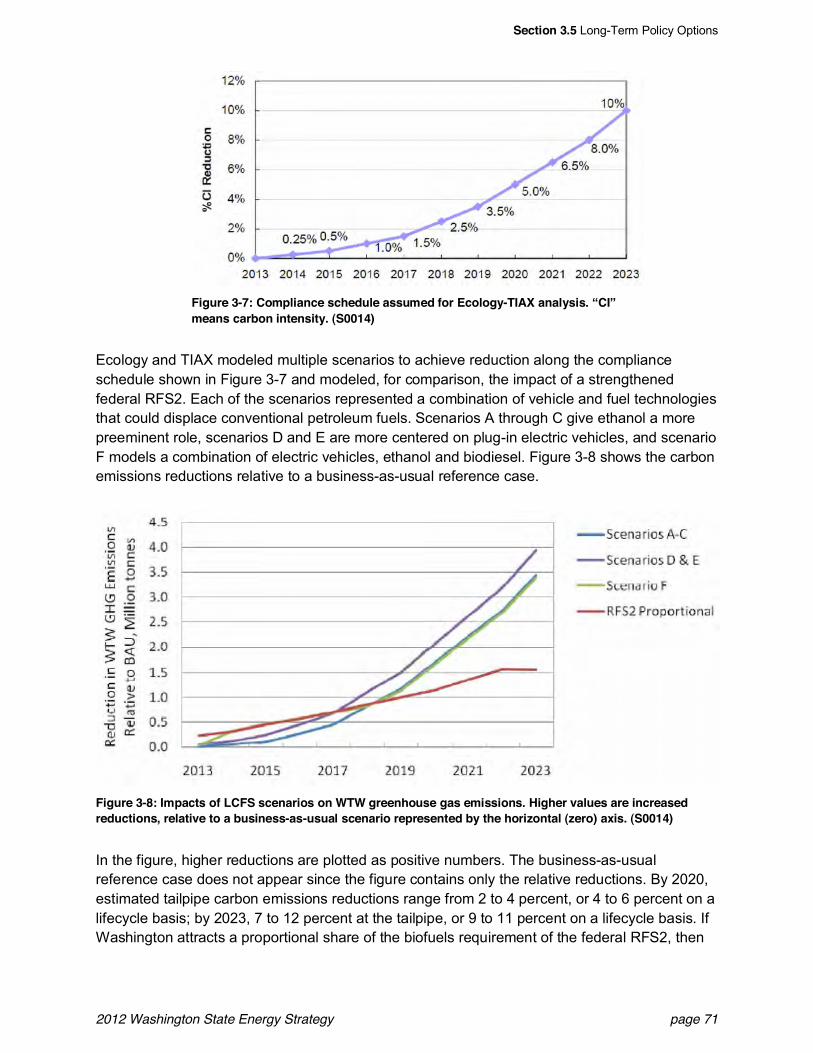
Section 3.5 Long-Term Policy Options
2012 Washington State Energy Strategy page 71
Figure 3-7: Compliance schedule assumed for Ecology-TIAX analysis. CImeans carbon intensity. (S0014)
Ecology and TIAX modeled multiple scenarios to achieve reduction along the complianceschedule shown in Figure 3-7 and modeled, for comparison, the impact of a strengthenedfederal RFS2. Each of the scenarios represented a combination of vehicle and fuel technologiesthat could displace conventional petroleum fuels. Scenarios A through C give ethanol a morepreeminent role, scenarios D and E are more centered on plug-in electric vehicles, and scenarioF models a combination of electric vehicles, ethanol and biodiesel. Figure 3-8 shows the carbonemissions reductions relative to a business-as-usual reference case.
Figure 3-8: Impacts of LCFS scenarios on WTW greenhouse gas emissions. Higher values are increasedreductions, relative to a business-as-usual scenario represented by the horizontal (zero) axis. (S0014)
In the figure, higher reductions are plotted as positive numbers. The business-as-usualreference case does not appear since the figure contains only the relative reductions. By 2020,estimated tailpipe carbon emissions reductions range from 2 to 4 percent, or 4 to 6 percent on alifecycle basis; by 2023, 7 to 12 percent at the tailpipe, or 9 to 11 percent on a lifecycle basis. IfWashington attracts a proportional share of the biofuels requirement of the federal RFS2, then
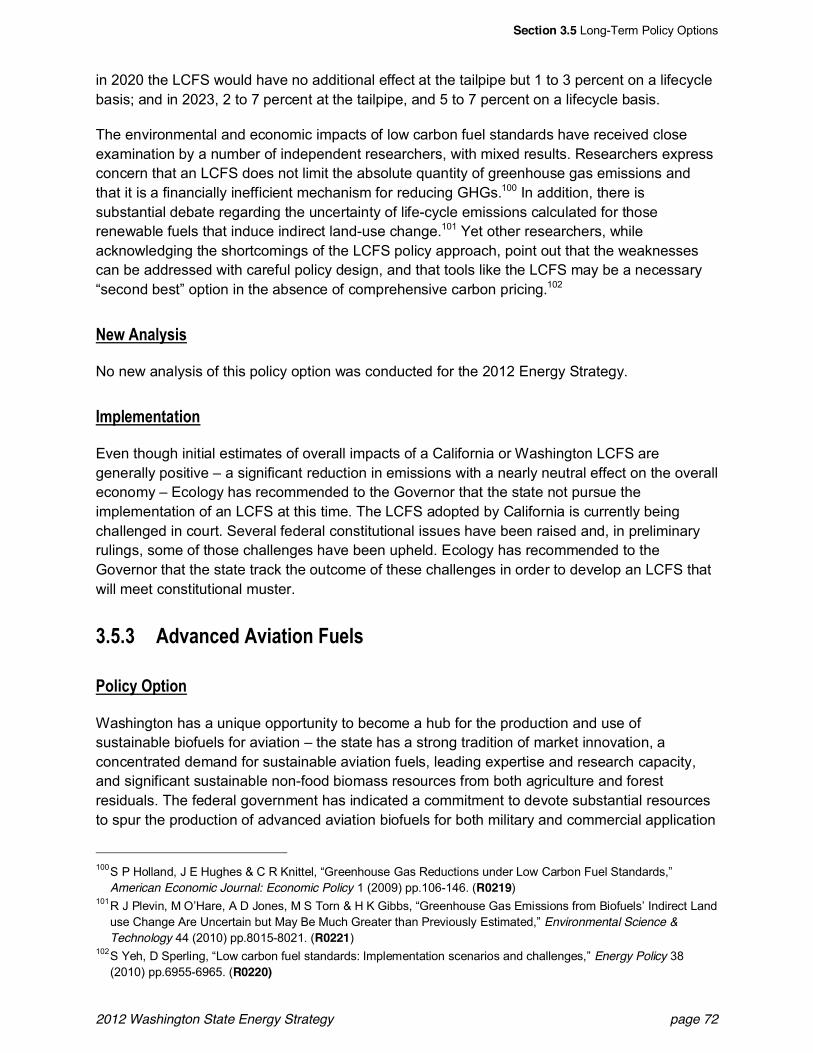
Section 3.5 Long-Term Policy Options
2012 Washington State Energy Strategy page 72
in 2020 the LCFS would have no additional effect at the tailpipe but 1 to 3 percent on a lifecyclebasis; and in 2023, 2 to 7 percent at the tailpipe, and 5 to 7 percent on a lifecycle basis.
The environmental and economic impacts of low carbon fuel standards have received closeexamination by a number of independent researchers, with mixed results. Researchers expressconcern that an LCFS does not limit the absolute quantity of greenhouse gas emissions andthat it is a financially inefficient mechanism for reducing GHGs.100 In addition, there issubstantial debate regarding the uncertainty of life-cycle emissions calculated for thoserenewable fuels that induce indirect land-use change.101 Yet other researchers, whileacknowledging the shortcomings of the LCFS policy approach, point out that the weaknessescan be addressed with careful policy design, and that tools like the LCFS may be a necessarysecond best option in the absence of comprehensive carbon pricing.102
W%0&-*"$=,5,
No new analysis of this policy option was conducted for the 2012 Energy Strategy.
M3?$%3%*+"+5'*
Even though initial estimates of overall impacts of a California or Washington LCFS aregenerally positive a significant reduction in emissions with a nearly neutral effect on the overalleconomy Ecology has recommended to the Governor that the state not pursue theimplementation of an LCFS at this time. The LCFS adopted by California is currently beingchallenged in court. Several federal constitutional issues have been raised and, in preliminaryrulings, some of those challenges have been upheld. Ecology has recommended to theGovernor that the state track the outcome of these challenges in order to develop an LCFS thatwill meet constitutional muster.
D4F4D -17"*.%1&-75"+5'*&T;%$,
C'$5.=&U?+5'*
Washington has a unique opportunity to become a hub for the production and use ofsustainable biofuels for aviation the state has a strong tradition of market innovation, aconcentrated demand for sustainable aviation fuels, leading expertise and research capacity,and significant sustainable non-food biomass resources from both agriculture and forestresiduals. The federal government has indicated a commitment to devote substantial resourcesto spur the production of advanced aviation biofuels for both military and commercial application
100 S P Holland, J E Hughes & C R Knittel, Greenhouse Gas Reductions under Low Carbon Fuel Standards,American Economic Journal: Economic Policy 1 (2009) pp.106-146. (R0219)
101 R J Plevin, M O Hare, A D Jones, M S Torn & H K Gibbs, Greenhouse Gas Emissions from Biofuels Indirect Landuse Change Are Uncertain but May Be Much Greater than Previously Estimated, Environmental Science &Technology 44 (2010) pp.8015-8021. (R0221)
102 S Yeh, D Sperling, Low carbon fuel standards: Implementation scenarios and challenges, Energy Policy 38(2010) pp.6955-6965. (R0220)
Section 3.5 Long-Term Policy Options
2012 Washington State Energy Strategy page 73
in the coming years. This has the potential to reduce dependence on foreign sources of fossilfuels, reduce greenhouse gases and foster economic growth and jobs in Washington.
A targeted, strategic policy focus on sustainable aviation biofuels in Washington can encouragethe realization of this potential. This policy focus could include targeting aviation biofuels in stateincentive programs, strengthening research and development efforts, facilitating siting andpermitting for pilot projects, job training, infrastructure development, and conducting lifecycleanalyses of new technologies and pathways to ensure sustainability.
C6%75';,&Q%,%"6.>&"*1&9:?%65%*.%
Advanced biofuels have already been produced and used in test flights of both military andcommercial aircraft. Drop-in biofuels are intended to meet the same safety and performancestandards as existing petroleum-based aviation fuels, and require no retooling of distribution,storage and fueling infrastructure. The international body that ensures that safety and technicalstandards are met for all fuels, ASTM International, has already approved a 50 percent biofuelblend for one jet fuel technology and others are expected. The U.S. Air Force has announcedthat it plans to meet 50 percent of its domestic jet fuel needs from sustainable biofuels by 2016.
In May 2011, Sustainable Aviation Fuels Northwest (SAFN) released a significant reportresulting from a broad-based stakeholder effort led by Alaska Airlines, the Boeing Company, theports of Seattle, Portland and Spokane, and WSU.103 The report explores the opportunities andchallenges of sustainable production of biofuels for aviation in Northwest states.
According to the SAFN report, Washington and the Northwest present a substantial market forsustainable aviation biofuels, with 865 million gallons consumed annually for commercial andmilitary airplane use in Washington, Oregon, Idaho and Montana. By 2030, that demand isprojected to grow to more than one billion gallons per year. The aviation industry presents aconcentrated market with a relatively small number of fueling points. For the near future,commercial and military jet aircraft will need liquid, high energy-density fuels.
Washington is home to supplies of a number of promising sustainable feedstocks, includingforest residues, oilseed crops, algae, and municipal and industrial solid wastes. Severalconversion technologies are also in use or in development in Washington.
In its 2011 session, the Legislature passed SHB 1422, authorizing a residual forest biomass-to-aviation fuel demonstration project as a joint effort between the departments of NaturalResources and Commerce, with UW and WSU. The project is intended to link Washington sforest products and aviation industries in producing sustainable aviation biofuels with feedstockfrom the state s public and private forestlands.
W%0&-*"$=,5,
No new analysis of this policy option was conducted for the 2012 Washington State EnergyStrategy.
103 http://www.safnw.com/ (R0110)
Section 3.5 Long-Term Policy Options
2012 Washington State Energy Strategy page 74
W%:+&<+%?,
Multiple private sector initiatives are underway to bring commercial-scale production facilities tofruition in Washington. Both AltAir Fuels and Imperium Renewables are planning major drop-inaviation biofuel production facilities.
The U.S. Department of Agriculture, through its Agriculture and Food Research Initiative (AFRI),has awarded $80 million in new research funds over the next five years to broad-based regionalresearch consortia led by WSU and UW to develop feedstocks and next generation processtechnologies for drop-in aviation biofuels, the largest grants USDA has ever awarded.
D4F4E M3?6'7%3%*+,&+'&Q"5$6'"1,
C'$5.=&U?+5'*
Rail transport is one of the most energy efficient ways to move people and goods along majorcorridors in general, rail emissions are two to four times less than for the same trip or serviceby car or truck. The energy efficiency advantages of rail apply both to freight railroads andintercity passenger service. The vast majority of railroads are privately owned and only indirectlyaffected by state policy, but several state-level actions could help facilitate the increased use ofrail or increase the energy efficiency of rail. In addition, Washington s High Speed RailProgram,104 when completed in 2017, will lead to energy savings and emission reductions byreducing travel time and improving reliability, and purchasing new locomotives that are moreenergy efficient and environmentally friendly.
In the 2008 state Climate Action Team report, a number of projects and actions to eliminatebottlenecks and increase capacity for freight and passenger rail were identified based on priorplanning and analysis efforts. Some of these projects have been implemented while others havenot:
! Invest in capital projects that make improvements to support freight rail, AMTRAK andSounder service.
! Support the creation of joint operating and trackage agreements between the BNSF Railwayand the Union Pacific (UP) Railroad to allow equal access to mainline infrastructure, such asthe current and future Stampede Pass tunnel and the Columbia River Gorge mainlines.
! Invest in the Stampede Pass line to allow for double-stack service.
! Work with the Class 1 railroads to make the improvements needed to operate the BNSF andUP lines along the Columbia River as directional running corridors.
! Increase Amtrak Cascades ridership to reduce energy use in other modes, such ashighway.
! Maintain a substantive program for improving and maintaining short-line railroads that havesufficient projected freight to make a difference in air quality.
104http://www.wsdot.wa.gov/News/2011/02/26_HighSpeedRailAgreements.htm (S0081)
Section 3.5 Long-Term Policy Options
2012 Washington State Energy Strategy page 75
! Work to facilitate links to other rail forms of non-SOV travel.
In addition, the 2008 Climate Action Team report identified rail recommendations in the followingcategories:
! Preserve the potential for a future east-west freight corridor and increase its capacity inorder to encourage more freight shifting from high energy consuming modes to rail.
! Improve capacity by extending the sunset date for the Ellensburg Lind section of the oldMilwaukee Road.
! Complete the freight action strategy corridor and other grade separation projects thatsignificantly reduce idling of cars and trucks.
! Further improve the fuel efficiency and reduce the air emissions of the equipment used byfreight railroads.
! Develop a methodology for determining when rail electrification might become viable inWashington, including how to leverage future federal grants and investments in railelectrification.
Analysis in 2012 will evaluate the status of these projects and actions and identify the newprojects and actions that will reduce energy consumption and emissions. The analysis willexamine which will require state-level actions, whether implementation is still warranted andstrategies for implementation, and additional state-level actions.
C6%75';,&Q%,%"6.>&"*1&9:?%65%*.%
The Climate Action Team processes in 2007 and 2008 estimated the potential greenhouse gasemissions impacts from improving freight and passenger railroads.105
W%0&-*"$=,5,
No new analysis of this policy option was conducted for the 2012 Energy Strategy. Analysis andimplementation recommendations beyond those developed as part of the 2008 Climate ActionTeam process will occur in 2012. The analysis will include reviewing analysis conducted in 2007and 2008 and updating the analysis as appropriate based on more recent research andimplementation reports.
W%:+&<+%?,
Identify resources for additional analysis in 2012 to support implementation. The additionalanalysis to be carried out in 2012 includes:
! Evaluate the potential energy saving and emission reduction effect of the Pacific NorthwestRail Corridor High Speed Rail Program.
105 Leading the Way -Implementing Practical Solutions to the Climate Change Challenge, November 2008; (S0003);and Washington Climate Action Team Transportation Policy Option Descriptions, December 2007. (S0044)
Section 3.5 Long-Term Policy Options
2012 Washington State Energy Strategy page 76
! Review rail recommendations from the 2008 Climate Action Team report to summarizewhich recommendations remain to be carried out, which should still be carried out thatrequire state-level action, and update state-level implementation actions.
! Identify potential additional state-level recommendations to advance implementation ofexpanded freight and passenger rail systems and networks.
! Consider policies and incentives to encourage use of biodiesel-blends to fuel locomotives.
D4F4F )'3?6%>%*,57%&!65?&Q%1;.+5'*&C6'26"3
C'$5.=&U?+5'*
About 75 percent of vehicle travel is not associated with the commute trip to work. This strategywould build upon the state s commute trip reduction program to encourage all travelers, not justcommuters, to use the transportation system in a more energy efficient manner. This strategy iscentered on outreach and education and would include a broad statewide education campaignand community-based trip reduction programs:
! A broad-based education campaign to encourage people to try energy efficienttransportation choices and behaviors, from walking and bicycling to using fuel efficientdriving practices that can provide cost savings to people and businesses and offer healthbenefits.
! A residential-based trip reduction program that uses social or individualized marketingstrategies to educate travelers about their options. The approach would be inclusive of alltrip purposes and all potential modes of travel, with the goal of getting people to change theeasy trips first and build on that success. The program may be adapted to other markets residential, schools, institutions and employment centers.
Examples of successful residential-based trip reduction programs include Whatcom County sSmart Trips program and King County s In Motion program. Such programs use a variety ofoutreach techniques to encourage individuals to learn more about their travel options.Individuals who reduce their driving and report on their changed behavior can earn rewards andprizes. The common elements of these programs include using all trips as candidates forchange, community identification and local community support, a pledge and reward system toencourage sustained behavior change, and ongoing communication and education aboutoptions and program results.
C6%75';,&Q%,%"6.>&"*1&9:?%65%*.%
Based on National Household Travel Survey data in 2009, getting to and from work accountedfor about 27 percent of household VMT. Work-related business was 8.4 percent of the VMT in2001, but declined to 6.7 percent in 2009, possibly due to advancements in computingtechnology making it possible for more business to be handled electronically. The VMT forshopping were almost 16 percent of total VMT, up about 1 percent from the 2001 level.106
106http://www1.eere.energy.gov/vehiclesandfuels/facts/m/2010_fotw616.html. (R0111)
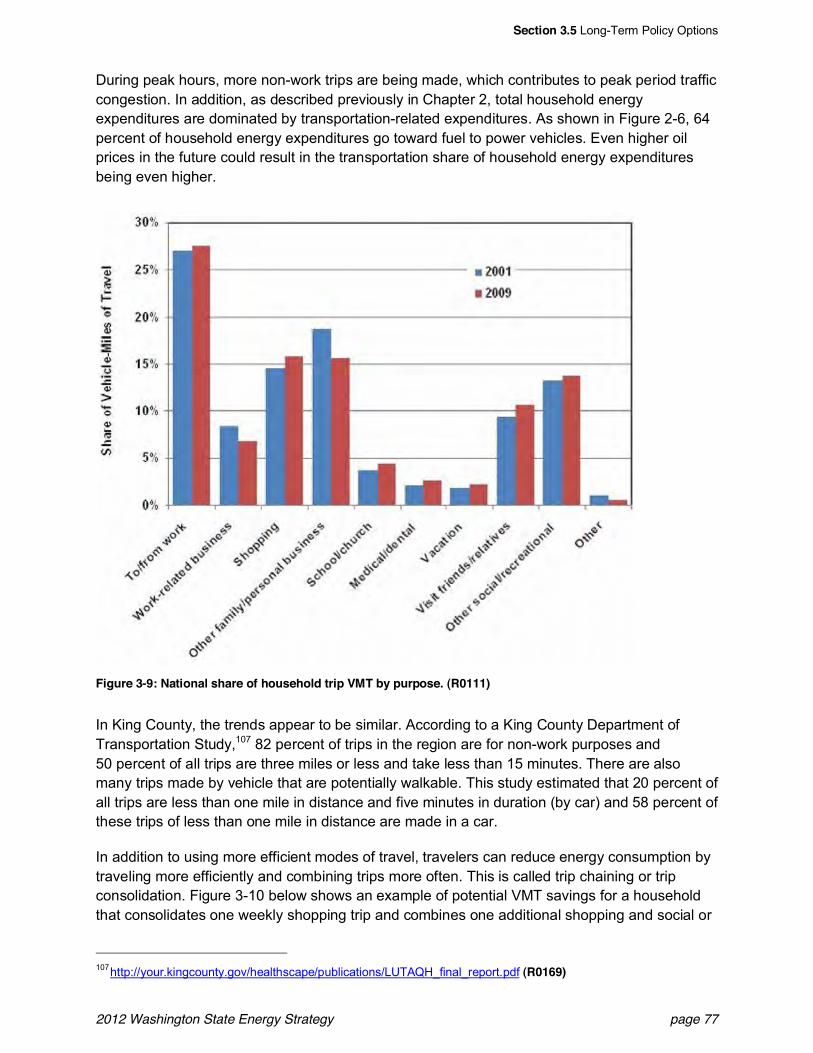
Section 3.5 Long-Term Policy Options
2012 Washington State Energy Strategy page 77
During peak hours, more non-work trips are being made, which contributes to peak period trafficcongestion. In addition, as described previously in Chapter 2, total household energyexpenditures are dominated by transportation-related expenditures. As shown in Figure 2-6, 64percent of household energy expenditures go toward fuel to power vehicles. Even higher oilprices in the future could result in the transportation share of household energy expendituresbeing even higher.
Figure 3-9: National share of household trip VMT by purpose. (R0111)
In King County, the trends appear to be similar. According to a King County Department ofTransportation Study,107 82 percent of trips in the region are for non-work purposes and50 percent of all trips are three miles or less and take less than 15 minutes. There are alsomany trips made by vehicle that are potentially walkable. This study estimated that 20 percent ofall trips are less than one mile in distance and five minutes in duration (by car) and 58 percent ofthese trips of less than one mile in distance are made in a car.
In addition to using more efficient modes of travel, travelers can reduce energy consumption bytraveling more efficiently and combining trips more often. This is called trip chaining or tripconsolidation. Figure 3-10 below shows an example of potential VMT savings for a householdthat consolidates one weekly shopping trip and combines one additional shopping and social or
107http://your.kingcounty.gov/healthscape/publications/LUTAQH_final_report.pdf (R0169)
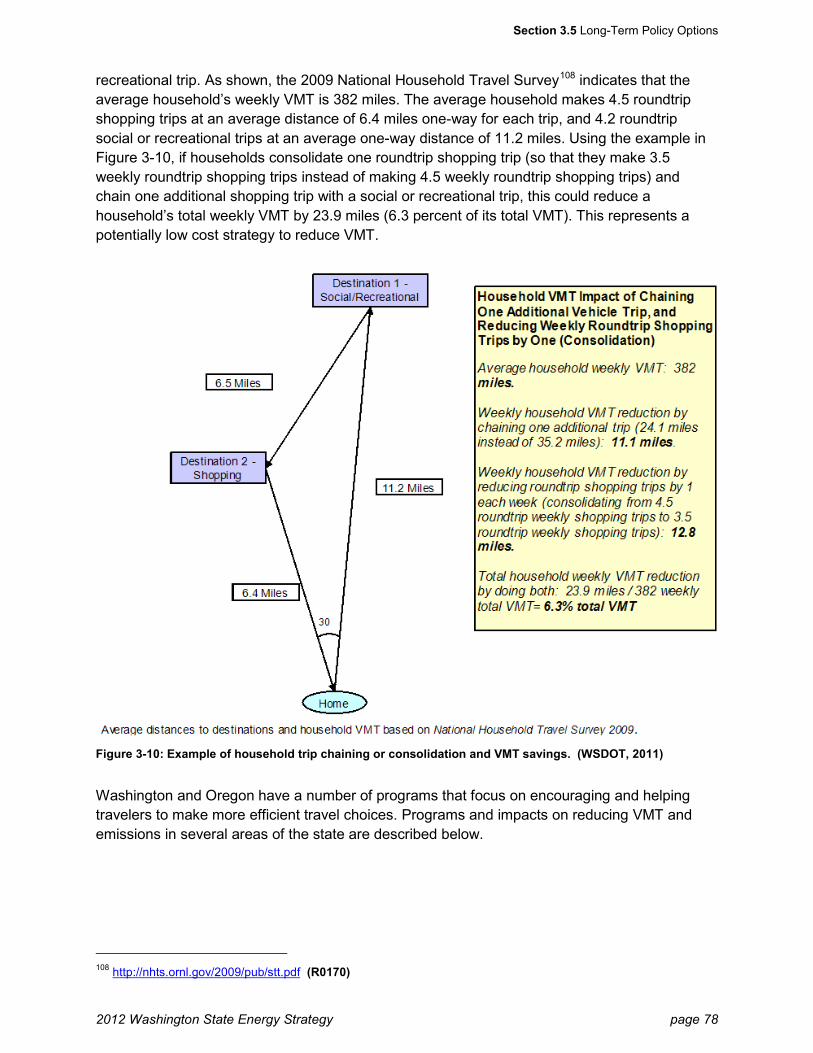
Section 3.5 Long-Term Policy Options
2012 Washington State Energy Strategy page 78
recreational trip. As shown, the 2009 National Household Travel Survey108 indicates that the average household’s weekly VMT is 382 miles. The average household makes 4.5 roundtrip shopping trips at an average distance of 6.4 miles one-way for each trip, and 4.2 roundtrip social or recreational trips at an average one-way distance of 11.2 miles. Using the example in Figure 3-10, if households consolidate one roundtrip shopping trip (so that they make 3.5 weekly roundtrip shopping trips instead of making 4.5 weekly roundtrip shopping trips) and chain one additional shopping trip with a social or recreational trip, this could reduce a household’s total weekly VMT by 23.9 miles (6.3 percent of its total VMT). This represents a potentially low cost strategy to reduce VMT.
Figure 3-10: Example of household trip chaining or consolidation and VMT savings. (WSDOT, 2011)
Washington and Oregon have a number of programs that focus on encouraging and helping travelers to make more efficient travel choices. Programs and impacts on reducing VMT and emissions in several areas of the state are described below.
108 http://nhts.ornl.gov/2009/pub/stt.pdf (R0170)
Section 3.5 Long-Term Policy Options
2012 Washington State Energy Strategy page 79
\5*2&)';*+= 6-)?"+,"- &)'33;*5+=XL",%1&!6"7%$&L%>"75'6&)>"*2%
King County s In Motion109 program was designed to address the full range of trip destinationsand purposes (including discretionary trips) and to work directly with individuals rather thanthrough a representative, such as an employer. In Motion incorporates all the key elements ofcommunity-based social marketing, including direct outreach, a specific call to action (e.g.,change two drive-alone trips per week to some other mode), incentives and follow up (e.g., tripreporting, surveys). Based on the success of the initial pilots, In Motion is an ongoing tool todecrease drive alone trips and increase the use of alternative modes in target neighborhoods oron selected transit routes, and to mitigate the impacts of major highway construction projects.
Through 2010, In Motion has been implemented in over 20 neighborhoods across King County,reaching over 70,000 households. Based only on the number of trips actually reported byparticipants during the course of a project (i.e., not annualized), on average a participant in a12-week In Motion program will reduce VMT by 153 and CO2 by 155 pounds. For a typicalproject of 3,500 households, In Motion will save 57,051 VMT, 3,754 gallons of gas and 54,632pounds (27 tons) of CO2. Based on survey data from participants, the program typically resultsin a 20-plus percent reduction in drive alone travel and varying levels of increase in all othermodes, depending on the availability of services and infrastructure in that neighborhood. About50 percent of the trips changed by participants are for work. The other 50 percent are spreadamong shopping, appointments, recreation and other purposes.
P>"+.'3&<3"6+&!65?,
Whatcom Smart Trips is a community-wide vehicle trip reduction program implemented by theWhatcom Council of Governments (WCOG) and the Whatcom Transportation Authority (WTA)in July 2006. The program focuses on affecting trips of all types; component programs include atravel diary,110 incentives, Emergency Ride Home, employer partners, targeted outreach, schoolprograms, a bike program,111 public awareness campaigns and a neighborhood-based program.
A 2008 Neighborhood Smart Trips campaign targeted 10,037 Bellingham households, aboutone-third of the city. Contact was made with 89 percent of the targeted households and almosthalf expressed interest in receiving educational materials and assistance. According to theprogram s 2009 follow-up survey, the targeted area experienced the following:
! 22 percent increase in walking trips
! 35 percent increase in bicycling trips
! 10 percent increase in transit trips
! 25 percent increase in physical activity associated with active transportation trips
! 13 percent decrease in vehicle trips
! 15 percent decrease in vehicle miles traveled
109 http://www.kingcounty.gov/inmotion (R0171)110 www.WhatcomSmartTrips.org (R0172)111 www.everybodyBIKE.com (R0173)
Section 3.5 Long-Term Policy Options
2012 Washington State Energy Strategy page 80
! 3,500 ton decrease in greenhouse gases
)5+=&'(&<%"++$% ,@40)+")A"1)B$4++($C&C6'26"3,
Way to Go, Seattle!112 includes a variety of programs intended to encourage more efficienttravel for all trip types. Following are brief descriptions of two current programs.
! One Less Car Challenge: For a variety of reasons (saving money, reducing stress, helpingthe environment) some people want to live with one less car in their households. The OneLess Car Challenge aims to help these people by providing personal, one-on-one support tohelp participants learn how to get around by bus, bike, foot or carpool. Forty-fourhouseholds have given up a car through the One Less Car Challenge this year to date. Ofparticipating households, 66 percent that gave up a car were one car households. Assuming4,100 miles per year per car given up, the city of Seattle estimates that roughly 180,400pounds of CO2 will be saved during the one year period during which each participant hasbeen without a car. However, the city of Seattle estimates that the amount of CO2 savedmay be more than this since their evidence suggests that most participants do not replacetheir car after they complete the challenge program.
! Walk Bike Ride Challenge: The Walk Bike Ride Challenge is a program through whichSeattle works with people who want to walk, bike and ride transit more. The city sendsparticipants information and encouragement throughout the program to help them createnew travel habits. Participants in this program can also win prizes. In 2011, Seattle has hadfour, two-month rounds of the Walk Bike Ride Challenge; and 1,628 participants havereduced CO2 emissions by 398,498 pounds by converting drive alone automobile trips totrips taken by walking, bicycling or riding some form of transit.
U6%2'* ,&8657%&V%,,]&<"7%&K'6%&)"3?"52*
The Drive Less, Save More campaign113 was launched in 2006 by the Oregon Department ofTransportation, Metro Portland regional government, and its public and private partners. Thisprogram seeks to reduce individual car trips as part of a larger solution to address trafficcongestion. The goal is to raise public awareness about the benefits of driving less through tripchaining and other smart driving strategies, such as riding transit, carpooling, vanpooling,ridesharing, telecommuting, biking and walking. Since the program launched, it has expandedbeyond the Portland metro area into Salem, Eugene and Springfield, Medford and Bend.
The program works to increase public awareness about transportation choices, especially tripchaining, to reduce car trips. The goal of this campaign is to get people to use travel options andencourage drivers to trip chain. As part of the campaign, the program has launched televisionads114 and sponsored a video challenge that invited public participation in a contest to produce atelevision ad.115
112http://www.seattle.gov/waytogo/ .(R0174)113http://www.drivelesssavemore.com/ (R0175)114 One television ad example: http://drivelesssavemore.com/how-to-videos/tv-ads/bumble-bee (R0189)115 See one here: http://www.youtube.com/user/DriveLessSaveMore#p/c/0/wepNpbCOzXY (R0190)
Section 3.5 Long-Term Policy Options
2012 Washington State Energy Strategy page 81
Now in its fifth year, nearly 19 percent of the Portland metropolitan region s population hasreduced their car trips because of Drive Less, Save More. The campaign estimates that it hasresulted in a reduction in VMT of 21.8 million miles, which leads to a reduction in greenhousegas emissions of 10,700 tons. The program also estimates that it has saved the public morethan $8 million in auto operating costs.
W%0&-*"$=,5,
No new analysis of this strategy was conducted for the 2012 Energy Strategy, but analysis willbe conducted in 2012.
W%:+&<+%?,! Implement near-term recommendations related to comprehensive trip reduction strategies
as described in Section 3.4.4 - Commute Trip Reduction Program Expansion.
! Develop toolkit that can be tailored by individual jurisdictions/organizations/communities.Could include further modifications to Rideshareonline.com for communities that need acalendaring tool.
! Provide guidance on evaluation methods and tools (including measurement surveys) andsupport for data collection, processing and evaluation.
! Assess allocating some funds from capital budgets to support program implementation aspart of capacity management.
! Develop a travel efficiency education and outreach program, potentially modeled afterrecycling campaigns in Washington or the Drive Less, Save More campaign in Oregon. Thestate would run the statewide awareness raising campaign and support local jurisdictions inactive program implementation.
D4F4G 9*%62=&9((5.5%*+&!6"*,?'6+"+5'*&)>'5.%,
C'$5.=&U?+5'*
This policy option would increase the supply of energy efficient transportation choices. Someforms of transportation are more energy efficient than others, with walking and biking being themost energy efficient forms of transportation overall. The energy efficiency of vehicles (such aspassenger cars, vans, transit and rail vehicles) is typically expressed as energy consumptionper vehicle mile. Energy efficiency of travel, however, is best expressed as energy efficiency perpassenger mile. Energy efficiency per passenger mile depends on the energy efficiency of thevehicle as well as the number of people being transported in the vehicle.
The current supply of energy efficient transportation alternatives is inadequate to maximizeenergy efficiency and, in the case of transit service, the supply is actually decreasing due todeclining sales tax revenues concurrent with increasing demand for the service. Preliminarytransportation stakeholder input received as part of development of the SES similarly suggests
Section 3.5 Long-Term Policy Options
2012 Washington State Energy Strategy page 82
that revenue to support transportation choices is inadequate. Investment in transportationalternatives must be increased to maximize transportation energy efficiency.
C6%75';,&Q%,%"6.>&"*1&9:?%65%*.%
One of the near-term strategies, Smart Growth and Transportation Planning as described inSection 3.4.5, describes how communities can grow and function to support travel that is moreenergy efficient, including facilitating more biking and walking. Compact, mixed-usecommunities can provide shorter travel distances between destinations and therefore enablemore travel by walking and biking, if safe and convenient non-motorized facilities are available.In addition, CTR and comprehensive trip reduction programs (see Sections 3.4.4 and 3.5.5)encourage an increase in more energy efficient forms of transportation, including carpooling andvanpooling.
Transit can be much more efficient than travel by passenger cars and, for this reason, the 2008Climate Action Team report considered approaches for providing transit services through theWashington Transportation Access Network (WSTAN) proposal. The WSTAN was described asa coordinated strategy to assure that public transportation provides vital transportationconnections that enable travel throughout Washington, as well as affordable alternatives to acar-dependent lifestyle.
Research of transit systems throughout the country shows that the energy efficiency of transitservice can vary widely and depend on the type of transit service, transit vehicle energyefficiency and ridership. As with passenger cars, a vehicle with more passengers will be moreenergy efficient on a passenger mile basis than a vehicle with fewer people. National dataindicates that buses and other transit vehicles are highly efficient when full. However, becausetransit buses are very heavy vehicles, they consume more energy per vehicle mile thanpassenger cars. If only a few passengers are on the bus, the efficiency per passenger mile maybe lower than a passenger car. Figure 3-11 summarizes the estimated CO2 emissions perpassenger mile for automobiles and public transportation at average and full occupancy, basedon national data. In this figure, the average number of passengers for private auto trips is 1.14for work trips and 1.63 for general trips, and the emissions factors are national averages. Manytransit agencies in Washington are more energy efficient than the national average andelectrically powered transit in the state has much lower greenhouse gas emissions perpassenger mile than the national average.
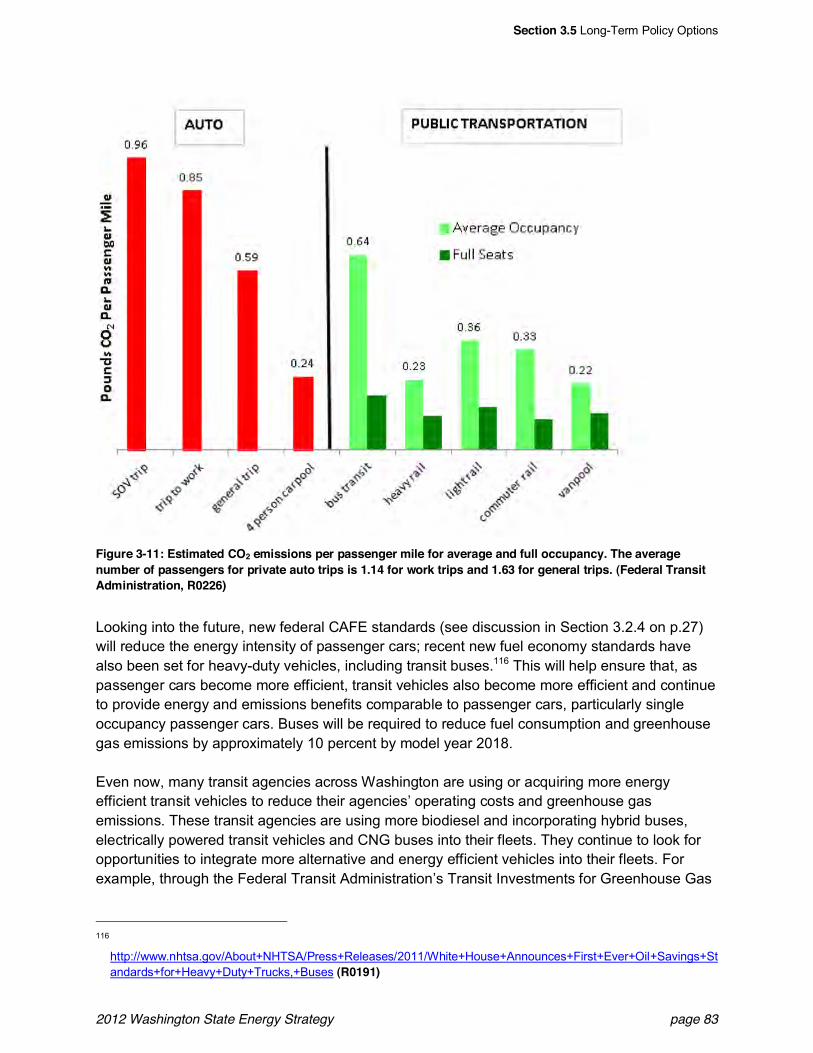
Section 3.5 Long-Term Policy Options
2012 Washington State Energy Strategy page 83
Figure 3-11: Estimated CO2 emissions per passenger mile for average and full occupancy. The averagenumber of passengers for private auto trips is 1.14 for work trips and 1.63 for general trips. (Federal TransitAdministration, R0226)
Looking into the future, new federal CAFE standards (see discussion in Section 3.2.4 on p.27)will reduce the energy intensity of passenger cars; recent new fuel economy standards havealso been set for heavy-duty vehicles, including transit buses.116 This will help ensure that, aspassenger cars become more efficient, transit vehicles also become more efficient and continueto provide energy and emissions benefits comparable to passenger cars, particularly singleoccupancy passenger cars. Buses will be required to reduce fuel consumption and greenhousegas emissions by approximately 10 percent by model year 2018.
Even now, many transit agencies across Washington are using or acquiring more energyefficient transit vehicles to reduce their agencies operating costs and greenhouse gasemissions. These transit agencies are using more biodiesel and incorporating hybrid buses,electrically powered transit vehicles and CNG buses into their fleets. They continue to look foropportunities to integrate more alternative and energy efficient vehicles into their fleets. Forexample, through the Federal Transit Administration s Transit Investments for Greenhouse Gas
116
http://www.nhtsa.gov/About+NHTSA/Press+Releases/2011/White+House+Announces+First+Ever+Oil+Savings+Standards+for+Heavy+Duty+Trucks,+Buses (R0191)
Section 3.5 Long-Term Policy Options
2012 Washington State Energy Strategy page 84
and Energy Reduction (TIGGER) program, five transit agencies in Washington were awardedgrants in November 2011 to improve the energy efficiency of their vehicle fleets:117
! Chelan ! Douglas Public Transportation Benefit Area will acquire five 100 percent batteryelectric transit vehicles and associated fast charge stations;
! Sound Transit will design, procure and install energy storage units for up to five light railvehicles to capture unused energy generated by braking, and will store that energy to powertrains;
! Intercity Transit will purchase hybrid biodiesel!"lectric replacement buses;
! The Cowlitz Transit Authority will purchase 35!foot clean fuel biodiesel buses; and
! Stillaguamish Tribe Transit Services will purchase additional hybrid sedans to expand itsrideshare program.
In addition, some transit agencies in are beginning to use energy efficiency as a performancestandard for transit service. Spokane Transit, for example, includes energy consumption as oneof the agency s three performance standards118 to measure the success of fixed-route serviceand to help determine changes to transit service. Routes are compared against annualbenchmark scores set for routes similar in service type and/or vehicle types. Any route thatperforms below the benchmark for two consecutive years for any one of the three performancestandards is considered out of compliance with the agency s fixed route service designguidelines. Spokane Transit characterizes their routes as either basic routes or commute routes.At a minimum, basic routes must meet an average passenger load factor that results in theroute being at least as energy efficient as a typical SOV. The benchmark for commuter routes ishigher and, at a minimum, these routes must be at least as energy efficient as the averageoccupancy private automobile.
Because energy volatility is expected to continue into the future, it will become increasinglyimportant to consider energy efficiency in transportation projects and services. Energy efficiencyimprovements in transit can be accomplished through improvements in vehicle technology andoperations, as well as by increasing the average passenger load. Significant improvements arepossible, even with the use of currently available transit technologies.
For instance, a recent research project for the Transit Cooperative Research Board developedscenarios that result in long-term transit efficiency improvements. One scenario presentspotential greenhouse gas emissions per passenger mile in 2030 and 2050 for a bus transitagency that adopts hybrid diesel technology, while also gaining efficiency through operationaland maintenance improvements. By 2050, the improvements result in a 62 percent reduction inemissions per passenger mile from 2010 levels.119
Some of the long-term land use changes that are critical to improving the energy efficiency ofthe overall transportation system will depend on the provision of high quality transit service. The
117 See http://fta.dot.gov/documents/2011_TIGGER-CF.FINAL.pdf for the list of all projects awarded. (R0192)118 The other two performance standards are ridership and farebox recovery ratio.119 The Route to Carbon and Energy Savings: Transit Efficiency in 2030 and 2050, Prepared for the Transit
Cooperative Research Program, November 2010. (R0193)
Section 3.5 Long-Term Policy Options
2012 Washington State Energy Strategy page 85
relationship is interdependent long-term land use changes can t occur without supportivetransit service, and transit service needs supportive land use to more efficiently provide transitservice to more people.
New Analysis
No new analysis of this policy option was conducted for the 2012 Energy Strategy. Dependingon actions or analysis undertaken at the state level to address revenue for transportation (suchas through the Connecting Washington effort), new analysis conducted as part of that or relatedefforts may be described in 2012.
W%:+&<+%?,! Coordinate with Connecting Washington effort for new revenue sources for alternative
transportation choices, including non-motorized infrastructure, transit, carpooling andvanpooling.
! Identify and advance implementation of near and long-term approaches to improve theenergy efficiency of transit services in Washington. This can include considering fundingopportunities for the acquisition of more efficient transit vehicles, and the development andimplementation of approaches to improve service and support energy efficiency goals.
! Implement recommendations in Section 3.4.5 related to land use changes that can helpsupport the long-term provision of more energy efficient transportation choices (non-motorized and transit modes).
Funding mechanisms should support transportation choices that are most consistent with near-and long-term reductions to energy consumption. These include trip reduction programs thatencourage and facilitate the use of more energy efficient modes of transportation (both centers-based programs like CTR and GTEC in Section 3.4.4 and comprehensive programs perSection 3.5.5), programs that facilitate non-motorized travel and programs that support theprovision of energy efficient transit service.
D4F4H 93%625*2&C65.5*2&K%+>'1,
C'$5.=&U?+5'*
Currently, funding for the state s highway system is drawn primarily from gasoline and dieselfuel taxes. Through careful policymaking, the state can choose to tax products in ways thatproduce socially or environmentally optimal outcomes. This is the principle behind cigarettetaxes (encouraging improved health) or proposed carbon taxes (encouraging use of low-carbonfuels).
The fuel taxes that fund highways encourage energy efficiency by making it more expensive toconsume more energy, but they lack sophistication in their relationship to the state s evolving,modern energy system. In particular, fuel taxes do not work well together with increasingly fuel-efficient vehicles: the more desirable, low-emissions, low-energy vehicles created, the lessmoney the state receives through fuel taxes to maintain and build the roads on which they drive.
Section 3.5 Long-Term Policy Options
2012 Washington State Energy Strategy page 86
It is reasonable to forecast a more distant future in which battery-electric vehicles eventuallydominate the roadways, producing an even larger drop in collections from traditional fuel taxes.Alternative pricing methods can remove an inevitable tangle between modern energy policy thatencourages efficient vehicles and the state s need to fund roadways.
The fuel tax system also runs counter to sound energy policy in that it does little to move driversaway from the congested parts of the road system. Previous research has demonstrated a clearlink between road congestion and poor fuel efficiency. If the state were to price road use insteadof fuel use, a door would open for modern, sophisticated pricing mechanisms to make lesscongested roadways lower-cost roadways, hence encouraging fuel efficient travel.
As the pressure from road congestion grows and as vehicle efficiency increases, a system-wideshift from fuel taxes to road pricing may emerge. In order to be prepared for such a shift, thestate can complement the basic understanding of mileage pricing gained through the Section3.4.8 pilot, with continued research into the costs and benefits of various system-widealternatives.
For this year s Energy Strategy, Commerce analyzed three possible tax shifts associated withthe changing picture of vehicle fuel efficiency and road pricing:
! Mileage pricing: a fixed fee on every vehicle mile traveled. This simple policy levies auniform fee to all vehicles in all locations, but more complex variants could assign differentprices to rural versus urban mileage or scale the rate according to gross vehicle weight(correlating to the amount of wear on roads). Mileage pricing encourages drivers to use thetransportation system more efficiently by reducing trip lengths or frequencies or by usingmodes of travel other than a privately owned vehicle. Mileage pricing raises the same equityconcerns already associated with fuel taxes, in which energy cost is a disproportionatelylarge fraction of the household bill for low-income groups and some rural residents. SeeTRB Special Report 303 for more analysis of equity issues associated with alternativepricing strategies.120 Careful design of the mileage pricing structure could mitigate theseconcerns.
! Congestion pricing: Congestion or time-of-day pricing charges variable fees (tolls) to roadusers, with the fee designed to be highest when and where the road is most congested.There are a variety of ways that drivers may respond to congestion pricing and not allresponses reduce energy consumption and greenhouse gas emissions. Many drivers willsimply pay the toll because that makes the most sense for them. Others will respond to pricesignals by choosing the less expensive roadways and the level of service on the tolledsystem will improve. Other responses to congestion pricing include shifting non-essentialtrips to a less congested time of day, using a different mode (transit, carpool, or vanpool forexample) to reduce or avoid the toll, eliminating non-essential trips or changing work orhome locations to avoid the toll. Pricing would be applied only to congested sections of stateand federal highways and some sections of principal arterials in larger metropolitan areas. Ina hybrid solution with mileage pricing, a nominal fee could be applied to all state and federal
120 Transportation Research Board, Special Report 303 - Equity of Evolving Transportation Finance Mechanisms,2011, http://www.nap.edu/catalog.php?record_id=13240 (R0178)
Section 3.5 Long-Term Policy Options
2012 Washington State Energy Strategy page 87
highways, with additional congestionsurcharges applied only to the segmentsaffected by congestion.
! Carbon pricing: a price applied to carboncontained in any fuel sold, either directlythrough a tax or indirectly through tradingprices associated with an emissions cap.Carbon pricing is a comprehensive approach toenergy policy in a climate-constrained worldand ties energy policy in the transportationsector more closely to policy in all energysectors. For this reason, carbon pricing istreated separately in Chapter 5. Within thetransportation system, carbon pricing is moresimilar to the existing fuel tax than to mileagepricing or congestion pricing.
C6%75';,&Q%,%"6.>&"*1&9:?%65%*.%
Many studies, including Moving Cooler, haveestimated the impacts of transportation pricingstrategies on VMT, energy consumption andgreenhouse gas emissions at the national level. InWashington, Transportation 2040, by the PugetSound Regional Council (PSRC),127 includedanalysis of transportation pricing strategiesthrough use of a regional travel demandequilibrium model. The model takes variousparameters, such as road capacity andconfiguration, land use, travel patterns andeconomic activity into account. This equilibrium
121 Transport for London, Central London Congestion Charging: Impact Monitoring Fifth Annual Report, Jul 2007,http://www.tfl.gov.uk/assets/downloads/fifth-annual-impacts-monitoring-report-2007-07-07.pdf (R0194)
122 Mohammed Quddus, Alon Carmel, and Michael GH Bell, The Impact of the Congestion Charge on Retail: theLondon Experience, Greater London Authority, May 2005,http://www.london.gov.uk/mayor/economic_unit/docs/impact-of-congestion-charge-on-retail.pdf (R0195)
123 Booz, Allen, and Hamilton, Seattle Variable Toll Study, May 2009, http://www.seattle.gov/transportation/docs/FINAL%20Tolling%20Study%20report%20revised%206.25.10.pdf (R0196)
124 City of Seattle, 7 Best Practices, Congestion Pricing, Seattle Transit Master Plan Briefing Book: pp. 7.21-7.24,http://www.seattle.gov/transportation/docs/tmp/briefingbook/SEATTLE%20TMP%207%20BP%20-%20f%20-%20Congestion%20Pricing.pdf (R0197)
125 Steven Danna, Keibun Mori, Jake Vela, and Michelle Ward, Cordon-Based Road Pricing in Downtown Seattle, Jun2011 (S0082)
126 QuantEcon Inc, Improving highway Efficiency and Investment Policy Through Pricing: A Challenge to the StatusQuo, Dec 2009 at http://cascadepolicy.org/news/2010/01/05/ending-highway-gridlock-in-portland/ (R0198)
127 Puget Sound Regional Council, Transportation 2040, May 2010, http://psrc.org/transportation/t2040/t2040-pubs/final-draft-transportation-2040 (R0043)
Cordon Pricing
Another option for pricing transportation that hasreceived attention is cordon pricing or area pricing. Acordon is drawn around a congested area, such as acentral business district, and vehicles are charged toenter the cordon or operate within it.
Cordon pricing has been introduced in several citiesaround the world, including London and Stockholm.The total number of vehicles entering London s citycenter was 16 percent lower in 2006 than beforeimplementation in 2002.121 Retailers in central Londoninitially expressed concern about potential adverseimpacts on their sales, but researchers found nosignificant effect on the overall retail sales in onequantitative analysis.122
Seattle has studied possible cordon pricing on its citycenter,123,124 which has dense activity and anemployment center well served by transit. Danna et alestimated the quantitative effects for cordon pricing indowntown Seattle in a benefit-cost study.125 The studyextrapolated results from existing road pricing programsin London, Stockholm and Milan to estimate the majorimpacts of traffic volume in Seattle. The analysis foundthat cordon pricing averaging $2.10 on each vehicleentering the cordon could reduce the number ofvehicles entering the cordon by 12 percent, resulting ina 6 percent reduction in King County s greenhouse gasinventory and a 2 percent reduction in travel time andtraffic accidents.
However, another study by QuantEcon126 usingPSRC s regional travel model found that area pricingaround Seattle would have only a small reduction inregional VMT and would lower user benefits within theregion. Given these conflicting results cordon pricingwill remain an area of ongoing research and inquiry.
Section 3.5 Long-Term Policy Options
2012 Washington State Energy Strategy page 88
modeling approach is sophisticated and can take into account complex transportation dynamics,such as variable toll rates and traffic diversion effects.
An important focus of Transportation 2040 is congestion pricing using variable toll rates that areapplied to the freeway system as well as other highways and major arterials. The toll rates areeconomically optimal rates, determined by PSRC s formula to simultaneously minimize
congestion and diversion impacts. Consequently, toll rates are higher during the afternoon peakhours when roadways are most congested and lower when the roadways are less congested.PSRC s simulation shows that, with the optimal rate, congestion pricing would result in areduction in VMT of 3 percent and a reduction in transportation sector greenhouse gasemissions of 6 percent in 2040. PSRC also examined the impacts of an increased cost ofdriving per mile. The analysis suggested that mileage-based pricing that increased travel costby 19 cents per mile could reduce VMT by 10 percent and greenhouse gas emissions by 5percent in 2040. Nineteen cents per mile equates to a gasoline tax of over $5 per gallon for a 27mpg vehicle, which speaks to the well-known, low price elasticity of demand for gasoline.
Research elsewhere has compared the efficacy of pricing mileage versus pricing fuels. TheCenter for Transportation Studies at the University of Minnesota recently published a report128
concluding that fuel pricing is unsustainable and making a strong case for exploring mileagebased user fees, but leaving the precise nature of such fees open for further discussion. TheJoint Transportation Committee of the Washington State Legislature commissioned a report,129
delivered in January 2010, that raised similar concerns regarding the sustainability of fuelpricing, but favored increasing weight fees, tire fees and motor vehicles sales and use taxesover mileage-based pricing.
Lastly, there have been local field experiments on mileage pricing and congestion pricing herein the Northwest. For mileage pricing, the Oregon State Department of Transportationconducted a 12-month pilot program in 2006.130 This pilot program tested a mileage fee thatvaried for peak and off-peak hours and made use of a GPS device and pay-at-the-pumpsystem. This pilot mileage fee resulted in a 13.8 percent VMT reduction with a VMT fee of 10cents per mile at peak hours ($2.75 per gallon equivalent at 27 mpg) and 0.43 cents per mile offpeak ($0.12 per gallon at 27 mpg). This experiment also demonstrated the technical feasibilityof the GPS recording and payment system. PSRC also conducted an experiment testing thefeasibility of congestion pricing, as described in the report Traffic Choice Study.131 This studyused in-vehicle metering devices installed on 275 representative drivers in the Puget Soundregion for 18 months and varied toll rates on selected road facilities (mostly highways and majorarterials) by time of day and location. This experiment resulted in a 12 percent reduction in VMTand supported the feasibility of congestion pricing.
128 D D Coyle, F O Robinson, Z Zhao, L W Munnich Jr & A Z Lari, From Fuel Taxes to Mileage-Based User Fees:Rationale, Technology, and Transitional Issues. University of Minnesota Center for Transportation Studies, August2011, http://www.its.umn.edu/Publications/ResearchReports/reportdetail.html?id=2048 (R0179)
129 K Scanlan, Implementing Alternative Transportation Funding Methods. Joint Transportation Committee,Washington State Legislature, January 2010. (S0074)
130 Oregon State Department of Transportation, Oregon s Mileage Fee Concept and Road User Fee Pilot Program,Nov 2007, http://www.oregon.gov/ODOT/HWY/RUFPP/docs/RUFPP_finalreport.pdf?ga=t (R0113)
131 Puget Sound Regional Council, Traffic Choice Study, Apr 2008, http://psrc.org/transportation/traffic (R0114)
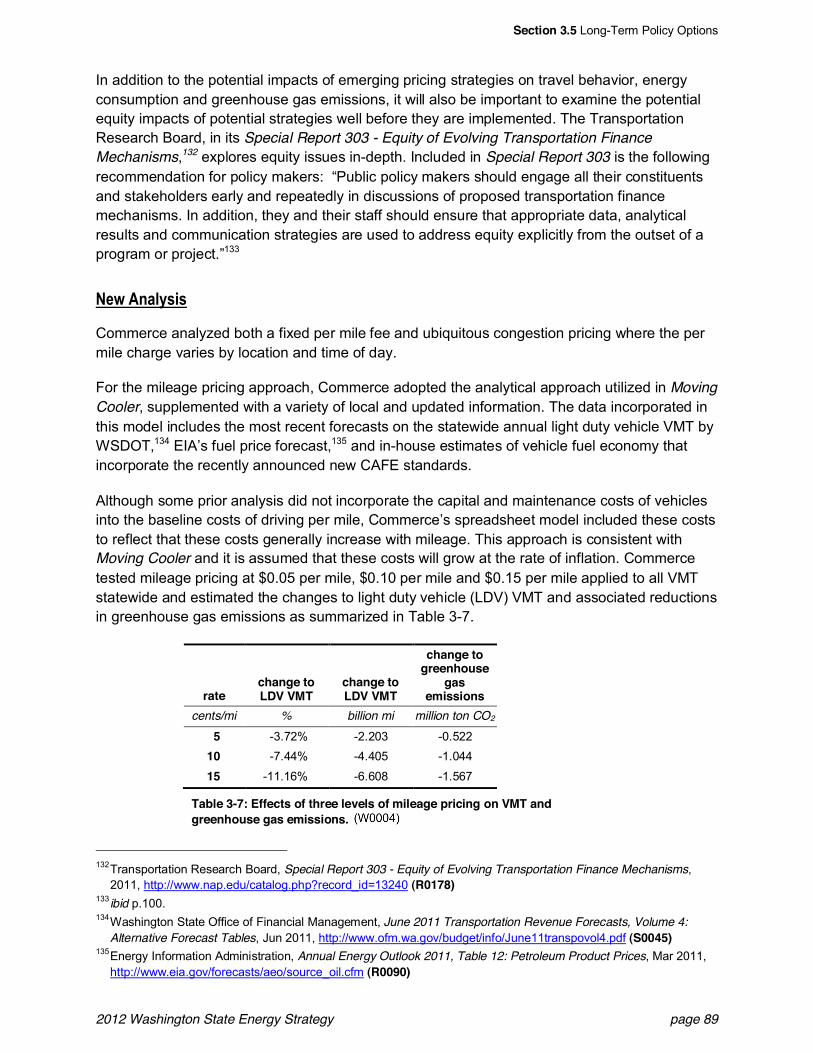
Section 3.5 Long-Term Policy Options
2012 Washington State Energy Strategy page 89
In addition to the potential impacts of emerging pricing strategies on travel behavior, energyconsumption and greenhouse gas emissions, it will also be important to examine the potentialequity impacts of potential strategies well before they are implemented. The TransportationResearch Board, in its Special Report 303 - Equity of Evolving Transportation FinanceMechanisms,132 explores equity issues in-depth. Included in Special Report 303 is the followingrecommendation for policy makers: Public policy makers should engage all their constituentsand stakeholders early and repeatedly in discussions of proposed transportation financemechanisms. In addition, they and their staff should ensure that appropriate data, analyticalresults and communication strategies are used to address equity explicitly from the outset of aprogram or project. 133
W%0&-*"$=,5,
Commerce analyzed both a fixed per mile fee and ubiquitous congestion pricing where the permile charge varies by location and time of day.
For the mileage pricing approach, Commerce adopted the analytical approach utilized in MovingCooler, supplemented with a variety of local and updated information. The data incorporated inthis model includes the most recent forecasts on the statewide annual light duty vehicle VMT byWSDOT,134 EIA s fuel price forecast,135 and in-house estimates of vehicle fuel economy thatincorporate the recently announced new CAFE standards.
Although some prior analysis did not incorporate the capital and maintenance costs of vehiclesinto the baseline costs of driving per mile, Commerce s spreadsheet model included these coststo reflect that these costs generally increase with mileage. This approach is consistent withMoving Cooler and it is assumed that these costs will grow at the rate of inflation. Commercetested mileage pricing at $0.05 per mile, $0.10 per mile and $0.15 per mile applied to all VMTstatewide and estimated the changes to light duty vehicle (LDV) VMT and associated reductionsin greenhouse gas emissions as summarized in Table 3-7.
ratechange toLDV VMT
change toLDV VMT
change togreenhouse
gasemissions
cents/mi % billion mi million ton CO2
5 -3.72% -2.203 -0.52210 -7.44% -4.405 -1.04415 -11.16% -6.608 -1.567
Table 3-7: Effects of three levels of mileage pricing on VMT andgreenhouse gas emissions.
132 Transportation Research Board, Special Report 303 - Equity of Evolving Transportation Finance Mechanisms,2011, http://www.nap.edu/catalog.php?record_id=13240 (R0178)
133 ibid p.100.134 Washington State Office of Financial Management, June 2011 Transportation Revenue Forecasts, Volume 4:
Alternative Forecast Tables, Jun 2011, http://www.ofm.wa.gov/budget/info/June11transpovol4.pdf (S0045)135 Energy Information Administration, Annual Energy Outlook 2011, Table 12: Petroleum Product Prices, Mar 2011,
http://www.eia.gov/forecasts/aeo/source_oil.cfm (R0090)
CaroleeS
(W0004)
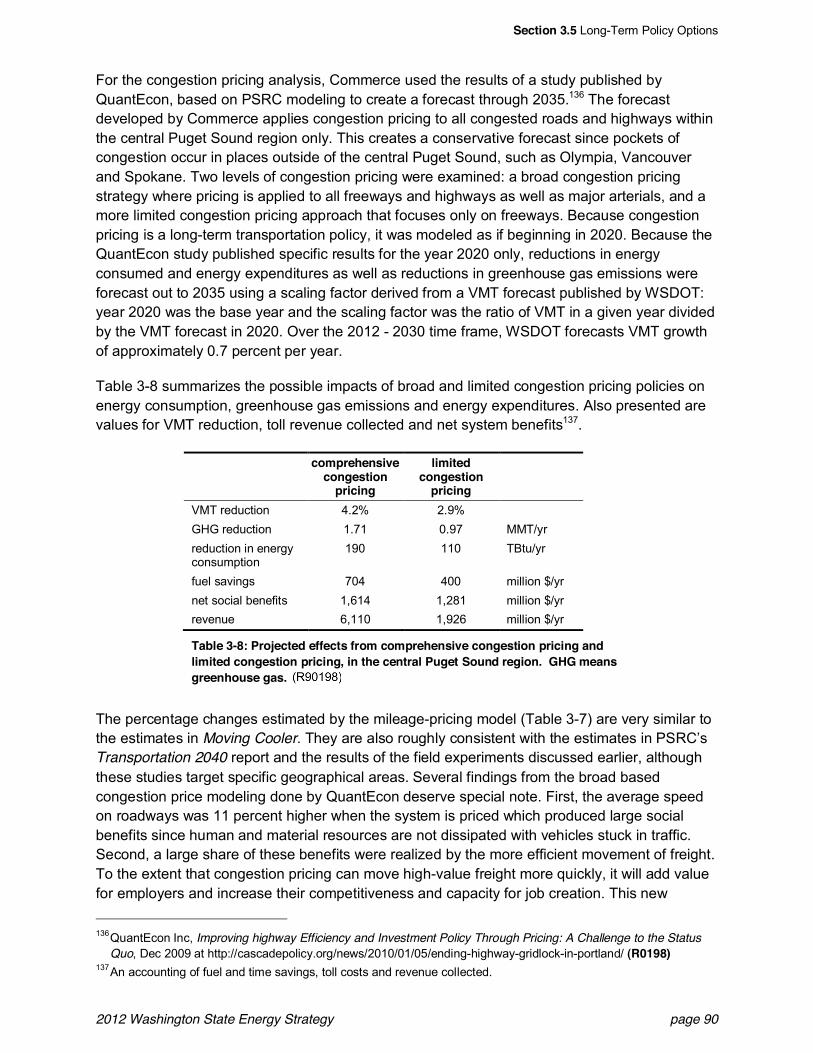
Section 3.5 Long-Term Policy Options
2012 Washington State Energy Strategy page 90
For the congestion pricing analysis, Commerce used the results of a study published by QuantEcon, based on PSRC modeling to create a forecast through 2035.136 The forecast developed by Commerce applies congestion pricing to all congested roads and highways within the central Puget Sound region only. This creates a conservative forecast since pockets of congestion occur in places outside of the central Puget Sound, such as Olympia, Vancouver and Spokane. Two levels of congestion pricing were examined: a broad congestion pricing strategy where pricing is applied to all freeways and highways as well as major arterials, and a more limited congestion pricing approach that focuses only on freeways. Because congestion pricing is a long-term transportation policy, it was modeled as if beginning in 2020. Because the QuantEcon study published specific results for the year 2020 only, reductions in energy consumed and energy expenditures as well as reductions in greenhouse gas emissions were forecast out to 2035 using a scaling factor derived from a VMT forecast published by WSDOT: year 2020 was the base year and the scaling factor was the ratio of VMT in a given year divided by the VMT forecast in 2020. Over the 2012 - 2030 time frame, WSDOT forecasts VMT growth of approximately 0.7 percent per year.
Table 3-8 summarizes the possible impacts of broad and limited congestion pricing policies on energy consumption, greenhouse gas emissions and energy expenditures. Also presented are values for VMT reduction, toll revenue collected and net system benefits137.
comprehensivecongestion
pricing
limitedcongestion
pricingVMT reduction 4.2% 2.9% GHG reduction 1.71 0.97 MMT/yr reduction in energy consumption
190 110 TBtu/yr
fuel savings 704 400 million $/yr net social benefits 1,614 1,281 million $/yr revenue 6,110 1,926 million $/yr
Table 3-8: Projected effects from comprehensive congestion pricing andlimited congestion pricing, in the central Puget Sound region. GHG meansgreenhouse gas.
The percentage changes estimated by the mileage-pricing model (Table 3-7) are very similar to the estimates in Moving Cooler. They are also roughly consistent with the estimates in PSRC s Transportation 2040 report and the results of the field experiments discussed earlier, although these studies target specific geographical areas. Several findings from the broad based congestion price modeling done by QuantEcon deserve special note. First, the average speed on roadways was 11 percent higher when the system is priced which produced large social benefits since human and material resources are not dissipated with vehicles stuck in traffic. Second, a large share of these benefits were realized by the more efficient movement of freight. To the extent that congestion pricing can move high-value freight more quickly, it will add value for employers and increase their competitiveness and capacity for job creation. This new
136 QuantEcon Inc, Improving highway Efficiency and Investment Policy Through Pricing: A Challenge to the StatusQuo, Dec 2009 at http://cascadepolicy.org/news/2010/01/05/ending-highway-gridlock-in-portland/ (R0198)
137 An accounting of fuel and time savings, toll costs and revenue collected.
CaroleeS
(R90198)
Section 3.5 Long-Term Policy Options
2012 Washington State Energy Strategy page 91
analysis by Commerce shows that both mileage pricing and congestion pricing are effective inreducing VMT and its associated greenhouse gas emissions but that congestion pricing yieldslarge social benefits by also reducing congestion. The jobs goal of this strategy will be betterserved with congestion pricing approach than a flat charge on all VMT.
W%:+&<+%?,
Commerce will cooperate with WSDOT and OFM to increase the depth and precision of studiesthat estimate the impacts of mileage, congestion or carbon pricing proposals on the Washingtoneconomy. Particular topics to be addressed include:
! Indirect economic impacts. Because the emerging pricing methods treated in this sectionare deployed economy-wide, the impacts, positive and negative alike, would reverberatethroughout the state economy. OFM stewards sophisticated economic modeling tools thatwill allow the state to forecast possible impacts of transportation pricing policies in non-transportation sectors.
! Differentiating discretionary and non-discretionary users. Transportation infrastructurehosts both non-discretionary users who have little flexibility on the routes and times theymust travel (e.g. commercial haulers) and discretionary users who are able to choose theirroutes and times to adapt to road pricing schemas (e.g. individual non-commuting travel).Commerce will examine the financial impacts and tradeoffs associated with distincttreatment of the two user groups for different policy options.
! Differentiating disadvantaged, urban and rural users. Commerce will determine how todesign strategies to avoid disproportionate impacts to the unique transportation needs ofrural areas, and to create fair burdens on various income levels in the state.
! Revenue recycling. Pricing schemas generate large amounts of revenue and the netbenefits of such polices depend on delivering that revenue back to road users in either cash(by lowering other taxes) or cost-beneficial investments in the transportation system.Competing uses for these revenues (including direct reimbursement to consumers) must becompared in a rational way, and appropriate revenue recycling packages designed togenerate net social benefits. See Section 8.3.2 The Effect of Energy Policy on RevenueGeneration for further discussion of this topic.
Section 4.1 Why Building Efficiency?
2012 Washington State Energy Strategy page 92
)>"?+%6&E &K"/5*2&L;5$15*2,&K'6%&9((5.5%*+
E4@ P>=&L;5$15*2&9((5.5%*.=Z
These strategies are intended to complement and enhance existing efforts to implementbuilding efficiency. They are directed exclusively at improving the efficiency of existing buildings,mostly in housing. At a time when there is high unemployment in the construction industry,efficiency projects in existing buildings can provide jobs while meeting the objectives of theEnergy Strategy.
The building efficiency strategy takes advantage of recent momentum created by federalfunding to create sustaining energy efficiency infrastructure. The American Recovery andReinvestment Act directed substantial amounts of funding to building efficiency programs. Aswell as providing grants for efficiency upgrades, the federal funding provided resources forworkforce development, the creation of new efficiency delivery organizations and the adoptionof new professional standards. This strategy aims to take advantage of these developmentswhile transitioning to a time when less federal funding will be available.
After transportation, energy use in buildings is the next largest energy consuming sector. Theresidential and commercial buildings sector accounts for 31 percent of energy consumption and26 percent of energy cost in Washington.138,139 While there is a long history of implementingenergy efficiency in buildings, additional opportunity exists to reduce energy consumption costeffectively.
The Northwest Power and Conservation Council s 6th Northwest Power Plan140 estimates cost-effective efficiency measures have the potential to provide 85 percent of the region s loadgrowth. Of these efficiency savings, over 65 percent are in the residential and commercialbuildings sectors. A 2008 report from Lawrence Berkeley National Laboratory, U.S. Building-Sector Energy Efficiency Potential,141 estimates there is good potential for cost effective energysavings for both electric and natural gas end uses. Relative to a business as usual base case,the report estimates a residential energy savings potential of 28 percent for gas and of 30percent for electricity. For commercial buildings, the savings are higher at 35 percent for gasand 34 percent for electricity.
138 Washington State Department of Commerce, Energy Strategy Update and 2011 Biennial Energy Report withIndicators, 2011 (S0029)
139 U.S. Energy Information Administration, State Energy Data System. (R0117)140 Northwest Power and Conservation Council, 6th Northwest Power Plan, 2010.
http://www.nwcouncil.org/energy/powerplan/6/default.htm (R0118)141 Brown, R. et al, U.S. Building-Sector Energy Efficiency Potential, Lawrence Berkeley National Laboratory, 2008.
http://enduse.lbl.gov/info/LBNL-1096E.pdf (R0119)
Section 4.2 Building on Prior Work
2012 Washington State Energy Strategy page 93
E4A L;5$15*2&'*&C65'6&P'6/
E4A4@ 9*%62=XQ%$"+%1&L;5$15*2&<+"*1"61,
Since 1977, Washington laws have included a state energy code to encourage construction ofmore efficient buildings. Mandatory energy code requirements were adopted on a statewidebasis in 1986 for commercial buildings and in 1990 for residential buildings. Most recentlymodified in 2009 by the Legislature, the energy-related buildings standards ask the WashingtonState Building Code Council to develop future editions of the energy code that incrementallymove toward achieving the 70 percent reduction in annual net energy consumption in newbuildings The 2009 bill also directs Commerce to develop a strategic plan for buildings in orderto support standards and requirements for commercial building energy disclosure for private andstate owned buildings.
Building energy policies are included in RCW 19.27A - Energy-related building standards. Forsome time, this chapter has included the state energy code, which is the primary state policy fornew building construction. In 2009, bill E2SSB 5854 made several additions to chapter 19.27Ato further enhance the energy efficiency of buildings.
<+"+%&9*%62=&)'1%
Building energy codes provide minimum efficiency standards for new buildings, additions, majorbuilding renovations and replacement of building equipment. By implementing energy efficiencyin buildings at the time of new construction or renovation, optimum levels of efficiency can beimplemented at the lowest cost.
Between 1990 and 2009, the number of residential housing units and commercial floor areaincreased by more than 25 percent. It is anticipated the growth rate between now and 2030 willproceed at nearly the same pace.142 By 2030, the Washington energy code will have influenced50 percent of all building construction.
Washington's first energy code, adopted in 1977 by statute, was a voluntary requirement. TheState Building Code Act and State Energy Code Act were passed by the Legislature in 1985.The State Building Code Act gave rulemaking authority to the Building Code Council, whichoversees all building and energy codes within the state. The first statewide energy code,adopted in 1986, was applicable to all new buildings, and was based on ANSI/ASHRAE/IESStandard 90A-1980. In 1990, HB 2198 amended RCW 19.27A and increased the insulationrequirements for residential buildings based on the energy source cost. Since the early 1990s,with a few exceptions, the energy code has been updated every three years on the sameschedule as the adoption of other state building standards.
In 2009, the statute for energy codes was revised to provide the Building Code Counciladditional instruction in the pursuit of additional energy savings through code as follows:
142 Based on building forecast prepared by the Northwest Power and Conservation Council in support of the 6th
Northwest Power Plan.
Section 4.2 Building on Prior Work
2012 Washington State Energy Strategy page 94
RCW 19.27A.160 Residential and nonresidential construction Energy consumptionreduction Council report.
(1) Except as provided in subsection (2) of this section, residential and nonresidentialconstruction permitted under the 2031 state energy code must achieve a seventy percentreduction in annual net energy consumption, using the adopted 2006 Washington stateenergy code as a baseline.
(2) The council shall adopt state energy codes from 2013 through 2031 that incrementallymove towards achieving the seventy percent reduction in annual net energy consumptionas specified in subsection (1) of this section. The council shall report its progress byDecember 31, 2012, and every three years thereafter. If the council determineseconomic, technological or process factors would significantly impede adoption of orcompliance with this subsection, the council may defer the implementation of theproposed energy code update and shall report its findings to the legislature by December31 of the year prior to the year in which those codes would otherwise be enacted.
Also in 2009, the Building Code Council adopted the 2009 edition of the Washington EnergyCode. This edition is expected to reduce energy use in new single family homes by 18 to26 percent.143 For non-residential buildings, sector savings average 13 percent of total energyuse compared to the 2006 Washington Energy Code.144
Meeting the energy reduction targets set by RCW 19.27A.160 will require a continued markettransformation effort. The energy efficiency market will need to continue to demonstrate newstandards for buildings and equipment are acceptable to the market and they meet thechallenge of providing economic value in a wide range of building types for consumers inWashington.
AN@@&<+6"+%25.&C$"*&('6&L;5$15*2,
To support efficiency improvements in the built environment, the Legislature directed Commerceto develop a strategy for improving the energy efficiency in buildings. The details of this requestare provided in RCW 19.27A.150 as summarized below. The resulting plan is available on theCommerce website, 2011 Strategic Plan for Enhancing Energy Efficiency & ReducingGreenhouse Gas Emissions from Homes, Buildings, Districts & Neighborhoods.145
This building strategy is closely linked to the energy code improvements requested in RCW19.27A.160 described above. Commerce worked with the State Building Code Council todevelop the framework for public input and prioritize the work. The legislation directs Commerceto develop a new plan every three years in anticipation of the next energy code adoption cycle.The first state building strategy focuses largely on improving buildings through energy codeadoption and related enhancements. Future building strategies should provide input on a widerrange of subjects related to energy use in the built environment.
143 Murray, C., Baylon, D., 2009 Washington State Energy Code: Analysis of Code Changes Adopted By theWashington State Building Code Council Washington State Department of Commerce, 2009. (S0049)
144 Kennedy, M, Baylon, D., Commercial Sector Savings Analysis: Proposed 2010 Washington State Energy Code,Ecotope, Inc. 2009. (S0050)
145http://www.commerce.wa.gov/site/1325/default.aspx (S0008)
Section 4.2 Building on Prior Work
2012 Washington State Energy Strategy page 95
Strategies for existing buildings are limited in the strategic plan for buildings. As a result, arenewed effort is being applied in this Energy Strategy.
The building strategy discussion included the following subjects:
! Energy efficiency public outreach
! Measurement of achievement and targets for energy codes
! Aspirational code development
! Performance based energy codes
! Workforce training
! Financial mechanisms
! Financing Market recognition of the value of homes constructed to the 2009 WSEC
! Identify costs and benefits
! Energy code training and enforcement
! State strategies to support research and demonstration
! District and neighborhood energy systems
! Address barriers for utilities to serve net zero energy homes and buildings
! Investigate methodologies and standards for the measurement of the amount of embodiedenergy used in building materials
! Outline of 2013 energy code recommendations
The building strategy recommendations most relevant to the current policy discussions are asfollows:
Recommendation 2C: Commerce will examine expanding the existing energy benchmarkingregulations in RCW 19.27A.070(5) to include reporting of commercial benchmarking scores tothe State Energy Office. This may result in a recommendation for modifications to the legislationin 2012.
The energy strategy committee encouraged the expansion of the state commercial buildingenergy disclosure, 19.27A.170, to support the development of future energy codes based onbuilding energy performance rather than building construction elements. To establish energybenchmarks for new buildings, detailed public record of energy consumption in specific buildingtypes is needed. This is a secondary but important aspect to the commercial building disclosuremodifications discussed for this strategic plan.
Recommendation 6: Commerce will evaluate financial mechanisms that support increasingenergy efficiency in existing buildings as well as new construction, in conjunction withimplementation of the Energy Strategy update. This is the key strategic mechanism forimproving efficiency in existing buildings.
Section 4.2 Building on Prior Work
2012 Washington State Energy Strategy page 96
The building strategy committee agreed there was a need to provide additional financialincentives for building efficiency, but the list of possible financing alternatives included in thebuildings strategy needed further development. Commerce has included their latest thinking onfinancing of energy efficiency retrofits in the Energy Strategy.
)'33%6.5"$&L;5$15*2&9*%62=&85,.$',;6%
In 2009, RCW 19.27A.170 established requirements for privately owned non-residential buildingenergy use disclosure. For all non-residential buildings with over 10,000 square feet of floorarea, energy use must be disclosed to the prospective buyer, lessee or lender. The disclosuredocumentation is created by the building owner using the E.P.A. s Energy Star PortfolioManager software. As well as providing a summary of utility expenses, Portfolio Managerdevelops a building score relative to similar buildings. Large utilities are required to support thisprogram by providing a minimum of 12 months of utility data to building owners on request.
Enhancements to this chapter are proposed later in this strategy to improve enforcement of thelaw and to enhance public awareness of commercial building energy use.
['3%&9*%62=&85,.$',;6%
RCW 19.27A.180 asks Commerce to research and select an energy performance score forhomes, and to provide input on an implementation strategy to reduce energy use in homes. Theresults of this research and reporting are included in the Commerce report, 2011 Home EnergyAudit and Retrofit including Home Energy Scoring.146 In this report, Commerce providesinformation on two new home energy scoring methods but postponed making a finalrecommendation until the scoring methods had more time in the market. The report alsoprovides a proposal for implementation similar to the Home Energy Retrofit Marketing andQuality Control program proposed later in the Energy Strategy. The report summarizes thepotential for energy efficiency improvements in existing housing. Commerce has furtherdeveloped home energy disclosure concepts for this Energy Strategy.
<+"+%&L;5$15*2&9*%62=&85,.$',;6%&"*1&M3?6'7%3%*+
The final aspect of the State Building Efficiency standards is 19.27A.190. This chapter requiresall state-owned or leased buildings over 10,000 square feet to create and maintain a buildingbenchmark using Portfolio Manager. For state buildings, a score below 70 requires awalkthrough energy audit. If the walkthrough audit identifies potential energy savings, aninvestment grade audit is to be completed, potentially leading to the installation of energyefficiency upgrades. For leased buildings, the benchmarking score will impact whether or notthe space is to be leased by the state. Technical support for state agencies and a report of statebuilding energy use is available from the Department of Enterprise Services.147
146
http://www.leg.wa.gov/documents/legislature/ReportsToTheLegislature/Home%20Energy%20Score%205854%20Sec%207%20Review%20Final_ed5aaddf-fa95-4639-b623-fb7be4da1a66.pdf (S0026)
147http://www.ga.wa.gov/energy/EnergyStar.htm
Section 4.2 Building on Prior Work
2012 Washington State Energy Strategy page 97
E4A4A -??$5"*.%&"*1&9^;5?3%*+&9((5.5%*.=&<+"*1"61,
Appliance and equipment standards at both the federal and state level provide significantenergy efficiency savings in buildings. These standards continue to be updated to provideadditional savings as manufacturers incorporate additional efficiency capabilities into theirproducts.
Federal efficiency standards currently cover 40 product classes for a wide range of energy usingequipment and appliances. In 1987, the National Appliance Energy Conservation Actestablished minimum efficiency standards for many household appliances. The Energy PolicyAct of 1992 and the Energy Policy Act of 2005 further expanded the list of covered products toinclude an increased number of consumer, commercial and industrial products. Under the law,the U.S. Department of Energy is required to review and update standards periodically. In 2006,the DOE recognized they were significantly behind schedule in the rule making process andhave set an aggressive schedule to catch up. As a result, many new appliance and equipmentrequirements are expected to be implemented in the next three to five years.
Washington implemented appliance and equipment efficiency standards for a number ofproducts not covered by federal standards. Washington RCW 19.260 Energy efficiency currentlyregulates 13 product classes.
States have historically led the nation in the development of new appliance standards. Federalstandards were first adopted in 1988 to consolidate numerous state standards being developed,most notably by California. Manufacturers prefer to have a uniform standard nationally. Today,state adoption of standards helps conserve energy at the local level and encourages the federalgovernment and impacted manufacturers to move toward national standards. Many of theproducts adopted in Washington and 11 other states in 2007 have been incorporated into thefederal appliance efficiency rules.
E4A4D O+5$5+=&)'*,%67"+5'*&Q%^;56%3%*+,
Utilities in the Pacific Northwest have implemented energy conservation programs inWashington since the 1970s. It is anticipated that over the next 10 years utility expenditures onelectric energy efficiency in Washington will average over $250 million per year.148 Natural gasutilities have also been active in pursuing cost effective energy conservation.
Pacific Northwest Electric Power Planning and Conservation Act, 1980, established the PacificNorthwest Electric Power and Conservation Planning Council and directs the Council to adopt aregional energy conservation and electric power plan. The act also sets forth provisions theBonneville Power Administration must follow in selling power, acquiring resources,implementing energy conservation measures and setting rates for the sale and disposition ofelectric energy. This act set the stage for energy conservation efforts in the Pacific Northwest,particularly for utilities served by the Bonneville Power Administration.
148 Northwest Power and Conservation Council, 6th Plan Conservation Target Calculator,http://www.nwcouncil.org/energy/powerplan/6/supplycurves/I937/default.htm (R0121)
Section 4.2 Building on Prior Work
2012 Washington State Energy Strategy page 98
For investor-owned electric and natural gas utilities regulated by the Washington State Utilityand Transportation Commission, rules have been developed requiring utilities to create the leastcost mix of resources, including conservation. The following rules have been adopted by theCommission.
WAC 480-100-238(1) ( Each electric utility regulated by the commission has theresponsibility to meet its system demand with a least-cost mix of energy supply resourcesand conservation. );
WAC 480-90-238(1) ( Each natural gas utility regulated by the commission has theresponsibility to meet system demand with the least-cost mix of natural gas supply andconservation. ).
Washington s Initiative 937, the Energy Independence Act passed by voters in November 2006,requires the state s electric utilities with more than 25,000 customers to acquire all cost-effectiveenergy conservation resources in their service territories beginning in 2010. Every two years,beginning in 2010, each major electric utility is required to prepare a 10-year conservation planand set biennial conservation targets. This impacts the state s 17 largest electric utilities whoserve approximately 88 percent of the electric loads in the state. This law requires both publicand investor owned utilities to plan for and acquire all cost-effective electric conservation. Thelaw includes a financial penalty for non-compliance. While many electric utilities in the statealready had active energy conservation programs, this law assures continued utility activityacross the state.
E4A4E V'0XM*.'3%&[';,5*2&9((5.5%*.=&C6'26"3,
Low-income weatherization services have been provided in Washington since 1977. Commercecontracts statewide with 26 local agencies to do weatherization work. A fact sheet149 developedby Commerce summarizes the funding sources for weatherization as follows:
! 2009 DOE funding: $7.2 million
! 2009 Department of Health and Human Services (LIHEAP) funding: $16.1 million
! 2010 Bonneville Power Administration funding: $2.3 million
! 2009-2011 Biennium Capital Budget Energy Matchmaker funding: $3 million
! A total of $59.5 million in 2009 American Recovery and Reinvestment Act (ARRA) fundingwill help weatherize an estimated 7,000 homes statewide and create hundreds of jobsthrough June 2011.
A recent evaluation by Washington State University150 of the low-income weatherizationprogram developed for Commerce provides the following summary of 2010 weatherizationefforts:
149 Additional Information on the Commerce Weatherization program is available athttp://www.commerce.wa.gov/site/500/default.aspx (S0053)
150 Kunkle, R, Schueler, V. Washington State Low-Income Weatherization Program Evaluation Report For FY2010Final Report May 2011, Washington State University Extension Energy Program.http://www.commerce.wa.gov/DesktopModules/CTEDPublications/CTEDPublicationsView.aspx?tabID=0&ItemID=9840&MId=870&wversion=Staging (S0054)
Section 4.3 Buildings Efficiency Policy Package
2012 Washington State Energy Strategy page 99
! Total weatherization program expenditures in FY2010 were $42 million. This is more thantwice historical annual expenditures. ARRA funds accounted for more than half of programexpenditures. Expenditures for all the other funding sources declined in FY2010.
! In FY2010, Washington s low-income weatherization program installed weatherizationmeasures estimated to save weatherized households $1.4 million per year in energy costs,which is $189 per housing unit. These energy savings will accrue each year during thelifetime of the energy measures.
E4D L;5$15*2,&9((5.5%*.=&C'$5.=&C"./"2%
The building efficiency policy package has been developed to increase the implementation ofbuilding efficiency measures. All of the policy options are suggested as near-term policy options.This reflects the desire to sustain momentum of efficiency programs funded through theRecovery Act and continue to create employment in the building efficiency retrofit market.
Performance and transparency policy proposals will help increase demand for energyefficiency improvements and provide supporting infrastructure for implementation. For bothresidential and commercial occupancies, universal disclosure of building energy use will helpcreate demand for efficiency improvements. To help consumers identify qualified efficiencycontractors, a proposed program to provide uniform standards, a quality assurance programand marketing with statewide reach has been included.
Funding and financing proposals would increase funding for energy efficiency improvements.First, a utility bill based funding design allowing cost and benefits to be shared by current andfuture building owners is recommended. Second, a proposal to provide real estate excise taxrelief to contractors who buy distressed housing and make energy efficiency improvements priorto resale.
Low income and rental housing proposals would provide for low-income weatherization andset minimum efficiency standards for rental housing.
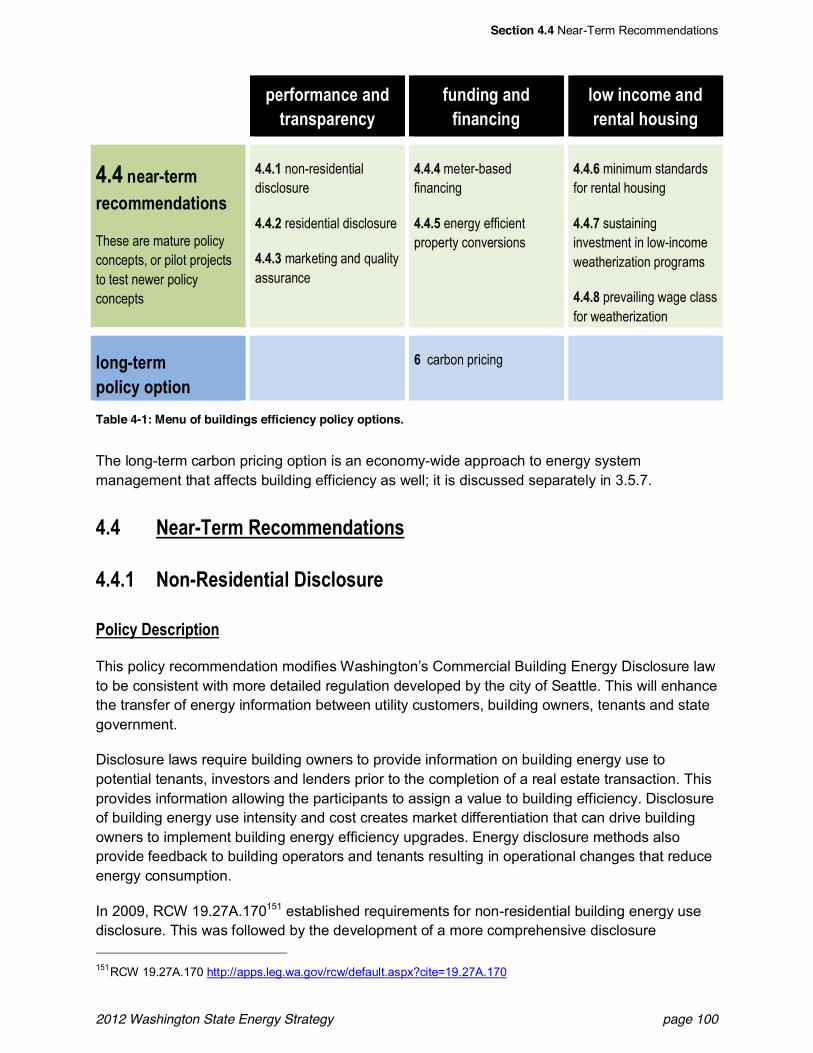
Section 4.4 Near-Term Recommendations
2012 Washington State Energy Strategy page 100
?%6('63"*.%&"*1+6"*,?"6%*.=
(;*15*2&"*1(5*"*.5*2
$'0&5*.'3%&"*16%*+"$&>';,5*2
E4E&*%"6X+%636%.'33%*1"+5'*,
These are mature policyconcepts, or pilot projectsto test newer policyconcepts
E4E4@ non-residentialdisclosure
E4E4A residential disclosure
E4E4D marketing and qualityassurance
E4E4E meter-basedfinancing
E4E4F energy efficientproperty conversions
E4E4G minimum standardsfor rental housing
E4E4H sustaininginvestment in low-incomeweatherization programs
E4E4I prevailing wage classfor weatherization
$'*2X+%63?'$5.=&'?+5'*
G carbon pricing
Table 4-1: Menu of buildings efficiency policy options.
The long-term carbon pricing option is an economy-wide approach to energy systemmanagement that affects building efficiency as well; it is discussed separately in 3.5.7.
E4E W%"6X!%63&Q%.'33%*1"+5'*,
E4E4@ W'*XQ%,51%*+5"$&85,.$',;6%
C'$5.=&8%,.65?+5'*
This policy recommendation modifies Washington s Commercial Building Energy Disclosure lawto be consistent with more detailed regulation developed by the city of Seattle. This will enhancethe transfer of energy information between utility customers, building owners, tenants and stategovernment.
Disclosure laws require building owners to provide information on building energy use topotential tenants, investors and lenders prior to the completion of a real estate transaction. Thisprovides information allowing the participants to assign a value to building efficiency. Disclosureof building energy use intensity and cost creates market differentiation that can drive buildingowners to implement building energy efficiency upgrades. Energy disclosure methods alsoprovide feedback to building operators and tenants resulting in operational changes that reduceenergy consumption.
In 2009, RCW 19.27A.170151 established requirements for non-residential building energy usedisclosure. This was followed by the development of a more comprehensive disclosure
151 RCW 19.27A.170 http://apps.leg.wa.gov/rcw/default.aspx?cite=19.27A.170
Section 4.4 Near-Term Recommendations
2012 Washington State Energy Strategy page 101
ordinance in the City of Seattle, CB 116731.152 For this proposal, it is recommended thatWashington develop modifications to the existing state law that are consistent with the city ofSeattle ordinance.153 The city ordinance includes a number of enhancements to the state lawthat are the basis for this policy recommendation:
! Implementation of the law is assigned to a specific city department. The department isrequired to develop rules and has enforcement authority including the ability to levy fines;
! Annual submission of Portfolio Manager reports to the city is required. This allows the city tocheck for compliance and provide aggregated reporting of the results;
! Portfolio Manager reports are to be provided to existing tenants; and
! Tenants must provide building owners with data required to complete Portfolio Managerdocumentation. This requires the tenant to provide information on the number of peopleoccupying the space and data on energy using devices, such as the number of computers.
In addition, the city ordinance includes a requirement that Portfolio Manager disclosuredocumentation be prepared for multi-family buildings. The city of Seattle ordinance enhancesthe existing state law and addresses the following problem areas in the existing state law:
! Many commercial building owners do not have easy access to their buildings utility billingdata. Leased spaces are frequently served by individual utility meters that are paid by thetenant. The utility will not provide the data to the building owner without permission of thetenant. This creates a barrier to implementation of energy use disclosure and to goodbuilding energy management.
! The benefits of automated energy data sharing have not been realized. Portfolio Manager isdesigned to accept automatic updates of utility billing data. Utility customers can requestthat their utilities import energy data directly into Portfolio Manager on their behalf, and viewand track energy performance ratings in their Portfolio Manager account. This saves theircustomers the time spent manually inputting energy data into Portfolio Manager. Not allWashington utilities have been responsive to requests for automated utility data transfers.
! The current Washington rules do not enhance the use of Portfolio Manager as an energymanagement tool. Portfolio Manager has been adopted by Washington to provide consistentreporting of energy use for disclosure at the time of sale, lease or to support lending.Portfolio Manager is also designed as an energy management tool. Building managers andtenants can benefit from ongoing feedback and evaluation provided by Portfolio Manager.
! Washington does not monitor compliance with the existing commercial building disclosurelaw. There are no penalties assigned for non-compliance.
This proposal recommends the following modifications to the current state law to assure thepotential for this policy is realized:
152 Seattle City Ordinance, CB116731, http://clerk.ci.seattle.wa.us/~scripts/nph-brs.exe?s1=&s3=116731&s4=&s2=&s5=&Sect4=AND&l=20&Sect2=THESON&Sect3=PLURON&Sect5=CBORY&Sect6=HITOFF&d=ORDF&p=1&u=%2F%7Epublic%2Fcbory.htm&r=1&f=G (R0199)
153City of Seattle, Building Energy Benchmarking and Reporting,http://www.seattle.gov/dpd/GreenBuilding/OurProgram/EnergyBenchmarkingDisclosure/Overview/ (R0123)
Section 4.4 Near-Term Recommendations
2012 Washington State Energy Strategy page 102
! Create more specific requirements for electronic reporting of billing data by utilities to assureautomation of data transfer;
! Create enhancements that support owners in the development of disclosure documentation;
! Develop requirements for the tenant to participate in the development of documentation;
! Require energy disclosure to existing occupants;
! Require disclosure documentation to be maintained on an ongoing basis;
! Require ongoing annual reporting to an assigned state organization;
! Make the information on building energy use broadly available to enable consumers toindependently identify buildings with low energy use;
! Consider adding and/or subtracting from the building occupancies impacted by the law; and
! Assign a lead agency for the development of detailed technical rules, enforcement and as acoordinator of technical support. This will require initial funding for rulemaking and a methodto collect fees for ongoing program support.
C6%75';,&Q%,%"6.>&"*1&9:?%65%*.%
Commercial building energy disclosure is required by California as well as the cities of Austin,New York, San Francisco and Washington, D.C.154 While there are some differences in theselaws, the main features of the approach are fairly consistent with the Seattle law.
Market premiums for energy efficient commercial buildings have been documented in severalreports. Using the Portfolio Manager tool, buildings with good energy performance are identifiedas Energy Star labeled buildings. These buildings have been noted to bring higher rents and aprice advantage at time of sale. Rental rates of Energy Star labeled buildings are documentedas being 3.3 to 15.5 percent greater than non-labeled buildings. Sales price premiums rangefrom less than 1 percent to 31 percent greater than the general population of commercialbuildings.155
W%0&-*"$=,5,
The following analysis provides a description of the labor required to complete the requireddisclosure documentation using Portfolio Manager. There are two significant functions requiredto create a Portfolio Manager report. First, to create the Portfolio Manager account, the buildingowner is required to input some information about the building type, floor area, number ofoccupants and a few details about special energy intense components such as number ofcomputers or whether there is a commercial kitchen. The next step is to input annual utility datamade available by the utility. This is done by hand or by authorizing the utility to update the data
154 Institute for Market Transformation, U.S. Commercial Benchmarking Policy Comparison Matrixhttp://www.buildingrating.org/sites/default/files/documents/Commercial_Benchmarking_Policy_Matrix.pdf (R0124)
155 Institute for Market Transformation, Rating and Disclosing the Energy Performance of Buildings: A Market-BasedSolution to Unlock Commercial Energy Efficiency Opportunities.http://www.imt.org/files/FileUpload/files/Benchmark/IMT_Rating_Policy_White_Paper.pdf (R0125)
Section 4.4 Near-Term Recommendations
2012 Washington State Energy Strategy page 103
directly to the Portfolio Manager server. For owner occupied buildings who typically have thedata for their buildings, this will typically take 15 to 35 minutes. To maintain a Portfolio Managerfile, updating the utility data as it is issued by the utility will take another five to seven minutesper billing period, less if done automatically by the utility.156 In addition, there must be anassumption that it will take some time for users to orientate themselves to the web and programenvironment prior to data gathering and input.
The process is more complex for large commercial buildings with multiple tenants served bymultiple utility meters. Tenants must provide the building owner with occupancy data andprovide a release authorizing the utility to provide meter data to the building owner. Utilities arerequired by the law to aggregate the utility meter data into a single report, allowing them toreport the energy use without disclosing tenant specific data.
To maintain ongoing Portfolio Manager scores, it is desirable for the utility to automaticallyupload billing data to the server. This is not consistently implemented by the utilities. In manycases, the building owner must enter the data provided by the utility. This increases the buildingowner s cost of maintaining the account.
There is a cost to the utility. The utility must develop a method for electronic transfer of utilitydata to the server. This is carried out by exporting customer utility information using the PortfolioManager Automated Benchmarking System, a free web service.
M3?$%3%*+"+5'*! Develop an implementation plan, including ongoing funding plan;
! Develop legislation, including initial funding authorization request; and
! Identify a lead agency for the development of rules and enforcement.
E4E4A Q%,51%*+5"$&85,.$',;6%
C'$5.=&8%,.65?+5'*
This policy proposes annual energy use summaries be provided to all residential utilitycustomers. At time of sale or when a property is offered for rent, the annual energy usesummary would be disclosed to prospective buyers or renters. For sellers who want todemonstrate recent improvements in housing, a home energy audit can supplement the energybill disclosure. The following outline provides detail:
1. All housing units: An annual energy report is provided to all consumers statewide by theserving gas or electric utility. The annual energy report includes energy use and costs. Thereporting format is made consistent statewide to facilitate report comparisons.
2. Housing for sale or rent: The most recent annual energy report is to be disclosed toprospective buyers or renters.
156 Information provided by Larry Covey, Washington State University Extension Energy Program. Mr. Covey iscurrently providing PM ratings for state buildings.
Section 4.4 Near-Term Recommendations
2012 Washington State Energy Strategy page 104
3. For existing homes that do not have a billing history or that would like to demonstrate homeenergy improvements: Provide a uniform state standard for disclosure using a detailedhome energy audit.
It is intended that a mandatory annual energy report be limited to energy use and cost andsome limited supporting information. Supporting information would include a statement of intentand a simple statement directing the customer to energy saving resources andrecommendations. The uniform format proposed would deliver the documentation to the userwith limited modifications to the existing utility billing process.
Utilities should be encouraged to provide additional information that enhances the annualenergy bill. While it is recommended that state requirements are simple, enhancements thatprovide additional context and direction should be encouraged. Information that providescomparisons to other customers or energy use based on size of home or weather conditions isrecommended but not required.
Disclosure requirements will need to be detailed further. This includes the sharing of utility billingdata between renters and owners, the timing of disclosure statements, requirements fordisclosure of non-utility energy use and disclosure of reporting by listing services.
Adoption of a uniform comprehensive energy audit that provides an estimate of annual energyuse and a detailed description of efficiency features of the home may be used as enhancementto energy bill disclosure. This may be required if utility data is not available. Exceptions forrelatively new homes should be considered.
C6%75';,&Q%,%"6.>&"*1&9:?%65%*.%
A comprehensive energy audit tells the property owner how to improve energy efficiency.Comprehensive energy audits are most appropriate when the property owner is ready to makeimprovements and, at that time, the energy audit cost can be offset with the energy cost savingsof those improvements. Disclosure using utility billing data represents a lower cost method ofdrawing attention to energy performance and encouraging current and prospective owners toinvest in energy efficiency.
Commerce completed a report, Home Energy Audit and Retrofit Including Home EnergyScoring.157 This report was developed in response to the legislative request detailed in RCW19.27A.180. In this report, Commerce recommends further examination of two recentlydeveloped home energy scoring methods. In addition, the report examines needed supportingprogram infrastructure. Cost of different energy audit protocols was examined as well as thecost of developing supporting infrastructure.
A number of methods for disclosing residential building efficiency have been demonstrated. Thisincludes disclosure of an energy inspection checklist, ratings based on a detailed audit andenergy bill disclosure. The two methods based on inspection or audits are called asset ratings
157 WA Dept. of Commerce, Home Energy Audit and Retrofit Including Home Energy Scoring January 2011http://www.commerce.wa.gov/DesktopModules/CTEDPublications/CTEDPublicationsView.aspx?tabID=0&ItemID=9487&MId=863&wversion=Staging (S0026)
Section 4.4 Near-Term Recommendations
2012 Washington State Energy Strategy page 105
because a description of the building components are the primary data set. Disclosure based onenergy bills is called an operational rating.
New York s Truth in Heating Law was established in 1981 to afford potential real estatepurchasers and renters a right to receive the past two years utility, or fuel bills, for any propertythey are considering purchasing or renting.
In the early 1990s, efforts by the DOE encouraged the development of home energy ratingsystems to support energy efficient lending. During this time, Washington organized publicmeetings around the subject and prepared a business plan for the creation of a home energyrating system.158 The business plan development included funding from several sources. Theplan includes analysis of the potential energy efficient loan participants and builds a programbudget for a non-profit organization to implement the program. Utilities, contractors, realtors andlenders were anticipated to sponsor the program until receipts from home energy rating feescould support it. The program costs were anticipated to be $500,000 per year (1993) for the firstfive years. Sponsors for the nonprofit organization did not materialize and, as a result, theprogram was not initiated.
Pilot projects demonstrating the use of home energy rating systems in support of energyefficient mortgages were implemented in several states in the 1990s, including Alaska,Arkansas, California, Vermont and Virginia. Each state was funded by the DOE to establish andlead a Home Energy Rating System provider organization from 1993 to 1998. Colorado andMississippi joined the pilot program in 1996. These pilots resulted in 63,000 ratings and 8,500energy efficient mortgages. In 1998, the final pilot year, the programs completed 13,037 homeenergy ratings at a program cost of $4,097,845. Of this, $1,112,811 was provided by the ratingproviders or homeowner participants. The balance was state, federal or utility funding.159
W%0&-*"$=,5,
A number of studies have documented reduced energy use through enhanced energy billinginformation campaigns that provide consumers with information on home energy use comparedto similar homes in their neighborhood. Consumer response to the enhanced billing informationreduces energy use by up to 3 percent. These programs provide cost-effective savings.160 Theyare most productive when targeted at high energy users and can be delivered at a cost ofapproximately $10 per customer per year.161 It should be noted that these programs provideenhanced information that is beyond the scope of the minimum requirements of this proposaland likely cost more to implement.
Residential energy audits have demonstrated good success when initiated by the buildingowner. Reporting from recent home energy retrofit programs has demonstrated a 50 percent
158 Lineham, T. J. Home Energy Rating System Business Plan Feasibility Study In Washington State, WashingtonState Energy Office, 1995 (S0055)
159 Farhar, Barbara C., Pilot States Program Report: Home Energy Rating Systems and Energy-Efficient Mortgages,National Renewable Energy Laboratory, April 2000 (R0126)
160 Navigant Consulting, Evaluation Report: Opower SMUD Pilot Year2, 2011http://opower.com/uploads/library/file/6/opower_smud_yr2_eval_report_-_final-1.pdf (R0127)
161 Meeting discussion, 10/20/11, Puget Sound Energy, Conservation Resource Advisory Group.
Section 4.4 Near-Term Recommendations
2012 Washington State Energy Strategy page 106
efficiency upgrade adoption rate immediately following an energy audit. Adoption of more thanone efficiency measure is common. It is anticipated that additional measures will be adopted inthe future. It is recommended that homeowners have a financial investment in the audit. Whileutility and government programs may provide much of the energy audit funding, most programsrequire some financial commitment from the owner. This assures the owner is interested in theenergy audit process and in implementation of efficiency upgrades. To control program costs ofhome energy audits and retrofits, prescreening is recommended. This includes identifying highenergy use homes through energy bills and separating the curious from the serious by charginga fee for home energy audits.162
Commerce has not recommended detailed home energy audits for all homes as a sale or rentaldisclosure requirement because of past program performance and costs. The following detailsboth cost and previous program outcomes related to home energy audits that are broadlyadopted at time of sale or lending.
Energy use disclosure at time of sale or use considers the number of homes sold or rented eachyear and the cost to develop reporting. This detail underscores the high cost of broad adoptionof building assets rating programs. Additional analysis of a billing based or operational rating willbe developed for the final Energy Strategy.
! From 1996 to 2007, annual existing single family home sales ranged from 84,570 to 159,600of an estimated 1,903,482 (2010) single family housing units.163
! A comprehensive home energy audit and score cost from $400 to $600 per home.164
! Twenty-five percent of existing homes were constructed since the introduction of the 1990State Energy Code and could reasonably be exempt from a home energy audit and score.
! For example statewide annual cost for home energy audit and score at time of sale: 95,000audits X $500 = $47,500,000.
For single family rental properties, the tenant turnover rate is just above 50 percent every twoyears. After the first two years of occupancy, the turnover rate drops to 16 percent or lower.165
Washington single family detached residences for rent are estimated to be 16 percent of thetotal single family detached residences166 or 304,500 units, 75 percent of these constructed priorto 1990, or 228,375 units. Of these, approximately 50 percent, or 114,187, would be required todisclose energy audit scores in the first two years of the requirement. This would decreasesignificantly in future years. Total cost for the first two years of the disclose program:
162 Fuller, M.et al, Driving Demand for Home Energy Improvements, Lawrence Berkeley Laboratory, 2010http://drivingdemand.lbl.gov/ (R0131)
163 Washington Center for Real Estate Research, http://www.wcrer.wsu.edu/WSHM/WSHM.html (S0057)164 WA Dept. of Commerce, Home Energy Audit and Retrofit Including Home Energy Scoring January 2011 (S0026)165 U.S. Census Bureau, Property Owners and Mangers Survey, Single Family Properties, Length of current rental
Stay (R0128)166 Based on U.S. Census Bureau, 2009 American Housing Survey, Seattle Metropolitan Area Detailed Table 1.
http://www.census.gov/hhes/www/housing/ahs/2009Seattle/seattle09.html (R0129)
Section 4.4 Near-Term Recommendations
2012 Washington State Energy Strategy page 107
! For rental properties statewide home energy audits at prior to lease: 114,000 X $500 =$57,093,750 first two years.
The cost associated with providing an annual energy bill has not been developed, but should bemuch less than requiring audits at sale. Commerce will consult with utilities to arrive at this costand the cost of possible enhancements.
M3?$%3%*+"+5'*! Develop supporting documentation for the annual home energy bills concept. This includes
detailed cost estimates, a benefits statement and implementation strategy;
! Provide opportunities to limit impacts on sellers, landlords and utilities by seeking input onbest implementation methods while accomplishing primary recommendations;
! Create model legislation for disclosure of home energy reports based on utility billing; and
! Examine obstacles to disclosure of tenant utility bills by building owners and proposeremedies.
E4E4D &K"6/%+5*2&"*1&_;"$5+=&-,,;6"*.%
C'$5.=&8%,.65?+5'*
Marketing is an essential element for increasing adoption of energy efficient practices in theresidential sector. The Pacific Northwest utilities have a long history of developing cooperativeefficiency programs that include program specifications, training for contractors, qualityassurance and marketing. It has been some time since this approach was broadly implementedfor home energy retrofits. This proposal recommends bringing this type of comprehensive effortto a statewide program.
To help consumers identify qualified home efficiency contractors, the proposed programprovides uniform standards, a quality assurance program and marketing with statewide reach.The program would be designed to support energy efficiency for all fuel types.
There are many different home energy efficiency programs and green remodeling programs inWashington. Each operates under their own program design. This program would serve toprovide a unifying marketing and quality assurance program that increases consumerconfidence in these programs. This will benefit consumer, existing efficiency programs andparticipating contractors.
To implement this program it is recommended that a lead administrative organization bedesignated to coordinate the home energy retrofit program. The program shall organize arounda single brand and provide services to build confidence amongst consumers and the energyefficiency funding community that retrofit work will be completed in a quality manner andproduce the expected energy savings, health and comfort benefits. Program elements include:
! Uniform marketing and branding strategy
Section 4.4 Near-Term Recommendations
2012 Washington State Energy Strategy page 108
! A consumer coaching program to carry the consumer through the multi-step retrofit process
! Certifications for workforce and industry participants
! Support for contractor business development
! Links to financing and incentives
! Providing a quality assurance backstop
-- Customer feedback mechanism
-- Conflict resolution mechanism
Likely partners are contractors, labor, utilities, weatherization organizations, local governmentand other interested organizations.
State government could serve as a catalyst for this program. This will require some allocation ofgovernment funding. However, it is anticipated that the bulk of funding for this type of programwill be the program participants such as utilities and participating contractors, perhaps through a"checkoff" mechanism similar to that used for marketing of agricultural commodities.
C6%75';,&Q%,%"6.>&"*1&9:?%65%*.%
A detailed discussion of the creation of Home Energy Retrofit Marketing and Quality AssuranceProgram is included in the Commerce report Home Energy Audit and Retrofit Including HomeEnergy Scoring January 2011. This report supports this concept as a needed supportingelement to any home energy disclosure regulations.
A number of successful energy efficiency branding programs have demonstrated theeffectiveness of collaborative marketing around consistent efficiency standards. This includesSuper Good Cents, Energy Star and Washwise.
Two reports developed on the national level support the concept. Roadmap for the HomeEnergy Upgrade Market167 by the SEE Action workgroup and Driving Demand for Home EnergyImprovements Lawrence Berkeley Laboratory,168 encourage comprehensive marketing,recognition of contractor role in encouraging efficiency sales and supporting quality assuranceprograms.
This concept is supported by the national Home Performance with Energy Star Program. TheIntroductory Fact Sheet169 and program Sponsor Guide170 provide good supporting information,a sample implementation plan and supporting marketing materials.
167 The Residential Building Retrofits Working Group Roadmap for the Home Energy Upgrade Market, State andLocal energy Efficiency Action Network June 2011.http://www1.eere.energy.gov/seeaction/residential_retrofits.html (R0130)
168 Fuller, M.et al, Driving Demand for Home Energy Improvements, Lawrence Berkeley Laboratory, 2010http://drivingdemand.lbl.gov/ (R0131)
169http://www.energystar.gov/ia/home_improvement/HPwES_Utility_Intro_FactSheet.pdf (R0132)170http://www.energystar.gov/ia/home_improvement/downloads/HPwES_Sponsor_Guide.pdf (R0133)
Section 4.4 Near-Term Recommendations
2012 Washington State Energy Strategy page 109
The program would adopt a uniform conservation implementation standard. Standards forenergy conservation work are well developed in the region and nationally. This includes theBonneville Power Administration Energy Efficiency Implementation Manual, program designs ofstate utilities and the DOE s Workforce Guidelines for Home Energy Upgrades.171
M3?$%3%*+"+5'*! Identify contractors, labor, utilities, local government and others interested in developing a
cooperative marketing and quality assurance program for residential energy efficiencyretrofits
! Develop design for lead administrative organization
! Develop detailed implementation plan, including startup and ongoing budgets
! Examine the need for legislation to designate a lead administrative organization orstreamline program contracting
E4E4E K%+%6XL",%1&T5*"*.5*2
C'$5.=&8%,.65?+5'*
Meter-based financing of energy efficiency retrofits enables customers to obtain investmentcapital and repay that investment as a charge for their utility services. Linking repayment to theutility service makes it easier to spread the investment cost among all who will reap the energycost savings. A meter-based financing mechanism would enable everyone who benefits from anenergy efficiency retrofit project to contribute to the repayment of that project s costs. Thebeneficiaries are the current and future occupants of the house or business, who benefit throughimproved energy performance and lower energy costs.
By contrast, conventional loan-based mechanisms recover all investment costs from the initialproperty owner, who usually receives only a portion of the future benefits. This discourages bothborrowers and lenders from making the investment. The weakness of conventional loanprograms is illustrated in several credit enhancement programs that offer conventional loanssupported with federal recovery funds. Despite substantial support with public funds, theprograms have sparked only modest interest among utility customers. It sometimes seemsirrational for a property owner to turn down an upgrade project that might yield a return oninvestment of 10-15 percent. However, long-term paybacks may have little value to the ownerwho expects to sell within a few years. For example, a residential efficiency project mightrequire an initial investment of $5,000 and yield annual cost savings of $600 per year. Despitethe 12 percent long-term return, a homeowner using conventional financing who sold theproperty after five years would suffer a significant loss. Likewise, the owner of a rental propertywould be unwilling to invest in an energy retrofit if most or all of the cost savings accrue to futuretenants through their utility bills.
171 Workforce Guidelines for Home Energy Upgrades, National Renewable Energy Laboratory, U.S. Department ofEnergy (R0134)
Section 4.4 Near-Term Recommendations
2012 Washington State Energy Strategy page 110
From the investor s perspective, a meter-based approach provides a level of security that isdifficult to obtain through conventional financing. A conventional loan is secured by the value ofthe property or by the borrower s personal creditworthiness. A loan secured by a mortgage isexpensive to originate and requires that the owner have positive equity. Unsecured (signature)loans are based on the creditworthiness of the initial borrower and usually require a shorterrepayment period than the life of the energy savings. By contrast, a meter-based financingmechanism could secure investor capital even if the owner defaults on his mortgage or declaresbankruptcy.
Under the meter-based approach, the program would provide the initial investment funding foran energy efficiency retrofit project. The investment capital would likely not be supplied by theutility itself and could be funded from the same sources that supply conventional loan programs.Customers who opt into the program would pay a tariffed energy efficiency service charge thatrecovers, with interest, the program investment over the useful life of the efficiency upgrades.Depending on the cost of investment capital, the initial energy service charge would likely beabout $7 per month for each $1,000 of investment. In the example discussed above, thecustomer receiving a $5,000 efficiency retrofit would pay an energy service charge of $35 permonth. Since his energy costs decrease by $50, the upgrade has no net cost to the customerand reduces his monthly energy cost by $15.
This approach has some similarities to the green power or carbon offset programs offered byincreasing numbers of public utilities, in that it lets customers select an alternative resourcewithout having to finance the investment on their own. In green power programs, customers whowish to reduce their use of conventional fossil fuel energy may opt into a green tariff. Thecustomer pays an extra charge for this service, and the utility uses these funds to acquirealternative power or carbon offsets. The meter-based efficiency mechanism would providecustomers with a similar payment mechanism and a way to use their own homes to achieveenvironmental objectives.
Utilities and utility regulators may find the meter-based approach attractive because it improvesthe alignment of costs and benefits associated with energy efficiency programs. Utilitiescurrently fund efficiency programs through the rates of all customers, including those customerswho have not received upgrades or who paid for their own efficiency measures (such as someindustrial customers and customers who own new homes). Some utilities also offer low-interestloans, which require their own investment capital. Meter-based financing would allow utilities torecover more of the cost directly from the customers who experience the energy cost savings ofthose upgrades and thereby reduce the financial tension between participants and non-participants. As with other efficiency programs, the terms of the meter-based program wouldrequire regulatory approval for investor-owned utilities.
Issues to resolve in developing meter-based mechanisms include:
! The best sources of investment funds to finance efficiency retrofit projects. Aneffective mechanism could require $500 million of capital statewide. These funds wouldprobably not be supplied by utility investors. For example, Seattle City Light provides on-billrepayment for the Community Power Works program, but it does not supply the investmentcapital itself. A meter-based approach could be used to secure investment capital supplied
Section 4.4 Near-Term Recommendations
2012 Washington State Energy Strategy page 111
by banks, other non-utility investors or the state through a bond program such as the stateHousing Finance Commission.
! Disclosure to subsequent customers. When a customer opts for meter-based financing,any subsequent owner or tenant will share responsibility for repayment through an energyservices charge. While this charge would be offset by energy cost savings, it should bedisclosed to the new customer. Existing disclosure mechanisms, including tariff disclosurerequirements and recording of notice with county auditors, may prove sufficient.
! Implementation by utilities. A meter-based approach, involving a tariff for energy services,would represent a new business process for electric and natural gas utilities and wouldrequire implementation of new business processes.172
! Utility management of energy efficiency resources. In making it easier for customers tofinance energy retrofit projects, a meter-based approach may reduce a utility s ability tomanage the pace at which energy efficiency resources are acquired.173 Any meter-basedmechanism may require provisions to enable the utility to maintain a stable level ofconservation activity over time.
C6%75';,&Q%,%"6.>&"*1&9:?%65%*.%
Approximately 25 municipal and investor-owned utilities in Kansas offer meter-based efficiencyretrofit programs. The investment capital is provided by a state revolving loan fund, using$34 million of federal stimulus funds. The program funds projects in owner-occupied and renter-occupied properties, as well as commercial properties, and there is no credit screening ofcustomers. Project costs are repaid over a term of up to 15 years, at a financing cost of4 percent.174 The Kansas program is modeled on a program called Pay as You Save (PAYS)that originated in New England.
New York state enacted legislation in August 2011 that creates an on-bill financing program withcapital supplied by the New York State Energy Research and Development Authority usingfederal funds. Implementation is expected in 2012.175
Energy utilities in Portland and Seattle have implemented on-bill financing mechanisms in whichEnterprise Cascadia, a community development financial institution, is the lender. Investmentcapital is supported by federal funds. Loans made through the programs are repaid on thecustomer s bill, but they remain conventional loans and do not rely on a tariff to enforcepayment.
172 In their comments on the draft strategy, Avista and PacifiCorp noted that the meter-based approach could requirechanges to utility billing systems.
173 In its comments on the draft strategy, Snohomish Public Utility District raised the concern that the customerresponse to a meter-based financing offering could disrupt a utility s ability to meet biennial targets adopted incompliance with Initiative 937.
174 Efficiency Kansas Program Manual, version 4, Aug. 27, 2010.http://www.efficiencykansas.com/document.fetcher.php?document_id=15 (R0139)
175 http://online.wsj.com/article/APb622e2623a644c5bbd5f61ee8f512d28.html (R0135)
Section 4.4 Near-Term Recommendations
2012 Washington State Energy Strategy page 112
In 1993, the Legislature enacted a statute176 authorizing investor-owned utilities to use utility tariffs to finance energy efficiency improvements. The law includes a provision that cost responsibility would transfer to successive users of the property receiving the improvement. The law provides for notification of subsequent property owners by recording the obligation with the county auditor or recording officer. 177,178,179,180
New Analysis
All of the residential energy efficiency policies included in the Energy Strategy aim to increase market penetration of energy efficiency retrofits. This includes insulation, air sealing, duct sealing and equipment upgrades. The impact of consumer engagement and additional access to funding is expected to increase the market penetration rates for homes from the current penetration rate of less than 0.5 percent to a greater rate noted in the analysis results. To reach the higher penetration rates it is anticipated that multiple strategies will need to be in place.
Implementation
Identify and develop potential sources of investment capital, including the Washington State Housing Finance Commission, to fund meter-based retrofit projects.
Work with private and public utilities to develop a meter-based financing approach, addressing stakeholder concerns.
Test customer acceptance using one or more pilot projects.
176 RCW 80.28.065 Tariff schedule — Energy conservation — Payment by successive property owners — Notice —
Rules. (1) Upon request by an electrical or gas company, the commission may approve a tariff schedule that contains rates or charges for energy conservation measures, services, or payments provided to individual property owners or customers. The tariff schedule shall require the electrical or gas company to enter into an agreement with the property owner or customer receiving services at the time the conservation measures, services or payments are initially provided. The tariff schedule may allow for the payment of the rates or charges over a period of time and for the application of the payment obligation to successive property owners or customers at the premises where the conservation measures or services were installed or performed or with respect to which the conservation payments were made. (2) The electrical or gas company shall record a notice of a payment obligation, containing a legal description, resulting from an agreement under this section with the county auditor or recording officer as provided in RCW 65.04.030. (3) The commission may prescribe by rule other methods by which an electrical or gas company shall notify property owners or customers of any such payment obligation.
177 Merrian Fuller, Enabling Investments in Energy Efficiency: A study of energy efficiency programs that reduce first-cost barriers in the residential sector, May 21, 2009, http://www.sefalliance.org/fileadmin/media/sefalliance/docs/Resources/UC_Berkeley_EE_loan_programs.pdf (R0137)
178 Matthew Brown, Alliance to Save Energy, Paying for Energy Upgrades Through Utility Bills, Brief No. 3, State Energy Efficiency Policies: Options and Lessons Learned, 2009, http://ase.org/resources/brief-3-paying-energy-efficiency-upgrades-through-utility-bills (R0138)
179 Uyen Le, Massachusetts Institute of Technology Community Innovators Lab, On-Bill Repayment: Understanding and Advocating for an On-Bill Repayment System, January 26, 2010. http://web.mit.edu/colab/resources/ (R0140)
180 Devashree Saha, et al., NGA Center for Best Practices, State Clean Energy Financing Guidebook, January 2011, http://www.nga.org/files/live/sites/NGA/files/pdf/1101CLEANENERGYFINANCING.PDF (R0141)
Section 4.4 Near-Term Recommendations
2012 Washington State Energy Strategy page 113
E4E4F 9*%62=&9((5.5%*+&C6'?%6+=&)'*7%6,5'*,
C'$5.=&8%,.65?+5'*
The housing crisis has left the state with a large stock of houses that are virtual orphans, subjectto foreclosure and owned by lenders. Many are unoccupied and in poor condition. The financialcrisis has left the state with many unemployed construction workers. A program to improve thehousing stock and employ these workers would reap economic benefits to this state, and thebenefits would be even greater if the upgrades took full advantage of the potential to increaseenergy efficiency.
Some individual homebuyers will see an opportunity in the pool of distressed properties,purchase a house, obtain bank financing for the purchase and improvements, employcontractors to make the improvements, and then move in. However, this takes a level ofpatience, skill and risk tolerance beyond the typical homebuyer. A more promising strategy isone in which developers make a business of converting properties from distressed to saleready.
One example is Green Canopy Homes in Seattle.181 This firm purchases homes in need ofrepairs and in some cases undervalued due to being bank or estate sales. After purchase,Green Canopy contracts with the Seattle!based company Ecofab to conduct an energyassessment and register a baseline energy performance score. The company serves as thegeneral contractor on each project, hiring subcontractors as needed. The upgrade focuses onrepairs, curb appeal and new appliances, with under 3 percent of the budget going to energyefficiency measures. These measures have a significant effect on energy performance,however, enough to reduce the house s carbon footprint by 12,000 pounds per year and itsenergy costs by an estimated $1,200 per year.182
Energy efficient property conversions benefit the public in multiple ways and should be stronglyencouraged. They improve neighborhoods by removing vacant or dilapidated properties and byincreasing the availability of quality properties. They increase employment in a distressedbusiness sector, through both direct employment of contractors and laborers and the productionof building materials. These activities also boost state and local collections of sales and realestate taxes.
Public policy should not just encourage property conversions but also those developers who willmake energy efficiency upgrades. If conversions are limited to cosmetic items new carpet anda coat of paint the opportunity is missed to make cost-effective improvements in energyefficiency. These deeper retrofit measures are much easier to accomplish while the house isvacant and other work is also being done.
Policy makers should consider multiple approaches to encourage energy efficient propertyconversions. One such possibility is to address the tax burden that applies to developer drivenconversions and would not apply when the improvements are made by owner-occupants. This
181 http://greencanopyhomes.com/182 Commerce s Emerging Business Models to Drive Energy Efficiency is pending. (S0058)
Section 4.4 Near-Term Recommendations
2012 Washington State Energy Strategy page 114
tax burden arises from the fact that a developer driven conversion typically requires two saletransactions, each of which is subject to the real estate excise tax (REET). The tax is paid firstwhen the developer purchases the distressed property. After the property is upgraded, thedeveloper sells the property, presumably at a higher price, and pays the real estate excise taxagain. The REET is levied at the time of sale at a rate of up to 1.78 percent.
To provide stronger incentives for energy efficiency conversions, the state could allow thetaxpayer to take a credit for the first REET payment in calculating the REET amount on thesecond, higher transaction. For example, if a developer purchased a distressed property for$150,000 and sold the property in an improved condition for $250,000, the REET would be$2,670 for the first transaction and $4,450 for the second transaction. With the tax credit, thesecond REET would be reduced to $1,780.
This credit would provide a small but tangible incentive to developers to incorporate energyefficiency measures when they convert distressed properties. The tax credit should be based ona demonstration that the upgrade includes energy efficiency measures, and it should requirethat resale occur within a specified period after the initial purchase.
C6%75';,&Q%,%"6.>&"*1&9:?%65%*.%
No previous research on this topic.
W%0&-*"$=,5,According to RealtyTrak, the current level of bank owned residential property sales isapproximately 1,000 - 2,000 per month. If 10,000 properties per year were induced by the REETcredit to perform an energy efficient property conversion, the result would be about $100 millionper year in energy efficiency expenditures. The associated energy costs savings would be about$170 million, net present value. The tax expenditure would be about $18 million per year.
M3?$%3%*+"+5'*! Assess interest among remodeling firms in a program to provide a tax credit for energy
efficient property conversions.
! Develop legislation to establish a tax credit for energy efficient property conversions. Thelegislation would define eligibility requirements, including the demonstration of energyefficiency results and the period for resale.
E4E4G K5*53;3&<+"*1"61,&('6&Q%*+"$&[';,5*2
C'$5.=&8%,.65?+5'*
To assure a minimum level of efficiency in rental housing, it is recommended that the stateestablish efficiency standards for this sector. This population of housing is less likely to havebeen upgraded because the owner does not pay the energy utility bills. This proposal wouldrequire all rental homes to be improved at time of sale or by a specific date in the future.

Section 4.4 Near-Term Recommendations
2012 Washington State Energy Strategy page 115
Required improvements would be limited to simple cost effective measures, attic and floorinsulation for example. Exceptions to the standard would be established to limit owner expensesand to limit impacts on property transfers.
! A list of minimum energy efficiency upgrades would be generated based on demonstratedcost-effectiveness in large populations of homes. For example, using the insulationstandards represented in the Bonneville Power Energy Efficiency Manual, or similardocumentation.
! Exceptions to requirements would be generated to assure costs are controlled. Forexample, wall insulation would not be required if the installation could not be completedwithout extensive finish work. Cost caps would be designed to limit maximum expense
! Exceptions would be made to assure the transfer of deeds did not impacts transfersbetween family members, as part of court-ordered property transfers, or other transfers to bedefined.
C6%75';,&Q%,%"6.>&"*1&9:?%65%*.%
Starting January 1, 1985, most residential properties in Wisconsin have had to meet minimumenergy conservation standards at the time of ownership transfer. Private, state-certifiedinspectors are hired by owners to check properties for compliance with the standards. TheRegister of Deeds in the county will not record the transfer of a property unless it meets theminimum standard:183 This may include:
! Insulation must be installed in all "accessible areas
! Windows must be double-glazed or equipped with storm windows
! Air leakage control completed
! Moisture control meets codes
Recent research has identified important physical differences between owner-occupied andrental markets for energy efficiency. Owner occupied housing is more likely to be heated withgas, rentals with electricity. Owner occupied housing is also more likely to be insulated: Forexample, (in California) if the dwelling is owner-occupied and the resident pays for heating orcooling, the attic/ceiling is roughly 20 percent more likely to be insulated, and the exterior wallsare roughly 13 percent more likely to be insulated. 184
W%0&-*"$=,5,
Washington State University, Energy Extension, is estimating the penetration potential forenergy efficiency retrofits to rental housing; the results of this work will be available shortly afterthis Energy Strategy is published.
183 Wisconsin Department of Safety and Professional Services WISCONSIN RENTAL WEATHERIZATIONPROGRAM http://dsps.wi.gov/sb/SB-RentalWeatherizationProgram.html (R0142)
184 Kenneth Gillingham, Matthew Harding, and David Rapson, Split Incentives in Household Energy Consumption,Energy Journal 33 (2012) pp.37-62., (R0160)
Section 4.4 Near-Term Recommendations
2012 Washington State Energy Strategy page 116
M3?$%3%*+"+5'*! Examine use of excise tax credit to partially fund projects;
! Identify any needed supporting infrastructure. For example, home inspector qualifications;
! Identify administrative agency and define enforcement methods;
! Develop proposed legislation; and
! Develop supporting documentation, including cost and benefit.
E4E4H <;,+"5*5*2&M*7%,+3%*+&5*&V'0XM*.'3%&P%"+>%65B"+5'*&C6'26"3,
C'$5.=&8%,.65?+5'*
Low-income weatherization programs are at risk because of anticipated budget reductions fromstate and federal funding sources. Commerce will lead a series of meetings to develop andimplement recommendations for sustaining program delivery of weatherization services to low-income households. Utilities, utility regulators, low-income and tribal representatives and otherstakeholders will be consulted to develop priorities for preserving and increasing theweatherization programs that serve vulnerable populations and provide energy savings for theentire utility system.
A preliminary list of subjects for discussion is presented below. It is anticipated that, by creatingan opportunity for dialogue, additional areas of interest will emerge.
! Develop a long-term needs assessment and resulting conservation potential for the low-income housing sector in Washington.
! Develop opportunities and incentives that allow and encourage utilities to prioritizeimplementation of low-income weatherization within their conservation portfolios. Assurethey are consistent with state utility conservation policies and regulations.
! Develop analysis of state match maker capital funding required to maximize utility fundingfor low-income weatherization.
! Examine opportunities to reduce program complexity that could result in increased directdelivery of efficiency services.
! Address the labor classification issues and possible cost savings resulting from changesdetailed in policy Section 4.4.8.
The proposals outlined in this section are motivated by the Legislature s directive that the stateEnergy Strategy meet the health, welfare, and economic needs of its citizens with particularemphasis on meeting the needs of low-income and vulnerable populations. Other elements ofthe building efficiency strategy depend on the ability of energy consumers to pay most of thecost of efficiency improvements, and policy makers have recognized that this will not work ifapplied to low-income households.
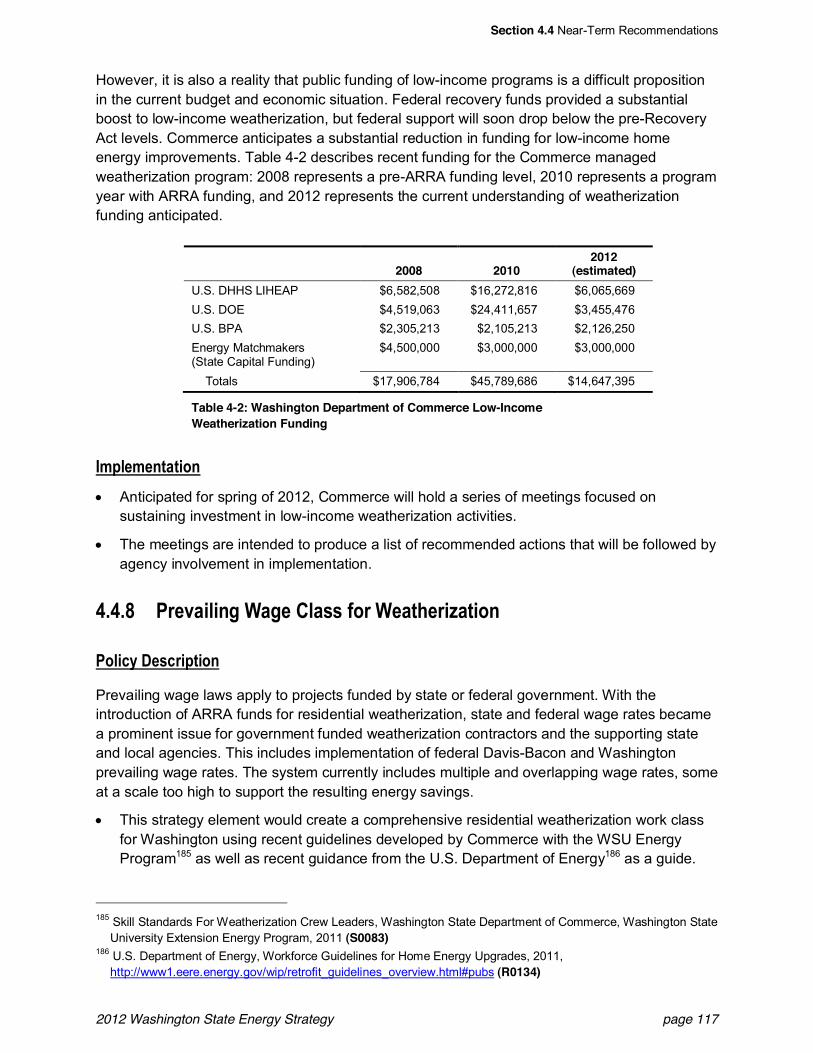
Section 4.4 Near-Term Recommendations
2012 Washington State Energy Strategy page 117
However, it is also a reality that public funding of low-income programs is a difficult propositionin the current budget and economic situation. Federal recovery funds provided a substantialboost to low-income weatherization, but federal support will soon drop below the pre-RecoveryAct levels. Commerce anticipates a substantial reduction in funding for low-income homeenergy improvements. Table 4-2 describes recent funding for the Commerce managedweatherization program: 2008 represents a pre-ARRA funding level, 2010 represents a programyear with ARRA funding, and 2012 represents the current understanding of weatherizationfunding anticipated.
2008 20102012
(estimated)U.S. DHHS LIHEAP $6,582,508 $16,272,816 $6,065,669U.S. DOE $4,519,063 $24,411,657 $3,455,476U.S. BPA $2,305,213 $2,105,213 $2,126,250Energy Matchmakers(State Capital Funding)
$4,500,000 $3,000,000 $3,000,000
Totals $17,906,784 $45,789,686 $14,647,395
Table 4-2: Washington Department of Commerce Low-IncomeWeatherization Funding
M3?$%3%*+"+5'*! Anticipated for spring of 2012, Commerce will hold a series of meetings focused on
sustaining investment in low-income weatherization activities.
! The meetings are intended to produce a list of recommended actions that will be followed byagency involvement in implementation.
E4E4I C6%7"5$5*2&P"2%&)$",,&('6&P%"+>%65B"+5'*
C'$5.=&8%,.65?+5'*
Prevailing wage laws apply to projects funded by state or federal government. With theintroduction of ARRA funds for residential weatherization, state and federal wage rates becamea prominent issue for government funded weatherization contractors and the supporting stateand local agencies. This includes implementation of federal Davis-Bacon and Washingtonprevailing wage rates. The system currently includes multiple and overlapping wage rates, someat a scale too high to support the resulting energy savings.
! This strategy element would create a comprehensive residential weatherization work classfor Washington using recent guidelines developed by Commerce with the WSU EnergyProgram185 as well as recent guidance from the U.S. Department of Energy186 as a guide.
185 Skill Standards For Weatherization Crew Leaders, Washington State Department of Commerce, Washington StateUniversity Extension Energy Program, 2011 (S0083)
186 U.S. Department of Energy, Workforce Guidelines for Home Energy Upgrades, 2011,http://www1.eere.energy.gov/wip/retrofit_guidelines_overview.html#pubs (R0134)
Section 4.4 Near-Term Recommendations
2012 Washington State Energy Strategy page 118
The effort would distinguish between weatherization workers and specialized trades. Forexample, define work conducted under this class to include most weatherization activities, butnot highly skilled labor activities (showerhead replacement vs. complex plumbing repair).
A description of the weatherization prevailing wage laws in Washington are provided on theWashington State Department of Labor and Industries webpage.187
W%0&-*"$=,5,
Key weatherization measures are at risk due to labor rate impacts on efficiency cost-effectiveness tests. An evaluation of the Weatherization Program production costs shows thatafter adjusting for normal construction cost inflation, FY 2010 per unit direct costs were $400 -$700 higher than unit costs reported in 2006. This translates into $4 million in additionalexpenditures in FY 2010. The ongoing cost increase may be a result of additional costs toachieve compliance or increased wages paid for weatherization work.188 This report alsosuggests that a program administrator examine the impacts of administrative andimplementation cost related to compliance with complex and sometimes more expensive wagerates than in the recent past.
! Assess the impact of higher wages on weatherization measure cost effectiveness: Higherproduction costs will result in some weatherization no longer being cost-effective.
! Wage requirements versus production costs: The federal Davis-Bacon and WashingtonPrevailing Wage requirements result in higher wages, which benefit employees doingweatherization work. However, this has resulted in higher weatherization production costsand fewer measures being installed.
! Accountability/reporting requirements versus administrative/overhead costs: Agencies saidit is becoming more difficult and time consuming to comply with program requirements. Thisis driving up their administration and operating costs and decreasing the cost effectivenessof the services they provides.
It has been noted that some of the current workforce classification could result in elimination ofsome weatherization measures. For example, if the wage rate of a sheet metal worker is appliedto residential duct insulation work, the measure will no longer be cost effective.
W%:+&<+%?,
Commerce will further examine the implementation of revised wage classifications and makepossible recommendations for modifications to state prevailing wage rules.
! Defining weatherization worker and simplify pay and reporting schedules
187 Labor and Industries web page. http://www.lni.wa.gov/TradesLicensing/PrevWage/Weatherization/default.asp(S0059)
188 Kunkle, R, Schueler, V. Washington State Low-Income Weatherization Program Evaluation Report For FY2010Final Report May 2011, Washington State University Extension Energy Program.http://www.commerce.wa.gov/DesktopModules/CTEDPublications/CTEDPublicationsView.aspx?tabID=0&ItemID=9840&MId=870&wversion=Staging (S0060)
Section 4.5 Combined Assessment of Residential Potential
2012 Washington State Energy Strategy page 119
! Propose new work classification for Washington Labor and Industries for consideration
E4F )'3#5*%1&-,,%,,3%*+&'(&Q%,51%*+5"$&C'+%*+5"$
This section provides a description of the market potential and a cost and benefit scenario fordoubling the current implementation rate for residential energy efficiency retrofits. Theresidential efficiency initiatives, with the exception of 4.4.6 minimum standards for rentalhousing, intend to stimulate and support voluntary actions that improve the efficiency of homes.A combination of these approaches is needed to move the market to action. It is anticipated thatsome combination of these activities will be needed to achieve the results included in thisanalysis. The residential initiatives include:
! 4.4.2 residential disclosure
! 4.4.3 marketing and quality assurance
! 4.4.4 meter-based financing
! 4.4.5 energy efficient property conversions
! 4.4.6 minimum standards for rental housing
Market Potential: There are a large number of homes that would benefit from additionalinsulation, air sealing and duct sealing. The exact numbers are unknown. A study of primarilyowner-occupied homes conducted by the region s utilities examined the insulation in existinghomes built in 2006 and earlier.189 Based on this study and typical insulation upgrade guidelinesCommerce made the following assessment of potential. Additional detailed analysis may beavailable from utility conservation potential studies developed as part of the utility least costplans.190 According to the study, 26 percent of homes have attic insulation rated less than R-19,23 percent of homes have no floor insulation and 31 percent have walls with R-0 or an unknownlevel of insulation (Figure 4-1). Determining the level of insulation in a wall is difficult, resulting inhigh levels of unknown. The Bonneville Power Administration191 and many other regional utilityefficiency programs recommend adding insulation to homes with less than R-19 attic insulation,or when there is no insulation exists in the floors or walls.
The mix of measures per home will vary. Many homes will require multiple measures. Some willonly require one. For this analysis, it was assumed that 20 percent or more of existing singlefamily homes could benefit from insulation, air sealing or duct sealing upgrades. In 2006,Washington included more than 1.8 million single family homes.192 Energy efficiency retrofitsapplied to 20 percent of this population would yield 365,000 Washington homes.
189 RLW Analytics, Single-Family Residential Existing Construction Stock Assessment, Market Research Report, E07-179, Northwest Energy Efficiency Alliance (10/2007) 6((&7//$**#8'"9/"*%*#",6/"*&'"(:*(#);8#%&<=>?@ABC (R0200)
190 An example of a comprehensive utility conservation potential study is from Puget Sound Energy. This is includedin Appendix K. of Puget Sound Energy s Integrated Resource Planhttp://pse.com/aboutpse/EnergySupply/Pages/Resource-Planning.aspx (R0201)
191 Bonneville Power Administration, Energy Efficiency Implementation Manual, October 2011.http://www.bpa.gov/Energy/N/implementation.cfm (R0202)
192 Washington Center for Real Estate Research, Single Family Housing Inventory, State of Washington andCounties, Year End, 2010. (S0057)
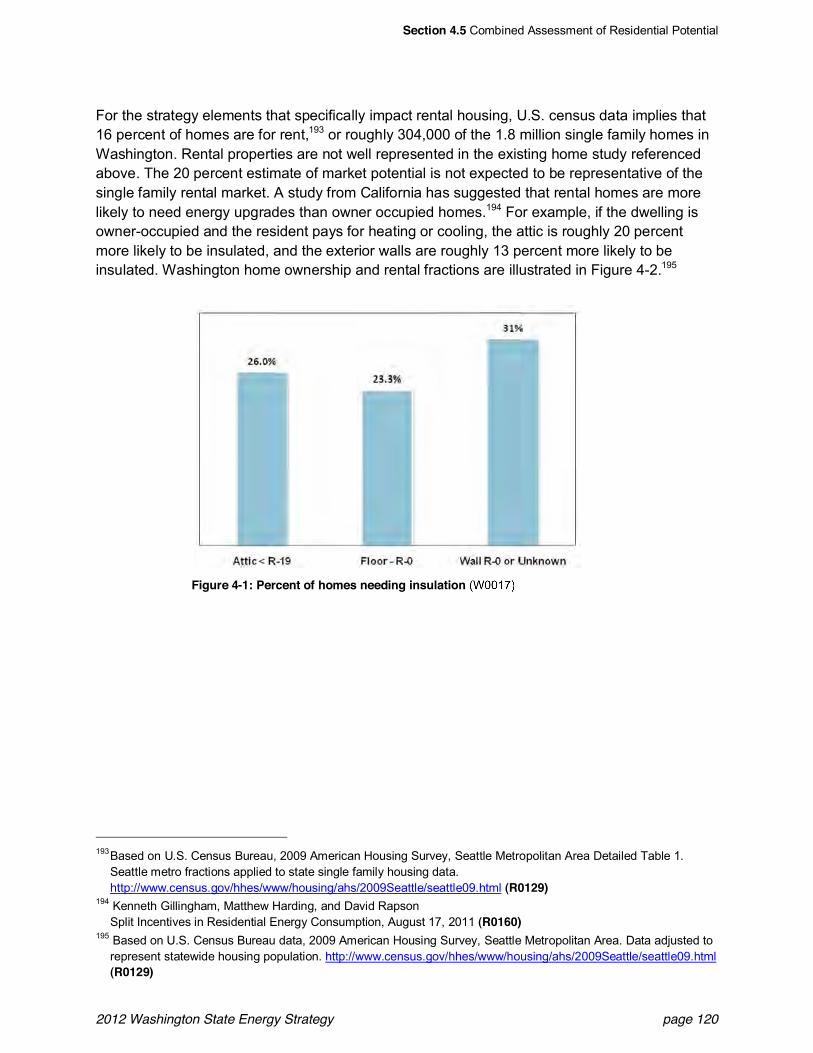
Section 4.5 Combined Assessment of Residential Potential
2012 Washington State Energy Strategy page 120
For the strategy elements that specifically impact rental housing, U.S. census data implies that16 percent of homes are for rent,193 or roughly 304,000 of the 1.8 million single family homes inWashington. Rental properties are not well represented in the existing home study referencedabove. The 20 percent estimate of market potential is not expected to be representative of thesingle family rental market. A study from California has suggested that rental homes are morelikely to need energy upgrades than owner occupied homes.194 For example, if the dwelling isowner-occupied and the resident pays for heating or cooling, the attic is roughly 20 percentmore likely to be insulated, and the exterior walls are roughly 13 percent more likely to beinsulated. Washington home ownership and rental fractions are illustrated in Figure 4-2.195
Figure 4-1: Percent of homes needing insulation
193 Based on U.S. Census Bureau, 2009 American Housing Survey, Seattle Metropolitan Area Detailed Table 1.Seattle metro fractions applied to state single family housing data.http://www.census.gov/hhes/www/housing/ahs/2009Seattle/seattle09.html (R0129)
194 Kenneth Gillingham, Matthew Harding, and David RapsonSplit Incentives in Residential Energy Consumption, August 17, 2011 (R0160)
195 Based on U.S. Census Bureau data, 2009 American Housing Survey, Seattle Metropolitan Area. Data adjusted torepresent statewide housing population. http://www.census.gov/hhes/www/housing/ahs/2009Seattle/seattle09.html(R0129)
CaroleeS
(W0017)
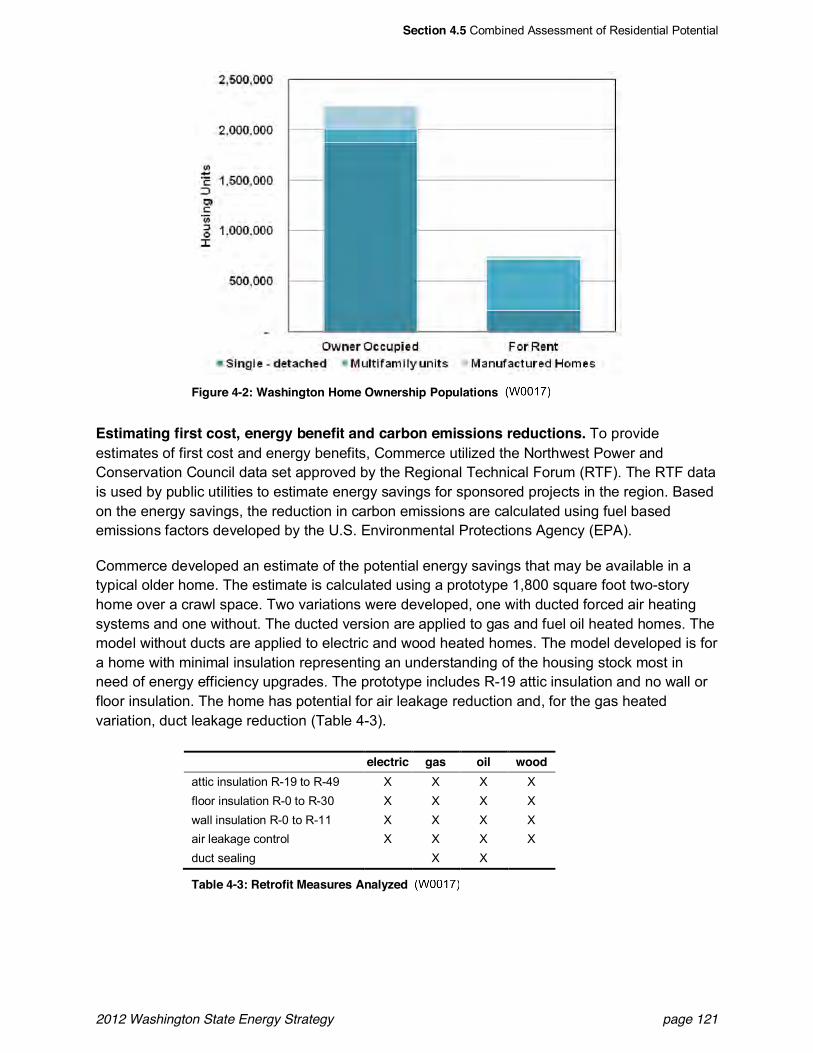
Section 4.5 Combined Assessment of Residential Potential
2012 Washington State Energy Strategy page 121
Figure 4-2: Washington Home Ownership Populations
Estimating first cost, energy benefit and carbon emissions reductions. To provideestimates of first cost and energy benefits, Commerce utilized the Northwest Power andConservation Council data set approved by the Regional Technical Forum (RTF). The RTF datais used by public utilities to estimate energy savings for sponsored projects in the region. Basedon the energy savings, the reduction in carbon emissions are calculated using fuel basedemissions factors developed by the U.S. Environmental Protections Agency (EPA).
Commerce developed an estimate of the potential energy savings that may be available in atypical older home. The estimate is calculated using a prototype 1,800 square foot two-storyhome over a crawl space. Two variations were developed, one with ducted forced air heatingsystems and one without. The ducted version are applied to gas and fuel oil heated homes. Themodel without ducts are applied to electric and wood heated homes. The model developed is fora home with minimal insulation representing an understanding of the housing stock most inneed of energy efficiency upgrades. The prototype includes R-19 attic insulation and no wall orfloor insulation. The home has potential for air leakage reduction and, for the gas heatedvariation, duct leakage reduction (Table 4-3).
electric gas oil woodattic insulation R-19 to R-49 X X X Xfloor insulation R-0 to R-30 X X X Xwall insulation R-0 to R-11 X X X Xair leakage control X X X Xduct sealing X X
Table 4-3: Retrofit Measures Analyzed
CaroleeS
(W0017)
CaroleeS
(W0017)
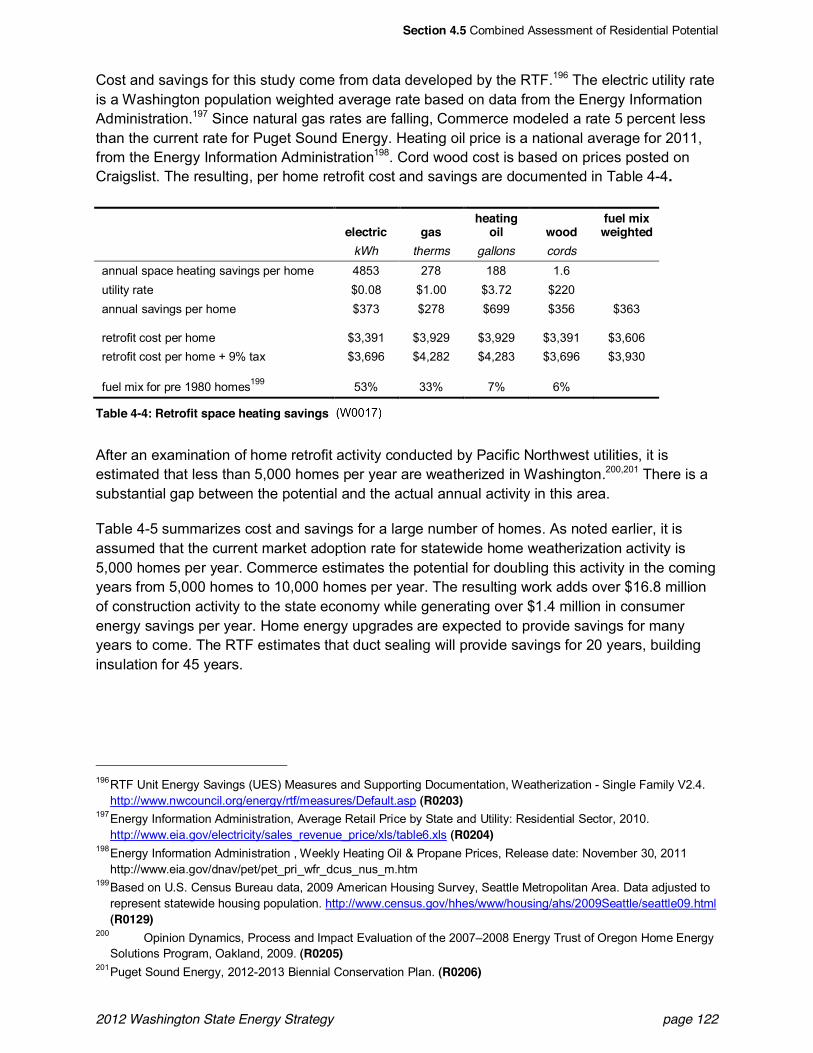
Section 4.5 Combined Assessment of Residential Potential
2012 Washington State Energy Strategy page 122
Cost and savings for this study come from data developed by the RTF.196 The electric utility rateis a Washington population weighted average rate based on data from the Energy InformationAdministration.197 Since natural gas rates are falling, Commerce modeled a rate 5 percent lessthan the current rate for Puget Sound Energy. Heating oil price is a national average for 2011,from the Energy Information Administration198. Cord wood cost is based on prices posted onCraigslist. The resulting, per home retrofit cost and savings are documented in Table 4-4.
electric gasheating
oil woodfuel mixweighted
kWh therms gallons cordsannual space heating savings per home 4853 278 188 1.6utility rate $0.08 $1.00 $3.72 $220annual savings per home $373 $278 $699 $356 $363
retrofit cost per home $3,391 $3,929 $3,929 $3,391 $3,606retrofit cost per home + 9% tax $3,696 $4,282 $4,283 $3,696 $3,930
fuel mix for pre 1980 homes199 53% 33% 7% 6%
Table 4-4: Retrofit space heating savings
After an examination of home retrofit activity conducted by Pacific Northwest utilities, it isestimated that less than 5,000 homes per year are weatherized in Washington.200,201 There is asubstantial gap between the potential and the actual annual activity in this area.
Table 4-5 summarizes cost and savings for a large number of homes. As noted earlier, it isassumed that the current market adoption rate for statewide home weatherization activity is5,000 homes per year. Commerce estimates the potential for doubling this activity in the comingyears from 5,000 homes to 10,000 homes per year. The resulting work adds over $16.8 millionof construction activity to the state economy while generating over $1.4 million in consumerenergy savings per year. Home energy upgrades are expected to provide savings for manyyears to come. The RTF estimates that duct sealing will provide savings for 20 years, buildinginsulation for 45 years.
196 RTF Unit Energy Savings (UES) Measures and Supporting Documentation, Weatherization - Single Family V2.4.http://www.nwcouncil.org/energy/rtf/measures/Default.asp (R0203)
197 Energy Information Administration, Average Retail Price by State and Utility: Residential Sector, 2010.http://www.eia.gov/electricity/sales_revenue_price/xls/table6.xls (R0204)
198 Energy Information Administration , Weekly Heating Oil & Propane Prices, Release date: November 30, 2011http://www.eia.gov/dnav/pet/pet_pri_wfr_dcus_nus_m.htm
199 Based on U.S. Census Bureau data, 2009 American Housing Survey, Seattle Metropolitan Area. Data adjusted torepresent statewide housing population. http://www.census.gov/hhes/www/housing/ahs/2009Seattle/seattle09.html(R0129)
200 Opinion Dynamics, Process and Impact Evaluation of the 2007 2008 Energy Trust of Oregon Home EnergySolutions Program, Oakland, 2009. (R0205)
201 Puget Sound Energy, 2012-2013 Biennial Conservation Plan. (R0206)
CaroleeS
CaroleeS
CaroleeS
(W0017)
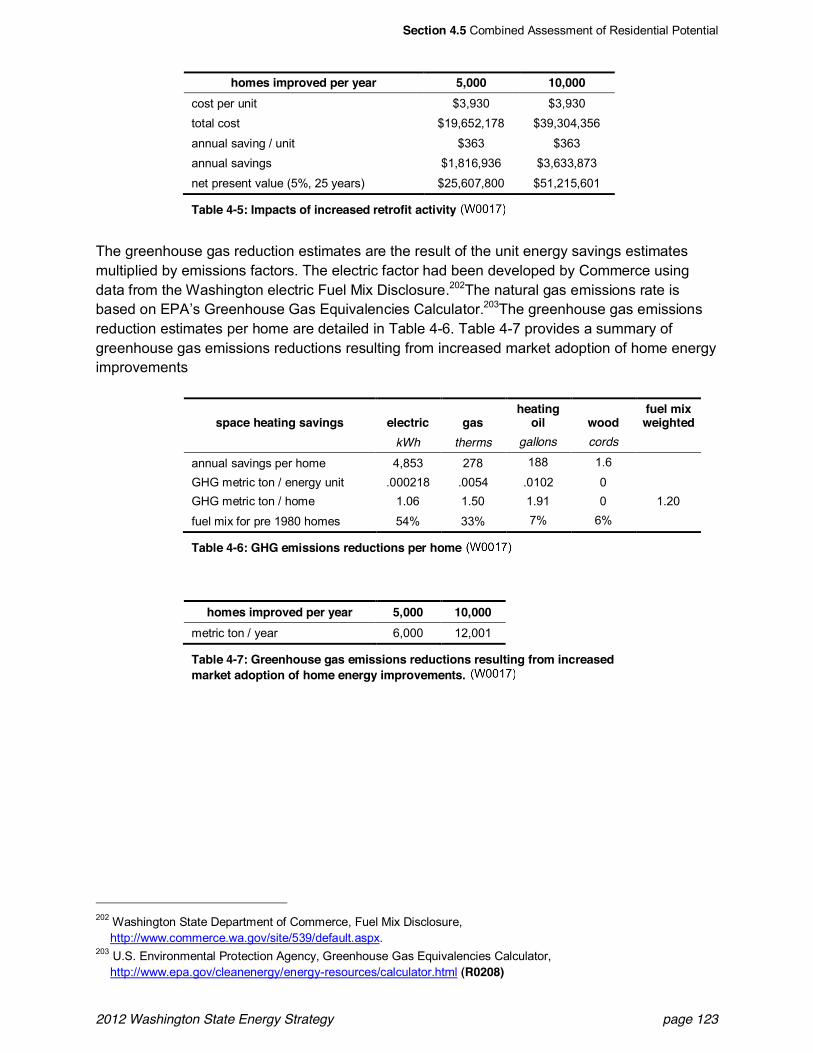
Section 4.5 Combined Assessment of Residential Potential
2012 Washington State Energy Strategy page 123
homes improved per year 5,000 10,000cost per unit $3,930 $3,930total cost $19,652,178 $39,304,356annual saving / unit $363 $363annual savings $1,816,936 $3,633,873net present value (5%, 25 years) $25,607,800 $51,215,601
Table 4-5: Impacts of increased retrofit activity
The greenhouse gas reduction estimates are the result of the unit energy savings estimatesmultiplied by emissions factors. The electric factor had been developed by Commerce usingdata from the Washington electric Fuel Mix Disclosure.202The natural gas emissions rate isbased on EPA s Greenhouse Gas Equivalencies Calculator.203The greenhouse gas emissionsreduction estimates per home are detailed in Table 4-6. Table 4-7 provides a summary ofgreenhouse gas emissions reductions resulting from increased market adoption of home energyimprovements
space heating savings electric gasheating
oil woodfuel mixweighted
kWh therms gallons cordsannual savings per home 4,853 278 188 1.6GHG metric ton / energy unit .000218 .0054 .0102 0GHG metric ton / home 1.06 1.50 1.91 0 1.20fuel mix for pre 1980 homes 54% 33% 7% 6%
Table 4-6: GHG emissions reductions per home
homes improved per year 5,000 10,000metric ton / year 6,000 12,001
Table 4-7: Greenhouse gas emissions reductions resulting from increasedmarket adoption of home energy improvements.
202 Washington State Department of Commerce, Fuel Mix Disclosure,http://www.commerce.wa.gov/site/539/default.aspx.
203 U.S. Environmental Protection Agency, Greenhouse Gas Equivalencies Calculator,http://www.epa.gov/cleanenergy/energy-resources/calculator.html (R0208)
CaroleeS
(W0017)
CaroleeS
CaroleeS
(W0017)
CaroleeS
(W0017)
Section 5.1 What is Distributed Energy and Why Is It Important?
2012 Washington State Energy Strategy page 124
)>"?+%6&F &85,+65#;+%1&9*%62=
F4@ P>"+&5,&85,+65#;+%1&9*%62=&"*1&P>=&M,&M+&M3?'6+"*+Z
In this Energy Strategy, the term distributed energy (DE) covers a wide range of technologiesand applications: district heating (and cooling), combined heat and power (CHP), and distributedelectricity generation (DG).204 A key characteristic that ties these types together is the relativelycompact geography of where electricity and thermal energy are produced and used. Districtheating is steam or hot water produced in a central plant and distributed to a single building orgroup of nearby buildings, e.g. Seattle Steam s downtown heating system.205 Combined heatand power (sometimes called cogeneration) is an energy facility designed to produce bothelectricity and useful heat from a single energy source, e.g. a pulp and paper mill that useswaste wood products to generate electricity and produce steam for on-site materials processingor use in an adjacent district energy system. Distributed generation generally refers to theproduction of relatively small amounts of electricity (kilowatts or a few megawatts) at the samelocation where it will be used, e.g. solar panels on a commercial building.
Historically, distributed energy technologies were the original basis for an electric generatingsystem and localized heating systems. Small power generating plants were situated in theneighborhood or town they served, hot water or steam pipes provided heating to downtownbuildings, and factories produced their own electricity and thermal needs on-site. Over time, wemoved away from such localized energy as larger power plants become much more efficientand transmission systems improved, driving down electricity costs and making both onsiteelectricity and thermal energy production systems less economically attractive. Other factors including the environmental impacts of power production, health and safety concerns, and thegeographical location of resources (e.g. hydroelectric plants located on large rivers) contributed to the decline in local energy production.
Why then are we seeing renewed interest in distributed energy systems? The interest comesfrom a combination of technical, social and environmental factors. The equipment for producingenergy close to loads has seen dramatic technical, economic and environmental improvementsover the last several decades. Prices for new, small-scale renewable technologies continue todecline.206 More individuals and businesses are seeking greater energy autonomy and considersolar systems, in particular, as a way to help achieve such independence. Developers see neweconomic development opportunities from DE technologies such as anaerobic digesters wherethey can address pollution issues while at the same time producing and selling clean energy.In addition, in a back to the future moment, we are once again beginning to better recognizethe potential efficiency benefits of combining electricity production and the use of waste heatfor onsite or adjacent off-site needs. The state s current fleet of standalone (non-CHP) fossil-fueled thermal power plants is about one-third efficient in converting fuel to electricity while
204 The term distributed generation typically refers to only the last of these items, namely the production of electricitylocated close to the particular load that it is intended to serve.
205 See http://www.seattlesteam.com (R0144)206 For example, the Energy Information Administration s (EIA) Annual Energy Outlook 2011, forecasts a five-fold
increase in solar generating capacity by 2035 based on a decline in the cost of photovoltaic systems over theproject period and the availability of Federal tax credits through 2016. (R0145)
Section 5.1 What is Distributed Energy and Why Is It Important?
2012 Washington State Energy Strategy page 125
modern CHP systems can have combined thermal and electric efficiencies of 60 to 80percent.207
This renewed interest in distributed energy does not by itself explain why it merits considerationin the Energy Strategy. There are three key reasons. First, it is timely. Washington hasestablished incentives as well as policy mandates that encourage the development of bothrenewable and distributed energy systems. The House Technology, Energy andCommunications Committee has an active investigation of these incentives and policiesunderway with the possibility of legislative proposals for the 2012 session. That investigationalso included substantial work by the Washington Utilities and Transportation Commission(UTC) on distributed energy issues related to the state s investor-owned utilities.208 Second,citizens and businesses are asking their state and utilities to help them with development ofdistributed energy systems. In just the last half-dozen years, the number of small photovoltaicsystems in the state has increased from a few dozen installations to more than two thousand.Finally, there are those with a long-term vision of distributed energy as a significant part ofWashington s energy future. California, with its goal to develop 12,000 megawatts of distributedenergy facilities by 2020, is one manifestation of that vision.209
Yet despite this increased interest and timeliness, Washington has several characteristics thatcan make it challenging to develop these systems. Not all of the factors described here areunique to Washington, but they all should be considered as existing DE policies are changed ornew ones added.
! Electricity Costs Washington has some of the lowest retail electricity costs in the UnitedStates. For businesses, low electricity costs increase competitiveness. For Washington scitizens such low costs mean more dollars in their pockets. However, for distributed energydevelopers, low electricity costs make the economic case for on-site energy production lesseconomically attractive. Low retail rates are not an issue for sales of electricity output toutilities since those rates reflect the margin avoided cost of new supplies. However, forindividuals or businesses that have cheap and reliable electricity supplies, the economicvalue of on-site generation to displace that low-cost power can be unattractive.
207 Both renewable and non-renewable resources can fuel distributed energy systems. The Energy Strategy focusespredominately on renewable energy or very high efficiency fossil- fueled systems. This focus is in keeping with theguiding principle to reduce dependence on fossil fuel energy sources through improved efficiency anddevelopment of cleaner energy sources, such a bioenergy, low-carbon energy sources, and natural gas, andleveraging the indigenous resources of the state for the production of clean energy. (RCW 43.21F,088 (1) (d)).
208 At the request of Washington State House of Representatives Technology, Energy and CommunicationsCommittee (TEC Committee), the Washington Utilities and Transportation Commission (Commission) isconducting a study relating to development of distributed energy in areas served by investor-owned electricutilities. Specifically, the TEC Committee has asked the Commission to provide to the Legislature backgroundinformation and detailed discussion of options to encourage the development of cost-effective distributed energy inareas served by investor-owned utilities, as well as the opportunities and challenges facing investor-owned utilitiesand their ratepayers in developing distributed energy in this state. The UTC issued their report on the investigation,Report on the Potential for Cost- Effective Distributed Generation in Areas Served by Investor-Owned Utilities inWashington State, Docket UE- 110667, October 7, 2011 (S0084)
209 The California Energy Commission has opened an investigation on how to integrate 12,000 MW of distributedenergy generation into the state s electricity grid. http://listserver.energy.ca.gov/mobile/m_details.php?eID=1436(R0146)
Section 5.2 Distributed Energy Policy Package
2012 Washington State Energy Strategy page 126
! Integration of Distributed Energy Resources - Washington has a reliable and well-developed electricity generation, transmission and distribution system based largely oncentralized electricity production and centralized control. As distributed electricity systemsachieve a higher penetration rate, especially of local electric distribution systems, electricutilities can face challenges in safely and effectively integrating those systems.
! Maintaining Electric System Reliability Electric utilities are required to maintain areliable electricity system and can even be subject to major federal penalties for failure to doso.210 Independently operated generating projects connected to neighborhood distributionpower lines can impact power quality, operations, voltage and frequently levels, andultimately the reliability for all customers connected to the system.
! Surplus Supplies The current recession as well as large amounts of new base loadelectricity development since 2000 have both dampened or eliminated overall load growthand in many instances created surplus supplies for some utilities.211 Consequently, someutilities are long on resources and do not need new supplies. In addition, the downturn indemand has depressed prices in the Western electricity market making it difficult for utilitiesto find markets for any surplus supplies.
! Local Opposition By their very nature, distributed energy systems are located near wherethe electricity or thermal energy is to be used rather than in remote locations. Consequently,there can sometimes be vocal, local opposition to new facilities in populated and developedlocations not in my backyard.
! Not All Distributed Energy is the Same Distributed energy can range from smallphotovoltaic panels on household rooftops to larger biomass-powered district heatingsystems in urban core areas to CHP systems at industrial facilities. In addition, distributedenergy technologies can be intermittent power sources or reliable baseload facilities.Depending on the characteristics of the source, there may be concerns about the aesthetic,environmental and technical impacts of distributed energy technologies.
! Limitations on Financial Support Unlike many other states that offer distributed energyincentives, Washington is constitutionally limited in its ability to provide direct funding to theprivate sector and the current state budget situation severely constrains the state s ability toprovide additional tax incentives for distributed energy.
F4A 85,+65#;+%1&9*%62=&C'$5.=&C"./"2%
This chapter describes and recommends ways that the state might encourage and facilitate thefurther development of distributed energy, while at the same time acknowledging both thechallenges of integrating such systems into existing energy (electric) infrastructure with minimaltechnical and financial impacts. Commerce proposes two overall approaches to strike thatbalance.
210 Section 215 of the Federal Power Act (16 U.S.C. 791-828c) imposes mandatory reliability standards on electricutilities and other electric system participants.
211 Northwest Power and Conservation Council, Memorandum, Comparison of Regional Load Forecasts, September1, 2011 available at http://www.nwcouncil.org/news/2011/09/p2.pdf (R0209)
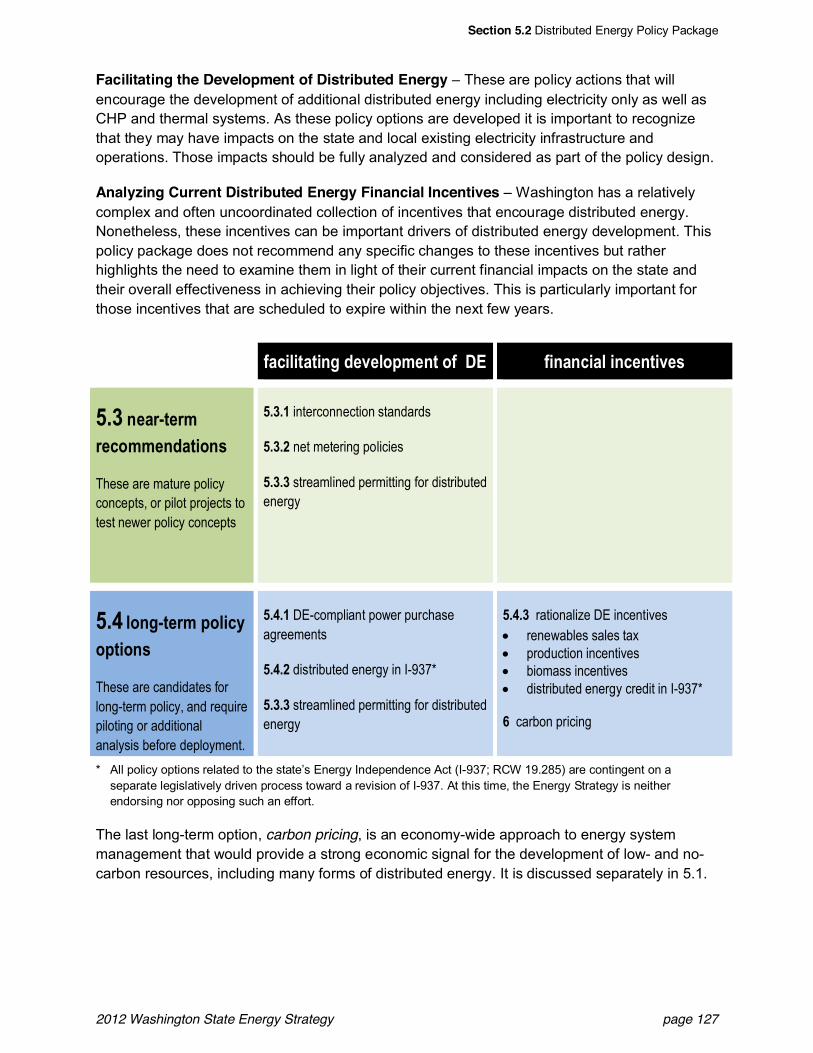
Section 5.2 Distributed Energy Policy Package
2012 Washington State Energy Strategy page 127
Facilitating the Development of Distributed Energy These are policy actions that willencourage the development of additional distributed energy including electricity only as well asCHP and thermal systems. As these policy options are developed it is important to recognizethat they may have impacts on the state and local existing electricity infrastructure andoperations. Those impacts should be fully analyzed and considered as part of the policy design.
Analyzing Current Distributed Energy Financial Incentives Washington has a relativelycomplex and often uncoordinated collection of incentives that encourage distributed energy.Nonetheless, these incentives can be important drivers of distributed energy development. Thispolicy package does not recommend any specific changes to these incentives but ratherhighlights the need to examine them in light of their current financial impacts on the state andtheir overall effectiveness in achieving their policy objectives. This is particularly important forthose incentives that are scheduled to expire within the next few years.
(".5$5+"+5*2&1%7%$'?3%*+&'(&&89 (5*"*.5"$&5*.%*+57%,
F4D&*%"6X+%636%.'33%*1"+5'*,
These are mature policyconcepts, or pilot projects totest newer policy concepts
F4D4@ interconnection standards
F4D4A net metering policies
F4D4D streamlined permitting for distributedenergy
F4E $'*2X+%63&?'$5.='?+5'*,
These are candidates forlong-term policy, and requirepiloting or additionalanalysis before deployment.
F4E4@ DE-compliant power purchaseagreements
F4E4A distributed energy in I-937*
F4D4D streamlined permitting for distributedenergy
F4E4D rationalize DE incentives! renewables sales tax! production incentives! biomass incentives! distributed energy credit in I-937*
G carbon pricing
* All policy options related to the state s Energy Independence Act (I-937; RCW 19.285) are contingent on aseparate legislatively driven process toward a revision of I-937. At this time, the Energy Strategy is neitherendorsing nor opposing such an effort.
The last long-term option, carbon pricing, is an economy-wide approach to energy systemmanagement that would provide a strong economic signal for the development of low- and no-carbon resources, including many forms of distributed energy. It is discussed separately in 5.1.
Section 5.3 Near-Term Recommendations
2012 Washington State Energy Strategy page 128
Note on Jurisdictional Issues Different levels of legal authority within the electricity sector were recognized whendeveloping the analyses and recommendations in this chapter. The operations of investor-owned utilities are subjectto state regulation by the UTC while the state s consumer-owned utilities cooperatives, municipals and public utilitydistricts - have elected governing boards. In addition, the Federal Energy Regulatory Commission (FERC) hasauthority in areas such as wholesale transactions and reliability. During the further development and implementationof these recommendations, it is important to include a thorough examination of jurisdictional responsibility andauthority. For example, Recommendation 5.4.1, DE-compliant power purchase agreements, will requireinvestigations of FERC authority over power purchase agreements.
F4D W%"6X!%63&Q%.'33%*1"+5'*,
F4D4@ M*+%6.'**%.+5'*&<+"*1"61,
C'$5.=&8%,.65?+5'*
In 2007, the UTC and a number of the state s consumer-owned electric utilities worked closelytogether to develop and adopt electrical interconnection standards for on-site electricityproduction. The rules, adopted by the UTC for its regulated investor-owned utilities and, in turn,voluntarily adopted by the governing boards of many of the state s consumer-owned utilities,established simplified interconnection standards for systems up to 300 kilowatts of capacity.This occurred in response to HB 5101 passed in the 2006 session.212 There seems to begeneral agreement that the UTC and voluntary consumer-owned utility process worked well andthat it could serve as a model for future interconnection efforts.213
In workshops and comments to the UTC on their distributed energy proceedings, both utilitiesand developers noted there have been improvements in interconnection technology since the2007 process and that it was time to reexamine the standards. Specifically, it may no longer benecessary to require an external disconnect switch with smaller DG systems, insurancerequirements may be decreased or waived and the overall limitation for simple systeminterconnection rules might be raised from 300 kW.
C6%75';,&Q%,%"6.>&"*1&9:?%65%*.%
An excellent summary of the provision of Washington s interconnection standards is availablefrom the Database of State Incentives for Renewables and Efficiency (DSIRE).214
W%0&-*"$=,5,
It is not possible to estimate the quantitative impacts of changes to Washington sinterconnection standards since those impacts will depend on what specific changes ultimately
212 HB 5001 created a public utility tax incentive for consumer generated renewable power (RCW 82.16.130). Theincentive did not take effect until uniform standards for interconnection to the electric distribution system were ineffect for light and power businesses serving 80% of the total customer load in the state.
213 Washington Utilities and Transportation Commission, Report on the Potential for Cost-Effective Distributed Energyin Areas Served by Investor-Owned Utilities in Washington State, Docket UE-110667, October 7, 2011. (S0084)
214 http://www.dsireusa.org/incentives/incentive.cfm?Incentive_Code=WA07R&re=1&ee=1 (R0147)
Section 5.3 Near-Term Recommendations
2012 Washington State Energy Strategy page 129
are adopted into state and local requirements. Overall, increases in the upper limit for simplifiedinterconnection procedures beyond the current limit of 300 kW should result in more rapid andless expensive deployment of larger distributed energy systems, and removal of the disconnectswitch requirement and lower insurance requirements should decrease the cost ofinterconnection.
As the UTC and other parties consider changes to the interconnection standards, twodocuments can provide useful direction on the range and type of issues to consider Freeingthe Grid and Connecting to the Grid.215 The Freeing the Grid report, for example, notes anumber of items to examine related to interconnection. Some of these items, in whole or in part,are already incorporated in interconnection standards.
! Open standards to all customer-sited generation, not simply renewable energy
! Permit systems up to 20 MW if they are sized to meet on-site loads
! Create four size categories 10 kW, 2 MW, 10 MW (non-exporting system), 20 MW orlarger
! State requirements should take less time than the Federal Energy Regulatory Commission(FERC) process
! Recommendations related to interconnection fees
! Engineering fees should be fixed, e.g. hourly rate or cost per study
! No need for external discount switch since all IEEE systems must have auto shut offcapability
! Certification tied to UL 1741 and IEEE 1547
! Use the FERC standard screens
! Network interconnection allows both spot and network interconnections
! Standard agreement with friendly clauses
! No additional insurance for non-inverter system below 50 kW and inverter systems to 1 MW
! Process for dispute resolution
! Rules apply to all utilities
M3?$%3%*+"+5'*
The UTC, working in close collaboration with Commerce and the WSU Energy Program, hasdetermined that a rulemaking is in order to modify its existing interconnection rules focusingparticularly on systems in the range up to two MW.216 As in the previous process, consumer-owned utilities would be invited to actively participate and ultimately voluntarily adopt
215 Freeing the Grid Best Practices in State Net Metering Policies and Interconnection Procedures, December 2010(R0040) and Connecting to the Grid A Guide for Distributed Generation Interconnection Issues, 6th Edition, 2009,(R0148), are available at http://irecusa.org
216 Subsequent to efforts on these smaller systems, we should also consider processes for systems at the 10 MW and20 MW levels.
Section 5.3 Near-Term Recommendations
2012 Washington State Energy Strategy page 130
comparable interconnection standards as those for the UTC. The rulemaking process shouldexamine all of the items in the Freeing the Grid and Connecting to the Grid reports. Thatexamination should include determination of which items are most important to both developersof projects and the utility community, and attempt to strike a balance between their needs.
F4D4A& W%+&K%+%65*2&C'$5.5%,
C'$5.=&8%,.65?+5'*
Washington is one of 43 states, plus Puerto Rico and the District of Columbia, with net meteringlaws. The law was originally adopted in 1998 with modifications in 2000, 2006 and 2007, andapplies statewide.217 Net metering is an electricity policy that allows an on-site generationsystem to run the electric meter backwards during periods when on-site electricity productionexceeds load. The value to the on-site generator is two-fold; it values any excess electricityproduction at retail rates and obviates the need for on-site electricity storage. Although netmetering can be applied to any type of DE generation including fossil fuels, most states,including Washington, limit the policy to renewable sources.218
Washington s net metering law is generally considered well-designed and effective. It received aB grade from the Interstate Renewable Energy Council in the 2010 and 2011 assessments ofstate net metering policies (Freeing the Grid).219 However, there are several components thatshould be considered for possible changes.
C6%75';,&Q%,%"6.>&"*1&9:?%65%*.%
An excellent summary of the provision of Washington s net metering law is available fromDSIRE.220
The state does not collect data on the total number of net-metered systems in Washington.However, the WSU Energy Program does certify small, distributed energy systems that want toclaim the state s production tax credit (Figure 5.1). Seattle City Light had 325 net-meteredcustomers in 2010 with total generation of approximately 1,032 MWh compared to total utilitysales of more than 9 million MWh per year.221
217 RCW 80.60218Washington s net metering law applies to solar thermal electric, photovoltaics, wind, small hydroelectric, fuel cells
and CHP/cogeneration using renewable fuels.219 Freeing the Grid Best Practices in State Net Metering Policies and Interconnection Procedures, December 2011,
page 70. (R0040)220 http://www.dsireusa.org/incentives/incentive.cfm?Incentive_Code=WA01R&re=1&ee=1 (R0149)221 Comment submitted on the State Energy Strategy by the City of Seattle, October 21, 2011 available at
http://www.commerce.wa.gov/DesktopModules/CTEDPublications/CTEDPublicationsView.aspx?tabID=0&ItemID=10087&MId=863&wversion=Staging Note that many of the Seattle City Light systems may also be included inthe Figure 5.1 statistics. (S0085)
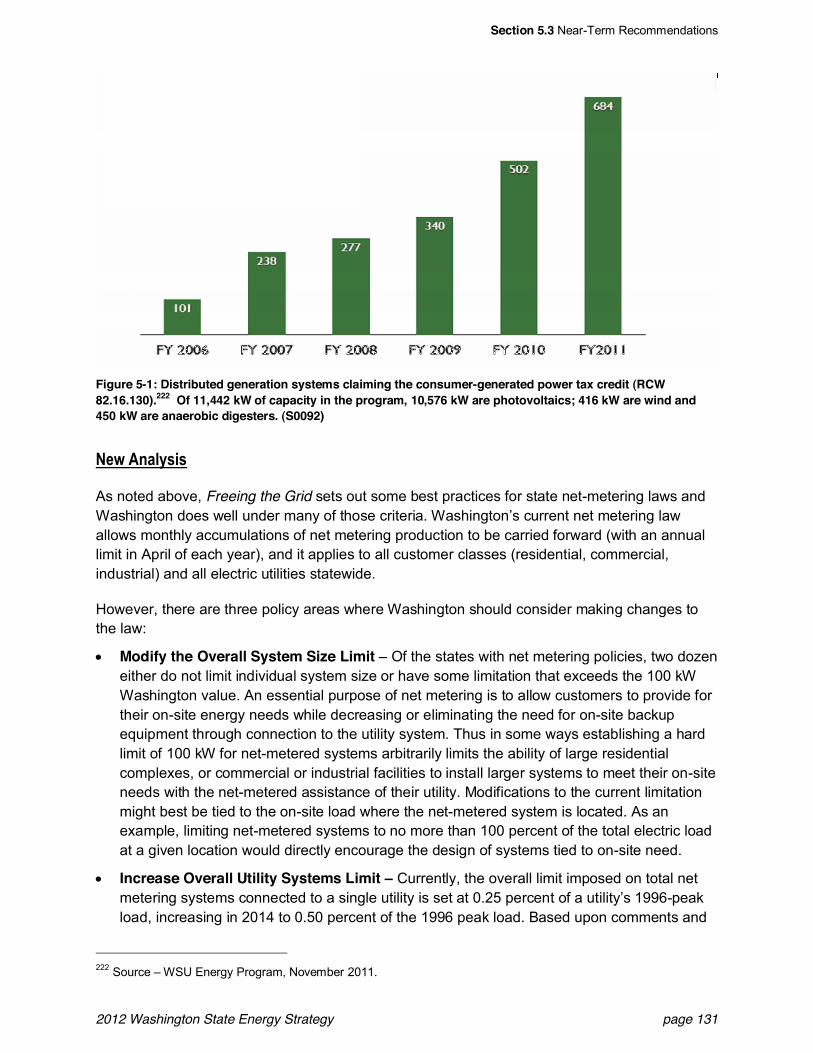
Section 5.3 Near-Term Recommendations
2012 Washington State Energy Strategy page 131
Figure 5-1: Distributed generation systems claiming the consumer-generated power tax credit (RCW82.16.130).222 Of 11,442 kW of capacity in the program, 10,576 kW are photovoltaics; 416 kW are wind and450 kW are anaerobic digesters. (S0092)
W%0&-*"$=,5,
As noted above, Freeing the Grid sets out some best practices for state net-metering laws andWashington does well under many of those criteria. Washington s current net metering lawallows monthly accumulations of net metering production to be carried forward (with an annuallimit in April of each year), and it applies to all customer classes (residential, commercial,industrial) and all electric utilities statewide.
However, there are three policy areas where Washington should consider making changes tothe law:
! Modify the Overall System Size Limit Of the states with net metering policies, two dozeneither do not limit individual system size or have some limitation that exceeds the 100 kWWashington value. An essential purpose of net metering is to allow customers to provide fortheir on-site energy needs while decreasing or eliminating the need for on-site backupequipment through connection to the utility system. Thus in some ways establishing a hardlimit of 100 kW for net-metered systems arbitrarily limits the ability of large residentialcomplexes, or commercial or industrial facilities to install larger systems to meet their on-siteneeds with the net-metered assistance of their utility. Modifications to the current limitationmight best be tied to the on-site load where the net-metered system is located. As anexample, limiting net-metered systems to no more than 100 percent of the total electric loadat a given location would directly encourage the design of systems tied to on-site need.
! Increase Overall Utility Systems Limit Currently, the overall limit imposed on total netmetering systems connected to a single utility is set at 0.25 percent of a utility s 1996-peakload, increasing in 2014 to 0.50 percent of the 1996 peak load. Based upon comments and
222 Source WSU Energy Program, November 2011.
Section 5.3 Near-Term Recommendations
2012 Washington State Energy Strategy page 132
the literature, overall utility level limitations of net-metered systems are less of an issue thanthe number and size of systems on individual feeders and local distribution systems. Itshould be examined whether any utilities are beginning to approach their limit, and if so,how the overall limit might be raised while still accommodating local electrical distributionsafety, reliability and operational concerns.
! Allow Carry Forward of Excess Generation Beyond One Year Currently, Washingtonlaw allows net- metered systems to carry forward their net excess generation from month tomonth, but at the end of a 12-month billing period net excess generation is granted back tothe utility without additional compensation to the customer.223 Allowing net-meteredcustomers to carry forward their net excess generation beyond 12 months but not receivepayment from the utility could make DE development more attractive. If limits on individualnet-metered systems are tied directly to on-site loads and utilities are not required to pay fornet excess generation at the end of one year, the overall impact on utility operations shouldbe manageable.
M3?$%3%*+"+5'*
Consider legislation to raise the net-metering limit with particular focus on tying that limit tocustomer load, e.g. no more the 100 percent of total load rather than an absolute kilowatt value.Alternatively consider raising the limit to two megawatts. Consider raising the limit on thepercentage of net-metered load required to be accommodated on a utility s existing systemwhile at the same time recognizing the need to accommodate limitations that may occur at thedistribution level. Allow net-metered systems to roll over excess generation credits beyond thecurrent limit of one year, but do not require utilities to pay for excess credits.
F4D4D <+6%"3$5*5*2&C%635++5*2&('6&85,+65#;+%1&9*%62=
C'$5.=&8%,.65?+5'*
The 2011 Energy Strategy Update specifically called for an investigation of streamlinedpermitting for combined heat and power systems (including district energy systems).224 Inaddition, the 2011 SES Update included several recommended actions that would streamlinepermitting for clean and advanced energy systems, including development of energy overlay
223 RCW 80.60.030224 Energy Strategy Update and 2011 Biennial Energy Report with Indicators, December 2010, page 10. Streamlined permitting of combined heat and power (CHP) projects. Various studies have indicated a large
quantity of industrial waste heat available that could be used to generate electricity in combined heat and power(CHP) or 'cogeneration' installations. If the industrial entity financing the CHP installation is able to sell the resultingelectricity into the grid a project often appears profitable, but permitting, regulatory or economic barriers can posean insurmountable hurdle to implementation. Meanwhile, the U.S. EPA is developing a Waste Energy RecoveryRegistry according to requirements of the 2007 Energy Independence and Security Act, and Washington maybenefit from preparing to respond to the CHP potentials revealed by the Registry. In this initiative, Commerce willresearch the barriers to CHP deployment during calendar year 2011, and recommend a set of remedies that mayinclude programmatic, regulatory or legislative solutions to be deployed in 2012. The research will be conducted inconjunction with regulatory streamlining research described under Streamlined Permitting for Clean and AdvancedEnergy Technologies below. (S0029)
Section 5.3 Near-Term Recommendations
2012 Washington State Energy Strategy page 133
zones, non-project and planned action State Environmental Policy Act (SEPA) reviews,accelerated permitting of pilot projects, and energy technology test zones.225 These latterrecommendations chiefly focused on large, utility-scale projects but some of the itemsdeveloped have relevance to the deployment of distributed energy systems.
W%0&-*"$=,5,
Renewable Energy Siting: Model ordinances are used by several states to provide a guidelinefor local governments to refer to when considering development of their own ordinances.Commerce staff reviewed and compared them for applicability in Washington. Commerceprepared a discussion brief.226
Streamlined Permitting: What opportunities exist for streamlining permitting of infilldevelopment or renewable energy facilities? Commerce staff prepared a brief report highlightingopportunities and actions local governments could take to streamline permitting for both infilland renewables, while maintaining the same level of environmental review and protection.227
M3?$%3%*+"+5'*
Currently, local governments may opt to address renewable energy facilities in policies ordevelopment regulations; however, there is no requirement to do so. As a result, mostjurisdictions have little to no mention of renewable energy facilities in plans or codes. Whilethere does appear to be an increase in the number of local governments that are addressingrenewables and, to a less extent distributed energy systems, directly, there is no specificguidance from the state on issues to consider or provision of examples. Because the StateEnergy Office, and the Local Government and Infrastructure Division are both in the Departmentof Commerce, that agency is uniquely situated to help local governments address renewableenergy facilities and deployment of distributed energy in their communities.
Commerce proposed the following implementation steps related to permitting and siting:
! Commerce will develop a website with connections to tools for local governments to use inthe development of local siting ordinances, best practices and models for distributed energy.An example of the type of information that might be included could be a technical brief onEnergy Aware Communities that includes discussion of development and siting of smalllocal energy generation.
! As local communities consider issues and develop codes regarding renewables and DE,they should consider type (wind, solar, geothermal), location (primary use on vacant parcels,freestanding, or as an on-building accessory use) and scale. Concerns can then bediscussed in a public forum. Any mitigation measures or design standards can be
225 Ibid, pages 12-15 (S0029)226 Department of Commerce, State Model Ordinances for Renewable Energy Facilities A Report Prepared to
Support the 2010/2012 State Energy Strategy, Department of Commerce, 2011. (S0062)227 Department of Commerce, Streamlining Local Government Project Review and Permitting of Renewable Energy
Facilities and Infill Development, Department of Commerce, 2011. (S0063)
Section 5.4 Long-Term Policy Options
2012 Washington State Energy Strategy page 134
determined, and codes can be written that would allow for more efficient permitting whenproposed projects are designed to meet those adopted provisions.
! During the last several legislative sessions, there has been legislation proposed that wouldgive the state broader authority to permit renewable energy facilities in instances where alocal government did not have its own adequate regulations in place. Commerce shouldconvene developers, local government, state agencies and other interested parties to reviewthose legislative proposals, fully identify jurisdictional issues, determine permitting and sitingconcerns, and examine government resource limitations. Based on that effort, Commercewould consider developing state or local model processes and ordinances.
! Perhaps the greatest opportunity to streamline permitting lies with the integration of theSEPA and the Growth Management Act (GMA). Commerce is developing suggestedrecommendations on how this may be done. For example, a Planned Action could bedeveloped that addresses siting, operation and mitigation of certain renewable energyfacilities (by type and scale) so that future projects within the scope of the Planned Actioncan be permitted more quickly and efficiently. Other options include Energy Overlay Zones,development of criteria for energy facilities allowed by conditional use permit, ordevelopment regulations that allow residential scale energy facilities in new and existingneighborhoods.
F4E V'*2X!%63&C'$5.=&U?+5'*,Note: Policies discussed in Section 5.3.3 also include long-term options discussed in theirprimary entry above.
F4E4@ 89X)'3?$5"*+&C'0%6&C;6.>",%&-26%%3%*+,
C'$5.=&8%,.65?+5'*
Washington has a long and successful history in the development of combined heat and powersystems, particularly in the pulp and paper industry. In fact, the existence of CHP capabilities atsome of those industrial sites has been an important element in maintaining their economicviability. Currently, Washington has nearly three dozen CHP sites with a capacity of over 1,200MWe, concentrated in the wood products, paper and petroleum refining industries.228 However,since 2004 only 152 megawatts of new CHP systems have been built in Washington. Numerousstudies over the last 10 years have pointed to the significant potential available from expansionof CHP systems in Washington and the Pacific Northwest, perhaps as much as 4,000megawatts (electric) of additional capacity.229
From a policy perspective, the terms and conditions of power purchase agreements betweendevelopers and electric utilities are critical to the viability of CHP and other renewable energyprojects of several megawatts or greater. Changes to power purchase agreements are a
228 NW Clean Energy Applications Center, State of Washington Clean Energy Opportunities: Technical Potential forCHP, August 2010. (R0210)
229 Washington State University Energy Program, Washington Efficient Energy Roadmap, 2011. (S0064)
Section 5.4 Long-Term Policy Options
2012 Washington State Energy Strategy page 135
complex and sometimes contentious process. Developers are looking for long-term,economically attractive contracts that allow them to acquire the financing needed to build whileutilities must weigh such agreements against the need to maintain system reliability andintegrity, meet their overall need (or lack of need) for new supply resources, and determine thepotential costs and rate impacts of these new generation additions.
Because of these complexities, Commerce proposes that this work be a long-term rather than ashort-term endeavor to allow sufficient time to fully research and understand the implications ofany proposals.
C6%75';,&Q%,%"6.>&"*1&9:?%65%*.%
The Northwest Clean Energy Application Center230 is an excellent source of detailed informationon state and regional CHP, district heating and waste heat recovery technologies, potentialsstudies and projects.
W%0&-*"$=,5,
The WSU Energy Program is conducting an analysis and road mapping effort examining energyefficiency tied to the combined heat, power and district energy components of distributedenergy. Their analyses together with work underway by the UTC will inform this process and willbe available at the end of 2011.
W%:+&<+%?,
Power purchase agreements generally apply to a wide range of CHP systems (from 400 kWanaerobic digesters to 25 MW pulp and paper mills). Obviously, the larger of these systems willhave a greater impact on both the technical and economic operation of utility systems. Utilities,especially those that are long on resources, have raised legitimate concerns about the coststhat these systems might impose on other customers. On the other hand, developers of largerscale distributed energy systems have suggested several changes that they believe wouldimprove the economic viability of their projects. These include:
! Adding formal consideration of thermal energy (thermal recovery, CHP) opportunities intoelectric utility Integrated Resource Planning (IRP) documents.
! Investigating the feasibility of setting purchase prices under power purchase agreements atthe delivery point instead of the entry point, requiring calculations of and credit for line-losssavings, and offering a portion of those savings to the generator.
! Extending the term of power purchase agreements to 15 to 20 years to allow for greaterinvestment certainty for project developers.
! Increasing the limit of basic power purchase agreements to 10 megawatts.
! Considering changes to the process for determining standby rates for CHP systems.
230 http://www.chpcenternw.org (R0150)
Section 5.4 Long-Term Policy Options
2012 Washington State Energy Strategy page 136
! Examining existing utility tariffs, such as Puget Sound Energy s Cogeneration and SmallPower Production Schedule 91 and Snohomish PUDs solar incentive program, as potentialmodels for utility tariffs or purchase agreements.
Given these differing perspectives, Commerce recommends a longer-term investigation of theimpacts of current power purchase agreements on DE development and utility operations Thegoal of this work would be to identify specific opportunities to make power purchase agreementsmore streamlined and consistent throughout the state.
Much of the work in this area falls under the auspices of the UTC. Commerce and the WSUEnergy program would work closely with the UTC and other interested parties on possiblemodifications to power purchase agreement policies and procedures. This process would alsoinvolve careful review of federal requirements under purview of the FERC.
F4E4A 85,+65#;+%1&9*%62=&5*&MXJDH
C'$5.=&8%,.65?+5'*
Initiative 937, the Energy Independence Act (the Act), require the state s largest electric utilitiesto acquire both cost-effective energy efficiency and new renewable resources.231 The Actspecifically recognizes the benefit of distributed energy by providing a double credit againstutility renewable energy obligations for systems rated at five megawatts or less.232 As a result,I-937 has increased interest in and development of new distributed generation. Since thepassage of the Act by voters in 2006, there have been discussions of and efforts to amendprovisions of the law. To date, none of the proposed changes has been adopted but discussionscontinue. Based on strong advice from the Energy Strategy Advisory Committee, this Strategydoes evaluate a range of proposals for changes to the law. However, there is a separatelegislative process underway to examine possible changes to I-937 either in 2012 orsubsequent sessions. If that process provides an opportunity to change provisions of the law,several changes could enhance the development of additional distributed energy.
Previous Research and Experience
Additional information on the Energy Independence Act, its associated implementation rules forconsumer-owned utilities.233 and investor-owned utilities234, plus other background materials areavailable on Commerce s website.235
231 RCW 19.285232 RCW 19.285.040 (2) (b)233 WAC 194-37234 WAC 480-109235http://www.commerce.wa.gov/site/1001/default.aspx (S0065)
Section 5.4 Long-Term Policy Options
2012 Washington State Energy Strategy page 137
W%0&-*"$=,5,
No new analysis was undertaken. During the course of previous legislative deliberations on theEnergy Independence Act, much analysis was produced. If legislation is proposed for 2012 or asubsequent session, Commerce will work closely with the Governor s Office, UTC, and otherpublic and private stakeholders to analyze the implications of any changes.
Without specific details on what changes would occur to the law, it is not possible to provide anyquantitative estimate impacts of I-937 changes on distributed energy development, greenhousegas emissions or potential price impacts
W%:+&<+%?,
Distributed energy related changes to I-937 to consider include:
! Establishing a process for prequalification of the eligibility of renewable and high-efficiencycogeneration energy technologies. The Energy Independence Act does not allow for utilitiesand project developers to receive absolute certainty that either the Washington State Auditoror the UTC will approve their investment in some types of renewable technologiesprojects.236 Based on a recommendation from the 2011 Energy Strategy Update,Commerce, the UTC and the Auditor s office have established an advisory process toprovide non-binding interpretations of I-937 eligibility. However, lack of a binding formalprocess as part of statutory language can limit the development of certain distributed energytechnologies and projects, especially those that do not conform precisely to definitions ofeligible renewables now in statute.
! Revising the definition of biomass to include additional biogenic sources. As currentlywritten, the definition of biomass in the Act limits the ability to include power produced fromhigh-solid biomass wastes as a qualified renewable resource. 237 Addition of high-solidsmaterials to such technologies as anaerobic digesters can significantly increase net energyproduction. Neither the UTC nor Commerce can alter that definition via rulemaking.
! Improving the definition of cogeneration technologies (combined heat and power) to clarifywhat systems qualify under the Act. There is general agreement that the definition ofcogeneration in the Act is not sufficiently detailed to include all types of cost-effectiveopportunities, especially situations where electricity efficiency improvements may be smallbut overall energy efficiency increases, such as thermal energy savings, are significant.
! Providing clarification on the five megawatt limit for distributed energy systems. As written, itis unclear if the five megawatt limit applies to the capacity or the average annual output of asystem, and whether it is for direct current or alternating current output of the system. Thismay create uncertainty for some CHP system projects, in particular.
236 There is an exception to this limitation for investor-owned utilities subject to the jurisdiction of the UTC. They mayrequest a formal declaratory order from the UTC on a renewable technology/project. See UTC Docket UE-111016,Policy statement regarding processes for determine whether projects are Eligible Renewable Resources underRCW 19.285 and WAC 480-109, June 7, 2011 for details. (S0066)
237 High-solids digesters use the organic fraction of municipal solid waste (primarily post-consumer food waste andyard waste) to produce methane.
Section 5.4 Long-Term Policy Options
2012 Washington State Energy Strategy page 138
! Considering allowing anaerobic digesters to unbundle their greenhouse gas emissionsreduction credits (methane reduction) from their renewable energy credits to improve theeconomic viability of such systems.
There may be additional proposed changes to I-937 that might benefit the development ofdistributed resources. As proposals are being considered and evaluated, they should also beassessed in light of their potential impact on distributed energy development.
F4E4D Q"+5'*"$5B%&85,+65#;+%1&9*%62=&M*.%*+57%,
C'$5.=&8%,.65?+5'*
Washington has a number of tax and policy incentives that are all or in part designed to improvethe economic viability of distributed energy systems. These incentives have been developedover time with only limited coordination or consideration of their overall impacts on thedevelopment of distributed energy or impacts on the existing state energy infrastructure.
If the state has a goal to support distributed energy in general, a specific technology or somecombination, what are the appropriate mechanisms for that support? What are the implicationsof choosing such a mechanism? In addition, what are the impacts?
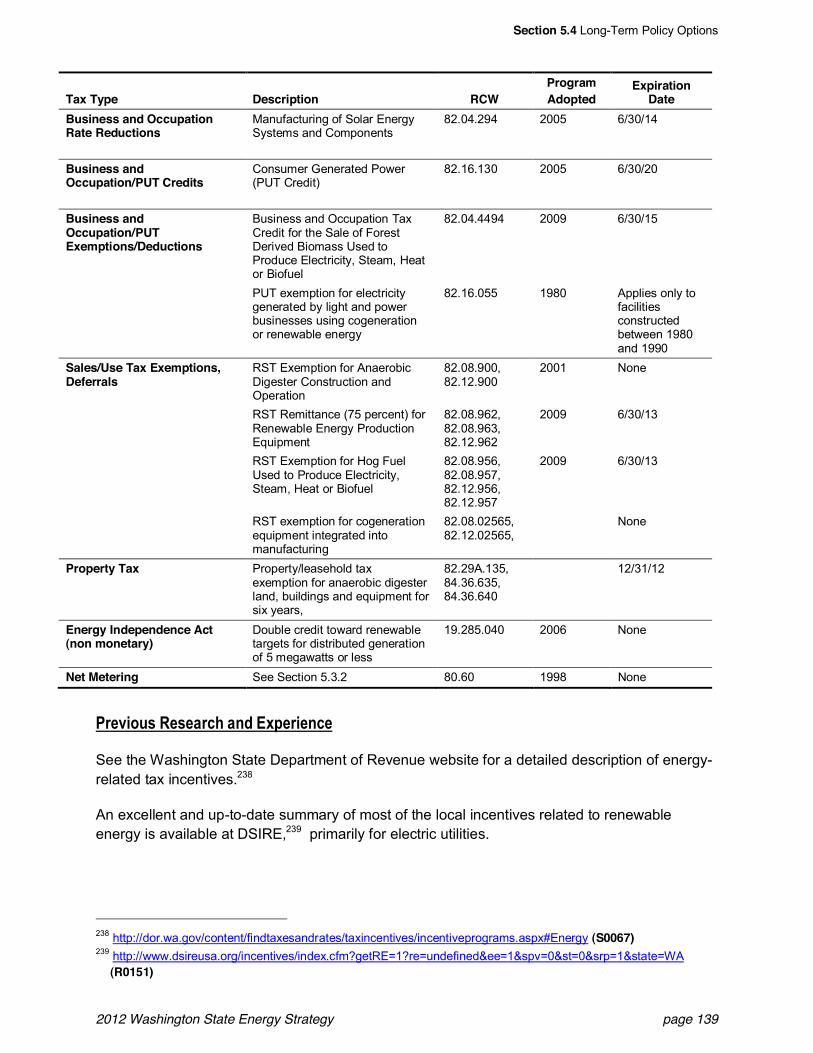
Section 5.4 Long-Term Policy Options
2012 Washington State Energy Strategy page 139
Tax Type Description RCWProgramAdopted
ExpirationDate
Business and OccupationRate Reductions
Manufacturing of Solar EnergySystems and Components
82.04.294 2005 6/30/14
Business andOccupation/PUT Credits
Consumer Generated Power(PUT Credit)
82.16.130 2005 6/30/20
Business andOccupation/PUTExemptions/Deductions
Business and Occupation TaxCredit for the Sale of ForestDerived Biomass Used toProduce Electricity, Steam, Heator Biofuel
82.04.4494 2009 6/30/15
PUT exemption for electricitygenerated by light and powerbusinesses using cogenerationor renewable energy
82.16.055 1980 Applies only tofacilitiesconstructedbetween 1980and 1990
Sales/Use Tax Exemptions,Deferrals
RST Exemption for AnaerobicDigester Construction andOperation
82.08.900,82.12.900
2001 None
RST Remittance (75 percent) forRenewable Energy ProductionEquipment
82.08.962,82.08.963,82.12.962
2009 6/30/13
RST Exemption for Hog FuelUsed to Produce Electricity,Steam, Heat or Biofuel
82.08.956,82.08.957,82.12.956,82.12.957
2009 6/30/13
RST exemption for cogenerationequipment integrated intomanufacturing
82.08.02565,82.12.02565,
None
Property Tax Property/leasehold taxexemption for anaerobic digesterland, buildings and equipment forsix years,
82.29A.135,84.36.635,84.36.640
12/31/12
Energy Independence Act(non monetary)
Double credit toward renewabletargets for distributed generationof 5 megawatts or less
19.285.040 2006 None
Net Metering See Section 5.3.2 80.60 1998 None
C6%75';,&Q%,%"6.>&"*1&9:?%65%*.%
See the Washington State Department of Revenue website for a detailed description of energy-related tax incentives.238
An excellent and up-to-date summary of most of the local incentives related to renewableenergy is available at DSIRE,239 primarily for electric utilities.
238 http://dor.wa.gov/content/findtaxesandrates/taxincentives/incentiveprograms.aspx#Energy (S0067)239 http://www.dsireusa.org/incentives/index.cfm?getRE=1?re=undefined&ee=1&spv=0&st=0&srp=1&state=WA
(R0151)
Section 5.5 Future Trends for Distributed Energy
2012 Washington State Energy Strategy page 140
W%0&-*"$=,5,
No new analysis was undertaken for this recommendation.
W%:+&<+%?,
Conduct a review and analysis of the impacts and costs of the state s current financialincentives for distributed energy. Focus that analysis particularly on the Retail Sales and UseTax Remittance for Renewable Energy Production Equipment, which will expire in June 2013,the Property Tax Exemption for biodigesters that expires in 2012, and the Public Utilities TaxExemption for Consumer Produced Power. These merit particular attention because theyappear to have had a significant impact on the development of new renewable and distributedenergy systems while at the same time impacting overall state revenue.
F4F T;+;6%&!6%*1,&('6&85,+65#;+%1&9*%62=
As a final note in this chapter, it is important to recognize there are a number of external factorsthat could have a major influence on the overall deployment of distributed energy systems. Afew of these key trends include:
! The development of low-cost storage systems such as inexpensive battery systems.Commerce has agreed to examine energy storage issues and policies in future work prior toand during the 2015 Strategy.
! Continuation of the relatively rapid decline in the price of photovoltaic systems.
! The success or failure of the California effort to develop up to 12,000 MW of distributedelectricity generation by 2020.240
! Improvements in power system electronics that enhance the ability of new technology tomore seamlessly and safely integrate with the electricity grid.
! Improvements in the electricity infrastructure driven by smart grid development that permitsimproved integration and control of increasing amounts of distributed generation into thegrid.
! New developments in production and distribution technologies for combined heat and powersystems and district energy systems.
! The impacts of climate change on the supply and demand for energy.
240 See the California Energy Commission IEPR Committee Workshop on Distribution Infrastructure and SmartGrid Solutions to Advance 12,000 MW of DG, June 22, 2011 athttp://listserver.energy.ca.gov/mobile/m_details.php?eID=1436 (R0146)
Section 6.1 Carbon Pricing
2012 Washington State Energy Strategy page 141
)>"?+%6&G &-*&M*+%26"+%1&C65.5*2&-??6'".>
G4@ )"6#'*&C65.5*2
On both federal and regional (interstate) levels, various carbon pricing schemes have beendiscussed, all of them variants of either a carbon tax or a cap-and-trade system. Most carbontax proposals apply a fee for every ton of carbon delivered in fossil fuels, sacrificing control overthe total emissions for the benefit of price certainty to the market. Cap-and-trade systemscontrol the total emissions by allocating a fixed number of allowances to emitters and allowingthem to trade those allowances at whatever prices develop in the market. Cap-and-tradesystems sacrifice price certainty for the benefit of precise control of the emissions.
Neither Commerce nor the Advisory Committee was able to conclusively identify a preferredmethod of carbon pricing. However, in order to scale the impact of any carbon pricing option onthe state energy system, Commerce chose to quantify costs and impacts of a revenue-neutralcarbon tax option, following British Columbia s policy design.
G4A -*"$=,5,&'(&"&Q%7%*;%XW%;+6"$&)"6#'*&!":&U?+5'*
G4A4@ M*+6'1;.+5'*
A revenue-neutral carbon tax applies to all fossil fuels consumed in the state, both direct fuelconsumption, such as building heat and motorized transportation, and electrical generation.British Columbia (BC) introduced the first revenue-neutral carbon tax in the region in 2008,aimed at reducing fossil fuel consumption by sending price signals to consumers to incentivizemore efficient fuel use. Its primary advantages are to provide: 1) price certainty for consumersand businesses so that they can make efficient energy investment and purchasing decisions;241
2) completeness as an economy-wide policy program that targets fuel consumption in allsectors and consumers; and 3) welfare improvement by reducing dead weight loss, which is aneconomic term describing inefficiency caused by overconsumption of products where the cost ofassociated pollution is not incorporated into the products retail price.242 Although a carbon taxdoes result in higher energy prices, consumers and businesses need not be adversely affectedif the revenues from a carbon tax are used to offset other state taxes. A carbon tax canpotentially impose greater burden to low-income households and small businesses as the shareof energy-related expenditures for these subgroups is generally higher. However, it is possibleto mitigate this effect by providing various mechanisms in the revenue recycling package, suchas an additional low-income tax credit, such as is used in the BC carbon tax program.243 When
241 Ian W.H. Parry and William A. Pizer, Emissions Trading Versus CO2 Taxes Versus Standards, Assessing U.S.Climate Policy Options, Resources for the Future, November 2007: pp. 81-82,www.rff.org/rff/Publications/upload/31809_1.pdf (R0153)
242 Lawrence H Goulder, Environmental Taxation and the "Double Dividend:" A Reader's Guide, NBER WorkingPaper No. 4896, National Bureau of Economic Research, 1994. (R0154)
243 British Columbia Ministry of Environment, BC Climate Action Plan, 2008,www.livesmartbc.ca/attachments/climateaction_plan_web.pdf: pp. 16. (R0155)
Section 6.2 Analysis of a Revenue-Neutral Carbon Tax Option
2012 Washington State Energy Strategy page 142
designed carefully, this revenue neutrality can therefore maintain or improve economiccompetitiveness and improve social welfare by reducing fuel consumption and pollution.
Specific parameters and design elements for a carbon tax are subject to further discussion, butfor this modeling exercise the 2012 Energy Strategy generally assumes that Washington willmodel its carbon tax after BC s in the following ways. A carbon tax will be collected in the samemanner as existing fuel taxes. It does not apply to marine and aviation fuels for interstate andinternational trips to prevent leakage effects, which is a diversion of refueling events (fuelconsumption) caused by geographic price differentials, and imported electricity will be exemptedfrom this taxation to avoid potential legal issues. Matching the BC carbon tax policy, thebaseline rate would start at $10 per metric ton of carbon dioxide equivalent (MTCO2e) with anincremental rate at $5/MTCO2e per year, with the tax rate eventually capped at $30/MTCO2e.This cap rate roughly equates to a price increase of 30 cents per gallon for regular motorgasoline. Carbon tax revenues are assumed to be returned to the taxpayers primarily in theform of rate cuts for existing state taxes.
G4A4A C6%75';,&Q%,%"6.>
Carbon Tax Center, a national nonprofit advocacy group, developed an elasticity-basedspreadsheet model to estimate the impacts of a national carbon tax.244 This modeldemonstrates the potential impacts of a tax, but does not account for complex energy-relateddynamics such as its effect on fuel mix for electric generation. In contrast to this elasticity-basedapproach, upon introducing the first economy-wide carbon tax, BC used a general equilibriummodel called the CIMS to estimate the societal impacts of the carbon tax.245 The primaryadvantage of general equilibrium models is that they can account for substitution effects andpredict economy-wide impacts along with fiscal and environmental impacts. This feature wasdemonstrated in several research papers, such as Analysis of Policies to Reduce OilConsumption and Greenhouse-Gas Emissions from the US Transportation Sector,246 whichused a U.S. general equilibrium energy model called the NEMS to predict its impacts on thetransportation sector. This approach, however, requires substantial financial resources and stafftime to complete due to the complexity of general equilibrium models.
For economic analysis, the results from Washington Western Climate Initiate Economic ImpactAnalysis,247 provides a useful estimate of potential economic impacts for Washington. This studyused an energy equilibrium model called Energy 2020 to analyze the economic impacts ofregional cap-and-trade. The study concluded that the effects on employment and total outputcould vary from one sector to another but are likely to be net positive when implemented with
244 Effectiveness, Carbon Tax Center, www.carbontax.org/issues/energy-demand-how-sensitive-to-price/, (accessedon May 11, 2010). (R0156)
245 BC Ministry of Environment, BC Climate Action Plan, Appendix I: A Quantitative Analysis of British Columbia sClimate Action Plan, 2008, www.env.gov.bc.ca/cas/pdfs/climate_action_21st_century.pdf (R0157)
246 Ross W. Morrow, Kelly Sims Gallagher, Gustavo Collantes, and Henry Lee, Analysis of policies to reduce oilconsumption and greenhouse -gas emissions from the US transportation sector, Energy Policy 38 (2010): 13051320, doi:10.1016/j.enpol.2009.11.006 (R0158)
247 ECONorthwest, Washington Western Climate Initiate Economic Impact Analysis, Feb 15, 2010www.ecy.wa.gov/climatechange/docs/20100707_wci_econanalysis.pdf (S0024)
Section 6.2 Analysis of a Revenue-Neutral Carbon Tax Option
2012 Washington State Energy Strategy page 143
other efficiency measures. Another study by Morgenstern et al found that using the past dataand general equilibrium model, the effects on manufacturing is negligible except for a fewenergy intensive industries, and the impacts on these industries can be minimized withmitigation measures such as a border tax and revenue offset for the U.S. as a whole.248
G4A4D W%0&-*"$=,5,
Commerce developed an elasticity-based spreadsheet model called the Carbon Tax AnalysisModel (C-TAM). This model is an open-source model based on three major elements: 1) carbontax rates, 2) the EIA s energy price and demand forecasts,249 and 3) price elasticities of demand(indicators of how consumer demand responds to price changes). Due to its dependency on theEIA forecast, C-TAM predicts the impacts on a production basis, meaning that the fuel used inanother state to generate electricity consumed in Washington is not included in the forecast. C-TAM is designed to account for the effects of complex price changes for each fuel type andlikely fuel mix change for electric generation. The elasticity selection is based on a thoroughliterature review covering a wide array of fuel products, ranging from transportation fuels tosector-by-sector electricity consumption. The analysis results are disaggregated for each fuelsource and sector (residential, commercial, industrial and transportation).
The primary advantage of C-TAM over more sophisticated models such as the NEMS is toprovide policy makers the ability to better understand the model and to change variousassumptions and parameters to explore the impacts of various carbon tax designs.Furthermore, C-TAM is far less resource intensive, yet produces detailed projections for eachsector and fuel source, and accounts for the complex interaction of energy price and demand.
The model forecasts that with the baseline parameters described earlier, a carbon tax canreduce energy-related emissions by 8.4 percent from the projected level in 2035, with$2.1 billion of carbon tax revenues for the same year. The impacts on fossil fuel consumptionare highest for the electricity sector, with far smaller impacts on transportation fuel consumption.A carbon tax has a greater impact on electrical generation because of the high carbon intensityof coal-fired electric generation.
Further analysis was pursued to examine the impacts of using alternative cap rates. Figure 6-1summarizes the results of this sensitivity analysis, and it suggests that a carbon tax of$70 per MTCO2e is sufficient to stablize the energy-related emissions at 1990 levels in 2035. Inaddition, a carbon tax at $90 per MTCO2e would be able to retire all electricity generating plantsusing fossil fuel. In reality some of these plants would need to be preserved as backup powerfor certain conditions, such as low water years and very cold days.
248 Richard D. Morgenstern, Joseph E. Aldy, Evan M. Herrnstadt, Mun Ho, and William A. Pizer, CompetitivenessImpacts of Carbon Dioxide Pricing Policies on Manufacturing, Assessing U.S. Climate Policy Options, Resourcesfor the Future, November 2007: 96-105, www.rff.org/rff/Publications/upload/31811_1.pdf (R0159)
249 Energy Information Administration, Annual Energy Outlook 2011, Mar 2011, www.eia.gov/forecasts/aeo/ (R0090)
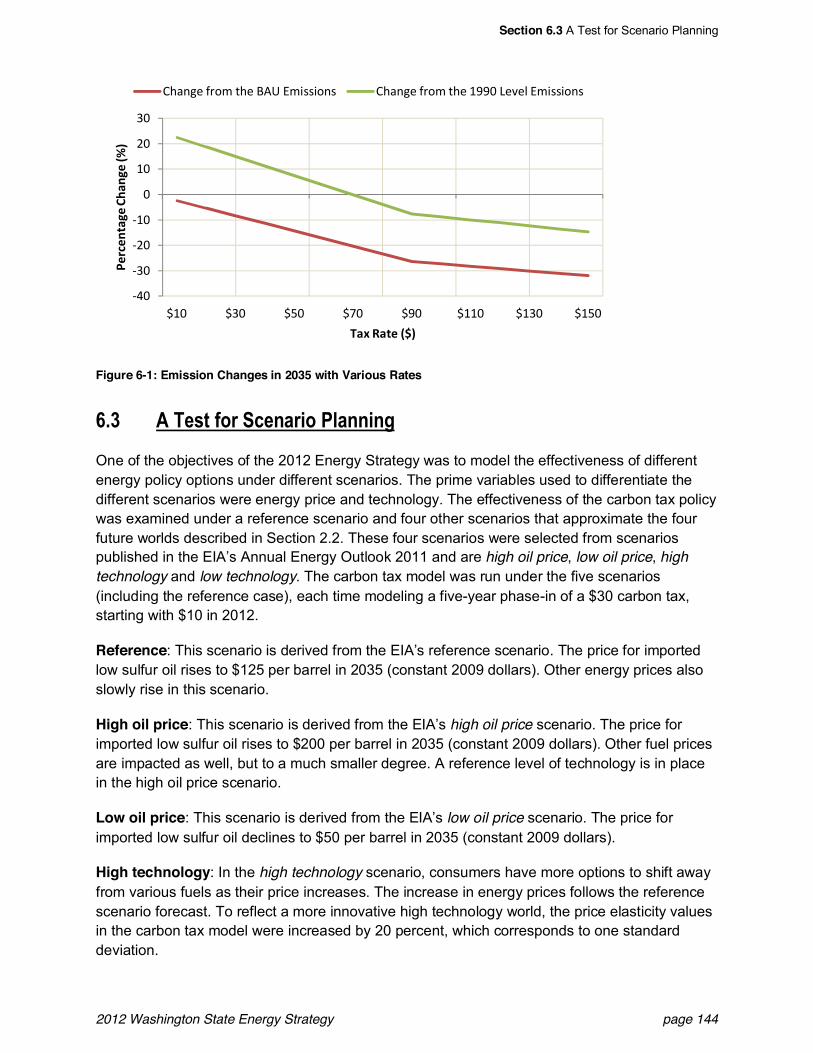
Section 6.3 A Test for Scenario Planning
2012 Washington State Energy Strategy page 144
Figure 6-1: Emission Changes in 2035 with Various Rates
G4D -&!%,+&('6&<.%*"65'&C$"**5*2
One of the objectives of the 2012 Energy Strategy was to model the effectiveness of differentenergy policy options under different scenarios. The prime variables used to differentiate thedifferent scenarios were energy price and technology. The effectiveness of the carbon tax policywas examined under a reference scenario and four other scenarios that approximate the fourfuture worlds described in Section 2.2. These four scenarios were selected from scenariospublished in the EIA s Annual Energy Outlook 2011 and are high oil price, low oil price, hightechnology and low technology. The carbon tax model was run under the five scenarios(including the reference case), each time modeling a five-year phase-in of a $30 carbon tax,starting with $10 in 2012.
Reference: This scenario is derived from the EIA s reference scenario. The price for importedlow sulfur oil rises to $125 per barrel in 2035 (constant 2009 dollars). Other energy prices alsoslowly rise in this scenario.
High oil price: This scenario is derived from the EIA s high oil price scenario. The price forimported low sulfur oil rises to $200 per barrel in 2035 (constant 2009 dollars). Other fuel pricesare impacted as well, but to a much smaller degree. A reference level of technology is in placein the high oil price scenario.
Low oil price: This scenario is derived from the EIA s low oil price scenario. The price forimported low sulfur oil declines to $50 per barrel in 2035 (constant 2009 dollars).
High technology: In the high technology scenario, consumers have more options to shift awayfrom various fuels as their price increases. The increase in energy prices follows the referencescenario forecast. To reflect a more innovative high technology world, the price elasticity valuesin the carbon tax model were increased by 20 percent, which corresponds to one standarddeviation.
DCE
DFE
DGE
DAE
E
AE
GE
FE
HAE- HFE- H0E- HIE- HBE- HAAE- HAFE- HA0E
6.A+.2
')C.03@)
2C.0DE
F
4)G05)'.0DHF
26#$9*-+"'J-(6*-K3L-5J)%%)'$% 26#$9*-+"'J-(6*-ABBE-M*N*;-5J)%%)'$%
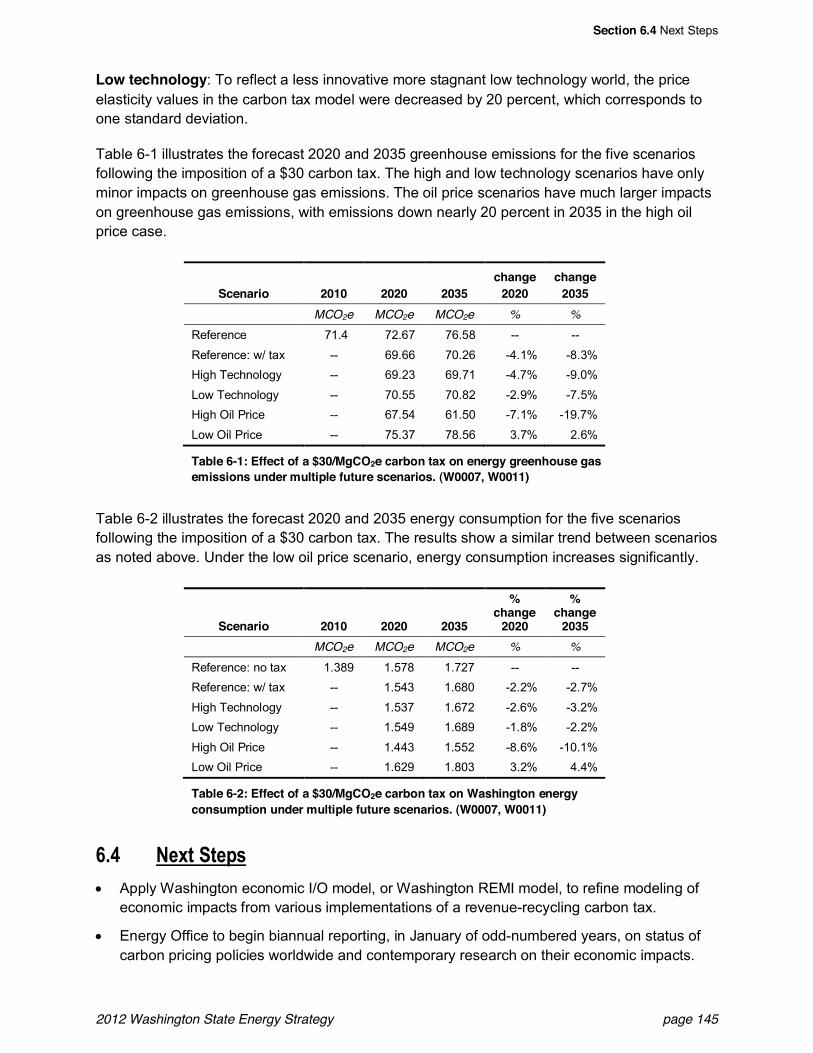
Section 6.4 Next Steps
2012 Washington State Energy Strategy page 145
Low technology: To reflect a less innovative more stagnant low technology world, the priceelasticity values in the carbon tax model were decreased by 20 percent, which corresponds toone standard deviation.
Table 6-1 illustrates the forecast 2020 and 2035 greenhouse emissions for the five scenariosfollowing the imposition of a $30 carbon tax. The high and low technology scenarios have onlyminor impacts on greenhouse gas emissions. The oil price scenarios have much larger impactson greenhouse gas emissions, with emissions down nearly 20 percent in 2035 in the high oilprice case.
Scenario 2010 2020 2035change
2020change
2035MCO2e MCO2e MCO2e % %
Reference 71.4 72.67 76.58 -- --Reference: w/ tax -- 69.66 70.26 -4.1% -8.3%High Technology -- 69.23 69.71 -4.7% -9.0%Low Technology -- 70.55 70.82 -2.9% -7.5%High Oil Price -- 67.54 61.50 -7.1% -19.7%Low Oil Price -- 75.37 78.56 3.7% 2.6%
Table 6-1: Effect of a $30/MgCO2e carbon tax on energy greenhouse gasemissions under multiple future scenarios. (W0007, W0011)
Table 6-2 illustrates the forecast 2020 and 2035 energy consumption for the five scenariosfollowing the imposition of a $30 carbon tax. The results show a similar trend between scenariosas noted above. Under the low oil price scenario, energy consumption increases significantly.
Scenario 2010 2020 2035
%change
2020
%change
2035MCO2e MCO2e MCO2e % %
Reference: no tax 1.389 1.578 1.727 -- --Reference: w/ tax -- 1.543 1.680 -2.2% -2.7%High Technology -- 1.537 1.672 -2.6% -3.2%Low Technology -- 1.549 1.689 -1.8% -2.2%High Oil Price -- 1.443 1.552 -8.6% -10.1%Low Oil Price -- 1.629 1.803 3.2% 4.4%
Table 6-2: Effect of a $30/MgCO2e carbon tax on Washington energyconsumption under multiple future scenarios. (W0007, W0011)
G4E W%:+&<+%?,! Apply Washington economic I/O model, or Washington REMI model, to refine modeling of
economic impacts from various implementations of a revenue-recycling carbon tax.
! Energy Office to begin biannual reporting, in January of odd-numbered years, on status ofcarbon pricing policies worldwide and contemporary research on their economic impacts.

Section 6.4 Next Steps
2012 Washington State Energy Strategy page 146
Focus on those political entities most relevant to Washington, e.g. British Columbia andCalifornia.
! Establish an annual forum on research in carbon pricing at the Washington Future EnergyConference, focusing on invitations to academic researchers both inside and outsideWashington.
Section 7.1 The 2011 Energy Strategy Update
2012 Washington State Energy Strategy page 147
)>"?+%6&H &M*5+5"+57%&<+"+;,&(6'3&+>%&AN@@&O?1"+%
H4@ !>%&AN@@&9*%62=&<+6"+%2=&O?1"+%The Energy Strategy Update and 2011 Biennial Energy Report with Indicators recommended 17specific action items.250 Those recommendations fell into four broad categories:
! Residential and Commercial Buildings Efficiency;
! Industrial Energy Efficiency;
! Transportation Efficiency and Technology; and
! Streamlined Permitting for Clean and Advanced Energy Technologies.
Following is a review of the relevant portions of each of the 17 recommendations as well as asummary of their implementation status.
H4A Q%,51%*+5"$&`&)'33%6.5"$&L;5$15*2,&9((5.5%*.=
H4A4@ M3?6'7%&)'*,;3%6&)'*(51%*.%&5*&9*%62=&9((5.5%*.=&Q%+6'(5+,We propose to develop and implement a streamlined program of contractor certification and
registration, training standards, periodic third party inspection of contractors work, and acomplaint resolution system. Additional standardization such as standard contractor bidforms would clarify the work for consumers. The program will be designed to be compliantwith the proposed, federal HomeStar program, or whichever national standard seems mostlikely to prevail at the time Washington s program moves forward.
Status: Commerce staff has conducted additional research in this area. Based on that researchwe have included a new recommendation in the 2012 Buildings Efficiency Policy Near-TermRecommendations 4.4.3 Marketing and Quality Assurance.
H4A4A T5*"*.5"$&!''$,&('6&Q%,51%*+5"$&"*1&)'33%6.5"$&9*%62=&9((5.5%*.=M*7%,+3%*+,
Commerce will research these available financial tools, identifying any legal, marketing oradministrative barriers others have encountered in deploying them, and identify those thatshow the most promise for Washington State.
Status Commerce staff conducted additional research on financial tools for energy efficiency.Based on that research we believe that meter based financing is the most promising approach.
250 Each of the quoted sections in this chapter along with additional detail appear on pages 6 to 15 of the Update,http://www.commerce.wa.gov/DesktopModules/CTEDPublications/CTEDPublicationsView.aspx?tabID=0&ItemID=9107&MId=863&wversion=Staging (S0029)
Section 7.2 Residential & Commercial Buildings Efficiency
2012 Washington State Energy Strategy page 148
The details of that recommendation are included in the 2012 Buildings Efficiency Near-TermPolicy Recommendations 4.4.4 Meter-Based Financing.
H4A4D O!)&)'*,%67"+5'*&C'$5.=&<;??'6+The UTC has just completed an inquiry on conservation incentives for investor-owned
utilities, described above on page 5, and has produced a policy guidance document thatdescribes how proposals decouple of electric and gas revenues from sales volume shouldbe structured.
If the nature of those recommendations necessitates coordinated rulemakings or agencyrequest legislation, the Department of Commerce will work together with the UTC to takethose policy steps toward providing appropriate incentives for energy conservation.
Status: On November 11, 2010, the UTC issued a Report and Policy Statement on RegulatoryMechanisms, Including Decoupling, to Encourage Utilities to Meet or Exceed the ConservationTargets. 251 Specific implementation of provisions in that policy statement will be through theindividual investor-owned utility rate making proceedings.
H4A4E K5*53;3&Q%^;56%3%*+,&('6&Q%*+"$&[';,5*2We propose to research and eventually advance policy toward increasing the energy
efficiency of rental housing. Policies examined will include for example:
-- Disclosure requirements. The building owner is required to disclose typical energyconsumption data or utility costs associated with each unit prior to lease signature.
-- Minimum efficiency measures. Rental units must include certain minimum efficiencymeasures, for example a certain R-value of attic insulation. The minimum efficiencymeasures could be required at time of sale (change of ownership) of rental housing, ormandated by a date certain.
Care will be taken to craft policy proposals in a way that do not threaten the availability orprice of rental housing to low-income populations.
Status: Commerce conducted additional research on rental housing and energy efficiency. The2012 Buildings Efficiency Near-Term Policy Recommendations 4.4.6 Minimum Standards forRental Housing proposes specific near-term actions for this item. In addition, Recommendation4.4.2, Residential Disclosure, recommends making energy consumption data available for allhouseholds, not just rental properties.
H4A4F 9((5.5%*.=&C6'26"3,&('6&W'*X9$%.+65.&T;%$,When homes are heated with electricity, the electric utility typically offers electric
conservation programs that include retrofits of the building shell, as well as subsidies or
251 UTC Docket U-100522 available athttp://www.wutc.wa.gov/rms2.nsf/177d98baa5918c7388256a550064a61e/43eb29bd6e98d0e8882577d1007fea20!OpenDocument (S0086)
Section 7.3 Industrial Energy Efficiency
2012 Washington State Energy Strategy page 149
financing for equipment. However, when homes are heated with wood, propane or oil, theconsumer s access to similar programs may be limited. This same problem exists to a lesserdegree for natural gas heated homes.
Commerce proposes to research policies that provide all households with access to energyconservation programs, regardless of heating fuel. Commerce will design and implementeducation and access programs to the extent possible without legislation during calendaryear 2011, but if necessary may propose legislation to expand these programs in the 2012legislative session
Status: We do not anticipate proposing any legislation on this item in the 2012 session. During2011, Commerce began discussions with Ecology on how non-electric efficiency measuresmight be incorporated into State Implementations Plans (SIPs) required for non-attainmentareas under the federal Clean Air Act. Ecology anticipated that Washington would have non-attainment areas for ozone; however, those federal regulations were suspended. Washingtondoes have some non-attainment areas for particulates where non-electric efficiency or fuelswitching programs for sources such as wood stoves may be attractive. Commerce will continueto examine ways to increase support for non-electric efficiency efforts in areas such as airquality compliance, new efficiency program design, and, where appropriate, legislation.
H4D M*1;,+65"$&9*%62=&9((5.5%*.=
H4D4@ T%1%6"$X)';?$%1&Q%.'2*5+5'*&C6'26"3Federal programs such as the U.S. DOE s Save Energy Now and the EPA Energy Star for
Industry provide resources and recognition for companies engaged in industrial energyefficiency. Meanwhile, the Washington State University Extension, Energy Program hasdeveloped a sophisticated industrial energy efficiency technical assistance program inWashington State.
We propose to develop a partnership among the Washington State Department ofCommerce and the WSU Extension Energy Program to provide additional recognition forcompanies engaged with federal industrial initiatives like those through U.S. DOE and/orEPA. The partnership will provide a combination of technical assistance, administrativeassistance, and public recognition for successful industrial participants. A special emphasiswill be given to international marketing of participating companies products or services.Possibly, firms complying with the new ISO 50001 Energy Management Systems standardwill also be given special recognition.
Status: The WSU Energy Program is developing a recognition program for industrialcustomers. They have been discussing the program with electric and gas utilities and theutilities have shown strong support for the idea. The specific details of how to best design anddeploy the program are still under development. We anticipate some type of recognitionprogram will be underway in the first or second quarter of 2012.
Section 7.4 Transportation Efficiency and Technology
2012 Washington State Energy Strategy page 150
H4D4A <+6%"3$5*%1&C%635++5*2&'(&)'3#5*%1&[%"+&"*1&C'0%6&C6'R%.+,Various studies have indicated a large quantity of industrial waste heat available that could
be used to generate electricity in combined heat & power (CHP) or cogenerationinstallations. If the industrial entity financing the CHP installation is able to sell the resultingelectricity into the grid a project often appears profitable, but permitting, regulatory oreconomic barriers can pose an insurmountable hurdle to implementation. Meanwhile, theU.S. EPA is developing a Waste Energy Recovery Registry according to requirements of the2007 Energy Independence and Security Act, and Washington may benefit from preparingto respond to the CHP potentials revealed by the Registry.
In this initiative, Commerce will research the barriers to CHP deployment during calendaryear 2011, and recommend a set of remedies that may include programmatic, regulatory orlegislative solutions to be deployed in 2012.
Status: The WSU Energy program is completing a report on opportunities for and barriers toCHP expansion (as well as district energy and industrial efficiency). The report, WashingtonThermal Energy Efficiency Opportunities will be completed by the end of 2011.
H4E !6"*,?'6+"+5'*&9((5.5%*.=&"*1&!%.>*'$'2=
H4E4@ 9*%62=&-0"6%&S6'0+>&K"*"2%3%*+Commerce will integrate transportation energy reduction into GMA technical assistance
provided to local governments, in particular by updating the GMA Transportation Guidebookto be consistent with the goals and principles of the State Energy Strategy. Updates to theGMA Transportation Guidebook will address issues related to the integrated effects of urbanplanning and development on transportation energy, as well as to the required issues listedabove. Commerce may also develop one or more model land use ordinances thatencourage low-energy transportation choices that could be adapted and deployed by localgovernments that have an interest in doing so.
Status: Commerce is on schedule to complete an extensive update to the GMA TransportationGuidebook by February 2012.252 Commerce is also preparing the following series of discussionbriefs on topics related to planning and developing energy aware communities:
! Brownfield Redevelopment
! Compact Communities
! Complete Streets
! Distributed Energy
! Economic Development
! Historic Preservation
252 Draft information on the update is available at the Commerce GMA website -http://www.commerce.wa.gov/portal/alias__CTED/lang__en/tabID__403/DesktopDefault.aspx (S0071)
Section 7.4 Transportation Efficiency and Technology
2012 Washington State Energy Strategy page 151
! Mixed-Use Development
! Infrastructure
! Parking
! Sense of Place
! Smart Growth
! Transfer of Development Rights
! Transportation
These technical assistance papers will be posted on the Commerce website in December 2011.
H4E4A 9$%.+65.&Y%>5.$%&)>"625*2&<+"+5'*&<5+5*2Under this initiative, Commerce will provide technical assistance to local governments,
when requested, on interpretation and implementation of the electric vehicle siting guidance.Though the siting guidance was developed with a primary purpose of enabling electricvehicle deployment, Commerce assistance will also help local governments coordinatecharging station siting with existing laws, protecting environmental and cultural resourcesthat may be affected.
Status: In 2009, the Washington State Legislature passed and the Governor signed into law2SHB 1481, an Act relating to electric vehicles.253 The law addresses electric vehicleinfrastructure, which are defined as the structures, machinery and equipment necessary andintegral to support an electric vehicle, including battery charging stations, rapid chargingstations, and battery exchange stations.
The law requires that local government develop regulations allowing electric vehicleinfrastructure as a use in all zones except those zoned for residential, resource or critical areas.This guidance extends the permitted use to these zones as well, although with some restrictionsand limitations. The requirements apply to local jurisdictions as follows:
! By July 1, 2010, municipalities greater than 20,000 in population in King County that areadjacent to Interstate 5, Interstate 90, Interstate 405, or State Route 520, and allmunicipalities adjacent to I-5 in Pierce, Snohomish and Thurston Counties, must allowelectric vehicle infrastructure.
! By July 1, 2011, municipalities less than 20,000 in population in King County that areadjacent to these freeways, and all municipalities statewide adjacent to I-5 and I-90statewide, are required to allow electric vehicle infrastructure.
! The remaining municipalities across the state are required to allow battery-charging stationsby July 1, 2011.
! For unincorporated county lands, the law imposes similar 2010 and 2011 deadlines forelectric vehicle infrastructure, but only within a one-mile buffer around these freeways. For
253 RCW 43.21C.410
Section 7.4 Transportation Efficiency and Technology
2012 Washington State Energy Strategy page 152
battery charging stations, the entire area of the county is affected except those zoned forresidential, resource, or critical areas by 2011.
In July 2010, the PSRC, with the assistance of Commerce, produced Electric VehicleInfrastructure A Guide for Local Governments in Washington.254 By the fall of 2011, morethan 100 jurisdictions had adopted electric vehicle infrastructure ordinances.255
H4E4D O*5('63&Q%2;$"+'6=&C6'+%.+5'*&('6&)>"625*2&<+"+5'*,Under current state law, operation by a private company of an electric vehicle charging
station, which involves the sale or resale of electricity, may be subject to UTC regulation,including rates, terms of service, and consumer protection. The UTC is reviewing currentlaw, rules, and tariffs to determine whether the current regulatory structure facilitatesdeployment of charging stations and encourages adoption of electric vehicles. If statutorychanges are needed, the UTC will work with Commerce and Transportation to developappropriate legislation.
Following any conclusions made by the UTC, Commerce may pursue rulemaking orlegislation that provides vehicle charging stations in the service territories of public utilities(which are unaffected by UTC decisions) with protections or remedies equivalent to thoserecommended by the UTC for charging stations potentially under its jurisdiction.
Status: The 2011 Legislature unanimously passed and the Governor signed SHB 1571,256,limiting the regulation of electric vehicle battery charging facilities. The legislation prohibits theUTC for regulation battery charging facilities for the public and allows regulation electric utilitiesto offer such facilities as part of their regulated service. Commerce determined that there wasno additional legislation or rulemaking necessary for public utility service territories.
H4E4E -3%*1&Q%*%0"#$%&T;%$,&<+"*1"61Commerce proposes to support reasonable legislation brought to the 2011 session that
converts the existing, volumetric renewable fuels standard to the universal type that hasbeen proven by the prior work of other states.
Status: Legislation to amend the state s renewable fuels standard was introduced in the 2011legislative session (HB 1606 and SB 5478) but did not pass. The 2012 AdvancingTransportation Efficiency Near-Term Recommendations 3.4.2 Renewable Fuels Standardreiterates the recommendation to adopt legislation.
254 Available athttp://www.commerce.wa.gov/DesktopModules/CTEDPublications/CTEDPublicationsView.aspx?tabID=0&ItemID=8851&MId=863&wversion=Staging (S0087)
255 For a summary of all Washington s plug-in electric vehicle legislation see www.electricdrive,wa.gov/policy.htm(S0088)
256 RCW 80.28.320
Section 7.4 Transportation Efficiency and Technology
2012 Washington State Energy Strategy page 153
H4E4F )'3?6%,,%1&W"+;6"$&S",Compressed natural gas (CNG) can fuel gasoline internal combustion engines with only
slight modifications, and has been deployed for that purpose for decades. CNG is currentlyembraced by a large number of commercial fleets to reduce greenhouse gas emissions,traditional pollutants, and costs, and to increase safety. Yet, there is comparatively little useof CNG in by Washington State fleets.
The Department of Commerce proposes to collaborate with other agencies to identifybarriers to deployment of CNG in the state s fleet, and create a program accelerating itsadoption.
Status: Washington has seen some key developmentof CNG fleets over the last 10 years. Pierce Transitcompleted conversion of its entire fleet to CNG in2004.262 Seattle Tacoma International Airport has all166 taxicabs operated by the Seattle-TacomaInternational Taxicab Association (STITA) fueled bycompressed natural gas and the port has 47 naturalgas vans, pickups and sedans in its fleet of 74 naturalgas and hybrid vehicles. In some limited discussionswith fleet managers by Commerce, the availability offueling infrastructure is a key concern to the furtherdeployment of CNG vehicles. Nonetheless, Commercecontinues to believe that this is a promising avenueand will be looking for resources and partnershipopportunities to encourage CNG, propane or othernatural gas fueling, especially in fleet applications. Inaddition, Commerce has met with developers of CNGfueling facilities and they have indicated that heavy-duty vehicles may be a particularly good target forearly deployment. The Department will continue towork with and encourage that development.
257 The promising prospect for North American natural gas has generated some interest in other fuels derived fromnatural gas, not just CNG. For a description of some of these fuels and there relative performance on energy andemissions, see M Q Wang & H S Huang, A Full Fuel-Cycle Analysis of Energy and Emissions Impacts ofTransportation Fuels Produced from Natural Gas, Argonne National Laboratory 1999. (R0224)
258 M R Werpy, A Burnham & K Bertram, Propane Vehicles: Status, Challenges, and Opportunities, Argonne NationalLaboratory, May 2010 (R0215)
259 L Bromberg & W K Cheng, Methanol as an alternative transportation fuel in the US: Options for sustainable and/orenergy-secure transportation, MIT Sloan Automotive Laboratory 2010. (R0216)
260 National Renewable Energy Laboratory, Validation of Hydrogen Fuel Cell Vehicle and Infrastructure Technology,U.S. Department of Energy 2007 (R0217).
261 C Zamfirescu & I Dincer, Using ammonia as a sustainable fuel, Journal of Power Sources 185 (2008) pp.459-465(R0218).
262 Pierce Transit's Clean Machines A breath of fresh air: Pierce Transit powers its bus fleet with compressed naturalgas at www.piercetransit.org/cng.htm. (R0211)
Fuels and Fleets
Besides CNG,257 several other fuels compete for aniche of the transportation energy market. Someare relatively established, while others are highlyexperimental. They include electricity (seeSection 3.4.1), propane,258 methanol,259
hydrogen,260 even ammonia.261 What they all dohave in common, is that they are unsupported bythe ubiquitous, roadside refueling infrastructurethat gasoline and diesel enjoy. Hence, the bestplace to start with any of these fuels are fleets,where the expense of a new refueling station canbe spread over multiple vehicles. It is for thisreason that governments are often looked to, as aleader in introducing new fuels into thetransportation system.
Choosing which alternative fuels to deploy in theWashington state fleet is not easy, as each hasunique signatures of price, price stability,emissions, vehicle availability, fueling equipmentrequirements, and so forth. In future energystrategies, Commerce will be working to deploycoordinated studies of all these factors that allowapples to apples comparisons among candidate
fuels before fleet decisions are made.
Section 7.5 Streamlined Permitting for Clean and Advanced Energy Technologies
2012 Washington State Energy Strategy page 154
H4F <+6%"3$5*%1&C%635++5*2&('6&)$%"*&"*1&-17"*.%1&9*%62=!%.>*'$'25%,
H4F4@ 9*%62=&U7%6$"=&a'*%,Energy Overlay Zones (EOZ) were formally acknowledged and protected by Senate Bill
5107 passed in 2009, which defines an EOZ as a formal plan enacted by the countylegislative authority that establishes suitable areas for siting renewable resource projectsbased on currently available resources and existing infrastructure with sensitivity to adverseenvironmental impact. In Klickitat County, an EOZ has been successful in promoting windresource development in particular.
For this initiative, Commerce will use the experience of Klickitat County and other localgovernments to create a guidance document to assist other counties with development oftheir own EOZs; and provide technical assistance when helpful
Status: Commerce is preparing a report considering alternatives to promote establishment ofEnergy Overlay Zones. The report recommends provision of financial incentives to localgovernments for the purpose of developing and implementing an EOZ. The report will beavailable as part of the supporting documentation for the 2012 Strategy.
H4F4A W'*XC6'R%.+&"*1&C$"**%1&-.+5'*&<9C-&Q%75%0,New energy projects may require State Environmental Policy Act (SEPA) review. To save
time at the project permitting phase, a non-project SEPA review may be undertaken earlierby a local government. The non-project SEPA review would focus on the planning, siting,and permits needed for energy projects before a specific project is proposed. The non-project review would apply to any project of a certain class, undertaken within a certaingeographic area, with the class and area both being defined within the non-project review.Once complete, any project meeting the definitions and other requirements in the non-project review may rely on the review to streamline project-level SEPA and permitting.
Planned Action SEPA reviews go a step further by proactively writing an ordinance(s) thatlimit the impacts and ensure project conformance with the mitigation requirementsassociated with a non-project Environmental Impact Statement (EIS). Streamliningassociated with planned actions may go beyond ordinance writing, for example Commercecould provide information that assists in creating mitigation banks.
As with the non-project SEPA review, Commerce will be able to offer technical assistancewith Planned Action SEPA review and development of implementing mitigation regulations.Commerce will partner with Ecology, Department of Fish and Wildlife, and other stateagencies to create comprehensive templates for successful non-project SEPA review. Priorlegislation established a Planning and Environmental Review Fund (PERF) which wasdesigned to assist local governments with planned action reviews. This fund is currentlyempty. Commerce may propose legislation to re-seed the PERF, but this time as a revolvingloan rather than as a grant fund. To repay the loan, a local government may assess fees toparties developing projects that fall under the non-project SEPA review.
Section 7.5 Streamlined Permitting for Clean and Advanced Energy Technologies
2012 Washington State Energy Strategy page 155
Status: Commerce developed a report highlighting opportunities for local government tostreamline permitting of renewable energy facilities as well as infill development in urbanareas.263 The recommendations encourage greater use of Planned Actions as well as otherstreamlining strategies. The report will be available as part of the supporting documentation forthe 2012 Energy Strategy.
H4F4D C6%^;"$5(5."+5'*&'(&-17"*.%1&!%.>*'$'25%,&;*1%6&MXJDHInitiative 937, voted into law in 2006, is the state s renewable portfolio standard. Power
developers and utilities have raised questions about whether a particular technology is aneligible renewable resource under the law and how unusual cases should be treated. In theabsence of a definitive method to determine eligibility, developers of innovative resourcesmay have insufficient assurance of their project s benefits to proceed. To date, the UTC, theState Auditor s Office and Department of Commerce have informally spoken to individualutilities and developers on a case by case basis.
We propose that the UTC, the State Auditor s Office and Commerce develop a publicprocedure that could pre-determine whether a generating resource would likely beconsidered an eligible resource when submitted by a utility as part of its compliancedocumentation. The procedure would be set up through an MOU, an exchange of letters, ora coordinated rule making, depending on legal advice as to how much formality is needed.Developers and utilities would be assured that if their proposed project or technology isdetermined to be eligible, the after-the-fact review would focus on whether the generationresource is within the parameters described in the proposal for pre-determination.
Status: Commerce, the Auditor and the UTC have established a process for providing informalopinions on eligibility issues related to I-937. That process has formally responded to about onedozen requests for opinions.264 In addition, the UTC issued a Policy State Regarding Processfor Determining Whether Projects are Eligible Renewable Resources under RCW 19.285 andWAC 480-109. The UTC policy statement allows Investor-Owned Utilities (IOUs) regulated bythe UTC to seek a formal declaratory order on proposed project eligibility.265
If the 2012 or 2013 legislative sessions do consider modifications to the I-937, we expect todevelop a legislative proposal for pre-qualification.
H4F4E -..%$%6"+%1&C%635++5*2&('6&C5$'+&C6'R%.+,Pilot energy generation or energy infrastructure projects, though smaller in scale than
conventional generation or infrastructure projects, often find themselves faced by the same,substantial permitting requirements as a full-scale undertaking. By nature of their smallersize pilot projects are usually (but not always) less likely to have significant impacts; and
263 Department of Commerce, Streamlining Local Government Project Review and Permitting for Renewable EnergyFacilities and Infill Development, November 2011. (S0063)
264 Guidance documents issued to date are available at http://www.commerce.wa.gov/site/1001/default.aspx . (S0065)265 UTC Docket UE-111016 available at http://www.utc.wa.gov/docs/Pages/DocketLookup.aspx?FilingID=111016
(S0066)
Section 7.5 Streamlined Permitting for Clean and Advanced Energy Technologies
2012 Washington State Energy Strategy page 156
furthermore it is in the state s interest to support our innovators by providing them theregulatory space to test new concepts.
This initiative begins as a research project consisting of a thorough mapping of thepermitting process a pilot energy project goes through at state agencies, including durationof each step. This mapping will be done in close collaboration with the Department ofEcology, the Department of Natural Resources, the Governor s Office of RegulatoryAssistance, the Energy Facility Site Evaluation Council and other agencies typicallyparticipating in project review. Next, Commerce will identify those steps that can bestreamlined in the case of pilot projects, once again with due respect for the special suite ofpossible environmental impacts associated with each class of technologies. Finally, in thosecases where Commerce and the regulating agencies can come to agreement onadjustments appropriate for pilot projects, Commerce will lead administrative, regulatory orlegislative steps necessary to enable an appropriate, streamlined process. Any legislationcalled for would be introduced in 2012 at the earliest.
Status: Work in this area is currently underway and a report is forthcoming. Many variableshave been discovered (especially for in stream and marine applications) and need to be workedthrough in order to propose potential solutions. Some applications will also require partnershipswith federal agencies.
H4F4F 9*%62=&!%.>*'$'2=&!%,+&a'*%,The permitting load associated with energy technology pilot projects could be vastly
reduced by designating one or more energy technology test zones in which pilot projectsunder a maximum size and within a certain class of technologies may be deployed withlimited permitting requirements that would still ensure environmental compliance. Recently,for example, the federal government opened a Solar Demonstration Zone located on Bureauof Land Management lands in Nevada. The concept is also similar to energy parksestablished at a few locations around the world that co-locate various energy research &development firms both to fertilize innovation among the inventors, as well as to allow easierdeployment of test facilities.
Given the relatively few examples in the United States, this initiative would also begin as aresearch project examining prior attempts to create energy test zones, the policies leadingto failure or success, and the landscape of local, state and federal laws in which such a testzone would need to be deployed. Commerce will simultaneously reach out to county andmunicipal governments to see if there is a willing, small-government partner, and reach outto firms innovating in the energy field who would have a strong interest in utilizing such azone. Outcomes of this research will lead to a more concrete policy recommendation in nextyear s Full Revision of the State Energy Strategy.
Status: Work in this area is currently underway and a report is forthcoming. Commerceidentified many variables (especially between land and water facilities) that need to be workedthrough in order to propose potential alternatives. An upland location could be pursued by thestate through use of a planned action or energy overlay zone approach. Projects that would fallwithin the scope of the predetermination could then proceed quickly. Projects that do not fall

Section 7.5 Streamlined Permitting for Clean and Advanced Energy Technologies
2012 Washington State Energy Strategy page 157
within the scope of the predetermination would require additional review, but only for theportions of the proposal not previously addressed. Some applications, especially for in-streamor marine projects, will require partnerships with federal agencies.
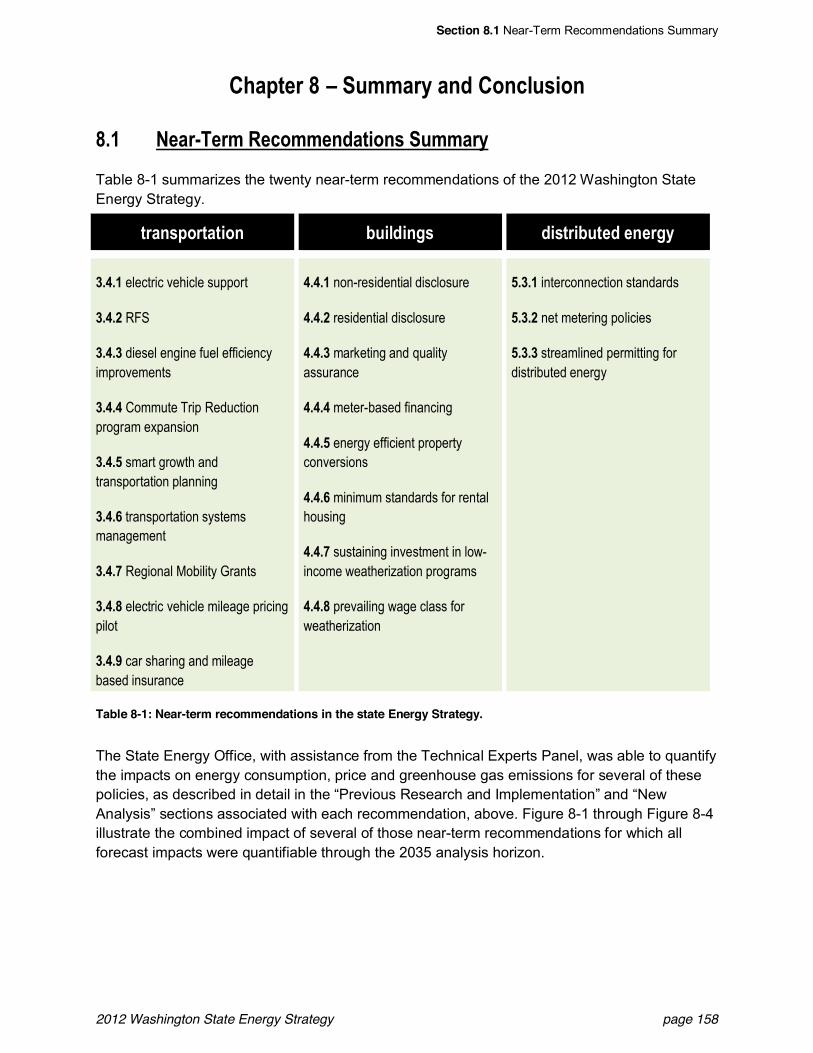
Section 8.1 Near-Term Recommendations Summary
2012 Washington State Energy Strategy page 158
)>"?+%6&I &<;33"6=&"*1&)'*.$;,5'*
I4@ W%"6X!%63&Q%.'33%*1"+5'*,&<;33"6=
Table 8-1 summarizes the twenty near-term recommendations of the 2012 Washington StateEnergy Strategy.
+6"*,?'6+"+5'* #;5$15*2, 15,+65#;+%1&%*%62=
D4E4@ electric vehicle support
D4E4A RFS
D4E4D diesel engine fuel efficiencyimprovements
D4E4E Commute Trip Reductionprogram expansion
D4E4F smart growth andtransportation planning
D4E4G transportation systemsmanagement
D4E4H Regional Mobility Grants
D4E4I electric vehicle mileage pricingpilot
D4E4J car sharing and mileagebased insurance
E4E4@ non-residential disclosure
E4E4A residential disclosure
E4E4D marketing and qualityassurance
E4E4E meter-based financing
E4E4F energy efficient propertyconversions
E4E4G minimum standards for rentalhousing
E4E4H sustaining investment in low-income weatherization programs
E4E4I prevailing wage class forweatherization
F4D4@ interconnection standards
F4D4A net metering policies
F4D4D streamlined permitting fordistributed energy
Table 8-1: Near-term recommendations in the state Energy Strategy.
The State Energy Office, with assistance from the Technical Experts Panel, was able to quantifythe impacts on energy consumption, price and greenhouse gas emissions for several of thesepolicies, as described in detail in the Previous Research and Implementation and NewAnalysis sections associated with each recommendation, above. Figure 8-1 through Figure 8-4illustrate the combined impact of several of those near-term recommendations for which allforecast impacts were quantifiable through the 2035 analysis horizon.
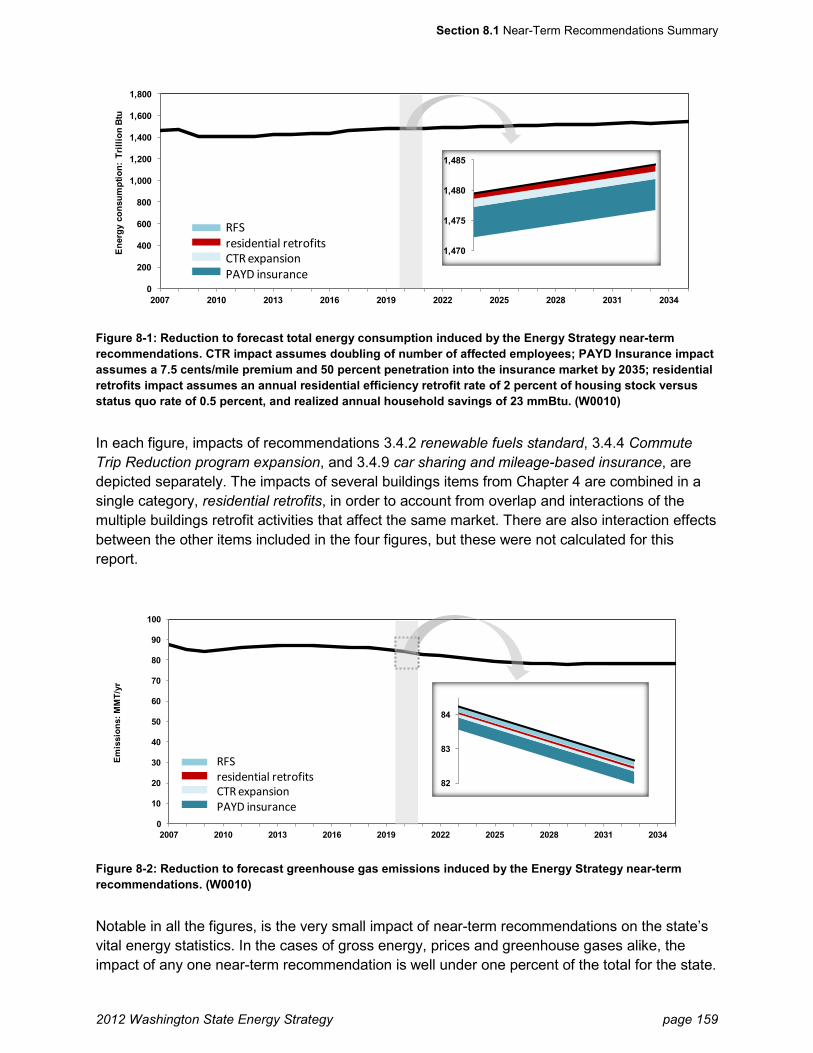
Section 8.1 Near-Term Recommendations Summary
2012 Washington State Energy Strategy page 159
Figure 8-1: Reduction to forecast total energy consumption induced by the Energy Strategy near-term recommendations. CTR impact assumes doubling of number of affected employees; PAYD Insurance impact assumes a 7.5 cents/mile premium and 50 percent penetration into the insurance market by 2035; residential retrofits impact assumes an annual residential efficiency retrofit rate of 2 percent of housing stock versus status quo rate of 0.5 percent, and realized annual household savings of 23 mmBtu. (W0010)
In each figure, impacts of recommendations 3.4.2 renewable fuels standard, 3.4.4 Commute Trip Reduction program expansion, and 3.4.9 car sharing and mileage-based insurance, are depicted separately. The impacts of several buildings items from Chapter 4 are combined in a single category, residential retrofits, in order to account from overlap and interactions of the multiple buildings retrofit activities that affect the same market. There are also interaction effects between the other items included in the four figures, but these were not calculated for this report.
Figure 8-2: Reduction to forecast greenhouse gas emissions induced by the Energy Strategy near-term recommendations. (W0010)
Notable in all the figures, is the very small impact of near-term recommendations on the state’s vital energy statistics. In the cases of gross energy, prices and greenhouse gases alike, the impact of any one near-term recommendation is well under one percent of the total for the state.
0
200
400
600
800
1,000
1,200
1,400
1,600
1,800
2007 2010 2013 2016 2019 2022 2025 2028 2031 2034
Ener
gy c
onsu
mpt
ion:
Tril
lion
Btu
RFSresidential retrofitsCTR expansionPAYD insurance
1,470
1,475
1,480
1,485
0
10
20
30
40
50
60
70
80
90
100
2007 2010 2013 2016 2019 2022 2025 2028 2031 2034
Emis
sion
s: M
MT/
yr
RFSresidential retrofitsCTR expansionPAYD insurance
82
83
84
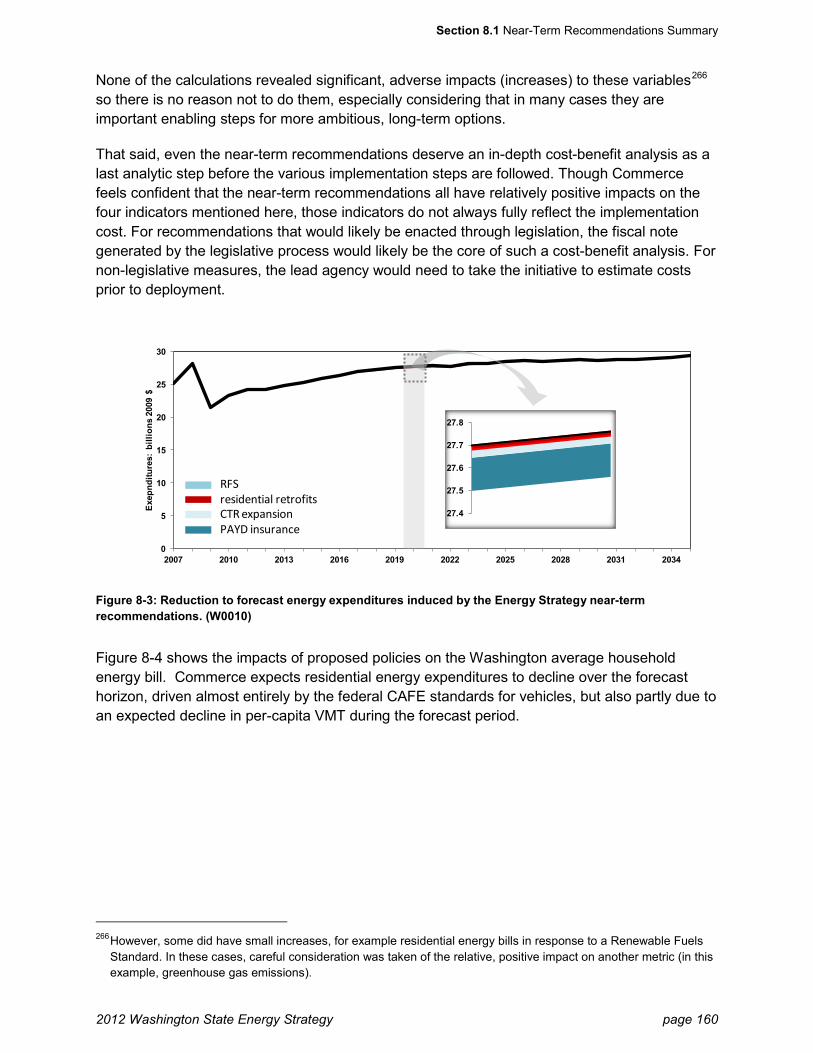
Section 8.1 Near-Term Recommendations Summary
2012 Washington State Energy Strategy page 160
None of the calculations revealed significant, adverse impacts (increases) to these variables266 so there is no reason not to do them, especially considering that in many cases they are important enabling steps for more ambitious, long-term options.
That said, even the near-term recommendations deserve an in-depth cost-benefit analysis as a last analytic step before the various implementation steps are followed. Though Commerce feels confident that the near-term recommendations all have relatively positive impacts on the four indicators mentioned here, those indicators do not always fully reflect the implementation cost. For recommendations that would likely be enacted through legislation, the fiscal note generated by the legislative process would likely be the core of such a cost-benefit analysis. For non-legislative measures, the lead agency would need to take the initiative to estimate costs prior to deployment.
Figure 8-3: Reduction to forecast energy expenditures induced by the Energy Strategy near-term recommendations. (W0010)
Figure 8-4 shows the impacts of proposed policies on the Washington average household energy bill. Commerce expects residential energy expenditures to decline over the forecast horizon, driven almost entirely by the federal CAFE standards for vehicles, but also partly due to an expected decline in per-capita VMT during the forecast period.
266 However, some did have small increases, for example residential energy bills in response to a Renewable Fuels
Standard. In these cases, careful consideration was taken of the relative, positive impact on another metric (in this example, greenhouse gas emissions).
0
5
10
15
20
25
30
2007 2010 2013 2016 2019 2022 2025 2028 2031 2034
Exep
nditu
res:
bill
ions
200
9 $
RFSresidential retrofitsCTR expansionPAYD insurance
27.4
27.5
27.6
27.7
27.8
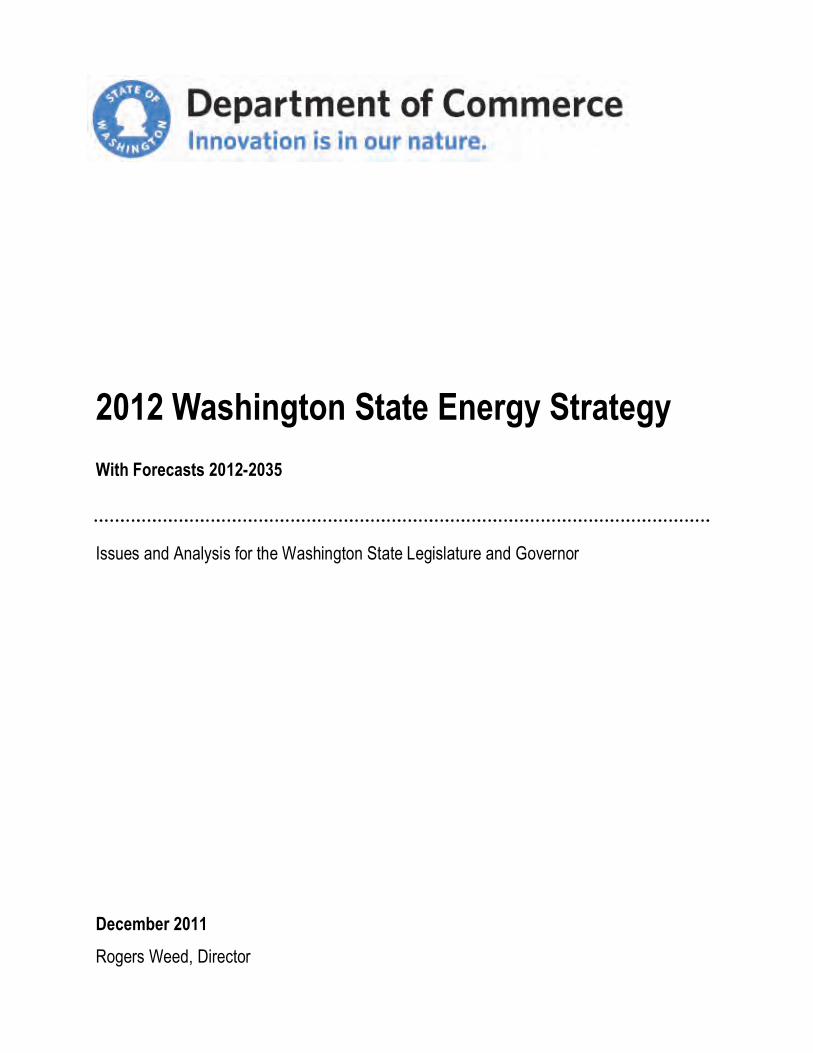
AN@A&P",>5*2+'*&<+"+%&9*%62=&<+6"+%2=P5+>&T'6%.",+,&AN@AXANDF
Issues and Analysis for the Washington State Legislature and Governor
8%.%3#%6&AN@@Rogers Weed, Director
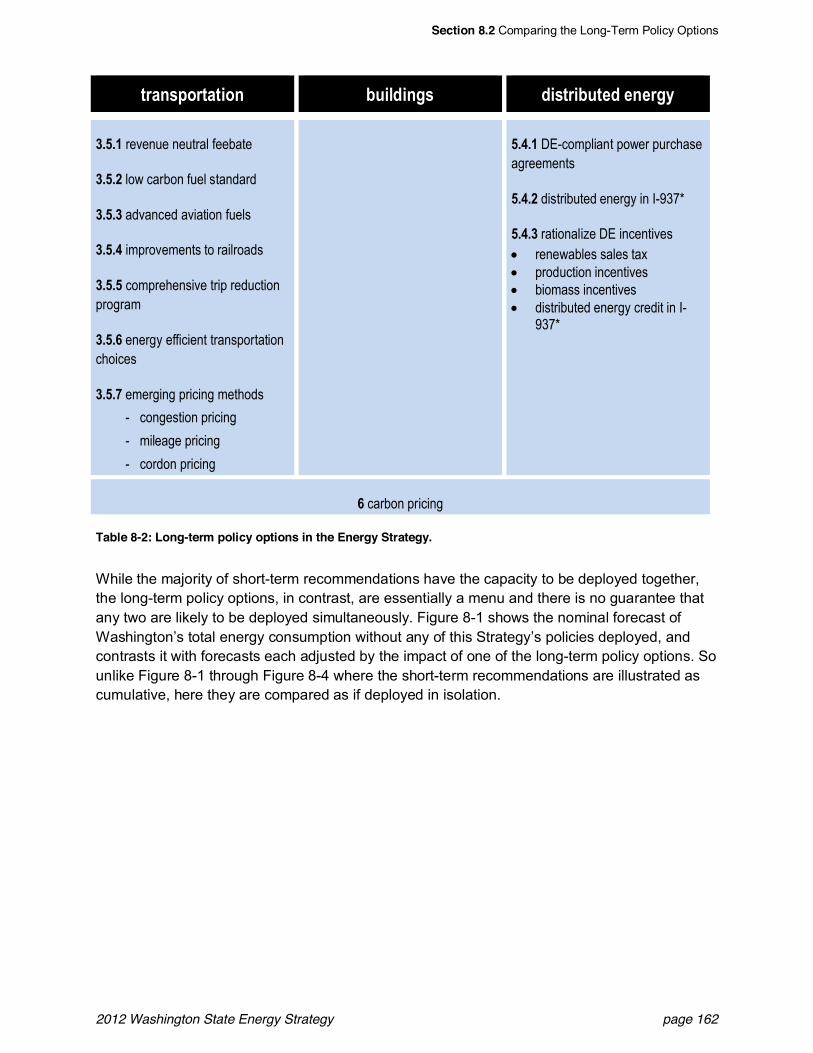
Section 8.2 Comparing the Long-Term Policy Options
2012 Washington State Energy Strategy page 162
+6"*,?'6+"+5'* #;5$15*2, 15,+65#;+%1&%*%62=
D4F4@ revenue neutral feebate
D4F4A low carbon fuel standard
D4F4D advanced aviation fuels
D4F4E improvements to railroads
D4F4F comprehensive trip reductionprogram
D4F4G energy efficient transportationchoices
D4F4H emerging pricing methods
- congestion pricing
- mileage pricing
- cordon pricing
F4E4@ DE-compliant power purchaseagreements
F4E4A distributed energy in I-937*
F4E4D rationalize DE incentives! renewables sales tax! production incentives! biomass incentives! distributed energy credit in I-
937*
G carbon pricing
Table 8-2: Long-term policy options in the Energy Strategy.
While the majority of short-term recommendations have the capacity to be deployed together,the long-term policy options, in contrast, are essentially a menu and there is no guarantee thatany two are likely to be deployed simultaneously. Figure 8-1 shows the nominal forecast ofWashington s total energy consumption without any of this Strategy s policies deployed, andcontrasts it with forecasts each adjusted by the impact of one of the long-term policy options. Sounlike Figure 8-1 through Figure 8-4 where the short-term recommendations are illustrated ascumulative, here they are compared as if deployed in isolation.
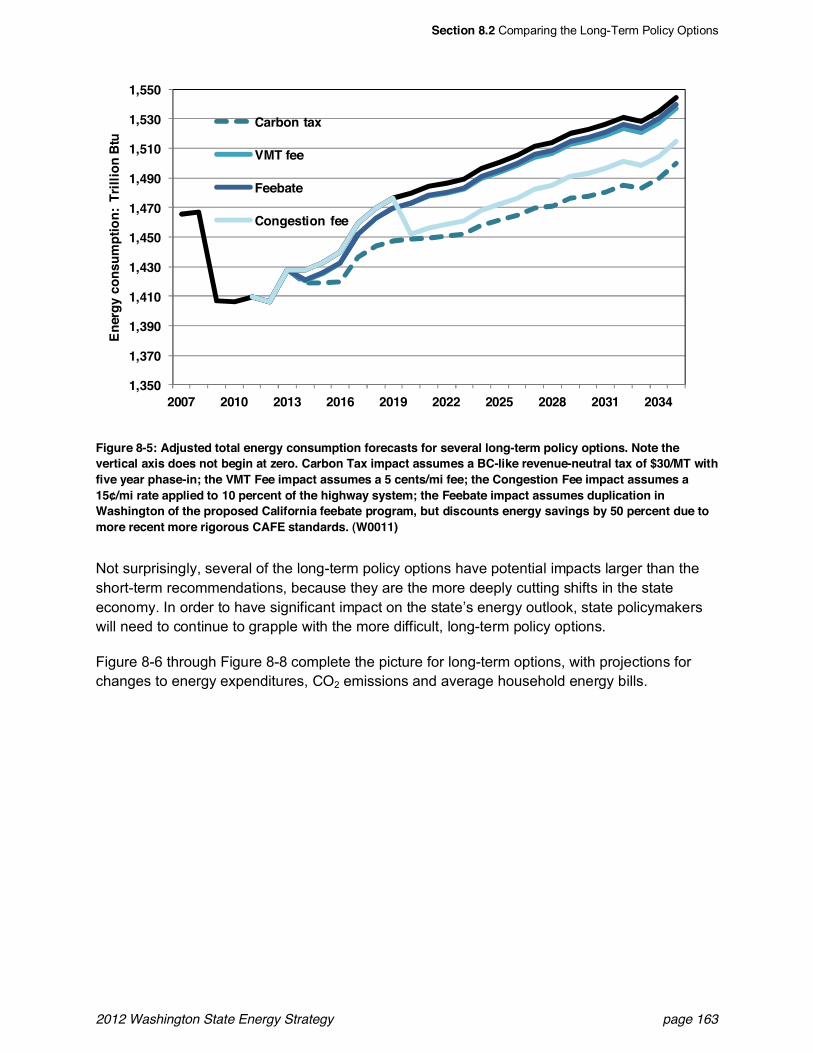
Section 8.2 Comparing the Long-Term Policy Options
2012 Washington State Energy Strategy page 163
Figure 8-5: Adjusted total energy consumption forecasts for several long-term policy options. Note thevertical axis does not begin at zero. Carbon Tax impact assumes a BC-like revenue-neutral tax of $30/MT withfive year phase-in; the VMT Fee impact assumes a 5 cents/mi fee; the Congestion Fee impact assumes a15¢/mi rate applied to 10 percent of the highway system; the Feebate impact assumes duplication inWashington of the proposed California feebate program, but discounts energy savings by 50 percent due tomore recent more rigorous CAFE standards. (W0011)
Not surprisingly, several of the long-term policy options have potential impacts larger than theshort-term recommendations, because they are the more deeply cutting shifts in the stateeconomy. In order to have significant impact on the state s energy outlook, state policymakerswill need to continue to grapple with the more difficult, long-term policy options.
Figure 8-6 through Figure 8-8 complete the picture for long-term options, with projections forchanges to energy expenditures, CO2 emissions and average household energy bills.
1,350
1,370
1,390
1,410
1,430
1,450
1,470
1,490
1,510
1,530
1,550
2007 2010 2013 2016 2019 2022 2025 2028 2031 2034
Ener
gy c
onsu
mpt
ion:
Tril
lion
Btu
Carbon tax
VMT fee
Feebate
Congestion fee
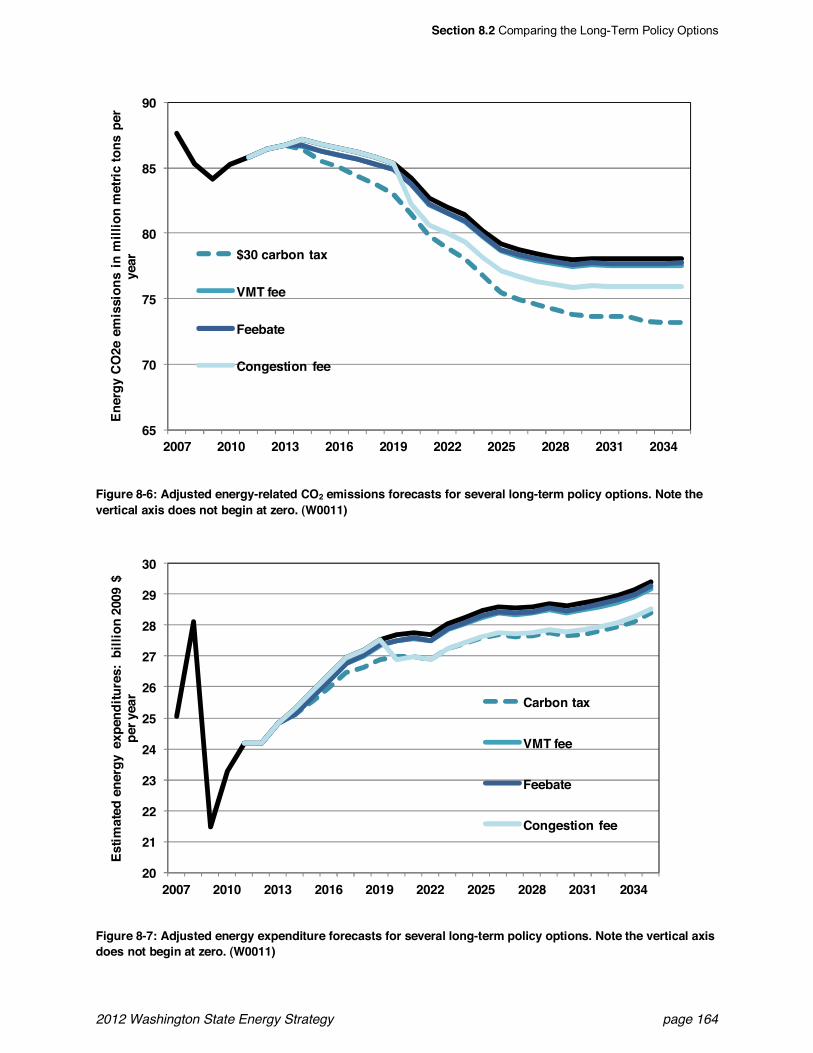
Section 8.2 Comparing the Long-Term Policy Options
2012 Washington State Energy Strategy page 164
Figure 8-6: Adjusted energy-related CO2 emissions forecasts for several long-term policy options. Note thevertical axis does not begin at zero. (W0011)
Figure 8-7: Adjusted energy expenditure forecasts for several long-term policy options. Note the vertical axisdoes not begin at zero. (W0011)
65
70
75
80
85
90
2007 2010 2013 2016 2019 2022 2025 2028 2031 2034
Ener
gy C
O2e
em
issi
ons
in m
illio
n m
etric
tons
per
year $30 carbon tax
VMT fee
Feebate
Congestion fee
20
21
22
23
24
25
26
27
28
29
30
2007 2010 2013 2016 2019 2022 2025 2028 2031 2034
Estim
ated
ene
rgy
expe
nditu
res:
bill
ion
2009
$pe
r yea
r Carbon tax
VMT fee
Feebate
Congestion fee
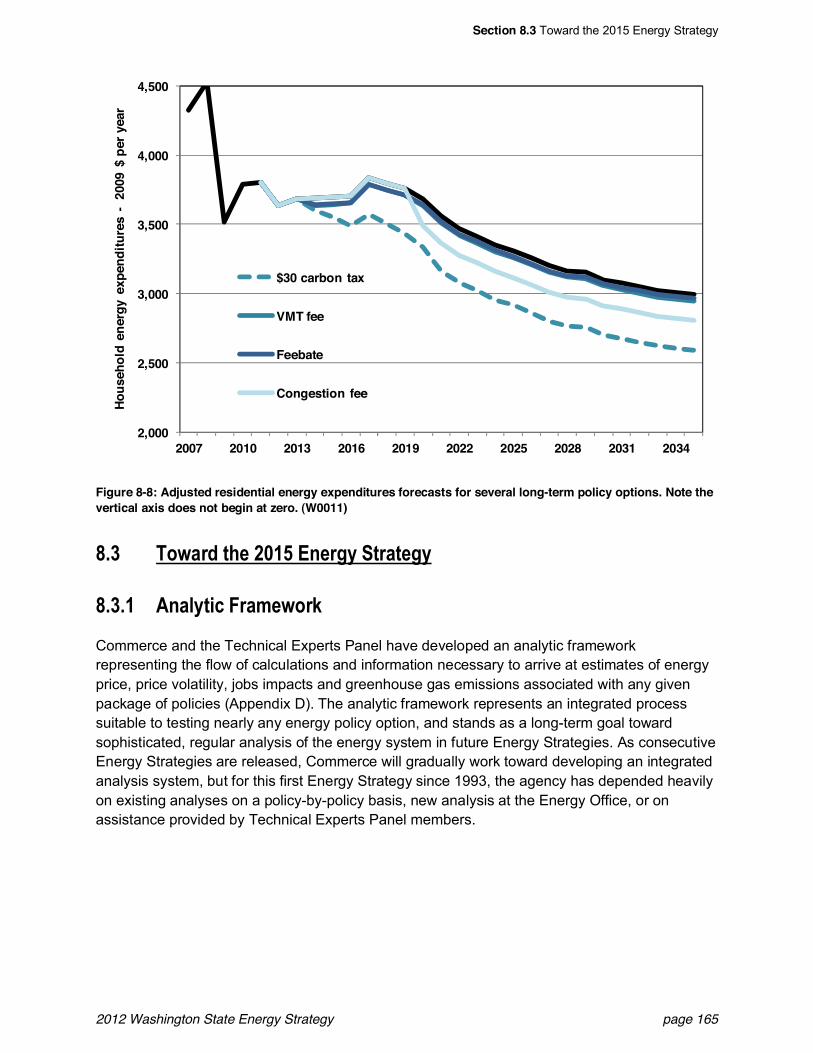
Section 8.3 Toward the 2015 Energy Strategy
2012 Washington State Energy Strategy page 165
Figure 8-8: Adjusted residential energy expenditures forecasts for several long-term policy options. Note thevertical axis does not begin at zero. (W0011)
I4D !'0"61&+>%&AN@F&9*%62=&<+6"+%2=
I4D4@ -*"$=+5.&T6"3%0'6/
Commerce and the Technical Experts Panel have developed an analytic frameworkrepresenting the flow of calculations and information necessary to arrive at estimates of energyprice, price volatility, jobs impacts and greenhouse gas emissions associated with any givenpackage of policies (Appendix D). The analytic framework represents an integrated processsuitable to testing nearly any energy policy option, and stands as a long-term goal towardsophisticated, regular analysis of the energy system in future Energy Strategies. As consecutiveEnergy Strategies are released, Commerce will gradually work toward developing an integratedanalysis system, but for this first Energy Strategy since 1993, the agency has depended heavilyon existing analyses on a policy-by-policy basis, new analysis at the Energy Office, or onassistance provided by Technical Experts Panel members.
2,000
2,500
3,000
3,500
4,000
4,500
2007 2010 2013 2016 2019 2022 2025 2028 2031 2034
Hous
ehol
d en
ergy
exp
endi
ture
s-
2009
$ p
er y
ear
$30 carbon tax
VMT fee
Feebate
Congestion fee
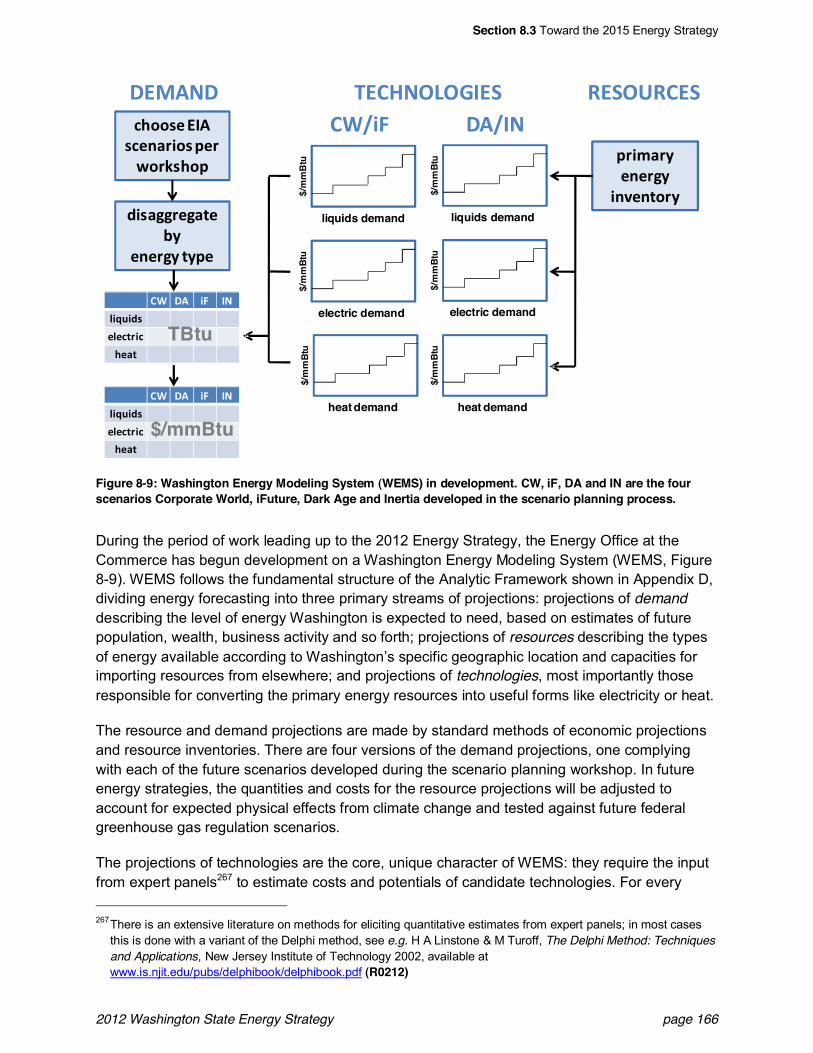
Section 8.3 Toward the 2015 Energy Strategy
2012 Washington State Energy Strategy page 166
Figure 8-9: Washington Energy Modeling System (WEMS) in development. CW, iF, DA and IN are the fourscenarios Corporate World, iFuture, Dark Age and Inertia developed in the scenario planning process.
During the period of work leading up to the 2012 Energy Strategy, the Energy Office at theCommerce has begun development on a Washington Energy Modeling System (WEMS, Figure8-9). WEMS follows the fundamental structure of the Analytic Framework shown in Appendix D,dividing energy forecasting into three primary streams of projections: projections of demanddescribing the level of energy Washington is expected to need, based on estimates of futurepopulation, wealth, business activity and so forth; projections of resources describing the typesof energy available according to Washington s specific geographic location and capacities forimporting resources from elsewhere; and projections of technologies, most importantly thoseresponsible for converting the primary energy resources into useful forms like electricity or heat.
The resource and demand projections are made by standard methods of economic projectionsand resource inventories. There are four versions of the demand projections, one complyingwith each of the future scenarios developed during the scenario planning workshop. In futureenergy strategies, the quantities and costs for the resource projections will be adjusted toaccount for expected physical effects from climate change and tested against future federalgreenhouse gas regulation scenarios.
The projections of technologies are the core, unique character of WEMS: they require the inputfrom expert panels267 to estimate costs and potentials of candidate technologies. For every
267 There is an extensive literature on methods for eliciting quantitative estimates from expert panels; in most casesthis is done with a variant of the Delphi method, see e.g. H A Linstone & M Turoff, The Delphi Method: Techniquesand Applications, New Jersey Institute of Technology 2002, available atwww.is.njit.edu/pubs/delphibook/delphibook.pdf (R0212)
+@((/.0>IJ/+.2)A1(/08.AK(AL/@(8
91/)CCA.C)'.:;
.2.AC;0';8.
M>NJOM 4>3PO7Q7=I>R 5>R7S53>R3TU1V MJUIO
3T MJ 1V IO
*1W-19/
.*.+'A1+
@.)'
8A1,)A;.2.AC;
12?.2'(A;$/m
mB
tu
liquids demand
$/m
mBt
u
electric demand$/
mm
Btu
liquids demand
$/m
mBt
u
heat demand
$/m
mBt
u
electric demand
$/m
mBt
u
heat demand3T MJ 1V IO
*1W-19/
.*.+'A1+
@.)'
TBtu
$/mmBtu
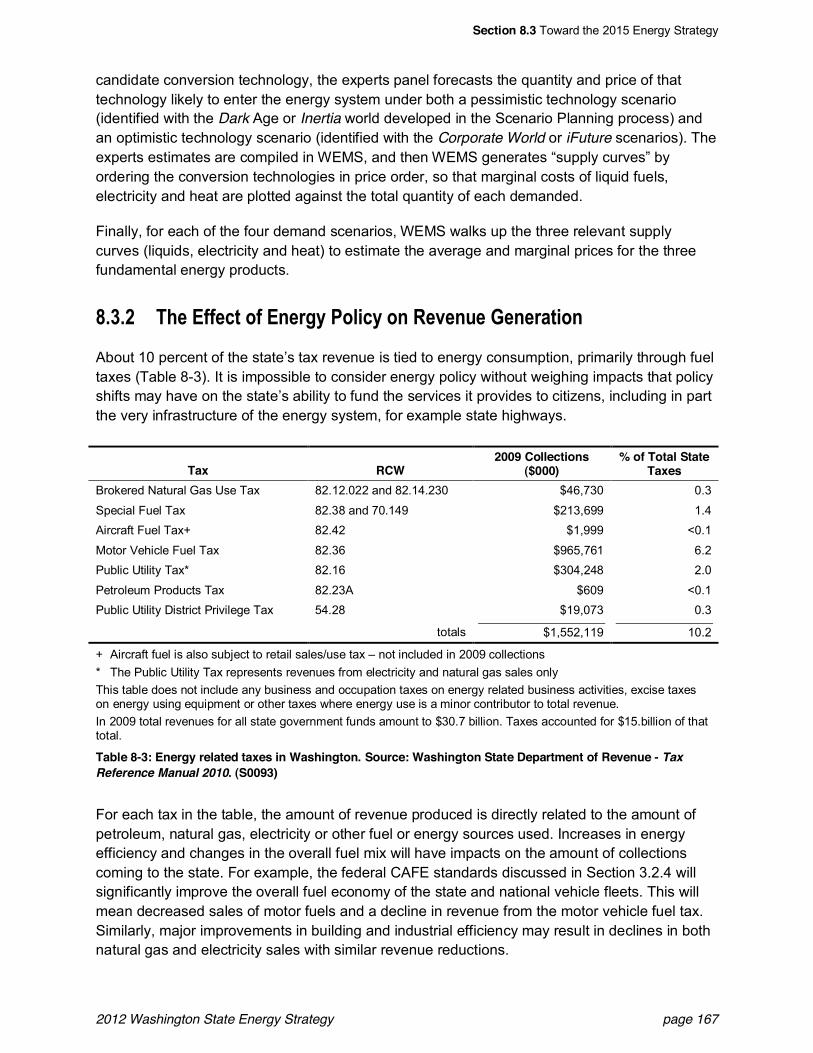
Section 8.3 Toward the 2015 Energy Strategy
2012 Washington State Energy Strategy page 167
candidate conversion technology, the experts panel forecasts the quantity and price of thattechnology likely to enter the energy system under both a pessimistic technology scenario(identified with the Dark Age or Inertia world developed in the Scenario Planning process) andan optimistic technology scenario (identified with the Corporate World or iFuture scenarios). Theexperts estimates are compiled in WEMS, and then WEMS generates supply curves byordering the conversion technologies in price order, so that marginal costs of liquid fuels,electricity and heat are plotted against the total quantity of each demanded.
Finally, for each of the four demand scenarios, WEMS walks up the three relevant supplycurves (liquids, electricity and heat) to estimate the average and marginal prices for the threefundamental energy products.
I4D4A !>%&9((%.+&'(&9*%62=&C'$5.=&'*&Q%7%*;%&S%*%6"+5'*
About 10 percent of the state s tax revenue is tied to energy consumption, primarily through fueltaxes (Table 8-3). It is impossible to consider energy policy without weighing impacts that policyshifts may have on the state s ability to fund the services it provides to citizens, including in partthe very infrastructure of the energy system, for example state highways.
Tax RCW2009 Collections
($000)% of Total State
TaxesBrokered Natural Gas Use Tax 82.12.022 and 82.14.230 $46,730 0.3Special Fuel Tax 82.38 and 70.149 $213,699 1.4Aircraft Fuel Tax+ 82.42 $1,999 <0.1Motor Vehicle Fuel Tax 82.36 $965,761 6.2Public Utility Tax* 82.16 $304,248 2.0Petroleum Products Tax 82.23A $609 <0.1Public Utility District Privilege Tax 54.28 $19,073 0.3
totals $1,552,119 10.2
+ Aircraft fuel is also subject to retail sales/use tax not included in 2009 collections* The Public Utility Tax represents revenues from electricity and natural gas sales onlyThis table does not include any business and occupation taxes on energy related business activities, excise taxeson energy using equipment or other taxes where energy use is a minor contributor to total revenue.In 2009 total revenues for all state government funds amount to $30.7 billion. Taxes accounted for $15.billion of thattotal.
Table 8-3: Energy related taxes in Washington. Source: Washington State Department of Revenue - TaxReference Manual 2010. (S0093)
For each tax in the table, the amount of revenue produced is directly related to the amount ofpetroleum, natural gas, electricity or other fuel or energy sources used. Increases in energyefficiency and changes in the overall fuel mix will have impacts on the amount of collectionscoming to the state. For example, the federal CAFE standards discussed in Section 3.2.4 willsignificantly improve the overall fuel economy of the state and national vehicle fleets. This willmean decreased sales of motor fuels and a decline in revenue from the motor vehicle fuel tax.Similarly, major improvements in building and industrial efficiency may result in declines in bothnatural gas and electricity sales with similar revenue reductions.
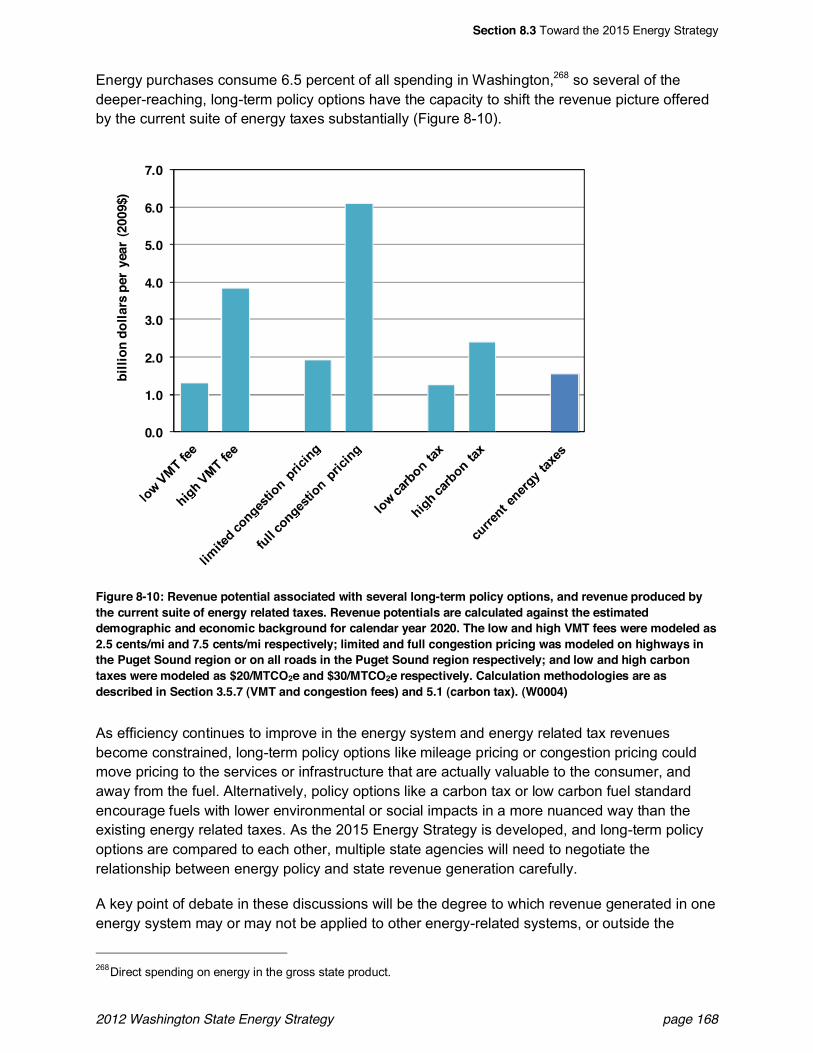
Section 8.3 Toward the 2015 Energy Strategy
2012 Washington State Energy Strategy page 168
Energy purchases consume 6.5 percent of all spending in Washington,268 so several of thedeeper-reaching, long-term policy options have the capacity to shift the revenue picture offeredby the current suite of energy taxes substantially (Figure 8-10).
Figure 8-10: Revenue potential associated with several long-term policy options, and revenue produced bythe current suite of energy related taxes. Revenue potentials are calculated against the estimateddemographic and economic background for calendar year 2020. The low and high VMT fees were modeled as2.5 cents/mi and 7.5 cents/mi respectively; limited and full congestion pricing was modeled on highways inthe Puget Sound region or on all roads in the Puget Sound region respectively; and low and high carbontaxes were modeled as $20/MTCO2e and $30/MTCO2e respectively. Calculation methodologies are asdescribed in Section 3.5.7 (VMT and congestion fees) and 5.1 (carbon tax). (W0004)
As efficiency continues to improve in the energy system and energy related tax revenuesbecome constrained, long-term policy options like mileage pricing or congestion pricing couldmove pricing to the services or infrastructure that are actually valuable to the consumer, andaway from the fuel. Alternatively, policy options like a carbon tax or low carbon fuel standardencourage fuels with lower environmental or social impacts in a more nuanced way than theexisting energy related taxes. As the 2015 Energy Strategy is developed, and long-term policyoptions are compared to each other, multiple state agencies will need to negotiate therelationship between energy policy and state revenue generation carefully.
A key point of debate in these discussions will be the degree to which revenue generated in oneenergy system may or may not be applied to other energy-related systems, or outside the
268 Direct spending on energy in the gross state product.
0.0
1.0
2.0
3.0
4.0
5.0
6.0
7.0
billi
on d
olla
rs p
er y
ear
(200
9$)
Section 8.3 Toward the 2015 Energy Strategy
2012 Washington State Energy Strategy page 169
energy system entirely. Can congestion fees on roads be used to fund transit systems thatrelieve the congestion? Can carbon taxes be returned to consumers, and, if so, how shouldthose returns be allocated? Can mileage fees be used to displace other revenue sources of thestate s general fund, e.g., sales taxes? All of these are difficult questions, but they must befaced head-on if the state is to make significant cuts in energy costs or emissions beyond theincremental steps made in the short-term recommendations. This is a volatile political issue, asevidenced by the existence of an amendment to the Washington State Constitution prohibitingthe use of certain fuel and vehicle taxes for non-road uses.269
As this Energy Strategy goes to press the Governor s Connecting Washington task force is atwork balancing these interests, and many others, to craft transportation financingrecommendations for the 2012 Legislature.270
I4D4D <?%.5"$&!'?5.,
Several special topics have received interest from the Advisory Committee and otherstakeholders, but did not receive significant attention in the three focus areas chosen for the2012 release of the Energy Strategy. Commerce will consider, among many other topics, thesefor extended attention in 2015:
! Safety and Security Protection of Washingtonians safety and security was suggested byseveral stakeholders as a presumptive goal for the Energy Strategy; it was not included inthe three goals or nine principles cited in the enabling legislation. Energy security is alreadyhandled separately in the Washington State Energy Assurance and EmergencyPreparedness Plan and in the Washington State Sector Specific Plan for Critical EnergyInfrastructure.271 Still, members of the Advisory Committee and staff at Commerce foundsafety and security to be a very reasonable additional goal for the Energy Strategy, andCommerce will attempt to include analyses of safety and security among the supportingwork in future energy strategies.
! Nuclear Energy Washington s long and complex history with nuclear energy makes thestate rich with nuclear energy boosters and opponents alike, so Commerce has heardstrong words about nuclear energy from both sides during the 2012 Energy Strategyprocess. Research at Pacific Northwest National Laboratory and a few private firms such asTerraPower and, of course, Energy Northwest s operating nuclear plant, support a healthypopulation of topic experts with which Washington may be able to make some well-considered policy decisions regarding nuclear energy. The topic was not considered in detailfor the 2012 Energy Strategy as it did not fall within any of the three areas (Transportation,Buildings, Distributed Energy) chosen for deeper treatment.
! Renewables Integration and Energy Storage With new, large contributions from wind tothe state s electric generation, integration of intermittent renewable energy into the grid hasbecome a topic of intensive interest and discussion. It was not treated in the 2012 Energy
269 Const. art. II, § 40. Art.II §40 was approved as Amendment 18 to the state constitution in November 1944.270 http://www.governor.wa.gov/priorities/transportation/connectwa.asp271 Both documents are updated periodically and available for download at
http://www.commerce.wa.gov/site/975/default.aspx. (S0089) (S0090)
Section 8.3 Toward the 2015 Energy Strategy
2012 Washington State Energy Strategy page 170
Strategy because the Clean Energy Leadership Council launched an effort on this frontseparately and it did not fall into one of the three focus areas. Pacific Northwest NationalLaboratory is an important research center of energy storage,272 and many businesses inWashington are developing energy storage and related technologies. Recent new laws inTexas273 and California274 will serve as important learning experiences on which Washingtoncan build sound energy storage policy in the future.
! Smart Grid Smart grid refers to the application of modern technologies to the electricgeneration, delivery and demand infrastructure. A few possible components of smart gridare:
-- support for demand response technologies;
-- grid resilience through sophisticated design and monitoring (e.g. synchrophasors);
-- support for distributed energy;
-- real-time consumer price signals; and
-- increased energy storage.
Many definitions of smart grid exist, and other components besides those listed may beconsidered essential by some parties. Washington has a strong reputation for technologydevelopment, so it is considered an excellent candidate for smart grid technology researchand business development, as well as for deployment.
! Comprehensive Amendment of I-937 Washington s renewable portfolio standard, I-937,has been the subject of much debate since its passage in 2006. Topics of contention rangewidely, including among others defining which renewables count toward the portfolio target;mechanisms to ease financial pressures on utilities with flat or declining load growth; andrules surrounding awarding and trade of renewable energy credits. The Advisory Committeeacknowledged that many of these difficult issues were being addressed by negotiationspreceding the 2012 legislative session, and deferred legal recommendations to thoseforums. Some clarification of definitions was possible without statutory changes, and thesehave been tackled in the 2011 Energy Strategy Update, using the pre-qualification processdescribed in Section 7.5.3 of this report. If solutions to the deeper issues surrounding I-937do not appear out of the legislative negotiations, a future Energy Strategy may undertake topropose a comprehensive amendment to the renewable portfolio standard.
! Waste-to-Energy Exciting opportunities to integrate waste management with clean energyproduction, transportation and food systems are beginning to emerge. Many of these offersignificant reductions in greenhouse gas emissions, creative solutions to air and waterquality concerns, and additional revenue streams, especially in rural economies. Growingcollaborations between research institutions, private technology providers and public
272 See, e.g., Z Yang et al, Electrochemical Energy Storage for Green Grid, Chemical Reviews 111 (2011) pp.3577-3613 and M Kintner-Meyer et al, Energy Storage for Power Systems Applications: A Regional Assessment for theNorthwest Power Pool (NWPP), Pacific Northwest National Laboratory 2010. (R0161)
273 Senate Bill 943, 2011 regular session. Rulemaking is being handled by the Public Utility Commission of Texas, seehttp://www.puc.state.tx.us/industry/projects/rules/39657/39657.aspx. (R0213)
274 Assembly Bill 2514, 2010 regular session. Rulemaking is being handled by the California Public UtilitiesCommission, see http://www.cpuc.ca.gov/PUC/energy/electric/storage.htm. (R0214)
Section 8.4 Conclusion
2012 Washington State Energy Strategy page 171
infrastructure managers are identifying pathways uniquely tailored to Washington Statefeedstocks and process technologies. From advanced drop-in biofuels for aviation and otherforms of transportation to nutrient recovery and high-value precursor chemicals, waste-to-energy projects are realizing greater efficiencies in electrical and thermal generation whilealso displacing fossil fuel-based products throughout many sectors of the state s economy.With ongoing efforts at many state and federal research institutions, Ecology s ongoingreview of solid waste rules, and strong interest in the emerging field of green chemistry,development of waste-to-energy projects will require ongoing coordination and acomprehensive review of related state regulatory and incentive programs to realize their fullpotential.
! System Benefit Charge Several states levy a system benefit charge to utility customers.The revenues from the charge are pooled in a dedicated fund that can be used, dependingon the law that created it, to provide assistance to low-income customers, implement energyefficiency measures, deploy demand side management measures, or find other ways toimprove the energy system that accrue to energy customers on a statewide basis. Since asystem benefit charge is simply a financing mechanism, any proposal for one in a futureEnergy Strategy will need to be tied to a concrete proposal for directing the funds receivedin a way constructive to the Energy Strategy goals.
The topics listed in this section highlight those that received particularly high AdvisoryCommittee or stakeholder attention. Of course, the Policy Options document (Appendix C) listswell over 100 additional policy focuses that will be given renewed attention in the early phasesof the 2015 Energy Strategy.
I4E )'*.$;,5'*Washington has a reliable and cost-effective system of producing and delivering energy for itshomes, businesses, factories and vehicles. Citizens of the state can rightfully take pride in theenergy resources developed here by industry and government. Whether it s as big as the GrandCoulee Dam or as small as an electric vehicle charging station along Highway 2, Washingtonhas met the need for energy resources as its economy has developed and prospered. However,as strong as this foundation is, it will not be enough to meet the energy needs of the future. Thestate must squeeze more out of its energy resources in order to meet the need for clean energyjob growth, fair and competitive energy prices, and a substantial reduction in greenhouseemissions.
This 2012 Washington State Energy Strategy provides guidance for this necessarytransformation, starting with transportation, the state s biggest and least efficient energyconsumption sector. The Energy Strategy shows how Washington can make progress bybuilding the infrastructure for significantly more efficient vehicles, by improving motor fuels tolower their greenhouse gas impact, and by helping citizens accomplish more with fewer tripsand travel miles. In the residential and commercial sectors, the Energy Strategy offersmeasures to transform the way energy is used in buildings. Greater energy efficiency requiresinformation and investment. It brings jobs, especially in the construction industry, moredisposable income and a stronger local economy.
Section 8.4 Conclusion
2012 Washington State Energy Strategy page 172
On the energy supply side, this strategy guides Washington toward a less centralized and morediverse energy portfolio. There is currently great interest in small-scale renewable energyprojects and that interest will grow with technological breakthroughs and fossil fuel priceincreases.
As the state implements the 2012 Washington State Energy Strategy, it would be easy to focusexclusively on the near-term action items. The near-term recommendations present anambitious agenda, one that requires the concerted effort of many stakeholders in the public andprivate sectors. However, there are fundamental policy questions raised in this strategy thatshould be answered if the state is to maintain progress over the long-term. Examples includecarbon pricing, land use planning and utility resource portfolio requirements. What mustWashington do to ensure a future with clean energy jobs, fair energy prices, and a stableclimate?
Related Documents