W8 8.3 Aggregate Planning, Material Requirement Planning, and Capacity Planning Operations Management © Ana G. Méndez University System, 2012. All rights reserved.

W8 8.3 Aggregate Planning, Material Requirement Planning, and Capacity Planning Operations Management © Ana G. Méndez University System, 2012. All rights.
Dec 25, 2015
Welcome message from author
This document is posted to help you gain knowledge. Please leave a comment to let me know what you think about it! Share it to your friends and learn new things together.
Transcript
W8 8.3Aggregate Planning, Material Requirement
Planning, and Capacity Planning
Operations ManagementOperations
Management
© Ana G. Méndez University System, 2012. All rights reserved.
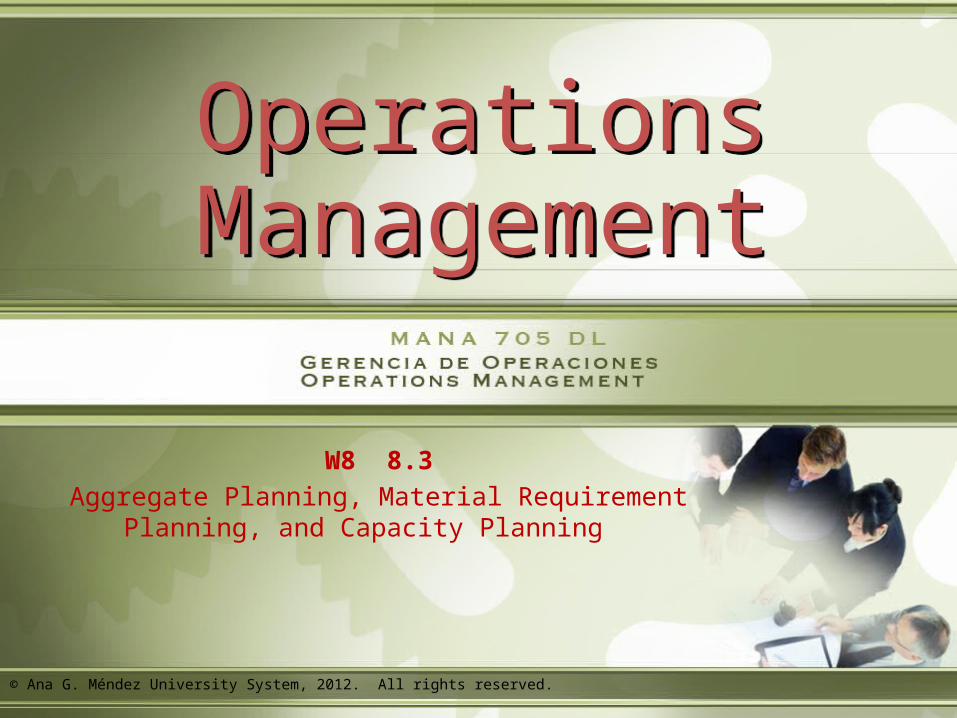
Aggregate Planning Process What is Aggregate Planning? Strategies for Aggregate Planning
Material Requirement Planning (MRP)What is MRP?Dependent Inventory Model Requirements MRP StructureLot-Sizing TechniquesMRP II Closed Loop and Capacity PlanningBreakeven Point
Outline for Workshop Eight
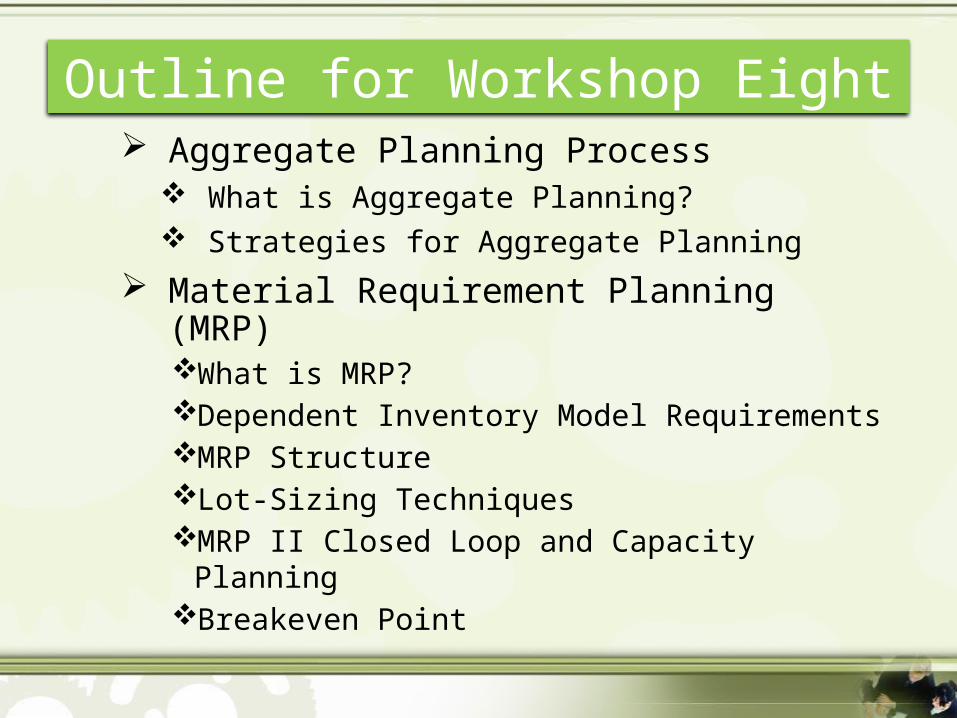
Specific Objectives for Workshop EightAt the end of the workshop, you will be able to:
1. Define aggregate planning.2. Identify strategies for developing an aggregate plan.3. Understand the graphical and mathematical planning of
other aggregate plans.4. Describe Material Requirement planning (MRP) and how to
build the product structure, the gross requirements plan, the net requirements plan and lot sizes for lot, and EOQ.
5. Describe Material Resource Planning (MRP II) and the closed loop.
6. Define Capacity Planning (CP), Capacity Requirement Planning (CRP), design capacity, effective capacity, utilization and efficiency.
7. Identify and compute break even.
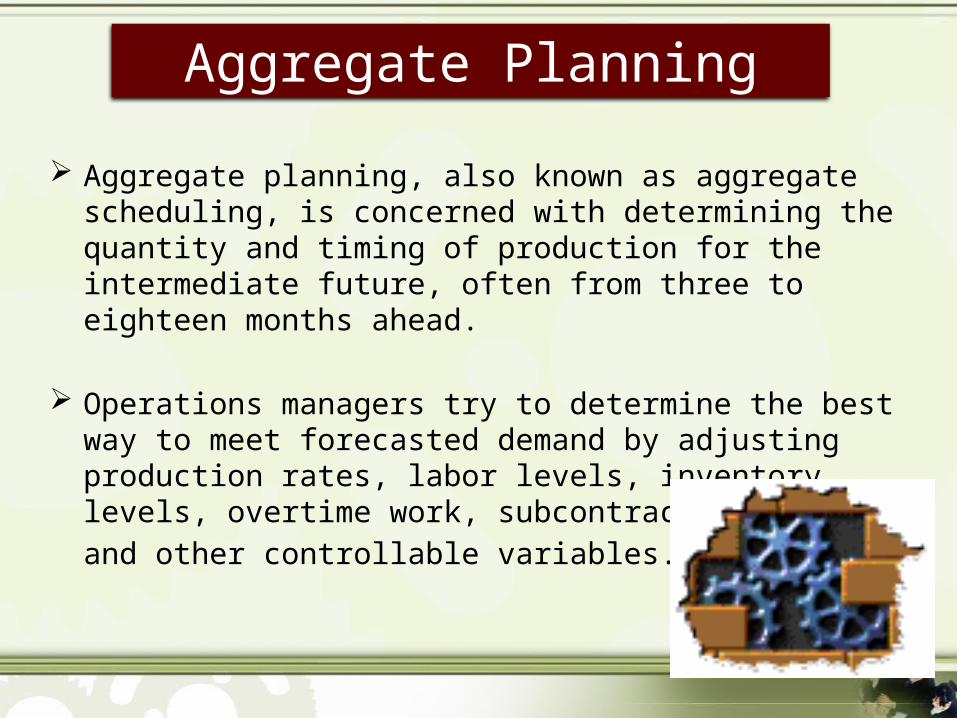
Aggregate planning, also known as aggregate scheduling, is concerned with determining the quantity and timing of production for the intermediate future, often from three to eighteen months ahead.
Operations managers try to determine the best way to meet forecasted demand by adjusting production rates, labor levels, inventory levels, overtime work, subcontracting rates, and other controllable variables.
Aggregate Planning
a
I am not a business major so I am not certain if this should be imediate instead of intermediate.
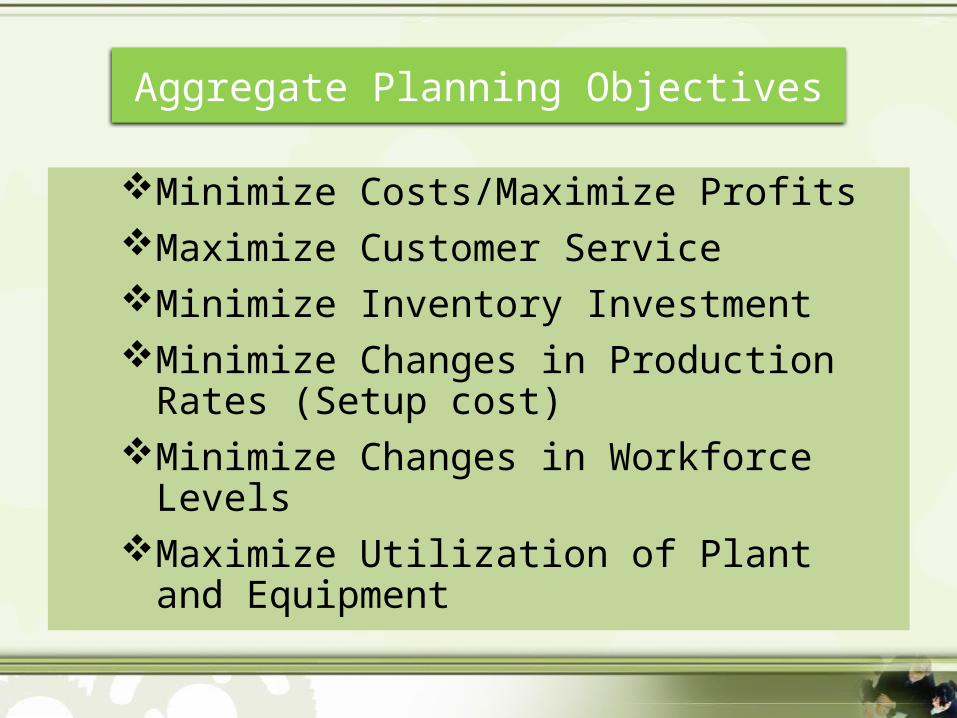
Aggregate Planning Objectives
Minimize Costs/Maximize ProfitsMaximize Customer ServiceMinimize Inventory InvestmentMinimize Changes in Production Rates
(Setup cost)Minimize Changes in Workforce LevelsMaximize Utilization of Plant and
Equipment
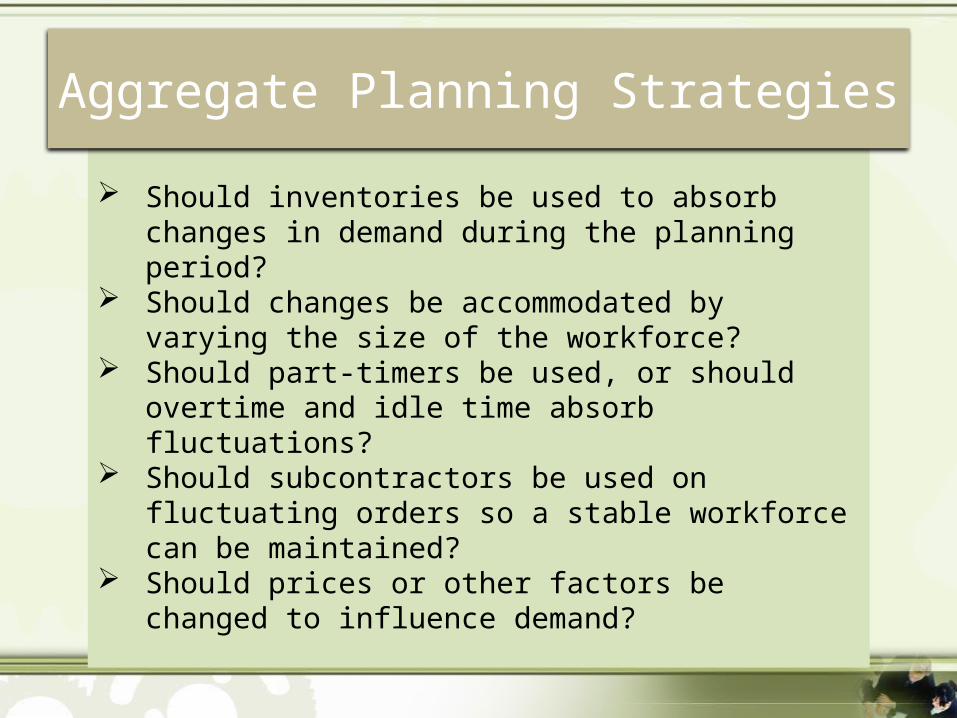
Should inventories be used to absorb changes in demand during the planning period?
Should changes be accommodated by varying the size of the workforce?
Should part-timers be used, or should overtime and idle time absorb fluctuations?
Should subcontractors be used on fluctuating orders so a stable workforce can be maintained?
Should prices or other factors be changed to influence demand?
Aggregate Planning Strategies
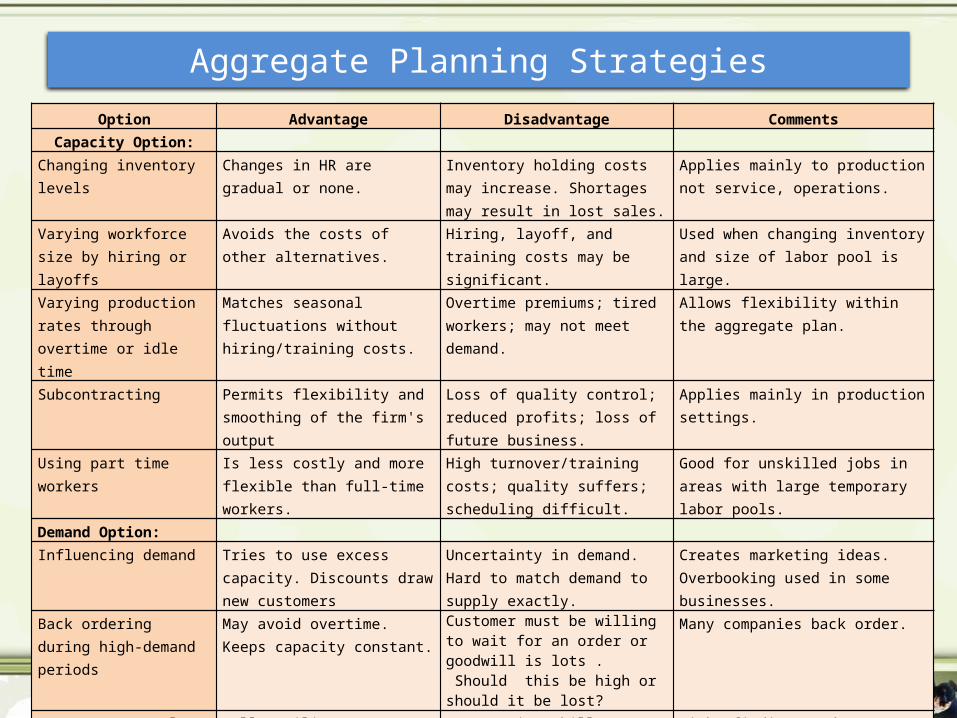
Option Advantage Disadvantage CommentsCapacity Option:
Changing inventory levels
Changes in HR are gradual or none.
Inventory holding costs may increase. Shortages may result in lost sales.
Applies mainly to production not service, operations.
Varying workforce size by hiring or layoffs
Avoids the costs of other alternatives.
Hiring, layoff, and training costs may be significant.
Used when changing inventory and size of labor pool is large.
Varying production rates through overtime or idle time
Matches seasonal fluctuations without hiring/training costs.
Overtime premiums; tired workers; may not meet demand.
Allows flexibility within the aggregate plan.
Subcontracting Permits flexibility and smoothing of the firm's output
Loss of quality control; reduced profits; loss of future business.
Applies mainly in production settings.
Using part time workers
Is less costly and more flexible than full-time workers.
High turnover/training costs; quality suffers; scheduling difficult.
Good for unskilled jobs in areas with large temporary labor pools.
Demand Option:
Influencing demand Tries to use excess capacity. Discounts draw new customers
Uncertainty in demand. Hard to match demand to supply exactly.
Creates marketing ideas. Overbooking used in some businesses.
Back ordering during high-demand periods
May avoid overtime. Keeps capacity constant.
Customer must be willing to wait for an order or goodwill is lots . Should this be high or should it be lost?
Many companies back order.
Counter seasonal product and service mixing
Fully utilizes resources; allows stable workforce.
May require skills or equipment outside firm's areas of expertise.
Risky finding products or services with opposite demand patterns.
Aggregate Planning Strategies
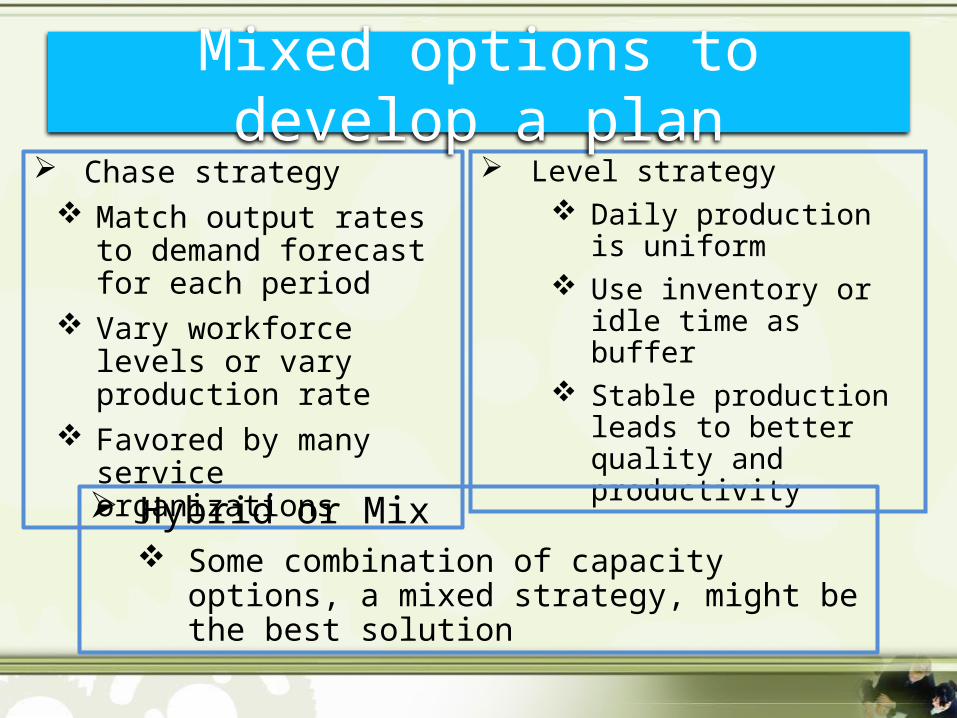
Chase strategy Match output rates to
demand forecast for each period
Vary workforce levels or vary production rate
Favored by many service organizations
Level strategy Daily production is
uniform Use inventory or idle
time as buffer Stable production
leads to better quality and productivity
Hybrid or Mix Some combination of capacity options, a
mixed strategy, might be the best solution
Mixed options to develop a plan
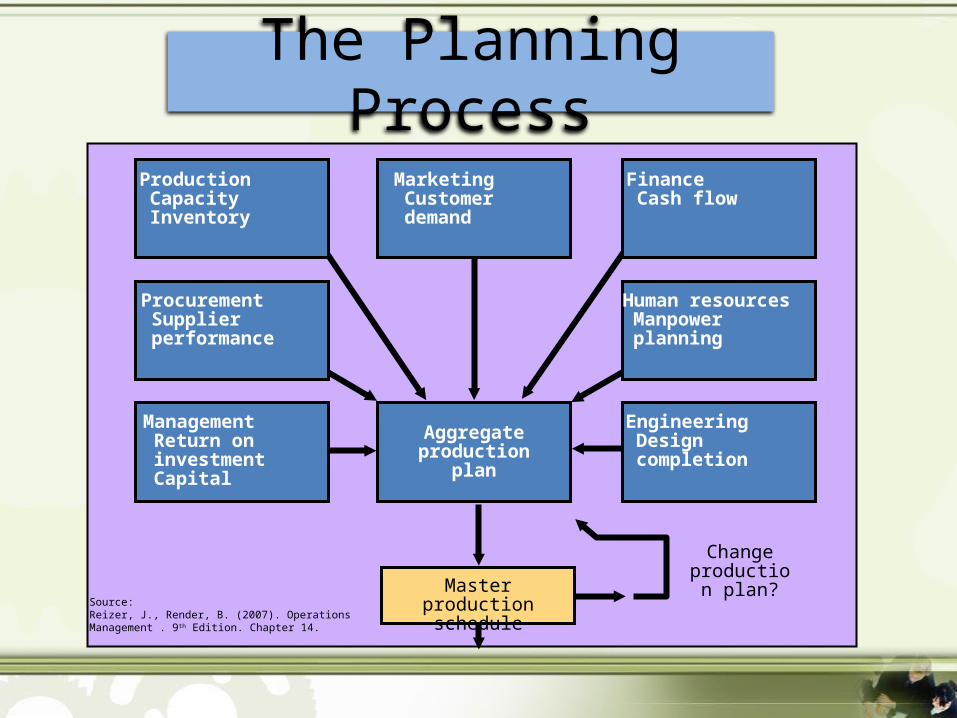
Change production
plan?Master production schedule
ManagementReturn oninvestmentCapital
EngineeringDesigncompletion
Aggregate production
plan
ProcurementSupplierperformance
Human resourcesManpowerplanning
ProductionCapacityInventory
MarketingCustomerdemand
FinanceCash flow
The Planning Process
Source: Reizer, J., Render, B. (2007). Operations Management . 9th Edition. Chapter 14.
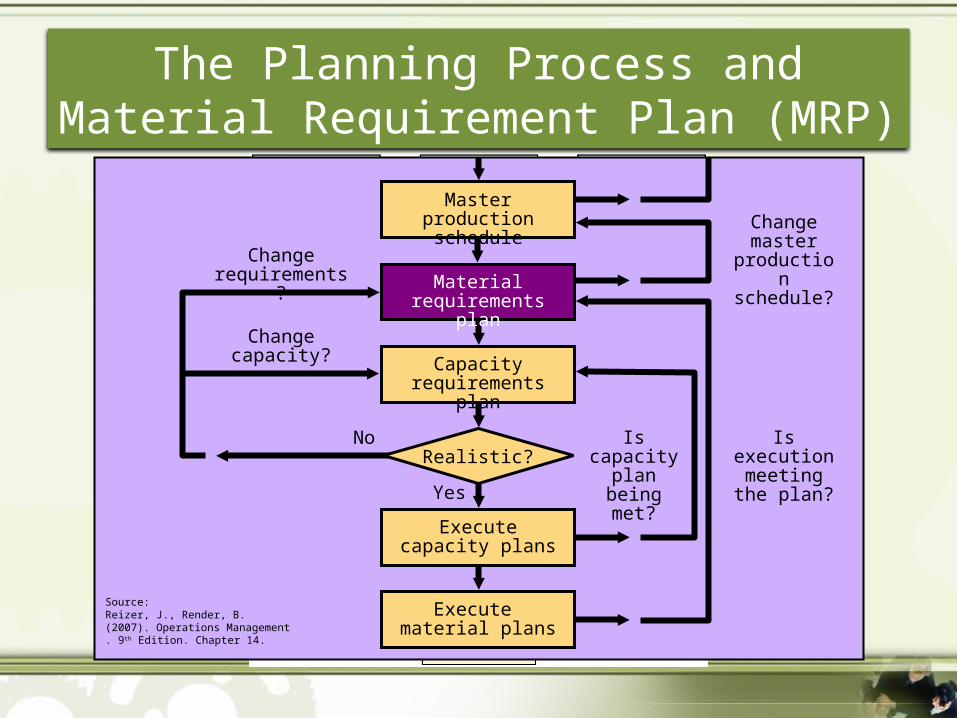
Is capacity plan being
met?
Is execution meeting the
plan?
Change master
production schedule?
Change capacity?
Change requirements?
No
Execute material plans
Execute capacity plans
Yes
Realistic?
Capacity requirements plan
Material requirements plan
Master production schedule
The Planning Process and Material Requirement Plan (MRP)
Source: Reizer, J., Render, B. (2007). Operations Management . 9th Edition. Chapter 14.
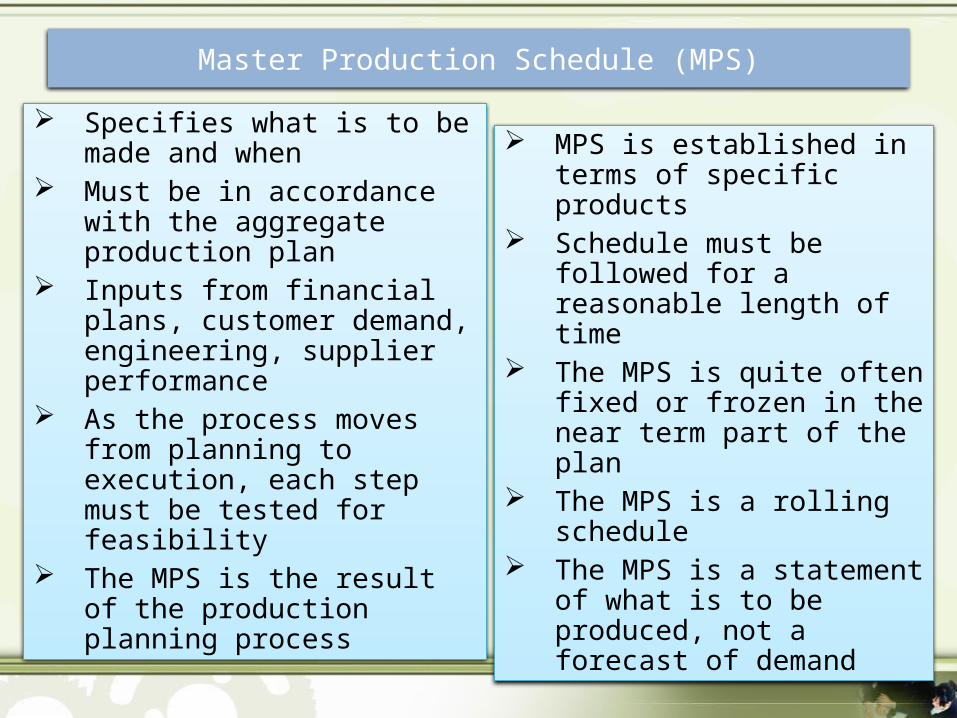
Specifies what is to be made and when
Must be in accordance with the aggregate production plan
Inputs from financial plans, customer demand, engineering, supplier performance
As the process moves from planning to execution, each step must be tested for feasibility
The MPS is the result of the production planning process
MPS is established in terms of specific products
Schedule must be followed for a reasonable length of time
The MPS is quite often fixed or frozen in the near term part of the plan
The MPS is a rolling schedule The MPS is a statement of what
is to be produced, not a forecast of demand
Master Production Schedule (MPS)
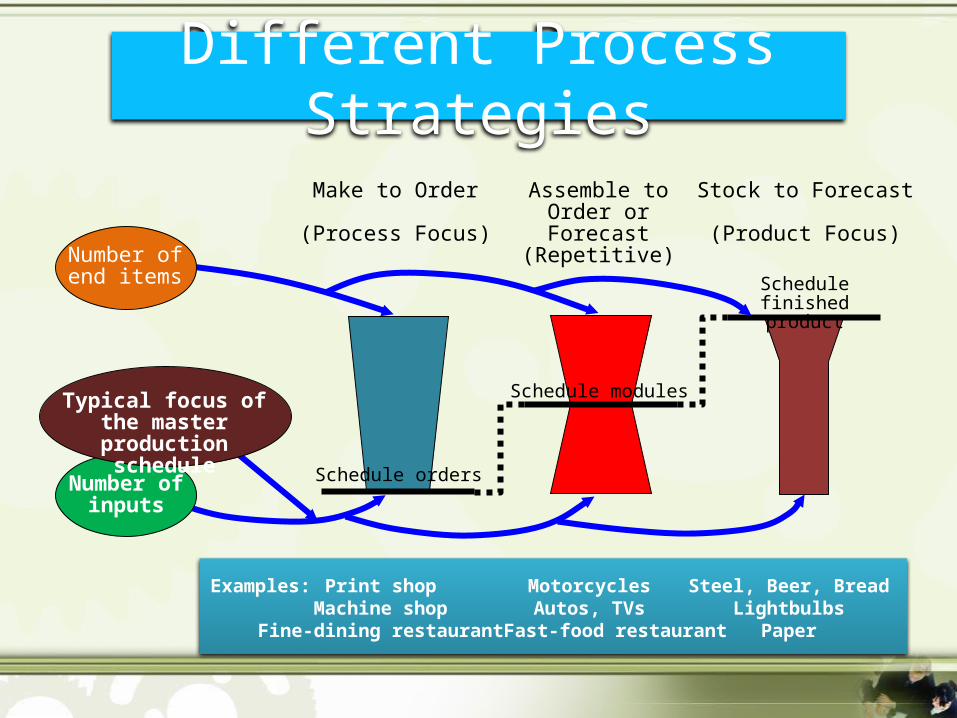
Stock to Forecast
(Product Focus)
Schedule finished product
Assemble to Order or Forecast
(Repetitive)
Schedule modules
Make to Order
(Process Focus)
Schedule orders
Examples: Print shop Motorcycles Steel, Beer, BreadMachine shop Autos, TVs Lightbulbs
Fine-dining restaurant Fast-food restaurant Paper
Number of end items
Number of inputs
Typical focus of the master production
schedule
Different Process Strategies
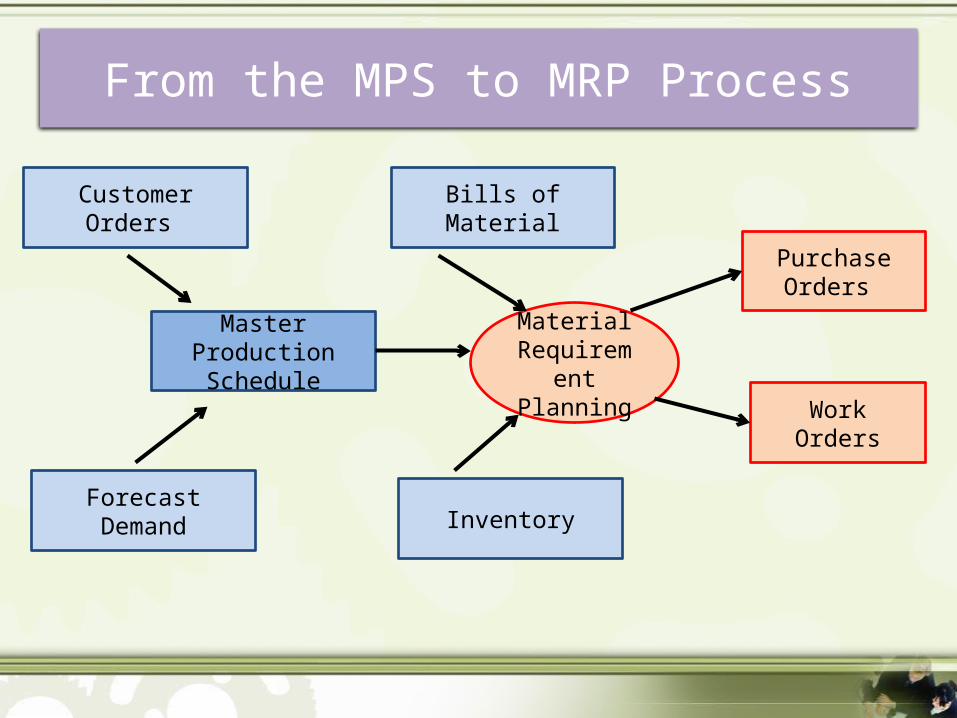
From the MPS to MRP Process
Inventory
Bills of Material
Purchase Orders
Work Orders
Customer Orders
Master Production Schedule
Forecast Demand
Material Requirement
Planning
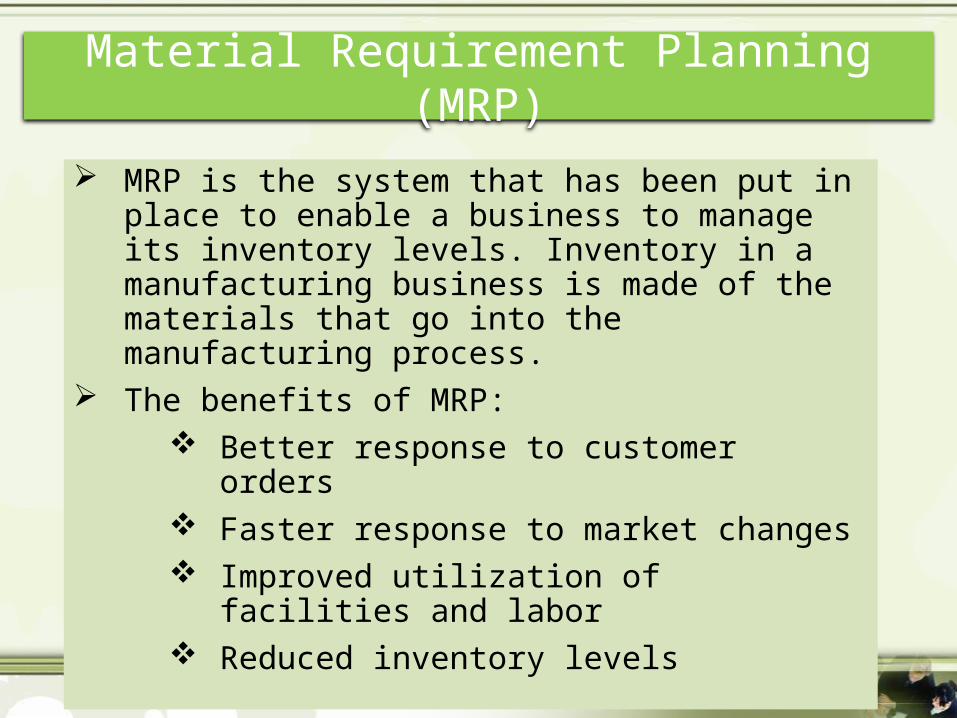
MRP is the system that has been put in place to enable a business to manage its inventory levels. Inventory in a manufacturing business is made of the materials that go into the manufacturing process.
The benefits of MRP: Better response to customer orders Faster response to market changes Improved utilization of facilities and labor Reduced inventory levels
Material Requirement Planning (MRP)
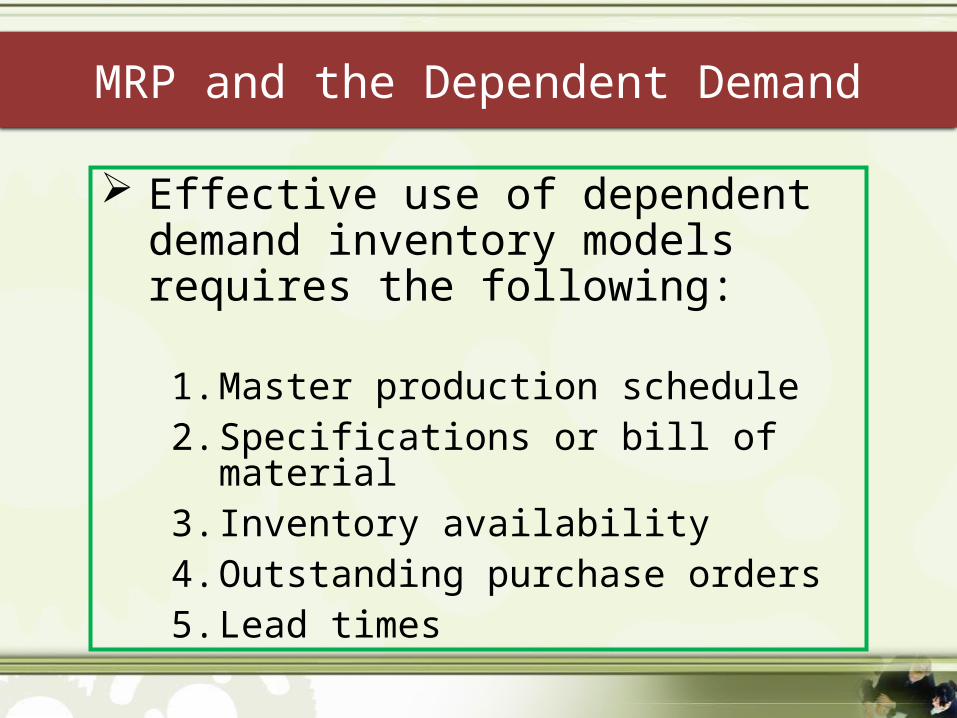
Effective use of dependent demand inventory models requires the following:
1. Master production schedule2. Specifications or bill of material3. Inventory availability4. Outstanding purchase orders5. Lead times
MRP and the Dependent Demand
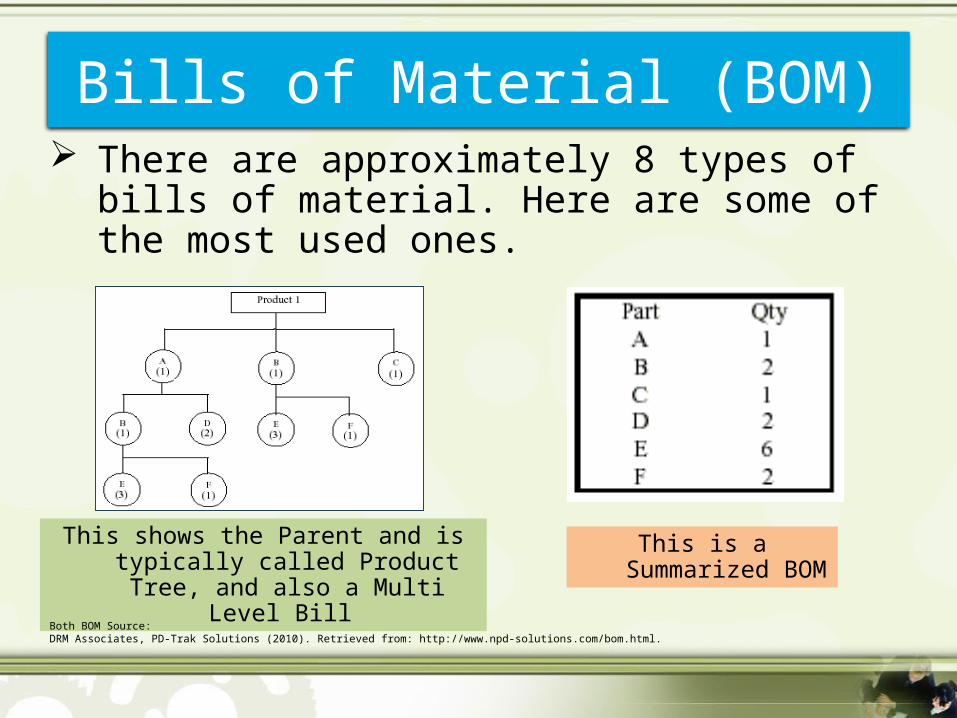
There are approximately 8 types of bills of material. Here are some of the most used ones.
This shows the Parent and is typically called Product Tree,
and also a Multi Level Bill
This is a Summarized
BOM
Bills of Material (BOM)
Both BOM Source: DRM Associates, PD-Trak Solutions (2010). Retrieved from: http://www.npd-solutions.com/bom.html.
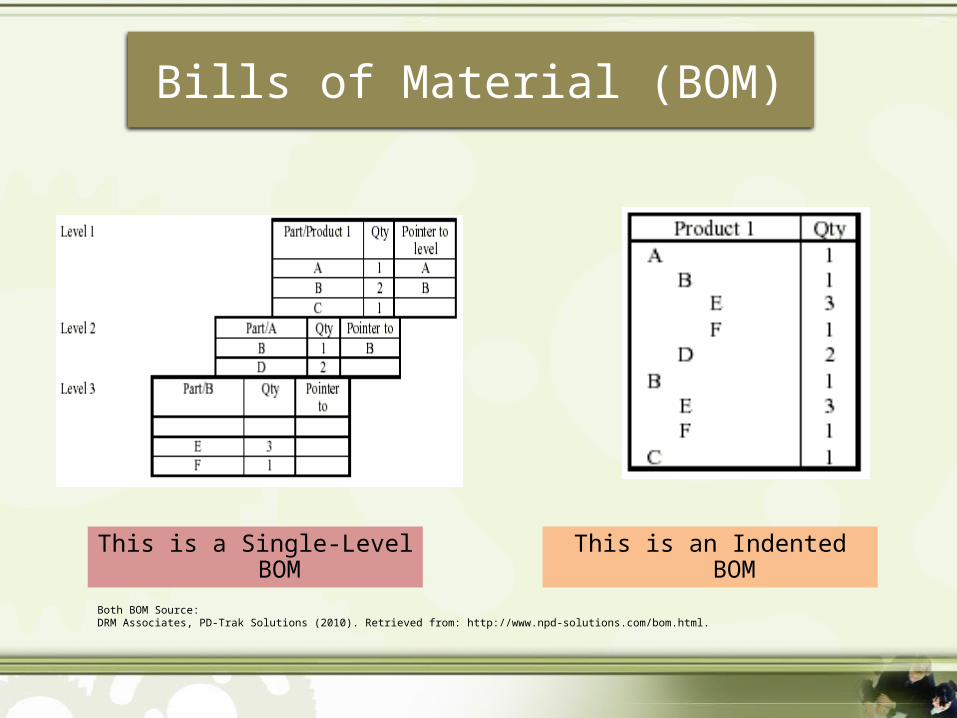
This is a Single-Level BOM This is an Indented BOM
Bills of Material (BOM)
Both BOM Source: DRM Associates, PD-Trak Solutions (2010). Retrieved from: http://www.npd-solutions.com/bom.html.
Accurate inventory records are absolutely required for MRP (or any dependent demand system) to operate correctly
Generally MRP systems require 99% accuracy
Outstanding purchase orders must accurately reflect quantities and scheduled receipts
MRP Needs Accurate Records
The time required to purchase, produce, or assemble an item For production – the sum of the
order, wait, move, setup, store, and run times
For purchased items – the time between the recognition of a need and the availability of the item for production
Lead Times
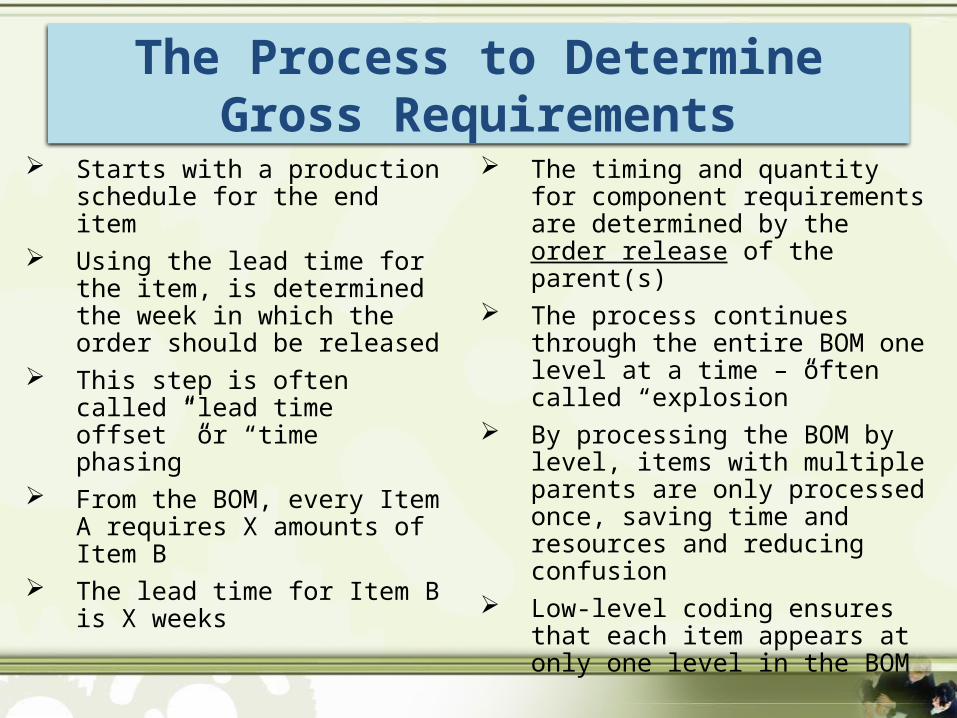
Starts with a production schedule for the end item
Using the lead time for the item, is determined the week in which the order should be released
This step is often called “lead time offset” or “time phasing”
From the BOM, every Item A requires X amounts of Item B
The lead time for Item B is X weeks
The timing and quantity for component requirements are determined by the order release of the parent(s)
The process continues through the entire BOM one level at a time – often called “explosion”
By processing the BOM by level, items with multiple parents are only processed once, saving time and resources and reducing confusion
Low-level coding ensures that each item appears at only one level in the BOM
The Process to Determine Gross Requirements
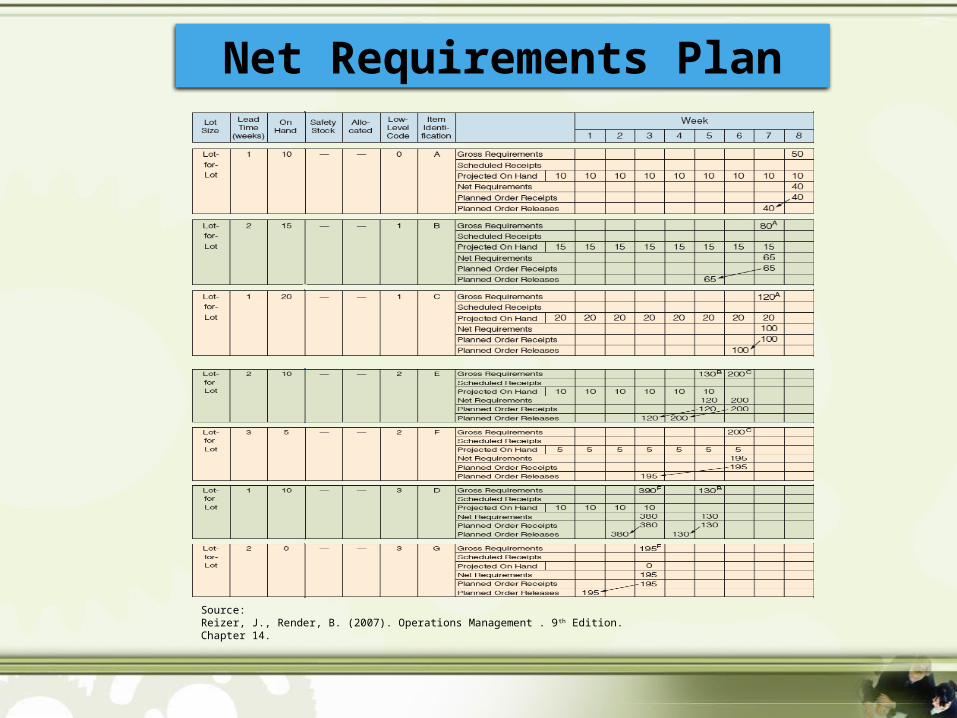
Net Requirements Plan
Source: Reizer, J., Render, B. (2007). Operations Management . 9th Edition. Chapter 14.
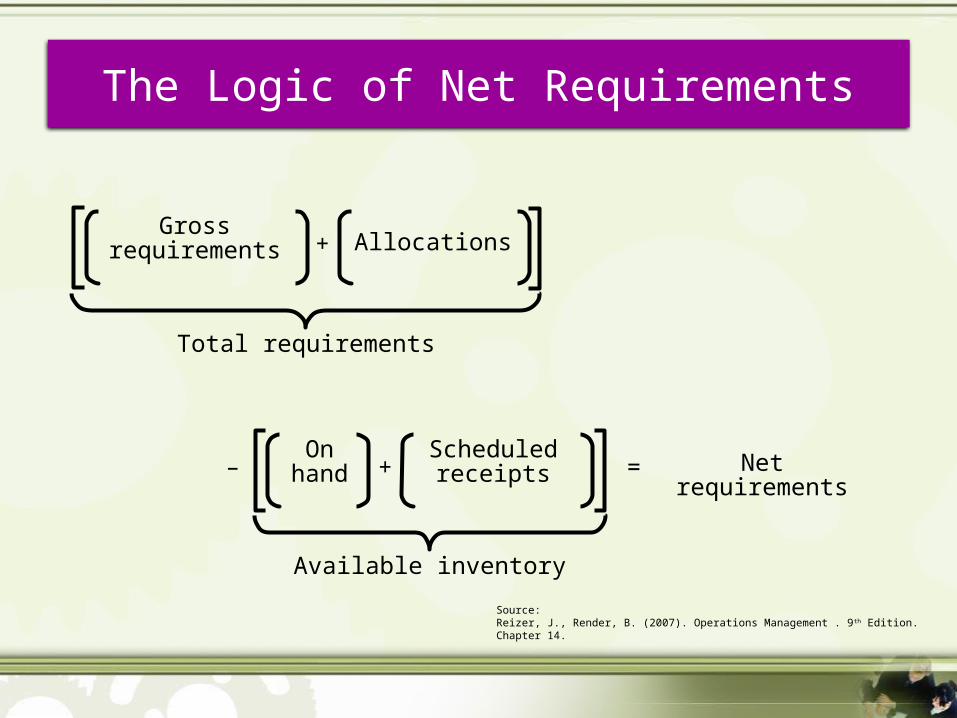
Available inventory
Net requirementsOn hand
Scheduled receipts+– =
Total requirements
Gross requirements Allocations+
The Logic of Net Requirements
Source: Reizer, J., Render, B. (2007). Operations Management . 9th Edition. Chapter 14.
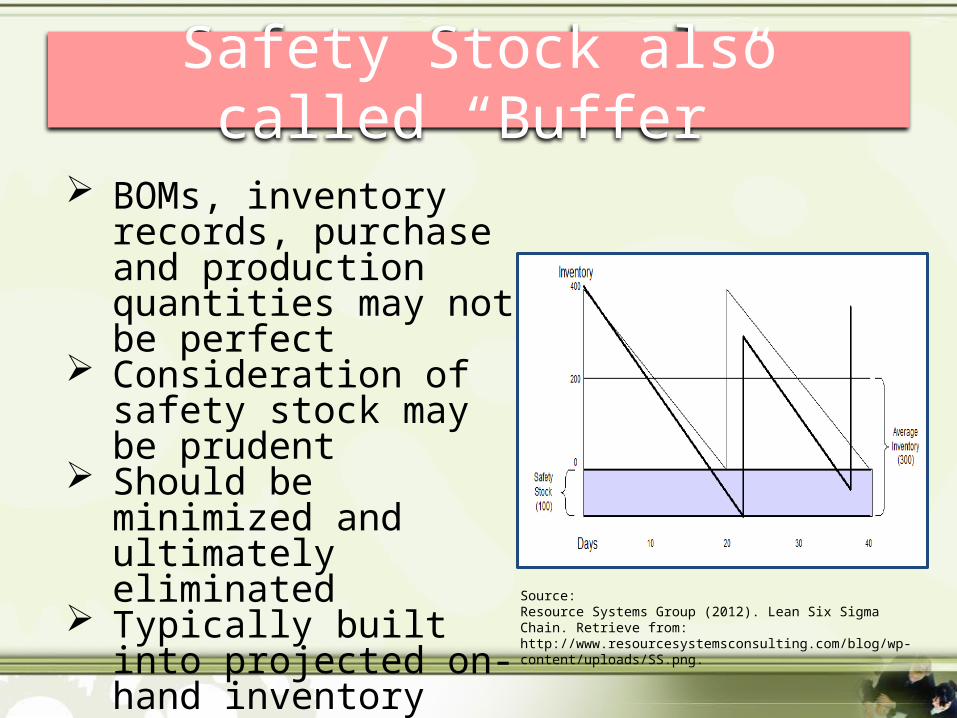
BOMs, inventory records, purchase and production quantities may not be perfect
Consideration of safety stock may be prudent
Should be minimized and ultimately eliminated
Typically built into projected on-hand inventory
Safety Stock also called “Buffer”
Source: Resource Systems Group (2012). Lean Six Sigma Chain. Retrieve from: http://www.resourcesystemsconsulting.com/blog/wp-content/uploads/SS.png.
Lot-for-lot techniques order just what is required for production based on net requirements
May not always be feasible If setup costs are high, lot-for-lot can be expensive
Economic order quantity (EOQ) EOQ expects a known constant demand and MRP
systems often deal with unknown and variable demand
Part Period Balancing (PPB) looks at future orders to determine most economical lot size
The Wagner-Whitin algorithm is a complex dynamic programming technique
Assumes a finite time horizon Effective, but computationally burdensome
Lot Sizing Techniques
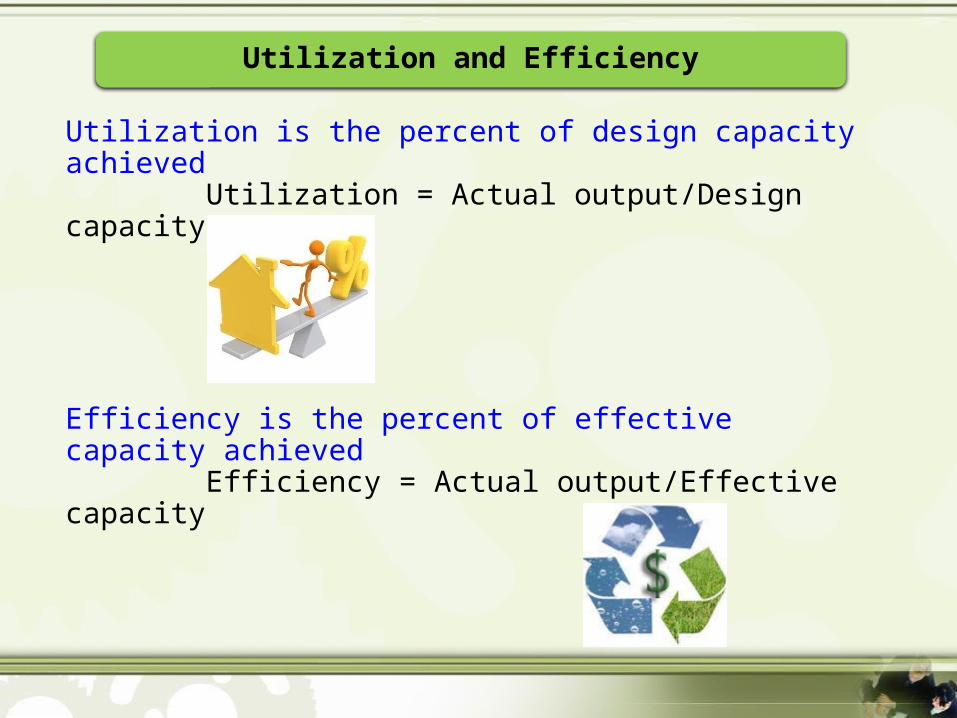
Utilization and Efficiency
Utilization is the percent of design capacity achieved Utilization = Actual output/Design capacity
Efficiency is the percent of effective capacity achieved Efficiency = Actual output/Effective capacity
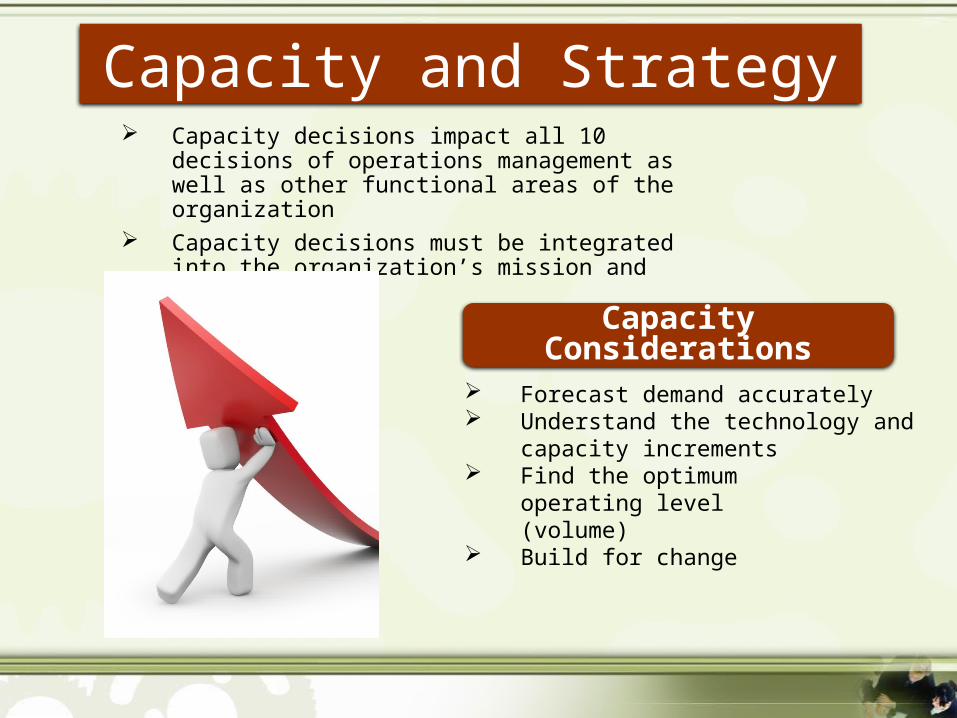
Capacity decisions impact all 10 decisions of operations management as well as other functional areas of the organization
Capacity decisions must be integrated into the organization’s mission and strategy
Forecast demand accurately Understand the technology and
capacity increments Find the optimum
operating level (volume)
Build for change
Capacity Considerations
Capacity and Strategy
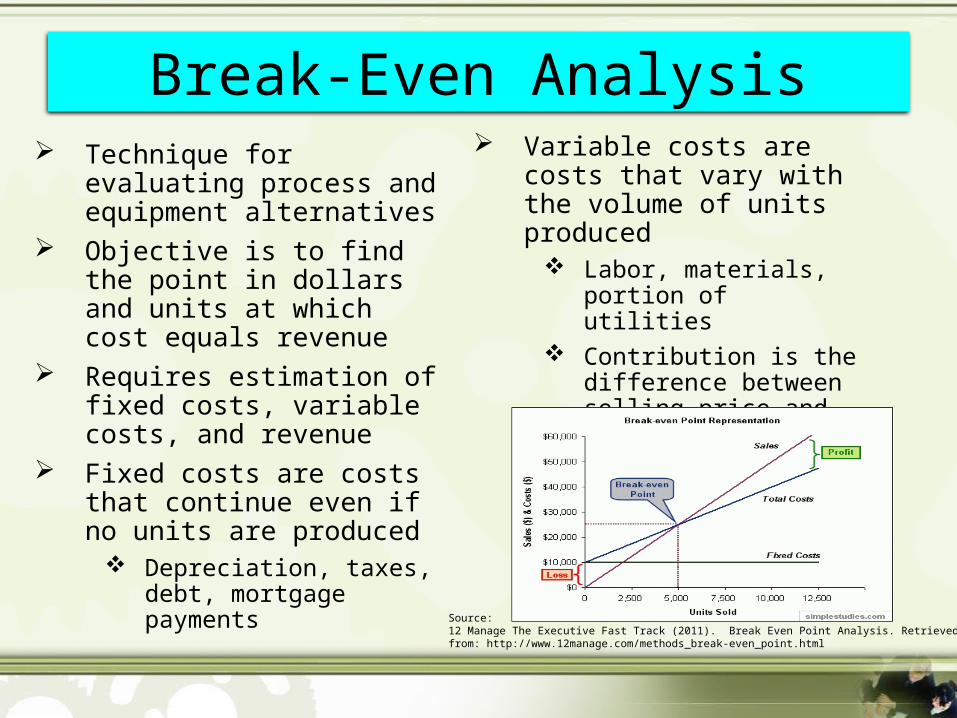
Technique for evaluating process and equipment alternatives
Objective is to find the point in dollars and units at which cost equals revenue
Requires estimation of fixed costs, variable costs, and revenue
Fixed costs are costs that continue even if no units are produced
Depreciation, taxes, debt, mortgage payments
Variable costs are costs that vary with the volume of units produced
Labor, materials, portion of utilities
Contribution is the difference between selling price and variable cost
Break-Even Analysis
Source: 12 Manage The Executive Fast Track (2011). Break Even Point Analysis. Retrieved from: http://www.12manage.com/methods_break-even_point.html
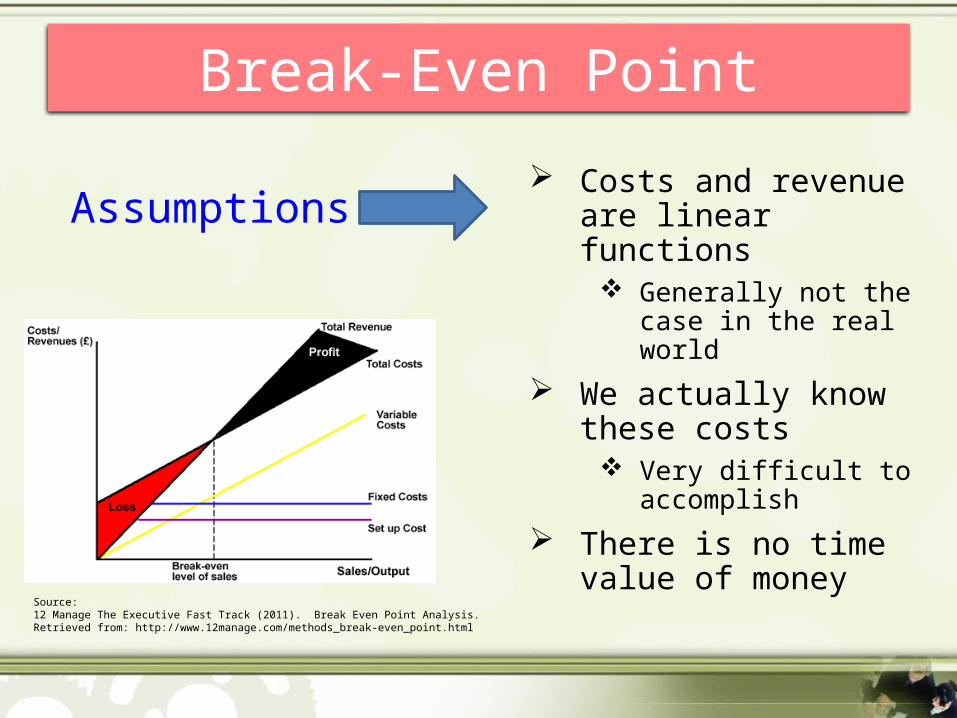
Assumptions Costs and revenue
are linear functions Generally not the
case in the real world
We actually know these costs
Very difficult to accomplish
There is no time value of money
Break-Even Point
Source: 12 Manage The Executive Fast Track (2011). Break Even Point Analysis. Retrieved from: http://www.12manage.com/methods_break-even_point.html
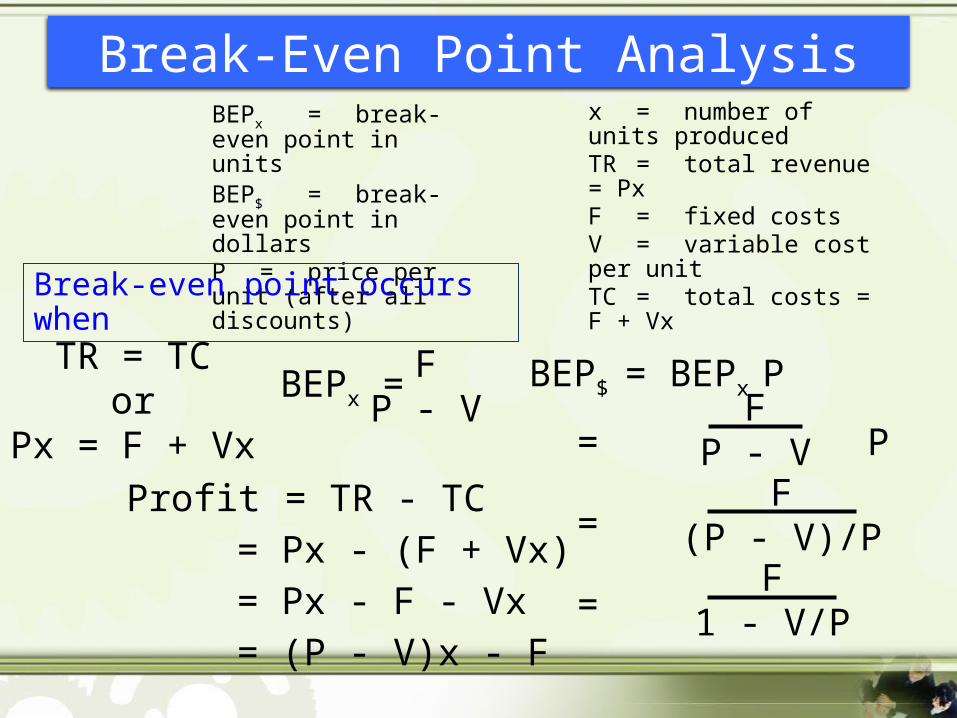
BEPx =break-even point in unitsBEP$ =break-even point in dollarsP = price per unit (after all discounts)
x = number of units producedTR = total revenue = PxF = fixed costsV = variable cost per unitTC = total costs = F + VxTR = TC
orPx = F + Vx
Break-even point occurs when
BEPx =F
P - VBEP$ = BEPx P
= P
=
=
F(P - V)/P
FP - V
F1 - V/P
Profit = TR - TC= Px - (F + Vx)= Px - F - Vx= (P - V)x - F
Break-Even Point Analysis

End of Presentation
You have finished the presentation.
Please continue with the Workshop Activities.
Related Documents