Voter Rationality and Politician Incentives: Exploiting Luck in Indian and Pakistani Elections 1 Madiha Afzal, Yale University October 20, 2007 Preliminary Draft Abstract Recent empirical work on US elections argues that any relationship between exogenous shocks and election outcomes is evidence of voter irrationality. In contrast, I develop a theoretical frame- work which highlights two di/erent mechanisms underlying politician behavior, e/ort and corrup- tion, which relate exogenous shocks to election outcomes under the assumption of complete voter rationality. Although corruption is generally considered the motivation underlying politician be- havior, I show that the more benign e/ort story also leads to the same predictions on electoral outcomes. In addition, the model shows that the relationship between politician behavior and thus probabilities of re-election and rainfall can vary with the underlying political environment of incumbency advantage or disadvantage. I empirically examine the relationship between politician re-election and rainfall using data from both Indian and Pakistani parliamentary elections. The results show that rainfall is signicantly positively related to re-election in times of incumbency advantage and negatively related to re-election in times of incumbency disadvantage in both coun- tries, consistent with the theoretical framework. Furthermore, evidence using development fund spending and politician occupations shows that the results are consistent with the e/ort story. JEL Classication: D72, O1 1 Email: [email protected] I thank Mark Rosenzweig, Chris Udry, Rohini Pande, Ebonya Washington, as well as Prashant Bharadwaj, Bjoern Bruegemann, A V Chari, Rahul Deb, Seema Jayachandran, Fabian Lange, Jeremy Magruder, Ted Miguel, and Salik Nur for helpful comments and suggestions. I also thank participants at the Yale Development Lunch, UC Berkeley Development Lunch, the Leitner Political Economy Workshop, and the Pacic Development Conference for feedback and encouragement. All errors are my own. 1

Welcome message from author
This document is posted to help you gain knowledge. Please leave a comment to let me know what you think about it! Share it to your friends and learn new things together.
Transcript
Voter Rationality and Politician Incentives:Exploiting Luck in Indian and Pakistani Elections1
Madiha Afzal, Yale University
October 20, 2007
Preliminary Draft
Abstract
Recent empirical work on US elections argues that any relationship between exogenous shocks
and election outcomes is evidence of voter irrationality. In contrast, I develop a theoretical frame-
work which highlights two di¤erent mechanisms underlying politician behavior, e¤ort and corrup-
tion, which relate exogenous shocks to election outcomes under the assumption of complete voter
rationality. Although corruption is generally considered the motivation underlying politician be-
havior, I show that the more benign e¤ort story also leads to the same predictions on electoral
outcomes. In addition, the model shows that the relationship between politician behavior and
thus probabilities of re-election and rainfall can vary with the underlying political environment of
incumbency advantage or disadvantage. I empirically examine the relationship between politician
re-election and rainfall using data from both Indian and Pakistani parliamentary elections. The
results show that rainfall is signi�cantly positively related to re-election in times of incumbency
advantage and negatively related to re-election in times of incumbency disadvantage in both coun-
tries, consistent with the theoretical framework. Furthermore, evidence using development fund
spending and politician occupations shows that the results are consistent with the e¤ort story.
JEL Classi�cation: D72, O1
1Email: [email protected] thank Mark Rosenzweig, Chris Udry, Rohini Pande, Ebonya Washington, as well as Prashant Bharadwaj, Bjoern
Bruegemann, A V Chari, Rahul Deb, Seema Jayachandran, Fabian Lange, Jeremy Magruder, Ted Miguel, and SalikNur for helpful comments and suggestions. I also thank participants at the Yale Development Lunch, UC BerkeleyDevelopment Lunch, the Leitner Political Economy Workshop, and the Paci�c Development Conference for feedbackand encouragement. All errors are my own.
1
1 Introduction
Classical democratic theory states that voters collect information on party platforms, policy pro-
nouncements, legislative voting, etc, on all candidates and cast their vote for the candidate who
o¤ers them the best package. However, collecting such information on each candidate is costly,
and voters know that policy pronouncements are non-binding. The alternative approach proposed
by the retrospective voting model places less of an information demand on voters and argues that
their decision rule is based on readily available information2. This information is simply the per-
formance of the incumbent while in power. If his performance is satisfactory, voters will re-elect
the incumbent; if it is unsatisfactory, they will vote for the opponent.
This leads us to the classic political agency problem: voters want to re-elect competent leaders,
but cannot directly observe e¤ort and ability. In voting retrospectively, they should respond to
economic indicators that re�ect performance. However, they should also �lter out exogenous factors,
such as rainfall, which a¤ect economic outcomes but lie beyond the politician�s control. An inability
to do so raises the probability of re-electing lucky but incompetent incumbents and results in
a lack of political accountability. A number of recent working papers, notably Wolfers (2007),
Achen and Bartels (2004), and Healy (2006), study data from US elections to show that politicians
are re-elected in lucky times and voted out in unlucky times. Wolfers relates oil price shocks to
US governors�probability of re-election, while Achen and Bartels show that there is an electoral
response to droughts and �oods in US presidential elections, and Healy uses individual voting data
to show that weather a¤ects voting behavior through income3. All three papers argue that any
relationship between exogenous shocks and electoral outcomes is evidence of voter irrationality.
However, this literature relies on the critical assumption that there is no response by politicians
to these exogenous shocks. As soon as there is any interaction of an exogenous shock with politician
behavior, we can no longer conclude that a relationship between shocks and politician re-election
is evidence of voter irrationality. I develop a theoretical framework which highlights two possible
mechanisms, e¤ort and corruption, which relate politician behavior to exogenous shocks, speci�cally
rainfall shocks in the South Asian context, under the assumption of complete voter rationality. I
also formalize the notion that voter behavior only changes because politician behavior changes;
speci�cally, voters vote out the politician if he behaves badly enough that a randomly selected
2See Key (1966) for seminal work on this topic; also see Fiorina (1981).3 In similar vein, Bertrand and Mullainathan (2001) show that CEO pay responds to exogenous factors that a¤ect
his company�s industry. Social psychology experiments also show that subjects in experiments aiming to assesscompetence systematically fail to take su¢ cient account of background or environmental factors.
2
challenger is deemed better than him4. In the e¤ort story, rainfall a¤ects the politician-landowner�s
own farm, and therefore changes his incentives to put in farm labor versus political e¤ort. In
the corruption story, rain a¤ects the constituents�aggregate income, and changes the politician�s
incentives to steal from them. The corruption and e¤ort stories yield analogous results for the
direction of the e¤ect on politician incentives but the e¤ort story is more benign in terms of its
e¤ect on constituents�welfare. In my empirical work, I test whether the e¤ort story is consistent
with politician behavior in the South Asian context, but cannot directly test for the corruption
story.
The theoretical model shows that the e¤ect of exogenous shocks on both e¤ort and corruption
can vary with the underlying political environment. Speci�cally, I show that politicians increase
e¤ort or lower corruption when there is higher rainfall (a good shock), if there is a high enough
incumbency advantage; and they lower e¤ort or raise corruption when there is higher rainfall in
times of incumbency disadvantage. A good rainfall shock in times of incumbency advantage serves
as an "income" shock and politicians are able to undertake better actions in the political arena.
However, in times of incumbency disadvantage, a rainfall shock has a "substitution" e¤ect into
worse politician behavior. More generally, one can argue that politician incentives vary in good
versus bad times, and any relationship between good times and re-election would re�ect that rather
than irrational voter behavior.
I empirically examine the relationship between re-election and rainfall using data from both
Indian and Pakistani parliamentary elections. Speci�cally, I have election and rainfall data for each
parliamentary constituency in both countries for eight election years in India, and four election
years in Pakistan. I use a measure of rainfall, the ratio of annual rainfall to mean annual rainfall
in the constituency, which is monotonically related to crop yield and agricultural productivity in
South Asia. The results show that rainfall is signi�cantly positively related to politician re-election
in India pre-1991, when there was an incumbency advantage, and negatively related to re-election
post-1991, when there was an incumbency disadvantage. Rainfall is negatively associated with
re-election in Pakistan in its democratic period, which was also characterized by an incumbency
disadvantage. These results are not consistent with an irrational voter response to luck, which
would have implied the same response across di¤erent political environments.
4The paradigm shift I propose between voter irrationality and rationality is similar to the one from traditionalbusiness cycle theories to budget cycle theories. The traditional political business cycle literature argues that voters aresystematically fooled by politicians who manipulate monetary policy resulting in temporary output and employmentincreases before an election. However, Rogo¤ (1990) shows that politicians who generate political budget cyclesthrough expansionary �scal policy may use this to signal competence.
3
The rainfall e¤ect comes through rural constituencies, consistent with both the e¤ort and cor-
ruption stories in South Asia. I use two additional pieces of data to test the e¤ort story: Pakistani
legislators�development fund spending, which I will argue is interpretable as e¤ort, and the occu-
pation of Indian MPs, and speci�cally, information on whether the politician is an agriculturist.
Development spending is negatively associated with rainfall in Pakistan, consistent with the e¤ort
mechanism in an environment of incumbency disadvantage. The rainfall e¤ect also comes through
politician-agriculturists in India, lending further support to the e¤ort story.
The remainder of this paper is organized as follows. Section 2 presents a simple theoretical
framework which highlights the various ways in which rainfall (or any other exogenous shock) can
impact a politician�s probability of re-election in a Bayesian framework. In Section 3, I discuss the
empirical strategy and describe the data in Section 4. Section 5 lays out the political context and
Section 6 presents and discusses the central empirical results of this paper. In Section 7, I test the
e¤ort story, and in Section 8, I test alternative explanations for my results. Section 9 concludes.
2 Theoretical Framework
This theoretical framework identi�es the possible channels through which rainfall (or any exogenous
source of variation in voter�s payo¤) can impact an incumbent�s probability of re-election. I �rst lay
out a simple political agency model that describes rational voter behavior with Bayesian updating,
motivated by the discussion in Besley (2006). This formalizes the notion that rational voters will
only change their voting behavior if politician behavior changes. I then set up the politician�s
maximization problem to show how his behavior changes with rainfall, using two alternative stories
for politician behavior: e¤ort and corruption.
In the e¤ort story, rainfall a¤ects the politician-landowner�s own farm, and therefore changes
his incentives to put in farm labor versus political e¤ort. In the corruption story, rain a¤ects the
constituents�aggregate income, and changes the politician�s incentives to steal from them. It is
standard in the literature to model politician behavior as corruption5. However, the e¤ort story
is an alternative way of looking at politician behavior, and is especially relevant in the South
Asian context where many politicians are landowners and must also spend time and e¤ort on
development schemes, for example, for their constituents. The corruption and e¤ort stories yield
5 In recent work addressing similar issues of corruption and politician re-election, Campante, Chor, and Do (2006)show that greater instability leads the incumbent to embezzle more during his short window of opportunity. Ferrazand Finan (2007) also �nd that mayors in Brazil in their �nal term are signi�cantly more corrupt than mayors whocan still be re-elected.
4
analogous results for politician incentives but have very di¤erent implications in terms of their
welfare e¤ects: the corruption story posits the politician as an extorter whereas the e¤ort story
implies that he is a more benign citizen-candidate. I can later test whether the e¤ort story is
consistent with politician behavior in the South Asian context; however, I cannot directly test for
the corruption story because of lack of data on corruption.
2.1 Basic Political Agency Set-up
For simplicity, there is adverse selection in the model, but no moral hazard (so the voters cannot
observe politician type but do observe his action, rather than some signal of the action as would
be the case if there was moral hazard). The basic results would hold if moral hazard was added to
the model.
The incumbent politician takes action a�f0; 1g, directly interpretable as good behavior; that
is, if the politician puts in good behavior, a = 1, and if he does not, a = 0. Rainfall R�f0; 1g is
exogenous and perfectly observable to both the politician and the voter. The representative voter�s
payo¤/income is y = a+R.
There are two types of politicians, good (g) and bad (b). The ex-ante probability of a randomly
selected politician being good is �; this is also the prior that the incumbent is good. The voter
will update his beliefs about the politician�s type (based on the action a) using Bayes rule and will
re-elect the incumbent if his belief that the incumbent is good is greater than the probability that
a randomly selected challenger is a good type, i.e. if P (g) > �. The probability that the good
politician undertakes the good action is �G and the probability that the bad politician undertakes
it is �B.
Voters update their beliefs according to Bayes rule, which implies that the belief that the
politician is good, conditional on having observed the good action, is: P (g) = �G��G�+�B(1��) > �.
This is always true if �G > �B. Thus putting in the good action always improves the politician�s
reputation, and there is always an equilibrium in which any politician who puts in the good action is
re-elected. More generally, in a continuous environment, if the politician puts in the better action,
he is more likely to be re-elected.
2.2 E¤ort Story
The main motivation for this story is the fact that a majority of politicians in South Asia tend to
own agricultural land in the constituencies from which they are elected; they are even referred to
5
as landowner-politicians. Agriculture is the primary occupation of 34% of MNAs, legislators who
were elected to the Lower House of Parliament in Pakistan, in 2002. It is the occupation of 50% of
MPs elected to the Lok Sabha, the Lower House of Parliament in India, in 2004. These numbers
are an underestimate for the time period under study in this paper, which is before 1999 for both
countries, given that the agricultural population has gone down over time. The Pakistan number
is an additional underestimate for two reasons: i) agriculture tends to be the secondary occupation
for more politicians, and ii) a policy change prior to the 2002 elections barred all candidates who
did not have a Bachelors degree from contesting elections; to the extent that landowner-politicians
were more a¤ected by this education requirement, 34% is an underestimate for the time period
under study.
The landowner-politician can spend time on his farm or spend time in the political arena. Farm
production is determined by rainfall and the politician�s labor on the farm. The politician thus
faces a tradeo¤ between farm labor and political e¤ort, because the latter increases his probability
of re-election but the former increases current income.
Formally, the politician faces the following utility maximization problem: he chooses e to max-
imize
U = p(e)U(R�L1�� +W ) + (1� p(e))U(R�L1��) s.t. e+ L � T .
where L is farm labor and e is political e¤ort. Production on the farm is given by R�L1��,
where R is rainfall. p(e) is the probability of re-election given e¤ort e; this probability is increasing
in e¤ort. W is the bene�t from re-election. The politician�s utility function exhibits diminishing
marginal utility: that is, U 0() > 0; U 00() < 0. This is how we generally expect utility functions to
behave; and this turns out to be crucial for the main result of the model. A high enough probability
of re-election, p de�nes incumbency advantage, and low enough p de�nes incumbency disadvantage.
Result i: When there is a high enough incumbency advantage, politicians increase e¤ort with
higher rainfall; and when there is a high enough incumbency disadvantage, politicians lower e¤ort
with better rainfall. Formally, for large enough p, @e@R > 0; and for low enough p,
@e@R < 0; this is
true if W is su¢ ciently large, p(e) is concave, and U 000 = 0:
Result ii: The response of e¤ort to rainfall is increasing in incumbency advantage; that is, @e@R
is increasing in p.
Proof: in Appendix.
6
2.3 Corruption Story
The main motivation for this story is that rainfall increases constituency income, from which the
incumbent can steal. This extortion can take the form of bribes from his now richer constituents
(because of rainfall). Voters will update their beliefs according to Bayes rule upon observing
corruption and will not re-elect the incumbent conditional on him undertaking corrupt activities.
Here, the idea is that the politician can choose the how much to steal from constituency income,
which depends on rainfall. Formally, the politician chooses � to maximize:
U = p(�)U(�f(R) +W ) + (1� p(�))U(�f(R))
where constituency income f(R), depends on rainfall R; � is the proportion of constituency
income the politician chooses to steal, and p(�) is the probability of re-election given corruption �;
this probability is decreasing in �. Finally, as in the e¤ort model, W is the bene�t from re-election,
and U() exhibits diminishing marginal utility.
Result i: When there is a high enough incumbency advantage, politicians lower corruption
with higher rainfall; and when there is a high enough incumbency disadvantage, politicians increase
corruption with better rainfall. For large enough p, @�@R < 0; and for low enough p,@�@R > 0; this is
true if W is su¢ ciently large, p(�) is convex, and U 000 = 0.
Result ii: The response of corruption to rainfall is decreasing in incumbency advantage; that
is, @�@R is decreasing in p.
Proof: in Appendix.
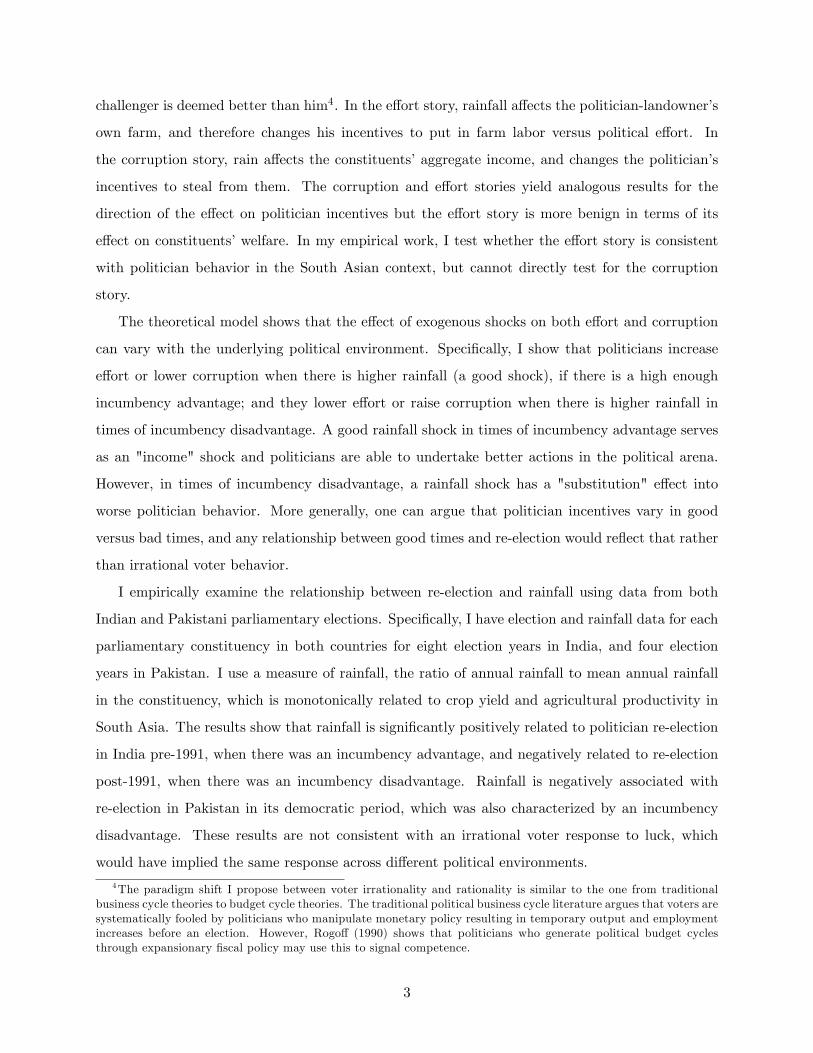
Table 1 contains a summary of the results of both models, and Figure 1 depicts the p functions
graphically.
2.4 Intuition
The intuition of the main results is as follows: in the corruption case, as p goes up (as we move
into the case of incumbency advantage), the incumbent is more likely to get W ; in this case,
when rainfall R goes up, the politician reduces corruption (�) because of diminishing marginal
utility. Similarly, the e¤ort story, as p increases, the incumbent is more likely to get W , and when
R increases, he lowers e¤ort on the farm (L) and so increases political e¤ort (e). This can be
termed the "income" e¤ect of increasing rainfall, which is to make the politician substitute into
better politician behavior (lower corruption and higher e¤ort) and it exists in times of incumbency
advantage precisely because the politician is more likely to get the bene�t from re-election. The
7

"substitution" e¤ect, which is to make the politician substitute into worse political behavior (higher
corruption and lower e¤ort) exists in times of incumbency disadvantage because the politician is
less likely to get the bene�t from re-election and so will substitute into activities that make money
now.
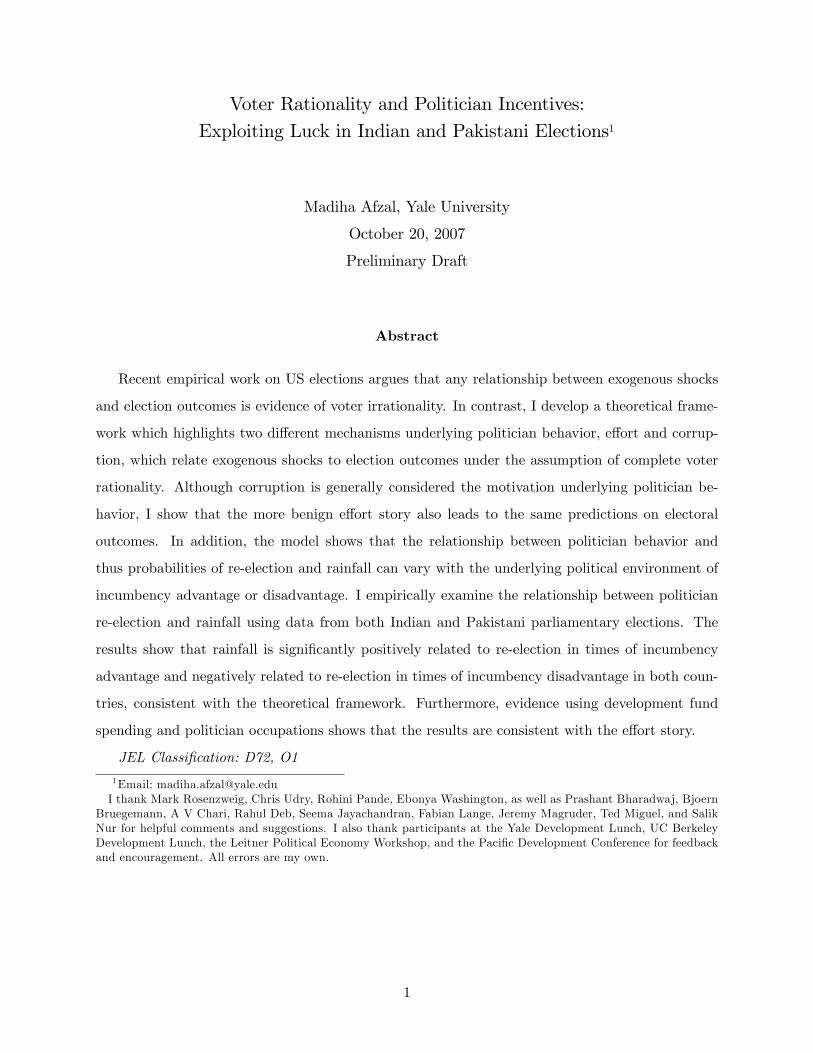
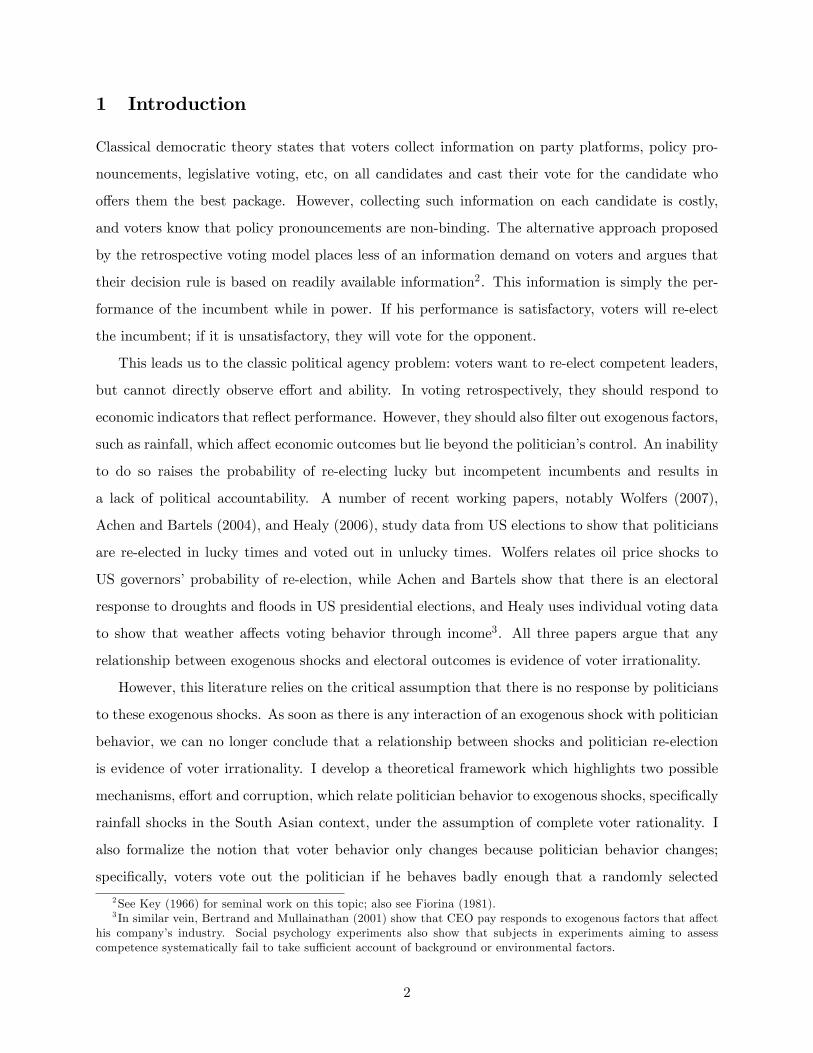
What does it mean for p(e) to be concave and for p(�) to be convex, which are assumptions we
need for the above results to hold? It means that an increase in e¤ort at lower levels is rewarded
at a higher rate than the increase at higher levels of e¤ort, that is, there are diminishing marginal
returns to e¤ort (Figure 1). The fact that p(�) is convex means that the politician is increasingly
more likely to be punished the higher the � (Figure 2). It is entirely reasonable to assume that
voters reward lower levels of e¤ort at a higher rate and penalize higher levels of corruption at a
higher rate.
2.5 Irrational voter
In contrast to the above, the irrational voter will not base his vote on his belief about the politician�s
type, and he will not update this belief using Bayes rule; rather he will re-elect the incumbent
when his payo¤ under the incumbent�s government y = a+R is (equal to or) higher than a certain
threshold. One can think of this in terms of the incumbent�s probability of re-election increasing as
the voter�s payo¤ increases. This latter framework guarantees that there are no perverse e¤ects of
having a �xed re-election threshold on the politician�s action, i.e., it ensures that (bad) politicians
do not put in the bad action when there is no rainfall or when there is a bad state of the world
just because they know that they will not be able to reach the threshold even if they do put in
the good action6. In this case, the politician�s action a is not a¤ected by rainfall R; however, the
incumbent is still more likely to be re-elected when there is higher rainfall just because the voter�s
total payo¤ is higher.
2.6 Testing the model
This theoretical framework formalizes a number of ideas: the relationship between e¤ort and cor-
ruption (and therefore probability of re-election) and rainfall can be positive or negative depending
on the underlying political environment. Both the stories presented here give the same predictions
about the direction of politician behavior under di¤erent political environments, but have di¤erent
6One can also guarantee that there is no perverse e¤ect from a �xed threshold if the politician is uncertain aboutthe exact threshold value.
8
motivations for the politician, and di¤erent implications for the voter.
Can we distinguish between the e¤ort and corruption stories empirically? In the e¤ort story,
rainfall a¤ects the politician�s personal income, and the story rests entirely on the fact that he is an
agriculturist, whereas in the corruption story, rainfall a¤ects constituency income. Two things can
help provide support for the e¤ort story: I have data on development fund spending in Pakistan,
which I argue can be interpreted as e¤ort (see description below in the data section) and can look
at whether spending responds to rainfall in the manner predicted in this model. I also have data
on occupations of MPs in India for four elections, and can therefore look at whether the rainfall
e¤ect comes through the politician being an agriculturist. Although I can directly test for the e¤ort
story, I cannot do so for corruption because of lack of data. Therefore, results consistent with the
e¤ort story do not rule out the corruption story also being at play.
3 Empirical Strategy
The empirical strategy of this paper is a di¤erence-in-di¤erence approach, with the following basic
speci�cation:
Pr(reelect)ct = �c + �t + Rainct + "ct
where:
Pr(reelect)ct for a constituency c at time t is de�ned in both of the following ways:
i) Pr(Candidate re-election): equals 0 if incumbent politician is not re-elected; 1 if incumbent
legislator is re-elected in constituency c at time t7.
ii) Pr(Party re-election): equals 0 if the incumbent political party is not re-elected; 1 if the
incumbent party is re-elected in constituency c at time t.
Rainct is rainfall for constituency c at time t. Two main measures for Rainct are used: i)
average annual rainfall in the duration between each election, and ii) rainfall in the year prior to
the election (if voters remember more about the immediate past). The literature on the relationship
between rainfall and agricultural production in South Asia states that the ratio of annual rainfall
to mean annual rainfall is a strong predictor of crop yield8. In accordance with this work, I take
7This does not take into account whether the incumbent politician ran for re-election or not. The results aresimilar for candidate re-election conditional on running. However, candidate re-election unconditional on runningshould be the more salient measure, as incumbents who have any hope of re-election should run again from the sameconstituency.
8See Jayachandran (2006).
9

the ratio of the rain measures identi�ed above to mean annual rainfall (de�ned as average rainfall
in the constituency over the 1950-99 time period) as my preferred measure of Rainct. Two other
speci�cations are also tested to check for robustness: logs (equivalent to the log of the ratio measure,
because of constituency �xed e¤ects) and levels (mean deviations are taken care of by constituency
�xed e¤ects, so levels are exactly equivalent to rainfall deviations)9.
�c are constituency �xed e¤ects, where c refers to 207 national-level electoral constituencies in
Pakistan, and 543 national-level electoral constituencies in India. �t are election-year e¤ects, where
t refers to election years 1990, 1993, and 1997 in Pakistan, and election years 1980, 1984, 1989,
1991, 1996, 1998, and 1999 in India.
3.1 E¤ort Tests
3.1.1 Development Fund Spending
DevSpendingct = �c + �t + Rainct + "ct
As I argue below, development spending is interpretable as e¤ort. If there is a negative associa-
tion between development fund spending and rainfall in Pakistan, given that there is an incumbency
disadvantage in Pakistan, then this will provide support for the e¤ort mechanism.
3.1.2 Politician-landlord
Pr(reelect)ct = �c + �t + 1Rainct + 2Agriculturistct + 3Rainct �Agriculturistct + "ctwhere Agriculturistct signi�es whether the incumbent MP is a landowner/agriculturist.
If the rainfall e¤ect mostly comes through 3 as opposed to 1, then this will provide support
for the e¤ort mechanism.
4 Data
4.1 Rainfall Data
The rainfall data used in this paper is from the Center for Climatic Research at the University of
Delaware, speci�cally from their Global Precipitation Monthly and Annual Data Series for 1950-99.
Rainfall is measured at a 0.5 degree by 0.5 degree longitude-latitude grid. To compile this data
9Results available upon request.
10
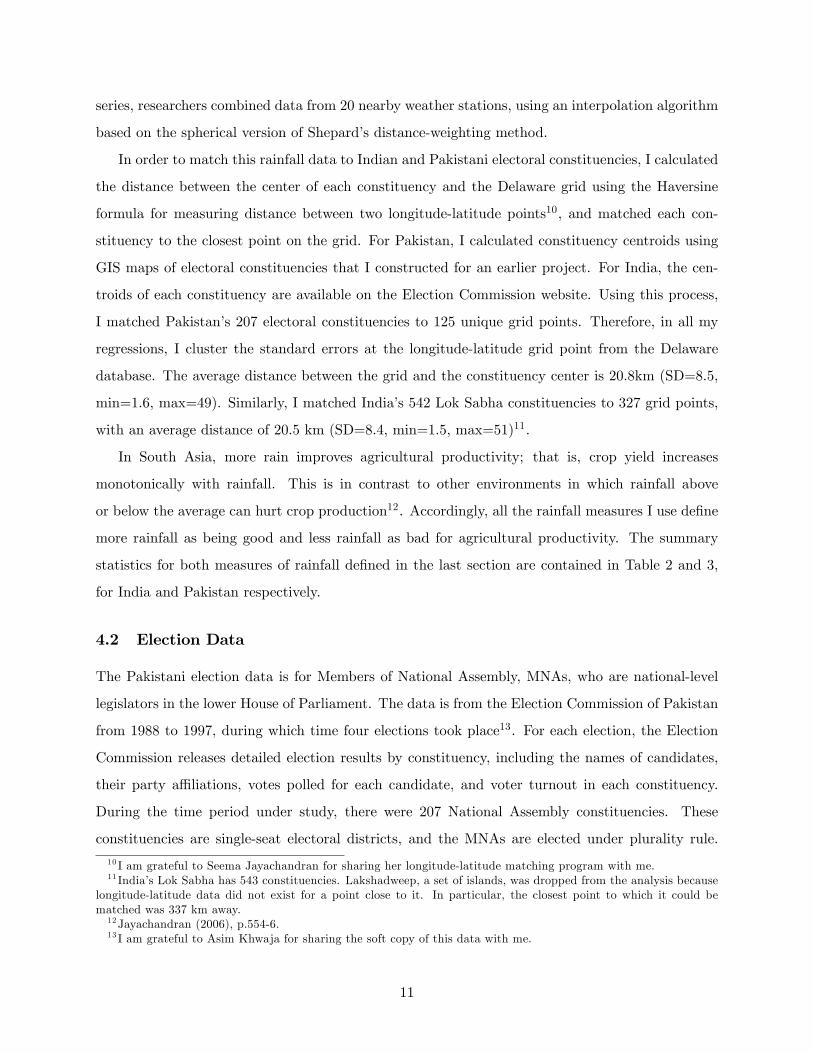
series, researchers combined data from 20 nearby weather stations, using an interpolation algorithm
based on the spherical version of Shepard�s distance-weighting method.
In order to match this rainfall data to Indian and Pakistani electoral constituencies, I calculated
the distance between the center of each constituency and the Delaware grid using the Haversine
formula for measuring distance between two longitude-latitude points10, and matched each con-
stituency to the closest point on the grid. For Pakistan, I calculated constituency centroids using
GIS maps of electoral constituencies that I constructed for an earlier project. For India, the cen-
troids of each constituency are available on the Election Commission website. Using this process,
I matched Pakistan�s 207 electoral constituencies to 125 unique grid points. Therefore, in all my
regressions, I cluster the standard errors at the longitude-latitude grid point from the Delaware
database. The average distance between the grid and the constituency center is 20.8km (SD=8.5,
min=1.6, max=49). Similarly, I matched India�s 542 Lok Sabha constituencies to 327 grid points,
with an average distance of 20.5 km (SD=8.4, min=1.5, max=51)11.
In South Asia, more rain improves agricultural productivity; that is, crop yield increases
monotonically with rainfall. This is in contrast to other environments in which rainfall above
or below the average can hurt crop production12. Accordingly, all the rainfall measures I use de�ne
more rainfall as being good and less rainfall as bad for agricultural productivity. The summary
statistics for both measures of rainfall de�ned in the last section are contained in Table 2 and 3,
for India and Pakistan respectively.
4.2 Election Data
The Pakistani election data is for Members of National Assembly, MNAs, who are national-level
legislators in the lower House of Parliament. The data is from the Election Commission of Pakistan
from 1988 to 1997, during which time four elections took place13. For each election, the Election
Commission releases detailed election results by constituency, including the names of candidates,
their party a¢ liations, votes polled for each candidate, and voter turnout in each constituency.
During the time period under study, there were 207 National Assembly constituencies. These
constituencies are single-seat electoral districts, and the MNAs are elected under plurality rule.
10 I am grateful to Seema Jayachandran for sharing her longitude-latitude matching program with me.11 India�s Lok Sabha has 543 constituencies. Lakshadweep, a set of islands, was dropped from the analysis because
longitude-latitude data did not exist for a point close to it. In particular, the closest point to which it could bematched was 337 km away.12Jayachandran (2006), p.554-6.13 I am grateful to Asim Khwaja for sharing the soft copy of this data with me.
11

Each party can �eld one candidate per constituency, and a large number of independent candidates
run for election as well14. Legislators do not face term limits in Pakistan.
The India election data is for members of the Lok Sabha, which is the lower House of Parliament.
This data is from the Election Commission of India for the eight elections held between 1977 and
1999. For each election, I have detailed election results by constituency, including candidate names,
votes polled, and party a¢ liations, as for Pakistan15. There were 543 Lok Sabha constituencies
in this time period, but election results are reported consistently for only 504 of them. Similar to
Pakistan, these are �rst-past-the-post elections.
The summary statistics for candidate and party re-election are in Tables 4 and 5, for India
and Pakistan respectively. Party and candidate re-election do not correspond exactly for two
reasons: parties may not �eld the incumbent for re-election in the same constituency or at all, and
candidates may switch parties. Whether the candidate or party is more salient for voters in terms
of retrospective voting is an empirical issue.
4.3 Development Fund Data
A slush fund has been allocated to each legislator in Pakistan in every year since 1985 to spend
on various development projects in his/her constituency. The name of the program has varied
with successive governments, but the overall mandate remains the same: provision of development
schemes to communities by their elected representatives. Development funds were allocated to
MNAs under the Peoples Programme in 1988-90 and 1993-97, and under the Tameer-e-Watan
Programme in 1991-93 and 1998-2000. MNAs can spend these funds on projects in the broad areas
of health, education, roads, water supply, drainage and sanitation, electri�cation, gas, construction,
establishment of public call o¢ ces, and certain miscellaneous �elds16. For example, the funds could
be used to help with the establishment of a basic health unit (BHU, a primary level public health
14 Interestingly, candidates can stand for election from more than one constituency, and can therefore win from morethan one constituency as well! In practice, there are a few strong candidates in every election who win from multipleconstituencies. When that occurs, the candidate must resign from all winning seats but one, and bye-elections areheld in the constituencies where he resigned. For these constituencies, I encode the incumbent politician as the onewho is in power for the duration between the current election and the next election; speci�cally, if the winner resigns,the bye-election winner is denoted as the incumbent. This makes sense because it is the incumbent�s performancethat voters are evaluating. However, I denote the person who wins the election the �rst time around as the winner,since he is the �rst preference of voters.15 I am grateful to Leigh Linden for sharing the soft copy of this data and his measure of candidate re-election with
me.16The Pakistan Ministry of Local Government and Rural Development generously provided detailed development
fund spending data for this paper, including data on the number of projects implemented and the amount of fundsspent by each MNA under each broad area, in each year.
12

care facility) or an elementary school for boys, or both. In the time period under study, the highest
amount of money spent by legislators was on road projects, followed by water-related projects.
How does MNA development fund spending work in the Pakistani context? Each MNA is
allocated the same amount of money in each budget year. However, the key thing to note is that
this money is not handed over to them at the start of the year to spend as they wish. MNAs
must propose the exact projects that they wish to be implemented. In this proposal, they must
also submit a detailed cost estimate, as well as suggest executing agencies who can implement the
project. This proposal is then put through a process of bureaucratic approval. The projects are
approved at the top by the heads of a federal ministry and an implementation agency is assigned17.
Funds are then disbursed directly to the executing agency selected for project implementation, and
the project is underway.
The entire amount allocated for development fund spending in every year is not spent by many
MNAs, similar to the situation with Indian MPLADS, the analagous development program for Lok
Sabha legislators in India18. In fact, many MNAs spend less than the allocated amount; some
spend more; and some do not propose projects at all19. This variation in total spending provides
a very useful measure for legislator e¤ort. Since there is a considerable amount of e¤ort required
to decide on projects and propose them with a detailed cost analysis, total spending by MNAs can
plausibly be interpreted as e¤ort expended by them in pursuing their political duties towards their
constituents. This interpretation of total funds spent as e¤ort was con�rmed by a senior Ministry
o¢ cer20. This is especially useful given that other measures of legislator e¤ort (or those correlated
with it) are not available, since voting in the legislature is not recorded in Pakistan. It is even more
salient given that development schemes form a large part of what constituencies expect from their
legislators in Pakistan.
17Speci�cally, the Secretary and Minister of Local Government and Rural Development Ministry is responsiblefor �nal approval of the proposal. If the cost estimate exceeds the allocation, the projects are prioritized accordingto cost. These cost estimates are also veri�ed by the AGPR (Accountant General, Pakistan Revenue) o¢ ce inconsultation with the designated executing agency. The majority of projects are implemented by the Pakistan PublicWorks Department, followed by the Local Government and Rural Development Department and the Water and PowerDevelopment Agency.18See Keefer and Khemani (2007) for an analysis of MPLADS in India.19The latter group of MNAs is missing in the data provided by the Ministry, and a Ministry o¢ cer con�rmed that
this was so because they had not spent their development fund money in that year.20Keefer and Khemani (2007) also interpret MPLADS similarly.
13

4.4 Agriculturist Data
The data source is a collection of biographies of MPs published by the Lok Sabha. These biographies
are available for all legislators for the 1991, 1996, 1998, and 1999 elections (4 out of 8 elections in
my sample). MPs are asked to declare their occupations; they can declare a number of di¤erent
occupations at the same time. What is relevant for this paper is whether the politician is an
agriculturist or not, and whether it is one of his occupations or his only one.
5 Political Context
5.1 Pakistan
5.1.1 Background
The time duration under study in this paper was a purely democratic period in Pakistan between
two military regimes. Elections were competitive, with a large number of candidates and parties
running. There were four elections between 1988 and 1997. Elections were not held at �xed times
because no government was allowed to complete its term; rather, each National Assembly was
dissolved by the President prior to completing its term and early elections were announced to be
held within three months, as dictated by the Constitution. There were a number of reasons the
National Assembly was dissolved in each term, but government corruption was always cited as one
of them. Infact, in calculating my prior year rainfall measure, I exclude the rainfall in the three
months directly prior to the election because the incumbent was not in power then; I therefore use
rainfall in the twelve months prior to the Assembly dissolution21.
5.1.2 Incumbency Disadvantage
An incumbency advantage (disadvantage if negative) is de�ned as the causal advantage attributed to
being an incumbent. It cannot simply be calculated by running a regression of probability of election
in the next period on incumbency status because there may be other confounding factors correlated
with incumbency; speci�cally, a candidate may both be an incumbent and more likely to be elected
again simply because he is a great leader. We can tease out the causal incumbency advantage using
the di¤erence in the probability of winning in the next time period between someone who just
won and someone who just lost this election, the idea being that they will be similar on all other
21Later, as a robustness check, I also con�rm that rainfall during the three months while the National Assemblywas dissolved is not related to re-election.
14
dimensions; therefore we can employ regression discontinuity design for this purpose, following Lee.
Speci�cally, the regression to run would be to regress election in the next time period on a quartic
polynomial in the vote margin in this time period with an indicator for whether the politician is an
incumbent; this way, controlling parametrically for the vote margin, the coe¢ cient on incumbent
captures the causal incumbency advantage. The vote margin is de�ned as follows: for the winner,
it is his vote share minus the vote share of the runner-up; for the loser, it is his vote share minus
the winner�s vote share.
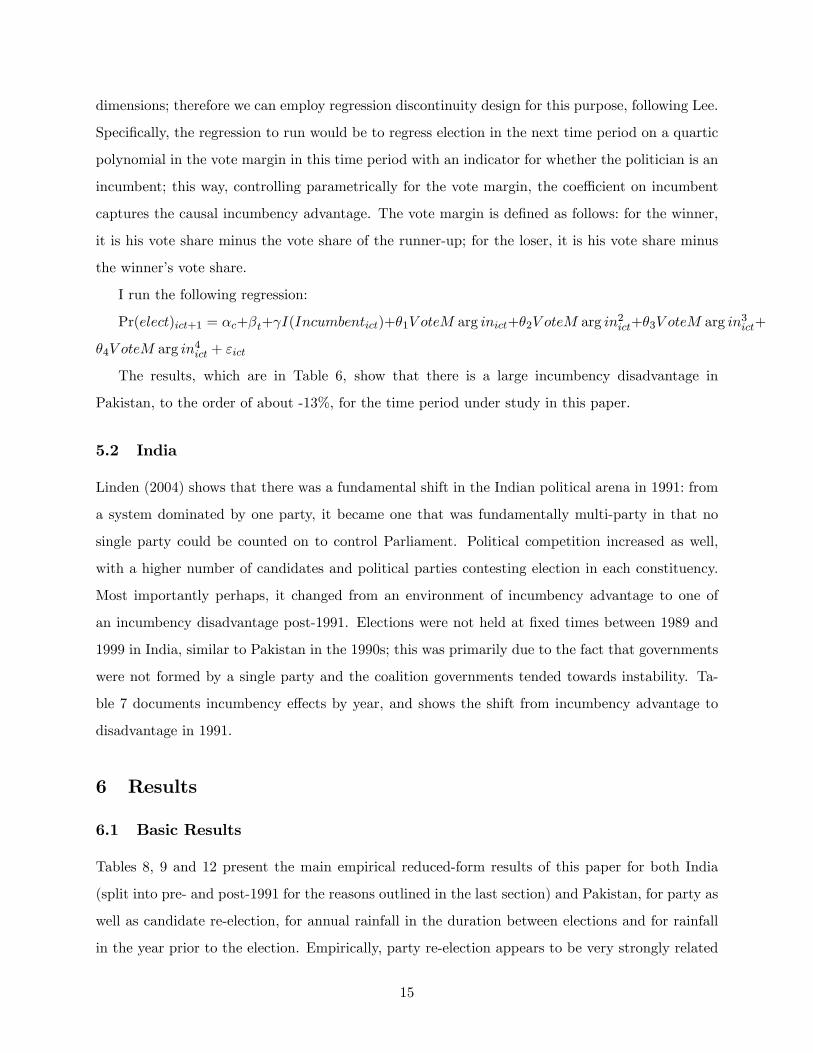
I run the following regression:
Pr(elect)ict+1 = �c+�t+ I(Incumbentict)+�1V oteM arg inict+�2V oteM arg in2ict+�3V oteM arg in3ict+
�4V oteM arg in4ict + "ict
The results, which are in Table 6, show that there is a large incumbency disadvantage in
Pakistan, to the order of about -13%, for the time period under study in this paper.
5.2 India
Linden (2004) shows that there was a fundamental shift in the Indian political arena in 1991: from
a system dominated by one party, it became one that was fundamentally multi-party in that no
single party could be counted on to control Parliament. Political competition increased as well,
with a higher number of candidates and political parties contesting election in each constituency.
Most importantly perhaps, it changed from an environment of incumbency advantage to one of
an incumbency disadvantage post-1991. Elections were not held at �xed times between 1989 and
1999 in India, similar to Pakistan in the 1990s; this was primarily due to the fact that governments
were not formed by a single party and the coalition governments tended towards instability. Ta-
ble 7 documents incumbency e¤ects by year, and shows the shift from incumbency advantage to
disadvantage in 1991.
6 Results
6.1 Basic Results
Tables 8, 9 and 12 present the main empirical reduced-form results of this paper for both India
(split into pre- and post-1991 for the reasons outlined in the last section) and Pakistan, for party as
well as candidate re-election, for annual rainfall in the duration between elections and for rainfall
in the year prior to the election. Empirically, party re-election appears to be very strongly related
15

to rainfall, while candidate re-election is weakly so (signi�cantly related for prior year rainfall for
India, and not at all for Pakistan across all speci�cations). Therefore, parties are the dimension
along which voters appear to be voting retrospectively.
The main results are as follows: rainfall is signi�cantly positively related to re-election prior to
the 1991 elections in India, and negatively related to re-election post-1991 in India. It is signi�-
cantly negatively related to re-election in Pakistan. The results hold up well for both the duration
rainfall measure as well as the prior year rain measure, although they are somewhat stronger for
the latter, consistent with the view that voters remember the most about the last year prior to
the election rather than the entire duration. Consistent with the theoretical model, the negative
relationship between rainfall and re-election exists in times of incumbency disadvantage, and the
positive relationship exists when there is an incumbency advantage.
In terms of magnitude, the India results suggest that a 10% increase in annual rainfall relative
to the mean over the duration that the incumbent was in power increases the probability of his
party being re-elected by 4.9% pre-1991, whereas a 10% increase in the same measure post-1991
decreases the probability of the incumbent�s party being re-elected by 1.7%. In Pakistan, a 10%
increase in annual rainfall relative to the average over the duration that the incumbent was in
power decreases the probability of his party being re-elected by 2%. A 10% increase in rainfall in
the year prior to the election in India is associated with a 2.8% increase in the probability of the
party being re-elected pre-1991 but a 2.3% reduction post-1991. A 10% increase in rainfall in the
year prior to the election in India is also associated with a 1.4% increase in the probability of the
candidate being re-elected pre-1991 and a 1.4% reduction post-1991. Finally, in Pakistan, a 10%
increase in rainfall in the year prior to the election decreases the probability of the incumbent�s
party being re-elected by 2%22.
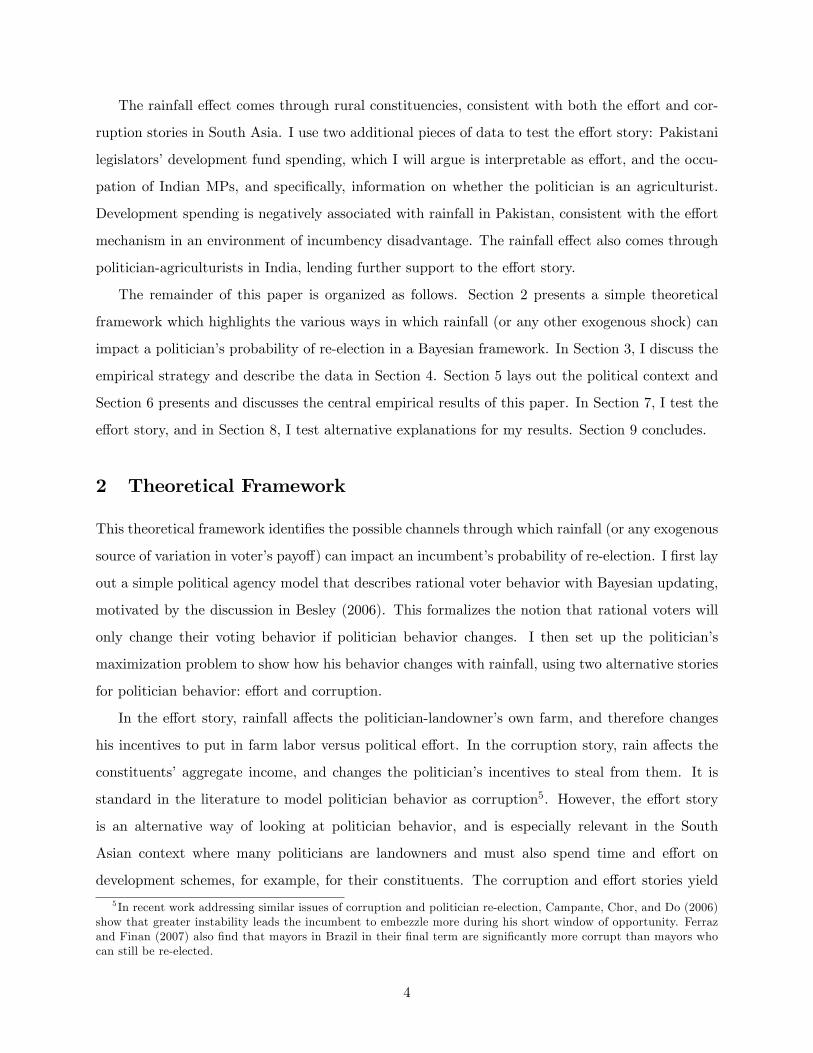
Tables 10 and 11, which break up the reduced form regressions for India up by year, show that
the shift from a positive e¤ect of rainfall on re-election to a negative e¤ect occurred exactly in
1991. Infact, the pattern of coe¢ cients more or less mirrors the shift in India�s incumbency e¤ect
coe¢ cients.22Prior year rainfall for Pakistan is rainfall in the 12 months prior to the dissolution of government, that is, rainfall
between 15 months prior to the election and 3 months prior to the election when the government was dissolved.
16
6.2 Urban-Rural
Since rainfall increases income in a constituency through crop productivity, we believe the e¤ect
on re-election should be more pronounced the more rural the constituency. For Pakistan, the
proportion of the population living in rural areas is available at the district level through the
Census23. Table 13 shows that the re-election-rainfall e¤ect comes through rural areas in Pakistan,
as we would expect. These results are consistent with both the e¤ort and the corruption stories,
because the e¤ort story goes through landlord-politicians and rainfall increases constituency income
in the corruption story through aggregate crop production.
6.3 E¤ects by Party
In India, the incumbency advantage pre-1991 was really a Congress advantage, exclusive to incum-
bents belonging to the Congress Party24. Given this, we should expect the relationship between
rainfall and re-election to be positive during this time for Congress incumbents only. This is ex-
actly what I �nd (Table 14). That is, the overall incumbency advantage is driven precisely through
Congress incumbents and the positive relationship between rainfall and re-election is also driven
exactly through Congress incumbents. More generally, the idea is that if the incumbency advan-
tage or disadvantage varies by party, the rainfall e¤ect should vary correspondingly by party as
well. Post-1991, the incumbency disadvantage exists for both Congress as well as non-Congress
incumbents, although it is stronger for non-Congress incumbents. Accordingly, we see the positive
relationship between rainfall and re-election for Congress incumbents driven down to zero, and it
is negative for non-Congress incumbents.
7 E¤ort Tests
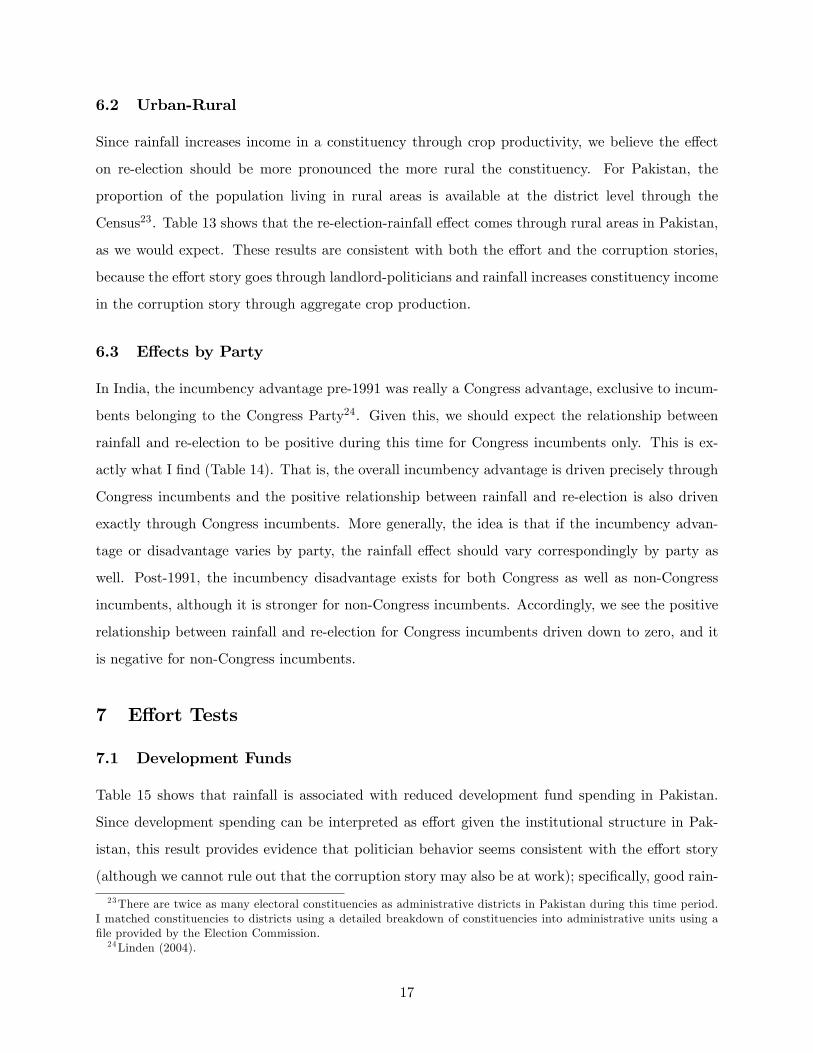
7.1 Development Funds
Table 15 shows that rainfall is associated with reduced development fund spending in Pakistan.
Since development spending can be interpreted as e¤ort given the institutional structure in Pak-
istan, this result provides evidence that politician behavior seems consistent with the e¤ort story
(although we cannot rule out that the corruption story may also be at work); speci�cally, good rain-
23There are twice as many electoral constituencies as administrative districts in Pakistan during this time period.I matched constituencies to districts using a detailed breakdown of constituencies into administrative units using a�le provided by the Election Commission.24Linden (2004).
17

fall is associated with reduced politician e¤ort, which is rational given that there is an incumbency
disadvantage in Pakistan.
7.2 Landowner-Politicians
The basic premise behind the e¤ort story is that politicians are also agriculturists who divide
their time between farming and the political arena. I have data on Indian MPs�occupations for
those elected in the years 1991, 1996, and 1998. 50% of of MPs list "agriculturist" as one of their
occupations in every year, and for approximately 10%, it is their only occupation. The latter
measure is the relevant one to use in this paper, since the e¤ort story is driven exactly by the
tradeo¤ between time on the farm and in politics, without any other occupation to divide time.
Table 16 shows that the overall negative rainfall-re-election e¤ect during this time is infact driven
by MPs whose only other occupation is farming. The interaction term of rainfall and agriculturist
is negative and signi�cant (with a one-tailed test) for my preferred speci�cation using party re-
election and prior year rainfall. The overall rainfall re-election relationship is weaker than before
because I only have data on politician occupations for a subset of elections; since I have data on
incumbents in the 1991, 1996, and 1998 elections, I am using the 1996, 1998 and 1999 elections to
look at re-election. As seen in Table 6 and Table 10, the overall e¤ect incumbency e¤ect and the
overall rainfall-re-election relationship is weaker for these years.
8 Testing Alternate Explanations
8.1 Why not an Irrational Voter?
These results are not consistent with an irrational voter response to luck. Speci�cally, an irrational
voter story would imply that politicians are always more likely to be re-elected when there is
better rainfall, and this would hold regardless of the political environment. My results show that
politicians are actually less likely to be re-elected in times of incumbency disadvantage, which
shows that the irrational voter story is de�nitely not at play during those times. Politicians are
more likely to be re-elected during times of incumbency advantage, but unless voters also shifted
from being irrational pre-1991 to rational post-1991, which is hard to believe, my results cannot be
explained by an irrational voter story.
The literature which establishes a positive relationship between good exogenous shocks and
re-election in the US argues that it is evidence of voter rationality. It is important to note that
18

my theoretical framework can explain even that relationship completely in a rational voter setting,
given that there is evidence of a strong incumbency advantage in US elections (Lee).
8.1.1 Assembly Dissolution
As mentioned earlier, the national government was dissolved prematurely after each of the four
elections under study in Pakistan, and the next election was held within three months of the
dissolution of the Assembly. I can exploit this feature of the political environment as a robustness
check, by looking at whether there is any relationship between rainfall in these three months and
re-election. The idea behind this test is that politicians are not in power during this time and there
is no such thing as politician behavior, so it cannot change during this time due to rainfall. Given
that politician behavior cannot change, rational voters should not respond to rainfall during this
time. The results in Table 17 show that there is no relationship between re-election and rainfall
during the months of Assembly dissolution and are therefore consistent with rational voter behavior.
8.1.2 Rainfall on Election Day
Rainfall on the election day may directly a¤ect re-election through a pure weather e¤ect, without
going through the channels of crop production and politician incentives. That is, election day
rainfall could systematically change voter turnout, and this in turn could a¤ect election outcomes.
Speci�cally, this rainfall may deter voters from leaving home or work to go to the polling station
simply because it is inconvenient to do so, thereby reducing voter turnout. On the other hand,
rainfall may make it inconvenient to work outdoors, and more farmers may be able to leave work
that day in order to vote. Either way, a relationship between rainfall on election day and voter
turnout is suggestive of some sort of selection of voters in response to the weather, which may then
a¤ect election outcomes and thus re-election.
I test for this using rainfall in the election month as a proxy for election day rainfall. This
proxy, although imperfect, is quite relevant in South Asia because elections are staggered over a
period of about a month across di¤erent constituencies, given the sheer scale of voting by such
a large population. The results (Table 18) show that there is no e¤ect of rainfall in the election
month on voter turnout. This is consistent with rational voters, because it shows no evidence of a
pure weather e¤ect on voting.
19
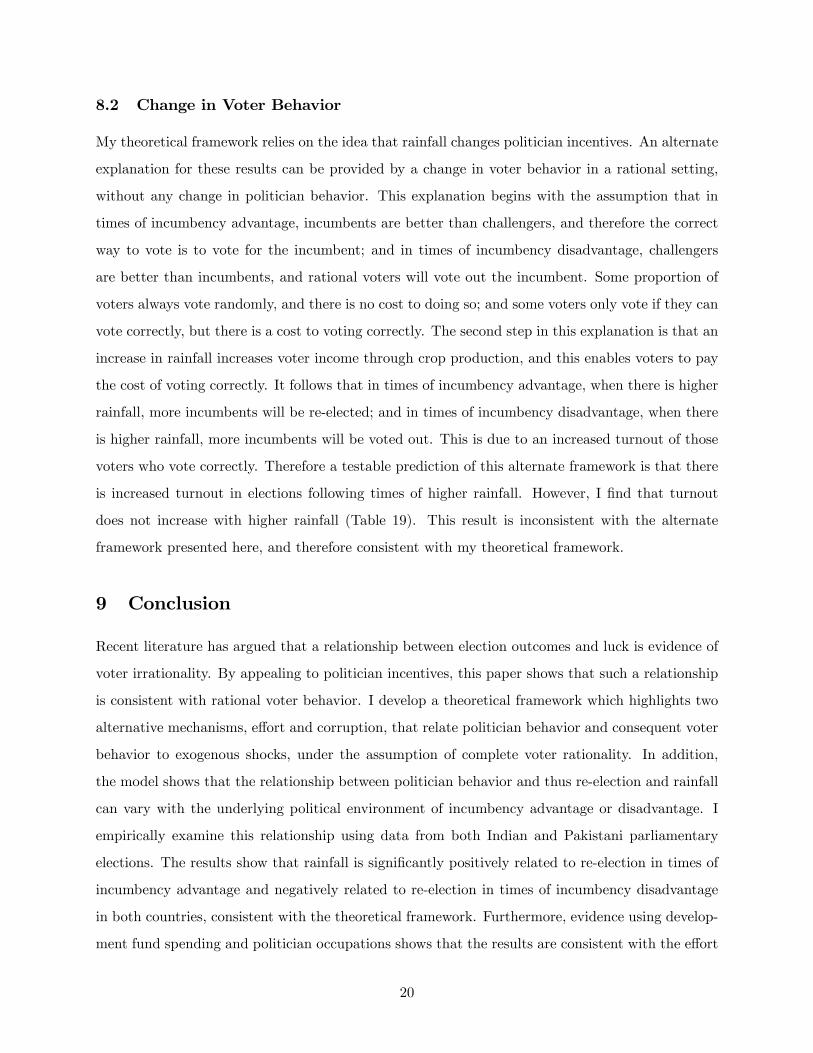
8.2 Change in Voter Behavior
My theoretical framework relies on the idea that rainfall changes politician incentives. An alternate
explanation for these results can be provided by a change in voter behavior in a rational setting,
without any change in politician behavior. This explanation begins with the assumption that in
times of incumbency advantage, incumbents are better than challengers, and therefore the correct
way to vote is to vote for the incumbent; and in times of incumbency disadvantage, challengers
are better than incumbents, and rational voters will vote out the incumbent. Some proportion of
voters always vote randomly, and there is no cost to doing so; and some voters only vote if they can
vote correctly, but there is a cost to voting correctly. The second step in this explanation is that an
increase in rainfall increases voter income through crop production, and this enables voters to pay
the cost of voting correctly. It follows that in times of incumbency advantage, when there is higher
rainfall, more incumbents will be re-elected; and in times of incumbency disadvantage, when there
is higher rainfall, more incumbents will be voted out. This is due to an increased turnout of those
voters who vote correctly. Therefore a testable prediction of this alternate framework is that there
is increased turnout in elections following times of higher rainfall. However, I �nd that turnout
does not increase with higher rainfall (Table 19). This result is inconsistent with the alternate
framework presented here, and therefore consistent with my theoretical framework.
9 Conclusion
Recent literature has argued that a relationship between election outcomes and luck is evidence of
voter irrationality. By appealing to politician incentives, this paper shows that such a relationship
is consistent with rational voter behavior. I develop a theoretical framework which highlights two
alternative mechanisms, e¤ort and corruption, that relate politician behavior and consequent voter
behavior to exogenous shocks, under the assumption of complete voter rationality. In addition,
the model shows that the relationship between politician behavior and thus re-election and rainfall
can vary with the underlying political environment of incumbency advantage or disadvantage. I
empirically examine this relationship using data from both Indian and Pakistani parliamentary
elections. The results show that rainfall is signi�cantly positively related to re-election in times of
incumbency advantage and negatively related to re-election in times of incumbency disadvantage
in both countries, consistent with the theoretical framework. Furthermore, evidence using develop-
ment fund spending and politician occupations shows that the results are consistent with the e¤ort
20
story, but this does not rule out the corruption story being at play as well.
References
Achen, C. H. and Bartels, L. M. (2004). Blind retrospection: Electoral Responses to Drought, Flu,
and Shark Attacks.
Banks, J. S. and Sundaram, R. K. (1998). Optimal Retention in Agency Problems. Journal of
Economic Theory, 82:293�323.
Berganza, J. C. (2000). Two roles for elections: Disciplining the incumbent and selecting a compe-
tent candidate. Public Choice, 105:165�193.
Bertrand, M. and Mullainathan, S. (2001). Are CEOs Rewarded for Luck? The Ones without
Principals are. The Quarterly Journal of Economics, 116(3):901�932.
Besley, T. (2006). Principled Agents? The Political Economy of Good Government. Oxford Uni-
versity Press, New York.
Besley, T. and Burgess, R. (2002). The Political Economy of Government Responsiveness: Theory
and Evidence from India. The Quarterly Journal of Economics, 117(4):1415�1451.
Besley, T., Pande, R., and Rao, V. (2005). Political Selection and the Quality of Government:
Evidence from South India.
Ferejohn, J. (1986). Incumbent Performance and Electoral Control. Public Choice, 50:5�25.
Ferraz, C. and Finan, F. (2005). Exposing Corrupt Politicians: The E¤ect of Brazil�s Publicly
released Audits on Electoral Outcomes.
Fiorina, M. P. (1981). Retrospective Voting in American National Elections. Yale University Press,
New Haven.
Healy, A. (2006). Do Voters Punish Politicians for Bad Weather?
Jayachandran, S. (2006). Selling labor low: Wage responses to productivity shocks in developing
countries. Journal of Political Economy, 114(3):538�575.
Keefer, P. and Khemani, S. (2007). Why Do Some Legislators not Like Pork?
21
Lee, D. S. Randomized Experiments from Non-random Selection in U.S. House Elections. Journal
of Econometrics.
V. O. Key, J. (1966). The Responsible Electorate. Harvard University Press, Cambridge.
Wolfers, J. (2007). Are Voters Rational? Evidence from Gubernatorial Elections.
A Appendix
A.1 E¤ort:
Di¤erentiating the politician�s maximization problem with respect to e gives his optimal choice for
e and L :
FOC : p0(e�)U(R�L1��+W )� p(e�)U 0(R�L1��+W )(1��)R�L��� p0(e�)U(R�L1��)� (1�
p(e�))U 0(R�L1��)(1� �)R�L�� = 0
Di¤erentiating the FOC with respect to R gives @e@R :
NumeratorDenominator
Numerator:�fp0(e)�R��1L1��[U 0(R�L1��+W )�U 0(R�L1��)]�p(e)�(1��)R2��1L1�2�[U 00(R�L1��+
W )�U 00(R�L1��)]��(1��)R2��1L1�2�U 00(R�L1��)�p(e)�(1��)R��1L��[U 0(R�L1��+W )�
U 0(R�L1��)]� �(1� �)R��1L��U 0(R�L1��)g
Denominator:p00(e)U(R�L1��+W )�2p0(e)U 0(R�L1��+W )(1��)R�L��+p(e)U 00(R�L1��+
W )(1��)2R2�L�2��p00(e)U(R�L1��)+2p0(e)U 0(R�L1��)(1��)R�L��+(1�p(e))U 00(R�L1��)(1�
�)2R2�L�2� � p(e)U 0(R�L1�� +W )(1� �)�R�L���1 � (1� p(e))U 0(R�L1��)(1� �)R�L���1 =
SOC < 0
Assume U 00(R�L1�� +W )� U 00(R�L1��) � 0 which is true if U 000 = 0
Then we can see that:
i) @e@R < 0 when p = 0 if p
0(e)�R��1L1��[U 0(R�L1�� +W )� U 0(R�L1��)]� U 00(R�L1��)(1�
�)�R2��1L1�2� � U 0(R�L1��)(1� �)�R��1L�� < 0
ii) @e@R > 0 when p = 1 if p
0(e)�R��1L1��[U 0(R�L1�� +W )�U 0(R�L1��)]�U 00(R�L1��)(1�
�)�R2��1L1�2��U 0(R�L1��)(1��)�R��1L��+(1��)�R��1L��[U 0(R�L1��)�U 0(R�L1��+
W )] < 0:
These conditions hold for su¢ ciently large W and concave p(e).
We can also see that an exogenous increase in p(e), which can be represented by p(e) + c; c > 0
causes an increase in @e@R :
Speci�cally, @@c(
@e@R) = (1� �)�R
��1L��[U 0(R�L1��)� U 0(R�L1�� +W )] > 0:
22
A.2 Corruption:
Di¤erentiating the politician�s maximization problem with respect to � gives his optimal choice for
� :
FOC : p0(��)U(��f(R)+W )+p(��)U 0(��f(R)+W )f(R)�p0(��)U(��f(R))+(1�p(��))U 0(��f(R))f(R) =
0
Di¤erentiating the FOC with respect to R gives @�@R :
NumeratorDenominator
Numerator: �fp0(�)�f 0(R)[U 0(�f(R)+W )�U 0(�f(R))]+ p(�)�f 0(R)f(R)[U 00(�f(R)+W )�
U 00(�f(R))]+p(�)f 0(R)[U 0(�f(R)+W )�U 0(�f(R))]+U 0(�f(R))f 0(R)+�f 0(R)f(R)U 00(�f(R))g
Denominator: p00(�)U(�f(R) +W ) + p0(�)U 0(�f(R) +W )f(R) + p0(�)U 0(�f(R) +W )f(R) +
p(�)U 00(�f(R) +W )f(R)2 � p00(�)U(�f(R))� p0(�)U 0(�f(R))f(R)� p0(�)U 0(�f(R))f(R) + (1�
p(�))U 00(�f(R))f(R)2 = SOC < 0
Assume U 00(�f(R) +W )� U 00(�f(R)) � 0 which is true if U 000 = 0
Then we can see that:
i) @�@R > 0 when p = 0 if p
0(�)�f 0(R)[U 0(�f(R) +W )� U 0(�f(R))] + U 00(�f(R))f(R)�f 0(R) +
U 0(�f(R))f 0(R) > 0
ii) @�@R < 0 when p = 1 if p0(�)�f 0(R)[U 0(�f(R) +W )�U 0(�f(R))] +U 00(�f(R))f(R)�f 0(R) +
f 0(R)[U 0(�f(R) +W )� U 0(�f(R))] + U 0(�f(R))f 0(R) < 0
These conditions are true for su¢ ciently large W and convex p(�).
We can also see that an exogenous increase in p(�), which can be represented by p(�)+ c; c > 0
causes a decrease in @�@R :
Speci�cally, @@c(
@�@R) = f
0(R)[U 0(�f(R) +W )� U 0(�f(R))] < 0:
23
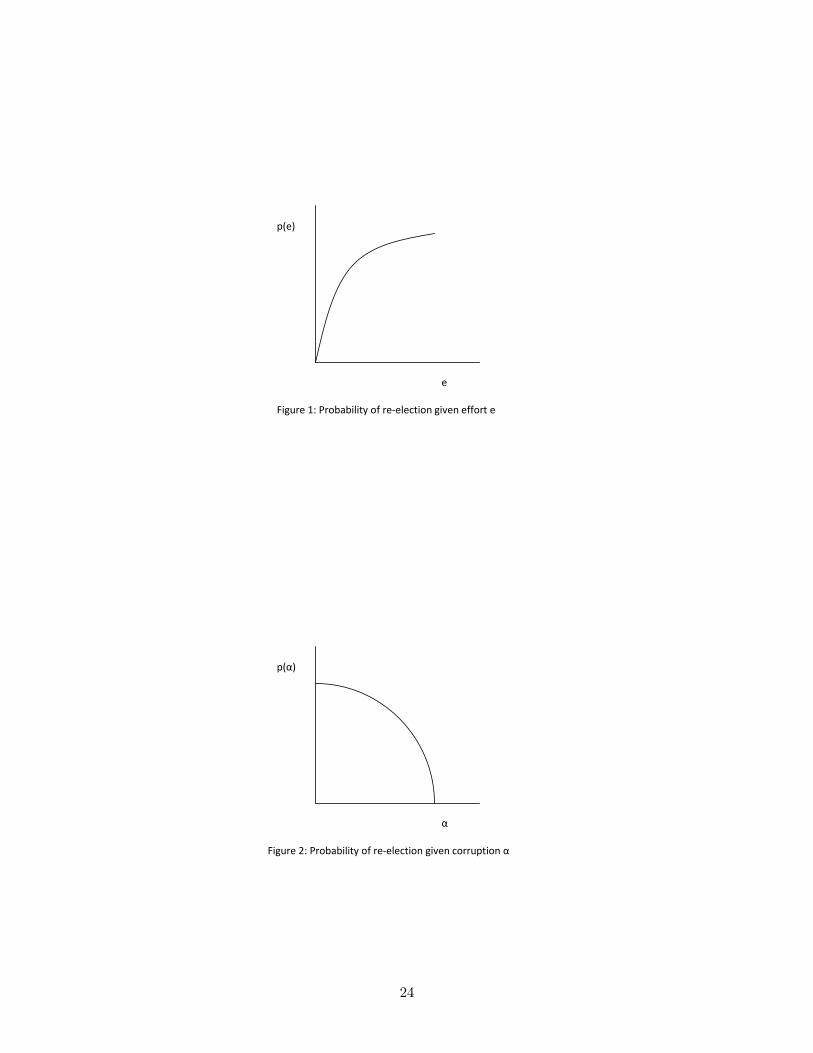
p(e)
e
Figure 1: Probability of reelection given effort e
p(α)
α
Figure 2: Probability of reelection given corruption α
24

B Tables
Table 1: Change in Politician Behavior with Rainfall
Incumbency Incumbency
Advantage Disadvantage
@Corruption@Rain < 0 > 0
@Effort@Rain > 0 < 0
25

Table 2: India Rainfall Summary Statistics
India Rainfall Means (mm)
Election Year Duration Prior Year
1980 1379.86 1120.05
(612.43) (573.42)
1984 1295.62 1294.82
(590.78) (726.55)
1989 1280.84 1150.72
(599.04) (610.17)
1991 1108.39 1309.98
(468.72) (600.25)
1996 1358.65 1130.97
(559.28) (588.68)
1998 1424.31 1226.41
(614.52) (540.88)
1999 1350.73 1223.48
(653.20) (602.70)
Obs 536 536
26
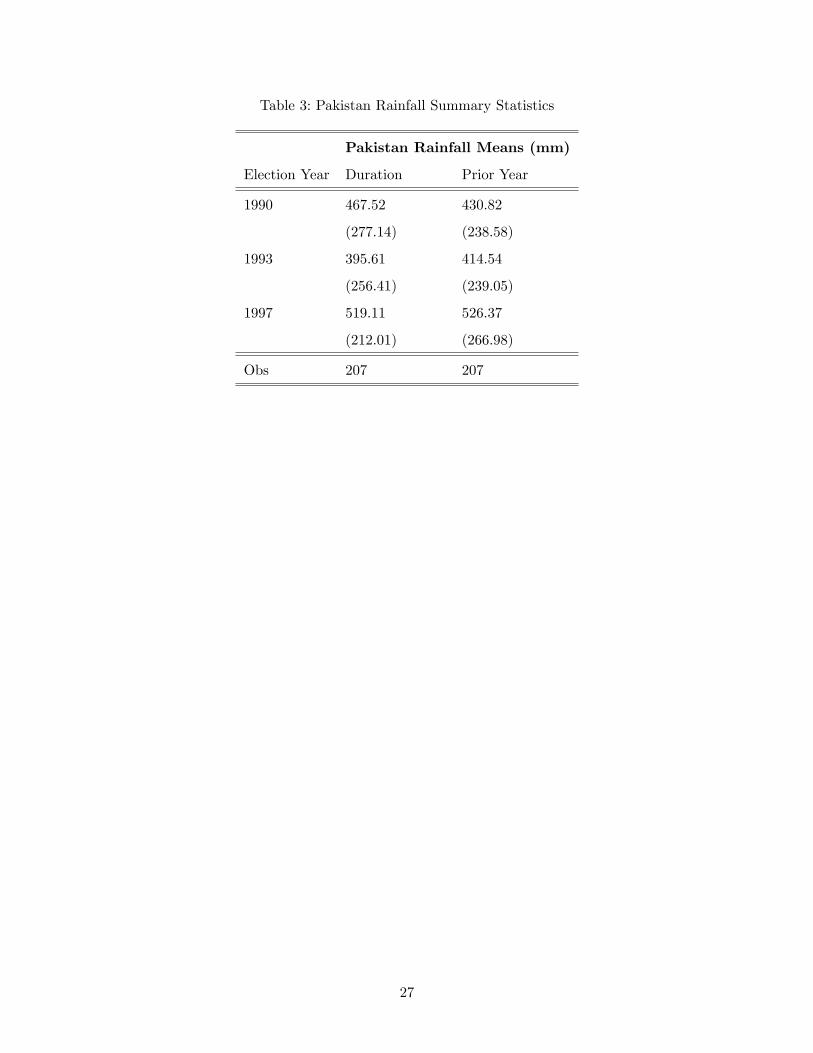
Table 3: Pakistan Rainfall Summary Statistics
Pakistan Rainfall Means (mm)
Election Year Duration Prior Year
1990 467.52 430.82
(277.14) (238.58)
1993 395.61 414.54
(256.41) (239.05)
1997 519.11 526.37
(212.01) (266.98)
Obs 207 207
27

Table 4: India Re-election Summary Statistics
India Re-election Means
Election Year Party Candidate
1980 0.29 0.19
(0.46) (0.39)
1984 0.64 0.29
(0.48) (0.46)
1989 0.37 0.22
(0.48) (0.42)
1991 0.59 0.42
(0.49) (0.49)
1996 0.49 0.27
(0.50) (0.45)
1998 0.50 0.39
(0.50) (0.49)
1999 0.50 0.43
(0.50) (0.50)
Obs 504 503
28
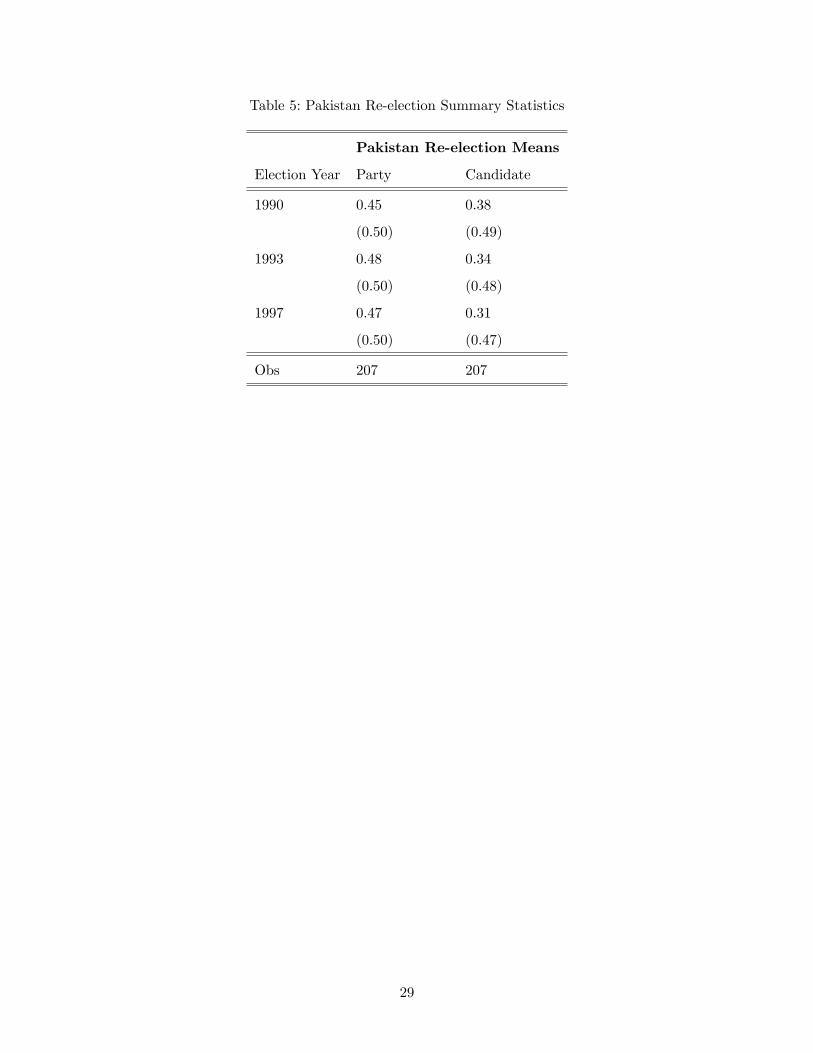
Table 5: Pakistan Re-election Summary Statistics
Pakistan Re-election Means
Election Year Party Candidate
1990 0.45 0.38
(0.50) (0.49)
1993 0.48 0.34
(0.50) (0.48)
1997 0.47 0.31
(0.50) (0.47)
Obs 207 207
29

Table 6: Pakistan�s Incumbency Disadvantage
Quartic Polynomial Regression
Probability of Election
Incumbent -0.133***
(0.050)
Quartic in vote margin
Fixed e¤ects constituency, year
R-sq 0.25
Obs 4048
Notes:
OLS regression with robust standard errors clustered by constituency in parentheses.
* denotes signi�cance at 10%, ** at 5%, and *** at 1%.
30

Table 7: India Incumbency E¤ects
Notes:
Source: Linden (2004).
31

Table 8: India Reduced Form: Party Re-election
India Reduced Form: Party Re-elect
Pre 1991 Post 1991
Ratio (Duration 0.4870*** -0.1710*
Rain) (0.1004) (0.1030)
Ratio (Prior 0.2384*** -0.2106***
Year Rain) (0.0877) (0.0794)
R-sq 0.51 0.51 0.33 0.33
Obs 1503 1503 2004 2004
Notes:
OLS regressions with robust standard errors clustered by longitude-latitude grid point in paren-
theses.
* denotes signi�cance at 10%, ** at 5%, and *** at 1%.
32

Table 9: India Reduced Form: Candidate Re-election
India Reduced Form: Candidate Re-elect
Pre 1991 Post 1991
Ratio (Duration 0.0014 -0.1277
Rain) (0.1050) (0.0954)
Ratio (Prior 0.1832** -0.1598**
Year Rain) (0.0862) (0.0759)
R-sq 0.39 0.39 0.36 0.36
Obs 1500 1500 2000 2000
Notes:
OLS regressions with robust standard errors clustered by longitude-latitude grid point in paren-
theses.
* denotes signi�cance at 10%, ** at 5%, and *** at 1%.
33
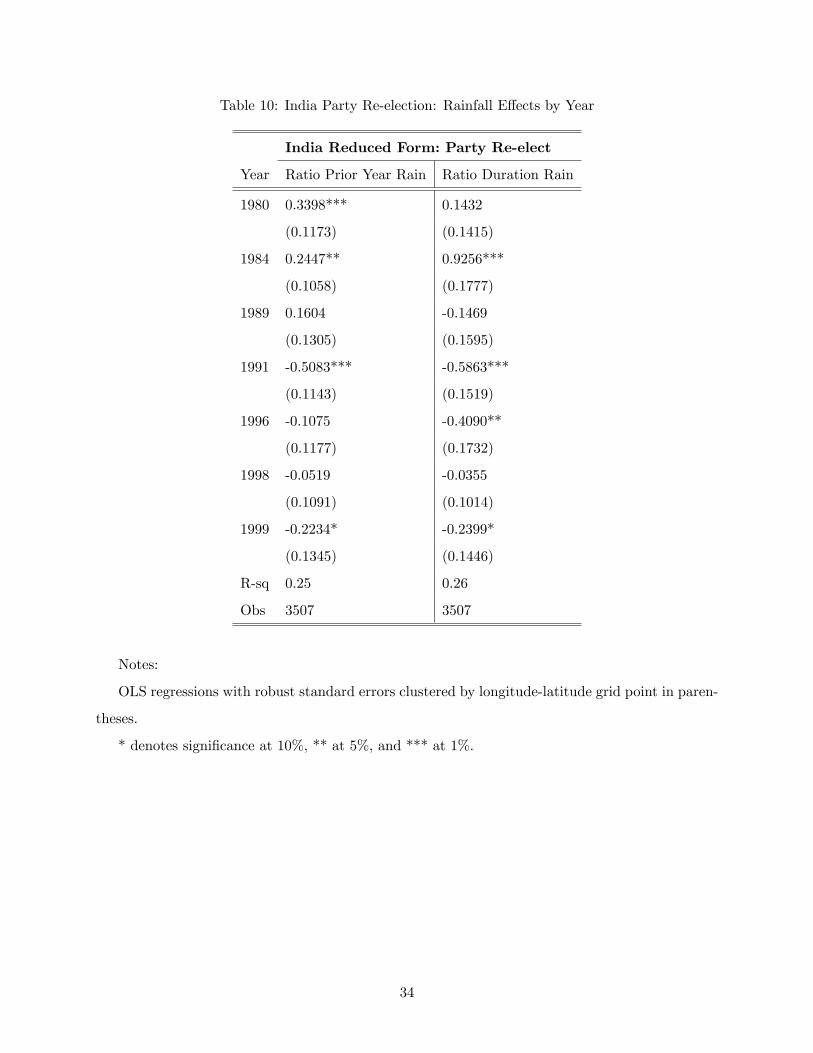
Table 10: India Party Re-election: Rainfall E¤ects by Year
India Reduced Form: Party Re-elect
Year Ratio Prior Year Rain Ratio Duration Rain
1980 0.3398*** 0.1432
(0.1173) (0.1415)
1984 0.2447** 0.9256***
(0.1058) (0.1777)
1989 0.1604 -0.1469
(0.1305) (0.1595)
1991 -0.5083*** -0.5863***
(0.1143) (0.1519)
1996 -0.1075 -0.4090**
(0.1177) (0.1732)
1998 -0.0519 -0.0355
(0.1091) (0.1014)
1999 -0.2234* -0.2399*
(0.1345) (0.1446)
R-sq 0.25 0.26
Obs 3507 3507
Notes:
OLS regressions with robust standard errors clustered by longitude-latitude grid point in paren-
theses.
* denotes signi�cance at 10%, ** at 5%, and *** at 1%.
34
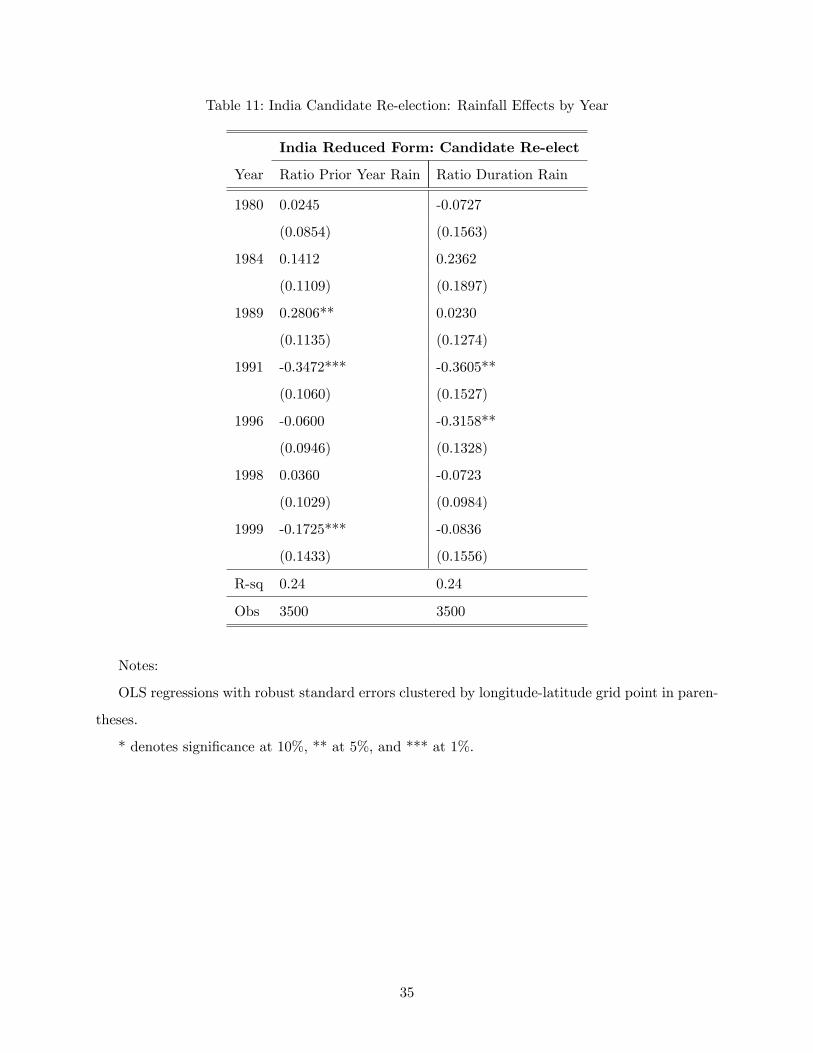
Table 11: India Candidate Re-election: Rainfall E¤ects by Year
India Reduced Form: Candidate Re-elect
Year Ratio Prior Year Rain Ratio Duration Rain
1980 0.0245 -0.0727
(0.0854) (0.1563)
1984 0.1412 0.2362
(0.1109) (0.1897)
1989 0.2806** 0.0230
(0.1135) (0.1274)
1991 -0.3472*** -0.3605**
(0.1060) (0.1527)
1996 -0.0600 -0.3158**
(0.0946) (0.1328)
1998 0.0360 -0.0723
(0.1029) (0.0984)
1999 -0.1725*** -0.0836
(0.1433) (0.1556)
R-sq 0.24 0.24
Obs 3500 3500
Notes:
OLS regressions with robust standard errors clustered by longitude-latitude grid point in paren-
theses.
* denotes signi�cance at 10%, ** at 5%, and *** at 1%.
35

Table 12: Pakistan Reduced Form
Pakistan Reduced Form
Party Re-elect Candidate Re-elect
Ratio (Duration -0.2038** -0.0079
Rain) (0.9061) (0.0847)
Ratio (Prior -0.2041** -0.0044
Year Rain) (0.0847) (0.1085)
R-sq 0.55 0.54 0.44 0.44
Obs 621 621 617 617
Notes:
OLS regressions with robust standard errors clustered by longitude-latitude grid point in paren-
theses.
* denotes signi�cance at 10%, ** at 5%, and *** at 1%.
36
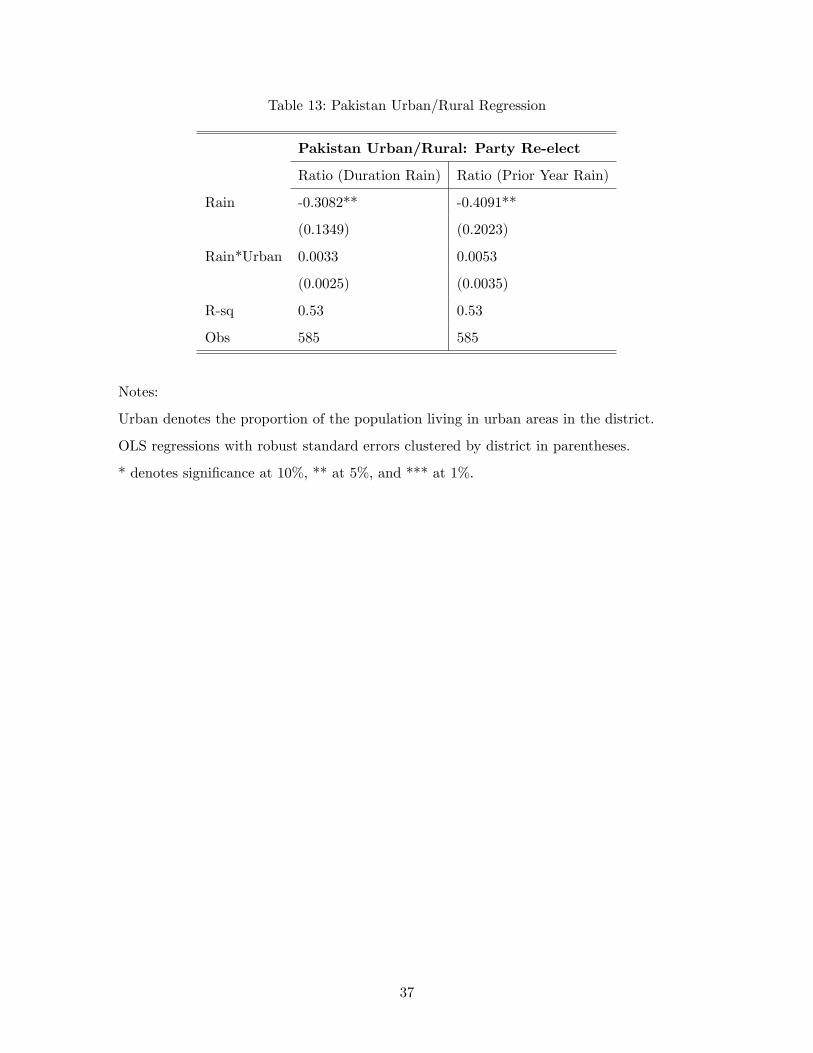
Table 13: Pakistan Urban/Rural Regression
Pakistan Urban/Rural: Party Re-elect
Ratio (Duration Rain) Ratio (Prior Year Rain)
Rain -0.3082** -0.4091**
(0.1349) (0.2023)
Rain*Urban 0.0033 0.0053
(0.0025) (0.0035)
R-sq 0.53 0.53
Obs 585 585
Notes:
Urban denotes the proportion of the population living in urban areas in the district.
OLS regressions with robust standard errors clustered by district in parentheses.
* denotes signi�cance at 10%, ** at 5%, and *** at 1%.
37
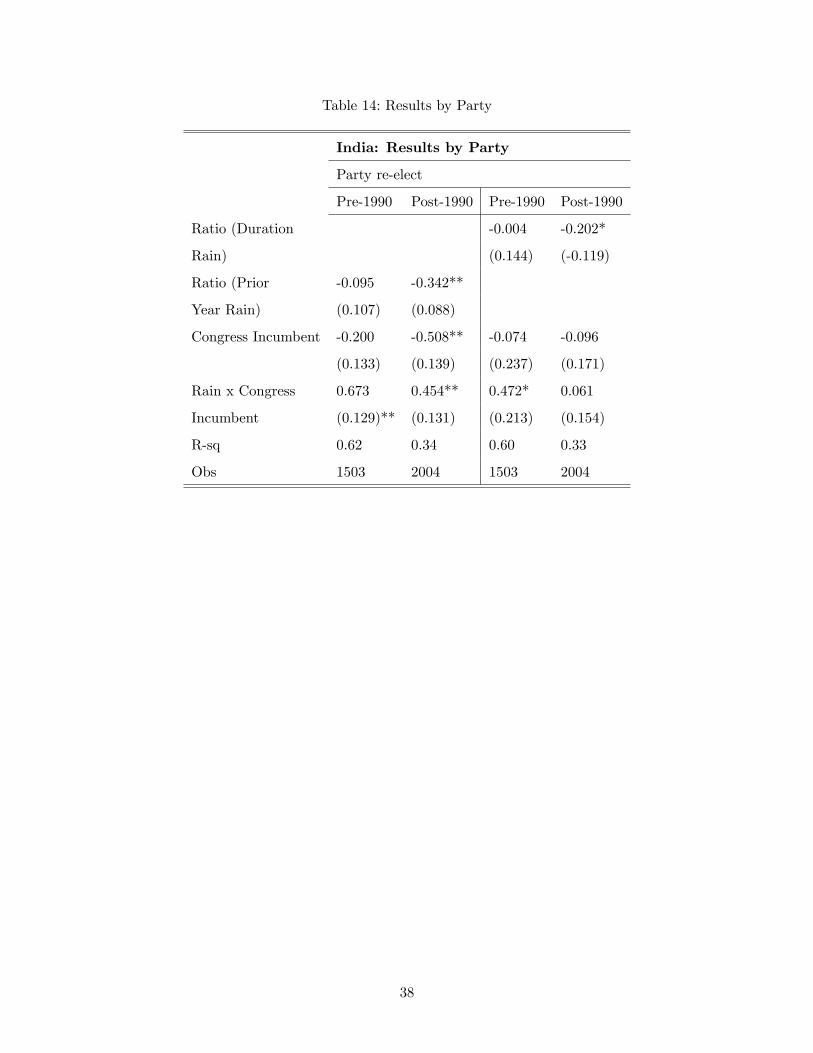
Table 14: Results by Party
India: Results by Party
Party re-elect
Pre-1990 Post-1990 Pre-1990 Post-1990
Ratio (Duration -0.004 -0.202*
Rain) (0.144) (-0.119)
Ratio (Prior -0.095 -0.342**
Year Rain) (0.107) (0.088)
Congress Incumbent -0.200 -0.508** -0.074 -0.096
(0.133) (0.139) (0.237) (0.171)
Rain x Congress 0.673 0.454** 0.472* 0.061
Incumbent (0.129)** (0.131) (0.213) (0.154)
R-sq 0.62 0.34 0.60 0.33
Obs 1503 2004 1503 2004
38

Table 15: Pakistan Development Fund Spending
Development Fund Spending
Ratio (Prior -6.0559***
year rain) (1.1635)
Fixed E¤ects constituency
election year
R-sq 0.61
Obs 621
Notes:
OLS regressions with robust standard errors clustered by longitude-latitude grid point in paren-
theses.
* denotes signi�cance at 10%, ** at 5%, and *** at 1%.
39

Table 16: Agriculturist Results
India: Agriculturist Results
Party re-elect Candidate re-elect
Ratio (Duration 0.287* 0.078
Rain) (0.151) (0.146)
Ratio (Prior 0.135 0.044
Year Rain) (0.114) (0.103)
Only agriculturist 0.493* 0.260 0.203 0.154
(0.282) (0.272) (0.243) (0.225)
Rain x Only -0.443 -0.181 -0.213 -0.145
agriculturist (0.274) (0.235) (0.238) (0.198)
R-sq 0.45 0.45 0.46 0.46
Obs 1503 1503 1500 1500
Notes:
OLS regressions with robust standard errors clustered by longitude-latitude grid point in paren-
theses.
* denotes signi�cance at 10%, ** at 5%, and *** at 1%.
40
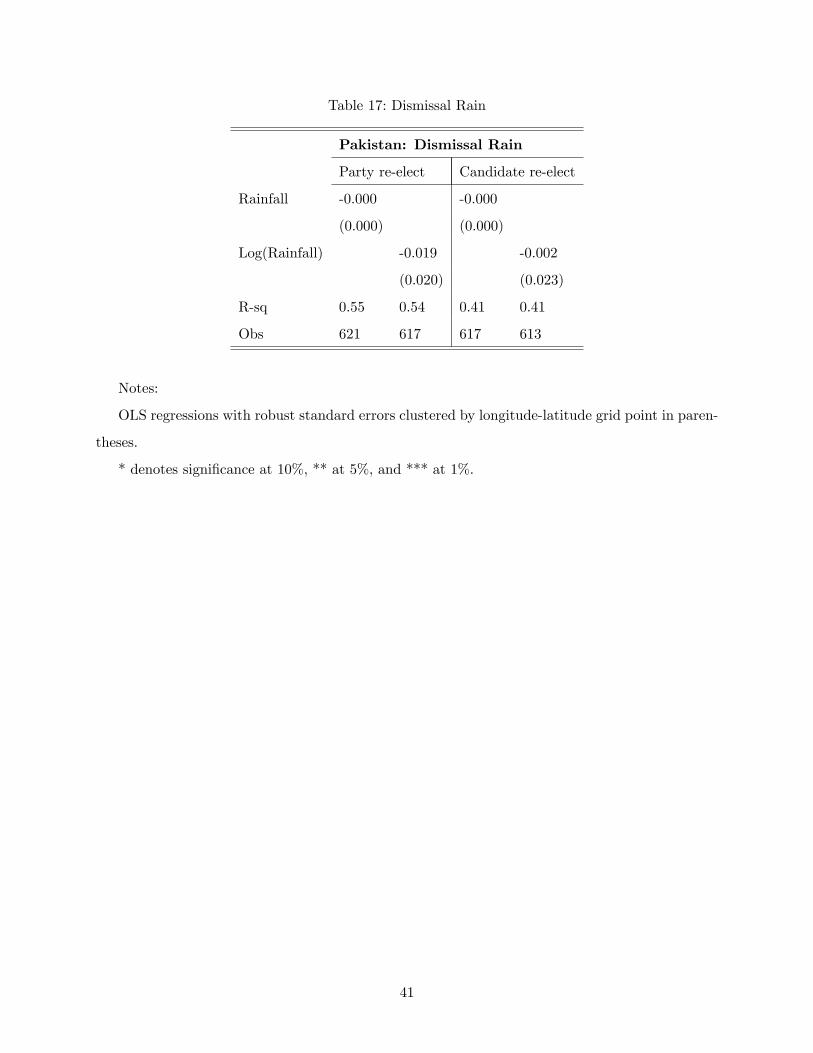
Table 17: Dismissal Rain
Pakistan: Dismissal Rain
Party re-elect Candidate re-elect
Rainfall -0.000 -0.000
(0.000) (0.000)
Log(Rainfall) -0.019 -0.002
(0.020) (0.023)
R-sq 0.55 0.54 0.41 0.41
Obs 621 617 617 613
Notes:
OLS regressions with robust standard errors clustered by longitude-latitude grid point in paren-
theses.
* denotes signi�cance at 10%, ** at 5%, and *** at 1%.
41
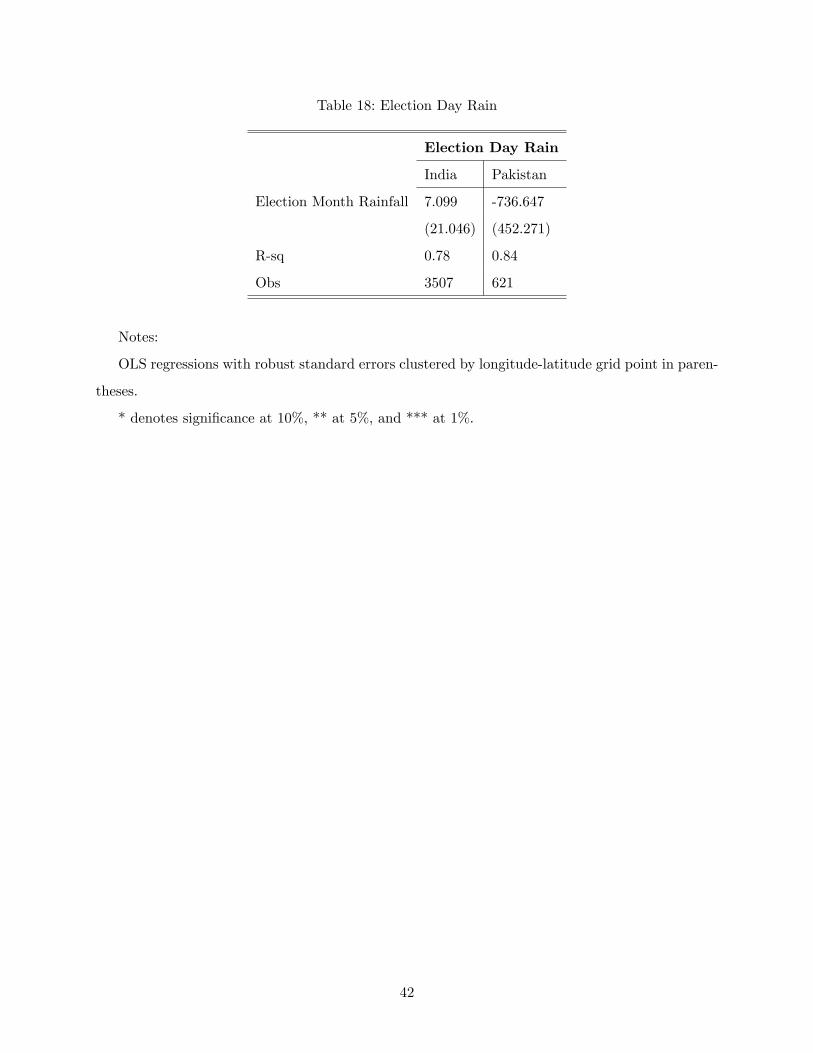
Table 18: Election Day Rain
Election Day Rain
India Pakistan
Election Month Rainfall 7.099 -736.647
(21.046) (452.271)
R-sq 0.78 0.84
Obs 3507 621
Notes:
OLS regressions with robust standard errors clustered by longitude-latitude grid point in paren-
theses.
* denotes signi�cance at 10%, ** at 5%, and *** at 1%.
42

Table 19: Voter Behavior
Voter Behavior Explanation
Log (Voter Turnout)
India Pakistan
Ratio (Prior Year Rain) -0.015 -0.345**
(0.022) (0.086)
Ratio (Duration Rain) -0.135** 0.014
(0.030) (0.084)
R-sq 0.78 0.83 0.74 0.74
Obs 4007 3507 616 616
Notes:
OLS regressions with robust standard errors clustered by longitude-latitude grid point in paren-
theses.
* denotes signi�cance at 10%, ** at 5%, and *** at 1%.
43
Related Documents


