MORPHOMETRIC DATA Flushing Rate (yr¹) 1,357,500 Variable Milfoil 1990 2004 EUTROPHIC EUTROPHIC 5.4 1.7 5,800 4.4 Max. Depth (m): Mean Depth (m): Volume (m³): Watershed Area (Ac.): Shore Length (m): PEARLY LAKE, RINDGE, NH TROPHIC CLASSIFICATION KNOWN EXOTIC SPECIES Year Trophic class Surface Area (Ac.): 142 Elevation (ft): 1006 P Retention Coef: 0.59 The Waterbody Report Card tables are generated from the 2012 305(b) report on the status of N.H. waters, and are based on data collected from 2001-2011. Volunteer Lake Assessment Program Individual Lake Reports 2,560 Designated Use Parameter Category Comments Phosphorus (Total) Slightly Bad Aquatic Life >/=5 samples and median is >threshold. pH Bad >10%, with a minimum of 2, samples exceed criteria, with 1 or more by a large margin. D.O. (mg/L) Encouraging < 10 samples and no exceedance of criteria. More data needed. D.O. (% sat) Slightly Bad >10% of samples exceed criteria by a small margin (minimum of 2 exceedances). Chlorophyll-a Slightly Bad >5 samples and median is > threshold. E. coli Encouraging Primary Contact Recreation >2 samples exist that are > 75% of geometric mean criteria, but not enough samples to calculate geomertic mean. No single sample exceedances. More data needed. Cyanobacteria Slightly Bad Cyanobacteria bloom(s). Chlorophyll-a Slightly Bad >10% of samples exceed criteria by a small margin (minimum of 2 exceedances). BEACH PRIMARY CONTACT ASSESSMENT STATUS WATERSHED LAND USE SUMMARY Fry, J., Xian, G., Jin, S., Dewitz, J., Homer, C., Yang, L., Barnes, C., Herold, N., and Wickham, J., 2011. Completion of the 2006 National Land Cover Database for the Conterminous United States, PERS, Vol. 77(9):858-864. For larger image contact NHDES. E. coli Bad >/=1 exceedance(s) of geometric mean criterion and/or >/=2 exceedances of single sample criterion, with 1 or more >2X criteria. PEARLY LAKE-PEARLY LAKE BEACH Cyanobacteria Slightly Bad Cyanobacteria bloom(s). PEARLY LAKE-PEARLY LAKE BEACH Land Cover Category % Cover Land Cover Category % Cover Land Cover Category % Cover Open Water 8.94 Developed-Open Space 4.97 Developed-Low Intensity 0.74 Developed-Medium Intensity 0.4 Developed-High Intensity 0.01 Barren Land 0 Deciduous Forest 14.3 Evergreen Forest 27.77 Mixed Forest 27.11 Shrub-Scrub 0.61 Grassland/Herbaceous 1.1 Pasture Hay 3.43 Cultivated Crops 0.17 Woody Wetlands 7.59 Emergent Wetlands 2.86

Welcome message from author
This document is posted to help you gain knowledge. Please leave a comment to let me know what you think about it! Share it to your friends and learn new things together.
Transcript
MORPHOMETRIC DATA
Flushing Rate (yr¹)
1,357,500
Variable Milfoil
1990
2004 EUTROPHIC
EUTROPHIC
5.4
1.7
5,800
4.4Max. Depth (m):
Mean Depth (m):
Volume (m³):
Watershed Area (Ac.):
Shore Length (m):
PEARLY LAKE, RINDGE, NH
TROPHIC CLASSIFICATION KNOWN EXOTIC SPECIES
Year Trophic class
Surface Area (Ac.): 142
Elevation (ft): 1006
P Retention Coef: 0.59
The Waterbody Report Card tables are generated from the 2012 305(b) report on the status of N.H. waters, and are based on data collected from 2001-2011.
Volunteer Lake Assessment Program Individual Lake Reports
2,560
Designated Use Parameter Category Comments
Phosphorus (Total) Slightly BadAquatic Life >/=5 samples and median is >threshold.
pH Bad >10%, with a minimum of 2, samples exceed criteria, with 1 or more by a large margin.
D.O. (mg/L) Encouraging < 10 samples and no exceedance of criteria. More data needed.
D.O. (% sat) Slightly Bad >10% of samples exceed criteria by a small margin (minimum of 2 exceedances).
Chlorophyll-a Slightly Bad >5 samples and median is > threshold.
E. coli EncouragingPrimary Contact Recreation >2 samples exist that are > 75% of geometric mean criteria, but not enough samples to calculate geomertic mean. No
single sample exceedances. More data needed.
Cyanobacteria Slightly Bad Cyanobacteria bloom(s).
Chlorophyll-a Slightly Bad >10% of samples exceed criteria by a small margin (minimum of 2 exceedances).
BEACH PRIMARY CONTACT ASSESSMENT STATUS
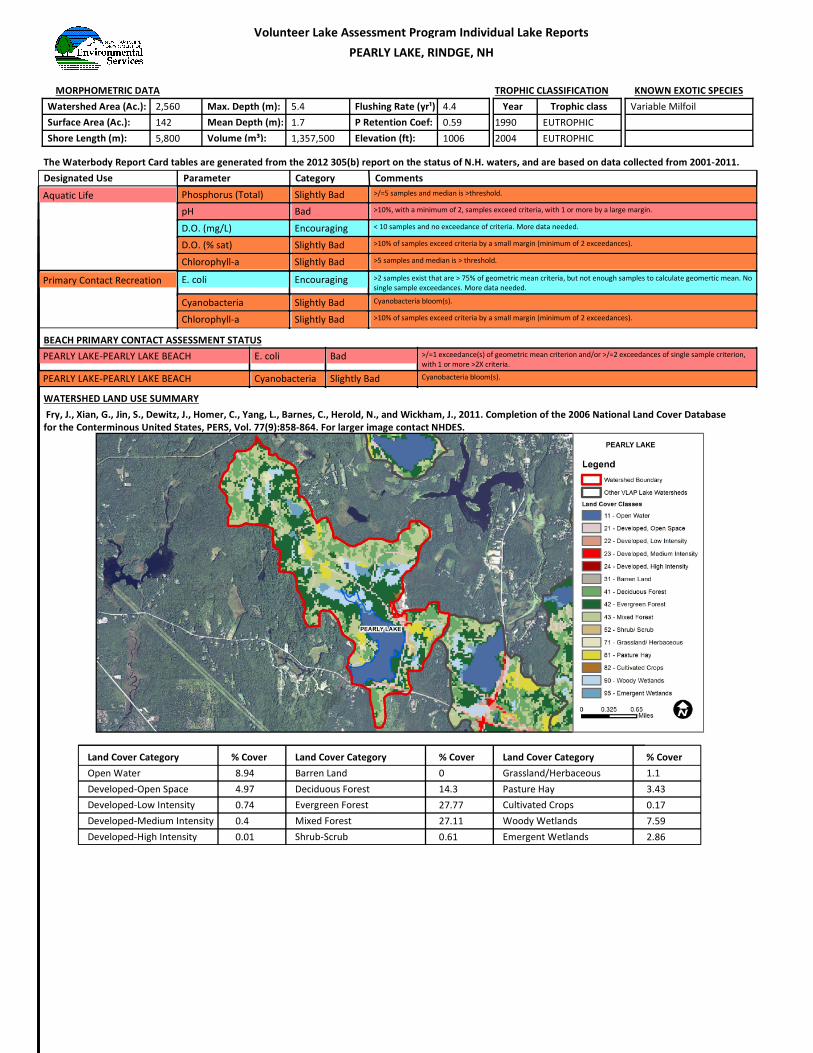
WATERSHED LAND USE SUMMARY
Fry, J., Xian, G., Jin, S., Dewitz, J., Homer, C., Yang, L., Barnes, C., Herold, N., and Wickham, J., 2011. Completion of the 2006 National Land Cover Database
for the Conterminous United States, PERS, Vol. 77(9):858-864. For larger image contact NHDES.
E. coli Bad >/=1 exceedance(s) of geometric mean criterion and/or >/=2 exceedances of single sample criterion,
with 1 or more >2X criteria.PEARLY LAKE-PEARLY LAKE BEACH
Cyanobacteria Slightly Bad Cyanobacteria bloom(s).PEARLY LAKE-PEARLY LAKE BEACH
Land Cover Category % Cover Land Cover Category % Cover Land Cover Category % Cover
Open Water 8.94
Developed-Open Space 4.97
Developed-Low Intensity 0.74
Developed-Medium Intensity 0.4
Developed-High Intensity 0.01
Barren Land 0
Deciduous Forest 14.3
Evergreen Forest 27.77
Mixed Forest 27.11
Shrub-Scrub 0.61
Grassland/Herbaceous 1.1
Pasture Hay 3.43
Cultivated Crops 0.17
Woody Wetlands 7.59
Emergent Wetlands 2.86
VOLUNTEER LAKE ASSESSMENT PROGRAM INDIVIDUAL LAKE REPORTS
PEARLY POND, RINDGE, NH
2013 DATA SUMMARY
This report was generated by the NH DES Volunteer Lake Assessment Program (VLAP). For more information contact VLAP at (603) 271-2658 or [email protected]
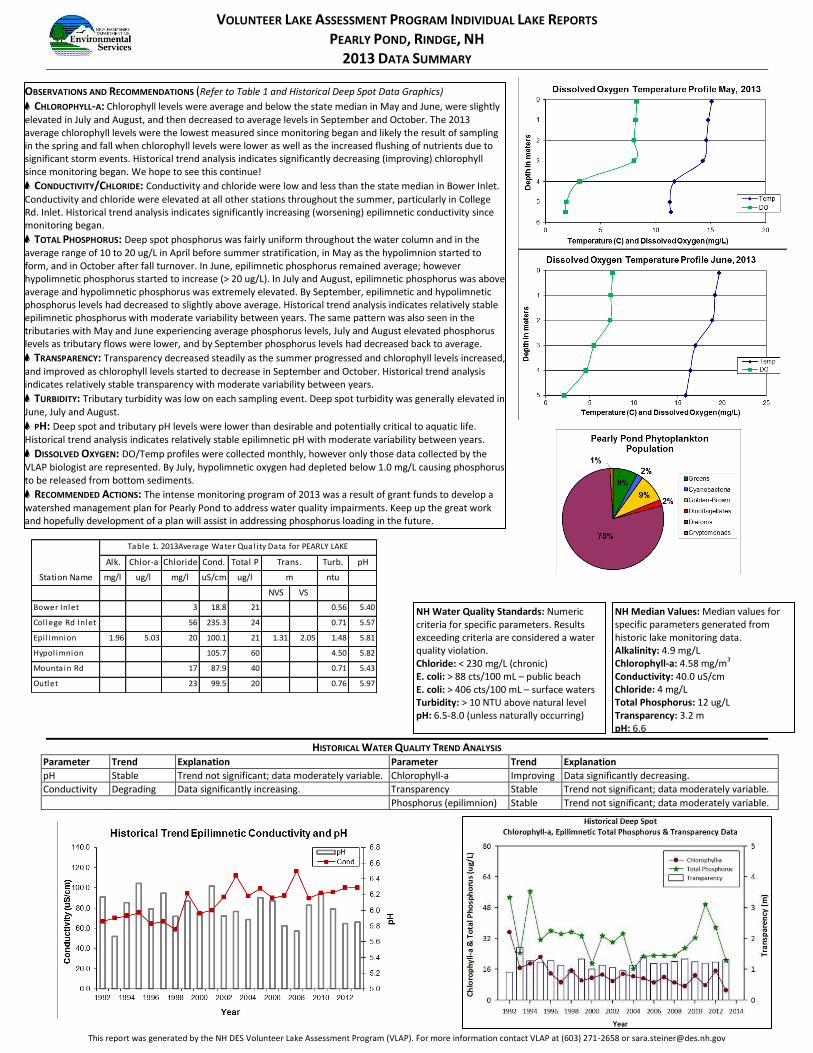
HISTORICAL WATER QUALITY TREND ANALYSIS
Parameter Trend Explanation Parameter Trend Explanation
pH Stable Trend not significant; data moderately variable. Chlorophyll-a Improving Data significantly decreasing.
Conductivity Degrading Data significantly increasing. Transparency Stable Trend not significant; data moderately variable.
Phosphorus (epilimnion) Stable Trend not significant; data moderately variable.
OBSERVATIONS AND RECOMMENDATIONS (Refer to Table 1 and Historical Deep Spot Data Graphics)
9 CHLOROPHYLL-A: Chlorophyll levels were average and below the state median in May and June, were slightly
elevated in July and August, and then decreased to average levels in September and October. The 2013
average chlorophyll levels were the lowest measured since monitoring began and likely the result of sampling
in the spring and fall when chlorophyll levels were lower as well as the increased flushing of nutrients due to
significant storm events. Historical trend analysis indicates significantly decreasing (improving) chlorophyll
since monitoring began. We hope to see this continue!
9 CONDUCTIVITY/CHLORIDE: Conductivity and chloride were low and less than the state median in Bower Inlet.
Conductivity and chloride were elevated at all other stations throughout the summer, particularly in College
Rd. Inlet. Historical trend analysis indicates significantly increasing (worsening) epilimnetic conductivity since
monitoring began.
9 TOTAL PHOSPHORUS: Deep spot phosphorus was fairly uniform throughout the water column and in the
average range of 10 to 20 ug/L in April before summer stratification, in May as the hypolimnion started to
form, and in October after fall turnover. In June, epilimnetic phosphorus remained average; however
hypolimnetic phosphorus started to increase (> 20 ug/L). In July and August, epilimnetic phosphorus was above
average and hypolimnetic phosphorus was extremely elevated. By September, epilimnetic and hypolimnetic
phosphorus levels had decreased to slightly above average. Historical trend analysis indicates relatively stable
epilimnetic phosphorus with moderate variability between years. The same pattern was also seen in the
tributaries with May and June experiencing average phosphorus levels, July and August elevated phosphorus
levels as tributary flows were lower, and by September phosphorus levels had decreased back to average.
9 TRANSPARENCY: Transparency decreased steadily as the summer progressed and chlorophyll levels increased,
and improved as chlorophyll levels started to decrease in September and October. Historical trend analysis
indicates relatively stable transparency with moderate variability between years.
9 TURBIDITY: Tributary turbidity was low on each sampling event. Deep spot turbidity was generally elevated in
June, July and August.
9 PH: Deep spot and tributary pH levels were lower than desirable and potentially critical to aquatic life.
Historical trend analysis indicates relatively stable epilimnetic pH with moderate variability between years.
9 DISSOLVED OXYGEN: DO/Temp profiles were collected monthly, however only those data collected by the
VLAP biologist are represented. By July, hypolimnetic oxygen had depleted below 1.0 mg/L causing phosphorus
to be released from bottom sediments.
9 RECOMMENDED ACTIONS: The intense monitoring program of 2013 was a result of grant funds to develop a
watershed management plan for Pearly Pond to address water quality impairments. Keep up the great work
and hopefully development of a plan will assist in addressing phosphorus loading in the future.
NH Median Values: Median values for
specific parameters generated from
historic lake monitoring data.
Alkalinity: 4.9 mg/L
Chlorophyll-a: 4.58 mg/m3
Conductivity: 40.0 uS/cm
Chloride: 4 mg/L
Total Phosphorus: 12 ug/L
Transparency: 3.2 m
pH: 6.6
NH Water Quality Standards: Numeric
criteria for specific parameters. Results
exceeding criteria are considered a water
quality violation.
Chloride: < 230 mg/L (chronic)
E. coli: > 88 cts/100 mL – public beach
E. coli: > 406 cts/100 mL – surface waters
Turbidity: > 10 NTU above natural level
pH: 6.5-8.0 (unless naturally occurring)
Table 1. 2013Average Water Qual i ty Data for PEARLY LAKE
Alk. Chlor-a Chloride Cond. Total P Trans. Turb. pH
Station Name mg/l ug/l mg/l uS/cm ug/l m ntu
NVS VS
Bower Inlet 3 18.8 21 0.56 5.40
Col lege Rd Inlet 56 235.3 24 0.71 5.57
Epi l imnion 1.96 5.03 20 100.1 21 1.31 2.05 1.48 5.81
Hypol imnion 105.7 60 4.50 5.82
Mountain Rd 17 87.9 40 0.71 5.43
Outlet 23 99.5 20 0.76 5.97
Related Documents