VOLUME II: LYON COUNTY IOWA STATE PROFILE

Welcome message from author
This document is posted to help you gain knowledge. Please leave a comment to let me know what you think about it! Share it to your friends and learn new things together.
Transcript
VOLUME II:
LYON COUNTY
IOWA STATE PROFILE

Volume II: County Profiles Lyon County
I O W A F I N A N C E A U T H O R I T Y Iowa Profile II.61.1 Final Report: May 18, 2018
Please visit the Iowa State Profile Dashboard:
www.westernes.com/Iowa
For and online version of this profile with many additional features including:
• Mapping • Interactive Charts and Tables • Data Downloads • Interactive Long Read • Interactive Tour • Jurisdiction to Jurisdiction Comparison • Download Additional Reports • And More
Volume II: County Profiles Lyon County
I O W A F I N A N C E A U T H O R I T Y Iowa Profile II.61.2 Final Report: May 18, 2018
Lyon County DEMOGRAPHICS
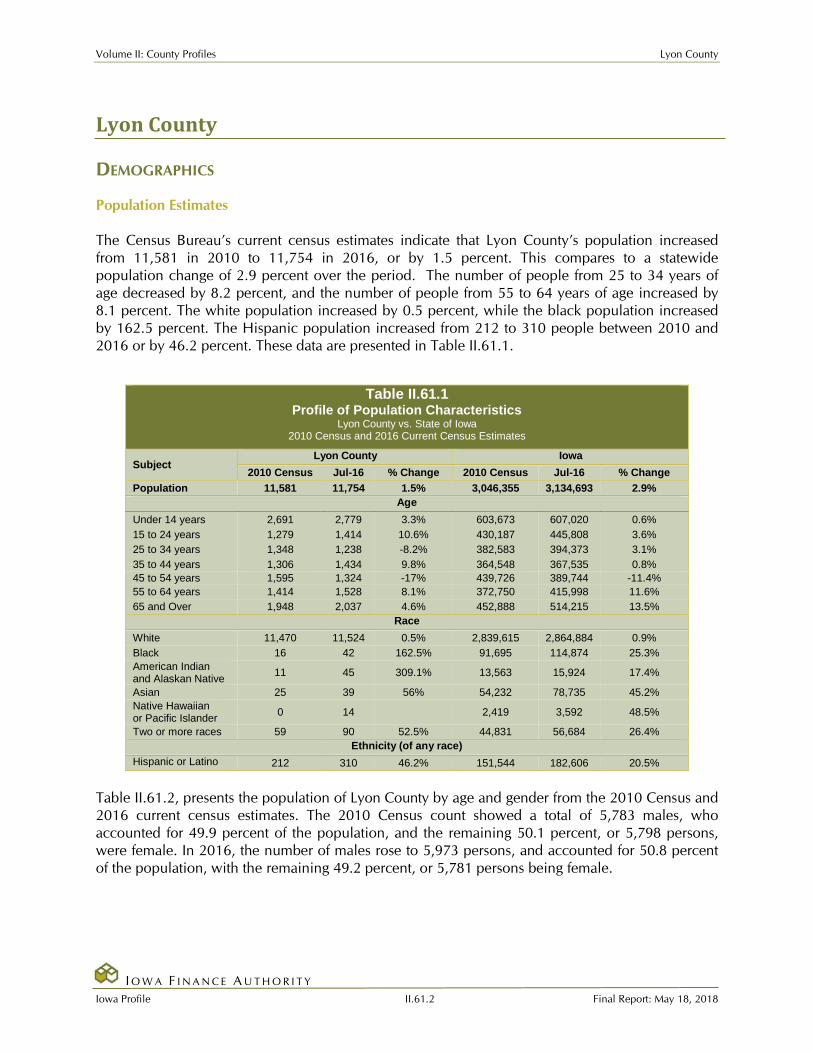
Population Estimates The Census Bureau’s current census estimates indicate that Lyon County’s population increased from 11,581 in 2010 to 11,754 in 2016, or by 1.5 percent. This compares to a statewide population change of 2.9 percent over the period. The number of people from 25 to 34 years of age decreased by 8.2 percent, and the number of people from 55 to 64 years of age increased by 8.1 percent. The white population increased by 0.5 percent, while the black population increased by 162.5 percent. The Hispanic population increased from 212 to 310 people between 2010 and 2016 or by 46.2 percent. These data are presented in Table II.61.1.
Table II.61.1
Profile of Population Characteristics Lyon County vs. State of Iowa
2010 Census and 2016 Current Census Estimates
Subject Lyon County Iowa
2010 Census Jul-16 % Change 2010 Census Jul-16 % Change Population 11,581 11,754 1.5% 3,046,355 3,134,693 2.9%
Age Under 14 years 2,691 2,779 3.3% 603,673 607,020 0.6% 15 to 24 years 1,279 1,414 10.6% 430,187 445,808 3.6% 25 to 34 years 1,348 1,238 -8.2% 382,583 394,373 3.1% 35 to 44 years 1,306 1,434 9.8% 364,548 367,535 0.8% 45 to 54 years 1,595 1,324 -17% 439,726 389,744 -11.4% 55 to 64 years 1,414 1,528 8.1% 372,750 415,998 11.6% 65 and Over 1,948 2,037 4.6% 452,888 514,215 13.5%
Race White 11,470 11,524 0.5% 2,839,615 2,864,884 0.9% Black 16 42 162.5% 91,695 114,874 25.3% American Indian and Alaskan Native 11 45 309.1% 13,563 15,924 17.4%
Asian 25 39 56% 54,232 78,735 45.2% Native Hawaiian or Pacific Islander 0 14 2,419 3,592 48.5%
Two or more races 59 90 52.5% 44,831 56,684 26.4% Ethnicity (of any race)
Hispanic or Latino 212 310 46.2% 151,544 182,606 20.5%
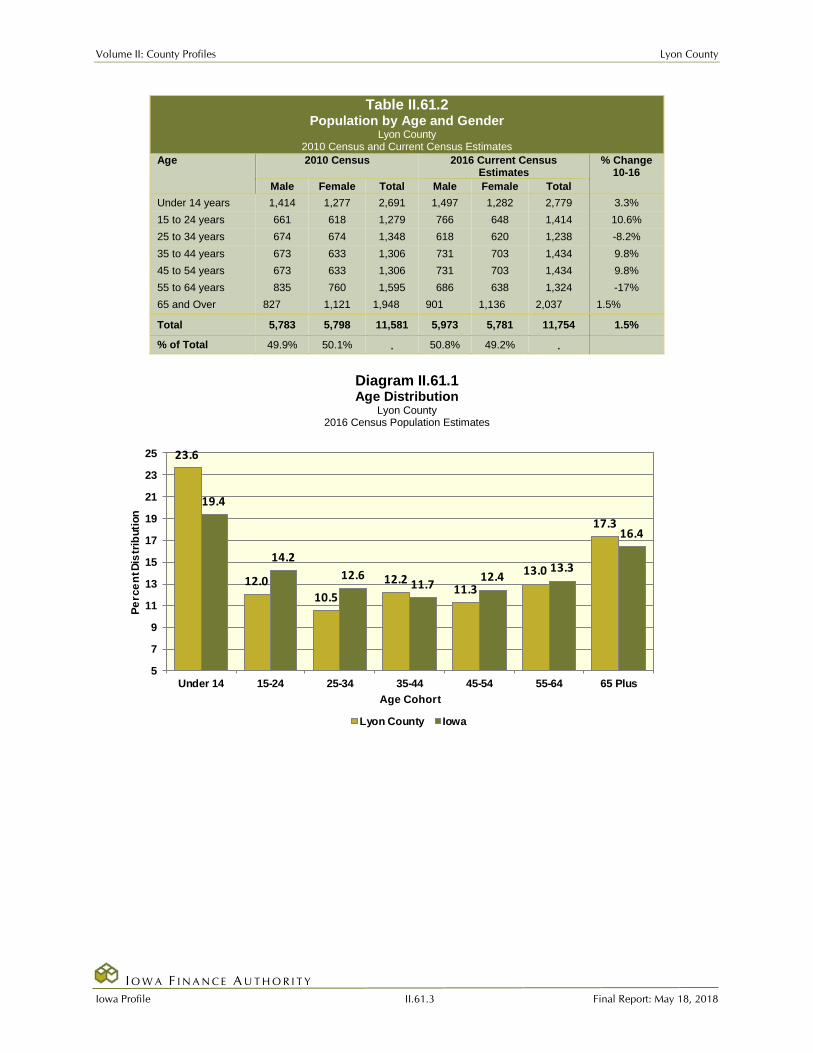
Table II.61.2, presents the population of Lyon County by age and gender from the 2010 Census and 2016 current census estimates. The 2010 Census count showed a total of 5,783 males, who accounted for 49.9 percent of the population, and the remaining 50.1 percent, or 5,798 persons, were female. In 2016, the number of males rose to 5,973 persons, and accounted for 50.8 percent of the population, with the remaining 49.2 percent, or 5,781 persons being female.
Volume II: County Profiles Lyon County
I O W A F I N A N C E A U T H O R I T Y Iowa Profile II.61.3 Final Report: May 18, 2018
Table II.61.2 Population by Age and Gender
Lyon County 2010 Census and Current Census Estimates
Age 2010 Census 2016 Current Census Estimates
% Change 10-16
Male Female Total Male Female Total Under 14 years 1,414 1,277 2,691 1,497 1,282 2,779 3.3% 15 to 24 years 661 618 1,279 766 648 1,414 10.6% 25 to 34 years 674 674 1,348 618 620 1,238 -8.2% 35 to 44 years 673 633 1,306 731 703 1,434 9.8% 45 to 54 years 673 633 1,306 731 703 1,434 9.8% 55 to 64 years 835 760 1,595 686 638 1,324 -17% 65 and Over 827 1,121 1,948 901 1,136 2,037 1.5%
Total 5,783 5,798 11,581 5,973 5,781 11,754 1.5%
% of Total 49.9% 50.1% . 50.8% 49.2% .
Diagram II.61.1 Age Distribution
Lyon County 2016 Census Population Estimates
23.6
12.010.5
12.211.3
13.0
17.3
19.4
14.212.6
11.7 12.413.3
16.4
5
7
9
11
13
15
17
19
21
23
25
Under 14 15-24 25-34 35-44 45-54 55-64 65 Plus
Perc
ent D
istr
ibut
ion
Age Cohort
Lyon County Iowa
Volume II: County Profiles Lyon County
I O W A F I N A N C E A U T H O R I T Y Iowa Profile II.61.4 Final Report: May 18, 2018
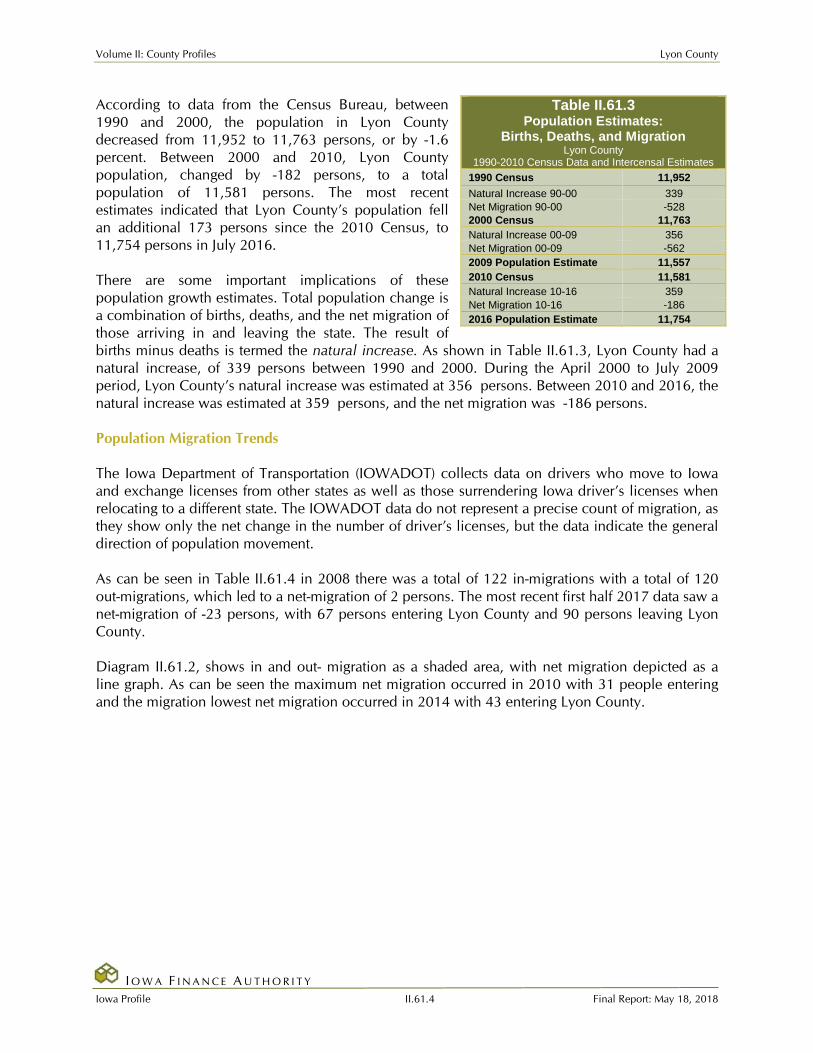
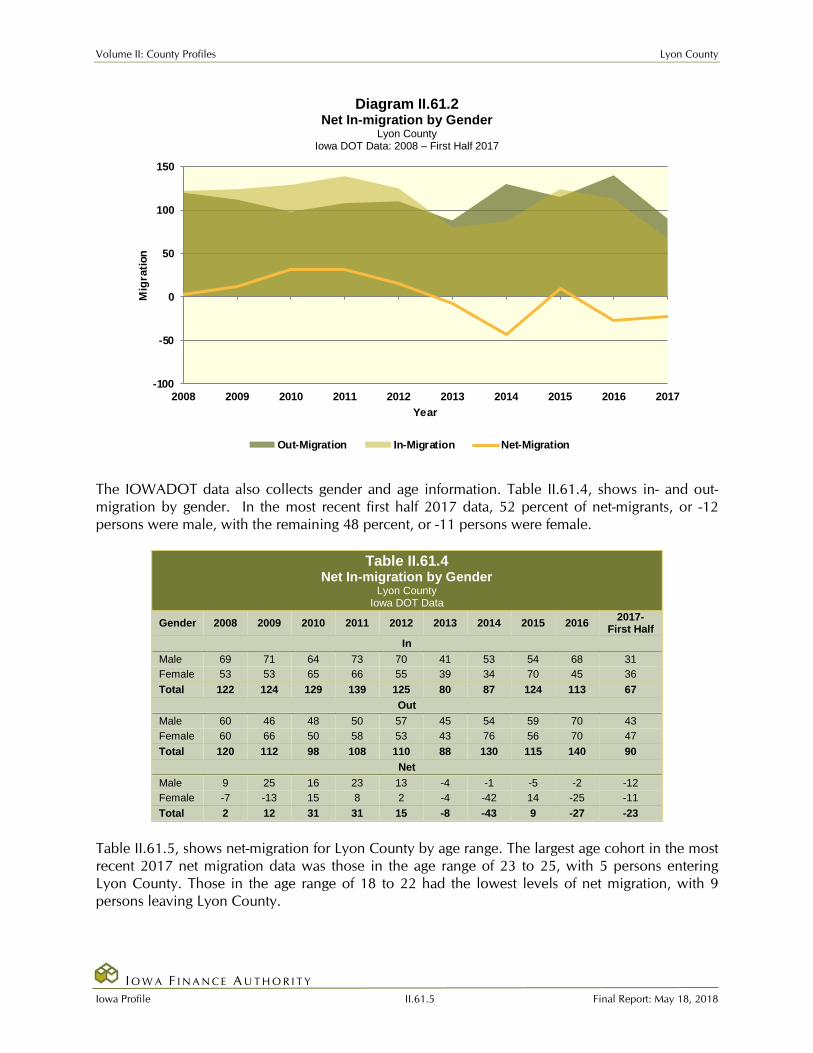
According to data from the Census Bureau, between 1990 and 2000, the population in Lyon County decreased from 11,952 to 11,763 persons, or by -1.6 percent. Between 2000 and 2010, Lyon County population, changed by -182 persons, to a total population of 11,581 persons. The most recent estimates indicated that Lyon County’s population fell an additional 173 persons since the 2010 Census, to 11,754 persons in July 2016. There are some important implications of these population growth estimates. Total population change is a combination of births, deaths, and the net migration of those arriving in and leaving the state. The result of births minus deaths is termed the natural increase. As shown in Table II.61.3, Lyon County had a natural increase, of 339 persons between 1990 and 2000. During the April 2000 to July 2009 period, Lyon County’s natural increase was estimated at 356 persons. Between 2010 and 2016, the natural increase was estimated at 359 persons, and the net migration was -186 persons. Population Migration Trends The Iowa Department of Transportation (IOWADOT) collects data on drivers who move to Iowa and exchange licenses from other states as well as those surrendering Iowa driver’s licenses when relocating to a different state. The IOWADOT data do not represent a precise count of migration, as they show only the net change in the number of driver’s licenses, but the data indicate the general direction of population movement. As can be seen in Table II.61.4 in 2008 there was a total of 122 in-migrations with a total of 120 out-migrations, which led to a net-migration of 2 persons. The most recent first half 2017 data saw a net-migration of -23 persons, with 67 persons entering Lyon County and 90 persons leaving Lyon County. Diagram II.61.2, shows in and out- migration as a shaded area, with net migration depicted as a line graph. As can be seen the maximum net migration occurred in 2010 with 31 people entering and the migration lowest net migration occurred in 2014 with 43 entering Lyon County.
Table II.61.3 Population Estimates:
Births, Deaths, and Migration Lyon County
1990-2010 Census Data and Intercensal Estimates 1990 Census 11,952 Natural Increase 90-00 339 Net Migration 90-00 -528 2000 Census 11,763 Natural Increase 00-09 356 Net Migration 00-09 -562 2009 Population Estimate 11,557 2010 Census 11,581 Natural Increase 10-16 359 Net Migration 10-16 -186 2016 Population Estimate 11,754
Volume II: County Profiles Lyon County
I O W A F I N A N C E A U T H O R I T Y Iowa Profile II.61.5 Final Report: May 18, 2018
Diagram II.61.2 Net In-migration by Gender
Lyon County Iowa DOT Data: 2008 – First Half 2017
-100
-50
0
50
100
150
2008 2009 2010 2011 2012 2013 2014 2015 2016 2017
Mig
ratio
n
Year
Out-Migration In-Migration Net-Migration
The IOWADOT data also collects gender and age information. Table II.61.4, shows in- and out- migration by gender. In the most recent first half 2017 data, 52 percent of net-migrants, or -12 persons were male, with the remaining 48 percent, or -11 persons were female.
Table II.61.4 Net In-migration by Gender
Lyon County Iowa DOT Data
Gender 2008 2009 2010 2011 2012 2013 2014 2015 2016 2017-First Half
In Male 69 71 64 73 70 41 53 54 68 31 Female 53 53 65 66 55 39 34 70 45 36 Total 122 124 129 139 125 80 87 124 113 67
Out Male 60 46 48 50 57 45 54 59 70 43 Female 60 66 50 58 53 43 76 56 70 47 Total 120 112 98 108 110 88 130 115 140 90
Net Male 9 25 16 23 13 -4 -1 -5 -2 -12 Female -7 -13 15 8 2 -4 -42 14 -25 -11 Total 2 12 31 31 15 -8 -43 9 -27 -23
Table II.61.5, shows net-migration for Lyon County by age range. The largest age cohort in the most recent 2017 net migration data was those in the age range of 23 to 25, with 5 persons entering Lyon County. Those in the age range of 18 to 22 had the lowest levels of net migration, with 9 persons leaving Lyon County.

Volume II: County Profiles Lyon County
I O W A F I N A N C E A U T H O R I T Y Iowa Profile II.61.6 Final Report: May 18, 2018
Table II.61.5 Migration by Age Range
Lyon County Iowa DOT Data
Age Range 2008 2009 2010 2011 2012 2013 2014 2015 2016 2017 –
First Half In
14-17 0 2 1 2 1 0 0 1 0 0 18-22 17 25 20 21 14 13 11 14 24 6 23-25 10 16 22 21 12 10 11 14 20 11 26-35 50 43 37 36 48 31 32 43 36 20 36-45 12 18 21 27 22 10 12 15 17 9 46-55 13 8 16 14 14 8 9 18 8 10 56-65 11 6 9 14 7 4 10 18 8 5 66 + 9 6 3 4 7 4 2 1 0 6 Total 122 124 129 139 125 80 87 124 113 67
Out 14-17 3 3 3 0 2 1 4 1 4 4 18-22 32 29 22 29 21 18 31 15 20 15 23-25 24 16 13 15 19 18 28 28 24 6 26-35 21 21 19 20 33 26 26 22 30 22 36-45 15 14 12 11 10 8 10 9 21 13 46-55 17 15 14 11 13 3 14 18 26 19 56-65 6 8 12 15 5 8 12 10 13 10 66 + 2 6 3 7 7 6 5 12 2 1 Total 120 112 98 108 110 88 130 115 140 90
Net 14-17 -3 -1 -2 2 -1 -1 -4 0 -4 -4 18-22 -15 -4 -2 -8 -7 -5 -20 -1 4 -9 23-25 -14 0 9 6 -7 -8 -17 -14 -4 5 26-35 29 22 18 16 15 5 6 21 6 -2 36-45 -3 4 9 16 12 2 2 6 -4 -4 46-55 -4 -7 2 3 1 5 -5 0 -18 -9 56-65 5 -2 -3 -1 2 -4 -2 8 -5 -5 66 + 7 0 0 -3 0 -2 -3 -11 -2 5 Total 2 12 31 31 15 -8 -43 9 -27 -23
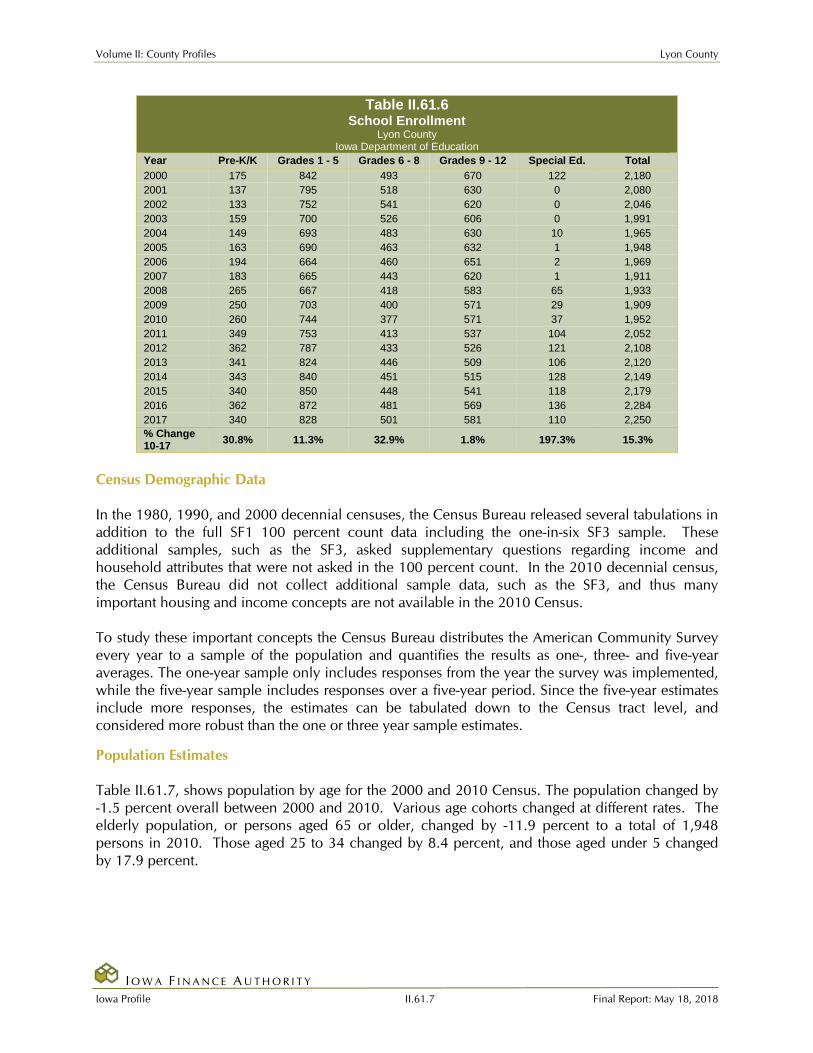
School Age Enrollment Table II.61.6, show the school enrollment from the Iowa Department of Education for Lyon County. The school enrollment figures below are for both public and private schools. As can be seen below, in 2010 total enrollment was 1,952 students and was 2,250 in 2017, a change of 15.3 percent. Enrollment for students in grades 1 to 5 was 744 students in 2010 and 828 in 2017, which was a change of 11.3 percent. Likewise, 2010 enrollment for students in grades 9 to 12 was 571 and 581 in 2017, which was a change of 1.8 percent.
Volume II: County Profiles Lyon County
I O W A F I N A N C E A U T H O R I T Y Iowa Profile II.61.7 Final Report: May 18, 2018
Table II.61.6 School Enrollment
Lyon County Iowa Department of Education
Year Pre-K/K Grades 1 - 5 Grades 6 - 8 Grades 9 - 12 Special Ed. Total 2000 175 842 493 670 122 2,180 2001 137 795 518 630 0 2,080 2002 133 752 541 620 0 2,046 2003 159 700 526 606 0 1,991 2004 149 693 483 630 10 1,965 2005 163 690 463 632 1 1,948 2006 194 664 460 651 2 1,969 2007 183 665 443 620 1 1,911 2008 265 667 418 583 65 1,933 2009 250 703 400 571 29 1,909 2010 260 744 377 571 37 1,952 2011 349 753 413 537 104 2,052 2012 362 787 433 526 121 2,108 2013 341 824 446 509 106 2,120 2014 343 840 451 515 128 2,149 2015 340 850 448 541 118 2,179 2016 362 872 481 569 136 2,284 2017 340 828 501 581 110 2,250 % Change 10-17 30.8% 11.3% 32.9% 1.8% 197.3% 15.3%
Census Demographic Data In the 1980, 1990, and 2000 decennial censuses, the Census Bureau released several tabulations in addition to the full SF1 100 percent count data including the one-in-six SF3 sample. These additional samples, such as the SF3, asked supplementary questions regarding income and household attributes that were not asked in the 100 percent count. In the 2010 decennial census, the Census Bureau did not collect additional sample data, such as the SF3, and thus many important housing and income concepts are not available in the 2010 Census. To study these important concepts the Census Bureau distributes the American Community Survey every year to a sample of the population and quantifies the results as one-, three- and five-year averages. The one-year sample only includes responses from the year the survey was implemented, while the five-year sample includes responses over a five-year period. Since the five-year estimates include more responses, the estimates can be tabulated down to the Census tract level, and considered more robust than the one or three year sample estimates. Population Estimates Table II.61.7, shows population by age for the 2000 and 2010 Census. The population changed by -1.5 percent overall between 2000 and 2010. Various age cohorts changed at different rates. The elderly population, or persons aged 65 or older, changed by -11.9 percent to a total of 1,948 persons in 2010. Those aged 25 to 34 changed by 8.4 percent, and those aged under 5 changed by 17.9 percent.

Volume II: County Profiles Lyon County
I O W A F I N A N C E A U T H O R I T Y Iowa Profile II.61.8 Final Report: May 18, 2018
Table II.61.7 Population by Age
Lyon County 2000 & 2010 Census SF1 Data
Age 2000 Census 2010 Census % Change 00–
10 Population % of Total Population % of Total Under 5 788 6.7% 929 8% 17.9% 5 to 19 2,812 23.9% 2,541 21.9% -9.6% 20 to 24 592 5% 500 4.3% -15.5% 25 to 34 1,244 10.6% 1,348 11.6% 8.4% 35 to 54 3,148 26.8% 2,901 25% -7.8% 55 to 64 968 8.2% 1,414 12.2% 46.1% 65 or Older 2,211 18.8% 1,948 16.8% -11.9% Total 11,763 100.0% 11,581 100.0% -1.5%
The elderly population is further explored in Table II.61.8. Those aged 65 to 66 changed by -14.8 percent between 2000 and 2010, resulting in a population of 167 persons. Those aged 85 or older changed by 5.5 percent during the same time period, and resulted in 362 persons over age 85 in 2010.
Table II.61.8 Elderly Population by Age
Lyon County 2000 & 2010 Census SF1 Data
Age 2000 Census 2010 Census % Change 00–10 Population % of Total Population % of Total
65 to 66 196 8.9% 167 8.6% -14.8% 67 to 69 356 16.1% 245 12.6% -31.2% 70 to 74 515 23.3% 421 21.6% -18.3% 75 to 79 445 20.1% 422 21.7% -5.2% 80 to 84 356 16.1% 331 17% -7% 85 or Older 343 15.5% 362 18.6% 5.5%
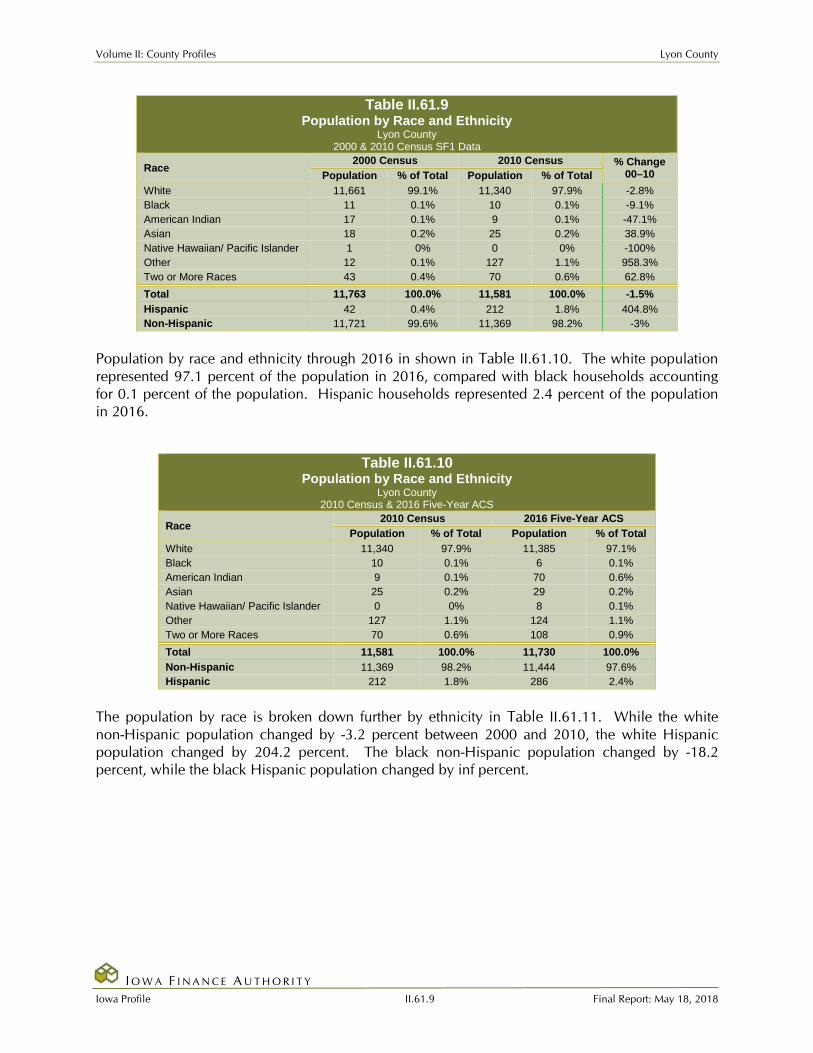
Total 2,211 100.0% 1,948 100.0% -11.9% Population by race and ethnicity is shown in Table II.61.9. The white population changed by -2.8 percent between 2000 and 2010, and resulted in representing 97.9 percent of the population in 2010. The black population changed by -9.1 percent, represented 0.1 percent of the population in 2010. The American Indian and Asian populations represented 0.1 and 0.2 percent, respectively, in 2010. As for ethnicity, the Hispanic population changed by 404.8 percent between 2000 and 2010, compared to the -3 percent growth rate for non-Hispanics.
Volume II: County Profiles Lyon County
I O W A F I N A N C E A U T H O R I T Y Iowa Profile II.61.9 Final Report: May 18, 2018
Table II.61.9 Population by Race and Ethnicity
Lyon County 2000 & 2010 Census SF1 Data
Race 2000 Census 2010 Census % Change
00–10 Population % of Total Population % of Total White 11,661 99.1% 11,340 97.9% -2.8% Black 11 0.1% 10 0.1% -9.1% American Indian 17 0.1% 9 0.1% -47.1% Asian 18 0.2% 25 0.2% 38.9% Native Hawaiian/ Pacific Islander 1 0% 0 0% -100% Other 12 0.1% 127 1.1% 958.3% Two or More Races 43 0.4% 70 0.6% 62.8% Total 11,763 100.0% 11,581 100.0% -1.5% Hispanic 42 0.4% 212 1.8% 404.8% Non-Hispanic 11,721 99.6% 11,369 98.2% -3%
Population by race and ethnicity through 2016 in shown in Table II.61.10. The white population represented 97.1 percent of the population in 2016, compared with black households accounting for 0.1 percent of the population. Hispanic households represented 2.4 percent of the population in 2016.
Table II.61.10 Population by Race and Ethnicity
Lyon County 2010 Census & 2016 Five-Year ACS
Race 2010 Census 2016 Five-Year ACS
Population % of Total Population % of Total White 11,340 97.9% 11,385 97.1% Black 10 0.1% 6 0.1% American Indian 9 0.1% 70 0.6% Asian 25 0.2% 29 0.2% Native Hawaiian/ Pacific Islander 0 0% 8 0.1% Other 127 1.1% 124 1.1% Two or More Races 70 0.6% 108 0.9% Total 11,581 100.0% 11,730 100.0% Non-Hispanic 11,369 98.2% 11,444 97.6% Hispanic 212 1.8% 286 2.4%
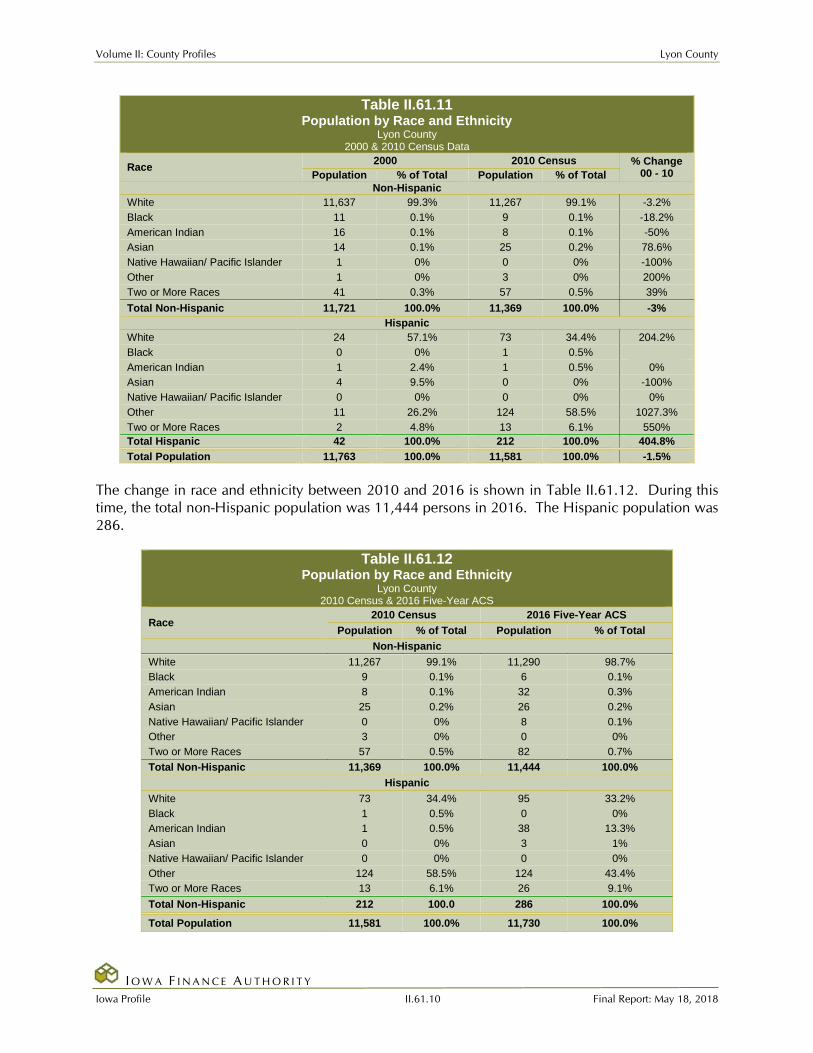
The population by race is broken down further by ethnicity in Table II.61.11. While the white non-Hispanic population changed by -3.2 percent between 2000 and 2010, the white Hispanic population changed by 204.2 percent. The black non-Hispanic population changed by -18.2 percent, while the black Hispanic population changed by inf percent.
Volume II: County Profiles Lyon County
I O W A F I N A N C E A U T H O R I T Y Iowa Profile II.61.10 Final Report: May 18, 2018
Table II.61.11 Population by Race and Ethnicity
Lyon County 2000 & 2010 Census Data
Race 2000 2010 Census % Change 00 - 10 Population % of Total Population % of Total
Non-Hispanic White 11,637 99.3% 11,267 99.1% -3.2% Black 11 0.1% 9 0.1% -18.2% American Indian 16 0.1% 8 0.1% -50% Asian 14 0.1% 25 0.2% 78.6% Native Hawaiian/ Pacific Islander 1 0% 0 0% -100% Other 1 0% 3 0% 200% Two or More Races 41 0.3% 57 0.5% 39% Total Non-Hispanic 11,721 100.0% 11,369 100.0% -3%
Hispanic White 24 57.1% 73 34.4% 204.2% Black 0 0% 1 0.5% American Indian 1 2.4% 1 0.5% 0% Asian 4 9.5% 0 0% -100% Native Hawaiian/ Pacific Islander 0 0% 0 0% 0% Other 11 26.2% 124 58.5% 1027.3% Two or More Races 2 4.8% 13 6.1% 550% Total Hispanic 42 100.0% 212 100.0% 404.8% Total Population 11,763 100.0% 11,581 100.0% -1.5%
The change in race and ethnicity between 2010 and 2016 is shown in Table II.61.12. During this time, the total non-Hispanic population was 11,444 persons in 2016. The Hispanic population was 286.
Table II.61.12 Population by Race and Ethnicity
Lyon County 2010 Census & 2016 Five-Year ACS
Race 2010 Census 2016 Five-Year ACS
Population % of Total Population % of Total Non-Hispanic
White 11,267 99.1% 11,290 98.7% Black 9 0.1% 6 0.1% American Indian 8 0.1% 32 0.3% Asian 25 0.2% 26 0.2% Native Hawaiian/ Pacific Islander 0 0% 8 0.1% Other 3 0% 0 0% Two or More Races 57 0.5% 82 0.7% Total Non-Hispanic 11,369 100.0% 11,444 100.0%
Hispanic White 73 34.4% 95 33.2% Black 1 0.5% 0 0% American Indian 1 0.5% 38 13.3% Asian 0 0% 3 1% Native Hawaiian/ Pacific Islander 0 0% 0 0% Other 124 58.5% 124 43.4% Two or More Races 13 6.1% 26 9.1% Total Non-Hispanic 212 100.0 286 100.0%
Total Population 11,581 100.0% 11,730 100.0%
Volume II: County Profiles Lyon County
I O W A F I N A N C E A U T H O R I T Y Iowa Profile II.61.11 Final Report: May 18, 2018
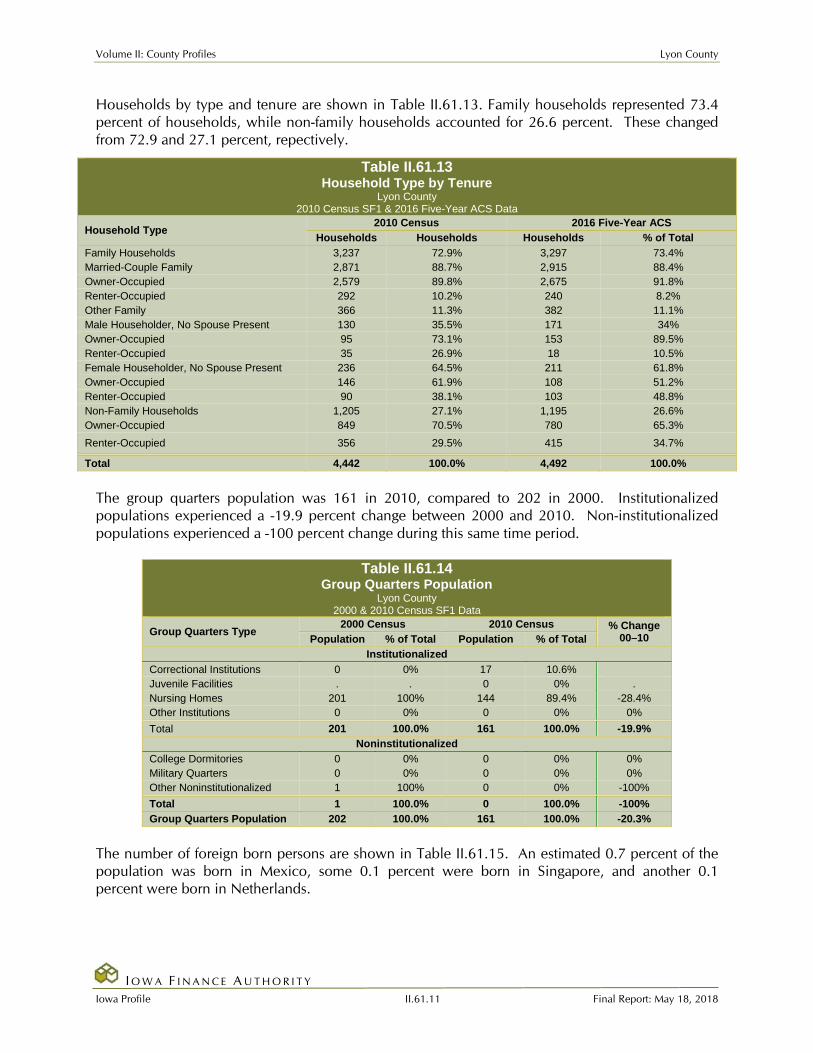
Households by type and tenure are shown in Table II.61.13. Family households represented 73.4 percent of households, while non-family households accounted for 26.6 percent. These changed from 72.9 and 27.1 percent, repectively.
Table II.61.13 Household Type by Tenure
Lyon County 2010 Census SF1 & 2016 Five-Year ACS Data
Household Type 2010 Census 2016 Five-Year ACS
Households Households Households % of Total Family Households 3,237 72.9% 3,297 73.4% Married-Couple Family 2,871 88.7% 2,915 88.4% Owner-Occupied 2,579 89.8% 2,675 91.8% Renter-Occupied 292 10.2% 240 8.2% Other Family 366 11.3% 382 11.1% Male Householder, No Spouse Present 130 35.5% 171 34% Owner-Occupied 95 73.1% 153 89.5% Renter-Occupied 35 26.9% 18 10.5% Female Householder, No Spouse Present 236 64.5% 211 61.8% Owner-Occupied 146 61.9% 108 51.2% Renter-Occupied 90 38.1% 103 48.8% Non-Family Households 1,205 27.1% 1,195 26.6% Owner-Occupied 849 70.5% 780 65.3% Renter-Occupied 356 29.5% 415 34.7%
Total 4,442 100.0% 4,492 100.0% The group quarters population was 161 in 2010, compared to 202 in 2000. Institutionalized populations experienced a -19.9 percent change between 2000 and 2010. Non-institutionalized populations experienced a -100 percent change during this same time period.
Table II.61.14 Group Quarters Population
Lyon County 2000 & 2010 Census SF1 Data
Group Quarters Type 2000 Census 2010 Census % Change
00–10 Population % of Total Population % of Total Institutionalized
Correctional Institutions 0 0% 17 10.6% Juvenile Facilities . . 0 0% . Nursing Homes 201 100% 144 89.4% -28.4% Other Institutions 0 0% 0 0% 0% Total 201 100.0% 161 100.0% -19.9%
Noninstitutionalized College Dormitories 0 0% 0 0% 0% Military Quarters 0 0% 0 0% 0% Other Noninstitutionalized 1 100% 0 0% -100% Total 1 100.0% 0 100.0% -100% Group Quarters Population 202 100.0% 161 100.0% -20.3%
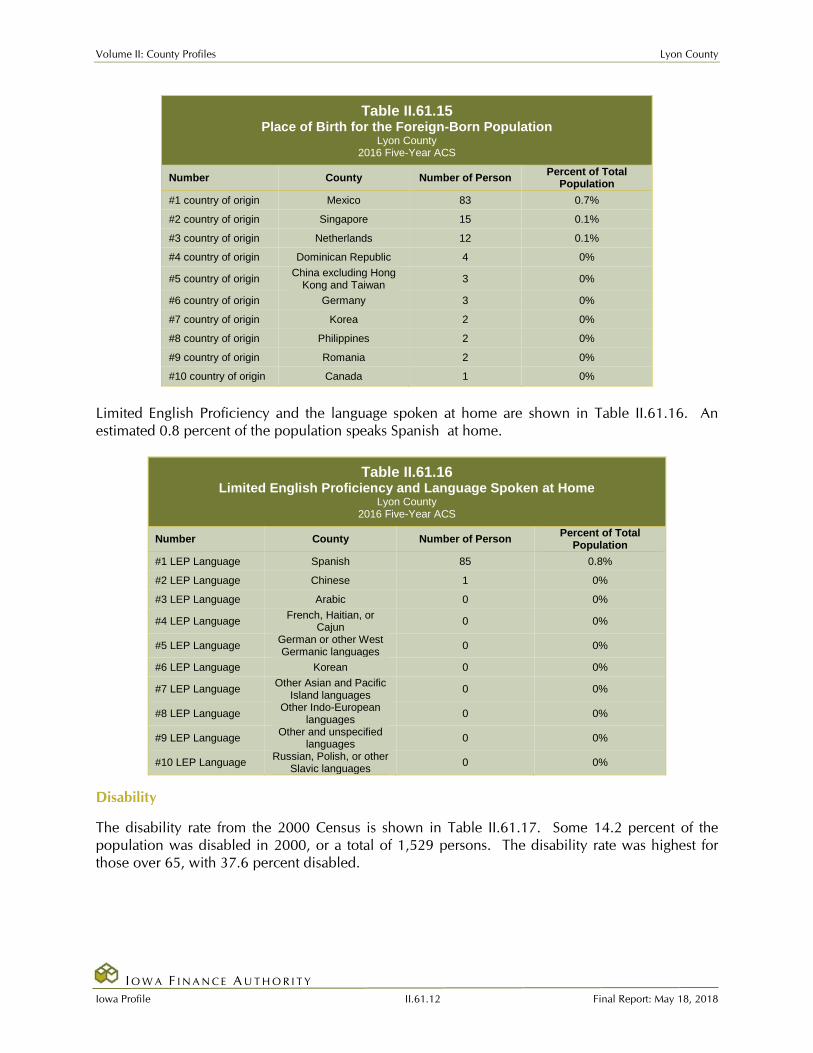
The number of foreign born persons are shown in Table II.61.15. An estimated 0.7 percent of the population was born in Mexico, some 0.1 percent were born in Singapore, and another 0.1 percent were born in Netherlands.
Volume II: County Profiles Lyon County
I O W A F I N A N C E A U T H O R I T Y Iowa Profile II.61.12 Final Report: May 18, 2018
Table II.61.15 Place of Birth for the Foreign-Born Population
Lyon County 2016 Five-Year ACS
Number County Number of Person Percent of Total Population
#1 country of origin Mexico 83 0.7%
#2 country of origin Singapore 15 0.1%
#3 country of origin Netherlands 12 0.1%
#4 country of origin Dominican Republic 4 0%
#5 country of origin China excluding Hong Kong and Taiwan 3 0%
#6 country of origin Germany 3 0%
#7 country of origin Korea 2 0%
#8 country of origin Philippines 2 0%
#9 country of origin Romania 2 0%
#10 country of origin Canada 1 0%
Limited English Proficiency and the language spoken at home are shown in Table II.61.16. An estimated 0.8 percent of the population speaks Spanish at home.
Table II.61.16 Limited English Proficiency and Language Spoken at Home
Lyon County 2016 Five-Year ACS
Number County Number of Person Percent of Total Population
#1 LEP Language Spanish 85 0.8%
#2 LEP Language Chinese 1 0%
#3 LEP Language Arabic 0 0%
#4 LEP Language French, Haitian, or Cajun 0 0%
#5 LEP Language German or other West Germanic languages 0 0%
#6 LEP Language Korean 0 0%
#7 LEP Language Other Asian and Pacific Island languages 0 0%
#8 LEP Language Other Indo-European languages 0 0%
#9 LEP Language Other and unspecified languages 0 0%
#10 LEP Language Russian, Polish, or other Slavic languages 0 0%
Disability
The disability rate from the 2000 Census is shown in Table II.61.17. Some 14.2 percent of the population was disabled in 2000, or a total of 1,529 persons. The disability rate was highest for those over 65, with 37.6 percent disabled.

Volume II: County Profiles Lyon County
I O W A F I N A N C E A U T H O R I T Y Iowa Profile II.61.13 Final Report: May 18, 2018
Table II.61.17 Disability by Age
Lyon County 2000 Census SF3 Data
Age Total
Disabled Population
Disability Rate
5 to 15 68 3.3% 16 to 64 709 10.6% 65 and older 752 37.6% Total 1,529 14.2%
Table II.61.18 shows disability by type in 2000. There were 709 physical disabilities in 2000, some 447 employment disabilities, and 556 go-outside-home disabilities.
Table II.61.18 Total Disabilities Tallied: Aged 5 and Older
Lyon County 2000 Census SF3 Data
Disability Type Population Sensory disability 408 Physical disability 709 Mental disability 395 Self-care disability 168 Employment disability 447 Go-outside-home disability 556 Total 2,683
Disability by age, as estimated by the 2016 ACS, is shown in Table II.61.19. The disability rate for females was 12 percent, compared to 10.2 percent for males. The disability rate changed precipitously higher with age, with 41.8 percent of those over 75 experiencing a disability.
Table II.61.19 Disability by Age
Lyon County 2016 Five-Year ACS Data
Age Male Female Total
Disabled Population
Disability Rate
Disabled Population
Disability Rate
Disabled Population
Disability Rate
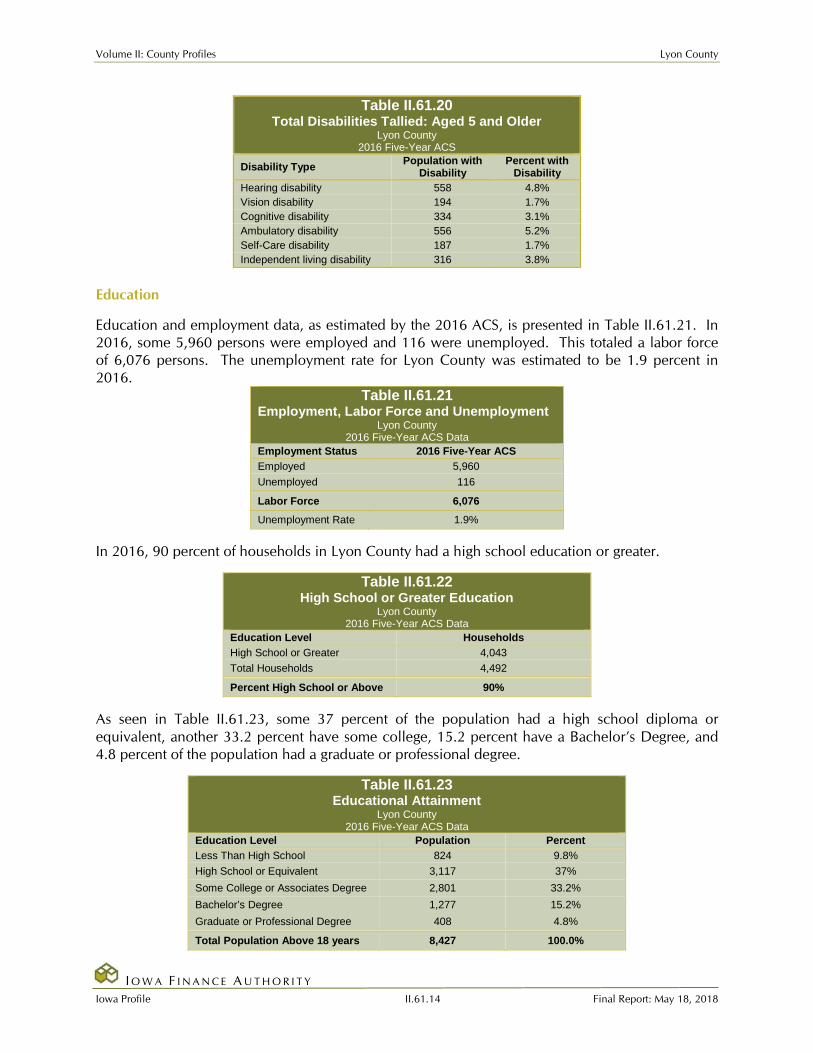
Under 5 0 0% 0 0% 0 0% 5 to 17 75 5.6% 52 4.7% 127 5.2% 18 to 34 68 6.3% 70 7.1% 138 6.7% 35 to 64 185 8.4% 257 12.2% 442 10.2% 65 to 74 103 23.6% 69 14.6% 172 18.9% 75 or Older 172 46.5% 228 38.9% 400 41.8% Total 603 10.2% 676 12% 1,279 11.1% The number of disabilities by type, as estimated by the 2016 ACS, is shown in Table II.61.20. Some 5.2 percent have an ambulatory disability, 3.8 have an independent living disability, and 1.7 percent have a self-care disability.
Volume II: County Profiles Lyon County
I O W A F I N A N C E A U T H O R I T Y Iowa Profile II.61.14 Final Report: May 18, 2018
Table II.61.20 Total Disabilities Tallied: Aged 5 and Older
Lyon County 2016 Five-Year ACS
Disability Type Population with Disability
Percent with Disability
Hearing disability 558 4.8% Vision disability 194 1.7% Cognitive disability 334 3.1% Ambulatory disability 556 5.2% Self-Care disability 187 1.7% Independent living disability 316 3.8%
Education
Education and employment data, as estimated by the 2016 ACS, is presented in Table II.61.21. In 2016, some 5,960 persons were employed and 116 were unemployed. This totaled a labor force of 6,076 persons. The unemployment rate for Lyon County was estimated to be 1.9 percent in 2016.
Table II.61.21 Employment, Labor Force and Unemployment
Lyon County 2016 Five-Year ACS Data
Employment Status 2016 Five-Year ACS Employed 5,960 Unemployed 116
Labor Force 6,076
Unemployment Rate 1.9%
In 2016, 90 percent of households in Lyon County had a high school education or greater.
Table II.61.22 High School or Greater Education
Lyon County 2016 Five-Year ACS Data
Education Level Households High School or Greater 4,043 Total Households 4,492
Percent High School or Above 90%
As seen in Table II.61.23, some 37 percent of the population had a high school diploma or equivalent, another 33.2 percent have some college, 15.2 percent have a Bachelor’s Degree, and 4.8 percent of the population had a graduate or professional degree.
Table II.61.23 Educational Attainment
Lyon County 2016 Five-Year ACS Data
Education Level Population Percent Less Than High School 824 9.8% High School or Equivalent 3,117 37% Some College or Associates Degree 2,801 33.2% Bachelor’s Degree 1,277 15.2% Graduate or Professional Degree 408 4.8%
Total Population Above 18 years 8,427 100.0%

Volume II: County Profiles Lyon County
I O W A F I N A N C E A U T H O R I T Y Iowa Profile II.61.15 Final Report: May 18, 2018
ECONOMICS
Labor Force Table II.61.24, shows the labor force statistics for Lyon County from 1990 to the present. Over the entire series the lowest unemployment rate occurred in 1999 with a rate of 1.8 percent. The highest level of unemployment occurred during 2009 rising to a rate of 4.3 percent. This compared to a statewide low of 2.6 in 1999 and statewide high of 6.4 percent in 2009. Over the last year, the unemployment rate in Lyon County increased from 2 percent in 2015 to 2.1 percent in 2016, which compared to a statewide decrease to 3.7 percent.
Table II.61.24 Labor Force Statistics
Lyon County 1990 - 2016 BLS Data
Year Lyon County Statewide
Unemployment Rate Unemployment Employment Labor Force Unemployment
Rate 1990 122 5,538 5,660 2.2% 4.4% 1991 132 5,535 5,667 2.3% 4.7% 1992 146 5,762 5,908 2.5% 4.5% 1993 165 5,761 5,926 2.8% 4% 1994 144 5,779 5,923 2.4% 3.5% 1995 159 5,696 5,855 2.7% 3.4% 1996 157 5,810 5,967 2.6% 3.5% 1997 129 5,794 5,923 2.2% 3.1% 1998 132 5,543 5,675 2.3% 2.7% 1999 101 5,499 5,600 1.8% 2.6% 2000 126 6,225 6,351 2% 2.6% 2001 156 6,436 6,592 2.4% 3.3% 2002 217 6,292 6,509 3.3% 4% 2003 224 6,051 6,275 3.6% 4.5% 2004 201 6,001 6,202 3.2% 4.5% 2005 188 6,264 6,452 2.9% 4.3% 2006 153 6,513 6,666 2.3% 3.7% 2007 160 6,521 6,681 2.4% 3.7% 2008 182 6,648 6,830 2.7% 4.2% 2009 296 6,626 6,922 4.3% 6.4% 2010 247 6,158 6,405 3.9% 6% 2011 211 6,563 6,774 3.1% 5.5% 2012 202 6,630 6,832 3% 5% 2013 199 6,667 6,866 2.9% 4.7% 2014 180 6,855 7,035 2.6% 4.3% 2015 144 6,923 7,067 2% 3.8% 2016 147 6,964 7,111 2.1% 3.7%
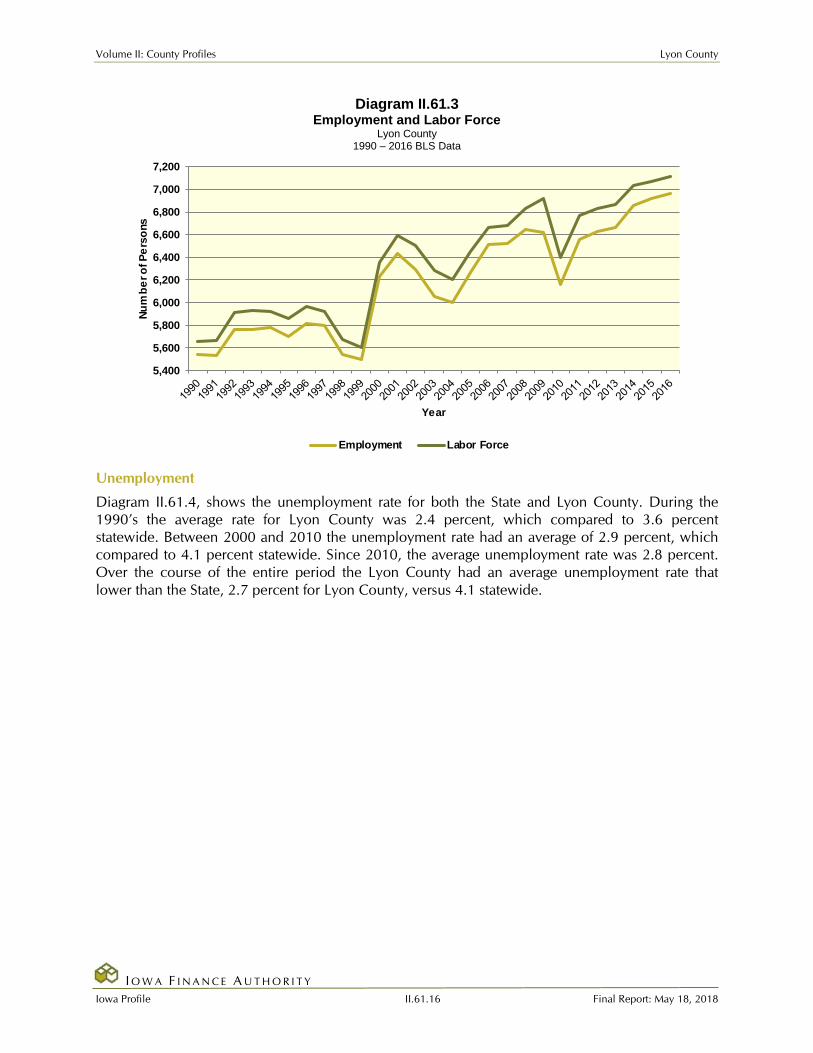
Diagram II.61.3, shows the employment and labor force for Lyon County. The difference between the two lines represents the number of unemployed persons. In the most recent year, employment stood at 6,964 persons, with the labor force reaching 7,111, indicating there were a total of 147 unemployed persons.
Volume II: County Profiles Lyon County
I O W A F I N A N C E A U T H O R I T Y Iowa Profile II.61.16 Final Report: May 18, 2018
Diagram II.61.3 Employment and Labor Force
Lyon County 1990 – 2016 BLS Data
5,400
5,600
5,800
6,000
6,200
6,400
6,600
6,800
7,000
7,200
Num
ber o
f Per
sons
Year
Employment Labor Force
Unemployment
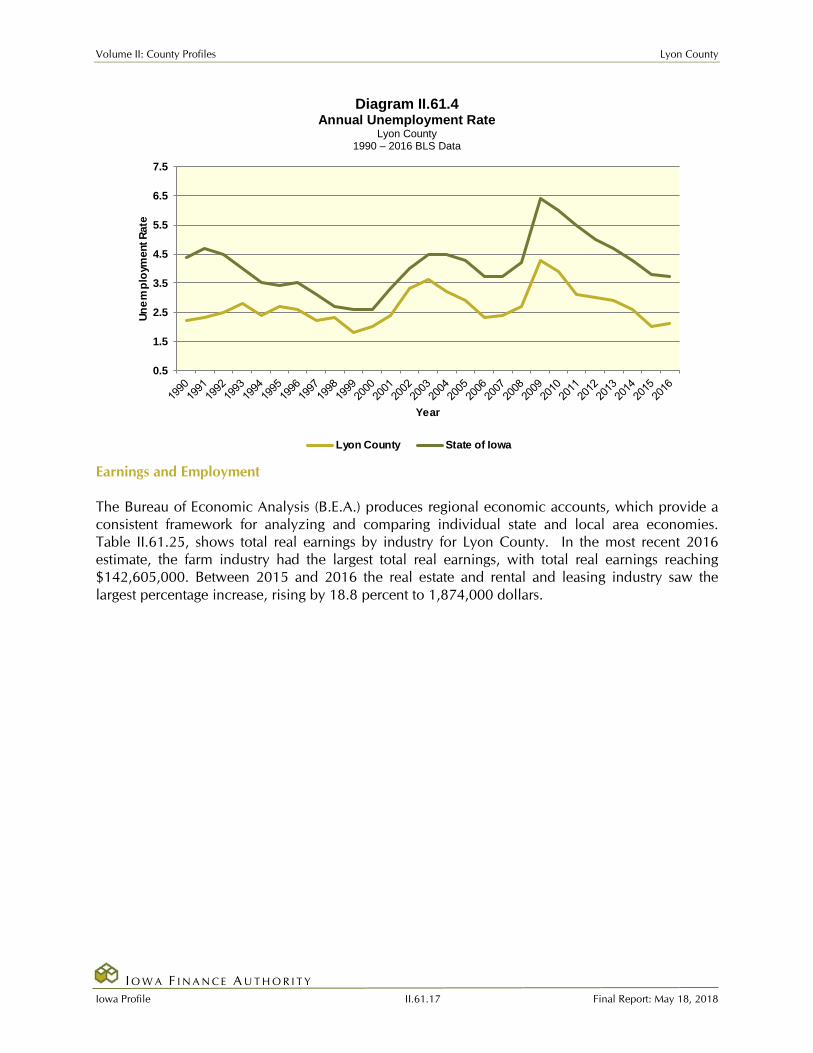
Diagram II.61.4, shows the unemployment rate for both the State and Lyon County. During the 1990’s the average rate for Lyon County was 2.4 percent, which compared to 3.6 percent statewide. Between 2000 and 2010 the unemployment rate had an average of 2.9 percent, which compared to 4.1 percent statewide. Since 2010, the average unemployment rate was 2.8 percent. Over the course of the entire period the Lyon County had an average unemployment rate that lower than the State, 2.7 percent for Lyon County, versus 4.1 statewide.
Volume II: County Profiles Lyon County
I O W A F I N A N C E A U T H O R I T Y Iowa Profile II.61.17 Final Report: May 18, 2018
Diagram II.61.4 Annual Unemployment Rate
Lyon County 1990 – 2016 BLS Data
0.5
1.5
2.5
3.5
4.5
5.5
6.5
7.5
Unem
ploy
men
t Rat
e
Year
Lyon County State of Iowa
Earnings and Employment The Bureau of Economic Analysis (B.E.A.) produces regional economic accounts, which provide a consistent framework for analyzing and comparing individual state and local area economies. Table II.61.25, shows total real earnings by industry for Lyon County. In the most recent 2016 estimate, the farm industry had the largest total real earnings, with total real earnings reaching $142,605,000. Between 2015 and 2016 the real estate and rental and leasing industry saw the largest percentage increase, rising by 18.8 percent to 1,874,000 dollars.

Volume II: County Profiles Lyon County
I O W A F I N A N C E A U T H O R I T Y Iowa Profile II.61.18 Final Report: May 18, 2018
Table II.61.25 Real Earnings by Industry
Lyon County BEA Table CA-5N Data (1,000’s of 2016 Dollars)
NAICS Categories 2001 2010 2011 2012 2013 2014 2015 2016 %
Change 15-16
Farm earnings 59,458 91,818 170,455 188,044 226,717 217,452 208,718 142,605 -31.7 Forestry, fishing, related activities, and other 0 0 0 0 0 0 0 0 0
Mining 0 0 0 0 0 0 0 0 0 Utilities 0 0 0 0 0 0 0 0 0 Construction 15,407 21,894 26,352 29,005 28,917 26,616 27,963 29,319 4.9 Manufacturing 29,618 34,150 34,714 36,277 38,637 40,255 43,067 42,951 -0.3 Wholesale trade 13,360 15,437 16,324 16,892 16,663 16,831 17,078 16,255 -4.8 Retail trade 13,739 10,857 11,547 11,789 11,828 11,816 11,642 11,413 -2 Transportation and warehousing 0 0 0 0 0 0 0 0 0
Information 1,888 9,485 10,906 10,476 8,933 8,037 7,280 6,699 -8 Finance and insurance 6,970 9,317 8,466 10,018 9,559 10,285 10,652 10,644 -0.1 Real estate and rental and leasing 1,280 4,431 3,101 3,521 4,628 4,545 4,650 5,527 18.8
Professional and technical services 11,482 13,350 13,919 14,212 0 15,006 15,911 17,504 10
Management of companies and enterprises 0 0 0 0 0 0 0 0 0
Administrative and waste services 1,770 2,432 3,011 3,401 0 4,275 4,047 2,539 -37.3
Educational services 644 565 585 715 715 736 681 714 4.9 Health care and social assistance 11,577 16,446 17,275 16,927 13,954 14,060 12,604 13,715 8.8
Arts, entertainment, and recreation 0 455 446 486 461 596 638 722 13.1
Accommodation and food services 0 1,612 15,430 19,354 18,044 21,522 22,173 22,445 1.2
Other services, except public administration 9,389 10,815 10,720 10,988 10,228 10,322 11,451 12,401 8.3
Government and government enterprises 26,695 33,522 32,663 32,109 32,638 33,424 34,305 35,530 3.6
Total 217,377 297,205 397,535 426,130 463,006 460,027 458,551 398,992 -13
Volume II: County Profiles Lyon County
I O W A F I N A N C E A U T H O R I T Y Iowa Profile II.61.19 Final Report: May 18, 2018
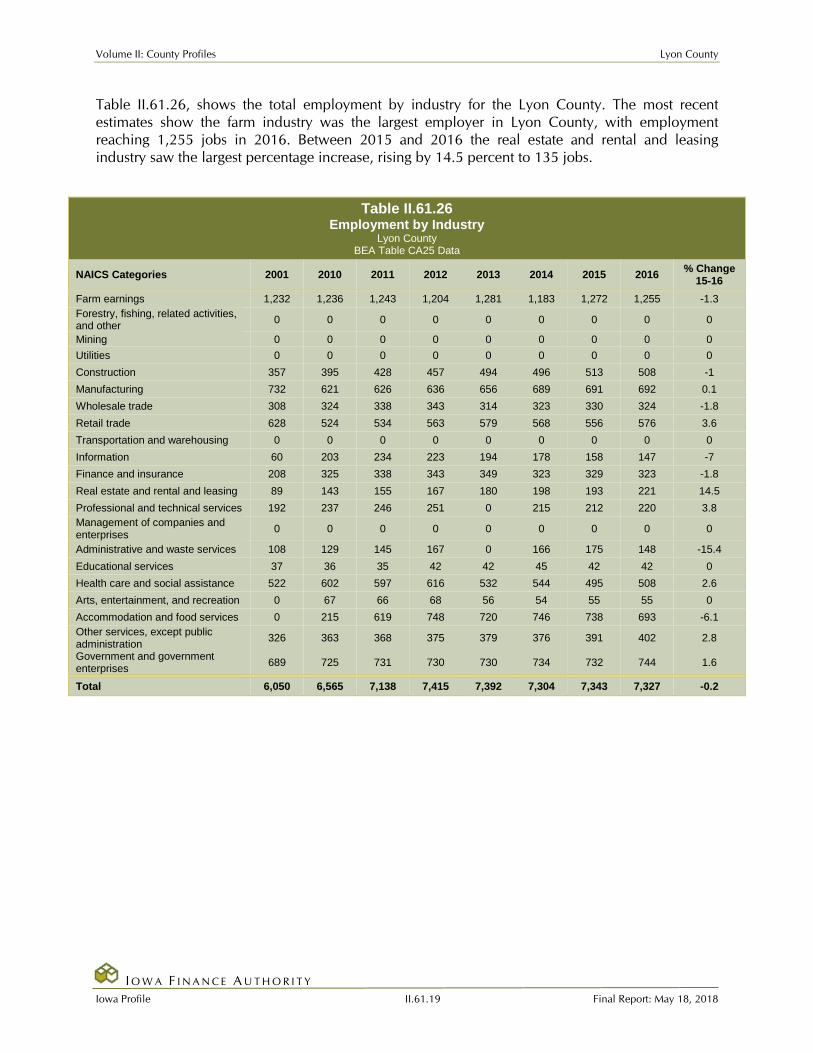
Table II.61.26, shows the total employment by industry for the Lyon County. The most recent estimates show the farm industry was the largest employer in Lyon County, with employment reaching 1,255 jobs in 2016. Between 2015 and 2016 the real estate and rental and leasing industry saw the largest percentage increase, rising by 14.5 percent to 135 jobs.
Table II.61.26
Employment by Industry Lyon County
BEA Table CA25 Data NAICS Categories 2001 2010 2011 2012 2013 2014 2015 2016 % Change
15-16 Farm earnings 1,232 1,236 1,243 1,204 1,281 1,183 1,272 1,255 -1.3 Forestry, fishing, related activities, and other 0 0 0 0 0 0 0 0 0
Mining 0 0 0 0 0 0 0 0 0 Utilities 0 0 0 0 0 0 0 0 0 Construction 357 395 428 457 494 496 513 508 -1 Manufacturing 732 621 626 636 656 689 691 692 0.1 Wholesale trade 308 324 338 343 314 323 330 324 -1.8 Retail trade 628 524 534 563 579 568 556 576 3.6 Transportation and warehousing 0 0 0 0 0 0 0 0 0 Information 60 203 234 223 194 178 158 147 -7 Finance and insurance 208 325 338 343 349 323 329 323 -1.8 Real estate and rental and leasing 89 143 155 167 180 198 193 221 14.5 Professional and technical services 192 237 246 251 0 215 212 220 3.8 Management of companies and enterprises 0 0 0 0 0 0 0 0 0
Administrative and waste services 108 129 145 167 0 166 175 148 -15.4 Educational services 37 36 35 42 42 45 42 42 0 Health care and social assistance 522 602 597 616 532 544 495 508 2.6 Arts, entertainment, and recreation 0 67 66 68 56 54 55 55 0 Accommodation and food services 0 215 619 748 720 746 738 693 -6.1 Other services, except public administration 326 363 368 375 379 376 391 402 2.8
Government and government enterprises 689 725 731 730 730 734 732 744 1.6
Total 6,050 6,565 7,138 7,415 7,392 7,304 7,343 7,327 -0.2
Volume II: County Profiles Lyon County
I O W A F I N A N C E A U T H O R I T Y Iowa Profile II.61.20 Final Report: May 18, 2018
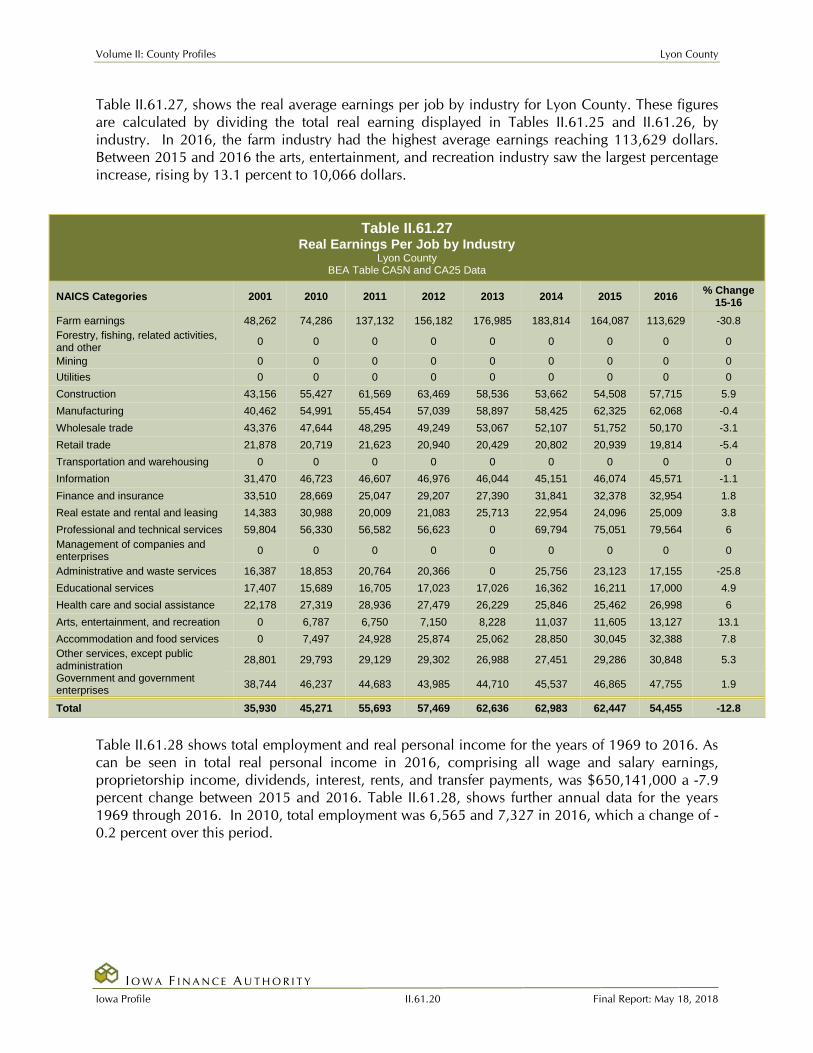
Table II.61.27, shows the real average earnings per job by industry for Lyon County. These figures are calculated by dividing the total real earning displayed in Tables II.61.25 and II.61.26, by industry. In 2016, the farm industry had the highest average earnings reaching 113,629 dollars. Between 2015 and 2016 the arts, entertainment, and recreation industry saw the largest percentage increase, rising by 13.1 percent to 10,066 dollars.
Table II.61.27
Real Earnings Per Job by Industry Lyon County
BEA Table CA5N and CA25 Data NAICS Categories 2001 2010 2011 2012 2013 2014 2015 2016 % Change
15-16 Farm earnings 48,262 74,286 137,132 156,182 176,985 183,814 164,087 113,629 -30.8 Forestry, fishing, related activities, and other 0 0 0 0 0 0 0 0 0
Mining 0 0 0 0 0 0 0 0 0 Utilities 0 0 0 0 0 0 0 0 0 Construction 43,156 55,427 61,569 63,469 58,536 53,662 54,508 57,715 5.9 Manufacturing 40,462 54,991 55,454 57,039 58,897 58,425 62,325 62,068 -0.4 Wholesale trade 43,376 47,644 48,295 49,249 53,067 52,107 51,752 50,170 -3.1 Retail trade 21,878 20,719 21,623 20,940 20,429 20,802 20,939 19,814 -5.4 Transportation and warehousing 0 0 0 0 0 0 0 0 0 Information 31,470 46,723 46,607 46,976 46,044 45,151 46,074 45,571 -1.1 Finance and insurance 33,510 28,669 25,047 29,207 27,390 31,841 32,378 32,954 1.8 Real estate and rental and leasing 14,383 30,988 20,009 21,083 25,713 22,954 24,096 25,009 3.8 Professional and technical services 59,804 56,330 56,582 56,623 0 69,794 75,051 79,564 6 Management of companies and enterprises 0 0 0 0 0 0 0 0 0
Administrative and waste services 16,387 18,853 20,764 20,366 0 25,756 23,123 17,155 -25.8 Educational services 17,407 15,689 16,705 17,023 17,026 16,362 16,211 17,000 4.9 Health care and social assistance 22,178 27,319 28,936 27,479 26,229 25,846 25,462 26,998 6 Arts, entertainment, and recreation 0 6,787 6,750 7,150 8,228 11,037 11,605 13,127 13.1 Accommodation and food services 0 7,497 24,928 25,874 25,062 28,850 30,045 32,388 7.8 Other services, except public administration 28,801 29,793 29,129 29,302 26,988 27,451 29,286 30,848 5.3
Government and government enterprises 38,744 46,237 44,683 43,985 44,710 45,537 46,865 47,755 1.9
Total 35,930 45,271 55,693 57,469 62,636 62,983 62,447 54,455 -12.8
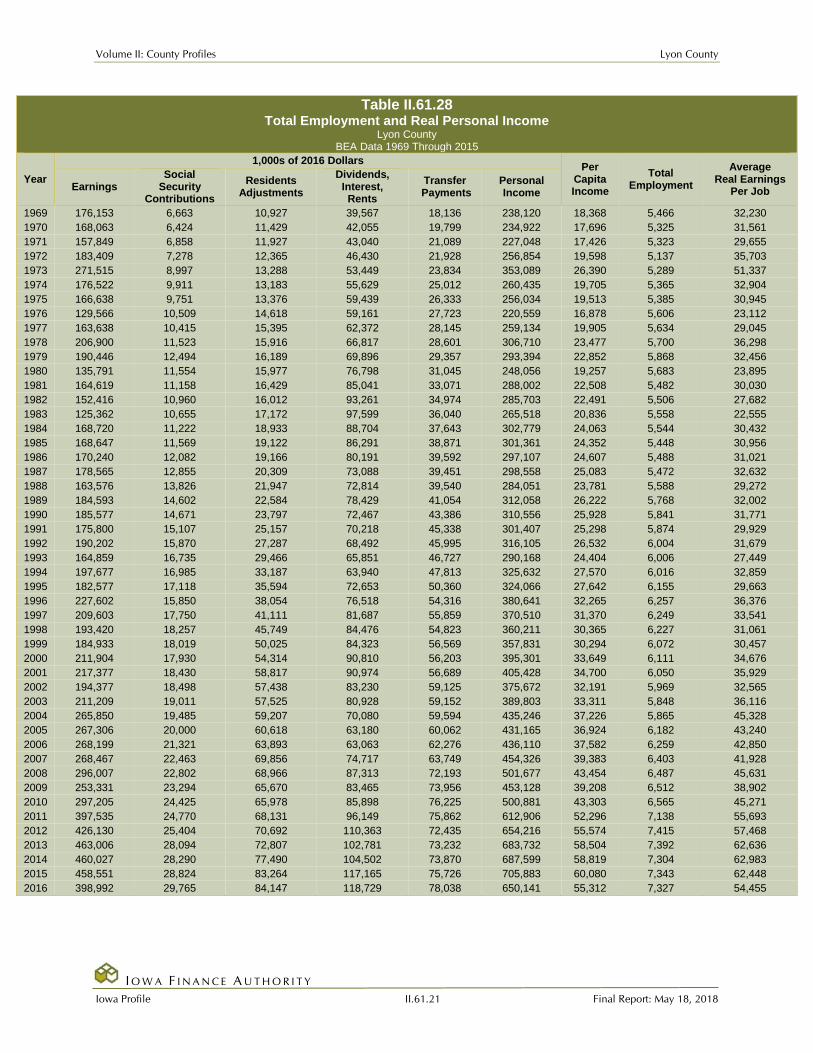
Table II.61.28 shows total employment and real personal income for the years of 1969 to 2016. As can be seen in total real personal income in 2016, comprising all wage and salary earnings, proprietorship income, dividends, interest, rents, and transfer payments, was $650,141,000 a -7.9 percent change between 2015 and 2016. Table II.61.28, shows further annual data for the years 1969 through 2016. In 2010, total employment was 6,565 and 7,327 in 2016, which a change of -0.2 percent over this period.
Volume II: County Profiles Lyon County
I O W A F I N A N C E A U T H O R I T Y Iowa Profile II.61.21 Final Report: May 18, 2018
Table II.61.28 Total Employment and Real Personal Income
Lyon County BEA Data 1969 Through 2015
Year
1,000s of 2016 Dollars Per Capita Income
Total Employment
Average Real Earnings
Per Job Earnings Social
Security Contributions
Residents Adjustments
Dividends, Interest, Rents
Transfer Payments
Personal Income
1969 176,153 6,663 10,927 39,567 18,136 238,120 18,368 5,466 32,230 1970 168,063 6,424 11,429 42,055 19,799 234,922 17,696 5,325 31,561 1971 157,849 6,858 11,927 43,040 21,089 227,048 17,426 5,323 29,655 1972 183,409 7,278 12,365 46,430 21,928 256,854 19,598 5,137 35,703 1973 271,515 8,997 13,288 53,449 23,834 353,089 26,390 5,289 51,337 1974 176,522 9,911 13,183 55,629 25,012 260,435 19,705 5,365 32,904 1975 166,638 9,751 13,376 59,439 26,333 256,034 19,513 5,385 30,945 1976 129,566 10,509 14,618 59,161 27,723 220,559 16,878 5,606 23,112 1977 163,638 10,415 15,395 62,372 28,145 259,134 19,905 5,634 29,045 1978 206,900 11,523 15,916 66,817 28,601 306,710 23,477 5,700 36,298 1979 190,446 12,494 16,189 69,896 29,357 293,394 22,852 5,868 32,456 1980 135,791 11,554 15,977 76,798 31,045 248,056 19,257 5,683 23,895 1981 164,619 11,158 16,429 85,041 33,071 288,002 22,508 5,482 30,030 1982 152,416 10,960 16,012 93,261 34,974 285,703 22,491 5,506 27,682 1983 125,362 10,655 17,172 97,599 36,040 265,518 20,836 5,558 22,555 1984 168,720 11,222 18,933 88,704 37,643 302,779 24,063 5,544 30,432 1985 168,647 11,569 19,122 86,291 38,871 301,361 24,352 5,448 30,956 1986 170,240 12,082 19,166 80,191 39,592 297,107 24,607 5,488 31,021 1987 178,565 12,855 20,309 73,088 39,451 298,558 25,083 5,472 32,632 1988 163,576 13,826 21,947 72,814 39,540 284,051 23,781 5,588 29,272 1989 184,593 14,602 22,584 78,429 41,054 312,058 26,222 5,768 32,002 1990 185,577 14,671 23,797 72,467 43,386 310,556 25,928 5,841 31,771 1991 175,800 15,107 25,157 70,218 45,338 301,407 25,298 5,874 29,929 1992 190,202 15,870 27,287 68,492 45,995 316,105 26,532 6,004 31,679 1993 164,859 16,735 29,466 65,851 46,727 290,168 24,404 6,006 27,449 1994 197,677 16,985 33,187 63,940 47,813 325,632 27,570 6,016 32,859 1995 182,577 17,118 35,594 72,653 50,360 324,066 27,642 6,155 29,663 1996 227,602 15,850 38,054 76,518 54,316 380,641 32,265 6,257 36,376 1997 209,603 17,750 41,111 81,687 55,859 370,510 31,370 6,249 33,541 1998 193,420 18,257 45,749 84,476 54,823 360,211 30,365 6,227 31,061 1999 184,933 18,019 50,025 84,323 56,569 357,831 30,294 6,072 30,457 2000 211,904 17,930 54,314 90,810 56,203 395,301 33,649 6,111 34,676 2001 217,377 18,430 58,817 90,974 56,689 405,428 34,700 6,050 35,929 2002 194,377 18,498 57,438 83,230 59,125 375,672 32,191 5,969 32,565 2003 211,209 19,011 57,525 80,928 59,152 389,803 33,311 5,848 36,116 2004 265,850 19,485 59,207 70,080 59,594 435,246 37,226 5,865 45,328 2005 267,306 20,000 60,618 63,180 60,062 431,165 36,924 6,182 43,240 2006 268,199 21,321 63,893 63,063 62,276 436,110 37,582 6,259 42,850 2007 268,467 22,463 69,856 74,717 63,749 454,326 39,383 6,403 41,928 2008 296,007 22,802 68,966 87,313 72,193 501,677 43,454 6,487 45,631 2009 253,331 23,294 65,670 83,465 73,956 453,128 39,208 6,512 38,902 2010 297,205 24,425 65,978 85,898 76,225 500,881 43,303 6,565 45,271 2011 397,535 24,770 68,131 96,149 75,862 612,906 52,296 7,138 55,693 2012 426,130 25,404 70,692 110,363 72,435 654,216 55,574 7,415 57,468 2013 463,006 28,094 72,807 102,781 73,232 683,732 58,504 7,392 62,636 2014 460,027 28,290 77,490 104,502 73,870 687,599 58,819 7,304 62,983 2015 458,551 28,824 83,264 117,165 75,726 705,883 60,080 7,343 62,448 2016 398,992 29,765 84,147 118,729 78,038 650,141 55,312 7,327 54,455

Volume II: County Profiles Lyon County
I O W A F I N A N C E A U T H O R I T Y Iowa Profile II.61.22 Final Report: May 18, 2018
Diagram II.61.5, shows real average earnings per job for Lyon County from 1990 to 2016. Over this period the average earning per job for Lyon County was $41,219, which was lower than the statewide average of $43,526 over the same period.
Diagram II.61.5
Real Average Earnings Per Job Lyon County
BEA Data 1990 - 2016
20,000
25,000
30,000
35,000
40,000
45,000
50,000
55,000
60,000
65,000
70,000
Ave
rage
Ear
ning
s Pe
r Job
($)
Year
Lyon County State of Iowa
Diagram II.61.6, shows real per capita income for the Lyon County from 1990 to 2016, which is calculated by dividing total personal income from all sources by population. Per capita income is a broader measure of wealth than real average earnings per job, which only captures the working population. Over this period, the real per capita income for Lyon County was $38,266, which was higher than the statewide average of $38,254 over the same period.

Volume II: County Profiles Lyon County
I O W A F I N A N C E A U T H O R I T Y Iowa Profile II.61.23 Final Report: May 18, 2018
Diagram II.61.6 Real Per Capita Income
Lyon County BEA Data 1990 - 2016
20,000
25,000
30,000
35,000
40,000
45,000
50,000
55,000
60,000
65,000
Per C
apita
Inco
me
($)
Year
Lyon County State of Iowa
Quarterly Census of Employment and Wages
The BLS produces the Quarterly Census of Employment and Wages (QCEW), which reports monthly data on employment and quarterly data on wages and number of business establishments. QCEW employment data represent only filled jobs, whether full or part-time, temporary or permanent, by place of work the pay period. If data do not meet BLS or State agency disclosure standards they are displayed as (ND) and not disclosed. Data from this series are from the period of January 2006 through December 2016 and are presented in Table II.61.29, with the 2016 information considered preliminary (p). Between 2015 and 2016, total annual employment increased from 4,569 persons in 2015 to 4,574 in 2016, a change of 0.1 percent.
Table II.61.29 Total Monthly Employment
Lyon County BLS QCEW Data, 2001–2016(p)
Period 2006 2007 2008 2009 2010 2011 2012 2013 2014 2015 2016 Jan 3,526 3,538 3,689 3,713 3,685 3,829 4,460 4,474 4,510 4,486 4,429 Feb 3,527 3,507 3,650 3,644 3,648 3,767 4,452 4,446 4,454 4,461 4,425 Mar 3,566 3,601 3,709 3,680 3,747 3,873 4,524 4,473 4,519 4,530 4,477 Apr 3,669 3,626 3,758 3,744 3,781 4,039 4,607 4,591 4,613 4,579 4,544 May 3,733 3,686 3,824 3,827 3,896 4,530 4,727 4,779 4,705 4,655 4,656 Jun 3,768 3,805 3,954 3,955 4,039 4,852 4,796 4,851 4,800 4,776 4,776 Jul 3,725 3,778 3,775 3,813 3,957 4,699 4,649 4,672 4,736 4,558 4,607 Aug 3,686 3,774 3,752 3,758 3,885 4,674 4,654 4,683 4,725 4,529 4,612 Sep 3,718 3,754 3,765 3,817 3,950 4,662 4,637 4,632 4,742 4,566 4,620 Oct 3,665 3,727 3,802 3,779 3,905 4,647 4,587 4,609 4,772 4,563 4,605 Nov 3,674 3,696 3,760 3,800 3,909 4,589 4,620 4,598 4,750 4,523 4,551 Dec 3,714 3,744 3,797 3,879 3,957 4,657 4,690 4,682 4,802 4,600 4,581
Annual 3,664 3,686 3,770 3,784 3,863 4,402 4,617 4,624 4,677 4,569 4,574 % Change . 0.6% 2.3% 0.4% 2.1% 14% 4.9% 0.2% 1.1% -2.3% 0.1%
Volume II: County Profiles Lyon County
I O W A F I N A N C E A U T H O R I T Y Iowa Profile II.61.24 Final Report: May 18, 2018
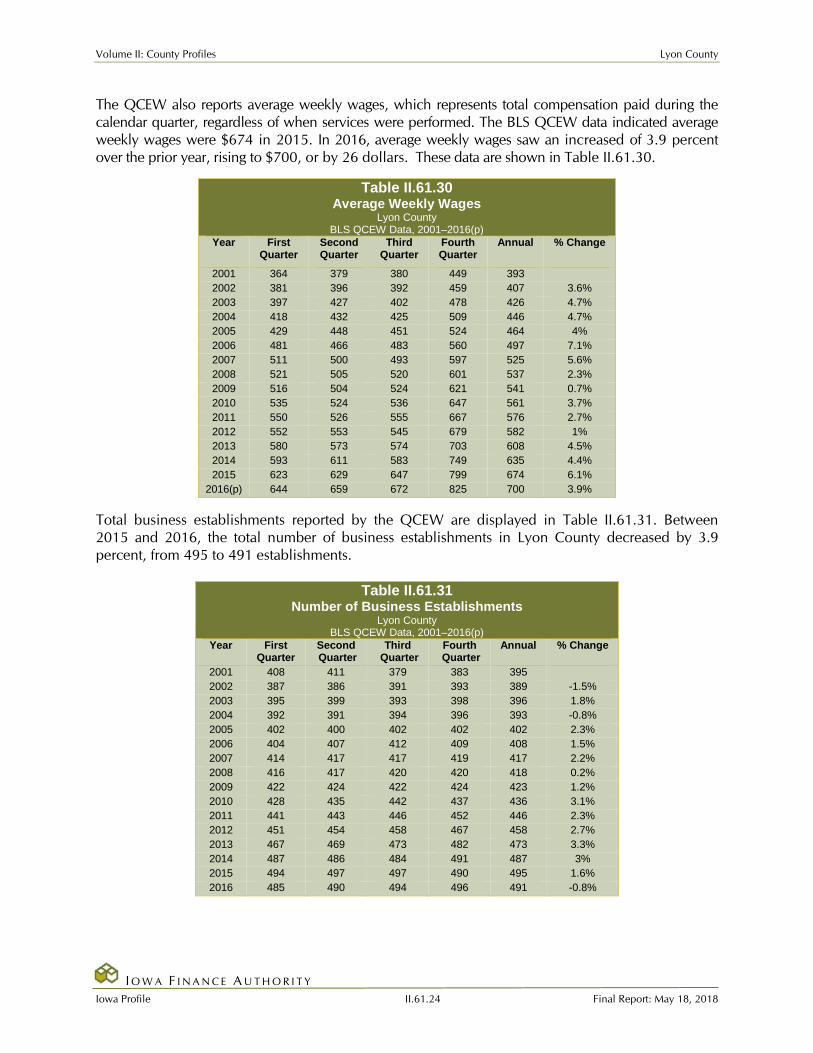
The QCEW also reports average weekly wages, which represents total compensation paid during the calendar quarter, regardless of when services were performed. The BLS QCEW data indicated average weekly wages were $674 in 2015. In 2016, average weekly wages saw an increased of 3.9 percent over the prior year, rising to $700, or by 26 dollars. These data are shown in Table II.61.30.
Table II.61.30 Average Weekly Wages
Lyon County BLS QCEW Data, 2001–2016(p)
Year First Quarter
Second Quarter
Third Quarter
Fourth Quarter
Annual % Change
2001 364 379 380 449 393 2002 381 396 392 459 407 3.6% 2003 397 427 402 478 426 4.7% 2004 418 432 425 509 446 4.7% 2005 429 448 451 524 464 4% 2006 481 466 483 560 497 7.1% 2007 511 500 493 597 525 5.6% 2008 521 505 520 601 537 2.3% 2009 516 504 524 621 541 0.7% 2010 535 524 536 647 561 3.7% 2011 550 526 555 667 576 2.7% 2012 552 553 545 679 582 1% 2013 580 573 574 703 608 4.5% 2014 593 611 583 749 635 4.4% 2015 623 629 647 799 674 6.1%
2016(p) 644 659 672 825 700 3.9%
Total business establishments reported by the QCEW are displayed in Table II.61.31. Between 2015 and 2016, the total number of business establishments in Lyon County decreased by 3.9 percent, from 495 to 491 establishments.
Table II.61.31 Number of Business Establishments
Lyon County BLS QCEW Data, 2001–2016(p)
Year First Quarter
Second Quarter
Third Quarter
Fourth Quarter
Annual % Change
2001 408 411 379 383 395 2002 387 386 391 393 389 -1.5% 2003 395 399 393 398 396 1.8% 2004 392 391 394 396 393 -0.8% 2005 402 400 402 402 402 2.3% 2006 404 407 412 409 408 1.5% 2007 414 417 417 419 417 2.2% 2008 416 417 420 420 418 0.2% 2009 422 424 422 424 423 1.2% 2010 428 435 442 437 436 3.1% 2011 441 443 446 452 446 2.3% 2012 451 454 458 467 458 2.7% 2013 467 469 473 482 473 3.3% 2014 487 486 484 491 487 3% 2015 494 497 497 490 495 1.6% 2016 485 490 494 496 491 -0.8%
Volume II: County Profiles Lyon County
I O W A F I N A N C E A U T H O R I T Y Iowa Profile II.61.25 Final Report: May 18, 2018
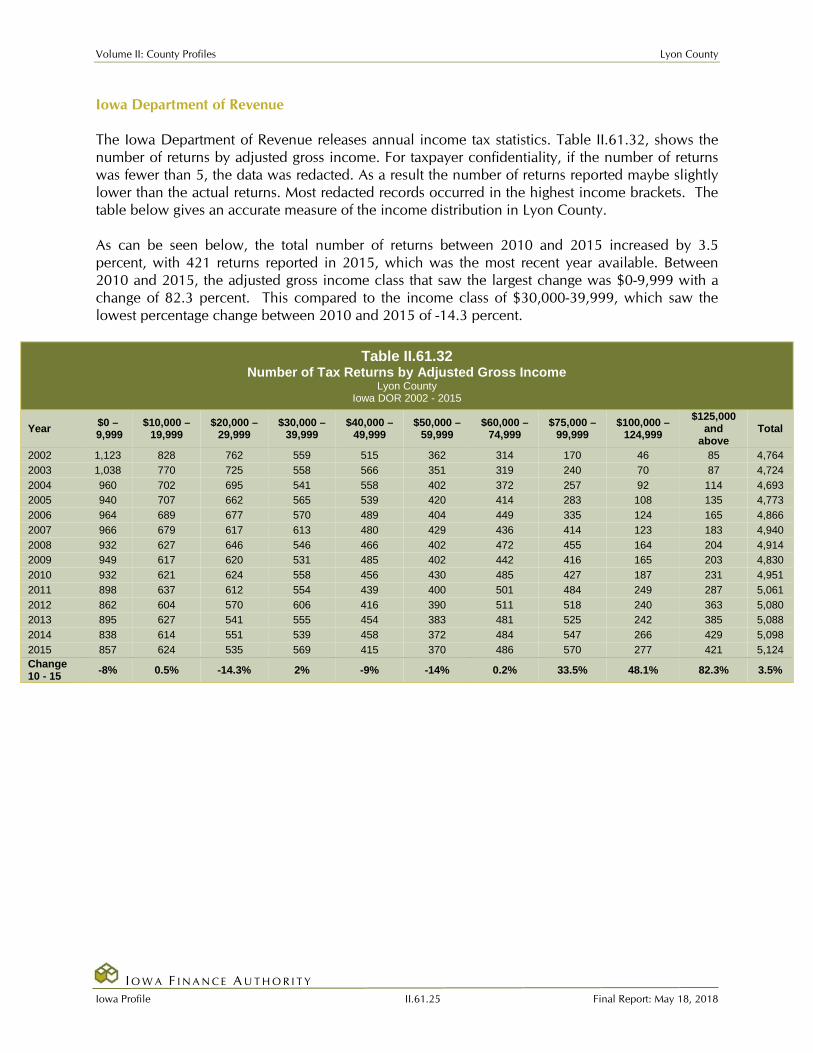
Iowa Department of Revenue The Iowa Department of Revenue releases annual income tax statistics. Table II.61.32, shows the number of returns by adjusted gross income. For taxpayer confidentiality, if the number of returns was fewer than 5, the data was redacted. As a result the number of returns reported maybe slightly lower than the actual returns. Most redacted records occurred in the highest income brackets. The table below gives an accurate measure of the income distribution in Lyon County. As can be seen below, the total number of returns between 2010 and 2015 increased by 3.5 percent, with 421 returns reported in 2015, which was the most recent year available. Between 2010 and 2015, the adjusted gross income class that saw the largest change was $0-9,999 with a change of 82.3 percent. This compared to the income class of $30,000-39,999, which saw the lowest percentage change between 2010 and 2015 of -14.3 percent.
Table II.61.32 Number of Tax Returns by Adjusted Gross Income
Lyon County Iowa DOR 2002 - 2015
Year $0 – 9,999
$10,000 – 19,999
$20,000 – 29,999
$30,000 – 39,999
$40,000 – 49,999
$50,000 – 59,999
$60,000 – 74,999
$75,000 – 99,999
$100,000 – 124,999
$125,000 and
above Total
2002 1,123 828 762 559 515 362 314 170 46 85 4,764 2003 1,038 770 725 558 566 351 319 240 70 87 4,724 2004 960 702 695 541 558 402 372 257 92 114 4,693 2005 940 707 662 565 539 420 414 283 108 135 4,773 2006 964 689 677 570 489 404 449 335 124 165 4,866 2007 966 679 617 613 480 429 436 414 123 183 4,940 2008 932 627 646 546 466 402 472 455 164 204 4,914 2009 949 617 620 531 485 402 442 416 165 203 4,830 2010 932 621 624 558 456 430 485 427 187 231 4,951 2011 898 637 612 554 439 400 501 484 249 287 5,061 2012 862 604 570 606 416 390 511 518 240 363 5,080 2013 895 627 541 555 454 383 481 525 242 385 5,088 2014 838 614 551 539 458 372 484 547 266 429 5,098 2015 857 624 535 569 415 370 486 570 277 421 5,124 Change 10 - 15 -8% 0.5% -14.3% 2% -9% -14% 0.2% 33.5% 48.1% 82.3% 3.5%
Volume II: County Profiles Lyon County
I O W A F I N A N C E A U T H O R I T Y Iowa Profile II.61.26 Final Report: May 18, 2018
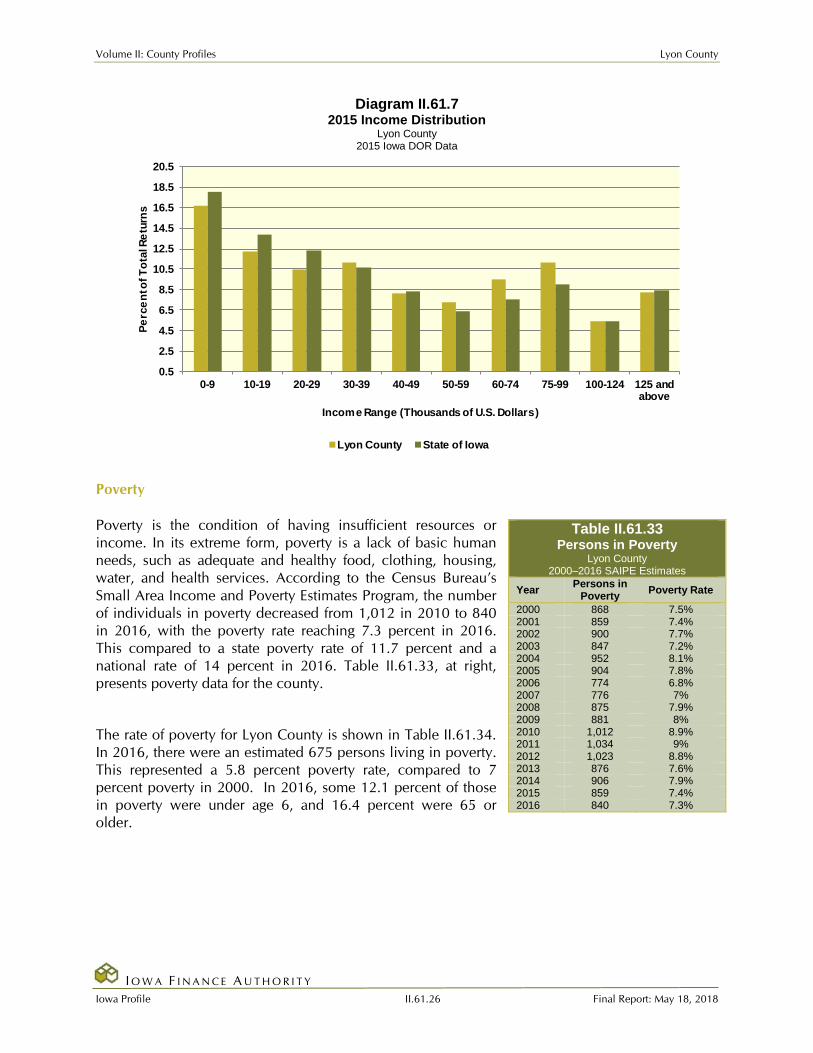
Diagram II.61.7 2015 Income Distribution
Lyon County 2015 Iowa DOR Data
0.5
2.5
4.5
6.5
8.5
10.5
12.5
14.5
16.5
18.5
20.5
0-9 10-19 20-29 30-39 40-49 50-59 60-74 75-99 100-124 125 andabove
Perc
ent o
f Tot
al R
etur
ns
Income Range (Thousands of U.S. Dollars)
Lyon County State of Iowa
Poverty Poverty is the condition of having insufficient resources or income. In its extreme form, poverty is a lack of basic human needs, such as adequate and healthy food, clothing, housing, water, and health services. According to the Census Bureau’s Small Area Income and Poverty Estimates Program, the number of individuals in poverty decreased from 1,012 in 2010 to 840 in 2016, with the poverty rate reaching 7.3 percent in 2016. This compared to a state poverty rate of 11.7 percent and a national rate of 14 percent in 2016. Table II.61.33, at right, presents poverty data for the county.
The rate of poverty for Lyon County is shown in Table II.61.34. In 2016, there were an estimated 675 persons living in poverty. This represented a 5.8 percent poverty rate, compared to 7 percent poverty in 2000. In 2016, some 12.1 percent of those in poverty were under age 6, and 16.4 percent were 65 or older.
Table II.61.33 Persons in Poverty
Lyon County 2000–2016 SAIPE Estimates
Year Persons in Poverty Poverty Rate
2000 868 7.5% 2001 859 7.4% 2002 900 7.7% 2003 847 7.2% 2004 952 8.1% 2005 904 7.8% 2006 774 6.8% 2007 776 7% 2008 875 7.9% 2009 881 8% 2010 1,012 8.9% 2011 1,034 9% 2012 1,023 8.8% 2013 876 7.6% 2014 906 7.9% 2015 859 7.4% 2016 840 7.3%

Volume II: County Profiles Lyon County
I O W A F I N A N C E A U T H O R I T Y Iowa Profile II.61.27 Final Report: May 18, 2018
Table II.61.34 Poverty by Age
Lyon County 2000 Census SF3 & 2016 Five-Year ACS Data
Age 2000 Census 2016 Five-Year ACS
Persons in Poverty % of Total Persons in Poverty % of Total Under 6 60 7.4% 82 12.1% 6 to 17 198 24.4% 153 22.7% 18 to 64 349 43% 329 48.7% 65 or Older 205 25.2% 111 16.4% Total 812 100.0% 675 100.0% Poverty Rate 7% . 5.8% .
HOUSING
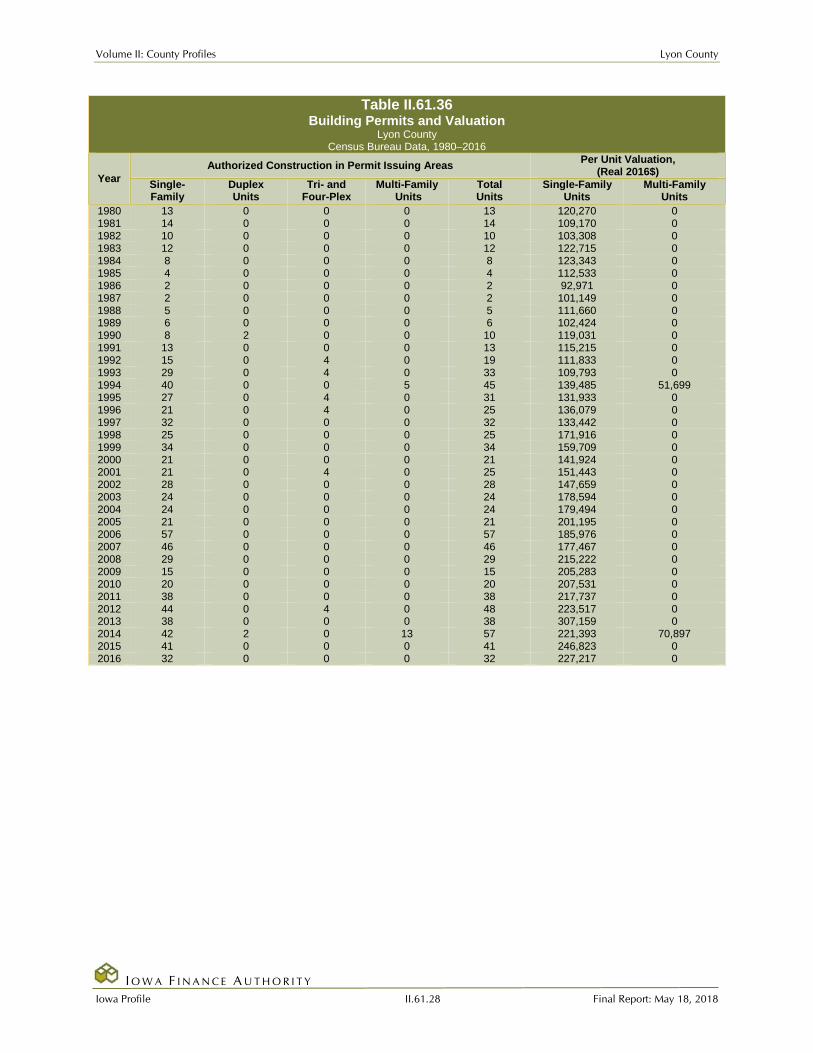
The Census Bureau estimates that the total number of housing units increased by 3.1 percent in Lyon County between 2010 and 2016, from 4,848 to 4,998. This compared to an estimated 3.3 percent increase statewide, as shown in Table II.61.35. Housing Production The Census Bureau reports building permit authorizations and “per unit” valuation of building permits by county annually. Single-family construction usually represents most residential development in the county. Single-family building permit authorizations in Lyon County decreased from 41 authorizations in 2015 to 32 in 2016. The real value of single-family building permits decreased from $246,823 in 2015 to $227,217 in 2016. This compares to an increase in permit value statewide, with values rising from $234,346 in 2015 to $235,750 in 2016. Additional details are given in Table II.61.36.
Table II.61.35 Housing Units
State of Iowa vs. Lyon County 2000 and 2016 Census Data and Intercensal Estimates
Subject Iowa % Growth
Since Census
Lyon County County
% Growth Since
Census 2000 Census Base 1,232,625 . 4,757 . 2010 Census 1,336,417 8.4% 4,848 1.9% July 2011 Estimate 1,341,974 0.4% 4,854 0.1% July 2012 Estimate 1,346,403 0.7% 4,882 0.7% July 2013 Estimate 1,353,274 1.3% 4,918 1.4% July 2014 Estimate 1,362,458 1.9% 4,949 2.1% July 2015 Estimate 1,370,778 2.6% 4,983 2.8% July 2016 Estimate 1,380,162 3.3% 4,998 3.1%
Volume II: County Profiles Lyon County
I O W A F I N A N C E A U T H O R I T Y Iowa Profile II.61.28 Final Report: May 18, 2018
Table II.61.36 Building Permits and Valuation
Lyon County Census Bureau Data, 1980–2016
Year Authorized Construction in Permit Issuing Areas Per Unit Valuation,
(Real 2016$) Single- Family
Duplex Units
Tri- and Four-Plex
Multi-Family Units
Total Units
Single-Family Units
Multi-Family Units
1980 13 0 0 0 13 120,270 0 1981 14 0 0 0 14 109,170 0 1982 10 0 0 0 10 103,308 0 1983 12 0 0 0 12 122,715 0 1984 8 0 0 0 8 123,343 0 1985 4 0 0 0 4 112,533 0 1986 2 0 0 0 2 92,971 0 1987 2 0 0 0 2 101,149 0 1988 5 0 0 0 5 111,660 0 1989 6 0 0 0 6 102,424 0 1990 8 2 0 0 10 119,031 0 1991 13 0 0 0 13 115,215 0 1992 15 0 4 0 19 111,833 0 1993 29 0 4 0 33 109,793 0 1994 40 0 0 5 45 139,485 51,699 1995 27 0 4 0 31 131,933 0 1996 21 0 4 0 25 136,079 0 1997 32 0 0 0 32 133,442 0 1998 25 0 0 0 25 171,916 0 1999 34 0 0 0 34 159,709 0 2000 21 0 0 0 21 141,924 0 2001 21 0 4 0 25 151,443 0 2002 28 0 0 0 28 147,659 0 2003 24 0 0 0 24 178,594 0 2004 24 0 0 0 24 179,494 0 2005 21 0 0 0 21 201,195 0 2006 57 0 0 0 57 185,976 0 2007 46 0 0 0 46 177,467 0 2008 29 0 0 0 29 215,222 0 2009 15 0 0 0 15 205,283 0 2010 20 0 0 0 20 207,531 0 2011 38 0 0 0 38 217,737 0 2012 44 0 4 0 48 223,517 0 2013 38 0 0 0 38 307,159 0 2014 42 2 0 13 57 221,393 70,897 2015 41 0 0 0 41 246,823 0 2016 32 0 0 0 32 227,217 0
Volume II: County Profiles Lyon County
I O W A F I N A N C E A U T H O R I T Y Iowa Profile II.61.29 Final Report: May 18, 2018
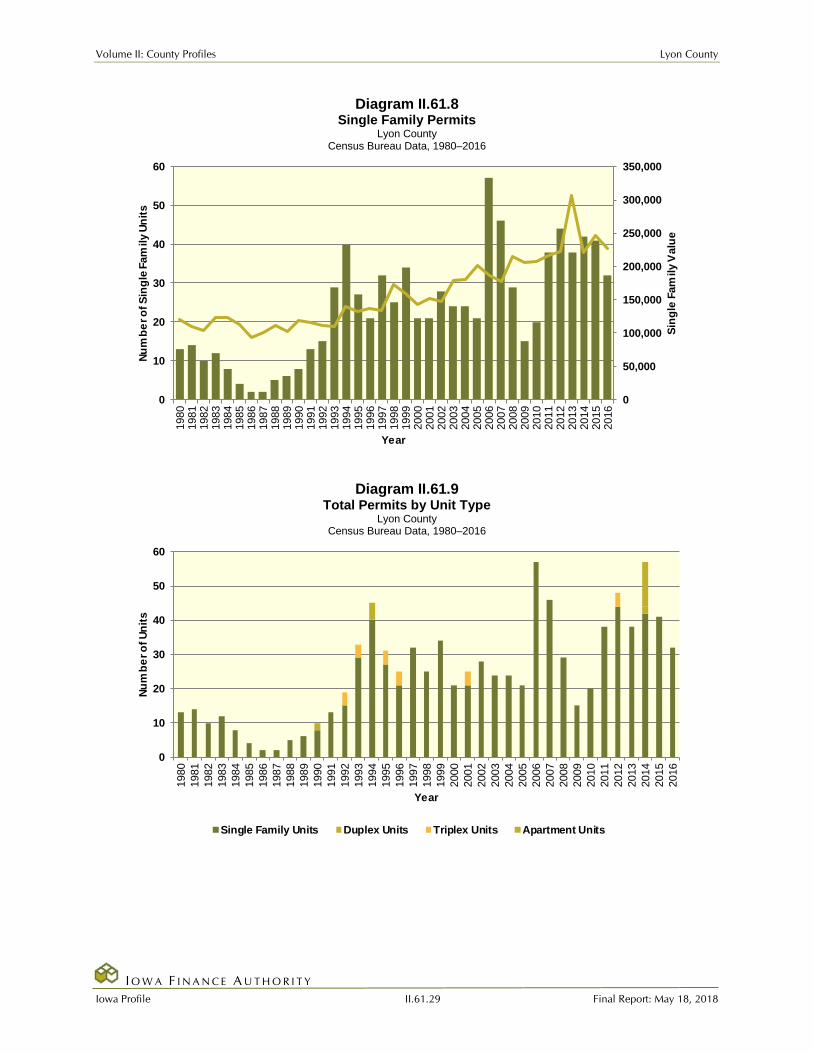
Diagram II.61.8 Single Family Permits
Lyon County Census Bureau Data, 1980–2016
0
50,000
100,000
150,000
200,000
250,000
300,000
350,000
0
10
20
30
40
50
6019
8019
8119
8219
8319
8419
8519
8619
8719
8819
8919
9019
9119
9219
9319
9419
9519
9619
9719
9819
9920
0020
0120
0220
0320
0420
0520
0620
0720
0820
0920
1020
1120
1220
1320
1420
1520
16
Sing
le F
amily
Val
ue
Num
ber o
f Sin
gle
Fam
ily U
nits
Year
Diagram II.61.9
Total Permits by Unit Type Lyon County
Census Bureau Data, 1980–2016
0
10
20
30
40
50
60
1980
1981
1982
1983
1984
1985
1986
1987
1988
1989
1990
1991
1992
1993
1994
1995
1996
1997
1998
1999
2000
2001
2002
2003
2004
2005
2006
2007
2008
2009
2010
2011
2012
2013
2014
2015
2016
Num
ber o
f Uni
ts
Year
Single Family Units Duplex Units Triplex Units Apartment Units
Volume II: County Profiles Lyon County
I O W A F I N A N C E A U T H O R I T Y Iowa Profile II.61.30 Final Report: May 18, 2018
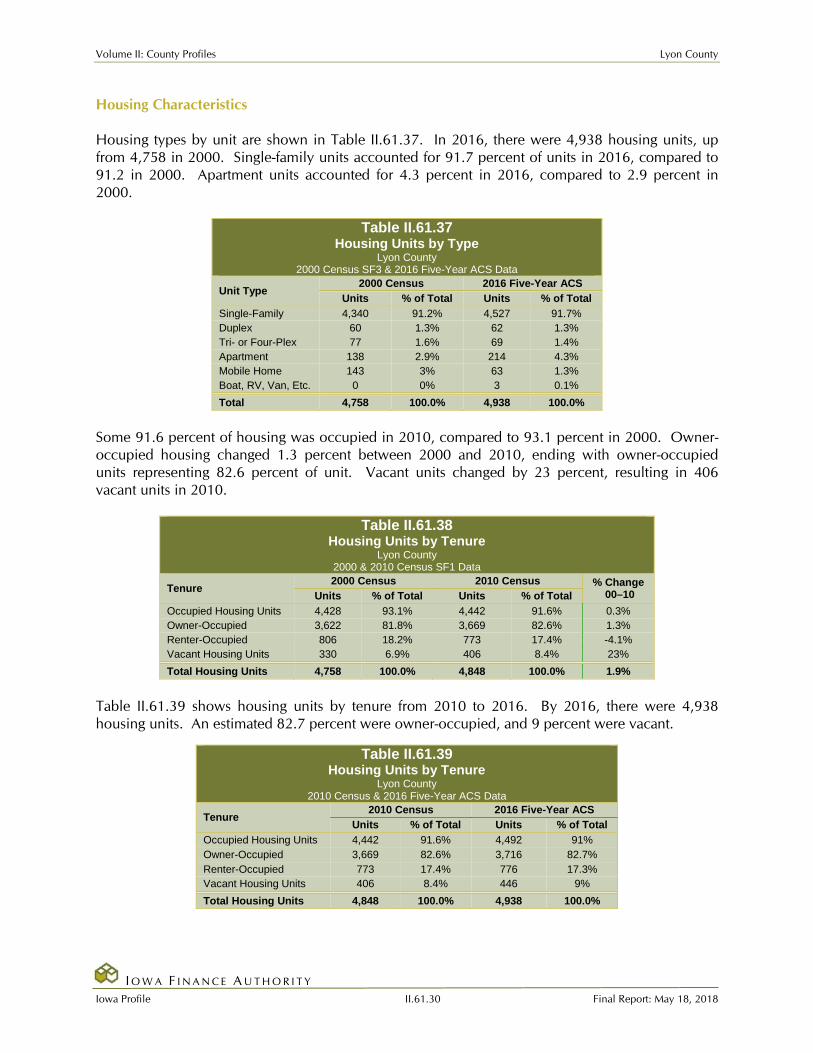
Housing Characteristics Housing types by unit are shown in Table II.61.37. In 2016, there were 4,938 housing units, up from 4,758 in 2000. Single-family units accounted for 91.7 percent of units in 2016, compared to 91.2 in 2000. Apartment units accounted for 4.3 percent in 2016, compared to 2.9 percent in 2000.
Table II.61.37 Housing Units by Type
Lyon County 2000 Census SF3 & 2016 Five-Year ACS Data
Unit Type 2000 Census 2016 Five-Year ACS
Units % of Total Units % of Total Single-Family 4,340 91.2% 4,527 91.7% Duplex 60 1.3% 62 1.3% Tri- or Four-Plex 77 1.6% 69 1.4% Apartment 138 2.9% 214 4.3% Mobile Home 143 3% 63 1.3% Boat, RV, Van, Etc. 0 0% 3 0.1% Total 4,758 100.0% 4,938 100.0%
Some 91.6 percent of housing was occupied in 2010, compared to 93.1 percent in 2000. Owner-occupied housing changed 1.3 percent between 2000 and 2010, ending with owner-occupied units representing 82.6 percent of unit. Vacant units changed by 23 percent, resulting in 406 vacant units in 2010.
Table II.61.38 Housing Units by Tenure
Lyon County 2000 & 2010 Census SF1 Data
Tenure 2000 Census 2010 Census % Change
00–10 Units % of Total Units % of Total Occupied Housing Units 4,428 93.1% 4,442 91.6% 0.3% Owner-Occupied 3,622 81.8% 3,669 82.6% 1.3% Renter-Occupied 806 18.2% 773 17.4% -4.1% Vacant Housing Units 330 6.9% 406 8.4% 23% Total Housing Units 4,758 100.0% 4,848 100.0% 1.9%
Table II.61.39 shows housing units by tenure from 2010 to 2016. By 2016, there were 4,938 housing units. An estimated 82.7 percent were owner-occupied, and 9 percent were vacant.
Table II.61.39 Housing Units by Tenure
Lyon County 2010 Census & 2016 Five-Year ACS Data
Tenure 2010 Census 2016 Five-Year ACS
Units % of Total Units % of Total Occupied Housing Units 4,442 91.6% 4,492 91% Owner-Occupied 3,669 82.6% 3,716 82.7% Renter-Occupied 773 17.4% 776 17.3% Vacant Housing Units 406 8.4% 446 9% Total Housing Units 4,848 100.0% 4,938 100.0%

Volume II: County Profiles Lyon County
I O W A F I N A N C E A U T H O R I T Y Iowa Profile II.61.31 Final Report: May 18, 2018
Households by household size are shown in Table II.61.40. There were a total of 4,442 households in 2010, up from 4,428 in 2000. One person households changed by 1.7 percent between 2000 and 2010, while two person households changed by 7.6 percent. Three and four person households changed by -8.6 and -10.7 respectively, representing 12.7 percent and 12.2 percent of the population in 2010.
Table II.61.40 Households by Household Size
Lyon County 2000 & 2010 Census SF1 Data
Size 2000 Census 2010 Census % Change
00–10 Households % of Total Households % of Total One Person 1,075 24.3% 1,093 24.6% 1.7% Two Persons 1,575 35.6% 1,694 38.1% 7.6% Three Persons 615 13.9% 562 12.7% -8.6% Four Persons 605 13.7% 540 12.2% -10.7% Five Persons 369 8.3% 337 7.6% -8.7% Six Persons 132 3% 151 3.4% 14.4% Seven Persons or More 57 1.3% 65 1.5% 14% Total 4,428 100.0% 4,442 100.0% 0.3%
Households by income is shown in Table II.61.41. Households earning more than $100,000 per year represented 20.4 percent of households in 2016, compared to 4.4 percent in 2000. Households earning between $50,000 and $74,999 represented 25 percent of households in 2010, compared to 20.4 percent in 2000. Meanwhile, households earning less than $15,000 accounted for 7.9 percent of households in 2016, compared to 14.4 percent in 2000.
Table II.61.41 Households by Income
Lyon County 2000 Census SF3 & 2016 Five-Year ACS Data
Income 2000 Census 2016 Five-Year ACS
Households % of Total Households % of Total Less than $15,000 631 14.4% 353 7.9% $15,000 to $19,999 330 7.5% 194 4.3% $20,000 to $24,999 297 6.8% 176 3.9% $25,000 to $34,999 784 17.8% 434 9.7% $35,000 to $49,999 954 21.7% 637 14.2% $50,000 to $74,999 897 20.4% 1,124 25% $75,000 to $99,999 310 7.1% 657 14.6% $100,000 or More 192 4.4% 917 20.4% Total 4,395 100.0% 4,492 100.0%

Volume II: County Profiles Lyon County
I O W A F I N A N C E A U T H O R I T Y Iowa Profile II.61.32 Final Report: May 18, 2018
Table II.61.42, shows households by year home built. Housing units built between 2000 and 2009, and 2010 or later, account for 6.7 percent and 2.9 percent of households, respectively. Households built in the 1970’s, 1980’s, and 1990’s account for 13.6 percent, 5.6 percent, and 11.3, respectively. Housing units built prior to 1939 represented 31.2 percent of households in 2016.
Table II.61.42 Households by Year Home Built
Lyon County 2000 Census SF3 & 2016 Five-Year ACS Data
Year Built 2000 Census 2016 Five-Year ACS
Households % of Total Households % of Total 1939 or Earlier 1,844 41.6% 1,403 31.2% 1940 to 1949 419 9.5% 349 7.8% 1950 to 1959 521 11.8% 568 12.6% 1960 to 1969 372 8.4% 365 8.1% 1970 to 1979 660 14.9% 613 13.6% 1980 to 1989 245 5.5% 250 5.6% 1990 to 1999 367 8.3% 509 11.3% 2000 to 2009 . . 303 6.7% 2010 or Later . . 132 2.9% Total 4,428 100.0% 4,492 100.0%
The distribution of unit types by race are shown in Table II.61.43. An estimated 93.1 percent of white households occupy single family homesand some 3.4 percent of white households occupied apartments. An estimated 100 percent of American Indian households occupy single family homes.
Table II.61.43 Distribution of Units in Structure by Race
Lyon County 2016 Five-Year ACS Data
Unit Type White Black American Indian Asian
Native Hawaiian/Pacific
Islanders Other Two or
More Races
Single-Family 93.1% 0% 100% 0% 0% 100% 100%
Duplex 0.8% 0% 0% 0% 0% 0% 0%
Tri- or Four-Plex 1.4% 0% 0% 0% 0% 0% 0%
Apartment 3.4% 0% 0% 0% 0% 0% 0%
Mobile Home 1.3% 0% 0% 0% 0% 0% 0%
Boat, RV, Van, Etc. 0% 0% 0% 100% 0% 0% 0%
Total 100.0% 100.0% 100.0% 100.0% 100.0% 100.0% 100.0%
The disposition of vacant housing units in 2000 and 2010 are shown in Table II.61.44. An estimated 22.9 percent of vacant units were for rent in 2010, a 10.7 percent change since 2000. In addition, some 15.8 percent of vacant units were for sale, a change of -34.7 percent between 2000 and 2010. “Other” vacant units represented 47.5 percent of vacant units in 2010. This is a change of 70.8 percent since 2000. “Other” vacant units are not for sale or rent, or otherwise available to the marketplace. These units may be problematic if concentrated in certain areas, and may create a “blighting” effect.

Volume II: County Profiles Lyon County
I O W A F I N A N C E A U T H O R I T Y Iowa Profile II.61.33 Final Report: May 18, 2018
Table II.61.44 Disposition of Vacant Housing Units
Lyon County 2000 & 2010 Census SF1 Data
Disposition 2000 Census 2010 Census % Change
00–10 Units % of Total Units % of Total For Rent 84 25.5% 93 22.9% 10.7% For Sale 98 29.7% 64 15.8% -34.7% Rented or Sold, Not Occupied 18 5.5% 25 6.2% 38.9% For Seasonal, Recreational, or Occasional Use 17 5.2% 31 7.6% 82.4%
For Migrant Workers 0 0% 0 0% 0% Other Vacant 113 34.2% 193 47.5% 70.8% Total 330 100.0% 406 100.0% 23%
The disposition of vacant units between 2010 and 2016 are shown in Table II.61.45. By 2016, for rent units accounted for 20.6 percent of vacant units, while for sale units accounted for 17.9 percent. “Other” vacant units accounted for 52.2 percent of vacant units, representing a total of 233 “other” vacant units.
Table II.61.45 Disposition of Vacant Housing Units
Lyon County 2010 Census & 2016 Five-Year ACS Data
Disposition 2010 Census 2016 Five-Year ACS
Units % of Total Units % of Total For Rent 93 22.9% 92 20.6% For Sale 64 15.8% 80 17.9% Rented Not Occupied 7 1.7% 0 0% Sold Not Occupied 18 4.4% 23 5.2% For Seasonal, Recreational, or Occasional Use 31 7.6% 18 4% For Migrant Workers 0 0% 0 0% Other Vacant 193 47.5% 233 52.2% Total 406 100.0% 446 100.0%
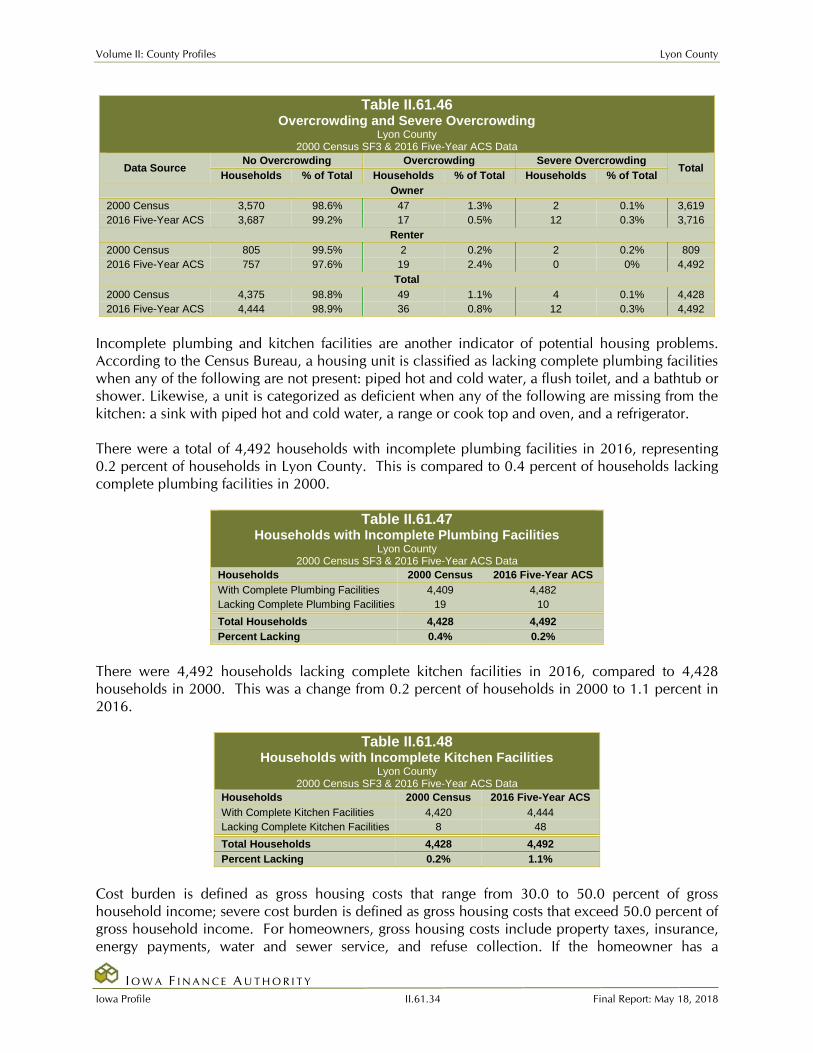
Housing Problems Households are classified as having housing problems if they face overcrowding, incomplete plumbing or kitchen facilities, or cost burdens. Overcrowding is defined as having from 1.1 to 1.5 people per room per residence, with severe overcrowding defined as having more than 1.5 people per room. Households with overcrowding are shown in Table II.61.46. In 2016, an estimated 0.8 percent of households were overcrowded, and an additional 0.3 percent were severely overcrowded.
Volume II: County Profiles Lyon County
I O W A F I N A N C E A U T H O R I T Y Iowa Profile II.61.34 Final Report: May 18, 2018
Table II.61.46 Overcrowding and Severe Overcrowding
Lyon County 2000 Census SF3 & 2016 Five-Year ACS Data
Data Source No Overcrowding Overcrowding Severe Overcrowding
Total Households % of Total Households % of Total Households % of Total
Owner 2000 Census 3,570 98.6% 47 1.3% 2 0.1% 3,619 2016 Five-Year ACS 3,687 99.2% 17 0.5% 12 0.3% 3,716
Renter 2000 Census 805 99.5% 2 0.2% 2 0.2% 809 2016 Five-Year ACS 757 97.6% 19 2.4% 0 0% 4,492
Total 2000 Census 4,375 98.8% 49 1.1% 4 0.1% 4,428 2016 Five-Year ACS 4,444 98.9% 36 0.8% 12 0.3% 4,492
Incomplete plumbing and kitchen facilities are another indicator of potential housing problems. According to the Census Bureau, a housing unit is classified as lacking complete plumbing facilities when any of the following are not present: piped hot and cold water, a flush toilet, and a bathtub or shower. Likewise, a unit is categorized as deficient when any of the following are missing from the kitchen: a sink with piped hot and cold water, a range or cook top and oven, and a refrigerator. There were a total of 4,492 households with incomplete plumbing facilities in 2016, representing 0.2 percent of households in Lyon County. This is compared to 0.4 percent of households lacking complete plumbing facilities in 2000.
Table II.61.47 Households with Incomplete Plumbing Facilities
Lyon County 2000 Census SF3 & 2016 Five-Year ACS Data
Households 2000 Census 2016 Five-Year ACS With Complete Plumbing Facilities 4,409 4,482 Lacking Complete Plumbing Facilities 19 10 Total Households 4,428 4,492 Percent Lacking 0.4% 0.2%
There were 4,492 households lacking complete kitchen facilities in 2016, compared to 4,428 households in 2000. This was a change from 0.2 percent of households in 2000 to 1.1 percent in 2016.
Table II.61.48 Households with Incomplete Kitchen Facilities
Lyon County 2000 Census SF3 & 2016 Five-Year ACS Data
Households 2000 Census 2016 Five-Year ACS With Complete Kitchen Facilities 4,420 4,444 Lacking Complete Kitchen Facilities 8 48 Total Households 4,428 4,492 Percent Lacking 0.2% 1.1%
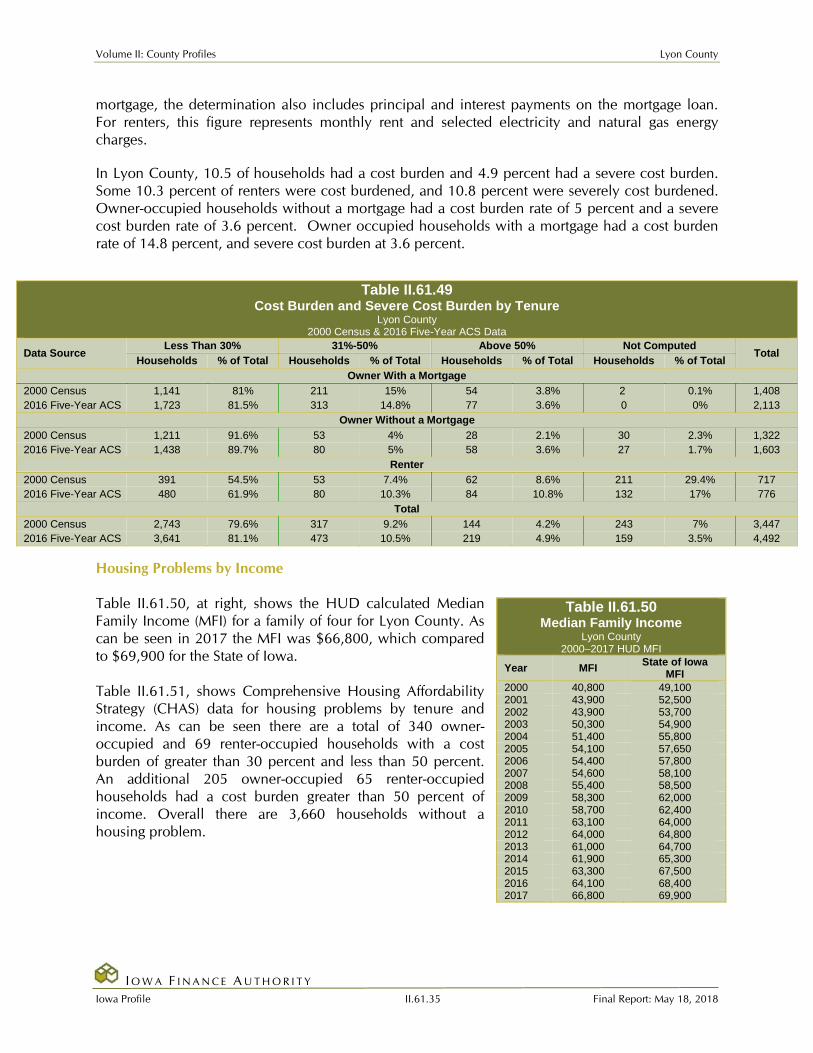
Cost burden is defined as gross housing costs that range from 30.0 to 50.0 percent of gross household income; severe cost burden is defined as gross housing costs that exceed 50.0 percent of gross household income. For homeowners, gross housing costs include property taxes, insurance, energy payments, water and sewer service, and refuse collection. If the homeowner has a
Volume II: County Profiles Lyon County
I O W A F I N A N C E A U T H O R I T Y Iowa Profile II.61.35 Final Report: May 18, 2018
mortgage, the determination also includes principal and interest payments on the mortgage loan. For renters, this figure represents monthly rent and selected electricity and natural gas energy charges.
In Lyon County, 10.5 of households had a cost burden and 4.9 percent had a severe cost burden. Some 10.3 percent of renters were cost burdened, and 10.8 percent were severely cost burdened. Owner-occupied households without a mortgage had a cost burden rate of 5 percent and a severe cost burden rate of 3.6 percent. Owner occupied households with a mortgage had a cost burden rate of 14.8 percent, and severe cost burden at 3.6 percent.
Table II.61.49 Cost Burden and Severe Cost Burden by Tenure
Lyon County 2000 Census & 2016 Five-Year ACS Data
Data Source Less Than 30% 31%-50% Above 50% Not Computed
Total Households % of Total Households % of Total Households % of Total Households % of Total
Owner With a Mortgage 2000 Census 1,141 81% 211 15% 54 3.8% 2 0.1% 1,408 2016 Five-Year ACS 1,723 81.5% 313 14.8% 77 3.6% 0 0% 2,113
Owner Without a Mortgage 2000 Census 1,211 91.6% 53 4% 28 2.1% 30 2.3% 1,322 2016 Five-Year ACS 1,438 89.7% 80 5% 58 3.6% 27 1.7% 1,603
Renter 2000 Census 391 54.5% 53 7.4% 62 8.6% 211 29.4% 717 2016 Five-Year ACS 480 61.9% 80 10.3% 84 10.8% 132 17% 776
Total 2000 Census 2,743 79.6% 317 9.2% 144 4.2% 243 7% 3,447 2016 Five-Year ACS 3,641 81.1% 473 10.5% 219 4.9% 159 3.5% 4,492
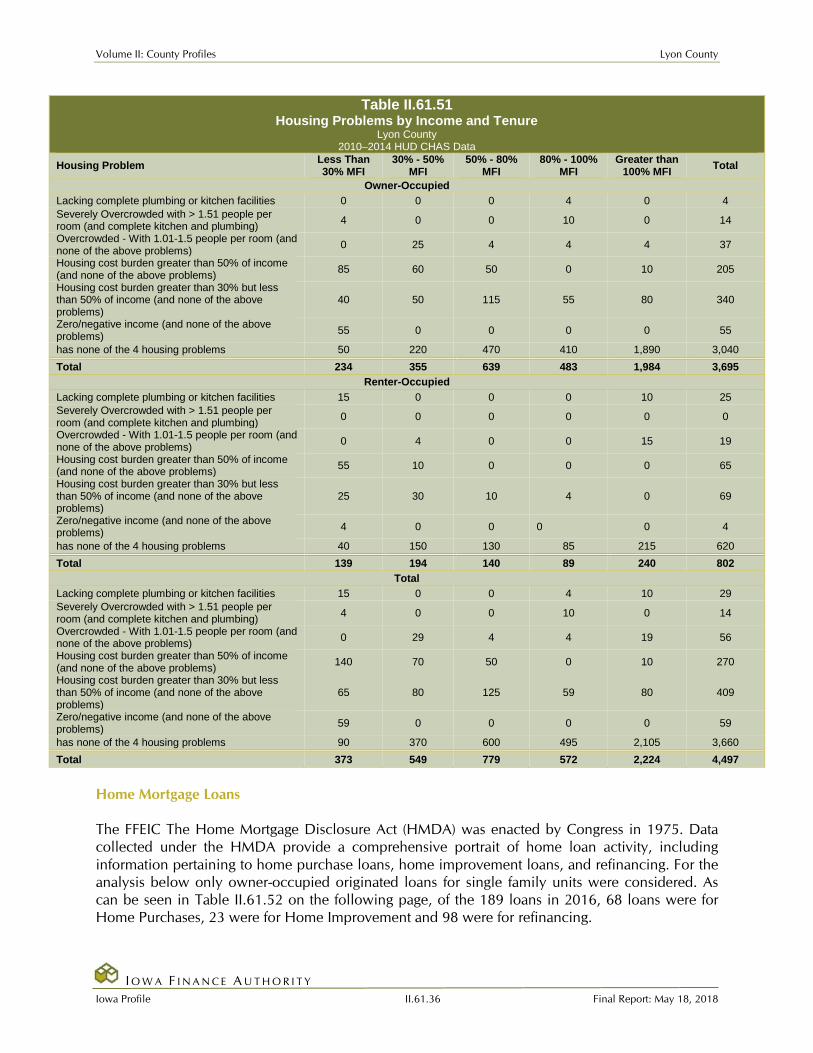
Housing Problems by Income Table II.61.50, at right, shows the HUD calculated Median Family Income (MFI) for a family of four for Lyon County. As can be seen in 2017 the MFI was $66,800, which compared to $69,900 for the State of Iowa. Table II.61.51, shows Comprehensive Housing Affordability Strategy (CHAS) data for housing problems by tenure and income. As can be seen there are a total of 340 owner-occupied and 69 renter-occupied households with a cost burden of greater than 30 percent and less than 50 percent. An additional 205 owner-occupied 65 renter-occupied households had a cost burden greater than 50 percent of income. Overall there are 3,660 households without a housing problem.
Table II.61.50 Median Family Income
Lyon County 2000–2017 HUD MFI
Year MFI State of Iowa MFI
2000 40,800 49,100 2001 43,900 52,500 2002 43,900 53,700 2003 50,300 54,900 2004 51,400 55,800 2005 54,100 57,650 2006 54,400 57,800 2007 54,600 58,100 2008 55,400 58,500 2009 58,300 62,000 2010 58,700 62,400 2011 63,100 64,000 2012 64,000 64,800 2013 61,000 64,700 2014 61,900 65,300 2015 63,300 67,500 2016 64,100 68,400 2017 66,800 69,900
Volume II: County Profiles Lyon County
I O W A F I N A N C E A U T H O R I T Y Iowa Profile II.61.36 Final Report: May 18, 2018
Table II.61.51 Housing Problems by Income and Tenure
Lyon County 2010–2014 HUD CHAS Data
Housing Problem Less Than 30% MFI
30% - 50% MFI
50% - 80% MFI
80% - 100% MFI
Greater than 100% MFI Total
Owner-Occupied Lacking complete plumbing or kitchen facilities 0 0 0 4 0 4 Severely Overcrowded with > 1.51 people per room (and complete kitchen and plumbing) 4 0 0 10 0 14
Overcrowded - With 1.01-1.5 people per room (and none of the above problems) 0 25 4 4 4 37
Housing cost burden greater than 50% of income (and none of the above problems) 85 60 50 0 10 205
Housing cost burden greater than 30% but less than 50% of income (and none of the above problems)
40 50 115 55 80 340
Zero/negative income (and none of the above problems) 55 0 0 0 0 55
has none of the 4 housing problems 50 220 470 410 1,890 3,040 Total 234 355 639 483 1,984 3,695
Renter-Occupied Lacking complete plumbing or kitchen facilities 15 0 0 0 10 25 Severely Overcrowded with > 1.51 people per room (and complete kitchen and plumbing) 0 0 0 0 0 0
Overcrowded - With 1.01-1.5 people per room (and none of the above problems) 0 4 0 0 15 19
Housing cost burden greater than 50% of income (and none of the above problems) 55 10 0 0 0 65
Housing cost burden greater than 30% but less than 50% of income (and none of the above problems)
25 30 10 4 0 69
Zero/negative income (and none of the above problems) 4 0 0 0 0 4
has none of the 4 housing problems 40 150 130 85 215 620 Total 139 194 140 89 240 802
Total Lacking complete plumbing or kitchen facilities 15 0 0 4 10 29 Severely Overcrowded with > 1.51 people per room (and complete kitchen and plumbing) 4 0 0 10 0 14
Overcrowded - With 1.01-1.5 people per room (and none of the above problems) 0 29 4 4 19 56
Housing cost burden greater than 50% of income (and none of the above problems) 140 70 50 0 10 270
Housing cost burden greater than 30% but less than 50% of income (and none of the above problems)
65 80 125 59 80 409
Zero/negative income (and none of the above problems) 59 0 0 0 0 59
has none of the 4 housing problems 90 370 600 495 2,105 3,660 Total 373 549 779 572 2,224 4,497
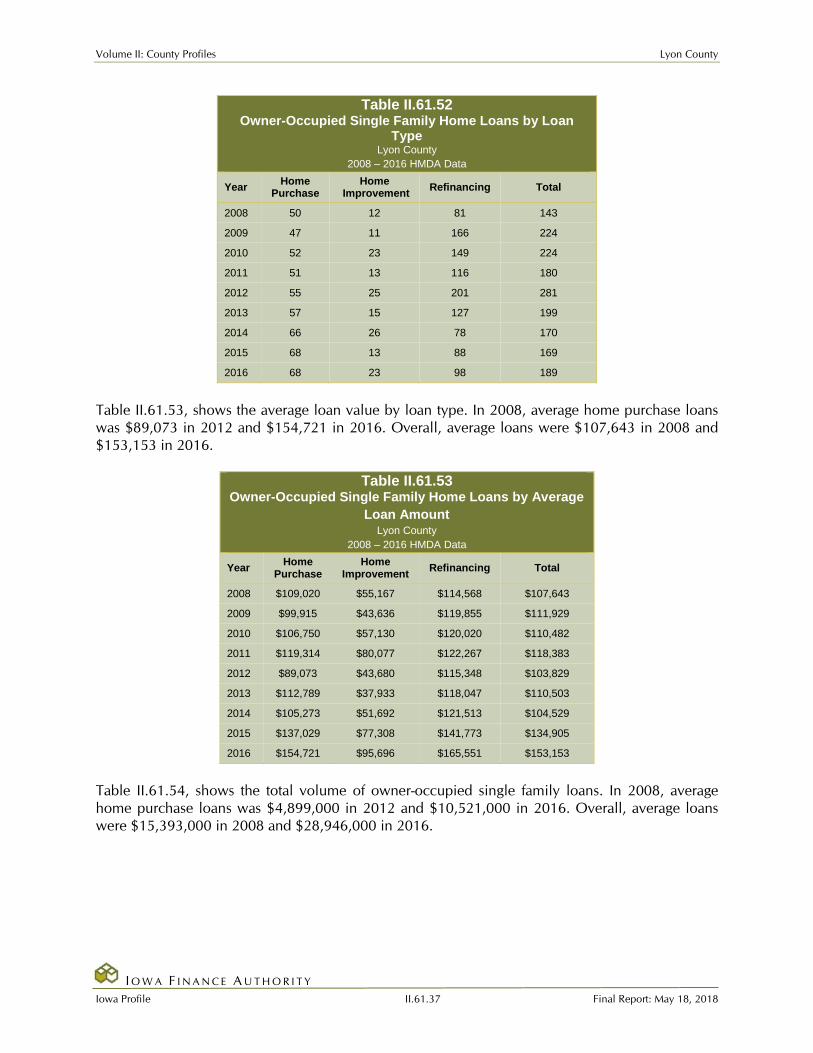
Home Mortgage Loans The FFEIC The Home Mortgage Disclosure Act (HMDA) was enacted by Congress in 1975. Data collected under the HMDA provide a comprehensive portrait of home loan activity, including information pertaining to home purchase loans, home improvement loans, and refinancing. For the analysis below only owner-occupied originated loans for single family units were considered. As can be seen in Table II.61.52 on the following page, of the 189 loans in 2016, 68 loans were for Home Purchases, 23 were for Home Improvement and 98 were for refinancing.
Volume II: County Profiles Lyon County
I O W A F I N A N C E A U T H O R I T Y Iowa Profile II.61.37 Final Report: May 18, 2018
Table II.61.52 Owner-Occupied Single Family Home Loans by Loan
Type Lyon County
2008 – 2016 HMDA Data
Year Home Purchase
Home Improvement Refinancing Total
2008 50 12 81 143
2009 47 11 166 224
2010 52 23 149 224
2011 51 13 116 180
2012 55 25 201 281
2013 57 15 127 199
2014 66 26 78 170
2015 68 13 88 169
2016 68 23 98 189
Table II.61.53, shows the average loan value by loan type. In 2008, average home purchase loans was $89,073 in 2012 and $154,721 in 2016. Overall, average loans were $107,643 in 2008 and $153,153 in 2016.
Table II.61.53 Owner-Occupied Single Family Home Loans by Average
Loan Amount Lyon County
2008 – 2016 HMDA Data
Year Home Purchase
Home Improvement Refinancing Total
2008 $109,020 $55,167 $114,568 $107,643
2009 $99,915 $43,636 $119,855 $111,929
2010 $106,750 $57,130 $120,020 $110,482
2011 $119,314 $80,077 $122,267 $118,383
2012 $89,073 $43,680 $115,348 $103,829
2013 $112,789 $37,933 $118,047 $110,503
2014 $105,273 $51,692 $121,513 $104,529
2015 $137,029 $77,308 $141,773 $134,905
2016 $154,721 $95,696 $165,551 $153,153
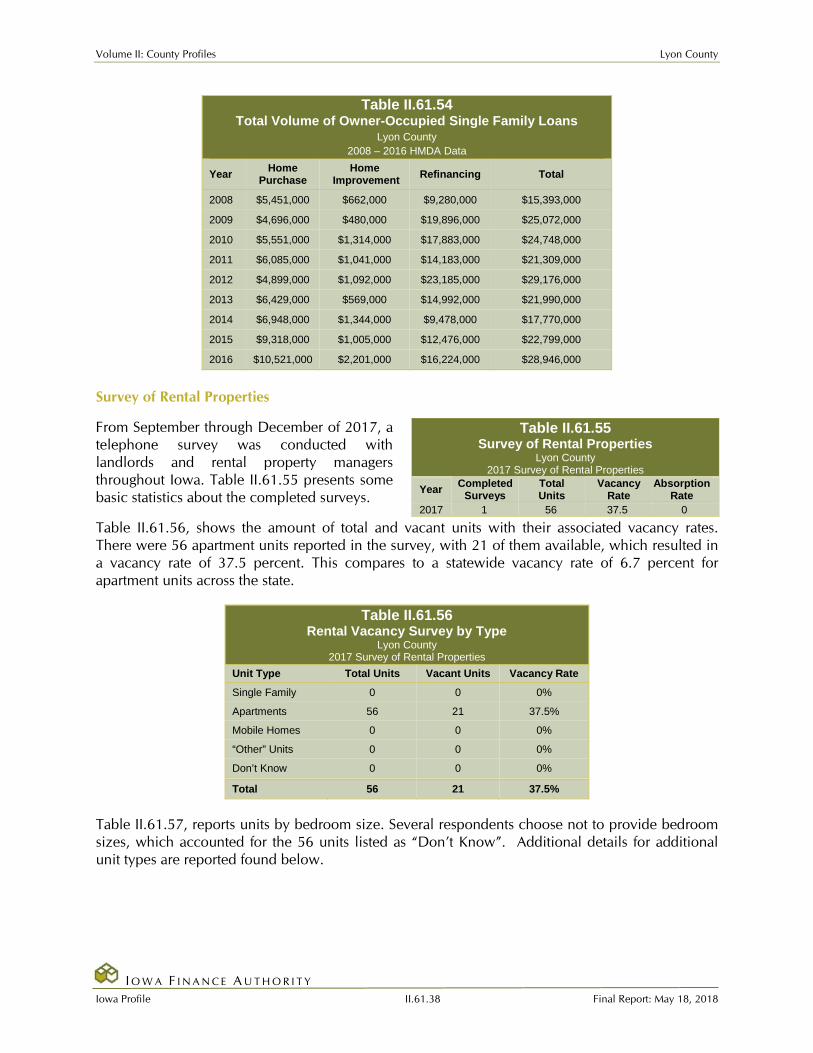
Table II.61.54, shows the total volume of owner-occupied single family loans. In 2008, average home purchase loans was $4,899,000 in 2012 and $10,521,000 in 2016. Overall, average loans were $15,393,000 in 2008 and $28,946,000 in 2016.
Volume II: County Profiles Lyon County
I O W A F I N A N C E A U T H O R I T Y Iowa Profile II.61.38 Final Report: May 18, 2018
Table II.61.54 Total Volume of Owner-Occupied Single Family Loans
Lyon County 2008 – 2016 HMDA Data
Year Home Purchase
Home Improvement Refinancing Total
2008 $5,451,000 $662,000 $9,280,000 $15,393,000
2009 $4,696,000 $480,000 $19,896,000 $25,072,000
2010 $5,551,000 $1,314,000 $17,883,000 $24,748,000
2011 $6,085,000 $1,041,000 $14,183,000 $21,309,000
2012 $4,899,000 $1,092,000 $23,185,000 $29,176,000
2013 $6,429,000 $569,000 $14,992,000 $21,990,000
2014 $6,948,000 $1,344,000 $9,478,000 $17,770,000
2015 $9,318,000 $1,005,000 $12,476,000 $22,799,000
2016 $10,521,000 $2,201,000 $16,224,000 $28,946,000
Survey of Rental Properties
From September through December of 2017, a telephone survey was conducted with landlords and rental property managers throughout Iowa. Table II.61.55 presents some basic statistics about the completed surveys.
Table II.61.56, shows the amount of total and vacant units with their associated vacancy rates. There were 56 apartment units reported in the survey, with 21 of them available, which resulted in a vacancy rate of 37.5 percent. This compares to a statewide vacancy rate of 6.7 percent for apartment units across the state.
Table II.61.56 Rental Vacancy Survey by Type
Lyon County 2017 Survey of Rental Properties
Unit Type Total Units Vacant Units Vacancy Rate
Single Family 0 0 0%
Apartments 56 21 37.5%
Mobile Homes 0 0 0%
“Other” Units 0 0 0%
Don’t Know 0 0 0%
Total 56 21 37.5%
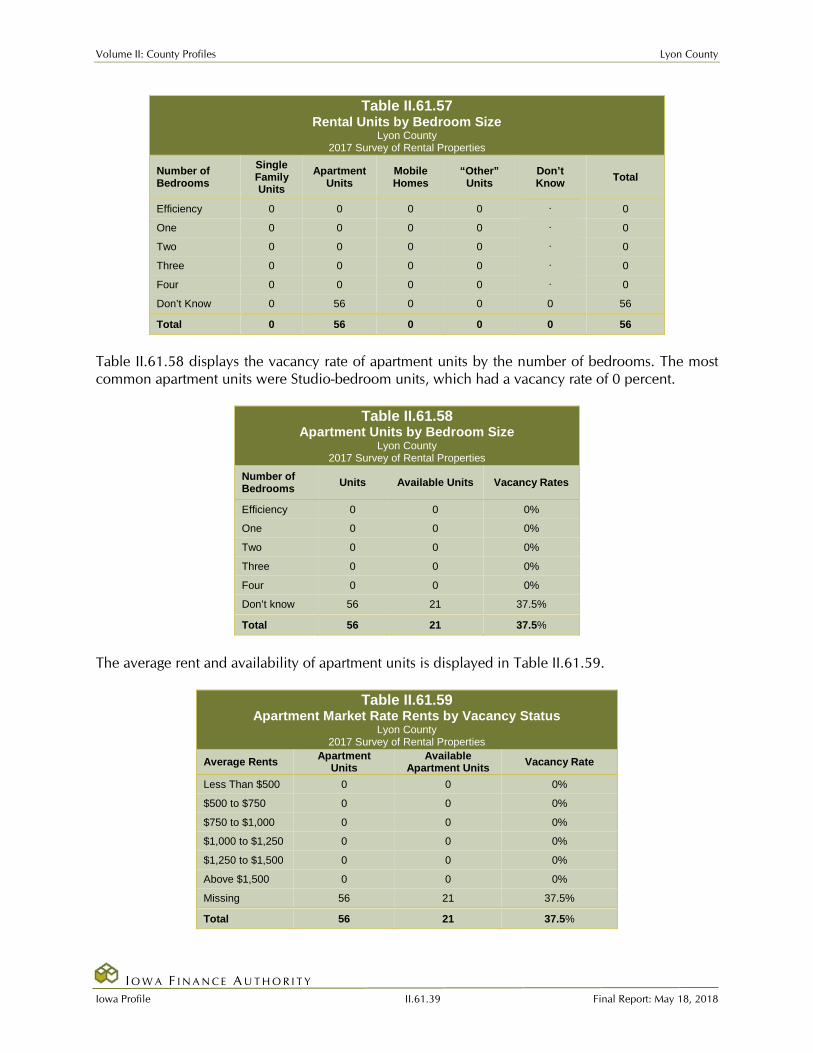
Table II.61.57, reports units by bedroom size. Several respondents choose not to provide bedroom sizes, which accounted for the 56 units listed as “Don’t Know”. Additional details for additional unit types are reported found below.
Table II.61.55 Survey of Rental Properties
Lyon County 2017 Survey of Rental Properties
Year Completed Surveys
Total Units
Vacancy Rate
Absorption Rate
2017 1 56 37.5 0
Volume II: County Profiles Lyon County
I O W A F I N A N C E A U T H O R I T Y Iowa Profile II.61.39 Final Report: May 18, 2018
Table II.61.57 Rental Units by Bedroom Size
Lyon County 2017 Survey of Rental Properties
Number of Bedrooms
Single Family Units
Apartment Units
Mobile Homes
“Other” Units
Don’t Know Total
Efficiency 0 0 0 0 . 0 One 0 0 0 0 . 0 Two 0 0 0 0 . 0 Three 0 0 0 0 . 0 Four 0 0 0 0 . 0 Don’t Know 0 56 0 0 0 56 Total 0 56 0 0 0 56
Table II.61.58 displays the vacancy rate of apartment units by the number of bedrooms. The most common apartment units were Studio-bedroom units, which had a vacancy rate of 0 percent.
Table II.61.58
Apartment Units by Bedroom Size Lyon County
2017 Survey of Rental Properties Number of Bedrooms Units Available Units Vacancy Rates
Efficiency 0 0 0% One 0 0 0% Two 0 0 0% Three 0 0 0% Four 0 0 0% Don’t know 56 21 37.5% Total 56 21 37.5%
The average rent and availability of apartment units is displayed in Table II.61.59.
Table II.61.59 Apartment Market Rate Rents by Vacancy Status
Lyon County 2017 Survey of Rental Properties
Average Rents Apartment Units
Available Apartment Units Vacancy Rate
Less Than $500 0 0 0% $500 to $750 0 0 0% $750 to $1,000 0 0 0% $1,000 to $1,250 0 0 0% $1,250 to $1,500 0 0 0% Above $1,500 0 0 0% Missing 56 21 37.5% Total 56 21 37.5%

Volume II: County Profiles Lyon County
I O W A F I N A N C E A U T H O R I T Y Iowa Profile II.61.40 Final Report: May 18, 2018
Respondents were asked if utilities are included in the rent and as shown in Table II.61.60 below 1 respondents, or 100 percent, included some sort of utility in the rent.
Table II.61.60 Are there any utilities included with
the rent? Lyon County
2017 Survey of Rental Properties Period Respondent
Yes 1
No 0
% Offering Utilities 100%
The type of utility included in the rent is shown in Table II.61.61. There were 1 respondent who included electricity, 0 respondents who included natural gas, 1 respondent who included water and sewer and 1 respondent included trash collection in the rent.
Table II.61.61 Which utilities are included with the rent?
Lyon County 2017 Survey of Rental Properties
Type of Utility Provided Respondent
Electricity 1
Natural Gas 0
Water/Sewer 1
Trash Collection 1
Accessible Rental Properties The survey also asked respondents if any of their units were accessible to persons with disabilities. As can be seen in, Table II.61.62, there were 6 accessible apartment units. Respondents also indicated there were a total of 0 persons with disabilities currently residing in accessible units.
Table II.61.62 Accessible Units by Bedroom Size
Lyon County 2017 Survey of Rental Properties
Number of Bedrooms
Single Family Units
Apartment Units
Mobile Homes
“Other” Units
Don’t Know Total
Efficiency 0 0 0 0 0 One 0 0 0 0 0 Two 0 0 0 0 0 Three 0 0 0 0 0 Four 0 0 0 0 0 Don’t Know 0 6 0 0 0 6 Total 0 6 0 0 0 6

Volume II: County Profiles Lyon County
I O W A F I N A N C E A U T H O R I T Y Iowa Profile II.61.41 Final Report: May 18, 2018
Table II.61.63, shows the breakdown of accessible and not accessible apartment units by bedroom size. Overall, 10.7 percent of all apartment units were considered accessible by survey respondents.
Table II.61.63 Apartment Units by Accessibility and Bedroom Size
Lyon County 2017 Survey of Rental Properties
Number of Bedrooms
Not Accessible
Accessible Units
Apartment Units
Percentage Accessible
Studio 0 0 0 0% One 0 0 0 0% Two 0 0 0 0% Three 0 0 0 0% Four 0 0 0 0% Don’t know 50 6 56 10.7%
Total 50 6 56 10.7%
Perceived Need for Rental Units
Table II.61.64, at right, shows the number of survey respondents who keep a waiting list. As can be seen 1 respondent said they keep a waitlist, with an estimated 0 number of persons on the wait list. The 2017 Housing Needs Forecast reports housing demand projections from 2017 to 2050. Three possible economic futures portraying moderate, strong, and very strong growth were used to create three forecasts. The strong scenario is the base case, representing conditions as of today. The moderate growth scenario forecast projects household growth with the assumption of slower population and employment growth, where the very strong growth scenario incorporates assumptions of much stronger employment and population growth over the forecast horizon. The primary objective of offering three alternative forecasts is to enhance planning capacity and to provide additional tools in order to assist state and local governments in their ongoing housing needs assessment, thereby facilitating informed discussion about housing demand at the local community level. These forecasts prove useful when interpreting the need for new or rehabilitated housing and whether single-family or rental housing activities might be best undertaken. All three forecasts span the period of 2016 through 2050 and offer predictions of the demand for housing. However, only the strong growth scenario is reported here. The moderate and very strong scenarios are reported in the appendix.
This report uses the modified population projections based on projections released from Woods & Poole Economic, Inc (W&P). Income categories were calculated using the Housing and Urban Development CHAS (Comprehensive Housing Affordability Strategy) data and are expressed as a percentage of area
Table II.61.64 Do you keep a waiting list?
Lyon County 2017 Survey of Rental Properties
Period Respondent
Yes 1
No 0
Waitlist Size 0
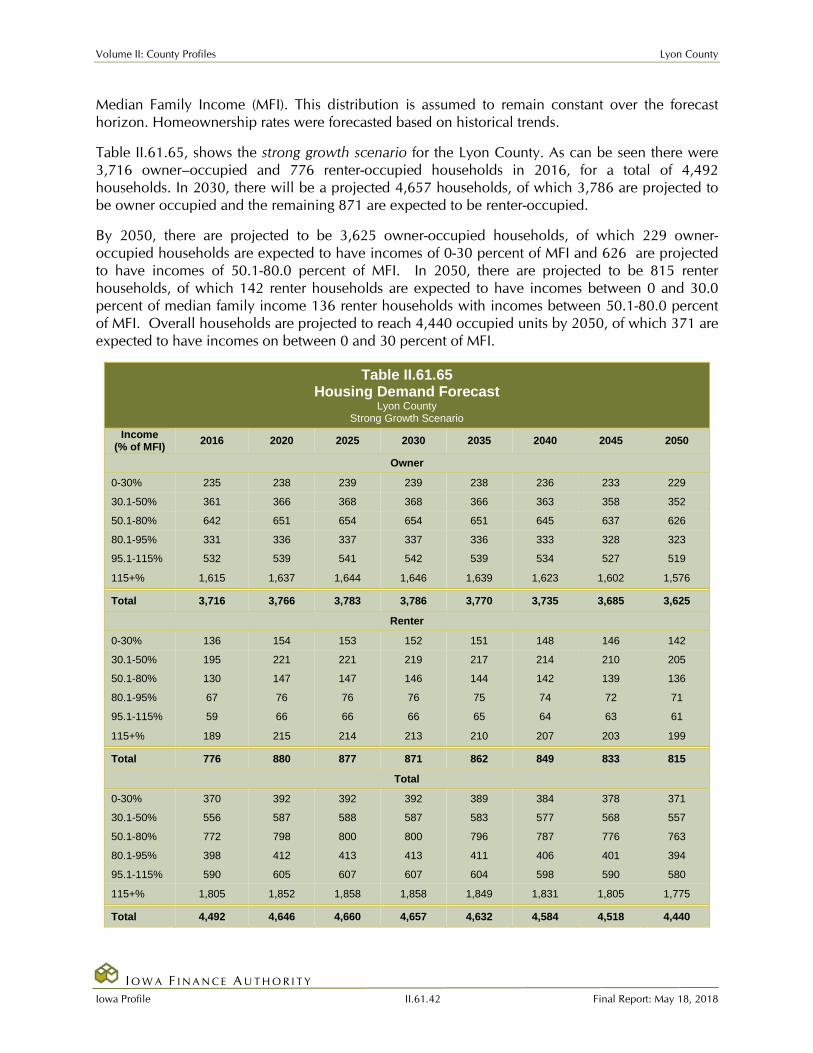
Volume II: County Profiles Lyon County
I O W A F I N A N C E A U T H O R I T Y Iowa Profile II.61.42 Final Report: May 18, 2018
Median Family Income (MFI). This distribution is assumed to remain constant over the forecast horizon. Homeownership rates were forecasted based on historical trends.
Table II.61.65, shows the strong growth scenario for the Lyon County. As can be seen there were 3,716 owner–occupied and 776 renter-occupied households in 2016, for a total of 4,492 households. In 2030, there will be a projected 4,657 households, of which 3,786 are projected to be owner occupied and the remaining 871 are expected to be renter-occupied.
By 2050, there are projected to be 3,625 owner-occupied households, of which 229 owner-occupied households are expected to have incomes of 0-30 percent of MFI and 626 are projected to have incomes of 50.1-80.0 percent of MFI. In 2050, there are projected to be 815 renter households, of which 142 renter households are expected to have incomes between 0 and 30.0 percent of median family income 136 renter households with incomes between 50.1-80.0 percent of MFI. Overall households are projected to reach 4,440 occupied units by 2050, of which 371 are expected to have incomes on between 0 and 30 percent of MFI.
Table II.61.65 Housing Demand Forecast
Lyon County Strong Growth Scenario
Income (% of MFI) 2016 2020 2025 2030 2035 2040 2045 2050
Owner
0-30% 235 238 239 239 238 236 233 229
30.1-50% 361 366 368 368 366 363 358 352
50.1-80% 642 651 654 654 651 645 637 626
80.1-95% 331 336 337 337 336 333 328 323
95.1-115% 532 539 541 542 539 534 527 519
115+% 1,615 1,637 1,644 1,646 1,639 1,623 1,602 1,576
Total 3,716 3,766 3,783 3,786 3,770 3,735 3,685 3,625
Renter
0-30% 136 154 153 152 151 148 146 142
30.1-50% 195 221 221 219 217 214 210 205
50.1-80% 130 147 147 146 144 142 139 136
80.1-95% 67 76 76 76 75 74 72 71
95.1-115% 59 66 66 66 65 64 63 61
115+% 189 215 214 213 210 207 203 199
Total 776 880 877 871 862 849 833 815
Total
0-30% 370 392 392 392 389 384 378 371
30.1-50% 556 587 588 587 583 577 568 557
50.1-80% 772 798 800 800 796 787 776 763
80.1-95% 398 412 413 413 411 406 401 394
95.1-115% 590 605 607 607 604 598 590 580
115+% 1,805 1,852 1,858 1,858 1,849 1,831 1,805 1,775
Total 4,492 4,646 4,660 4,657 4,632 4,584 4,518 4,440

Volume II: County Profiles Lyon County
I O W A F I N A N C E A U T H O R I T Y Iowa Profile II.61.43 Final Report: May 18, 2018
Related Documents