Visualizing Wildlife Conservation and Development in Southern Africa: A Multi-Optic Approach By Andrew John Lyons A dissertation submitted in partial satisfaction of the requirements for the degree of Doctor of Philosophy in Environmental Science, Policy and Management in the Graduate Division of the University of California, Berkeley Committee in charge: Professor Wayne Getz, Chair Professor Louise Fortmann Professor Isha Ray Fall 2012

Welcome message from author
This document is posted to help you gain knowledge. Please leave a comment to let me know what you think about it! Share it to your friends and learn new things together.
Transcript
Visualizing Wildlife Conservation and Development in Southern Africa: A Multi-Optic Approach
By
Andrew John Lyons
A dissertation submitted in partial satisfaction of the
requirements for the degree of
Doctor of Philosophy
in
Environmental Science, Policy and Management
in the
Graduate Division
of the
University of California, Berkeley
Committee in charge:
Professor Wayne Getz, Chair
Professor Louise Fortmann
Professor Isha Ray
Fall 2012
Visualizing Wildlife Conservation and Development in Southern Africa: A Multi-Optic Approach
© 2012
By Andrew John Lyons
1
Abstract
Visualizing Wildlife Conservation and Development in Southern Africa:
A Multi-Optic Approach
by
Andrew Lyons
Doctor of Philosophy in Environmental Science Policy and Management
University of California, Berkeley
Professor Wayne Getz, Chair
The relationships between people and natural environments in coupled socio-ecological systems (SES) are complex. As complex adaptive systems with humans as one of the central drivers, coupled SES exhibit non-linear behavior, multiple stable-states, path dependence, and highly dynamic webs of connectivity across domains and scales. It should come as no surprise therefore that efforts to push these relationships towards greater sustainability are challenging to design and execute, particularly in resource constrained contexts with multiple competing actors. In this dissertation I examine conservation efforts in Zambia and Namibia from perspectives that vary along two gradients. Theoretically, my analyses are based upon epistemologies ranging from highly qualitative, interpretative and relational explanations of project outcomes, to highly quantitative models of spatially structured processes. Empirically, I draw upon ethnographic methods that seek to develop a grounds-eye view of reality, to satellite-sensed data which capture large scale patterns at the expense of context and detail. These two poles are bridged by an information framework that employs the meta-language of vision to describe and bound different forms of understanding, with an emphasis on rich articulations of context to enable dialogue across knowledges. Part I of the dissertation engages a long-standing debate about community-based natural resource management (CBNRM), which together with protected areas has been one the core conservation strategies across countries in southern Africa. Since the advent of CBNRM in the mid-1980s, scholars and practitioners have sought to explain the uneven performance of CBNRM programs. Most CBNRM assessments examine the underlying principles of community-based conservation, the local social and ecological contexts, and connections with larger political and historical patterns. I argue that analysis of the potential and pitfalls of CBNRM also requires an understanding of the institutional history and internal dynamics of projects that implement CBNRM reforms. Drawing upon theory and methods from development ethnography and public policy, I examine the rise and fall of CONASA, a second-generation CBNRM project in Zambia that operated in the early 2000s. CONASA was constituted from a merger of organizations and discourses to create continuity with previous projects. Its ambitious suite of activities included support for household livelihoods, community-based resource management, policy analysis,
2
advocacy, and conservation enterprises at local, national, and transboundary levels. While individual activities were largely successful, CONASA's hybrid origins and logframe-centric management created fissures between its holistic design and daily operations, and hindered its ability to develop a broader narrative and maintain key alliances. This study illustrates the importance of understanding the interplay between project design and operational context in order to fully appreciate the possibilities and limitations of project-mode conservation. While a ground's eye view highlights context and nuances of process, the bird's eye view reveals pattern and emergent behavior across scales. In Part II, I present a new spatial modeling method for location data from orbiting satellites to analyze the spatiotemporal patterns in movement data. Advances in GPS technology have created both opportunities in ecology as well as a need for analytical tools that can deal with the growing volume of data and ancillary variables associated with each location. Time Local Convex Hull (T-LoCoH), is a home range construction algorithm that incorporates time into the construction and aggregation of local kernels. Time is integrated with Euclidean space using an adaptive scaling of the individual's characteristic velocity, enabling the construction of utilization distributions that capture temporal partitions of space as well as contours that differentiate internal space based on movement phase and time-use metrics. I test T-LoCoH against a simulated dataset and provide illustrative examples from a GPS dataset from springbok in Namibia. The incorporation of time into home range construction expands the concept of utilization distributions beyond the traditional density gradient to spatial models of movement and time, opening the door to new applications in movement ecology. Hulls also provide a means for characterization of the interactions between individuals, which are central to many aspects of population biology, including competition, predation, reproduction, resource optimization, and disease transmission. Classic measures of association are based on the intersection of static home range estimates and counts of matched locations, but the advances in GPS technology have created new possibilities for characterizing dynamic spatiotemporal properties of association. Hull metrics of association for both spatially and temporally overlapping hulls reveal the intensity of interaction both in raw terms as well as corrected for revisitation, as well as time lags. Similarly, a metric for the proportion of enclosed points constructed from the combined set of locations reveal the distribution of sharing across space and time for the entire time period. Illustrative examples of the methodology are provided using elephant tracking data from Tembe Elephant Park in South Africa. Plotting association metrics on a map, over time, and against other hull properties reveal novel patterns that can be basis for further study. Local hulls offer a promising approach for characterizing the spatiotemporal properties of association and exploring their covariates. Parts I and II of the dissertation both illustrate ways to pull out and characterize pattern in complex systems, but at scales and methods appropriate for the data and question. The challenge in seeing the 'whole picture' of complex coupled SES is not only to draw upon multiple disciplines and perspectives, but to do so in ways that enable dialog. Central to bridging nodes of knowledge is aggregation of detail into accessible and meaningful abstractions, embedding contextual information to inform new connections and enable extensions into new systems and domains, and making visible the spatial and social vantage points through which knowledge is produced and disseminated.

i
Dedicated to my parents, James and Helen Lyons,
who instilled in me a lifelong curiosity about how things work.
ii
Table of Contents
Acknowledgements......................................................................................................................... v
Chapter 1. Optical Epistemology: Towards A Knowledge Framework for the Science of Coupled Social-Ecological Systems ............................................................................................... 1
Introduction................................................................................................................................. 1 Complex Adaptive Systems........................................................................................................ 3 Epistemological Foundations...................................................................................................... 4 Consumption of Knowledge ....................................................................................................... 6 Optical Epistemology.................................................................................................................. 7 A Social Agenda ......................................................................................................................... 8 Towards a Set of Knowledge Principles for Coupled SES Science ........................................... 8 Structure of the Dissertation ....................................................................................................... 9 References................................................................................................................................. 10
Chapter 2. Analytical Approaches in Community Based Natural Resource Management and the Need for Project Perspectives ....................................................................................................... 13
Introduction............................................................................................................................... 13 Background............................................................................................................................... 14
The Emergence of CBNRM.................................................................................................. 14 Critiques of CBNRM ................................................................................................................ 16
Outcomes .............................................................................................................................. 17 Design of CBNRM Interventions ......................................................................................... 20 Local Context........................................................................................................................ 22 Influences of External Actors and Global Geopolitics ......................................................... 24 Data, Representation, and Science........................................................................................ 26 Scale...................................................................................................................................... 27 Sustainability......................................................................................................................... 28
Project Perspectives .................................................................................................................. 30 Project Contradictions in CBNRM Literature ...................................................................... 31 Development Ethnography ................................................................................................... 33 Managerialism....................................................................................................................... 36 Logical Framework Analysis................................................................................................ 40
Summary ................................................................................................................................... 43 References................................................................................................................................. 43
Chapter 3. The Rise and Fall of a Second Generation CBNRM Project in Zambia: Insights from a Project Perspective ..................................................................................................................... 54
Introduction............................................................................................................................... 54 Methods..................................................................................................................................... 55 Development of CBNRM in Zambia........................................................................................ 56
Early CBNRM ...................................................................................................................... 56 Governance and Food Security Rise on the CBNRM Agenda ............................................. 57 TBNRM ................................................................................................................................ 57 Managerialism Comes to USAID/Zambia............................................................................ 58
iii
A Project is Born....................................................................................................................... 59 The RFA................................................................................................................................ 59 The Proposal ......................................................................................................................... 60 Managerialism in CONASA................................................................................................. 63 Tensions between programmatic and operational logics ...................................................... 65 Developing the Project Narrative.......................................................................................... 66
Discussion................................................................................................................................. 68 Are Two Discourses Better than One? The Search for Synergy in CBNRM....................... 68 Between the Office and the Village: The Construction and Mediation of Neoliberal Conservation ......................................................................................................................... 69
Conclusion ................................................................................................................................ 70 References................................................................................................................................. 70
Chapter 4. Home Range Plus: A Space-Time Characterization of Movement Over Real Landscapes.................................................................................................................................... 75
Introduction............................................................................................................................... 75 Methods..................................................................................................................................... 76
Time-Scaled Distance ........................................................................................................... 77 Movement Phase Metrics...................................................................................................... 78 Time-Use Metrics ................................................................................................................. 78 Isopleths ................................................................................................................................ 79 Simulated Data...................................................................................................................... 80 Springbok Data ..................................................................................................................... 80 Implementation ..................................................................................................................... 81 Parameter Selection .............................................................................................................. 83
Results....................................................................................................................................... 86 Simulated Data...................................................................................................................... 86 Springbok Data ..................................................................................................................... 90
Discussion................................................................................................................................. 94 References................................................................................................................................. 95
Chapter 5. Spatiotemporal Association Analysis with Local Hulls............................................. 99 Introduction............................................................................................................................... 99 Methods and Results ............................................................................................................... 101
Tembe Elephant Data.......................................................................................................... 101 Pre-Processing..................................................................................................................... 102 Independent Hull Creation.................................................................................................. 106 Association Metrics ............................................................................................................ 110 Spatially Overlapping Hulls................................................................................................ 113 Combined hull creation....................................................................................................... 115
Discussion............................................................................................................................... 121 References............................................................................................................................... 122
Chapter 6 Conclusion: Towards an Integration of Vision ......................................................... 124 Introduction............................................................................................................................. 124 From Framework to Assessment: Standards of Good Knowledge......................................... 125
Objectivity........................................................................................................................... 125

iv
Context................................................................................................................................ 125 Project Dynamics in CBNRM ................................................................................................ 125 Modeling Space-Use from Decontextualized Data................................................................. 126 Conclusion .............................................................................................................................. 128 References............................................................................................................................... 128
v
Acknowledgements My research and academic studies at the University of California, Berkeley were funded by a Foreign Language and Area Studies Fellowship, Mary Thompson Rocca Scholarship from the UC Berkeley Center for African Studies, Schwabacher Memorial Fellowship, Fulbright-Hays grant, NIH Grant GM83863, BSF Grant 2008255, the Rosalinde and Arthur Gilbert Foundation, and the Berkeley Initiative in Global Change Biology with funding from UC Berkeley's Office of the Vice Chancellor for Research. I am deeply grateful to countless persons who supported my research and graduate training at UC Berkeley, beginning with my advisor Wayne Getz and the members of my graduate committees: Louise Fortmann, Isha Ray, Maggi Kelly, and Peng Gong. I have benefited from the incredibly bright and generous graduate students in the Getz lab, with particular thanks to Wendy Turner, George Wittemyer, Chris Wilmers, Scott Fortmann-Roe, Karen Weinbaum, Steve Bellan, Sadie Ryan, and James Lloyd-Smith. I am also grateful to the many dedicated Berkeley faculty with whom I have learned from and been mentored by over the years, including Elizabeth Colson, Sam Mchombo, Patina Mendez, and Gordon Frankie. Many thanks also to the friends and colleagues who graciously reviewed and made comments on drafts of my dissertation chapters, including Kurt Spreyer and Teddy Hodges. My PhD research builds upon earlier work in Zambia that was guided and facilitated by Susan Jacobson at the University of Florida, who was an awesome master's advisor. My collaborators in Zambia and the others who made this research possible are far too numerous to mention. This work would never have come to fruition without the material and social support of Gladys Chipanta, Violet Phiri, Tamara Banda, Clara Banda, and Rachel Banda- twatôtela sana! I am deeply grateful to the entire staffs of Wildlife Conservation Society and CARE for their kindness, energy, and steadfast dedication to conservation and human welfare. For more than a decade I have been inspired by and grateful to Dale Lewis and Julia Nagata for their long-term commitment to the people and places they work with, constant innovation, and gracious hospitality. I am immensely grateful to Mwape Sichilongo and Biston Mbewe who generously shared their extensive experiences and insights with CBNRM, and Frank van Dixhoorn who graciously supported me with office space when other plans fell through. I would also like to thank Chris Annear, Andy De Roche, Patricia Mupeta, and Brian Child for their assistance and words of wisdom as fellow researchers over the years. Last but not least, I am deeply indebted to Augustine Mulolwa, Mishek Phiri, Alick Mwanza, Imasiku Nyambe, and administrative staff in the School of Mines at the University of Zambia who provided institutional support during my fieldwork. Finally, thanks and apologies go to Zilose Lyons for her patience and endurance as a graduate student spouse.
1
CHAPTER 1.
OPTICAL EPISTEMOLOGY: TOWARDS A KNOWLEDGE FRAMEWORK FOR THE SCIENCE OF COUPLED SOCIAL-ECOLOGICAL SYSTEMS
Introduction
At its essence, this dissertation is about vision. More specifically, it is about the different forms of vision that have been, or could be, used to understand coupled social-ecological systems (SES), interpret the past, manage the present, and forecast the future. In this chapter, I present a knowledge framework that uses vision as a meta-language as a broader framework within which the knowledges presented in this dissertation can be placed. The study systems examined in this dissertation are the people and animals that live in and around protected areas in southern Africa, however a vision-based knowledge framework for the study of coupled SES is useful more broadly.
Developing a systematic set of ideas to review how we know what we know about coupled SES is a worthy pursuit for several reasons. We've inherited the planet at a time of great change in which the biosphere itself can be considered a coupled SES. Environmental change has been so significant and widespread that many scientists feel it warrants defining a new geological epoch, the Anthropocene (Crutzen 2002). The defining characteristics of this era are the significant levels of human interaction with and modification of the Earth's ecosystems and climate. The combined and cumulative effects of technology, energy production, urbanization, population growth, consumption, and increasingly intensive resource extraction practices have modified the climate itself and stand to tip the biosphere into a new state (Barnosky et al. 2012). If indeed there ever were isolated “natural” ecosystems in earlier periods of human history, the decoupled ecosystem is now certainly a thing of the past.
However if coupled SES are now the norm, they have certainly not become easier to define and delineate. The characteristics of coupled SES render them not only difficult to understand, but in many significant ways fundamentally unknowable. Unknowable in part because as complex adaptive systems, the complexity of biophysical processes in SES themselves generate nonlinearities and multiple nodes of equilibria that render “neat” characterizations of form and process problematic, and greatly diminish the accuracy and time horizons of forecasts and predictions. In lieu of fine-scaled characterizations, we often have to settle for general paradigms and scale-specific descriptions at coarse resolutions.
If biophysical complexity isn't enough of a challenge, the simultaneous role of people as both actors and knowledge producers muddy the waters of knowing even further. The role of people as significant drivers in coupled SES not only introduces a highly complex actor to the picture, but also complicates the process of knowing. When we look closer at what we think we know about a particular SES, such as the scope of knowledge (what is included and excluded from the question), choice of scale, standards of proof, level of abstraction, and interpretation of data, it becomes readily apparent that the production of knowledge is rarely simple, and always contingent on the actors in the system. With so many dimensions of knowledge about systems that are fundamentally complex biophysically, we may have little choice but to accept plurality as one of the fundamental characteristics of these systems, knowledges instead of Knowledge.
2
The ubiquity of coupled SES establishes their significance as objects of enquiry, and their intrinsic blurriness makes them prime material for an exploration of epistemological frames of reference. In the rest of this chapter, I sketch a knowledge framework for studying and understanding SES. I select the term knowledge framework rather than epistemology because my goal is to integrate a range of issues both theoretical and utilitarian, concerning both the production of knowledge and its consumption. The framework has three pieces. I begin with a description of the beast we are trying to understand – the characteristics of coupled SES, and what this means in terms of what we can know and should try to know. Secondly, I briefly review selected epistemological concepts about the process of knowing and summarize research on the consumption of information. Lastly, I present a normative set of principles about how science should be conducted on SES in an age of environmental collapse.
This knowledge framework, as with all epistemologies, rests on a set of social values, whether explicit or hidden. Much as feminist scholars of science in the 1980s and 1990s grounded their critiques of the epistemology of big-S Science by laying bare a set of values about equity and responsibility that were rooted in the social concerns of the day (Haraway 1988; Harding 1986), I begin my discussion by articulating a social agenda rooted in the pressing social issues of today – the ongoing collapse of the biosphere. I argue that just as the practice of big-S science in the 1950s and 1960s served to produce and reproduce relations of subjugation for women and historically disempowered groups, thus warranting a rethinking of the bounds and process of science, so too does the current environmental collapse imperil the rights and wellbeing of other species and future generations. Hence we too should reflect upon how the practice of environmental science is embedded in this larger disaster.
In developing a knowledge framework for the study of SES, I draw upon several bodies of work. I draw heavily upon science and technology studies, political ecology, and feminist scholars of science, all of whom examine from different angles the production of knowledge as a social practice, including the roles of actors and networks, claims and notions of objectivity, and influence of underlying relations of power. To highlight the salient features of coupled SES, I draw upon theories of complex systems, including the implications of non-equilibrium dynamics, applications of the Heisenberg uncertainty principle, emergent properties, limits of reductionist science, and role of quantitative models. Lastly, I review a more recent body of work from the fields of business, disaster response, and intelligence, about the consumption of knowledge in complex adaptive systems, including the consequences of TMI ("too much information"), uncertainty and paralysis in human decision making, strength of weak ties, importance of bundling context, and properties of self-organizing data.
I conclude by weaving together these ideas in a set of principles for the study of SES which frames the work of science as making visible those patterns, connections, antecedents and consequences which are otherwise not visible. I argue that to be relevant for the Anthropocene and serious attention to inter-species and inter-generational equity, SES science must be not only multi-disciplinary but also multi-positional, with dialog and decision making as integral characteristics of "good" knowledge. The later requirement further demands that knowledge be situated, partial, accountable, and sufficiently contextualized in both its production and consumption. In the final chapter of this dissertation, I return to this framework and reflect upon the individual studies that comprise this dissertation.
3
Complex Adaptive Systems
Complex adaptive systems (CAS) involve many heterogeneous components that adapt or learn as they interact (Holland 2006). Compared to simpler systems, CAS have characteristics that make them far more difficult to understand or predict, including nonlinear behavior, multiple stable states of attraction, path dependence, feedback mechanisms, self-organization, and many-to-many relationships between past and future states (Bennett and McGinnis 2008; Holland 1995). Manson (2001) categorizes complex behavior into three broad divisions: 1) algorithmic complexity which deals with mathematical complexity theory and information theory, 2) deterministic complexity which is based on chaos and catastrophe theory, and 3) aggregate complexity which concerns "how individual elements work in concert to create systems with complex behavior" (Manson 2001:405).
Coupled SES are canonical examples of CAS (Walsh and McGinnis 2008; Pickett et al. 2005; Bennett and McGinnis 2008). The complex behavior and emergent properties of coupled SES are mostly the result of aggregate complexity, where interactions and feedback mechanisms between components combine to produce unexpected results. Complexity theory has been productively used to examine the co-evolution of socio-cultural norms and land use in the Greater Yellowstone ecosystem (Bennett and McGinnis 2008), self-organizing behavior in organizations (Morel and Ramanujam 1999), and cardinal principles and best practices for community based natural resource management (Berkes 2004). However there remains an ongoing debate concerning the amount of clarity complexity theory offers to social science, including questions whether the theory operates at too general a level to enhance understanding (Manson and O'Sullivan 2006) and concerns about the ontological decisions required to construct mathematical models of complex systems (O'Sullivan 2004).
Mathematic models and computer simulations remain the main approach for studying complex behavior due to their ability to quickly create numerous heterogeneous components at various degrees of abstraction, explore a variety of functional forms of inter-component relationships, embed submodels within parent models, incorporate conditional action, incorporate stochasticity, allow for adaptation, and update components in parallel (Holland 2006). As with dynamical system models more generally, prediction is typically not the name of the game. In fact using models to predict future states from initial conditions is likely to result in poor policy (Pilkey 2009). Mathematical models are better suited for characterizing the dynamics of systems, including behavior around nodes of equilibrium, tipping points, sensitivity of the system to changes in components or their relationships, and emergent properties. In short models provide a meta-language for describing the dynamics of a complex system.
If mathematics is the torch that best illuminates the dynamic properties and emergent behavior in formalized systems, ethnography may be the method of choice for understanding hidden connections in complex social systems. Similar to good modeling, good ethnography typically aims to explain and represent rather than predict, explore unknown connections between components, and look for self-organizing behavior and sensitivity to initial conditions (Agar 2004). Bridging the highly qualitative and highly quantitative ends of the spectrum are methods that combine participatory action research with agent based computer simulations with complex systems theory as the overarching analytical framework (Lynam et al. 2003).
4
Much more can be said about the implications of viewing coupled SES through the lens of complexity (see for example Lansing 2003; Manson and O'Sullivan 2006), but three aspects stand out for the purposes of a knowledge framework for SES. Firstly, complex behavior arises from the dynamic interactions between components; thus the science of SES should prioritize the science of relationships. In many cases this will also requires multi-disciplinary science, as the interacting components could be as diverse as trees and traditional healers. Second, complexity theory contains a lot of conceptual apparati useful for thinking about the dynamics of coupled SES. The ideas of nodes of dynamic equilibrium, tipping points, and self-organizing behavior, for example, although cartoonish can help develop theories and hypotheses how people and environments interact. Of particular import is the recognition that coupled SES can exist far away from equilibrium states for some time before rapidly and often dramatically switching to an alternate steady state which may be less desirable (Barnosky et al. 2012; Bennett and McGinnis 2008). Finally, while subcomponents may be amenable to predictive models, the dynamics of coupled SES can not be explained by deterministic representations of process (Bennett and McGinnis 2008). Quantitative scientists should therefore abandon all hope of creating an über model that will predict the future, and rather use models as a lens to produce partial and situated knowledges in conversation with other lenses.
Epistemological Foundations
Entire branches of scholarship have formed around the need to better understand the ways in which science, discourse, worldviews, and social relations intersect and shape how people describe, think about, and manage the environment. Science technology studies (STS), political ecology, and feminist studies of science are three families of work that have examined the epistemological underpinnings of science.
STS examines the properties of scientific knowledge by seeing science not simply a set of principles and standards but as first and foremost a social practice. Latour (1988) analyzes the scientific process of establishing 'truth' as beginning with a unevaluated conjecture. To become truth, a conjecture must accumulate allies, with 'allies' defined in a very broad sense including the objects of investigation themselves when they 'behave' in ways consistent with the conjecture in question. This rendition may appear to be little more than a post-modern articulation of repeatable experimentation, but the metaphor gets legs when the other types of allies enter the picture – fellow scientists and gatekeepers within the scientific profession (e.g., funders, editors, hiring committees). For a conjecture to eventually reach the status of truth, it must be picked up and repeated by other scientists who operate in mostly closed social networks with nodes of varying influence. Once a conjecture—or piece of equipment—has attracted enough allies and been repeated enough, it becomes 'truth' and may eventually attain the coveted status of 'black box' whereby the messy details and debates become hidden away from view (Latour 1988; Latour 1996). The take home messages from this view of science are 1) the recognition that the production of scientific knowledge is socially embedded and 2) truth claims require a combination of "observation allies" (i.e., repeatable experiments in accordance with the scientific method) and "people allies".
These same presuppositions are central for feminist studies of science and political ecology, both of which are attentive to the ways in which power operates in networks of professional science, and conversely how science reproduces relations of power in the broader
5
society. A classic case study by Fairhead and Leach (1996) illustrates these linkages in both directions. Colonial powers in Guinea had long assumed that the islands of forest in the forest savannah matrix were the last remnants of a large intact humid forest. This view was derived from an assumption (i.e., knowledge) that indigenous Guineans were inherently environmental spoilers, a notion that fell within a broader set of knowledges about the White Man's superiority underpinning the colonial project (see also Manspeizer 2004). Fairhead and Leach document how this and other racist notions taken as received wisdom influenced how colonial scientists framed questioned, collected data, and drew conclusions, even though historical photos and field research conclusively establish the opposite mechanism to be in operation—locals were actually growing forest islands around village nuclei. This is a case where the power of the colonial project manifested itself not through overt mechanisms of scientific control, but through the thin veil of discourse that was invisible to those who operated within it. Numerous other studies from colonial and non-colonial settings have illustrated similar patterns (Mearns and Leach 1996).
The relationship between power and the practice of science is the launch pad for much of feminist critiques of science. Through case studies ranging from the language and metaphors in biology textbooks (Martin 1991), to a cross-cultural comparison of the field of primatology (Haraway 1989), to the social construction of accuracy in nuclear missiles (Mackenzie and Biagioli 1999), these scholars document the many ways in which race, gender and class shape scientific practice and discourse, and in turn how conventional science produces unquestionable knowledge that authorizes Euro-American cultural and political practice, removes accountability, and represents alternative norms and values as the marked 'other' (Harding 1986). These and other authors summarily dismiss conventional understandings of value-free, omnipotent objectivity as mythical, the 'god-trick of seeing everything from nowhere' (Haraway 1988:581). In replacement of absolute but mythical objectivity, Haraway (1988) and Harding (1995) propose alternative forms of objectivity which are partial, situated, embodied, and responsive to the lived experiences of the subjugated. Latour (2000) proposes yet another, more generic, standard of objectivity—giving the subjects of the research, be they people or things, the opportunity to object to their representation.
The implications of these foundational epistemological works for a knowledge framework for SES begin with an acceptance that all forms of scientific knowledge are partial and socially situated. Neither the practice of science, nor the characteristics of coupled SES, permit a single comprehensive understanding. In its place we are allowed—encouraged—to have plural knowledges, representations about different parts of the proverbial elephant. Plural knowledges are not a panacea however if our ultimate objective is actionability. How does one reconcile and make sense of multiple accounts of multiple components of a common complex system? This is the challenge of SES science. As Gupta and Ferguson (1997:39) put it:
We see the political task is not 'sharing' [anthropological] knowledge with those who lack it, but forging links between different knowledges that are possible from different locations and tracing lines of possible alliance and common purpose between them.
Mosse (2005) echoes these sentiments when he writes, "Good ethnography allows the simultaneous existence of different forms of knowledge, and try to create bridges between them".
6
Consumption of Knowledge
For knowledge of SES to meet the requirements of 'good' science, I have argued it must also be actionable, or at least have the potential to lead to action that serves the wellbeing of the voiceless. Actionable doesn't necessarily imply applied science, as basic science questions are often the first barriers to overcome to produce knowledge that can guide action, what has been called 'use-inspired' basic science or Pasteur's quadrant (Stokes 1997). But actionability does demand attention to the genesis of a question, and how knowledge is disseminated and consumed.
Making knowledge actionable may at first seem a trivial task in the 21st century, where digital technologies of reproduction and dissemination have created channels to share information with vast numbers of people virtually instantaneously and at little cost. Although a digital divide rooted in historical inequalities continues to temper universal access to information via the internet, claims that the internet has all but eliminated barriers to sharing and accessing information are not completely exaggerated. Land managers, scientists, and social and environmental advocates all have capacity to host and access tremendous repositories of information at little cost. And current trends suggest accessibility will only continue to improve, with the growing digitization of archival records, development of sophisticated knowledge sharing tools for citizen science initiatives (e.g., iNaturalist.org; OpenDataKit.org), and a slow but steady shift in the publication industry toward open access. Online tools have also made possible new forms of collaboration that bypass the traditional channels of interaction between scientists, giving birth to completely new models of scientific enquiry (Nielsen 2011).
Although digital technologies of information dissemination have certainly made accessibility less of a barrier for actionable knowledge, they have paradoxically produced a hurdle of a different sort – information overload. Increased information improves decision making up to a point, but more information can turn from a blessing to a curse when the quantity and quality of information surpasses human abilities to consume it. The term TMI (too much information), started out as an initialism used in electronic chat messages, but has now become mainstream and was proposed for inclusion in the Oxford English Dictionary in 2009 (Oxford English Dictionary 2012). The introduction of additional information not only provides diminishing returns to improved decision making, it can actually make things worse. Studies from psychology and business studies demonstrate that access to information exceeding the human capacity to comprehend produces worse decisions albeit with higher (but false) confidence (Slovic 1973; Heimann 2010). Large volumes of information have also been shown to increase dissatisfaction and second guessing with whatever decision is made, or paralyze the decision making process entirely out of fear of making the wrong choice (Schwartz 2004).
The challenges of grappling with ever-increasing volumes of information is at least as old as the printing press (Blair 2010), however the current moment is truly unique with an expected 35 Zettabyes of information in the digital universe by 2020 (Gantz and Reinsel 2010). Digital data poses challenges for actionability not only for its volume but also typically high levels of abstraction and reduction of context. This modern day form of disembodiment can render information unsituated, unbounded, and unaccountable, with validation and acceptance shaped as much by the network of dissemination as its process of production. The US intelligence community came head to head with these challenges in the post-911 years as floods of new data
7
overwhelmed the ability to comprehend and transformed analysts to "passive consumers of large stockpiles of data" (Heimann 2010:37). Similarly, after the 2010 earthquake in Haiti, a flood of geospatial data were generated by relief agencies to guide emergency assistance. Much of these data were generated at a distance and delivered through portals with no mechanisms for feedback and divorced from rapidly changing needs of managers on the ground. These platforms lack the promise to improve communication, as they neglect self-organization of people and data. The uniform message is not appropriate for all users, and the recipients of the message do not contribute to its creation and cannot provide feedback, despite their knowledge (Heimann 2010:38).
Similarly, technological advances in sensor technology, from GPS hardware to remote sensing to DNA sequencing, have dramatically expanded the capacity to collect ecological and biological data. Social datasets are also growing at a rapid pace. Analyzing large volumes of data typically demands the use of databases, which at times are themselves the end goal of research (Bowker 2000). However the transformation of observations into databases typically comes at the cost of data minimalization, loss of nuances in meaning, inappropriate forms of categorization, and obliteration of the social legacy of the data (Schuurman 2008). This loss of context and data dimensionality becomes problematic when reduced data objects are converted back into knowledge through quantitative analysis, or combined with other data whose dimensionality has similarly been reduced (Schuurman 2008). In short, database users need context just as badly as crisis managers.
Optical Epistemology
As the title of this dissertation suggests, I follow the footsteps of Haraway (1988) and others in suggesting that vision is possibly the most fruitful meta-language or metaphor for describing what we know about SES, and how know it. Haraway and others theorize and contextualize vision as the centerpiece of embodied objectivity, the notion that all knowledge is produced from somewhere by someone, a counter-point to the Gods eye view from nowhere (Haraway 1988:576). The everyday experience and language of vision thus bridges much of the scholarly work about what we know and how we know it.
Discipline, one of the fundamental forms of categorization of knowledge, works as "a system of rules" for the construction of knowledge reproduced through training and the institutions of professional advancement (Harriss 2002). Visually, discipline can be thought of as the tint or hue of a pair of spectacles, delineating a field a view and highlighting certain features while washing out and obscuring others. Under this metaphor, economics, soil science, and movement ecology can be thought of as different colored lenses that, much like the proverbial blind men describing an elephant, elucidate different details and processes within the same landscape. Similarly, visual metaphors can be used to differentiate the scale at which a system is known—such as at the level of a magnifying glass (micro) versus a satellite image (macro).
The meta-language of vision goes beyond the concepts of disciplinarity and scale by foregrounding not only what appears in the frame but also the relationship between the observer and the observed. The everyday experience of vision enables an appreciation of that which is known is a function of not only what is seen, but also who does the seeing and the relative positioning of the seer and the subject. When the relationship between observer and observed
8
comes into focus, the disparities in knowledge from alternative vantage points become neither unexpected nor frightening. Why would we expect an agronomist, a historian, and a landholder to reach consensus about how a savanna ecosystem operates? Scholars in feminist studies and science technology studies have pushed these ideas farthest, conceptualizing the notion of vantage point not only in spatial terms but also as positions within networks of social relations (Haraway 1988; Gupta and Ferguson 1997; Latour 1988).
A Social Agenda
If we accept that omniscient objective knowledge is a myth (Harding 1995), even for particle physics (Heisenberg 1927), and that all ways of knowing support a set of embodied interests (i.e., ideas are never 'innocent', Schmink and Wood 1987:51), then the first step in outlining a knowledge framework for coupled SES is to lay bare a set of values and interests to which we hold ourselves accountable. I assert that the current environmental disaster which is the hallmark of the Anthropocene epoch warrants an extension of the equity-centric agenda embraced by Haraway and others 25 years ago, to encompass the millions of fellow species at risk of extinction and billions of yet-to-be-born humans. Thus if the hallmark of good science is the production of "better accounts of the world" (Haraway 1988), these accounts had better take into consideration the plight of the voiceless, both current and future, human and non-human,.
The imperatives that emerge from knowing the future will be dramatically different than the past, and the recognition that actions today will have a dramatic effect for centuries to come (Barnosky et al. 2012), further demand that the standards for "better" accounts of the world consider not only the conditions under which knowledge is produced, but also how it is reproduced and consumed. In other words, if the future of the biosphere depends on hearing the canary in the coal mine, and a tree full of canaries falls in the forest but the tape recording of their screams is never published, then for all intents and purposes that matter it never fell. Good SES science must be actionable SES science, or lead to action.
Towards a Set of Knowledge Principles for Coupled SES Science
At the broadest level, knowledge produced by SES science should aim to illuminate or make visible connections or processes that are not otherwise visible. This is hardly new and basically what good science does anyway, be it social or biophysical. In some cases unmasking connection requires looking for repeatable pattern in data and using the tools of statistics and mathematics to show significant correlation, preferably coupled with experimental design to establish causal mechanisms. For other connections, including many social ones, patterns and processes may be out in the open but in need of a language or theorization to be recognizable.
A problem with expressing the goal of science as making the invisible visible emerges in the simple question, visible for whom? There are of course multiple ways to dive into this question, however the language of vision itself suggests the "for whom" conundrum is but another dimension of the partiality of knowledge. This leads to the second principle of SES science knowledge, which is the acknowledgement and proclamation of the bounds of knowledge and the relationship between the seer and the seen. A description of the vantage point from which knowledge is produced should begin with the rules and legacies of the discipline, but
9
continue to express the spatial, temporal and social context from which the question was defined, refined, and investigated.
SES science should produce objective knowledge, with a usable standard of objectivity being Latour's notion of maximizing the capacity of the subjects to object (Latour 2000). This can be assessed in terms of repeatability of the research, triangulation through multiple lines of evidence or analyses, and in social research vetting results in fora where the subjects have the opportunity to validate or refute interpretations. Harding's (1995) development of the notion of strong objectivity articulates additional dimensions of objectivity as partial, socially situated, and cognizant of the power relations through which knowledge is produced.
The requirement for actionability in turn demands several characteristics of the production and dissemination of knowledge. Trivial science is not actionable; questions should be shaped by knowledge needs rather than methods looking for problems. Actionability also involves advancing conversations, enabling connections across different knowledges, and extending knowledges to new domains and problems. These require that context be bundled with knowledge – the context of how the knowledge was produced and disseminated including technological mediations and transformations into and out of databases. Actionability is also enhanced when knowledge can be reconfigured and re-organized with other knowledges and users.
Structure of the Dissertation
This dissertation is structured in two parts clustered around two very different but complementary ways to produce knowledge about coupled SES in southern Africa. Part I (Chapters 2 and 3) focuses on the practice of community based conservation in Zambia through the unconventional approach of taking as the unit of analysis a conservation project rather than local communities, wildlife, or an ecosystem. Through analysis of the historical context in which a CBNRM project came into being, the institutional context within which it was embedded, and the organizational context in which individual staff members operated, this study reveals how challenges for implementation were created even before the first Land Rover rolled into the project site, and how staff and managers responded to those challenges over time. This ethnographic work is high qualitative and develops context as not backdrop but the main explanatory variable which contributed to the trajectory and outcome of the project. This story could not be transmitted without its context, because indeed the context is the story. What is generalizeable from this research is not the specific conclusions or factors that contributed to CONASA's rise and fall, but the stream of questions explored, the hypotheses and connections investigated, and the fleshed out details of how context contributes to outcomes.
Part II takes a very different approach, starting with data from a moving object that has been stripped of nearly all context save for time and location. The specific data investigated are locations of springbok antelope collected by GPS collars, but the method presented is generic to any type of movement data. The T-LoCoH algorithm constructs a little polygon or hull around each point in the dataset by connecting the dots of its nearest neighbors, then uses these hulls for a variety of analytical purposes including the construction of home range maps showing where the individual was found most often, classification of points into a discrete behavior categories, emergent patterns of time use and revisitation, and measures of association between individuals.
10
The method attempts to squeeze information from a dataset that is basically devoid of contextual information that would have been nice to know, such as what the animal was sensing at each point, what it was thinking, and with whom or what it was interacting. We unfortunately are not privy to those variables, however the data collection technology provides have a lot of data in which to search for pattern. In lieu of context, we use mathematical models to find emergent patterns and reconstruct context based on a set of assumptions about behavior from other studies. Although we must of course be cautious about inferring function from form, mathematical representations of process allow us to conduct experiments which may not otherwise be possible, such as studying the cascading effects of taking down a fence or vaccinating animals against disease.
In the final chapter, I assess each part of my dissertation in light of the knowledge framework presented above, with a focus on the strengths and weaknesses of each method in terms of accountability, actionability and facilitating dialog. I end with a discussion of the compatibility co-knowledges during both production and consumption, and the implications of this work for promoting healthy ecosystems and communities.
References
Agar M (2004) We have met the other and we're all nonlinear: Ethnography as a nonlinear dynamic system. Complexity 10 (2):16-24
Barnosky AD, Hadly EA, Bascompte J, Berlow EL, Brown JH, Fortelius M, Getz WM, Harte J, Hastings A, Marquet PA, Martinez ND, Mooers A, Roopnarine P, Vermeij G, Williams JW, Gillespie R, Kitzes J, Marshall C, Matzke N, Mindell DP, Revilla E, Smith AB (2012) Approaching a state shift in Earth's biosphere. Nature 486 (7401):52-58
Bennett D, McGinnis D (2008) Coupled and complex: Human-environment interaction in the Greater Yellowstone Ecosystem, USA. Geoforum 39 (2):833-845
Berkes F (2004) Rethinking Community-Based Conservation. Conservation Biology 18 (3):621-630
Blair A (2010) Too much to know: managing scholarly information before the modern age. Yale University Press,
Bowker GC (2000) Biodiversity data diversity. Social Studies of Science 30 (5):643-683 Crutzen PJ (2002) Geology of Mankind. Nature 415 (6867):23-23 Fairhead J, Leach M (1996) Misreading the African landscape: Society and ecology in a forest-
savanna mosaic. Cambridge University Press, Cambridge Gantz J, Reinsel D (2010) The Digital Universe Decade – Are You Ready? International Data
Corporation, Framingham, MA Gupta A, Ferguson J (1997) Discipline and Practice: "The Field" as Site, Method, and Location
in Anthropology. In: Gupta A, Ferguson J (eds) Anthropological locations: Boundaries and Grounds of a Field Science. University of California Press, Berkeley,
Haraway D (1988) Situated Knowledges: The Science Question in Feminism and the Privilege of Partial Perspective. Feminist Studies 14 (3):575-599
Haraway D (1989) Primate Visions: Gender, race and nature in the world of modern science. Routledge, New York and London
Harding S (1995) "Strong Objectivity": A Response to the New Objectivity Question. Synthese 104 (3):331-349
Harding SG (1986) The science question in feminism. Cornell University Press,
11
Harriss J (2002) The Case for Cross-Disciplinary Approaches in International Development. World Development 30 (3):487-496
Heimann R (2010) Data Paradox: Information Sharing Incongruities in the Intelligence Community. Imaging Notes Fall 2010:35-39
Heisenberg W (1927) Ueber den anschaulichen Inhalt der quantentheoretischen Kinematik and Mechanik. Zeitschrift für Physik 43:172-198
Holland JH (1995) Hidden Order: How Adaptation Builds Complexity. Perseus Books, New York, NY
Holland JH (2006) Studying complex adaptive systems. Journal of Systems Science and Complexity 19 (1):1-8
iNaturalist.org (2012) About iNaturalist. http://www.inaturalist.org/about <accessed on 2012/11/05>,
Lansing JS (2003) Complex Adaptive Systems. Annual Review of Anthropology 32:183-204 Latour B (1988) Science in Action: How to Follow Scientists and Engineers Through Society.
Harvard University Press, Cambridge, MA. Latour B (1996) Aramis or the Love of Technology. Harvard University Press, Cambridge Latour B (2000) When things strike back: a possible contribution of 'science studies' to the social
sciences. British Journal of Sociology 51 (1):107-123 Lynam T, Bousquet F, Le Page C, d'Aquino P, Barreteau O, Chinembiri F, Mombeshora B
(2003) Adapting science to adaptive managers: spidergrams, belief models, and multi-agent systems modeling. Integrated natural resources management: linking productivity, the environment and development:157-174
Mackenzie D, Biagioli M (1999) Nuclear Missile Testing and the Social Construction of Accuracy. The Science Studies Reader:343-357
Manson S, O'Sullivan D (2006) Complexity theory in the study of space and place. Environment and Planning A 38 (4):677-692
Manson SM (2001) Simplifying complexity: a review of complexity theory. Geoforum 32 (3):405-414
Manspeizer I (2004) Considering Wildlife Conservation in Zambia at the Turn of the Millennium. State University of New York at Binghamton, Binghamton, NY
Martin E (1991) The egg and the sperm: How science has constructed a romance based on stereotypical male-female roles. Signs:485-501
Mearns R, Leach M (eds) (1996) The Lie of the Land: Challenging Received Wisdom on the African Environment Heinemann, Portsmouth, N.H
Morel B, Ramanujam R (1999) Through the Looking Glass of Complexity: The Dynamics of Organizations as Adaptive and Evolving Systems. Organization Science 10 (3):278-293. doi:10.1287/orsc.10.3.278
Mosse D (2005) Cultivating Development: An Ethnography of Aid Policy and Practice. Pluto Press, London
Nielsen M (2011) Reinventing Discovery: The New Era of Networked Science. Princeton University Press, Princeton, NJ
O'Sullivan D (2004) Complexity science and human geography. Transactions of the Institute of British Geographers 29 (3):282-295
OpenDataKit.org (2012) About Open Data Kit. http://opendatakit.org/about <accessed on 2012/11/05>,
Oxford English Dictionary (2012) "T, n." Oxford University Press,
12
Pickett STA, Cadenasso ML, Grove JM (2005) Biocomplexity in Coupled Natural–Human Systems: A Multidimensional Framework. Ecosystems 8 (3):225-232. doi:10.1007/s10021-004-0098-7
Pilkey O (2009) Useless Arithmetic: Why Environmental Scientists Can't Predict the Future. Columbia University Press, New York, NY
Schmink M, Wood CH (1987) The ‘Political Ecology’ of Amazonia. In: Little PD, Horowitz MM, Nyerges AE (eds) Lands at Risk in the Third World. Westview, Boulder, pp 38-57
Schuurman N (2008) Database Ethnographies Using Social Science Methodologies to Enhance Data Analysis and Interpretation. Geography Compass 2 (5):1529-1548
Schwartz B (2004) The paradox of choice: Why more is less. Ecco New York Slovic P (1973) Behavioral Problems of Adhering to a Decision Policy. Paper presented at the
Institute for Quantitative Research in Finance, Napa, CA. , Stokes DE (1997) Pasteur's Quadrant – Basic Science and Technological Innovation. Brookings
Institution Press, Washington, DC Walsh SJ, McGinnis D (2008) Biocomplexity in coupled human-natural systems: The study of
population and environment interactions. Geoforum 39 (2):773-775
13
CHAPTER 2.
ANALYTICAL APPROACHES IN COMMUNITY BASED NATURAL RESOURCE MANAGEMENT AND THE NEED FOR PROJECT PERSPECTIVES
Introduction
Since its debut more than 30 years ago, the growth of community based natural resource management (CBNRM) has been almost as good for scholars as it has been for conservationists. Dozens of reviews, hundreds of papers, and thousands of meetings and workshops have been devoted to documenting experiences, analyzing results, drawing connections, extracting lessons learned, and contextualizing the performance of CBNRM in space, time, and theory. CBNRM continues to be a popular subject of research and debates about its principles and application continue to fill the pages of special journal issues (Shackleton et al. 2010; Torquebiau and Taylor 2009) and conference panels (ASA 2010).
Despite (or perhaps because of) this plethora of attention, CBNRM appears perpetually mired in a crisis of identity and credibility (Dressler et al. 2010). Part of the challenge has been the polyvalent character of term CBNRM, which may variously reference a set of conservation principles, discourse, body of organized action, or process of transformation of governance. CBNRM has become a catchphrase to cover all of this (Torquebiau and Taylor 2009), although even a cursory glance of the objects lying under the rubric reveals that CBNRM is “not one thing but many” (Adams and Hulme 2001:193).
Despite so much scholarship, fundamental questions about CBNRM remain up in the air, such as whether the problems faced by CBNRM are due to poor implementation or a flawed model, and how to construct a typology of specific approaches (Shackleton et al. 2010). Among the few areas of consensus is that there is no turning back the clock to fortress conservation. “Once raised, the idea is difficult to suppress…CBNRM, broadly interpreted, persists in its prominence [because] it is the only viable option for an effective human stewardship of most of Africa’s landscape” (Murphree 2009:2553).
Among the reasons for the longevity of CBNRM as a topic of interest for scholars is the diversity of theoretical frames that have been fruitfully brought to bear on what is intrinsically a multi-disciplinary field of practice. This review includes papers from fields as diverse as landscape ecology to political science. In general, however, published writing on community based conservation lacks depth in precisely the realm where practice gets most complicated, the social processes (Agrawal and Ostrom 2006). An array of social science theory exists that can help shed light on complicated social behavior and unanticipated trajectories of many CBNRM programs, including environmental history, political ecology, anthropology, and discourse analysis (Adams and Hutton 2007; Mascia et al. 2003; Hajer 1995; Brosius and Russell 2003).
To bolster the foundations of our understanding of CBNRM, I begin this review by summarizing a sizable chunk of the core CBNRM literature, grouping authors and arguments less by field than by the object of their analysis: the social and ecological outcomes of CBNRM, design of programs, local context, external influences, production of data and representation, scale, and sustainability.
14
In the second half, I review a unit of analysis that has been theorized and productively employed in rural development studies but less so in conservation, perspectives on the project. I include literature on projects in a review of CBNRM for three reasons. Projects have been instrumental in the implementation of most formal CBNRM programs, whether driven by government, NGOs, or universities. Secondly, an exciting body of work on projects has recently arisen in response to calls for detailed ethnographies from both conservation and development studies (Watts 2001; Brosius et al. 1998), as well as an older body of work on managerialism in public administration (Clarke et al. 2000). Finally, in Chapter 3, I will draw upon theorizations of projects for the analysis of a project ethnography that addresses some rather puzzling questions about a CBNRM project in Zambia that seemed to do most things right but was shut down after only four years.
Background
The Emergence of CBNRM
Protected areas have been the backbone of strategies to protect species and ecosystems since the advent of the modern conservation movement in the late 1800s. The demarcation of zones of pristine wilderness, and the narratives about people and nature that fortify such borders, originated in countries in the global north where exclosures served to both protect remaining areas of 'pristine' nature from the destructive appetite of industrialization, as well wrestle away land from peasants and indigenous peoples whose labor and compliance was desired by capitalists and the state (Adams and McShane 1992). During the colonial era, this model of exclusion spread southward as game reserves started dotting the colonial maps of Africa. By displacing native populations and disrupting agricultural systems, the game reserves created labor pools for the mines and provided resources for white hunters (Adams and Mulligan 2003).
As the colonial period drew to an end, many of the newly independent countries inherited protected area estates and conservation policies that were highly inequitable and based on questionable assumptions about both rural economies and ecosystems. But rather than dismantle colonial conservation policy, most countries expanded and/or strengthened protected areas for their important role in the more pressing project of state formation (Gibson 1999; Manspeizer 2004; Neumann 1998). These important assets faced a new crisis in the mid to late 70s, as government budgets plummeted first from falling commodity prices, and then by fiscal austerity measures tied to loan agreements from the north (Gibson 1999). Parks and wildlife departments across Africa grew progressively weaker as lean years turned into lean decades, and poachers moved in to fill a robust demand for meat and ivory. Concurrently, democratic reforms were deepening across the global south and local resistance to unpopular exclusionary policies were becoming increasingly expressive, challenging protected area policies both directly and indirectly (Neumann 1998).
This convergence of political and ecological crisis produced a historical moment in which new actors in conservation had an opportunity to develop the CBNRM discourse and transform conservation away from the ‘fences and fines’ approach. The fundamental premise of CBNRM is that conservation in and around protected areas can not succeed without the cooperation of local communities, who had largely been denied access to natural resources in parks and were forced to absorb the costs of living in remote areas with poor infrastructure. Local communities were
15
thus seen to be embedded in two adversarial relationships: on the one hand they were at battle with oppressive wildlife departments, and on the other with their natural surroundings which they had no incentive to conserve. Reducing the hand of central government and devolving the rights and rewards for protected area management to local communities, the theory went, would realign both of these relationships in the direction of another alluring concept of the 1980s, sustainable development (Wells et al. 1992; Western et al. 1994).
The idea that conservation could involve local communities constituted a sharp departure from the colonial and immediate post-independence eras, however it resonated across a broad range of actors as both a practical measure and moral imperative (Adams and Hulme 2001; Wells et al. 1992; Hutton et al. 2005). As a discourse, CBNRM quickly gained prominence due to its malleability and compatibility with other broad trends in development and ecology (McNeill 2006).
First, the ‘new’ conservation was founded upon a rethinking of “local” people, pushed forward by environmental historians, anthropologists, and human rights advocates. This switch began by recasting local people from environmental degraders to ecological stewards who had become victims of oppressive and racist governments (Hulme and Murphree 1999). Concurrent with this new representation, local communities were no longer cast as ‘invaders’ or ‘spoilers’ but as ‘indigenous people’, a label that brought allies and a full complement of political claims about human rights, recognition of history and territory, and traditional ecological knowledge (Agrawal and Gibson 1999a). The role of local people was also changing in the field of rural development, where a broad recognition of the importance of local knowledge and viewpoints was emerging along with the development of a range of participatory appraisal and planning methods (Campbell and Vainio-Mattila 2003; Chambers 1983).
A second influential discourse of the 1980s and 90s that contributed to the popularity of CBNRM was neoliberalism. Neoliberal ideals are reflected in the CBNRM paradigm by its move away from management by central government, the promotion of ‘civil society’ as the most efficient provider of public goods, and the belief that natural resources are better conserved if exposed to market forces which define their value, optimal use and distribution (Hulme and Murphree 1999; McCarthy 2006; Hutton et al. 2005).
The shift to community-based conservation also coincided with several paradigm shifts within ecology and resource management. These included a shift from a reductionist view of ecosystems to a systems approach that highlights dynamism and non-linearity of natural processes, in which people have been a part of many natural systems for quite a long time (Berkes 2004; Vitousek et al. 1997; Adams and McShane 1992). Proponents of ecosystem management responded by advocating participatory approaches as the most efficient means to achieve ‘sustainable development’, another poorly defined but extremely influential discourse in the late 1980s. (Hulme and Murphree 1999; Hutton et al. 2005).
At a more functional level, CBNRM promised new resources and political opportunities for a range of actors. Local communities were promised a stronger voice in the management of adjacent protected areas and a larger share of benefits flowing from tourism and safari hunting. Conservation and development NGOs saw CBNRM as a way to integrate social and environmental agendas, and thus expand their project portfolios into new sectors, geographies,
16
and funding streams. For government, embracing the CBNRM discourse meant tapping into new streams of bilateral foreign aid, regaining control of their protected area estate, and the possibility of actually extending State reach by influencing the infant community structures. Foreign development agencies also stood to gain, tapping into a wave of public and political interest in biodiversity conservation, sustainable development and downsizing government. As a discourse, CBNRM thus proved itself to be remarkably absorbent, and thus powerful, performing the remarkable feat of servicing the interests and agendas of foes and friends alike (Blaikie 2006a; Mosse 2004).
Based on its discursive appeal and the promise of win-win outcomes, CBNRM flourished (Wells and Brandon 1993). By the mid-1990s, over a hundred CBNRM programs had sprouted up across the tropics including more than 50 in Africa (Alpert 1996). These programs fell under a number of acronyms, including CBNRM, CWD (conservation with development), CWM (community wildlife management), CNRM (community natural resource management), and ICDP (integrated conservation and development program). While some authors have sought to provide definitions for these different labels (e.g., Campbell and Vainio-Mattila 2003), the usage and boundaries of these terms remains inconsistent. CBNRM has emerged as the broadest and most enduring label (Dressler et al. 2010; USAID 2012), and many authors differentiate the two most common labels, ICDPs and CBNRM, according to the level of devolution whereby CBNRM programs are characterized by a stronger and more formal devolution than ICDPs. For my purpose of reviewing the theoretical lenses which have been used to evaluate these types of programs, I clump together a variety of conservation literatures without trying to tease apart or redefine differences in the approach.
The inconsistent use of acronyms, however, is not merely sloppy or careless, but reflects one of the characteristics that give CBNRM its potency as a discourse. Although the contexts and conditions in which CBNRM has been introduced are enormously varied (Adams and Hulme 2001), claims, evidence, and conclusions about CBNRM programs in settings as diverse as Sierra Leone and Botswana are routinely lumped together in arguments about the validity of a supposedly singular set of principles (e.g., Oates 1999). The number of review papers that seek to extract best practices and lessons learnt from widely diverse case studies speaks to the degree to which professional conservationists see CBNRM as a ‘tool’ that can be continuously refined and applied generically with increasing levels of perfection (e.g., Shackleton and Campbell 2001; Gruber 2008; Kellert et al. 2000). While the fuzziness and decontextualization of CBNRM may not add much clarity to our understanding of the dynamics of conservation in specific locales, it is precisely this ambiguity which makes CBNRM discursively malleable and thus enabling for a broad range of actors (Blaikie 2006b; Mosse 2005).
Critiques of CBNRM
Despite its grand entrance, the heyday of CBNRM was not long-lived. The discourse that was able to absorb all manner of agendas also proved to be quite leaky when exposed to analytic and empirical scrutiny. A wave of critiques of CBNRM began in the early to mid 1990s, questioning whether the projects that labeled themselves as such could deliver on either side of their win-win promise. Collectively these critiques have been characterized as a ‘backlash” to CBNRM with a corresponding call to go “back to barriers”, and contributed to a shift in funding priorities for donors (Hutton et al. 2005; Wilshusen et al. 2002).
17
A mountain of CBNRM assessments have been summarized in several review papers and edited volumes (e.g., Hughes and Flintan 2001; Adams and Hulme 2001; Hutton et al. 2005; Gruber 2008; Fabricius and Koch 2004; Songorwa et al. 2000; Roe et al. 2009; Hulme and Murphree 2001; Brosius et al. 2005). While not repeating these summaries, below I place the main arguments of the CBNRM critique into the following broad families based upon the focus of analysis: outcomes, design of CBNRM interventions, local context, external influences, data and representation, scales, and sustainability. While the elements of this typology overlap and many arguments transcend categories, this structure encompasses the vast majority of arguments posed in published and unpublished CBNRM literature. In the final section of this chapter, I describe elements from an under-utilized perspective in CBNRM analysis, the project as a unit of analysis.
Outcomes
Many assessments of CBNRM begin by looking at outcomes, as the strongest litmus test of whether the approach is ultimately viable. Three types of outcomes are commonly examined: the ecological changes, socio-economic impacts at local levels, and how CBNRM programs intersect with broader patterns of power and the historical oppression of rural people.
Ecological Outcomes
The fiercest arm of the CBNRM backlash charges that CBNRM programs have failed to stem, and in some cases have accelerated, the disappearance of the very resources they claim to protect. Definitive assessments of ecological change are limited by a chronic lack of monitoring data (Cumming 2004; Shackleton et al. 2010), which itself has been interpreted as a sign of failed conservation. One of the earlier meta-analyses of CBNRM projects concluded that only five of 36 reviewed projects could demonstrate a positive impact for wildlife conservation, a ratio which sounds bad but becomes more difficult to interpret given that half of the projects had no ecological monitoring at all (Kremen et al. 1994). Where ecological data does exist, linking the observed changes to the effects of a CBNRM project presents another significant challenge given that few projects monitor control areas as a proxy for the counterfactual (Ferraro and Pattanayak 2006).
Despite the empirical and methodological challenges, several authors have tried to both document and account for the ecological outcomes of CBNRM programs. In an influential work, Oates (1999) describes a pattern of habitat destruction and extirpation of primates in and around national parks in Sierra Leone, Ghana, and Nigeria. Although much of the destruction he describes took place prior to the CBNRM project and during periods of civil war, Oates uses the environmental degradation as evidence of “serious flaws in the theory that wildlife can best be conserved through promoting human economic development’ (1999:xv). In a more grounded study, Simasiku et al. (2008) examine a range of population counts, proxies of wildlife trends, and economic data as the basis for an analysis of the underlying inefficiencies with Zambia’s conservation programs.
Examples of successful conservation outcomes from CBNRM also exist. Despite all of the problems conserving wildlife outside parks in Zambia, the game management areas that had an active CBNRM program maintained sufficiently large and healthy wildlife populations to
18
sustain safari hunting, whereas those areas with no CBNRM program continued to lose their remaining populations (Dalal-Clayton et al. 2003; Clarke 2000; Gibson 1999). Likewise in Zimbabwe, the numbers of elephant and buffalo remained steady in several districts over the first two decades of CAMPFIRE, and the amount of good elephant habitat was maintained in certain districts (Taylor 2009). A review of community based forest management projects in Tanzania documented improved forest conditions where forest management was genuinely devolved to communities with external support (Ribot et al. 2010). Conservation lands and animal populations have also increased or been maintained in most of the community conservation areas in Namibia and Botswana, and there is evidence of successful conservation at specific sites in Central and West Africa (Roe et al. 2009).
Threat reduction is commonly used as a proxy for conservation impact when monitoring data on wildlife populations and ecosystem integrity is lacking (Salafsky and Margoluis 1999b; Shackleton et al. 2010). Threats are often more easily measured than changes in wildlife populations or vegetation, which occur at large spatial scales over long periods of time. The ability of CBNRM program to reduce threats has been mixed. In many programs, the levels of illegal hunting and settlement have been slowed or reversed (Roe et al. 2009). In other cases, the control of one form of exploitation gave rise to another form of the same threat, as when firearms are replaced with snares (Lewis and Phiri 1998). Long-term threats, such as land use conversion, internal movements of economic and ecological refugees, and rising demand for meat and fuel wood continue to be ever present challenges in many areas (Hulme and Murphree 2001; Dalal-Clayton et al. 2003). In general, community based forest conservation has had less success in reducing threats than savannah systems.
Socioeconomic outcomes
As with ecological outcomes, assessing socioeconomic effects at either the household or community level is frequently constrained by a lack of data. Many CBNRM programs invest in social infrastructure, such as schools, clinics, and roads (Alpert 1996; Lewis and Alpert 1997; Dalal-Clayton et al. 2003). While such investments are tangible, other studies have noted that access to and benefits from social infrastructure are not evenly spread, are generally decoupled from individual behavior or resource management practices, and do not address core sustenance requirements for food and income (Gibson 1999). Provision of basic infrastructure—normally the responsibility of the state—by conservation NGOs also has also been implicated in reducing the demand from rural communities for good governance from their elected officials, and altering political relations between communities, the national wildlife department, and local government in complicated ways (Mulolani et al. 2005).
Several studies have determined that those who benefit the most from CBNRM are those directly engaged with the project through employment or other positions that generate or control revenue streams (e.g., Gibson 1999). In a study of the welfare and expenditure of households located within and outside game management areas (GMAs) in Zambia, Bandyopadhyay and Tembo (2009) found that GMA residents who were members of a community committee or were otherwise actively engaged with the formal structures benefitted significantly more than others in the community, a pattern often labeled as ‘elite capture’. Similarly in a study of the Luangwa Integrated Resource Development Project (LIRDP) in eastern Zambia, Wainwright and Wehrmeyer (1998) found that only 11% of surveyed households received any direct benefits
19
from the project. For most rural residents, the meager level of benefit is far overshadowed by the direct costs of living in a remote area with dangerous animals, and the opportunity costs of foregoing hunting, timber cutting, and agricultural expansion (Songorwa 1999; Norton-Griffiths and Southey 1995; Emerton 2001).
Other studies have surveyed community attitudes, which tend to be strongly correlated with gains in welfare. In a study of CBNRM programs in the Chobe enclave in Botswana and LIRDP in Zambia, Musumali et al. (2007) discovered high levels of confusion, frustration, and mistrust, with over 50% of respondents in both areas perceiving no household level benefits whatsoever from the program. Similarly, Songorwa (1999) documented high levels of mistrust in the Selous Conservation Program in Tanzania, created by broken promises by the project and a perception that conservation carries far more costs than benefits. The creation of high expectations and false hopes has been singled out as one of the inherent flaws of project-based implementation of community based conservation (Oates 1999) and rural development more broadly.
Reproducing Relations of Oppression
Despite all the claims of local empowerment, many CBNRM studies conclude that communities are junior partners and lack a strong voice in decisions about management, allocation of resources, and benefit sharing. Structural inequality often reflects a legacy of past dispossession of land and resources near protected areas, and can make the introduction of CBNRM extremely complicated or even politically untenable. McDermott-Hughes (2001a) for example describes the unraveling of CBNRM at a site in Zimbabwe where a history of land dispossession created suspicion and opposition to project activities.
Another group of critiques charge that CBNRM projects do not merely operate in contexts characterized by historical struggles over resources, but actually perpetuate the same relations of inequality and oppression that marginalize local communities. Marginalization of local communities is often associated with the expansion of state power into remote areas. CBNRM programs enable expansion of state control over valuable resources and recalcitrant populations by providing, i) a legitimizing narrative, ii) institutional structures, and iii) physical resources (Gibson 1999; Hill 1996; Peluso 1993). CBNRM programs have also primed rural areas for ‘investment’ by private ecotourism and hunting concessionaires, extending a long pattern of displacement of rural people by more powerful actors (McDermott-Hughes 2001b; Neumann 1997). Examining the distribution of costs and benefits at larger scales, other authors have noted that while the benefits of biodiversity conservation are indirect and external, the costs are borne at local and national levels, including loss of life and property, reduced access to resources, and foregone opportunities to generate income (Wainwright and Wehrmeyer 1998; Norton-Griffiths and Southey 1995; Bodmer and Lozano 2001). Viewed in this light, CBNRM has been likened to a Trojan Horse through which the expanding state power and corporate capital can be inserted into new territories (Blaikie 2006b; Dressler et al. 2010).
However not all CBNRM programs have dodged contentious land and resource politics, or privileged the interests of the state and capital. Some have proactively engaged with land politics and legislative reforms to strengthen tenure to local communities, and in so doing won acceptance by local actors (McDermott-Hughes 2001a). In other cases, projects have attempted
20
to stem elite capture by pushing the democratization of local management committees, although the legitimacy of new institutions is not always as recognized or effective as customary authority (Dalal-Clayton et al. 2003).
Design of CBNRM Interventions
To understand why the outcomes of CBNRM programs so often deviate from stated goals, many authors have investigated the design of CBNRM interventions, including the incentives package they introduce, their recognition and handling of tradeoffs, and the strategies for incorporating local participation.
Incentives
CBNRM programs typically seek to bring extraction levels in line with ecological limits through a series of carrots and sticks. Under ideal conditions the devolution of rights should produce sufficient incentives for people to use resources for the greatest long-term benefits. However in practice devolution is partial and livelihood decisions are made under conditions of high levels of uncertainty and a high discount rate. Many conservation projects therefore supplement devolution of rights with goods and services that aim to foster goodwill, provide incentives, and ease livelihood burdens during the transition period to a new management regime.
However the ‘incentive package’ provided by CBNRM programs has come under scrutiny as being either ineffective or contradictory. A common critique observes that public goods such as improved physical infrastructure are not likely to modify individual behaviors unless access is denied to violators (Gibson 1999; Nelson and Agrawal 2008). This can be difficult to achieve in practice, as was the case in Zambia where local hunters switched from guns to snares in order to continue hunting albeit more secretively (Gibson and Marks 1995; Lewis and Phiri 1998).
Another disconnect results when there is a substitutability problem between incentives and the behaviors they seek to modify. Barrett and Arcese (1995) note that cash disbursements are only a substitute good for bush meat if food markets are accessible and stable, which is often not the case in remote areas. And neither food, nor cash, is a good substitute when hunting is done for non-pecuniary purposes, such as ceremonies, rites of passage, expressions of lineage identity, and the maintenance of social relations (Barrett and Arcese 1995; Gibson and Marks 1995). The provision of direct benefits to communities also runs the risk of strengthening people’s allegiances not to sustainable resource use but to the program (Gibson 1999).
Ignoring Tradeoffs
The notion of socio-ecological ‘win-win’ solutions is central to the narrative of CBNRM. While this may be rhetorically appealing, the connections between economic development, livelihoods and conservation outcomes is poorly understood in many conservation programs (Hughes and Flintan 2001). There is often an assumption that improved standards of living will automatically translate into better stewardship of resources, but many authors argue this assumption is grounded more in idyllic notions of rural communities (Oates 1999) or a faith in the universality of environmental values, rather than empirical evidence (Newmark and Hough
21
2000; Brown 2003). Even the conservation benefits from the eco-friendly enterprises often promoted by CBNRM programs, such as community lodges or the sustainable harvesting non-timber forest products, are contingent upon a long list of institutional and ecological assumptions that are often not true and may even not be articulated (Margoluis and Salafsky 1998; Murphree 2003; Salafsky and Wollenberg 2000). Conversely, evidence that improved resource management reduces poverty is also ambiguous and generally weak (Wunder 2001).
The tendency of CBNRM projects to ignore or ‘wish away’ or simply ignore inherent tradeoffs between conservation and development interventions has led some authors to conclude that resource management and livelihood security are better left uncoupled (Barrett and Arcese 1995). A related school of thought promotes the idea that rural development activities in CBNRM should be located some distance away from protected areas to lure people away from park borders, rather than attempt the futile goal of creating sustainable buffer zones (Terborgh 1999; Wittemyer et al. 2008a).
Participation
While CBNRM differentiates itself from other approaches to conservation by its emphasis on local participation, many authors question the faithfulness of conservation program to participatory models. Critiques in this family start by simply noting that most CBNRM programs provide only nominal opportunities for community participation (Brown 2003; Newmark and Hough 2000; Songorwa 1999). Furthermore the opportunities that do exist are not spread evenly. Most local level committees are dominated by men, more specifically men tied to the local power structure (Gibson and Marks 1995). Women as a group have typically been denied opportunities for meaningful participation in resource management, locked out by both institutional norms and cultural practices (Meinzen-Dick and Zwarteveen 2001). While many CBNRM projects have sought to improve the representation of women by mandating a quota system in leadership positions, barriers to meaningful participation continue to operate and hinder many women from playing much more than a nominal role (Agrawal 2001). Not surprisingly, the majority of benefits from CBNRM programs are likewise captured by men (Nabane and Matzke 1997; Meinzen-Dick and Zwarteveen 2001).
Participatory methods also carry transaction costs, both for the project and participants, which are often not borne by projects and may not even be recognized (Barrett and Arcese 1995). The time and financial requirements may push a program to make only token efforts to involve local people, and to ventriloquise the voice of the community in order to satisfy a donor policy interest (Blaikie 2006b; Campbell and Vainio-Mattila 2003; Cooke and Kothari 2001). Even when participatory approaches are more than perfunctory, CBNRM programs may be more interested in using participation as a means to maximize the efficiency of service provision for a suite of activities that have been predetermined, as opposed to gathering local perspectives or fostering a new type of relationship with communities (Mosse 2001). While these challenges and contradictions have been encountered in others fields of rural development such as health and education, CBRNM practitioners in particular have been slow to learn from similar experiences with participatory development (Campbell and Vainio-Mattila 2003; Lundy 1999).
22
Local Context
To help understand why CBNRM so often produces disappointing results, numerous authors have turned their attention to the particularities of specific locales to build arguments that a nonconducive context is to blame for the poor performance of CBNRM. Here the potential of community conservation is thought to be constrained not as much by flaws in its underlying precepts and ideals, but by local conditions that make those principles unworkable in practice. Arguments in this camp examine both social and ecological characteristics at sites where CBNRM has been formally introduced
Community
All CBNRM programs introduce incentives and interventions that aim to modify the behavior of people in a local ‘community’. Whether the goal is to change attitudes, farming practices, regulatory compliance, or land use patterns, programs develop and implement incentives based upon an understanding of the characteristics of rural communities and what makes them tick.
Conservation narratives are frequently based on “primitivist” discourses about rural Africans as either inherently ecologically destructive or eco-saviors (Manspeizer 2004; Adams and McShane 1992). Although opposite in their representation, both discourses have been used to justify State intervention and an expansion of protected areas that was started in the colonial era (Neumann 1997). Agrawal and Gibson (1999b) trace the discursive history of three characteristics often associated with the concept of ‘community’: community as a small and fixed spatial unit, communities possessing a homogenous social structure, and communities as a shared set of norms. Even when legislative reform creates opportunities for the devolution of rights, communities must appear to conform to and operate as the highly stylized image of themselves embedded in policy (McDermott-Hughes 2001c; Li 2002; Sullivan 2002).
Numerous authors have highlighted the many ways that actual communities differ from their idealized forms found in CBNRM models. Bradshaw (2003) for example questions the portrayal of local communities in CBNRM models as inherently favoring ecologically and environmentally sustainable land uses. Drawing upon an example where a community favored a dirty industry that promised more economic gains than conservation, he argues that many communities lack the credibility to be designated environmental stewards.
Other authors question the assumptions CBNRM programs make about the presumed static and homogenous qualities of communities. CBNRM programs often design interventions with the presumption that local people operate under a uniform set of circumstances and incentives, failing to recognize that communities are comprised of individuals with diverse assets, needs, and preferences (Wainwright and Wehrmeyer 1998). Oates (1999) suggests that one of the fundamental flaws of CBNRM is the failure to recognize and respond to the large number of new migrants who are attracted to protected areas for employment or opportunities to quickly harvest valuable resources and then move on (see also Wittemyer et al. 2008b)). Unruh et al. (2005) shed more light on migrant behavior by documenting how perceptions of insecure land tenure drive migrants in southern Zambia tend to clear more land than they can actually cultivate, a process known as ‘clearing to claim’. In many rural African settings, aspirations for
23
local progress have been usurped by a broader dream of egress, with profound consequences for the management and governance of natural resources (Ferguson 2006), a process which may even accelerate with the additional stresses from climate change (McDermott-Hughes 2008).
Poverty & Population
From Malthus (1888) to Hardin (1968) to Kaplan (1994), discourses around poverty, population growth, and environmental degradation have a long and influential history that have shaped all manner of thinking about economic development and conservation. Many of these same concerns and debates have also appeared in critiques of CBNRM. Hackel (1999) for example suggests that chronic levels of poverty and high population growth rates characteristic of many parts of rural Africa will invariably make conservation a less desirable form of land use in the future in the eyes of local communities. Individual communities may temporarily embrace CBNRM if it produces material benefits, but that support will be short lived if benefits stop flowing or a more economically attractive alternative comes along (Hackel 1999). CBNRM has generally been more effective in maintaining biodiversity in countries such as Namibia and Botswana that have relatively low rates of poverty and basic needs are met by higher incomes and state-backed social safety nets (Roe et al. 2009). Conservationists should therefore be cautious where and how they deploy CBNRM, and advocate protectionism until such time when rural development programs can produce more conducive contexts (Hackel 1999).
Population density and growth are frequently cited as factors shaping the success and sustainability of CBNRM. Most observers agree that CBNRM is more likely to achieve its twin goals in areas with relatively low human population density and high value resources (Murombedzi 2001). However too low a population density can create challenges for monitoring, enforcement, and management of ecosystem function (Gibson et al. 2000; Murphee 2000).
Population increase, whether natural or from migration, poses a number of challenges for CBNRM. Population growth outside conservation areas can act as a source of migrants to frontier zones, particularly when source areas are characterized by land scarcity, overstocking of livestock, or intra-family conflict (Murombedzi 2001; Cliggett 2000). Population increases can also drive down the per capita level of program benefits to levels that are no longer competitive with alternative land uses (Bond 2001). Although higher population density generally increases pressure on resources, to the chagrin of conservationists many communities engaged in CBNRM actively seek new migrants for the political and economic capital they bring (Murombedzi 2001). When conservation narratives that call for the preservation of the status quo collide with the strong and consistent reality of human population growth, the response can be a troubling double-set of standards for the scale of local and global resource use. “Even as children play at their feet, planners envision stable rural populations contained behind electric fences…Through intensive, community-based projects, peasants can cultivate their garden within their boundaries. In doing so, they free up land for extensive bioregions and travel routes: tourists expand as peasants involute” (Hughes 2002:25).
Political Economy
Conservation is ultimately about governance (Hulme and Murphree 2001). CBNRM in particular, as an endeavor requiring the coordinated efforts of multiple actors at multiple scales,
24
is unlikely to go as planned without a robust understanding of incentives and actions of multiple actors (Agrawal and Ostrom 2006). A common pitfall many CBNRM projects have fallen into is not recognizing the political context into which conservation initiatives are placed, or the inherently political nature of this “new” approach to conservation. Many authors have sought to make visible the intersection of CBNRM with local and national politics in an attempt to explain why some programs encounter strong opposition or result in unintended consequences.
CBNRM advocates often present this community based conservation as a technical innovation that generates a win-win outcomes by simply ‘getting the prices right’ and creating ‘more effective and efficient’ management structures (Child 1996). However devolution always creates winners and losers, and nothing could be more political than reallocating rights to land, wildlife, and forests (Murphee 2000; McCarthy 2006). Hence while practitioners of CBNRM have spent considerable effort developing technical solutions and designing organizational structures, they have often failed to find the means to implement them politically (Jones and Murphree 2004).
At a national level, the high financial value of wildlife creates strong disincentives for central government to devolve authority to lower structures (Nelson and Agrawal 2008). This is coupled with asymmetrical relations of power between the center and the local, in which state agencies have access to considerably more resources than local communities and dominate the implementation of policy (Murphee 2000). In certain countries, local police, military commanders, or corrupt politicians may yield considerable influence and be closely aligned with commercial logging, mining, or poaching operations (Oates 1999; Terborgh 1999; Smith et al. 2003). CBNRM can trigger intense political opposition at multiple levels by threatening to divert flows of income and disrupt long-standing chains of patron-client ties that extend from the local to the national (Blaikie 2006b). Even local extension officers from line Ministries can become a source of opposition when a CBNRM program renders their services redundant or diminishes their domain of influence (Blaikie 2006b).
Even when formal legislation mandates devolution to the community level, if local institutions do not have sufficient capacity to govern resources, little will change in practice (McDermott-Hughes 2001c). Local management committees created by CBNRM initiatives often lack the legitimacy or technical ability to exercise their new mandates, including the ability to exclude powerful and armed outsiders. They may also conflict with more traditional forms of leadership, social norms, or the hegemony of ‘local elites’ (Gibson and Marks 1995). Community based institutions may also be in competition with local government and state resource agencies, that are almost always badly under-resourced, particularly at the sub-national level, and may seek to co-opt the economic or political capital generated by CBNRM. It may therefore be little surprise that ‘aborted devolution’ in all its guises has been posited as the most significant and widespread factor limiting the performance of CBNRM programs (Murphee 2000).
Influences of External Actors and Global Geopolitics
Shifting from the local to the global, another branch of analysis begins by reminding us that the contemporary manifestation of CBNRM has been strongly influenced by the history and interests of international aid and conservation organizations. Both the idea and the mechanics of
25
formal CBNRM policies have largely been forged through collaborations between states, international finance institutions, NGOs, universities, for-profit consulting firms, as well as communities. Interrogating the intersection of these actors illuminates how a broader set of interests and processes shape the reception, characteristics, and outcomes of CBNRM in specific locales (Blaikie 2006b).
Geopolitical Legacies
As the offspring of rural development and biodiversity conservation, CBNRM is in the rather unenviable position of inheriting the baggage of not one, but two lineages, of mostly failed foreign interventions in Africa. However the dynamics and uneven effects of past conservation and development projects are not simply lying peacefully in history books. Their legacies remain etched in the land, institutions, memories and language of beneficiaries and victims alike. Many conservation programs operate in areas in or around national parks, areas that often have an unforgotten history of racially-based land dispossession that frames current interactions with the State (McDermott-Hughes 2001a). Narratives that were forged in the colonial period to justify dispossession of rural African people remain surprisingly intact in the discourse of contemporary conservation (Blaikie 2006b; Neumann 1998). Even when the social construction of rural Africans has shifted from one extreme to another, from inherent spoilers to natural stewards, there remains a troubling consistency how rural people are always framed as “other” (Manspeizer 2004).
The contentious socioeconomic conditions faced by donor-supported CBNRM programs have been in many cases tied to an earlier suite of donor-driven reforms. The “shock therapy” structural adjustment programs of the 1980s left rural areas devoid of functioning agricultural markets, wildlife departments without staff, and local government unable to provide basic social services and infrastructure (Gibson 1999). While the details of foreign aid may be different today, the effects of these earlier programs can be seen in the inherent mistrust of donor-supported programs, weak state institutions, dependency on international aid and foreign NGOs, and ultimately the privatization of sovereignty (Newmark and Hough 2000; Manspeizer 2004; Ferguson 2006).
Neoliberalism
The mechanisms by which international actors influence conservation practice extend well beyond the power of selective financing. Many authors have examined how CBNRM programs both manifest and actively constitute a more fundamental reconfiguration of governance of the environment. Viewed at this scale, the evolution of discourse of communities, conservation and even nature itself can not be separated from the broader expansion of neoliberal policies during the same time period as the rise of CBNRM.
The fingerprints of neoliberalism have been on CBNRM since the moment of its inception. Neoliberal forms of understanding apply the principles and assumptions of the market to the governance of all manner of public resources. Thus, while the diagnosis of the poaching crisis in the 1980s centered on disempowered wildlife agencies and impoverished rural populations, neoliberal understandings promoted a solution that called for exposure of the remaining resource stocks to market forces rather than more effective or equitable protection by
26
the state (Child 1996; Jones and Murphree 2004). This maneuver not only provided wildlife and wilderness an economic value on par with alternative land uses such as agriculture and livestock (that were also pried opened to the market), but conveniently created new and bigger markets for tourism, hunting, and the business of conservation itself, through which international capital could flow.
This centrality of markets placed CBNRM in line with mainstream political currents of the times and was one of the key attractions for the initial wave of CBNRM converts (Hulme and Murphree 1999; Hutton et al. 2005). Even as experiences accrued and the theorized trickle down effect turned out to be little more than a dribble, CBNRM programs continued to turn to market forces to develop ‘sustainable’ enterprise opportunities through which marginalized households might reduce their livelihood deficit (Naughton et al. 1998; Jones and Murphree 2004).
Concurrent with the rolling out of markets, neoliberal reforms ‘rolled back’ big government through some not-so-gentle nudging (Igoe and Brockington 2007), and functions of the state transferred to a resurgent civil society in the form of community based organizations and NGOs. Large international conservation NGOs, or BINGOs (Corson 2010), in particular have emerged as prominent players in framing, designing and implementing conservation programs. The large BINGOs have grown in transnational networks alongside the international finance institutions that fund them, and have played a significant role in both representing CBNRM and mobilizing political support for it (Corson 2008).
Data, Representation, and Science
Given that our understanding of CBNRM is a function of the data available, another line of enquiry examines how knowledge about CBNRM is produced. One of the root causes for the anecdotal character of many CBNRM assessments is the difficulty of data collection. Field assessments rarely offer enough time or resources to collect much data, particularly on environmental variables (Wainwright and Wehrmeyer 1998; Shackleton et al. 2010). This reduces the amount of primary data available for analysis, and compels researchers to rely on project generated data and reports. However monitoring is not a forte in most CBNRM projects, and what does take place tends to be oriented around reporting requirements (Kremen et al. 1994; Hughes and Flintan 2001). Incomplete information about the local socioeconomic context has in particular presented challenges for designing effective institutions to govern resources at the local level (Wells and Brandon 1993).
CBNRM scholars have highlighted not only the consequences of missing information, but also the ways in which information—and misinformation—is produced, reproduced, and used discursively. Many of the narratives about the relationship of rural African people with landscapes and wildlife have been received as ‘inherited wisdom’ from overtly racist and oppressive colonial regimes, often with little reflection or scrutiny (Leach and Mearns 1996). Thus, seductive but empirically inaccurate stereotypes of rural Africans as homogenous, static, and spatially bounded persist without challenge, continuously reproduced by images, stories, and popular media (Neumann 1998; Manspeizer 2004).
Even scientists are not immune from misinterpreting data or asking the wrong question in light of a prevailing discourse, as shown conclusively by Fairhead and Leach (1996) in their
27
well-known study of ‘deforestation’ in the savannah woodlands of West Africa. For decades scientists and resource managers presumed patches of forest in the savanna woodlands of Guinea were the remnants of a once intact forest that had been fragmented by human activity, but archival imagery and sociological research established the opposite to be true – that people were actually growing forest patches as resource banks. Contemporary conservationists continue to privilege ‘scientific’ forms of understanding over local knowledge (Goldman 2003), and have used ‘scientific management’ to justify exclusionary practices and continued central control over resources and economic opportunities (Shackleton et al. 2002; Homewood and Brockington 1999).
Conservationists and scientists are, however, not the only ones with agency to produce knowledge. Communities and government agencies have proven quite adept in strategically reconfiguring discourse to advance alternative agendas (Fortmann 1995; McDermott-Hughes 2001a; Peters and Kambewa 2007). Some CBNRM projects have explicitly sought to expand local access to technologies of visualization, tools which have more commonly been used by the state and conservationists to represent landscapes as devoid of people and social history. Through the development of ‘counter maps,’ communities have laid claims to territory and legal rights made possible by legislative reforms (McDermott-Hughes 2001a; Hodgson and Schroeder 2002; Peluso 1995). Other CBNRM projects have sought to train local management committees in ‘modern’ methods of resource management, as the foundation of a broader vision for a more genuine and effective form of comanagement between professional and ‘citizen’ scientists (Getz et al. 1999).
Scale
Scale—spatial, temporal, and institutional—is another analytic that has been applied to understand the design and performance of CBNRM. Scale is an appropriate lens for analysis given the nested hierarchies of institutions and ecosystems through which CBNRM programs operate.
The local scale at which community organizations operate is part of the discursive appeal of CBNRM, purportedly enabling more efficient, locally grounded, and politically acceptable management (Agrawal and Gibson 1999a; Blaikie 2006b; Western et al. 1994). Smaller units of management thus have lower transaction costs and do a better job aligning responsibility, authority, and incentive (Murphee 2000). Among the canonical principles of CBNRM are that the unit of proprietorship should be the unit of production, management, and benefit, and these should be as small as practicable within ecological and socio-political constraints (Murphee 1991). Other rules of thumb dictate that community structures should be no larger than that which can meet face-to-face under a large tree (Dalal-Clayton et al. 2003).
It may therefore seem paradoxical that the local management scale has also been cited as a cause for the limited effectiveness of CBNRM. Localized management bodies often have limited financial and technical resources to create and implement resource management plans (Bradshaw 2003). Resource constraints can result in an overreliance on volunteers, who may lack specialized skills, are prone to burnout, or may seek to co-opt project resources for personal gain. Alternately, local management bodies may require significant levels of external assistance from NGOs or a government body, which can result in dependency or the imposition of an
28
external agenda (Newmark and Hough 2000). Other authors, however, suggest that these ‘problems’ are actually a reflection of the primary achievement of CBNRM: bringing local communities into a global world, both in terms of practice and narrative, thus softening the institutional and discursive boundaries of the ‘local’ (Rodary 2009).
More fundamentally, local management bodies tend to focus on local problems and opportunities, which can blind them from seeing larger trends or the links to the larger social context including policy issues (Hughes and Flintan 2001). This tunnel vision can result in management practices that sanction local users while largely ignoring larger threats such as migration, penetration of urban markets, land use change, and climate change (Barrett and Arcese 1995). Alternately, local management may simply displace environmental degradation to adjacent areas, creating a kind of conservation “leakage” (Hughes and Flintan 2001). Even if connections to larger problems are seen, local bodies may lack the technical and political capital to engage at higher political levels where important policy decisions on ecosystem management are made (Bradshaw 2003).
Similarly, local management bodies are often not well positioned to provide continuity and coherent management across relevant ecological scales, both spatial and temporal (Murphee 2000). This limitation is particularly important in heavily modified systems or where wildlife and other resources are unevenly distributed over a large area as is typical with park buffer zones. As conservation programs increasingly orient and market themselves around the provision of a broader set of ecosystem services, such as watershed protection and carbon sequestration, this mismatch in institutional and ecological scales will be even more noticeable (McDermott-Hughes 2008).
Sustainability
Sustainability has been a central concern of both rural development and conservation, it is therefore not surprising that many critiques of CBNRM focus on its environmental, economic, and social sustainability, the so-called triple bottom line. The history of sustainability as a discourse is in itself an interesting story, which I do not review here, but even the recent history of conservation reveals how the concept has co-evolved with neoliberal values regarding who and what should ‘pay for itself’, as well as recent shifts in thinking about the dynamic qualities of biodiversity, ecosystems, and culture.
Economic Sustainability
Most authors are quick to note that few if any CBNRM programs have demonstrated economic sustainability. Even in relatively well-funded and well-managed areas in Zimbabwe, with high-value resources, low human population densities, and well-developed tourism markets, far more money has been spent ‘priming the pump’ than has been actually generated by the program (Taylor 2009). Programs which aim to conserve resources that are biologically rich but of little economic value are even more likely to need long-term external support, as are programs that concentrate on transforming or replacing environmentally unsustainable livelihoods, (Hughes and Flintan 2001).
29
Most CBNRM programs have little hope of being completely self-sufficient financially, with possible exceptions being those constituted around a mass market model (WCS 2008) or connected to a high value tourism asset such as a flagship park (Dalal-Clayton et al. 2003). Many community-based tourism ventures will only generate a net profit under extremely favorable market conditions, and their ability to remain viable during ups and downs in the market is highly questionable (Murphree 2003), although safari hunting is more robust than other segments of the tourism market (Taylor 2009). Even when specific enterprises may eventually operate in the black, the time frame for reaching economic self-sufficiency is difficult to predict due to lack of systematic rigorous data, and may exceed the typical project cycle.
Given that conservation rarely covers its costs (Balmford et al. 2003), conservation organizations recognize the need for long-term subsidizes and are looking at longer term financing options such as endowments and emerging markets for ecosystem services (e.g., REDD). Although international markets can generate significant streams of funding, financing conservation through tourism or carbon markets is a source of concern (Newmark and Hough 2000). Foreign investors are often risk intolerant, and many industries connected to foreign markets have high rates of overhead and profit leakage out of the country.
Low prospects of economic sustainability can pose real risks for CBNRM projects that secure local ‘buy-in’ by promising livelihood gains. The loss of donor funding or access to markets can quickly sour local attitudes towards conservation (Hackel 1999), resulting in a resumption of extractive practices (Oates 1999) or angry calls to “give us back our guns!” (Lyons 2004). More fundamentally, protecting biodiversity for its utilitarian values dilutes other rationalities for conservation including moral imperatives and aesthetic values (Oates 1999).
Socioecological Change and Resilience
Even within a relatively short time frame, the context within which CBNRM programs operate can change dramatically (Lyons 2004). Another line of analysis popular with CBNRM scholars concerns the degree to which CBNRM is equipped to respond to changes in ecological and social conditions.
Barrett and Arcese (1995) question the wisdom of basing conservation strategies on the introduction of sustainable use schemes, given the natural variability and uncertainty of wildlife populations. They doubt whether it will be politically viable for local managers to reduce or suspend harvests during drought years when wildlife populations are stressed but the demand for meat and income is highest. The ‘boom and bust’ economic cycles associated with resource based industries may drive both established and new residents to continue harvesting plants and animals to reduce risks and smooth out the bumps in their income flows (Noss 1997). To make matters worse, long-term range reductions and the ever-expanding demand for meat and wood products in urban areas will only continue to reduce the biological viability of sustainable use (Barrett and Arcese 1995).
Looking further into the future, McDermott-Hughes (2008) questions whether the economic activities that form the foundation of CBNRM today will be viable in an era of climate change where protecting the atmosphere may not be fully compatible with protecting the local. In addition to a greater demand, and thus profitability, of land for biofuel plantations, a warmer
30
climate is likely to produce greater variability in food production, increasing numbers of highly mobile ‘ecological refugees’, and reduced numbers of tourist and safari hunters (McDermott-Hughes 2008).
Inherent Contradictions and Undermining the Conditions of Success
Another set of questions concerns the ways in which CBNRM may actually undermine the conditions of its own success. In many case studies, hype from the launch of externally initiated CBNRM generated a tremendous amount of enthusiasm and optimism. Policy reforms promised to devolve management authority to local communities and reallocate distribution of financial benefits. Donor-funded projects similarly promised to provide a variety of material goods and services. Communities therefore expected tangible benefits to materialize in the short term, however more often than not, programs could not deliver on their promises, triggering a backlash of disappointment and even opposition to CBNRM (Songorwa 1999; Shackleton et al. 2002).
Other authors have pointed out how even successful CBNRM, or perhaps especially successful CBNRM, can erode the foundations of its own success. Neumann (1997) for example notes the irony of attempting to ‘modernize’ rural areas with the introduction of tenure reform, market expansion, and new infrastructure, in order to create communities that live in harmony with their environment. “Their lifestyles must allow them to do what immigrants and, significantly, Westerners, cannot — produce and reproduce in an ecologically benign way” (1997:566). The few studies that have examined how local people who receive benefits from CBNRM programs manage their new wealth show a strong pattern of investment in agricultural production, including the expansion of arable land (Bond 2001).
Successful CBRNM can also trigger an influx of new migrants, attracting individuals drawn by the possibility of employment, agricultural subsidies, or social services provided by conservation projects (Newmark and Hough 2000; Noss 1997; Wittemyer et al. 2008b; Angelsen and Kaimowitz 1999). New migrants however may not share the same conservation ethic, may not be subject to the same social pressures as long term residents, and thus be more willing to break rules. Conversely, migrants may also feel marginalized in the structures of local governance, and respond with subversive strategies including ‘clearing to claim’, sabotaging the resource, or undermining the program politically (Dzingirai 1996; 2003; Unruh et al. 2005).
Project Perspectives
The bulk of literature on CBNRM focuses on one or more of the themes outlined above, questioning the socioeconomic and ecological outcomes, design of CBNRM programs, local context, scale, role of external actors, and sustainability. A link in the chain which has been much less scrutinized is that which lies at the intersection of inputs, outputs, and context, namely the project itself.
Although grassroots pressure and innovative leadership at specific sites have pushed the CBNRM agenda upward, CBNRM has in general not emerged via an organic process of spontaneous self-organization at the local level. The vast majority of CBNRM programs have been designed and driven by organizations based outside the project area (Shackleton et al.
31
2010). In some cases pilot projects led to policy reform (e.g., ADMADE in Zambia), while in other cases policy reform came first and was extended to communities (CAMPFIRE in Zimbabwe). But in all cases the codification of formal CBNRM policy has always occurred at the center, often with only nominal input from communities (Hughes and Flintan 2001), and the key to understanding the performance and possibilities of CBNRM is understanding the social relations within this web of actors (Blaikie 2006b).
Implementing a policy as potentially transformative as CBNRM, whereby rights and responsibilities are shifted downward sometimes to entirely new organizational structures, entails a number of tasks that have been mostly filled by projects. Establishing formal local management structures for example requires organizing community meetings, holding elections, developing bylaws, and training the local leadership about their new responsibilities. Additional activities are then needed to give the new structures some teeth, including technical training, communication campaigns, enforcement, auditing, and facilitating collaboration with government and private companies (Dalal-Clayton et al. 2003).
While implementing CBNRM policies could be accomplished through any number of mechanisms (Kiss 2004), many donors have a preference for project structures administered by NGOs, private consulting firms, or academic institutions. Projects implemented by these types of organizations are considered to be more capable and accountable than comparable units within government, tolerate tighter financial and programmatic controls, permit donors to claim credit for specific outcomes, and stabilize alliances with powerful lobbying interests in home countries (Sayer and Wells 2004). USAID in particular has shown a preference for supporting CBNRM in southern Africa through project structures, and has channeled most of its financing through projects managed by large international NGOs and consulting firms, notably WWF (ADMADE in Zambia, CAMPFIRE in Zimbabwe, LIFE in Namibia), WCS (ADMADE), Chemonics (Natural Resource Management Project in Botswana), and DAI (COMPASS in Malawi).
Project Contradictions in CBNRM Literature
Despite their favor among donors, projects are often the subjects of critiques. Many CBNRM papers make reference to project related issues, but with different levels of empirical detail and theorization. ‘Thinner’ papers typically note the problems and apparent contradictions of projects, but the project remains a black box and is often referred to as a singular actor with little detail about internal processes. Thin papers also often compare uncontextualized case studies or use speculation to discuss the underlying factors that drive project behavior. ‘Thicker’ papers offer more empirical evidence of the internal organizational dynamics of projects, view projects as sites where different actors interact rather than functioning like an actor itself, and frame the causal mechanisms in terms of social theory that examines the relationship between power, knowledge production, discourse, and overlapping webs of social relations. Below I review a selection of issues and arguments related to project performance presented along a coarse gradient of the source material from ‘thin’ to ‘thick’.
Among the contradictory outcomes often noted by reviews of project mode conservation are the production of boom-bust cycles, development of dependency syndrome, magnet effects that draw additional people to conservation areas, creation of expectations that can not be met, and a perceived lack of local ownership (Kiss 2004; Newmark and Hough 2000; Songorwa 1999;
32
Sayer and Wells 2004). Many authors have commented on a set of problems which seem particularly endemic to donor funded projects. Externally funded projects tend to suffer from lengthy planning processes that result in inflexible management plans and fixed budgets that aren’t able to respond quickly enough to dynamic contexts (van Schaik and Rijksen 2002). Projects funded by donors often have an additional requirement of ‘showing impact’ within a pre-defined time period, pushing projects to speed things along by bringing in external consultants unfamiliar with the local context (Hughes and Flintan 2001). After all of the support missions, planning activities, and administrative overhead, there might not be much left of the budget for the communities (Songorwa 1999).
A common obstacle in CBNRM programs is the difficulty of controlling and guiding the behavior of organizations, particularly bureaucratic and local institutions, within a complex environment of competing goals and interests (Kellert et al. 2000; Marks 2001). Many jurisdictions adopt a bureaucratic approach in response to high levels of complexity, which can in turn obscure or distort how resources for CBNRM are applied in practice (Murphee 2000). In other cases, a ‘commandist’ approach is taken as a way of dealing with local opposition (Songorwa 1999), or developing the bureaucracy of local institutions becomes an end in itself to the detriment of management activities (Kellert et al. 2000). The dominant worldview, organizational culture, and preferences for scale can also make CBNRM institutions fundamentally ‘misfit’ to deal with the scale of the resource system and range of stakeholder interests (Brown 2003).
Other authors have documented the process though which CBNRM became institutionalized in influential conservation organizations. Alcorn (2005) and Coward (2005) chronicle the internal debates, institutional context, and individual actors who were instrumental in making community based approaches to conservation become mainstream in WWF and Ford Foundation respectively. Bonner (1993) also maps the personalities and relationships in the internal debates around WWF’s official policy towards an ivory ban, illustrating how opportunism and power dynamics trumped equity, and the historical realities of elephant conservation in East Africa.
While many papers point out the problems and contradictions of the institutions that implement CBNRM, fewer have attempted to tease apart the processes that shape institutional behavior. Although a large body theory and methods have been developed to understand the interactions of people engaged in collective action, it has often been noted that conservationists have in general not been quick to employ the perspectives and tools of social science (Barrett and Arcese 1995; Campbell and Vainio-Mattila 2003; Wells et al. 1992; Agrawal and Ostrom 2006; Mascia et al. 2003; Brechin et al. 2003).
There is a long tradition (e.g., Lee 1984) of understanding conservation processes and outcomes by viewing conservation practice not merely in reference to ecological principals and the technology of management, but as fundamentally an interplay of social relations. In recognition of the need to move beyond merely pointing out where projects go awry toward actually understanding the processes through which projects become reconfigured, several authors have issued calls for detailed, ethnographic case studies of community based conservation and development projects (Brosius et al. 1998; Watts 2001).
33
Since these early calls, the tools and frameworks for contextualizing conservation within a broader network of institutional relations have become well established (Brosius et al. 2005). Several authors have sought to unmask the inner workings of conservation projects. Gibson (1999) for example employs the politics of structural choice to view conservation projects not as internally coherent bodies for the mechanical implementation of policy, but as a terrain of struggle where disparate actors negotiate for a piece of finite resource pie. This perspective helps explain why the two founding CBNRM projects in Zambia, ADMADE and LIRDP, made choices that provided autonomy and insulated themselves from political uncertainty, but at the cost of compromising their core principles.
Corson (2008) extends this lens to a transnational conservation network connecting Malagasy villages, state agencies in Antananarivo, USAID, and international biodiversity NGOs. Using a multi-site ethnography, she documents the micro-politics of power within and between bureaucracies to explain how conservation and development practices and ideas are created, negotiated, and translated within the network in a way that ultimately reduces the opportunities for local communities to be involved in conservation.
Development Ethnography
Opening the Black Box of the Project
The emerging literature from the development ethnography in particular offers a rich conceptual apparatus and toolbox of methods to parse out the dynamics of project-based interventions. A central insight in development ethnography is the understanding that the core business of projects is not merely what they do but also the production of particular constructions of knowledge and maintenance of key allies on whom the project depends (Lewis and Mosse 2006). Development ethnography studies have, for example, unmasked the tendency of development projects to de-politicize what are inherently political processes (Ferguson 1994), incorporate ambiguity into policy models in ways that guarantee “success” (Mosse 2005), and compromise on operational details in order to secure cooperation and support at other levels (Li 1999).
The opening move for development ethnography is to see projects not as black boxes, organograms, or even logframes, but as nested sites of interaction between actors differentiated by social position, authority, and credibility. Once the outer façade is removed, many insights into the seemingly contradictory behavior of projects can be gleaned. For example an understanding of the internal dynamics exposes the fissures between the official programmatic mandate and the operational logic, which determines behavior on a daily basis. While the broader policy context legitimates the existence of the project and enables it to operate in the first place, broad policy goals rarely offer much guidance on the practicalities of day to day activities (Mosse 2005). The operational logic, on the other hand, is shaped by organizational culture, local context, and agency of individuals. The outcome of this interplay is often a double-set of transcripts, the official public transcript to which the project must always profess and validate, and a set of shadow or ‘hidden’ transcripts that reflect what’s really going on (Scott 1990).
34
Projects Need Partners
A second insight of development ethnography is the significance of the broader set of institutional relations in which a project is embedded, and the contingency of the project’s fate on those relations. Without a complete suite of cooperative ‘partners’, including a patron, clients, and any other gatekeepers whose consent and cooperation is needed for the project to perform its work, the project will simply cease to function and wither away into nonexistence. In this sense, projects need not only donors but also communities, as much as, if not more than, the community needs the project. Once communities realize their power of legitimation, as an adjunct to other defacto forms of veto power, the operational logic within the project may shift from the official ideological endorsement of local participation to an acceptance of the necessity of nitty-gritty negotiations that take place under the radar of visiting delegations (Mosse 2001).
The importance of maintaining networks of allies helps explain why the policy models that gain the most traction are precisely those that are mutually enabling for a broad range of actors. This perspective is a far cry from the traditional criteria of good policy as that which brings clarity and predictive capacity for social interventions. On the contrary, the most enabling policy is one which is compelling but ambiguous, malleable, and able to legitimate rather than orient practice (McNeill 2006; Mosse 2004). Thus most policy ideas that ‘catch on’ are imbued with ‘master metaphors’ such as participation and good governance, whose moral and popular appeal place them above criticism, but can be broadly interpreted to serve a variety of institutional needs (Cooke and Kothari 2001; Mosse 2005).
Narratives
The policy models so important for linking interests are founded upon narratives, stories about how the world works which function not as empirically grounded models of reality but as parsimonious caricatures that simplify complex interactions into digestible bites. Despite the selective and often strategic removal of certain details, narratives do not seem overtly ideological in that they don’t prescribe what should happen, but indicate simply what will happen in a given series of events. Their seemingly neutral tone and apolitical framing makes them invisible, and thus incredibly potent, in policy debates, especially those that are so engrained in culture they no longer need to be told (Roe 1991).
The second source of power of narratives lies in their ability to enable development actors to contend with the uncertainty and ambiguity inherent in development (and conservation) work (Roe 1991). Although understandings that are more nuanced and empirically grounded may offer stronger explanatory power, decision makers seek out framings that simplify, not complexify, decisions. Decision makers fall back on narratives for guidance when the system is too complex or too poorly known to make a more contextualized response. Likewise, in systems where institutions and claims are ambiguous or actively contested, the decision making process may be dominated by the positioning and counter-positioning of narratives (Fortmann 1995).
The role of narratives in simplifying decision making partially explains why narratives like the tragedy of the common remain so steadfastly dominant in public policy even in the face of mountains of empirical evidence and analytical arguments highlighting faulty assumptions and erroneous conclusions. The best way to displace a dominant narrative may therefore be not
35
to try to poke holes in it with countervailing evidence, but to develop a counter-narrative that is equally serviceable for policy makers (Roe 1994; Fortmann 2005).
There are other reasons why policy makers may prefer simplifying narratives over better understandings of empirical complexity. When positions are based not different understandings of a system but different values and preferences for scale, the discursive domain may be the more fertile arena for interaction. In other words, individual interests may be better served not by closing the gap between rhetoric and reality, but by improving the position of narratives relative to alternative narratives. Büscher and Dressler (2007) describe this dynamic in the ‘back to barriers’ debate where the battle of ideas over whom should govern and at what scale has largely taken place within a layer of ‘discursive blur’ where viewpoints compete with each other rather than what takes place on the ground. The domain of discursive blur also opens other spaces where allied discourses can be inserted and fused, producing hybrid discourses such as the many varieties of green neoliberalism (Hajer 1995; McCarthy 2006; Büscher and Dressler 2007).
A good narrative that supports a project's policy model is a valuable ally, however narratives must be constantly reproduced and defended lest they lose ground to counter-narratives and alternative interpretations. To engage effectively in the discursive arena, the management toolbox must include tools from art and literature, as well as science, because rarely, if ever, can projects completely engineer outcomes with any certainty. What they can control to a large degree, however, is the interpretation of events in ways that concur with the policy narrative.
The Social Construction of Success and Failure
The dependence of projects on their allies sheds light on another process central to the understanding of CBNRM, the social construction of success and failure. Whether a project is deemed successful or not depends critically on the ability of the project to position itself favorably within its web of relations (Mosse 2005). Success and failure is therefore never inherent in the beginning, but always contingent upon projects success in recruiting and maintaining allies, broadly defined (Latour 1996). Achieving mandated outcomes, normally considered the yardstick of success or failure, can be one way to secure and maintain key allies, but there are have many examples where views of a project become disconnected from what does or does not take place on the ground.
Development ethnographers have shown that the common interests among actors associated with development is often, more than outcomes, a policy model or narrative that enables a broad range of actions. Project staff must therefore constantly translate outcomes and events into policy models that support allies and disable foes (Latour 1996). The act—or art—of translating outcomes to its ‘interpretative communities’ is what determines whether the project receives the label of ‘success’ or ‘failure’ (Mosse 2005). When this translation does not occur, allies lose interest in the fate of the project, become disengaged, and the project is said to have failed. Yet when viewed as simply a part of a broader matrix of institutional interests and organized activity, the failure may be less of a failure to implement the plan than it is a failure of translation (Latour 1996). A more nuanced depiction of the process recognizes that, “projects do not fail, they are failed” by their wider networks of support and validation (Mosse 2005; Latour 1996). Hence the core business of everyone in the project is not simply the suite of activities
36
indicated on the workplan, but also the production of specific forms of knowledge and representation that serve to reproduce its reputation and credibility within a shifting terrain of institutional relations (Mosse 2005).
Managerialism
Complementing development ethnography’s insights into the centrality of knowledge production and maintenance of networks of allies as two of the driving forces of project behavior, another stream of inquiry has examined the evolution of management styles and their effects on project dynamics. Of particular note among these trends has been a rise in managerialist practices, a specific form of organization that accentuates centrist managerial control, efficiency, and functional accountability. Within projects, managerialism is often recognized by it trademark tools: strategic planning, logical framework analysis, quantifiable performance indicators, and evaluations that focus on outputs and efficiency. Lying beneath these practices, managerialism acts as a discourse that privileges certain forms of knowledge, defines the form and direction of accountability, and determines who may claim the right to govern.
Modern managerial practices first became mainstream in corporations in the mid-1970s when a post-Fordist business climate and increasing global competition produced a need for greater efficiencies (Flynn 2000). Corporations sought to increase profits by reorganizing modes of production to shorten cycles, reduce labor costs, and take advantage of technological innovations. Guiding the restructuring of corporations was the rise of a set of managerial practices that replaced professionalism and traditional bureaucratic modes of control with new ‘people-focused’ approaches that sought to incentivize labor through a corporate culture that emphasized commitment and competition over supervision and compliance (Clarke and Newman 1993). Undergirding this shift was a discourse proclaiming a universal set of managerial practices as being the optimal way to organize any organization in any sector. Embedded in the managerial discourse was a another shift in who had the right to run businesses, with labor and professionals losing ground to a new class of credentialed ‘people’ managers (Clarke and Newman 1993).
It did not take long for corporate managerialism to seep into the public sector. Fiscal crises struck many countries in the 1980s, spawning a call for greater efficiency in the administration of public services (Flynn 2000). Reforming public sector agencies became an important plank in a populist political agenda, with many political candidates presenting themselves as champions of the people working against their own government bureaucracy. The corporate world was a natural place for reform minded politicians to turn to for ideas on improving efficiency in public service. Politicians have always looked to the private sector for innovation, and the 1980s in particular were an era in which the decline of the Soviet Union appeared to validate the intrinsic superiority of the organizing principles of the market over command and control economies (Flynn 2000). While even the boldest reformers never claimed efficiency gains in the public sector alone would solve the fiscal crises, reforming bureaucracies and ‘cutting red tape’ served as important symbolic gestures to show that government was serious about improving national competitiveness and making public sector agencies more accountable to taxpayers (Flynn 2000).
37
Although presented as a technical improvement based on input from neutral management experts, managerialism involves several changes that shift the balance of power away from professionals and traditional lines of public authority towards the prerogative of managers (Clarke et al. 2000). Reengineering work processes and eliminating unnecessary regulations gave the appearance of producing a lighter, more efficient system of administration focused on the needs of ‘customers’, but it also created a legitimizing discourse and mechanisms through which managers could exert control at a distance and central government could force change in rogue agencies and sub-national units of government (Jenkins 1995, quoted in Flynn 2000).
The rhetoric of efficiency requires the quantification of output (Flynn 2000), managerial systems thus place heavy emphasis on quantifiable measures of outputs and outcomes. Similarly costs, including the allocation of labor, must be tracked closely and justified to show improvements in efficiency. The positioning of efficiency as a primary metric of organizational credibility challenges employees and units within an organization to justify their existence in term of short term quantifiable gains, and provides a legitimizing discourse to introduce a variety of organizational transformations (Clarke and Newman 1993).
The dynamic interplay between organizational culture and managerial practices also affected the pace of adoption of managerialism and the ability of government to tackle complex problems. Managerialist practices presume organizations to consist of chains of low-trust relationships that must be linked by highly formalized contractual practices (Clarke et al. 2000). This presupposition makes managerialism a particularly poor fit when imposed upon organizations that function through relations of trust and reciprocity, common in emerging economies (Desai and Imrie 1998). Relationships between organizations also become more formalized and contractual, based on a calculus of intra-organizational ‘business interests’ as defined and narrowed through process of mission statement development and strategic planning (Clarke et al. 2000). While more focused institutional mandates has arguably made organizations more effective at their ‘core business’, this perspective poses challenges for dealing with social problems that are inherently inter-sectorial and collaborative, such as poverty alleviation and environmental management.
Given the mixed reception of reforms under the rubrics of ‘Reinventing Government’ and the ‘New Public Management’, many scholars caution against presuming too much coherency in the highly uneven process through which the bundle of processes known as managerialism were adopted (Clarke et al. 2000; Desai and Imrie 1998). While many agencies adopted managerial practices in varying degrees, other departments, particularly those with strong traditions of professionalism, responded with resistance, adaption, and cooption (Clarke and Newman 1997). The uneven rollout of managerial practices has led some scholars to suggest that managerialism is best thought of a meta-language of terms and concepts that get reconfigured in specific contexts to legitimate a variety of local claims on the right to govern (Lynn 1996), or perhaps more succinctly as bundles of knowledges and practices associated with formalized organizational management (Roberts et al. 2005:1846).
The diffusion of managerialist practices did not stop at the public service sectors in the global north. Driven by claims of a single best way to run the functions of the state, bureaucratic reforms were built into loan agreements and structural adjustment packages by bilateral and multilateral institutions (Flynn 2000). As in the public sector agencies in the north, the
38
imposition of managerialist reforms through foreign aid produced mixed results, and were frequently resisted or transformed by local norms, values, and rent-seeking bureaucrats (Desai and Imrie 1998).
Managerial practices were also adopted by many NGOs, whose role in foreign aid expanded dramatically in the 1980s and 1990s both in volume and scope. From the 1970s to the 1990s, the proportion of foreign aid from OECD countries that was implemented through NGOs grew several fold, and tax-based funding overtook private donations as the largest source of NGO funding (Edwards and Hulme 1996; Fowler 2000). The adoption by NGOs of corporate styles of management was both a response to the expectations of donors, as well as part of broader process of ‘corporatization’ that many international NGOs went through during this period (Roberts et al. 2005). As with the public sector reforms, the introduction of managerialist practices in NGOs was mixed, resulting in many changes in administrative practice and the logic of progress, but also adaptation, cooption, and hybridization with older systems of organization (O'Reilly 2010; Townsend et al. 2004).
Many authors have described unanticipated and undesirable consequences of managerialism in NGOs. The emphasis on accountability and efficiency rewards NGOs for demonstrating short-term, quantifiable change, thus pushing programs toward a narrow suite of short and easily measured interventions such as micro-credit (Townsend et al. 2002). Outcomes that are more qualitative or long-term, such as empowerment, cohesion, or watershed management, are more difficult to measure and are therefore rendered less important under the new metrics (Edwards and Hulme 1996). Issues affecting women in particular can be sidelined under managerialism, or reduced to easily measurable indicators such as number of women in various roles, as gender relations are not easily quantified and managerialism tends to promote hierarchical organizational models in which women are at a disadvantage (Edwards and Hulme 1996). Although some NGO networks have made use of more robust systems of monitoring and measurement to explicitly incorporate structured learning into program design (Roberts et al. 2005), more often than not the greater degree of formalism serves to stifle innovation (Fyvie and Ager 1999; Edwards and Hulme 1996).
Managerial practices also impinge strongly on the scope and direction of accountability within NGOs. Fully developed organizational accountability acts both internally—creating a space where an organization can reflect upon how well is has remained true to its core values and membership—as well as externally (Ebrahim 2003). Well-rounded external accountability is directed both upward to an organization's donors and trustees, as well as downward to its clients and members (Najam 1996). Accountability should also be both functional in scope, pushing the organization to take responsibility for material and human resources to which it has been entrusted, as well as strategic, questioning the broader and possibly unforeseen impacts of its work (Ebrahim 2003). Managerialism, however, emphasizes a very narrow slice of organizational accountability, specifically functional accountability that is external and upward, which some argue is more akin to ‘accountancy’ than true ‘accountability’ (Edwards and Hulme 1996).
The narrow scope of managerial accountability can radically shift the locus of power within an organization. Accountability can become an end in itself, promoting those individuals with the skills and access to harness the apparatus of knowledge production into a new class of
39
information gatekeepers (Townsend et al. 2002; Roberts et al. 2005). The locus of power may even shift completely outside the project, as donor planning procedures and reporting requirements can be so complicated as to require direction from development agency staff and external consultants (Sayer and Wells 2004). The resulting shifts in who defines the agenda and has input into major decisions can diminish the degree of local ownership, a slippery slope that often ends in a set of activities that are irrelevant and fail to produce intended results. Unfortunately project leadership may not even be fully aware that the project has gone off track or become unpopular, because managerialist accountancy minimizes opportunities to gain a more holistic perspective of itself and broader impacts.
The adoption of managerialist practices has been especially problematic for NGOs seeking to empower the poor. The emphasis on upward and external accountability fundamentally shifts the basis of legitimacy and moral credibility from one grounded in civic rootedness to one based on an association with the public domain (Edwards and Hulme 1996; Fowler 2000). NGOs that were established for the purposes of social justice and advocacy have turned into service providers for government and donors; thus they are no longer seen as working with the poor but working for the poor (Miraftab 1997). The shift from advocacy to service provision may actually work against the goal of empowerment, as the accountability mechanisms in service delivery schemes tend to reproduce relationships with highly imbalanced accountabilities that can result in patronage and abuse of power (Ebrahim 2003; O'Reilly 2010). The number of contradictions within international development programs using managerialist practices has led some critics to charge that the real effects of anti-poverty programs are not more effective poverty alleviation campaigns but making poor people and NGOs themselves more governable by the State (Townsend et al. 2002).
Beneath shifts in bureaucratic rules and structure, managerialism operates at a deeper discursive level, shaping fundamental understandings of the ultimate causes of—and thus solutions to—environmental degradation and poverty. Discourses generate their power through their ability to focus certain forms of understanding while filtering out others (Hajer 1995). In defining the standards for the measurement of change, managerial knowledges also reproduce a particular interpretation of reality, and in so doing "define various forms of agency, administer certain silences, and prescribe various forms of intervention" (Brosius 1999:278).
The complicated practices of strategic planning, logframe analysis, monitoring and evaluation consolidate official knowledge production to a small number of actors with the technical skills and social position to be part of the privileged 'information loops' that emanate from the center. Managerial knowledges allow these loops to function as 'transmission belts', whereby resources and authority flow from the core to the periphery and legitimating information flows from the periphery back to the core (Tvedt 1998). These closed loops, driven by managerialist practices, are the chief mechanism through which development 'fashions' are dispersed and colonize new spaces far from their areas of origin where not surprisingly they are often poorly matched to the local context (Townsend et al. 2002).
Among the fundamental discursive shifts to which managerialism has played a constitutive part is the long-term depoliticization of the diagnoses and interventions in development and conservation (Ferguson 1994). Through a technocratic language of 'optimizing institutions', 'bridging gaps', and 'strengthening capacity', managerialism masks the political
40
nature of development interventions that reallocate resources, legitimize and delegitimize claims, and reconfigure relations of power at multiple scales. NGOs also benefit and contribute to the depoliticization process whereby development "problems" are constituted in such a way as to require technical expertise and NGO assets outside of the realm of political solutions (Fisher 1997). Conservation problems and solutions are also often framed in anti-political terms, couched in the technical language of ecoregional planning, indices of biodiversity, and entry requirements of supposedly apolitical international markets for ecosystem services (Brosius and Russell 2003; Büscher 2010).
Logical Framework Analysis
Bilateral donors were among the earliest adopters of managerial planning and implementation approaches. Logical framework analysis (LFA) has been widely used to structure planning and reporting by many donors including USAID. The LFA process pushes project planners to articulate their goals, strategy, and means of monitoring and verification (Sartorius 1991). The culmination of the planning process is the logframe matrix in which the rows represent a hierarchical structure of goals, objectives, and activities, and the columns represent indicators, means of verification, and assumptions. A number of participatory methodologies and decision making tools have been developed to help groups develop logframes, including stakeholder analysis and problem trees (Couillard et al. 2009).
USAID developed LFA in 1970 in response to calls from the US Congress for greater accountability. Initially the framework was widely used within the agency, but its unwieldiness and lack of guidelines made it unpopular and it was largely abandoned within the agency by the late 1970s (Sartorius 1991). LFA experienced a new surge of popularity in the late 1980s when new wave of criticisms about the accountability of development assistance program spewed out from Congress.
In 1995, USAID, having heard the broader call to 'reinvent' government (Osborne and Gaebler 1992), initiated its 'Reengineering' program, a comprehensive set of management reforms centered around five core values: customer focus, managing for results, accountability, teamwork and participation, and diversity (Brown et al. 1996). Washington demanded its missions abroad adopt new management practices and develop results frameworks and performance monitoring plans at both the portfolio and project level. A series of guidelines were issued describing how to develop monitoring matrices, establish performance targets, design evaluations, and collect data (CDIE 1996). By imposing management requirements further and further down the food chain, USAID and other donors were able to maintain tighter control on the burgeoning armies of NGOs that arose in response to funding opportunities to provide social services that had previously been filled by the state.
Since its debut in the early 1970s, LFA has been widely adopted by government, NGOs and industry. Throughout this expansion, the approach has undergone many adaptations and modifications; there have been at least three distinguishable generations of LFA plus a millennium edition (Couillard et al. 2009; Sartorius 1996). While logframe tools have given groups and multi-organizational alliances a common language and planning framework to design projects, the approach has also been the subject of critique, much of which is particularly germane for conservation and development contexts.
41
LFA emerged from corporate and military planning systems characterized by a strong central authority and a relatively clear set of goals (Gasper 2000). Whether these conditions are often met in conservation contexts is doubtful, particularly in multi-organizational programs where clear consensus on priorities may not exist. Logframes privilege the information needs of busy managers by simplifying the interactions of the project, but this simplification can be a disservice to the project when the logframe is taken as not just a crude visual representation of a more complicated process but the essence of the project design itself (Gasper 2000). LFA also presumes that outcomes can be defined and provided for at the beginning, and may be achieved within a fixed time frame, presumptions that may hold in some settings but are more often than not at odds with the complex unfolding of community-based conservation projects (Murphee 2004).
While a key function of LFA is to make projects more accountable for expected results, project ethnographers have shown how project planners continue to find ways to keep escape routes open. In many projects, planning and implementation are intentionally performed by different groups, allowing each party to blame the other if something goes awry (Biggs and Smith 2003). A second escape valve lies waiting in the ‘assumptions’ column of the logframe, which is often written in terms that are broad and easily violated. While project personnel may not be able to control the local context nor the trajectory of their activities, through such escape valves they can almost always influence the interpretation of events and massage causality in ways that preserve the cohesion of the project model rendered in the logframe (Biggs and Smith 2003; Mosse 2005).
Logframes play a central role in structuring a host of managerial practices. The process of developing a logframe is in itself highly technocratic and abstract. It requires abilities to simplify complex interactions into a nested hierarchy of discrete 'results', define performance indicators which are SMART (Specific, Measurable, Achievable, Relevant, and Time-Bound, Doran 1981), employ quantitative models to develop sampling protocols and set performance targets, and articulate assumptions that sound plausible but still preserve an important safety valve, all using the specific terminology of results based programming. The artistic counterpoint to the technical material is to deliver in the end an ambitious package that concurs with donor interests, time frame, and dominant narratives (Mosse 2005). This complicated process completes one of the first effects of managerialism, namely concentrating official project representation and knowledge production in a privileged information caste of project planners, consultants, and M&E officers.
Next, results-based programs such as those demanded by USAID, require virtually all activities to be pre-approved on a workplan, which itself is structured by the logframe, and beholden to report according to pre-defined indicators. In many projects, evaluations are also structured around the logframe, a practice which seals the representation of the project in narrow technical terms at the potential cost of missing unexpected consequences and broader impacts (Gasper 2000).
The adoption of managerialism in conservation NGOs largely mirrors the history of development NGOs. As with the traditional fields of development, conservation NGOs proliferated and expanded into new roles during the period of state contraction in the 1980s and 90s (Alpert 1994; Chapin 2004). In the US, a symbiotic relationship between USAID and
42
biodiversity NGOs (BINGOs) developed whereby the BINGOs lobbied Congress to support USAID’s biodiversity conservation programs, for whom the BINGOs were the primary contractors (Corson 2008). This relationship was enabled by legislative rules that enabled Congress to micro-manage USAID portfolios, and a broader set of governmental reforms that resulted in more programs being outsourced. Concurrently, the size of conservation grants given out by USAID grew while the number of program staff shrank, transforming the institutional relationship between USAID and conservation NGOs to that of a banker and client (Corson 2008). As biodiversity conservation programs increasingly took onboard social welfare objectives in collaborations with traditional development NGOs, conservation NGOs were further exposed to more systematic planning and evaluation methods.
Conservation organizations have had other reasons to adopt corporate style management. Many of the larger international conservation organizations underwent a period of expansion in the 1980s and 90s, seeking and receiving sponsorship from corporate as well as private and public sources (Chapin 2004). This effort brought additional resources and political clout through a more strategic approach to conservation planning, producing conservation strategies that were big, bold, and based on the best available science (Brooks et al. 2001). The corporatization of conservation, and conversely the greening of capital, is a trend continues that continues today as conservation NGOs collaborate with venture capitalists, banks, and investment firms to tap into the fledging markets for ecosystem services such as carbon sequestration (Schapiro 2010).
To satisfy their new corporate patrons’ calls for more effective conservation investments in an era of rapid environmental degradation, conservation organizatons have been pushed to develop more robust information systems. A variety of quantitative methods for planning and monitoring conservation investments have been developed at multiple scales ranging from individual sites (Margoluis and Salafsky 1998; Saterson et al. 1999), ecoregions (Groves et al. 2000; Sanderson et al. 2002), to multi-site project portfolios (Salafsky and Margoluis 1999a; TNC 2006). Like logical framework analysis, conservation planning approaches outline a systematic process that includes articulating specific goals and objectives, developing a conceptual map of the system, compiling a biophysical profile, defining indicators and benchmarks of progress, and integrating data collection and reporting into day to day operations.
Although the reforms in conservation planning and evaluation have been widespread, the quest for robust and replicable conservation models has not sat well for everyone. Some critics charge that evaluation methods in conservation still fall far short of the minimum standards for reviewing investments, and call for wider use of economistic evaluation tools including robust econometrics and analyses of the counterfactual (Ferraro and Pattanayak 2006). At the other end of the spectrum, social scientists express concern that the heavy use of rapid appraisal approaches, formalistic data collection methods, and technologies of visualization such as GIS are prone to missing important social processes, including the underlying factors that drive resource degradation and the ways in which the production and transmission of information can itself become a source of distortion (Brosius and Russell 2003). Conservationists also point out that many of the most important results of CBNRM are not easily quantified and could easily be sidelined in monitoring programs designed to capture short term quantitative change (Ashley 1998).
43
Summary
CBNRM has been and remains today a popular subject of scholars who use a wide array of theoretical frames to understand the performance of past and current programs and identify opportunities to make future conservation efforts more effective. The bulk of this literature examines outcomes of CBNRM policy, the design of programs, local social and ecological contexts, intersections with global politics and discourse, and issues of sustainability. However given that many CBNRM programs have been largely implemented through project structures under government, universities, and NGOs, an important piece of the puzzle that has not been widely investigated are the internal dynamics of projects.
Development ethnography offers a rich set of concepts, terminology, and questions to understand the underlying drivers that influence the behavior of actors within projects. The importance of a project’s network of supporters, both upward and downward, explains the constant work of everyone in the project to weld the interests of allies to the fate of the project. Some allies can be bought, but most are recruited through the reproduction of common narratives and policy models that are mutually enabling.
The study of managerialism, which originated in the corporate world before being taken up by public and non-governmental organizations, offers another lens which helps illuminate the bundle of incentives and disincentives under which projects function. Managerialism enables managers and administrators to control actions from a distance through the technocratic centralization of knowledge production, but at the cost of losing particular forms of knowledge and programmatic flexibility that is often vital for successful conservation. Managerialist practices are enmeshed with a broader discourse about what type of information is valid and who has the right to govern, but like any exercise of power it is never absolute and may be resisted, subverted, or co-opted. The double set of transcripts common in conservation projects, excessive time spent on monitoring and reporting, lack of local buy-in, and limited ability to capitalize on opportunities, are but a few of the contradictory behaviors in projects that are directly related to managerial practices.
The insights from development ethnography and study of managerialism are particularly helpful to understand CBNRM projects that are financed through the standard bi- or multi-lateral donor funding model. Projects that enjoy more than one source of funding, have a greater degree of autonomy, adopt a broader spectrum of accountability, or play a non-implementing role, may be more fruitfully examined with other frameworks. In the next chapter, I apply these lenses to a second generation CBNRM project in Zambia, CONASA, to help explain how and why a project that had such a promising beginning and did so much on the ground only lived for four short years.
References
Adams JS, McShane TO (1992) The myth of wild Africa. Norton, New York Adams WM, Hulme D (2001) If community conservation is the answer in Africa, what is the
question? Oryx 35 (3):193-200 Adams WM, Hutton J (2007) People, Parks and Poverty: Political Ecology and Biodiversity
Conservation. Conservation and Society 5 (2):147–183
44
Adams WM, Mulligan M (2003) Decolonizing Nature: Strategies for Conservation in a Post-colonial Era. Earthscan, London
Agrawal A, Gibson C (1999a) Enchantment and Disenchantment: The Role of Community in Natural Resource Conservation. World Development 27 (4):629-649
Agrawal A, Gibson C (1999b) The Role of Community in Natural Resource Conservation. In: Agrawal A, Gibson C (eds) Community and the Environment: Ethnicity, Gender and the State in Community-Based Conservation. Rutgers University Press, Rutgers, NJ.,
Agrawal A, Ostrom E (2006) Political Science and Conservation Biology: A Dialog of the Deaf. Conservation Biology 20 (3):681-682
Agrawal B (2001) Participatory exclusions, community forestry, and gender: An analysis for South Asia and a conceptual framework. World Development 29 (10):1623-1648
Alcorn JB (2005) Dances around the Fire: Conservation Organizations and Community-Based Natural Resource Management. In: Brosius JP, Tsing AL, Zerner C (eds) Communities and Conservation: Histories and Politics of Community-Based Natural Resource Management. Altamira Press, Walnut Creek, CA,
Alpert P (1994) USAID's expanded program to conserve biodiversity in sub-Saharan Africa. Ambio 23:167
Alpert P (1996) Integrated conservation and development projects: Examples from Africa. Bioscience 46 (11):845-855
Angelsen A, Kaimowitz D (1999) Rethinking the causes of deforestation: lessons from economic models. The World Bank Research Observer 14 (1):73
ASA (2010) ASA 2010 Annual Meeting Panel Description: The Politics of Living with Conservation in Southern Africa. African Studies Association, Piscataway, NJ
Ashley C (1998) Intangibles matter: Non-financial dividends of Community Based Natural Resource Management in Namibia. Living in a Finite Environment (LIFE) Program, World Wildlife Fund, Windhoek
Balmford A, Gaston KJ, Blyth S, James A, Kapos V (2003) Global variation in terrestrial conservation costs, conservation benefits, and unmet conservation needs. Proceedings of the National Academy of Sciences 100 (3):1046-1050. doi:10.1073/pnas.0236945100
Bandyopadhyay S, Tembo G (2009) Household Welfare and Natural Resource Management around National Parks in Zambia. Policy Research Working Paper Environment Department, The World Bank, Washington, DC
Barrett C, Arcese P (1995) Are Integrated Conservation-Development Projects (ICDPs) Sustainable? World Development 23 (7):1073-1084
Berkes F (2004) Rethinking Community-Based Conservation. Conservation Biology 18 (3):621-630
Biggs S, Smith S (2003) A Paradox of Learning in Project Cycle Management and the Role of Organizational Culture. World Development 31 (10):1743-1757
Blaikie P (2006a) Is Small Really Beautiful? Community-based Natural Resource Management in Malawi and Bostwana. World Development 34:1942-1957
Blaikie P (2006b) Is Small Really Beautiful? Community-based Natural Resource Management in Malawi and Botswana. World Development 34 (11):1942-1957
Bodmer RE, Lozano EP (2001) Rural Development and Sustainable Wildlife Use in Peru. Conservation Biology 15 (4):1163-1170
Bond I (2001) CAMPFIRE and the Incentives for Institutional Change. In: Hulme D, Murphee MW (eds) African Wildlife and Livelihoods. James Currey Ltd, Oxford, pp 208-226
45
Bonner R (1993) At the Hand of Man: Peril and Hope for Africa's Wildlife. Alfred A. Knopf, New York
Bradshaw B (2003) Questioning the credibility and capacity of community-based resource management. The Canadian Geographer 47 (2):137-150
Brechin SR, Wilshusen PR, Benjamin C (2003) Crafting Conservation Globally and Locally. In: Brechin SR, Wilshusen PR, Fortwangler CL, West PC (eds) Contested Nature: Promoting International Biodiversity Conservation with Social Justice in the Twenty-first Century. State University of New York Press, Albany,
Brooks T, Balmford A, Burgess N, FjeldsÃ… JON, Hansen LA, Moore J, Rahbek C, Williams P (2001) Toward a Blueprint for Conservation in Africa. BioScience 51 (8):613-624. doi:doi:10.1641/0006-3568(2001)051[0613:TABFCI]2.0.CO;2
Brosius JP (1999) Analyses and interventions. Current Anthropology 40 (3):277-310 Brosius JP, Russell D (2003) Conservation from Above: Imposing Transboundary Conservation.
Journal of Sustainable Forestry 17 (1):39-65 Brosius JP, Tsing AL, Zerner C (1998) Representing communities: Histories and politics of
community-based natural resource management. Society and Natural Resources 11 (2):157-168
Brosius JP, Tsing AL, Zerner C (eds) (2005) Communities and Conservation: Histories and Politics of Community-Based Natural Resource Management. Altamira Press, Walnut Creek, CA, USA
Brown K (2003) Integrating Conservation and Development: a Case of Institutional Misfit. Frontiers in Ecology and the Environment 1 (9):479-487
Brown K, Vondal P, Benya L (1996) Planning and Managing for Results with Teams, Customers, and Partners in the Reengineered USAID: Observations from the Field. U.S. Agency for International Development, Washington
Büscher B (2010) Anti-Politics as Political Strategy: Neoliberalism and Transfrontier Conservation in Southern Africa. Development and Change 41 (1):29-51
Büscher B, Dressler W (2007) Linking Neoprotectionism and Environmental Governance: On the Rapidly Increasing Tensions between Actors in the Environment-Development Nexus. Conservation and Society 5 (4):586-611
Campbell LM, Vainio-Mattila A (2003) Participatory Development and Community-Based Conservation: Opportunities Missed for Lessons Learned? Human Ecology 31 (3):417-437
CDIE (1996) Preparing a Performance Monitoring Plan. USAID Center for Development Information and Evaluation, Washington
Chambers R (1983) Rural Development: Putting the Last First. Longman, London, UK Chapin M (2004) A Challenge to Conservationists. World Watch 17 (6):17-31 Child B (1996) The practice and principles of community-based wildlife management in
Zimbabwe: The CAMPFIRE programme. Biodiversity and Conservation 5:369-398 Clarke J (2000) Evaluation of Wildlife Conservation Society's Administrative Management
Design (ADMADE) project. Associates in Rural Development for USAID/Zambia, Lusaka
Clarke J, Gewirtz S, McLaughlin E (2000) Reinventing the Welfare State. In: Clarke J, Gewirtz S, McLaughlin E (eds) New Managerialism, New Welfare? Sage Publications, London,
Clarke J, Newman J (1993) The right to manage: A second managerial revolution? Cultural Studies 7 (3):427 - 441
46
Clarke J, Newman J (1997) The Managerial State. Sage, London Cliggett L (2000) Social Components of Migration: Experiences from Southern Province,
Zambia. Human Organization 59 (1):125-135 Cooke B, Kothari U (2001) The Case for Participation as Tyranny. In: B. C, U. K (eds)
Participation: The New Tyranny. Zed Books, London, pp 1-15 Corson C (2008) Mapping the Development Machine: The US Agency for International
Development’s Biodiversity Conservation Agenda in Madagascar. Dissertation, University of California at Berkeley, Berkeley
Corson C (2010) Shifting Environmental Governance in a Neoliberal World: US AID for Conservation. Antipode 42 (3):576-602
Couillard J, Garon S, Riznic J (2009) The Logical Framework Approach – Millennium. Project Management Journal 40 (4):31-44. doi:10.1002/pmj.20117
Coward W (2005) Building Models of Community-Based Natural Resource Management: A Personal Narrative. In: Brosius JP, Tsing AL, Zerner C (eds) Communities and Conservation: Histories and Politics of Community-Based Natural Resource Management. Altamira Press, Walnut Creek, CA,
Cumming D (2004) Performance of Parks in a Century of Change. In: Child B (ed) Parks in Transition. Earthscan, London,
Dalal-Clayton B, Child B, Butler C, Phiri E (2003) Lessons from Luangwa: The Story of the Luangwa Integrated Resource Development Project, Zambia. Wildlife and Development, vol 13. IIED, London
Desai V, Imrie R (1998) The new managerialism in local governance: North-South dimensions. Third World Quarterly 19 (4):635-650
Doran GT (1981) There's a S.M.A.R.T. way to write management's goals and objectives. Management Review 70 (11):35-36
Dressler W, Büscher B, Schoon M, Brockington DAN, Hayes T, Kull CA, McCarthy J, Shrestha K (2010) From hope to crisis and back again? A critical history of the global CBNRM narrative. Environmental Conservation 37 (01):5-15. doi:doi:10.1017/S0376892910000044
Dzingirai V (1996) 'Every man must resettle where he wants': The Politics of Settlement in the Context of Community Based Widlife Management Programme in Binga, Zimbabwe. Zambezia 23 (1):19-30
Dzingirai V (2003) 'CAMPFIRE is not for Ndebele Migrants': The Impact of Excluding Outsiders from CAMPFIRE in the Zambezi Valley, Zimbabwe. Journal of Southern African Studies 29 (2):445-459
Ebrahim A (2003) Accountability in Practice: Mechanisms for NGOs. World Development 31 (5):813-829
Edwards M, Hulme D (1996) Too Close for Comfort? The Impact of Official Aid on Nongovernmental Organizations. World Development 24 (6):961-973
Emerton L (2001) The Nature of Benefits and the Benefits of Nature. In: Hulme D, Murphee MW (eds) African Wildlife and Livelihoods. James Currey Ltd, Oxford, pp 208-226
Fabricius C, Koch E (eds) (2004) Rights, Resources, and Rural Development: Community-based Natural Resource Management in Southern Africa. EarthScan, London
Fairhead J, Leach M (1996) Misreading the African landscape: Society and ecology in a forest-savanna mosaic. Cambridge University Press, Cambridge
47
Ferguson J (1994) The Anti-Politics Machine: "Development", Depoliticization, and bureaucratic power in Lesotho. University of Minnesota Press, Minneapolis, MN
Ferguson J (2006) Global Shadows: Africa in the Neoliberal World Order. Duke Univ Press, Ferraro P, Pattanayak SK (2006) Money for Nothing? A Call for Empirical Evaluation of
Biodiversity Conservation Investments. PLoS Biology 4 (4):e105 Fisher W (1997) Doing Good? The Politics and Antipolitics of NGO Practices. Annual Review
of Anthropology 26:439-464 Flynn N (2000) Managerialism and Public Services: Some International Trends. In: Clarke J,
Gewirtz S, McLaughlin E (eds) New Managerialism, New Welfare? Sage Publications, London,
Fortmann L (1995) Talking Claims: Discursive Strategies in Contesting Property. World Development 23 (6):1053-1063
Fortmann L (2005) What We Need is a Community Bambi. In: Brosius JP, Lowenhaupt A, Zerner C (eds) Communities and Conservation: Histories and Politics of Community-Based Natural Resource Management. Alta Mira Press, New York,
Fowler A (2000) NGDOs as a moment in history: Beyond aid to social entrepreneurship or civic innovation? Third World Quarterly 21 (4):637-654
Fyvie C, Ager A (1999) NGOs and Innovation: Organizational Characteristics and Constraints in Development Assistance Work in The Gambia. World Development 27 (8):1383-1395
Gasper D (2000) Evaluating the logical framework approach towards learning-oriented development evaluation. Public Administration and Development 20:17-28
Getz W, Fortmann L, Cumming D, du Toit J, Hilty J, Martin R, Murphree M, Owen-Smith N, Starfield AM, Westphal MI (1999) Sustaining natural and human capital: Villagers and scientists. Science 283 (5409):1855-1856
Gibson C (1999) Politicians and poachers: The political economy of wildlife policy in Africa. Political Economy of Institutions and Decisions. Cambridge University Press, Cambridge, UK
Gibson C, Ostrom E, McKean MA (2000) Forests, People, and Governance: Some Initial Theoretical Lessons. In: Gibson C, McKean MA, Ostrom E (eds) People and forests: Communities, Institutions, and Governance. MIT Press, Cambridge, MA.,
Gibson CC, Marks SA (1995) Transforming rural hunters into conservationists: An assessment of community-based wildlife management programs in Africa. World Development 23 (6):941-957
Goldman M (2003) Partitioned Nature, Privileged Knowledge: Community based Conservation in Tanzania. Development and Change 34 (5):833-862
Groves C, Valutis L, Vosick D, Neely B, Wheaton K, Touval J, Runnels B (2000) Designing a Geography of Hope: A Practitioner’s Handbook for Ecoregional Conservation Planning, vol I. The Nature Conservancy,
Gruber J (2008) Key Principles of Community-Based Natural Resource Management: A Synthesis and Interpretation of Identified Effective Approaches for Managing the Commons. Environmental Management 45 (1):52-66
Hackel J (1999) Community conservation and the future of Africa’s wildlife. Conservation Biology 13:726–734
Hajer M (1995) The Politics of Environmental Discourse: Ecological Modernization and the Policy Process Oxford University Press, Oxford
Hardin G (1968) The Tragedy of the Commons. Science 162 (3859):1243–1248
48
Hill KA (1996) Zimbabwe's Wildlife Utilization Programs: Grassroots Democracy or an Extension of State Power? African Studies Review 39 (1):103-121
Hodgson DL, Schroeder RA (2002) Dilemmas of Counter-Mapping Community Resources in Tanzania. Development and Change 33 (1):79-100
Homewood K, Brockington D (1999) Biodiversity, conservation and development in Mkomazi Game Reserve, Tanzania. Global Ecology and Biogeography 8:301-313
Hughes D (2002) When Tourists Cross Boundaries and Peasants Don’t: Inequality and Regional Metaphors in Southern African Conservation. Paper presented at the Globalization of Geographies of Conservation, University of Wisconsin, Madison, 19 April 2002
Hughes R, Flintan F (2001) Integrating Conservation and Development Experience: A Review and Bibliography of the ICDP Literature. Biodiversity and Livelihoods Issues No. 3. International Institute for Environment and Development, London
Hulme D, Murphree M (1999) Communities, wildlife and the 'new conservation' in Africa. Journal of International Development 11 (2):277-286
Hulme D, Murphree M (eds) (2001) African Wildlife and African Livelihoods: The Promise and Performance of Community Conservation. James Currey, Oxford
Hutton J, Adams WM, Murombedzi JC (2005) Back to the barriers? Changing narratives in biodiversity conservation. Forum for Development Studies 32 (2):341-370
Igoe J, Brockington D (2007) Neoliberal Conservation: A Brief Introduction. Conservation and Society 5 (4):432-449
Jenkins S (1995) Accountable to None: The Tory Nationalisation of Britain. Hamish Hamilton, London
Jones B, Murphree M (2004) Community-Based Natural Resource Management as a Conservation Mechanism: Lessons and Directions. In: Child B (ed) Parks in Transition. Earthscan, London,
Kaplan R (1994) The coming anarchy: How scarcity, crime, overpopulation, tribalism, and disease are rapidly destroying the social fabric of our planet Atlantic Monthly 2 (2)
Kellert SR, Mehta JN, Ebbin SA, Lichtenfeld LL (2000) Community natural resource management: promise, rhetoric, and reality. Society and Natural Resources 13 (8):705-715
Kiss A (2004) Making Biodiversity Conservation a Land Use Priority. In: McShane T, Wells MP (eds) Getting Biodiversity Projects to Work. Columbia University Press, New York, pp 98-123
Kremen C, Merenlender A, Murphy D (1994) Ecological Monitoring: A Vital Need for Integrated Conservation and Development Programs in the Tropics. Conservation Biology 8 (2):388-397
Latour B (1996) Aramis or the Love of Technology. Harvard University Press, Cambridge Leach M, Mearns R (1996) Challenging Received Wisdom in Africa. In: Leach M, Mearns R
(eds) Lie of the Land: Challenging Received Wisdom on the African Environment. James Currey, Oxford,
Lee RG Sustained Yield and Social Order. In: Steen HK (ed) History of Sustained-Yield Forestry: A Symposium. Held at Western Forestry Center, Portland, Oregon, October 18–19, 1983, Portland, Oregon, 1984. Forest History Society, Santa Cruz, CA., pp 90–100
Lewis D, Mosse D (2006) Encountering order and disjuncture: Contemporary anthropological perspectives on the organization of development Oxford Development Studies 34:1-13
49
Lewis DM, Alpert P (1997) Trophy hunting and wildlife conservation in Zambia. Conservation Biology 11 (1):59-68
Lewis DM, Phiri A (1998) Wildlife snaring: An indicator of community response to a community-based conservation project. Oryx 32 (2):111-121
Li T (1999) Compromising Power: Development, Culture, and Rule in Indonesia. Cultural Anthropology 14 (3):295-322
Li TM (2002) Engaging Simplifications: Community-Based Resource Management, Market Processes and State Agendas in Upland Southeast Asia. World Development 30 (2):265-283
Lundy P (1999) Community participation in Jamaican conservation projects. Community Development Journal 34 (2):122-132
Lynn LE (1996) The New Public Management as an International Phenomenon: A Skeptical View. Paper presented at the The New Public Management in International Perspective, St. Gallen, Switzerland, 11-13 July, 1996
Lyons A (2004) Munwe omwe taupwai njina: An internal mid-term evaluation of CONASA. CARE International, Lusaka, Zambia
Malthus TR (1888) An essay on the principle of population: or, A view of its past and present effects on human happiness. London, Reeves and Turner,
Manspeizer I (2004) Considering Wildlife Conservation in Zambia at the Turn of the Millennium. State University of New York at Binghamton, Binghamton, NY
Margoluis R, Salafsky N (1998) Measures of Success: Designing, Managing, and Monitoring Conservation and Development Projects. Island Press, Washington, D.C.
Marks SA (2001) Back to the Future: Some Unintended Consequences of Zambia's Community-Based Wildlife Program (ADMADE). Africa Today 41 (1):120-141
Mascia MB, Brosius JP, Dobson TA, Forbes BC, Horowitz L, McKean MA, Turner NJ (2003) Conservation and the Social Sciences. Conservation Biology 17 (3):649-650
McCarthy J (2006) Devolution in the Woods: Community Forestry as Hybrid Neoliberalism. Environment and Planning A 37 (6):99-1014
McDermott-Hughes D (2001a) Cadastral Politics: The Making of Community-Based Resource Management in Zimbabwe and Mozambique. Development and Change 32:741-768
McDermott-Hughes D (2001b) Rezoned for Business: How Eco-Tourism Unlocked Black Farmland in Eastern Zimbabwe. Journal of Agrarian Change 1 (4):576-599
McDermott-Hughes D (2008) Requiem for the Zambezi Valley? Conservation and protected areas under climate change. Policy Matters 16:108-114
McDermott-Hughes M (2001c) Invoking community: Indigenous people and ancestral domain in Palawan, the Philippines. In: Agrawal A, Gibson C (eds) Community and the environment: Ethnicity, gender and the state in community-based conservation. Rutgers University Press, New Brunswick, NJ,
McNeill D (2006) The Diffusion of Ideas in Development Theory and Policy. Global Social Policy 6 (3):334-354
Meinzen-Dick R, Zwarteveen M (2001) Gender dimensions of community resource management. In: Agrawal A, Gibson C (eds) Community and the environment: Ethnicity, gender and the state in community-based conservation. Rutgers University Press, New Brunswick, NJ,
Miraftab F (1997) Flirting with the Enemy: Challenges Faced by NGOs in Development and Empowerment. Habitat International 21 (4)
50
Mosse D (2001) 'People's Knowledge', Participation and Patronage: Operations and Representation in Rural Development. In: Cooke B, Kothari U (eds) Participation: The New Tyranny? Zed Books, London, pp 16-35
Mosse D (2004) Is Good Policy Unimplementable? Reflections on the Ethnography of Aid Policy and Practice. Development and Change 35 (4):639-671
Mosse D (2005) Cultivating Development: An Ethnography of Aid Policy and Practice. Pluto Press, London
Mulolani D, Muwowo G, Haarklau S (2005) Mid-term Progress Review. Lupande CBNRM Land Use Planning Project, WWF Zambia, Lusaka, Zambia
Murombedzi JC (2001) Natural Resource Stewardship and Community Benefits in Zimbabwe's CAMPFIRE Programme. In: Hulme D, Murphee MW (eds) African Wildlife and Livelihoods. James Currey Ltd, Oxford, pp 244-255
Murphee MW Communities and institutions for resource management. In: National Conference on Environment and Development, Maputo, Mozambique, 1991.
Murphee MW Boundaries and Borders: The Question of Scale in the Theory and Practice of Common Property Management. In: Eighth Annual Conference of the International Association for the Study of Common Property, Bloomington, IN. May 31-June 4, 2000, 2000.
Murphee MW (2004) Communal Approaches to Natural Resource Management in Africa: From Whence and to Where? Journal of International Wildlife Law and Policy 7:203–216
Murphree M (2003) Lessons From Non-Lease Tourism Projects In The Communal Lands of Zimbabwe. Leadership Lessons for Best Practice in Estuary Based Enterprise Development. Institute of Natural Resources, University of Natal, Pietermaritzburg, South Africa
Murphree M (2009) The strategic pillars of communal natural resource management: benefit, empowerment and conservation. Biodiversity and Conservation 18 (10):2551-2562
Musumali M, Larsen T, Kaltenborn B (2007) An impasse in community based natural resource management implementation: the case of Zambia and Botswana. Oryx 41 (3):306-313. doi:doi:10.1017/S0030605307000518
Nabane N, Matzke G (1997) A gender-sensitive analysis of a community-based wildlife utilization initiative in Zimbabwe's Zambezi valley. Society & Natural Resources 10 (6):519-535
Najam A (1996) NGO Accountability: A Conceptual Framework. Development Policy Review 14:339-353
Naughton G, Hansen A, Kiker C, Jones B (1998) Final report: Assessment of community-based natural resource management (CBNRM) in Southern Africa. USAID/Regional Center for Southern Africa, Gaborone, Botswana
Nelson F, Agrawal A (2008) Patronage or Participation? Community-based Natural Resource Management Reform in Sub-Saharan Africa. Development and Change 39 (4):557-585
Neumann R (1997) Primitive Ideas: Protected Area Buffer Zones and the Politics of Land in Africa. Development and Change 28:559-582
Neumann R (1998) Imposing Wilderness: Struggles over Livelihood and Nature Preservation in Africa. University of California Press, Berkeley
Newmark W, Hough J (2000) Conserving Wildlife in Africa: Integrated Conservation and Development Projects and Beyond. BioScience 50 (7):585-592
51
Norton-Griffiths M, Southey C (1995) The Opportunity Costs of Biodiversity Conservation in Kenya. Ecological Economics 12 (2):125-139
Noss A (1997) Challenges to nature conservation with community development in central African forests. Oryx 31 (3):180-188
O'Reilly K (2010) The Promise of Patronage: Adapting and Adopting Neoliberal Development. Antipode 42 (1):179-200
Oates JF (1999) Myth and reality in the rain forest: How conservation strategies are failing in West Africa. University of California Press, Berkeley, CA
Osborne D, Gaebler T (1992) Reinventing government: How the entrepreneurial spirit is transforming the public sector. Plume, New York
Peluso N (1993) Coercing conservation? : The politics of state resource control. Global Environmental Change 3 (2):199-217
Peluso N (1995) Whose Woods Are These? Counter-Mapping Forest Territories in Kalimantan, Indonesia. Antipode 27 (4):383-406
Peters PE, Kambewa D (2007) Whose security? Deepening social conflict over 'customary' land in the shadow of land tenure reform in Malawi. Journal of Modern African Studies 45 (3):447-472
Ribot JC, Lund JF, Treue T (2010) Democratic decentralization in sub-Saharan Africa: its contribution to forest management, livelihoods, and enfranchisement. Environmental Conservation 37 (01):35-44. doi:doi:10.1017/S0376892910000329
Roberts S, Jones JP, Frohling O (2005) NGOs and the Globalization of Managerialism: A Research Framework. World Development 33 (11):1845-1864
Rodary E (2009) Mobilizing for nature in southern African community-based conservation policies, or the death of the local. Biodiversity and Conservation 18 (10):2585-2600
Roe D, Nelson F, Sandbrook C (eds) (2009) Community management of natural resources in Africa: Impacts, experiences and future directions. Natural Resource Issues No. 18. International Institute for Environment and Development, London, UK
Roe E (1991) Development Narratives, Or Making the Best of Blueprint Development. World Development 19 (4):287-300
Roe E (1994) Narrative Policy Analysis: Theory and Practice. Duke University Press, Durham, NC
Salafsky N, Margoluis R (1999a) Greater than the Sum of Their Parts: Designing Conservation and Development Programs to Maximize Results and Learning. Biodiversity Support Program, World Wildlife Fund, Washington
Salafsky N, Margoluis R (1999b) Threat Reduction Assessment: A Practical and Cost-Effective Approach to Evaluating Conservation and Development Projects. Conservation Biology 13 (4):830-841
Salafsky N, Wollenberg E (2000) Linking Livelihoods and Conservation: A Conceptual Framework and Scale for Assessing the Integration of Human Needs and Biodiversity. World Development 28 (8):1421-1438
Sanderson EW, Redford KH, Vedder A, Coppolillo PB, Ward SE (2002) A conceptual model for conservation planning based on landscape species requirements. Landscape and Urban Planning 58 (1):41-56
Sartorius R (1991) The logical framework approach to project design and management. Evaluation Practice 12 (2):139-147
52
Sartorius R (1996) The Third Generation Logical Framework Approach: Dynamic Management for Agricultural Research Projects. Journal of Agricultural Education and Extension 2 (4):49-62. doi:10.1080/13892249685300071
Saterson K, Margoluis R, Salafsky N (eds) (1999) Measuring Conservation Impact: An Interdisciplinary Approach to Project Monitoring and Evaluation. Biodiversity Support Program, World Wildlife Fund, Washington
Sayer J, Wells M (2004) The Pathology of Projects. In: McShane T, Wells M (eds) Getting Biodiversity Projects to Work. Columbia University Press, New York,
Schapiro M (2010) Conning the Climate: Inside the Carbon-Trading Shell Game. Harpers February 2010:31-39
Scott J (1990) Domination and the Arts of Resistance: Hidden Transcripts. Yale University Press, New Haven, CT.
Shackleton CM, Willis TJ, Brown K, Polunin NVC (2010) Reflecting on the next generation of models for community-based natural resources management. Environmental Conservation 37 (01):1-4. doi:doi:10.1017/S0376892910000366
Shackleton S, Campbell BM (2001) Devolution in natural resource management: institutional arrangements and power shifts: a synthesis of case studies from southern Africa. CIFOR, Bogor, Indonesia
Shackleton S, Campbell BM, Wollenberg E, Edmunds D (2002) Devolution and community-based natural resource management: Creating space for local people to participate and benefit? , vol 76. Natural Resource Perspectives. Overseas Development Institute, London
Simasiku P, Simwanza HI, Bandyopadhyay S, Pavy JM (2008) Game Management Areas in Crisis: The Impact of Zambia's Wildlife Management Policies on Communities and Conservation. Natural Resources Consultative Forum, Lusaka, Zambia
Smith RJ, Muir RDJ, Walpole MJ, Balmford A, Leader-Williams N (2003) Governance and the Loss of Biodiversity. Nature 426 (6962):67-70
Songorwa A (1999) Community-Based Wildlife Management (CWM) in Tanzania: Are the Communities Interested? World Development 27 (12):2061-2079
Songorwa A, Bürhs T, Hughey K (2000) Community-Based Wildlife Management in Africa: A Critical Assessment of the Literature. Natural Resources Journal 40:603-643
Sullivan S (2002) How Sustainable is the Communalizing Discourse of 'New' Conservation? The Masking of Difference, Inequality and Aspiration in the Fledgling ‘Conservancies’ of Namibia. In: Chatty D, Colchester M (eds) Conservation and Mobile Indigenous Peoples, vol 10. Studies in Forced Migration. Berghahn Books, New York and Oxford,
Taylor R (2009) Community based natural resource management in Zimbabwe: the experience of CAMPFIRE. Biodiversity and Conservation 18 (10):2563-2583
Terborgh J (1999) Requiem for Nature. Island Press, Washington, DC TNC (2006) Conservation by Design: A Strategic Framework for Mission Success. The Nature
Conservancy, Arlington, VA. Torquebiau E, Taylor R (2009) Natural resource management by rural citizens in developing
countries: innovations still required. Biodiversity and Conservation 18 (10):2537-2550 Townsend J, Porter G, Mawdsley E (2002) The role of the transnational community of non-
government organizations: Governance or poverty reduction? Journal of International Development 14 (6):829-839
53
Townsend J, Porter G, Mawdsley E (2004) Creating Spaces of Resistance: Development NGOs and their Clients in Ghana, India and Mexico. Antipode 36 (5):871-889
Tvedt T (1998) Angels of Mercy or Development Diplomats? NGOs and Foreign Aid. James Currey, Oxford
Unruh J, Cligget L, Hay R (2005) Migrant land rights reception and ‘clearing to claim’ in sub-Saharan Africa: A deforestation example from southern Zambia. Natural Resources Forum 29:190–198
USAID (2012) Workshop Announcement: Community-Based Natural Resource Management (CBNRM): Cutting Across Multi-Sector Divides, January 16-17, 2013. http://events.r20.constantcontact.com/register/event?oeidk=a07e5wg1ffd28160494 [accessed on 2012/11/17].
van Schaik C, Rijksen HD (2002) Integrated Conservation and Development Projects: Problems and Potential. In: Terborgh J, van Schaik C, Davenport L, Rao M (eds) Making Parks Work: Strategies for Preserving Tropical Nature. Island Press, Washington,
Vitousek PM, Mooney HA, Lubchenco J, Melillo JM (1997) Human Domination of Earth's Ecosystems. Science 277 (5325):494-499
Wainwright C, Wehrmeyer W (1998) Success in Integrating Conservation and Development? A Study from Zambia. World Development 26 (6):933-944
Watts M (2001) Development Ethnographies. Ethnography 2 (2):283-300. doi:10.1177/14661380122230939
WCS (2008) COMACO Business Audit Summer 2008. Wildlife Conservation Society and UC Berkeley Haas School of Business, Lusaka
Wells M, Brandon K, Hannah L (1992) People and parks: linking protected area management with local communities. World Bank, Washington, DC
Wells MP, Brandon KE (1993) The principles and practice of buffer zones and local participation in biodiversity conservation. Ambio 22 (2/3):157-162
Western D, Wright RM, Strum SC (eds) (1994) Natural connections. Perspectives in community-based conservation. Island Press, Washington, DC
Wilshusen PR, Brechin SR, Fortwangler CL, West PC (2002) Reinventing a Square Wheel: Critique of a Resurgent 'Protection Paradigm' in International Biodiversity Conservation. Society and Natural Resources 15:17-40
Wittemyer G, Elsen P, Bean WT, Burton ACO, Brashares JS (2008a) Accelerated Human Population Growth at Protected Area Edges. Science 321 (5885):123-126. doi:10.1126/science.1158900
Wittemyer G, Elsen P, Bean WT, Burton CO, Brashares JS (2008b) Accelerated human population growth at protected area edges. Science 321 (5885):123-126. doi:DOI: 10.1126/science.1158900
Wunder S (2001) Poverty Alleviation and Tropical Forests: What Scope for Synergies? World Development 29:1817-1833
54
CHAPTER 3.
THE RISE AND FALL OF A SECOND GENERATION CBNRM PROJECT IN ZAMBIA: INSIGHTS FROM A PROJECT PERSPECTIVE
Introduction
Afternoon thunderstorms couldn’t dampen the sense of optimism at the inaugural stakeholders workshop of the CONASA1 community-based natural resource management (CBNRM) project in March 2001. Forty-six stakeholders had descended upon the Ibis Gardens lodge and conference center in Chisamba, Zambia for three days to pat themselves on the back for winning a $8.5 million competitive bid from the US Agency for International Development (USAID) and plan the modalities for rolling out the new project. The consortium of non-governmental organizations (NGOs) which had put together the proposal included three core international NGOs, seven local NGOs, and two international development volunteer programs. Also in attendance were village leaders, NGO extension officers, representatives from central government, donors, and consultants. After months of planning meetings, participatory appraisals, and drafting of MOUs, the project was ready to commence promoting community-based wildlife conservation, agricultural intensification, microenterprise, policy advocacy, transboundary linkages, and market development. CONASA billed this ambitious suite of activities as CBNRM 2.0, and if indeed the primary function of policy is to enable disparate groups of actors to work together (Mosse 2004), and the designation of success is strongly correlated with the number of one’s allies (Latour 1996), then the sense of optimism that filled the air at Ibis Gardens was well-founded.
Four years later, the last few staff members were packing up their boxes. At the project field site, offices that had once buzzed with activity were quiet, while heaps of used flipchart paper gathered dust in a closet. There had been no financial mismanagement, reporting had been top-notch, a contracted evaluation revealed the vast majority of activities had been successfully implemented, and the project was well-liked within the communities. What had happened?
As described in Chapter 2, numerous reviews and meta-analyses have documented the origins of CBNRM, its theoretical foundations, best practices, and outcomes (e.g., Hughes and Flintan 2001; Adams and Hulme 2001; Hutton et al. 2005; Fabricius and Koch 2004). Much of the literature takes an 'outside' perspective, examining the principles upon which CBNRM is grounded, the socio-ecological conditions of specific locales, and the sustainability of conservation outcomes ecologically, economically, and socially. A piece of the chain less often scrutinized within CBNRM literature is the link that connects the principles, external resources, and local context—namely the project itself.
In this chapter I argue that analysis of the potential and limitations of CBNRM is fundamentally limited without also understanding the complex social dynamics within the projects that transform these principles into practice. As described in Chapter 2, other fields,
1 CONASA (Community Based Natural Resource Management and Sustainable Agriculture) was initially known as INSAKA (Improving Natural Resource Management and Sustainable Agriculture in the Kafue Area). For clarity, in this paper I always refer to it as CONASA.
55
notably development ethnography and public policy, have created conceptual tools through which projects and project dynamics may be examined, including the effects of the broader web of institutional relations within which a project is embedded, the role of narratives in directing attention toward specific outcomes and chains of causation, a distinction between programmatic and operational logics, and the use of managerial tools to maintain focus and stabilize relations both within the project and with its allies.
Did CONASA 'fail'? What is clear is that CONASA came to an end when its donor decided to take a different approach to rural development, and the three NGOs that made up CONASA could not adapt to the new course nor find alternative funding. Whether this means the project 'failed', or rather 'was failed' by its allies (Latour 1996), is a circular question. A more fundamental question concerns how the need to maintain relationships in CBNRM projects, with funders as well as local communities, government, and implementing partners, governs day-to-day activities at multiple levels, and how this drive to secure relations contributes to outcomes as much if not more than the underlying principles of CBNRM or conditions at the project site.
The rise and fall of CONASA illustrates how taking projects as a unit of analysis informs our understanding of outcomes that seem to contradict theory. This chapter is not an evaluation of CONASA (but see Lyons 2004), nor does it attempt to capture the voice of local communities. Rather it elaborates on how and why the project functioned internally and evolved the way it did. Development ethnography and public policy studies of managerialism help explain the trajectory of a CBNRM project that enjoyed local popularity and mostly successful activities yet struggled to retain its coherency and maintain key allies. Viewed from within, many of the challenges faced by CONASA were in fact foreshadowed at its birth at the Ibis Gardens workshop, whereby a diverse set of organizations, discourses, and institutional relations were stitched together by a narrative about synergy and spin-offs. Although its multi-scale, multi-sectorial design enabled the consortium to come together and capture a funding opportunity, CONASA’s hybrid origins and logframe-centric management eventually created fissures between the operational and programmatic logics and hindered its ability to adapt to a changing context and develop a broader narrative with which it could maintain key allies.
The focus of this chapter is not about how CBNRM projects should be planned or implemented, but how at least one project actually was planned and implemented, the later of which is of course a pre-requisite for the former. While many of the lessons learned may be specific to this particular project and its historical context, the approach and broader framework for understanding project dynamics are highly transferable. In the conclusion, I discuss a few implications for designing and managing CBNRM projects, which continue to attract wide attention and renewed calls for the development of best practices (USAID 2012).
Methods
My analysis of CONASA and its antecedents is based upon experiences spanning seven years (1998-2005) as an intern, researcher, and consultant. I initially served as a research intern for the USAID office in Lusaka in 1998, under the Strategic Objective One team that oversaw USAID support for ADMADE. I then conducted masters research for an additional ten months on community participation in wildlife monitoring in ADMADE. In 2000, I was part of a team that evaluated the Livingstone Food Security Project and ADMADE, the two projects that
56
directly morphed into CONASA, and later that year was part of the team that wrote the proposal for what would become CONASA.
Over the next three and a half years, I traveled to Zambia several times for research and to work with CONASA developing monitoring protocols, documenting participatory rural appraisals, designing surveys, training staff, and developing terms of reference for contracted studies. In 2003, I coordinated a comprehensive internal mid-term evaluation that turned out to be the last major assessment of the project. In 2005 I conducted another nine months of fieldwork, during which I interviewed former staff and others who had been working with the project. This study draws upon published and unpublished literature, field notes, and semi-structured interviews with NGO staff, government officials, and community members. Specific sources are noted when used, but the names and titles of interviewees have been omitted to protect their privacy.
Development of CBNRM in Zambia
While CONASA came into existence in 2001, its immediate roots can be traced back at least a decade earlier. In this section, I map out the institutional and discursive history of conservation and rural development programs in Zambia in the 1980s and 90s. This history not only illustrates the context within which CONASA emerged and operated, but how the project itself was constituted from a fusion of discourses and institutional relations that later produced contradictions, influenced the style of management, and ultimately made it difficult for CONASA to translate its work into a coherent narrative.
Early CBNRM
Zambia was one of the early adopters of CBNRM, introducing pilot programs in the late 1980s after years of declining budgets for the parks department, a poaching crisis that decimated wildlife populations in the flagship parks, rising opposition to unpopular conservation policies, and funding opportunities that enabled alliances between individuals in government, conservation organizations, and donors (Gibson 1999). The early CBNRM projects had a relatively simple model for reforming conservation in semi-protected Game Management Areas outside national parks. A portion of hunting fees was channeled back to the community whereby a committee chaired by the local chief determined how to allocate it for social infrastructure projects and law enforcement. It was hoped that carrots in the form of schools and clinics coupled with local recruitment of wildlife scouts would change attitudes towards wildlife and improve cooperation with law enforcement. Although increased levels of law enforcement stemmed poaching in areas where the program was active, the social benefits were thin and mostly went to individuals hand-picked by the chief and his headmen (Gibson and Marks 1995; Lewis and Alpert 1997; Clarke 2000).
USAID was one of the largest supporters of CBNRM in southern Africa in the 1980s and 90s. Its support for ADMADE began under a regional initiative for biodiversity protection, bundled with aid for similar programs in Zimbabwe, Botswana, and Namibia (Neme and Collings 1999). Initially, USAID supported the parks department directly, funding start-up costs such as vehicles, uniforms, training programs, and the construction of field offices. But after multiple reviews revealed poor accounting at multiple levels, USAID began channeling its
57
support through American NGOs, first WWF and then the Wildlife Conservation Society of New York (WCS) (Clarke 2000; ULG Consultants Ltd 1994; Ernst & Young 1998).
Governance and Food Security Rise on the CBNRM Agenda
Over the 1990s, issues of policy and governance rose higher and higher on the conservation agenda. In the mid-90s, USAID brought in consultants to examine the policy environment and make recommendation for new wildlife legislation (Ankersen and Hamann 1995). In November 1998, the government passed a new wildlife act, which stopped short of devolving property rights for wildlife but codified the existence of a new type of community level organization, Community Resource Boards (GRZ 1998). Despite the new legislation, donors remained frustrated with what they deemed political meddling within the parks department, perceptions girded by a much larger discourse about government corruption (Manspeizer 2004).
As Zambia’s economy and social welfare indicators deteriorated during the 1990s, food security became an increasingly important focus of the foreign aid agenda including CBNRM. Numerous third party assessments concluded that the community-level benefits under ADMADE were sparse, unevenly distributed, and centered on infrastructure projects that failed to address basic needs of rural households (Marks 2001; Wainwright and Wehrmeyer 1998; Matenga 1999; Hachileka et al. 1999). Surveys conducted by WCS, USAID’s primary contractor for support to ADMADE, also found that seasonal food insecurity continued to be a chronic problem in the central Luangwa Valley and was driving persistent levels of snaring (Lewis and Tembo 1999).
Food security was the central focus of CARE, another USAID protégé that would become one of CONASA’s institutional parents. CARE made its debut in Zambia in 1991, after consecutive years of drought withered crops and seed stocks in Southern Province. Against a backdrop of rusting sheds from the Ministry of Agriculture's defunct cooperatives, CARE oversaw the distribution of relief food in three districts in Southern Province. As conditions gradually improved, the food relief project evolved into a food security project, the Livingstone Food Security Project (LFSP).
The Livingstone project sought to strengthen food security through the sustainable livelihood approach, one of the dominant development models of the 1990s. A livelihood analysis starts at the household level, as opposed to earlier food security paradigms that examined food availability at national or regional levels, and considers food security in reference to a broader range of activities, strategies, and assets for securing access to food, offsetting risks, smoothing out production cycles, and coping with shocks (Chambers and Conway 1992). With sustainable livelihoods as the project model, the Livingstone project provided drought-resistant seed and fertilizer packs, developed village-based seed multiplication schemes, constructed improved granaries, established a savings scheme, and provided livestock health services and micro-enterprise support (Lyons et al. 2000).
TBNRM
Although not well-known in Zambia, transboundary conservation and ecoregional planning gained prominence among international conservation organizations in the mid-1990s.
58
The rise of transboundary natural resource management (TBNRM) was centered in southern Africa (Brosius and Russell 2003). Like CBNRM, TBNRM is discursively rich, promising a multitude of benefits that extend far beyond biodiversity conservation, including peace building, restoration of ecosystem services, cultural revival, increased economic investment, and organizational capacity building (Griffin et al. 1999).
USAID was a strong supporter of TBNRM in the region, investing in transboundary parks in the Great Limpopo, Kavango, and Zambezi basins (Büscher 2010). TBNRM appealed to USAID, embattled by a decade of downsizing and increasing micromanagement from Congress, by both reinvigorating the CBNRM discourse and allowing the agency to maintain political support from large conservation NGOs who were both its primary contractors and most effective lobbyists for continued Congressional funding for biodiversity (Corson 2008). TBNRM also promised the creation of new opportunities for market expansion and direct foreign investment, other strong selling points for the agency, and gave the USAID Regional Center for Southern Africa in Gaborone, Botswana, a regional environmental narrative upon which to claim a raison d'être (Wolmer 2003).
Managerialism Comes to USAID/Zambia
In 1995, USAID initiated its ‘Reengineering USAID’ reform program in response to a broader call to ‘reinvent’ government (Osborne and Gaebler 1992; Brown et al. 1996). The reengineering program involved management reforms based on a set of core values including customer focus, managing for results, accountability, teamwork and participation, and diversity (Brown et al. 1996). Missions were required to develop results frameworks, through which top-level strategic objectives are decomposed into intermediate and sub-intermediate results, and establish performance monitoring systems at both portfolio and project levels. Washington issued guidelines detailing how to develop performance monitoring matrices, establish performance targets, design evaluations, and collect data (CDIE 1996).
To meet the demands of Washington, USAID missions pushed the managerial reforms further down to individual projects, which were mandated to adopt logical framework analysis, or logframes. USAID developed the logframe approach in 1970, adapting methods used by corporate and military planners, following calls for greater accountability by the US Congress (Sartorius 1991). The framework compels project planners to articulate goals, strategies, and means of monitoring and verification, culminating in a matrix with rows outlining a nested hierarchy of goals, objectives, and activities, and columns that list indicators, means of verification, and assumptions. USAID's projects, recast as ‘investments’, were required to develop logframes as part of the funding process and use them to structure workplans and reporting. Increasingly, evaluations were also structured around the logframe, at the risk of representing project results in narrow technical terms that obscure broader impacts and unexpected consequences (Gasper 2000).
In 1998, the USAID mission in Zambia adopted a new five-year strategic plan, Promises to Keep: From Reforms to Benefits for Zambians (USAID/Zambia 1998). The new country strategy, whose title tacitly acknowledged the failure of earlier structural adjustment policies, had no explicit objective for biodiversity conservation, so ongoing support for ADMADE was reshelved under Strategic Objective One, Increased Sustainable Rural Incomes. To squeeze
59
CBRNM under this objective and aggregate performance monitoring with data from projects supporting commercial agriculture, the new framework enlarged the definition of ‘farmer’ to anyone who lived in a rural area, whether or not they actually farmed, and wildlife was reclassified as a “non-traditional export” the production of which was to be measured with the same metrics of net economic value and factor productivity (USAID/Zambia 1998).
A Project is Born
The RFA
As the new millennium dawned, the funding cycles for WCS/ADMADE and CARE/LFSP had ended or were in their final months. Relationships between both projects and USAID had been nurtured through a process of final review missions, stakeholder workshops, and lessons learned studies (Lyons 2000). In July 2000, the much-anticipated Request for Applications (RFA) for a new tranche of CBNRM funding was posted on USAID’s website, promising $7.5 million USD to the contractor who could make CBNRM work in central Zambia (USAID/RCSA 2000b).
The RFA specified the contours of a new five-year project2 to a remarkably fine degree. It began by laying out the geographic scope of the new project, an ambitious area including the game management areas surrounding the mammoth Kafue National Park (KNP). An amendment promised another $1 million USD if the new project could “effectively link” the communities and ecosystems south of KNP to the much larger proposed “Four Corners” transboundary conservation area encompassing the area between KNP, Hwange National Park in Zimbabwe, the Okavango delta in Botswana, and the Caprivi strip in Namibia (USAID/RCSA 2000a). To make expectations for the new project crystal clear, the RFA listed eight specific results the new project was to achieve, and several higher level results in USAID's national and regional logframes to which the new project was expected to contribute (USAID/RCSA 2000b).
The RFA attributed the underlying causes of environmental problems in the project zone to weak government institutions, poor penetration of markets, and a lack of civil society interest in advocating for stronger resource management policies. It then articulated a ‘development hypothesis’ for improving food security and sustainable resource management, with explicit references to the narratives and policy models central to USAID’s previous projects. These included a strong and continued faith in private sector led development to reduce poverty, the efficiencies of implementing rural development through farmer groups, the importance of local participation in extension and planning, the benefits of new production technologies, and the need for innovation in local institutions. It also stressed the importance of creating synergistic effects between socioeconomic development and conservation, and between regional planning and local development (USAID/RCSA 2000b).
The themes appearing throughout the RFA constitute ‘master metaphors’ of a new generation of CBNRM. These influential images enable action not through their predictive power but by being simultaneously compelling and ambiguous (Mosse 2005). Underlying all of the ‘lessons learned’ is a keystone discourse about ever-increasing levels of efficiency—getting 2 the time frame was later reduced to four years and the budget reduced by $2 million when the Bush administration took office
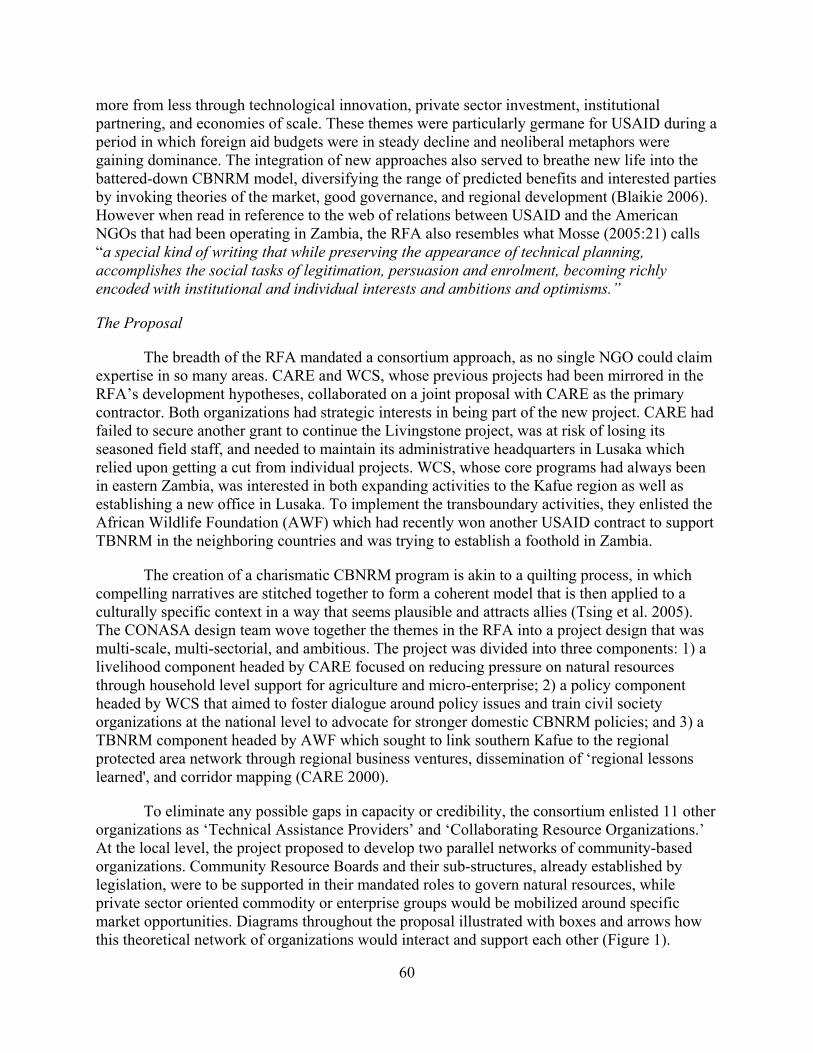
60
more from less through technological innovation, private sector investment, institutional partnering, and economies of scale. These themes were particularly germane for USAID during a period in which foreign aid budgets were in steady decline and neoliberal metaphors were gaining dominance. The integration of new approaches also served to breathe new life into the battered-down CBNRM model, diversifying the range of predicted benefits and interested parties by invoking theories of the market, good governance, and regional development (Blaikie 2006). However when read in reference to the web of relations between USAID and the American NGOs that had been operating in Zambia, the RFA also resembles what Mosse (2005:21) calls “a special kind of writing that while preserving the appearance of technical planning, accomplishes the social tasks of legitimation, persuasion and enrolment, becoming richly encoded with institutional and individual interests and ambitions and optimisms.”
The Proposal
The breadth of the RFA mandated a consortium approach, as no single NGO could claim expertise in so many areas. CARE and WCS, whose previous projects had been mirrored in the RFA’s development hypotheses, collaborated on a joint proposal with CARE as the primary contractor. Both organizations had strategic interests in being part of the new project. CARE had failed to secure another grant to continue the Livingstone project, was at risk of losing its seasoned field staff, and needed to maintain its administrative headquarters in Lusaka which relied upon getting a cut from individual projects. WCS, whose core programs had always been in eastern Zambia, was interested in both expanding activities to the Kafue region as well as establishing a new office in Lusaka. To implement the transboundary activities, they enlisted the African Wildlife Foundation (AWF) which had recently won another USAID contract to support TBNRM in the neighboring countries and was trying to establish a foothold in Zambia.
The creation of a charismatic CBNRM program is akin to a quilting process, in which compelling narratives are stitched together to form a coherent model that is then applied to a culturally specific context in a way that seems plausible and attracts allies (Tsing et al. 2005). The CONASA design team wove together the themes in the RFA into a project design that was multi-scale, multi-sectorial, and ambitious. The project was divided into three components: 1) a livelihood component headed by CARE focused on reducing pressure on natural resources through household level support for agriculture and micro-enterprise; 2) a policy component headed by WCS that aimed to foster dialogue around policy issues and train civil society organizations at the national level to advocate for stronger domestic CBNRM policies; and 3) a TBNRM component headed by AWF which sought to link southern Kafue to the regional protected area network through regional business ventures, dissemination of ‘regional lessons learned', and corridor mapping (CARE 2000).
To eliminate any possible gaps in capacity or credibility, the consortium enlisted 11 other organizations as ‘Technical Assistance Providers’ and ‘Collaborating Resource Organizations.’ At the local level, the project proposed to develop two parallel networks of community-based organizations. Community Resource Boards and their sub-structures, already established by legislation, were to be supported in their mandated roles to govern natural resources, while private sector oriented commodity or enterprise groups would be mobilized around specific market opportunities. Diagrams throughout the proposal illustrated with boxes and arrows how this theoretical network of organizations would interact and support each other (Figure 1).
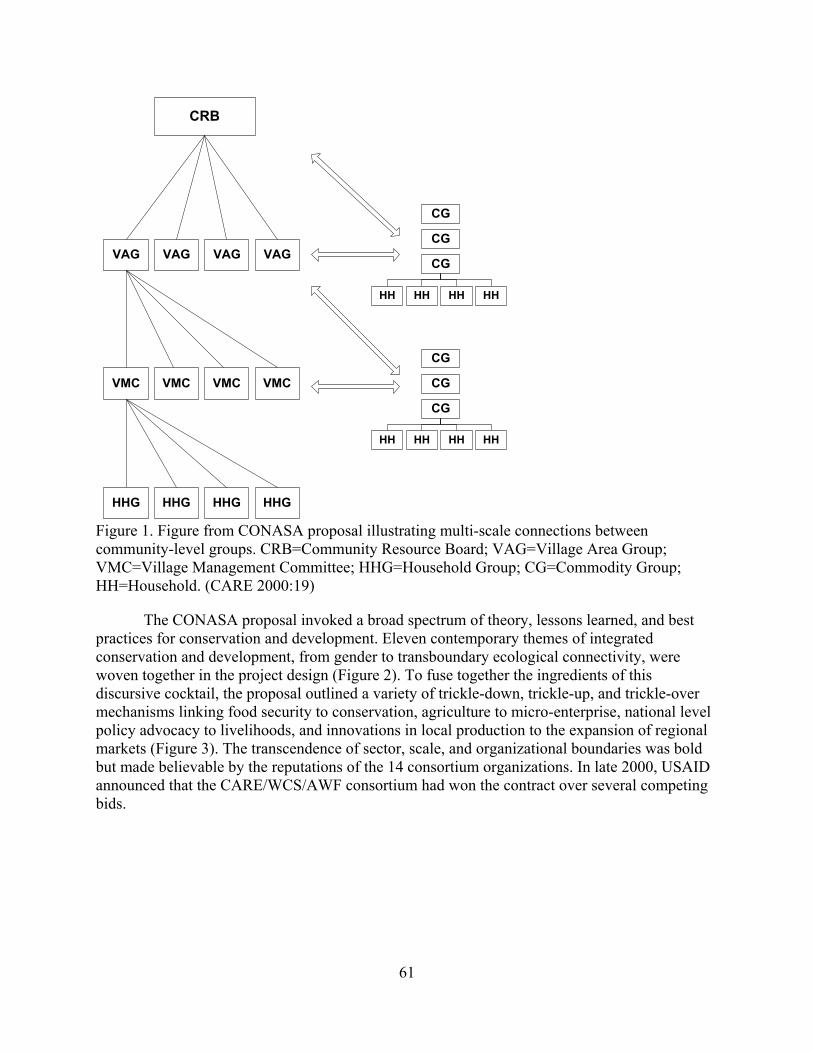
61
CRB
VAG
CG
HH
VAG VAGVAG
VMC VMC VMCVMC
HHG HHG HHGHHG
HH HH HH
CG
CG
CG
HH HH HH HH
CG
CG
Figure 1. Figure from CONASA proposal illustrating multi-scale connections between community-level groups. CRB=Community Resource Board; VAG=Village Area Group; VMC=Village Management Committee; HHG=Household Group; CG=Commodity Group; HH=Household. (CARE 2000:19)
The CONASA proposal invoked a broad spectrum of theory, lessons learned, and best practices for conservation and development. Eleven contemporary themes of integrated conservation and development, from gender to transboundary ecological connectivity, were woven together in the project design (Figure 2). To fuse together the ingredients of this discursive cocktail, the proposal outlined a variety of trickle-down, trickle-up, and trickle-over mechanisms linking food security to conservation, agriculture to micro-enterprise, national level policy advocacy to livelihoods, and innovations in local production to the expansion of regional markets (Figure 3). The transcendence of sector, scale, and organizational boundaries was bold but made believable by the reputations of the 14 consortium organizations. In late 2000, USAID announced that the CARE/WCS/AWF consortium had won the contract over several competing bids.
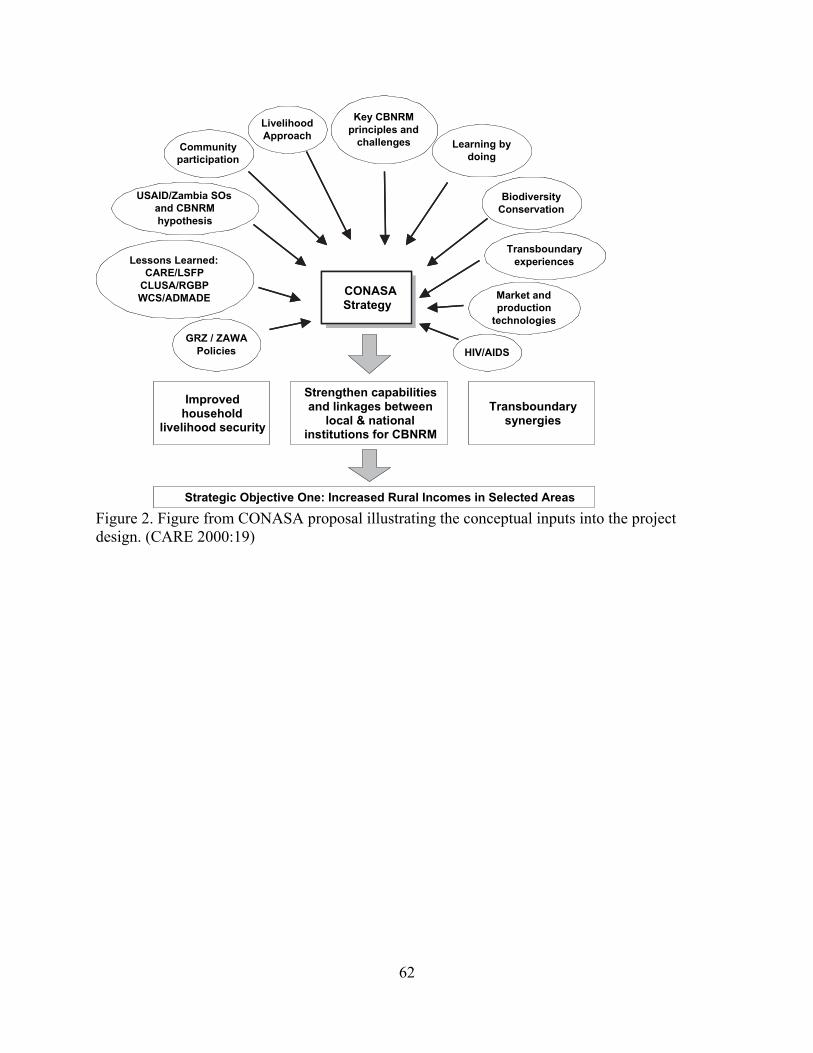
62
Lessons Learned:CARE/LSFP
CLUSA/RGBPWCS/ADMADE
HIV/AIDS
Communityparticipation
Key CBNRMprinciples and
challenges
Market andproduction
technologies
Transboundaryexperiences
GRZ / ZAWAPolicies
USAID/Zambia SOsand CBNRMhypothesis
CONASAStrategy
Improvedhousehold
livelihood security
Transboundarysynergies
Strengthen capabilitiesand linkages between
local & nationalinstitutions for CBNRM
Strategic Objective One: Increased Rural Incomes in Selected Areas
Learning bydoing
LivelihoodApproach
BiodiversityConservation
Figure 2. Figure from CONASA proposal illustrating the conceptual inputs into the project design. (CARE 2000:19)
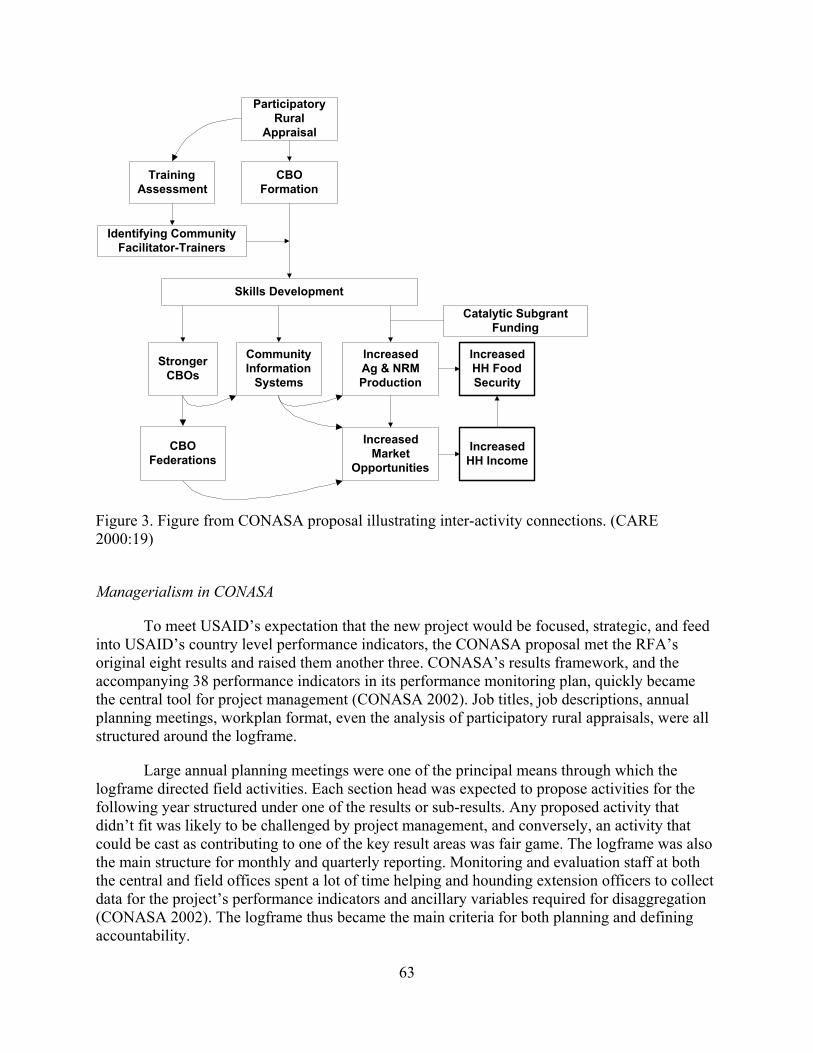
63
ParticipatoryRural
Appraisal
CBOFormation
Identifying CommunityFacilitator-Trainers
Skills Development
StrongerCBOs
IncreasedAg & NRMProduction
CBOFederations
CommunityInformation
Systems
IncreasedMarket
Opportunities
Catalytic SubgrantFunding
IncreasedHH FoodSecurity
IncreasedHH Income
TrainingAssessment
Figure 3. Figure from CONASA proposal illustrating inter-activity connections. (CARE 2000:19)
Managerialism in CONASA
To meet USAID’s expectation that the new project would be focused, strategic, and feed into USAID’s country level performance indicators, the CONASA proposal met the RFA’s original eight results and raised them another three. CONASA’s results framework, and the accompanying 38 performance indicators in its performance monitoring plan, quickly became the central tool for project management (CONASA 2002). Job titles, job descriptions, annual planning meetings, workplan format, even the analysis of participatory rural appraisals, were all structured around the logframe.
Large annual planning meetings were one of the principal means through which the logframe directed field activities. Each section head was expected to propose activities for the following year structured under one of the results or sub-results. Any proposed activity that didn’t fit was likely to be challenged by project management, and conversely, an activity that could be cast as contributing to one of the key result areas was fair game. The logframe was also the main structure for monthly and quarterly reporting. Monitoring and evaluation staff at both the central and field offices spent a lot of time helping and hounding extension officers to collect data for the project’s performance indicators and ancillary variables required for disaggregation (CONASA 2002). The logframe thus became the main criteria for both planning and defining accountability.
64
The logframe served another purpose essential for project management, stabilizing internal relations between consortium partners. As the project rolled out, several proposed activities were severely under-budgeted, and allocation of resources across the three components, organizations, and field offices became increasingly delicate. Managers were also concerned about moves by the parent NGOs to co-opt project resources or take actions under the CONASA banner that were not part of the workplan. As a project with financial resources but little institutional authority within the parent NGOs, CONASA’s managers relied upon the logframe’s technical stability and lesser fungibility than the master metaphors of CBNRM to negotiate these delicate tradeoffs.
Managers also employed the results framework to define and rationalize the project’s relations with external actors. CONASA’s guiding principle for engagement with the government’s CBNRM program, as enshrined in the logframe, was to support ‘bottom-up’ CBNRM. This translated into trainings and logistical support for the fledging Community Resource Boards, and establishing forums for national and regional CBNRM networks. However the lack of any significant support for the Zambia Wildlife Authority (ZAWA) was a marked departure from previous projects and fueled a perception within ZAWA that CONASA had taken money that was rightfully due to government. In the words of one senior ZAWA manager:
CONASA is viewed as a competitor to ZAWA. People [in ZAWA] would have loved the capacity building going on to have come to ZAWA. Communities are comparing ZAWA to CONASA, and CONASA is coming out more favorably because it has resources that ZAWA doesn't. To negotiate this and other delicate relationships, CONASA managers again relied upon
the project logframe, invoking its stability as a binding contract that had already been agreed upon and could not be altered. Through its roles in structuring accountability, internal resource allocation, and external relations, the logframe thus assumed a status beyond that of a mere planning tool or caricature of the project. Instead it became the official representation of both how the project operated and why it existed.
As both hull and rudder, the logframe was instrumental in keeping resources focused on a core set of interventions, but also created unintended consequences. Monitoring within the project became dominated by USAID’s reporting requirements, relegating other evaluation issues, such as perceptions of the project, indirect effects, and differential impacts, to the back burner. Reporting consumed a great deal of time for field staff, leading to complaints that “we spend so much time reporting, we have nothing to report on”.
Under pressure to achieve performance targets, field staff quickly learned the most expedient way to demonstrate impact was to step in directly wherever an activity was faltering. Project staff thus went beyond the traditional roles of trainers, facilitators, and distributors of subsidized inputs, and began managing community initiatives directly. They served as pro bono middle men between farmers and agro-businesses, managed construction projects that had stalled, and prepared presentation materials on policy when a civil society counterpart could not be found. One external reviewer, describing the micro-enterprise section, observed, “Through supply-led interventions, these enterprises have been provided with business development services and capital, additionally CONASA is running businesses” (Luqman 2004:2).
65
As the economic and political context within which CONASA operated shifted and core assumptions underlying the project model eroded, the stability of the project logframe gradually switched from being an asset to a liability. Many of CONASA’s activities had been designed to ‘add value’ to other ongoing processes, in keeping with USAID’s philosophy of maximizing efficiency and leveraging other resources. The crowded ‘assumptions’ column of the logframe included the ongoing disbursement of safari hunting revenue through Community Resource Boards, the growth of markets for agricultural products, and development of broader network of civil society organizations mobilized around CBNRM.
Regrettably for the project, many of these external processes never materialized. Due to election year politics, all safari hunting was banned by Presidential decree for the first two years, and a court injunction halted hunting in most of the project area for a third year. Meanwhile, ZAWA had minimal presence in the field due to a bumpy restructuring, and many of the formal CBNRM activities including law enforcement, elections, and land use planning were put on hold. Civil society was also misbehaving. Few of the civic organizations that attended the advocacy trainings viewed CBNRM as one of their core interests, and the agro-businesses that CONASA had hoped would buy the communities’ increased production remained focused on the commercial sector (Lyons 2004). Despite quite a few significant changes in the operational context, the original results framework continued to serve as the official compass.
Tensions between programmatic and operational logics
The centrality of the project logframe also contributed to growing fissures between the project’s official narrative and operational logic. CONASA’s discursive coherence relied heavily upon the idea of synergy and spin-offs, and strategies to create linkages across components and scales frequently arose at planning meetings. Field staff were well versed in programmatic approaches to maximize opportunities for synergy, including targeting criteria, reaching saturation levels, and spatial and temporal continuity, yet creating connections was always secondary to achieving core results. There were few incentives or mechanisms for program staff to traverse activity areas, as a manager noted in 2003: “[Livelihood component] staff are hesitant to get into resource management issues. When they try to get involved with conservation issues they get hammered on all sides…livelihood activities give them a role they know and is safe.”
Another fissure between the programmatic and operational logics emerged in the form and function of community participation. Local participation is a central tenet of both CBNRM and the sustainable livelihoods approach, and the RFA cited a lack of genuine participation as one of the underlying reasons for the limited performance of Zambia’s early CBNRM programs. USAID also took the unusual step of not merely stressing that the project should be “based on the aspiration and needs of Game Management Area communities”, but explicitly specified a mandatory result for the project logframe: “Strategy and methodologies for increasing broad-based community participation identified and tested” (USAID/RCSA 2000b:31). To assess local needs and aspirations, CARE conducted eight participatory rural appraisals (PRAs) during the proposal development, and a second round of PRA exercises six months after the project document was finalized. These were then followed a couple of months later by another round of community ‘negotiations’ during which specific activities and timetables were finally agreed upon (CONASA 2001a).
66
Compromise between projects and their ‘beneficiaries’ is often needed for a project to move forward (Li 1999). Rural communities in Zambia in particular have long interacted with outsiders from both government and NGOs, and many have become adept negotiators in relationships in which they may have little capacity to initiate but great capacity to redirect and veto. CONASA’s extension staff were also highly experienced, many having originally come from the Ministry of Agriculture before being recruited by CARE and WCS, and knew how to navigate the middle ground between project management and villagers. The seasoned ability on both sides to compromise was brought into service when it became apparent that there was a significant gap between project goals and what people in the communities wanted. The top constraints that repeatedly arose during the PRAs were a lack of dry season water sources, clinics, schools, credit, and agricultural inputs (CONASA 2001a). However USAID funding guidelines didn't allow water projects, schools or clinics. Insufficient private sector investment, human-wildlife conflicts, and resource degradation ranked near the bottom if at all, and few community members were interested in doing market research for non-timber forest products, creating bylaws to restrict local resource use, conducting policy advocacy, or developing joint venture tourism projects.
In the end, what emerged was a set of activities remarkably similar to what had been done under the Livingstone project: a series of trainings on group capacity building and gender sensitivity, village-based seed multiplication schemes, input loans coupled with ag extension, and micro-funding for small-scale environmentally-friendly businesses. Added to this mix were a handful of flagship activities more readily recognized as proper ‘conservation,’ including a community campsite, a study tour to CBNRM programs in neighboring countries, and several workshops on CBNRM policy (Lyons 2004). This suite of activities met the needs of nearly all actors. Rank and file community members received access to agricultural inputs and micro-finance. Local elites gained political capital by helping shape community projects and attending workshops that provided them knowledge, per diem, and opportunities to tap into wider social networks. For their part, CONASA field staff were welcomed into the communities and provided relatively low-risk opportunities to achieve impact within the time frame specified by the logframe.
Developing the Project Narrative
While compromise around project activities secured support at the local level, bigger challenges lay in maintaining cohesion and support within the NGO consortium and its external partners. CONASA’s core NGOs found themselves under the same roof after USAID’s funding opportunity produced common interests, but they came to the marriage with different institutional histories and strategic interests. The difficulties of three large international NGOs working together and presenting ‘one face’ to the world was on the agenda from the very first staff meetings. The creation of a project identity that would mesh with the needs of the primary NGOs and counter-balance the centrifugal force of institutional interests was thus a priority for project management during the first year.
The project to define the project was initially sidetracked by another legacy of the proposal development process, the project name. CONASA was initially called “INSAKA", a name that coincided with a nice acronym (Improving Natural Resource Management and Sustainable Agriculture in the Kafue Area) and also means ‘meeting place’ in Chibemba.
67
Unfortunately, another CARE project had already taken the name, and the communities in the project area, who were predominantly Tonga and Ila, objected to being branded by a word from another ethnic group. Thus one of the very first tasks was finding a new name for the project, a process which took several months during which the project was called simply ‘the project formerly known as INSAKA’.
At the community level, many people were initially suspicious of CONASA, believing it was part of ZAWA, while others assumed it was a continuation of CARE’s Livingstone project. As the project rolled out and activities were negotiated, the edges of CONASA gradually became defined, if eclectic. Agricultural extension staff and community members knew it as a food security project, workshop attendees knew it as a policy and advocacy project, and enterprise group members came to know it as a micro-enterprise project.
Developing an identity for the project as a whole was a slower process. The master metaphors invoked in the project proposal – empowerment, devolution, participation, sustainable livelihoods, civil society, and transboundary connections – were individually insufficient to capture the totality of the project’s scope. The discursive glue that CONASA's leadership applied to establish connections across components was the dual promise of spin-offs, in which one activity triggers desirable outcomes in another domain, and synergy, whereby related activities produce an impact greater than the sum of the parts.
Despite the successful implementation of most individual activities and explicit efforts to link program components, developing the foundation for a broader narrative about synergy and spin-offs remained elusive. In an effort to bridge scales, policy staff brought community leaders to the capital so national level actors might “hear it from the communities” (CONASA 2001b), but with ZAWA in disarray and a complex political relationship between communities and the State, there were no tangible changes in policy. Efforts by AWF’s Conservation Service Center (CSC) in Livingstone to create transboundary economic linkages between communities in the Kafue area and the neighboring countries were spatially and sectorially dispersed and bore little fruit, prompting other staff to dub the CSC the ‘Confused Service Center.’ A contracted study looking for synergy between livelihood security and conservation, arguably the most important form of synergy in CBNRM, concluded that causation was both positive and negative with little impact from the project’s activities (Whiteside 2004).
To communicate its work to a national audience, CONASA sponsored media events, produced newsletters, maintained a website, and commissioned two short promotional videos attempting to explain not just what it was doing but also why. The semi-official slogan used to synthesize the project’s strategy was “we promote household livelihood security using the tools of CBNRM,” but this tag line fell short of a narrative that could maintain interest at national and international levels. USAID was keen on seeing examples of market success, the conservation community was interested in seeing the formal CBNRM structures work, and other potential donors were interested in robust and holistic livelihood approaches that lifted up the rural poor. CONASA did all of these but none well enough to craft compelling stories or attract attention. In this discursive vacuum the project logframe remained the primary creation story.
Seeing the writing on the wall, CONASA’s management stepped up efforts in 2004 to develop the project ‘brand’. They explored the possibility of reframing the project as being
68
rights-based, but this was an unfamiliar discourse and did not mesh well with existing rationalities nor resonate with USAID’s preference for market driven development. ZAWA, for its part, was not an advocate for the project, having been largely excluded, and the conservation NGOs were not amassing evidence to validate their conservation models.
Despite repeated indications that "Phase-II" funding would be forthcoming, USAID never contracted their own evaluation of CONASA and instead switched priorities when they issued a RFA for a new project in late 2004. The new RFA called for business development services and financing for small scale commercial agriculture, arguably what CONASA was worst at, with no mention of biodiversity conservation, policy advocacy, or strengthening food security in agriculturally marginal areas (USAID/Zambia 2004). With no other serviceable patron to turn to, CONASA as a project came to an end.
Discussion
Are Two Discourses Better than One? The Search for Synergy in CBNRM
The promise of synergy and spin-offs has long been a central element of the CBNRM narrative. In early CBNRM projects, the devolution of rights coupled with livelihood interventions was hypothesized to reorient the relationship of communities with natural resources in ways that would both reduce poverty and conserve wildlife (Hulme and Murphree 2001). Later, the democratization of local environmental governance was hypothesized to trigger more conservation friendly policies and make conservation areas more conducive for ‘partnerships’ with external investors. As private capital and markets increasingly became the preferred means to kick-start sustainable development in conservation areas, two-fold win-win solutions expanded to “'win-win-win-win-win-win-win’ equations that benefit alike corporate investors, national economies, biodiversity, local people, western consumers, not to mention the World Bank and the BINGOs…” (Grandia 2007:487). With the addition of TBNRM, we can increase the number of wins even further, adding peace, cultural renewal, and restoration of ecosystem services—up to ten simultaneous wins.
Despite the allure of synergy, the majority of CBNRM reviews have solidly concluded that tradeoffs rather than synergistic effects are far more the norm in CBNRM programs (e.g., Hughes and Flintan 2001; Kellert et al. 2000; Wunder 2001; Agrawal and Redford 2006). CONASA’s experience falls within this camp, for although many activities were successful in their own right, connections between activities and across scales generally failed to materialize. How does one explain this marked and systematic disjuncture between rhetoric and reality, and how do we explain continuous promises to deliver synergy when there’s such little evidence that it’s a realistic outcome? Put another way, what work could possibly be achieved, and for whom, by continuously making such dubious claims?
The answer to these questions requires looking at the birth and social dynamics of projects. CONASA’s ability or inability to achieve synergy was shaped not only by the real potential for connections across activities, but also by a project design and management approach structured around narrowly defined and pre-determined performance indicators. Synergy was far more potent at the discursive level, providing a conceptual glue that was desperately needed at the onset to bond together multiple paradigms and organizations, and the past with the future.
69
The substance of the double-arrowed lines on the project diagram were ambiguous, but it was enough to keep the inevitable tradeoffs in the field and within the consortium from bleeding into the project’s public persona. However, this discourse struggled internally as management incentives and institutional interests favored a ‘separate but parallel’ model, to the point where staff began to openly question whether in fact there were actually not one but “three CONASAs”.
Between the Office and the Village: The Construction and Mediation of Neoliberal Conservation
The view from within sheds light on two other patterns often noted in critical studies of conservation: the derailing of CBNRM principles when institutionalized and bureaucratized, and conversely the specificities through which neoliberal policies are mediated during implementation (Dressler et al. 2010; Igoe and Brockington 2007).
CONASA's birth story helps explain how and why the project design was far more complex than its constituent models for livelihood security and natural resource devolution. USAID was eager to replicate, and thus validate, the models of its previous projects, as well as incorporate the latest ideas about bringing civil society closer to government. Overlain on this experimental fusion was a donor-defined timeline, the administrative complexities of a multi-NGO consortium, and the demands of a results-based management system in which accountability took the form of unidirectional accountancy all the way back to Washington. Under such conditions, it is little wonder that the operational logic privileged quick-fixes over genuine empowerment, and why project managers were preoccupied with reporting and developing a narrative that could pull all the pieces together. The irony was the pressure to produce results even precluded any serious possibility of correcting rural market failures, which take far longer and require far more collaboration than was possible under the logframe.
Despite gestures of community participation, CONASA was largely configured in Lusaka, Gaborone, and Washington, and the core of its design reflected continuity with USAID’s previous investments and attempts to extend market forces in conservation areas and widen the field of environmental governance to new sets of actors. We are cautioned, however, not to view neoliberalization as an inevitable, homogenous transformative project flowing from the core to the periphery, but rather as a highly variable bundle of processes that flow in multiple directions, are mediated by cultural and historical specificities, and can be co-opted, resisted, deflected, and transformed into new hybrids (Igoe and Brockington 2007; McCarthy 2006).
The trajectory of CONASA also provides an example of the transformation of a neoliberal package as it traveled from donor and NGO offices to the village. As with other cases where local politics trumped discursive power (cf. O'Reilly 2010; King 2009; Corson 2012), CONASA's neoliberal package was reconfigured during the necessary negotiations and compromises of implementation. At the end of the day, far more was spent on standard input packages than reducing the transaction costs of inefficient markets; the project coughed up the money for the community campground when no external investors materialized; more ‘beneficiaries’ received income through workshop per diem than emergent transboundary enterprises; civil society said they didn’t want a seat at the table unless it came with a sitting allowance; and the Zambia Wildlife Authority was still around to wave goodbye as the last field staff locked the doors and drove back to Lusaka. In other words, while CONASA’s project
70
design invoked a number of neoliberal aspirations and logics, much of what took place on the ground, and who ultimately called the shots at the local level, reflected ‘business as usual’ developmental politics.
Conclusion
The apparent ‘rise’ and ‘fall’ of CONASA can not be well explained from the principles of CBNRM, the characteristics of Zambia’s southern province, nor even by theories of the preconditions for synergy between conservation and development. Rather, it can only be fully understood when seen as a set of social relations that hinged around a complex project model that obtained its charisma from a fusion of discourses and institutional relations from previous projects, but could not hold together nor bend in new directions under the actual conditions of implementation.
Projects that come to life through a joining of models and institutional interests, then collapse from disintegration or dilution, are neither uncommon nor unexpected in CBNRM. Born within the layer of discursive blur preferred by apex conservation organizations and donors (Büscher and Dressler 2007), such complex, over-ambitious project designs ‘work’ in donor funding systems by attracting attention, validating previous investments, sustaining existing relationships, and masking internal diversity and tensions needed to recruit allies (Mosse 2005). But as we have seen, although tradeoffs and contradictions can be masked by master metaphors they can not be easily written out of existence. Rather they become integrated into the infrastructure, “as hidden fault lines as the project hardens into text, project model, legal agreement, organization, rules and tasks” (ibid). Managerialism is one way consortium projects like CONASA keep centrifugal forces in check, but the ensuing rigidity can be self-defeating when the project needs to adapt to new circumstances or cultivate a new narrative through which it can translate itself (Latour 1996).
Unmasking the dynamics within project also reveals opportunities for making them work better. Consortium arrangements can expand the expertise available with a project and simplify administration for the funder, but as the CONASA story bears out, they are also highly contingent on institutional history and culture, and can create challenges for developing cohesion and synergy. Similarly, "results-based" management tools such as logframes have useful roles but also come with inherent tradeoffs. They can be an asset when the expected results are relevant to the context and allowed to evolve, but a liability when they constrain innovation, become administrative burdens, or are used for purposes that require a more holistic frame of reference. The input of extension workers and other front line staff who do the necessary work of negotiation and compromise is central to keeping programming and performance targets aligned with reality. Ultimately, the scope and direction of accountability play a major role in the divergence between programmatic and operational logics. These dynamics can all be managed, but finding ways to make projects work better hinges upon making them visible in the first place.
References
Adams WM, Hulme D (2001) If community conservation is the answer in Africa, what is the question? Oryx 35 (3):193-200
71
Agrawal A, Redford K (2006) Poverty, Development, and Biodiversity Conservation: Shooting in the Dark? WCS Working Papers. Wildlife Conservation Society, Bronx, NY
Ankersen T, Hamann R (1995) A Statutory Framework for Reform of the National Parks and Wildlife Act of 1991, Republic of Zambia. Center for Governmental Responsibility, University of Florida College of Law, Gainesville, FL
Blaikie P (2006) Is Small Really Beautiful? Community-based Natural Resource Management in Malawi and Botswana. World Development 34 (11):1942-1957
Brosius JP, Russell D (2003) Conservation from Above: Imposing Transboundary Conservation. Journal of Sustainable Forestry 17 (1):39-65
Brown K, Vondal P, Benya L (1996) Planning and Managing for Results with Teams, Customers, and Partners in the Reengineered USAID: Observations from the Field. U.S. Agency for International Development, Washington
Büscher B (2010) Seeking 'Telos' in the 'Transfrontier'? Neoliberalism and the Transcending of Community Conservation in Southern Africa. Environment and Planning A 42:644-660. doi:doi:10.1068/a42140
Büscher B, Dressler W (2007) Linking Neoprotectionism and Environmental Governance: On the Rapidly Increasing Tensions between Actors in the Environment-Development Nexus. Conservation and Society 5 (4):586-611
CARE (2000) INSAKA Technical Proposal: A CBNRM Support Project for the Greater Kafue Area. CARE International in Zambia, Lusaka
CDIE (1996) Preparing a Performance Monitoring Plan. USAID Center for Development Information and Evaluation, Washington
Chambers R, Conway G (1992) Sustainable rural livelihoods: Practical concepts for the 21st century. IDS Discussion Paper 296. Institute of Development Studies, Brighton, UK
Clarke J (2000) Evaluation of Wildlife Conservation Society's Administrative Management Design (ADMADE) project. Associates in Rural Development for USAID/Zambia, Lusaka
CONASA (2001a) Negotiations and Options Assessments for Bbilili, Kalobe, Mulanga, Nanzhila, Nguba, Nkandazovu, and Chilala VAGs. CARE International, Lusaka, Zambia
CONASA (2001b) Proceedings of Wildlife Sector Stakeholders Forum: "Hear it from the Communities". CARE International, Lusaka, Zambia
CONASA (2002) Performance Monitoring System. CARE International, Lusaka, Zambia Corson C (2008) Mapping the Development Machine: The US Agency for International
Development’s Biodiversity Conservation Agenda in Madagascar. Dissertation, University of California at Berkeley, Berkeley
Corson C (2012) From Rhetoric to Practice: How High-Profile Politics Impeded Community Consultation in Madagascar's New Protected Areas. Society & Natural Resources 25 (4):336-351
Dressler W, Büscher B, Schoon M, Brockington DAN, Hayes T, Kull CA, McCarthy J, Shrestha K (2010) From hope to crisis and back again? A critical history of the global CBNRM narrative. Environmental Conservation 37 (01):5-15. doi:doi:10.1017/S0376892910000044
Ernst & Young (1998) USAID Report on the Wildlife Conservation Revolving Fund Financial Management Capacity. USAID/Zambia, Lusaka
Fabricius C, Koch E (eds) (2004) Rights, Resources, and Rural Development: Community-based Natural Resource Management in Southern Africa. EarthScan, London
72
Gasper D (2000) Evaluating the logical framework approach towards learning-oriented development evaluation. Public Administration and Development 20:17-28
Gibson C (1999) Politicians and poachers: The political economy of wildlife policy in Africa. Political Economy of Institutions and Decisions. Cambridge University Press, Cambridge, UK
Gibson CC, Marks SA (1995) Transforming rural hunters into conservationists: An assessment of community-based wildlife management programs in Africa. World Development 23 (6):941-957
Grandia L (2007) Between Bolivar and Bureaucracy: The Mesoamerican Biological Corridor. Conservation and Society 5 (4):478-503
Griffin J, Cumming D, Metcalfe S, t’Sas-Rolfes M, Singh J, Chonguiça E, Rowen M, Oglethorpe J (1999) Study on the Development of Transboundary Natural Resource Management Areas in Southern Africa. Biodiversity Support Program, Washington
GRZ (1998) The Zambia Wildlife Act, 1998. Government of the Republic of Zambia, Zambia Hachileka E, Chundama M, Mupimpila C (1999) The effectiveness of benefit sharing schemes in
community based wildlife resource management programmes in Zambia. The Study Fund. Social Recovery Project, Lusaka
Hughes R, Flintan F (2001) Integrating Conservation and Development Experience: A Review and Bibliography of the ICDP Literature. Biodiversity and Livelihoods Issues No. 3. International Institute for Environment and Development, London
Hulme D, Murphree M (eds) (2001) African Wildlife and African Livelihoods: The Promise and Performance of Community Conservation. James Currey, Oxford
Hutton J, Adams WM, Murombedzi JC (2005) Back to the barriers? Changing narratives in biodiversity conservation. Forum for Development Studies 32 (2):341-370
Igoe J, Brockington D (2007) Neoliberal Conservation: A Brief Introduction. Conservation and Society 5 (4):432-449
Kellert SR, Mehta JN, Ebbin SA, Lichtenfeld LL (2000) Community natural resource management: promise, rhetoric, and reality. Society and Natural Resources 13 (8):705-715
King B (2009) Commercializing conservation in South Africa. Environment and Planning A 41 (2):407-424
Latour B (1996) Aramis or the Love of Technology. Harvard University Press, Cambridge Lewis DM, Alpert P (1997) Trophy hunting and wildlife conservation in Zambia. Conservation
Biology 11 (1):59-68 Lewis DM, Tembo N (1999) Improving Food Security to Reduce Illegal Hunting of Wildlife.
ADMADE Lessons-Learned Paper. African College for CBNRM, Mfuwe, Zambia Li T (1999) Compromising Power: Development, Culture, and Rule in Indonesia. Cultural
Anthropology 14 (3):295-322 Luqman A (2004) Special Study on Enterprise Development in CONASA. CARE International
in Zambia, Lusaka Lyons A (2000) Common Ground: Lessons Learned from USAID/Zambia Investments in
Agriculture and Natural Resource Management. Associates in Rural Development for USAID/Zambia, Lusaka
Lyons A (2004) Munwe omwe taupwai njina: An internal mid-term evaluation of CONASA. CARE International, Lusaka, Zambia
73
Lyons A, Johnson A, Mwila G, Muyaba A (2000) Charting a Course to Food Security in Southern Province: Mid-Term Evaluation of the CARE Livingstone Food Security Project. Associates in Rural Development for USAID/Zambia, Lusaka, Zambia
Manspeizer I (2004) Considering Wildlife Conservation in Zambia at the Turn of the Millennium. State University of New York at Binghamton, Binghamton, NY
Marks SA (2001) Back to the Future: Some Unintended Consequences of Zambia's Community-Based Wildlife Program (ADMADE). Africa Today 41 (1):120-141
Matenga C (1999) Community-Based Wildlife Management Schemes in Zambia: Empowering or Disempowering Local Communities? Paper presented at the African Environments – Past and Present, Oxford, 5-8 July, 1999
McCarthy J (2006) Devolution in the Woods: Community Forestry as Hybrid Neoliberalism. Environment and Planning A 37 (6):99-1014
Mosse D (2004) Is Good Policy Unimplementable? Reflections on the Ethnography of Aid Policy and Practice. Development and Change 35 (4):639-671
Mosse D (2005) Cultivating Development: An Ethnography of Aid Policy and Practice. Pluto Press, London
Neme LA, Collings E (1999) Inventory of USAID's Existing Environmental Portfolio in Southern Africa. USAID, Washington, DC
O'Reilly K (2010) The Promise of Patronage: Adapting and Adopting Neoliberal Development. Antipode 42 (1):179-200
Osborne D, Gaebler T (1992) Reinventing government: How the entrepreneurial spirit is transforming the public sector. Plume, New York
Sartorius R (1991) The logical framework approach to project design and management. Evaluation Practice 12 (2):139-147
Tsing AL, Brosius JP, Zerner C (2005) Introduction: Raising Questions about Communities and Conservation. In: Brosius JP, Tsing AL, Zerner C (eds) Communities and Conservation: Histories and Politics of Community-Based Natural Resource Management. Altamira Press, Walnut Creek, CA,
ULG Consultants Ltd (1994) Mid-term planning assessment of the Natural Resources Management Project Zambian component. USAID, Harare
USAID (2012) Workshop Announcement: Community-Based Natural Resource Management (CBNRM): Cutting Across Multi-Sector Divides, January 16-17, 2013. http://events.r20.constantcontact.com/register/event?oeidk=a07e5wg1ffd28160494 [accessed on 2012/11/17].
USAID/RCSA (2000a) Request for Applications (RFA) 690-00-007 Amendment One. USAID, Gaborone
USAID/RCSA (2000b) Request for Applications (RFA) 690-00-007: Community Based Natural Resource Management Cooperative Agreement. USAID, Gaborone
USAID/Zambia (1998) Promise to Keep: From Reforms to Benefits for Zambians. Country Strategic Plan 1998-2002. USAID/Zambia, Lusaka
USAID/Zambia (2004) Request for Applications (RFA) Number 690-05-003 USAID/Zambia Strategic Objective No. 5 (SO#5) - Production, Finance and Technology (PROFIT) Program. USAID/Zambia, Lusaka
Wainwright C, Wehrmeyer W (1998) Success in Integrating Conservation and Development? A Study from Zambia. World Development 26 (6):933-944

74
Whiteside M (2004) A Special Study on The Linkages Between the Livelihood Approach and Natural Resource Production in CONASA. CONASA, Lusaka, Zambia
Wolmer W (2003) Transboundary Conservation: The Politics of Ecological Integrity in the Great Limpopo Transfrontier Park. Journal of Southern African Studies 29 (1):261-278
Wunder S (2001) Poverty Alleviation and Tropical Forests: What Scope for Synergies? World Development 29:1817-1833
75
CHAPTER 4.
HOME RANGE PLUS: A SPACE-TIME CHARACTERIZATION OF MOVEMENT OVER REAL LANDSCAPES
Introduction
Recent advances in GPS and data transmission technologies have greatly increased the volume, accuracy, affordability, and ancillary variables integrated with movement data (Hebblewhite and Haydon 2010; Tomkiewicz et al. 2010), creating both opportunities and challenges for ecologists (Cagnacci et al. 2010; Urbano et al. 2010).
One of the most common uses of location data has been the estimation of home ranges and utilization distributions (UDs) (Kie et al. 2010). Minimum convex polygons (MCPs) were among the earliest home range construction techniques, and are still widely used (Laver and Kelly 2008) despite their well-known biases in range estimation, sensitivity to point geometry, and inability to differentiate internal space (Burgman and Fox 2003; Nilsen et al. 2008; Downs and Horner 2008). In the 1980s, kernel density estimators (KDE) for constructing UDs (Worton 1989) were developed and became quickly popular. These methods, based on the superposition of Gaussian or compact (e.g. uniform or Epinechnikov) kernels, are more suitable for concave geometries, can construct probability contours, and are easy to use due to their implementation in a variety of software packages (Laver and Kelly 2008). More recent methods combine the simplicity of polygon methods with the robustness of kernel methods by superimposing and then aggregating non-parametric shapes constructed around each point, including Voronoi polygons (Casaer et al. 1999), Delaunay triangles (Downs and Horner 2009), and local MCPs (Getz et al. 2007; Getz and Wilmers 2004).
These classic home range methods generally treat locations as independent, an assumption especially violated with regularly sampled GPS locations. Techniques to correct for serial correlation include resampling the data (Rooney et al. 1998; Harris et al. 1990) and applying weights based on temporal density (Katajisto and Moilanen 2006). However other methods have been developed that take advantage of the information contained in serial correlation by modelling the movement between known locations. Among these are the Brownian bridge movement model (BBMM) method that constructs kernel density surfaces above each movement segment based on a diffusion model and the spatial uncertainty of each end point (Horne et al. 2007). Enhancements to BBMM refine the bridge model between known locations by dynamically adjusting diffusion rates based on an independent segmentation of the trajectory into discrete behaviour modes (Kranstauber et al. 2012). Similarly, movement based KDE (MKDE) incorporates serial correlation by interpolating additional points between known locations based on activity time (Benhamou and Cornélis 2010), with options to detect and correct for boundary constraints (Benhamou and Cornélis 2010), and incorporate an anisotropic advective component into the local kernel (Benhamou 2011). More recently, a non-KDE movement-based method based upon time-geography theory constructs elliptical spatiotemporal potential path areas (PPA) between known locations based on the animal's maximum theoretical velocity (Long and Nelson 2012).
76
Such movement-based home range methods explicitly incorporate information contained in temporal auto-correlation, but are still essentially models of space-use. Other methods aim to infer behavioural clues from movement data based upon the temporal patterns in the data, including variations in the amount of time spent near each location (Barraquand and Benhamou 2008; Fauchald and Tveraa 2003), periodicities in step length (Polansky et al. 2010; Wittemyer et al. 2008), path recursions (Bar-David et al. 2009), and fractal searching behaviour (Tremblay et al. 2007). To shed light on behavioural mechanisms, such temporally-sensitive characterizations of movement can be combined with maps of vegetation and other resources via spatiotemporal statistical models (Preisler et al. 2004; Sims et al. 2008), process-based stochastic state space models (Morales et al. 2004; Jonsen et al. 2003; Patterson et al. 2008), agent-based models (Tang and Bennett 2010; Railsback and Harvey 2002), and cognitive models (Bartumeus and Levin 2008).
Although progress has been made in developing methods that quantify space-use and behavior (Getz and Saltz 2008), these advances have not, in general, been well-integrated (Börger et al. 2008). Home range estimators commonly ignore time other than for time-interval windowing (Laver and Kelly 2008; Nielsen et al. 2003), while spatiotemporal and space-state models are often divorced from a model of space-use. Far fewer techniques model space-use and time-use simultaneously, with important exceptions being joint space-time utilization distributions (Keating and Cherry 2009) and time weighted MKDE which combines movement KDE with an adaptation of the time-of-first passage method (Benhamou and Riotte-Lambert 2012).
Here we present Time Local Convex Hull (T-LoCoH) which generalizes the non-parametric utilization construction method, LoCoH (Getz et al. 2007). T-LoCoH integrates time with space in the construction of local hulls through a scaling that relates distance and time in reference to the individual's characteristic velocity. The resulting hulls are local in both space and time, enabling metrics for movement phase and multiple dimensions of time-use including revisitation and duration. By taking hulls, rather than individual points, as samples for analysis, T-LoCoH produces UDs with high fidelity to temporal partitions of space and can differentiate internal space either with a traditional density gradient or alternately various behavioral metrics, including time-use properties. This flexibility places T-LoCoH in a growing family of methods responding to the demand for more question-based home range methods (Fieberg and Börger 2012).
Methods
T-LoCoH is based upon LoCoH, a non-parametric Lagrangian method for constructing UDs from a set of locations by aggregating local MCPs constructed around each point (Getz and Wilmers 2004). The algorithm begins by identifying a set of nearest neighbours for each point using one of three rules. The k-method simply selects the kth nearest neighbours around each point. The r-method takes all points within a fixed radius r, while the adaptive a-method selects all points within a cumulative distance a. The value of k, a or r is provided by the analyst, who also decides whether duplicate locations should be ignored, deleted, or randomly offset by a fixed amount. Local convex hulls are constructed around each point and its nearest neighbours, then sorted by density which is proxied by hull area (k-method) or number of points enclosed with ties broken by area (r and a-methods). After sorting, hulls are cumulatively merged together
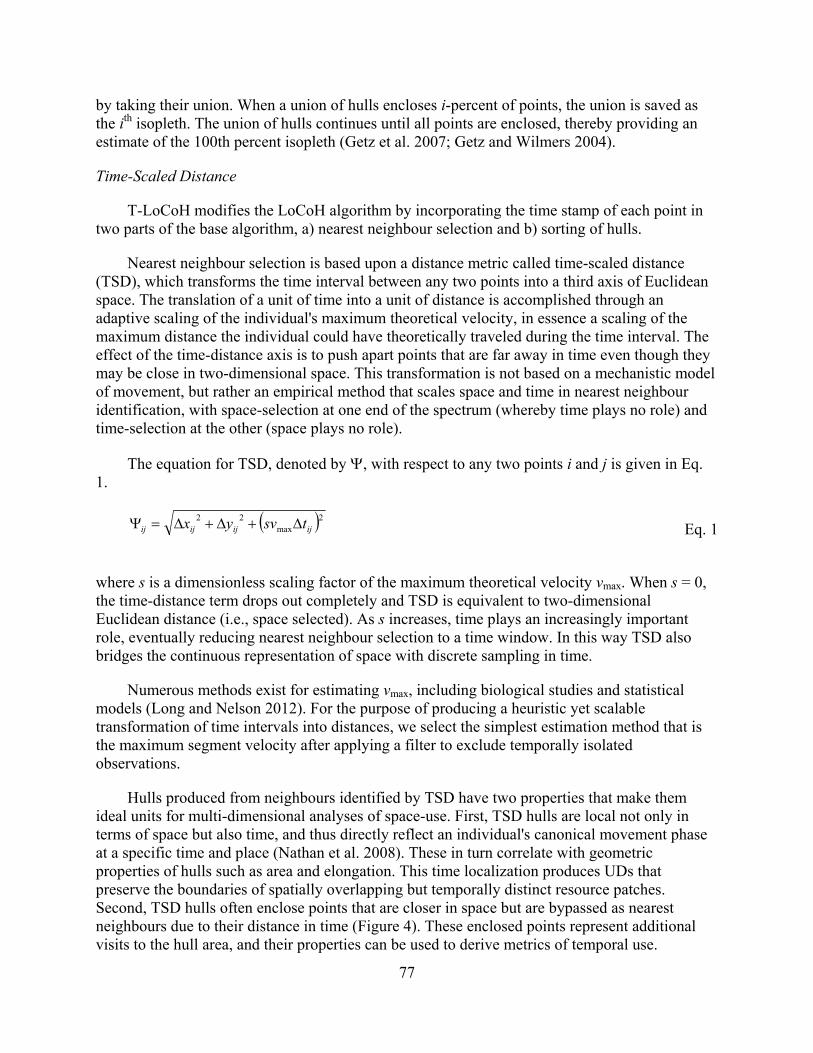
77
by taking their union. When a union of hulls encloses i-percent of points, the union is saved as the ith isopleth. The union of hulls continues until all points are enclosed, thereby providing an estimate of the 100th percent isopleth (Getz et al. 2007; Getz and Wilmers 2004).
Time-Scaled Distance
T-LoCoH modifies the LoCoH algorithm by incorporating the time stamp of each point in two parts of the base algorithm, a) nearest neighbour selection and b) sorting of hulls.
Nearest neighbour selection is based upon a distance metric called time-scaled distance (TSD), which transforms the time interval between any two points into a third axis of Euclidean space. The translation of a unit of time into a unit of distance is accomplished through an adaptive scaling of the individual's maximum theoretical velocity, in essence a scaling of the maximum distance the individual could have theoretically traveled during the time interval. The effect of the time-distance axis is to push apart points that are far away in time even though they may be close in two-dimensional space. This transformation is not based on a mechanistic model of movement, but rather an empirical method that scales space and time in nearest neighbour identification, with space-selection at one end of the spectrum (whereby time plays no role) and time-selection at the other (space plays no role).
The equation for TSD, denoted by , with respect to any two points i and j is given in Eq. 1.
2max22
ijijijij tsvyx Eq. 1
where s is a dimensionless scaling factor of the maximum theoretical velocity vmax. When s = 0, the time-distance term drops out completely and TSD is equivalent to two-dimensional Euclidean distance (i.e., space selected). As s increases, time plays an increasingly important role, eventually reducing nearest neighbour selection to a time window. In this way TSD also bridges the continuous representation of space with discrete sampling in time.
Numerous methods exist for estimating vmax, including biological studies and statistical models (Long and Nelson 2012). For the purpose of producing a heuristic yet scalable transformation of time intervals into distances, we select the simplest estimation method that is the maximum segment velocity after applying a filter to exclude temporally isolated observations.
Hulls produced from neighbours identified by TSD have two properties that make them ideal units for multi-dimensional analyses of space-use. First, TSD hulls are local not only in terms of space but also time, and thus directly reflect an individual's canonical movement phase at a specific time and place (Nathan et al. 2008). These in turn correlate with geometric properties of hulls such as area and elongation. This time localization produces UDs that preserve the boundaries of spatially overlapping but temporally distinct resource patches. Second, TSD hulls often enclose points that are closer in space but are bypassed as nearest neighbours due to their distance in time (Figure 4). These enclosed points represent additional visits to the hull area, and their properties can be used to derive metrics of temporal use.
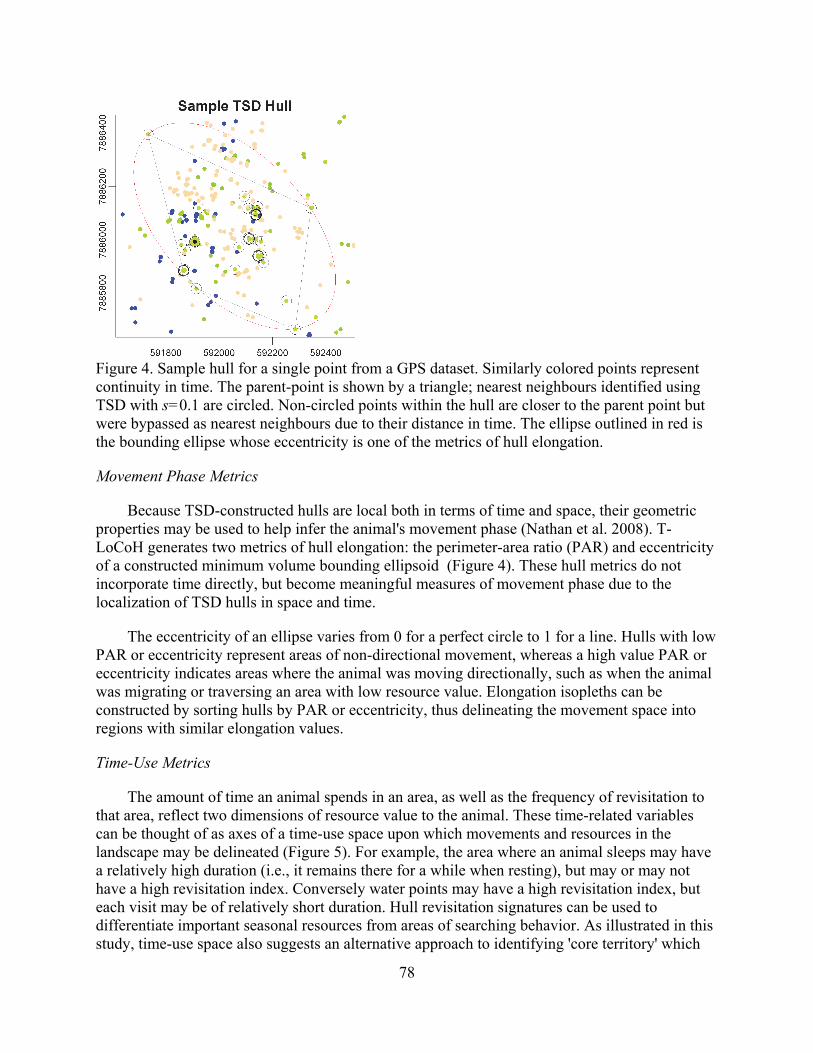
78
Figure 4. Sample hull for a single point from a GPS dataset. Similarly colored points represent continuity in time. The parent-point is shown by a triangle; nearest neighbours identified using TSD with s=0.1 are circled. Non-circled points within the hull are closer to the parent point but were bypassed as nearest neighbours due to their distance in time. The ellipse outlined in red is the bounding ellipse whose eccentricity is one of the metrics of hull elongation.
Movement Phase Metrics
Because TSD-constructed hulls are local both in terms of time and space, their geometric properties may be used to help infer the animal's movement phase (Nathan et al. 2008). T-LoCoH generates two metrics of hull elongation: the perimeter-area ratio (PAR) and eccentricity of a constructed minimum volume bounding ellipsoid (Figure 4). These hull metrics do not incorporate time directly, but become meaningful measures of movement phase due to the localization of TSD hulls in space and time.
The eccentricity of an ellipse varies from 0 for a perfect circle to 1 for a line. Hulls with low PAR or eccentricity represent areas of non-directional movement, whereas a high value PAR or eccentricity indicates areas where the animal was moving directionally, such as when the animal was migrating or traversing an area with low resource value. Elongation isopleths can be constructed by sorting hulls by PAR or eccentricity, thus delineating the movement space into regions with similar elongation values.
Time-Use Metrics
The amount of time an animal spends in an area, as well as the frequency of revisitation to that area, reflect two dimensions of resource value to the animal. These time-related variables can be thought of as axes of a time-use space upon which movements and resources in the landscape may be delineated (Figure 5). For example, the area where an animal sleeps may have a relatively high duration (i.e., it remains there for a while when resting), but may or may not have a high revisitation index. Conversely water points may have a high revisitation index, but each visit may be of relatively short duration. Hull revisitation signatures can be used to differentiate important seasonal resources from areas of searching behavior. As illustrated in this study, time-use space also suggests an alternative approach to identifying 'core territory' which
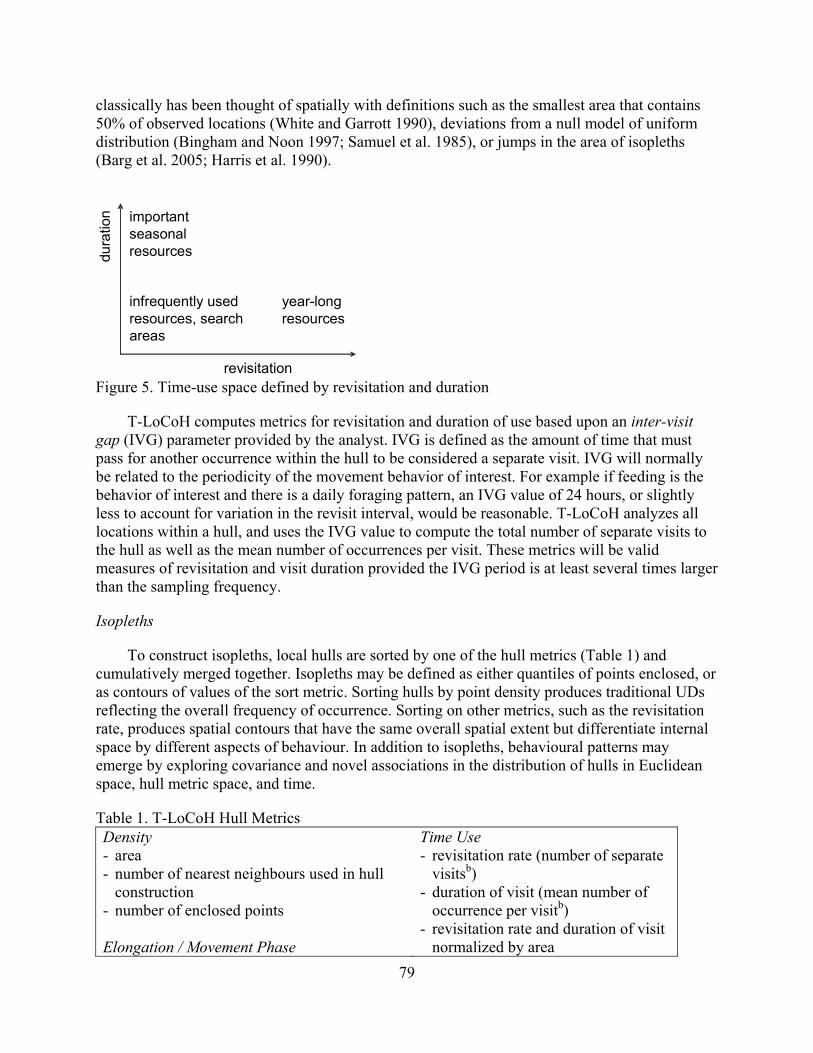
79
classically has been thought of spatially with definitions such as the smallest area that contains 50% of observed locations (White and Garrott 1990), deviations from a null model of uniform distribution (Bingham and Noon 1997; Samuel et al. 1985), or jumps in the area of isopleths (Barg et al. 2005; Harris et al. 1990).
revisitation
dura
tion
important seasonal resources
year-longresources
infrequently used resources, search areas
Figure 5. Time-use space defined by revisitation and duration
T-LoCoH computes metrics for revisitation and duration of use based upon an inter-visit gap (IVG) parameter provided by the analyst. IVG is defined as the amount of time that must pass for another occurrence within the hull to be considered a separate visit. IVG will normally be related to the periodicity of the movement behavior of interest. For example if feeding is the behavior of interest and there is a daily foraging pattern, an IVG value of 24 hours, or slightly less to account for variation in the revisit interval, would be reasonable. T-LoCoH analyzes all locations within a hull, and uses the IVG value to compute the total number of separate visits to the hull as well as the mean number of occurrences per visit. These metrics will be valid measures of revisitation and visit duration provided the IVG period is at least several times larger than the sampling frequency.
Isopleths
To construct isopleths, local hulls are sorted by one of the hull metrics (Table 1) and cumulatively merged together. Isopleths may be defined as either quantiles of points enclosed, or as contours of values of the sort metric. Sorting hulls by point density produces traditional UDs reflecting the overall frequency of occurrence. Sorting on other metrics, such as the revisitation rate, produces spatial contours that have the same overall spatial extent but differentiate internal space by different aspects of behaviour. In addition to isopleths, behavioural patterns may emerge by exploring covariance and novel associations in the distribution of hulls in Euclidean space, hull metric space, and time.
Table 1. T-LoCoH Hull Metrics Density - area - number of nearest neighbours used in hull
construction - number of enclosed points Elongation / Movement Phase
Time Use - revisitation rate (number of separate
visitsb) - duration of visit (mean number of
occurrence per visitb) - revisitation rate and duration of visit
normalized by area
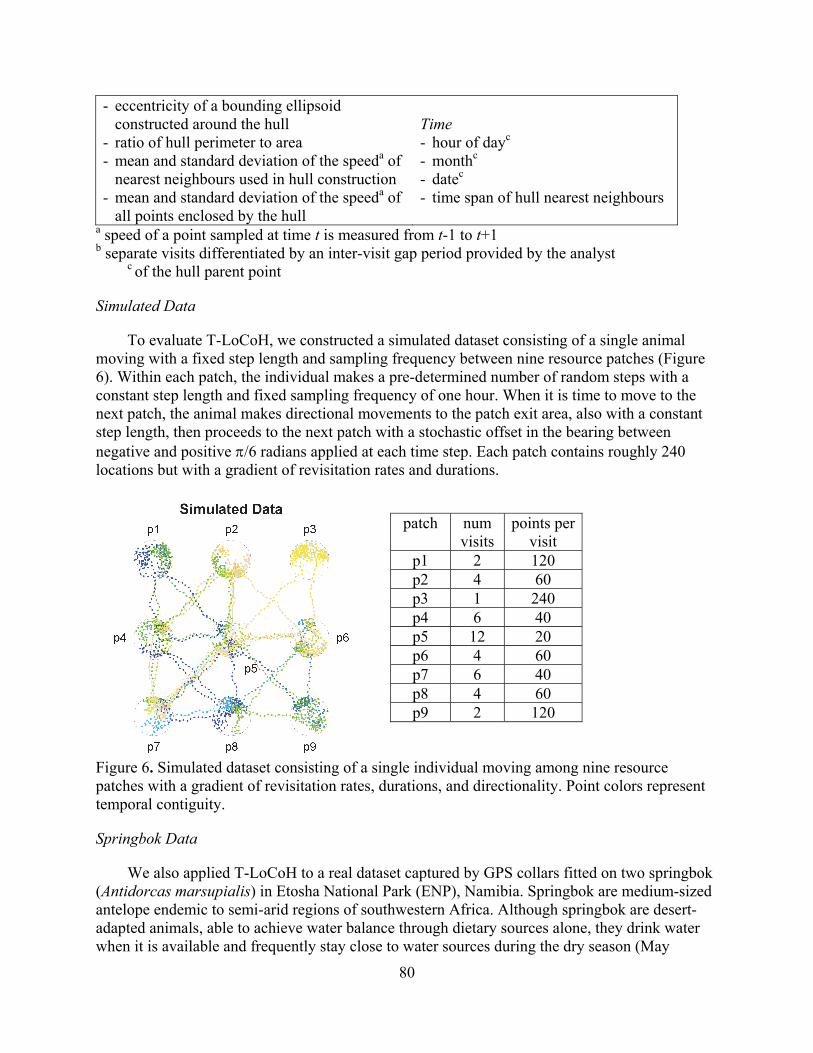
80
- eccentricity of a bounding ellipsoid constructed around the hull
- ratio of hull perimeter to area - mean and standard deviation of the speeda of
nearest neighbours used in hull construction - mean and standard deviation of the speeda of
all points enclosed by the hull
Time - hour of dayc - monthc - datec - time span of hull nearest neighbours
a speed of a point sampled at time t is measured from t-1 to t+1 b separate visits differentiated by an inter-visit gap period provided by the analyst
c of the hull parent point
Simulated Data
To evaluate T-LoCoH, we constructed a simulated dataset consisting of a single animal moving with a fixed step length and sampling frequency between nine resource patches (Figure 6). Within each patch, the individual makes a pre-determined number of random steps with a constant step length and fixed sampling frequency of one hour. When it is time to move to the next patch, the animal makes directional movements to the patch exit area, also with a constant step length, then proceeds to the next patch with a stochastic offset in the bearing between negative and positive /6 radians applied at each time step. Each patch contains roughly 240 locations but with a gradient of revisitation rates and durations.
patch num
visits points per
visit p1 2 120 p2 4 60 p3 1 240 p4 6 40 p5 12 20 p6 4 60 p7 6 40 p8 4 60 p9 2 120
Figure 6. Simulated dataset consisting of a single individual moving among nine resource patches with a gradient of revisitation rates, durations, and directionality. Point colors represent temporal contiguity.
Springbok Data
We also applied T-LoCoH to a real dataset captured by GPS collars fitted on two springbok (Antidorcas marsupialis) in Etosha National Park (ENP), Namibia. Springbok are medium-sized antelope endemic to semi-arid regions of southwestern Africa. Although springbok are desert-adapted animals, able to achieve water balance through dietary sources alone, they drink water when it is available and frequently stay close to water sources during the dry season (May
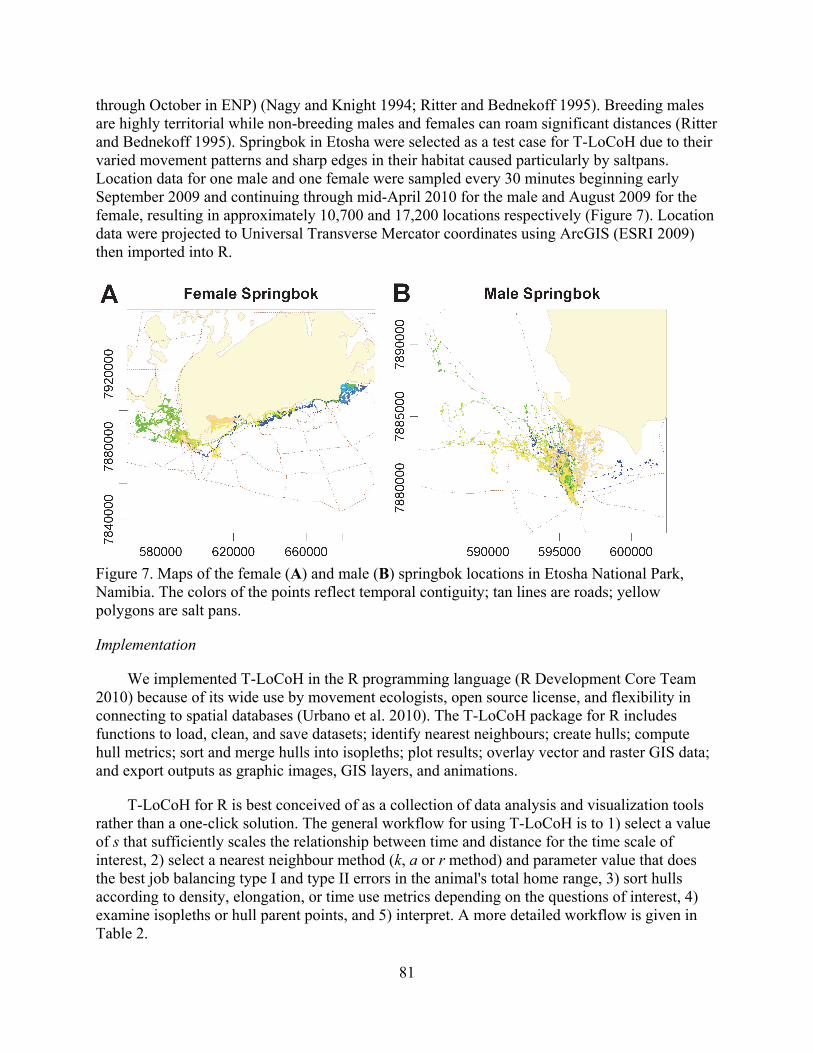
81
through October in ENP) (Nagy and Knight 1994; Ritter and Bednekoff 1995). Breeding males are highly territorial while non-breeding males and females can roam significant distances (Ritter and Bednekoff 1995). Springbok in Etosha were selected as a test case for T-LoCoH due to their varied movement patterns and sharp edges in their habitat caused particularly by saltpans. Location data for one male and one female were sampled every 30 minutes beginning early September 2009 and continuing through mid-April 2010 for the male and August 2009 for the female, resulting in approximately 10,700 and 17,200 locations respectively (Figure 7). Location data were projected to Universal Transverse Mercator coordinates using ArcGIS (ESRI 2009) then imported into R.
Figure 7. Maps of the female (A) and male (B) springbok locations in Etosha National Park, Namibia. The colors of the points reflect temporal contiguity; tan lines are roads; yellow polygons are salt pans.
Implementation
We implemented T-LoCoH in the R programming language (R Development Core Team 2010) because of its wide use by movement ecologists, open source license, and flexibility in connecting to spatial databases (Urbano et al. 2010). The T-LoCoH package for R includes functions to load, clean, and save datasets; identify nearest neighbours; create hulls; compute hull metrics; sort and merge hulls into isopleths; plot results; overlay vector and raster GIS data; and export outputs as graphic images, GIS layers, and animations.
T-LoCoH for R is best conceived of as a collection of data analysis and visualization tools rather than a one-click solution. The general workflow for using T-LoCoH is to 1) select a value of s that sufficiently scales the relationship between time and distance for the time scale of interest, 2) select a nearest neighbour method (k, a or r method) and parameter value that does the best job balancing type I and type II errors in the animal's total home range, 3) sort hulls according to density, elongation, or time use metrics depending on the questions of interest, 4) examine isopleths or hull parent points, and 5) interpret. A more detailed workflow is given in Table 2.
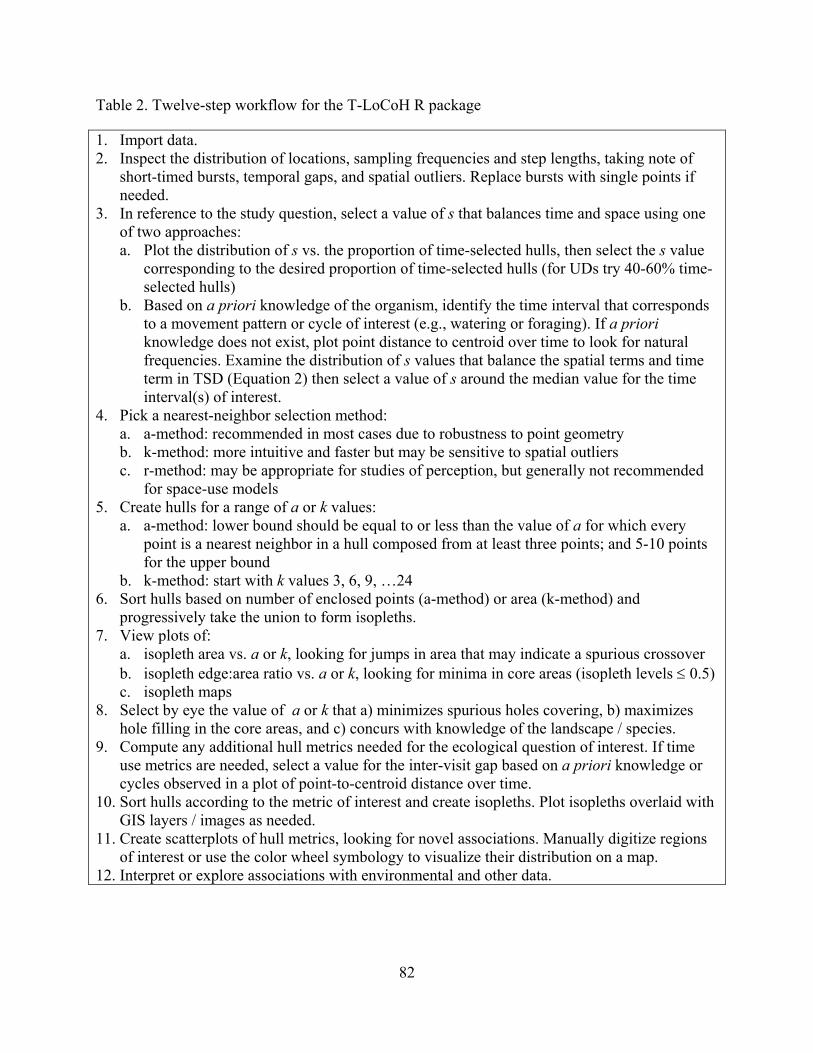
82
Table 2. Twelve-step workflow for the T-LoCoH R package
1. Import data. 2. Inspect the distribution of locations, sampling frequencies and step lengths, taking note of
short-timed bursts, temporal gaps, and spatial outliers. Replace bursts with single points if needed.
3. In reference to the study question, select a value of s that balances time and space using one of two approaches: a. Plot the distribution of s vs. the proportion of time-selected hulls, then select the s value
corresponding to the desired proportion of time-selected hulls (for UDs try 40-60% time-selected hulls)
b. Based on a priori knowledge of the organism, identify the time interval that corresponds to a movement pattern or cycle of interest (e.g., watering or foraging). If a priori knowledge does not exist, plot point distance to centroid over time to look for natural frequencies. Examine the distribution of s values that balance the spatial terms and time term in TSD (Equation 2) then select a value of s around the median value for the time interval(s) of interest.
4. Pick a nearest-neighbor selection method: a. a-method: recommended in most cases due to robustness to point geometry b. k-method: more intuitive and faster but may be sensitive to spatial outliers c. r-method: may be appropriate for studies of perception, but generally not recommended
for space-use models 5. Create hulls for a range of a or k values:
a. a-method: lower bound should be equal to or less than the value of a for which every point is a nearest neighbor in a hull composed from at least three points; and 5-10 points for the upper bound
b. k-method: start with k values 3, 6, 9, …24 6. Sort hulls based on number of enclosed points (a-method) or area (k-method) and
progressively take the union to form isopleths. 7. View plots of:
a. isopleth area vs. a or k, looking for jumps in area that may indicate a spurious crossover b. isopleth edge:area ratio vs. a or k, looking for minima in core areas (isopleth levels 0.5) c. isopleth maps
8. Select by eye the value of a or k that a) minimizes spurious holes covering, b) maximizes hole filling in the core areas, and c) concurs with knowledge of the landscape / species.
9. Compute any additional hull metrics needed for the ecological question of interest. If time use metrics are needed, select a value for the inter-visit gap based on a priori knowledge or cycles observed in a plot of point-to-centroid distance over time.
10. Sort hulls according to the metric of interest and create isopleths. Plot isopleths overlaid with GIS layers / images as needed.
11. Create scatterplots of hull metrics, looking for novel associations. Manually digitize regions of interest or use the color wheel symbology to visualize their distribution on a map.
12. Interpret or explore associations with environmental and other data.
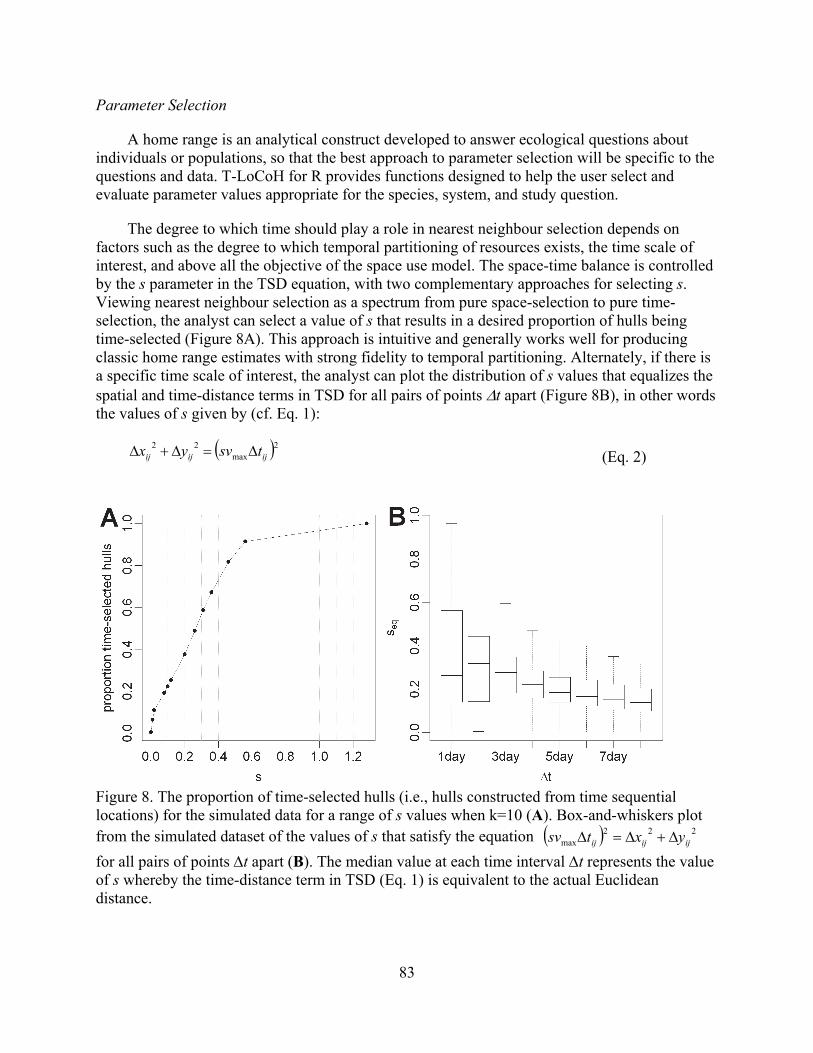
83
Parameter Selection
A home range is an analytical construct developed to answer ecological questions about individuals or populations, so that the best approach to parameter selection will be specific to the questions and data. T-LoCoH for R provides functions designed to help the user select and evaluate parameter values appropriate for the species, system, and study question.
The degree to which time should play a role in nearest neighbour selection depends on factors such as the degree to which temporal partitioning of resources exists, the time scale of interest, and above all the objective of the space use model. The space-time balance is controlled by the s parameter in the TSD equation, with two complementary approaches for selecting s. Viewing nearest neighbour selection as a spectrum from pure space-selection to pure time-selection, the analyst can select a value of s that results in a desired proportion of hulls being time-selected (Figure 8A). This approach is intuitive and generally works well for producing classic home range estimates with strong fidelity to temporal partitioning. Alternately, if there is a specific time scale of interest, the analyst can plot the distribution of s values that equalizes the spatial and time-distance terms in TSD for all pairs of points t apart (Figure 8B), in other words the values of s given by (cf. Eq. 1):
2max22
ijijij tsvyx (Eq. 2)
Figure 8. The proportion of time-selected hulls (i.e., hulls constructed from time sequential locations) for the simulated data for a range of s values when k=10 (A). Box-and-whiskers plot from the simulated dataset of the values of s that satisfy the equation 222
max ijijij yxtsv
for all pairs of points t apart (B). The median value at each time interval t represents the value of s whereby the time-distance term in TSD (Eq. 1) is equivalent to the actual Euclidean distance.
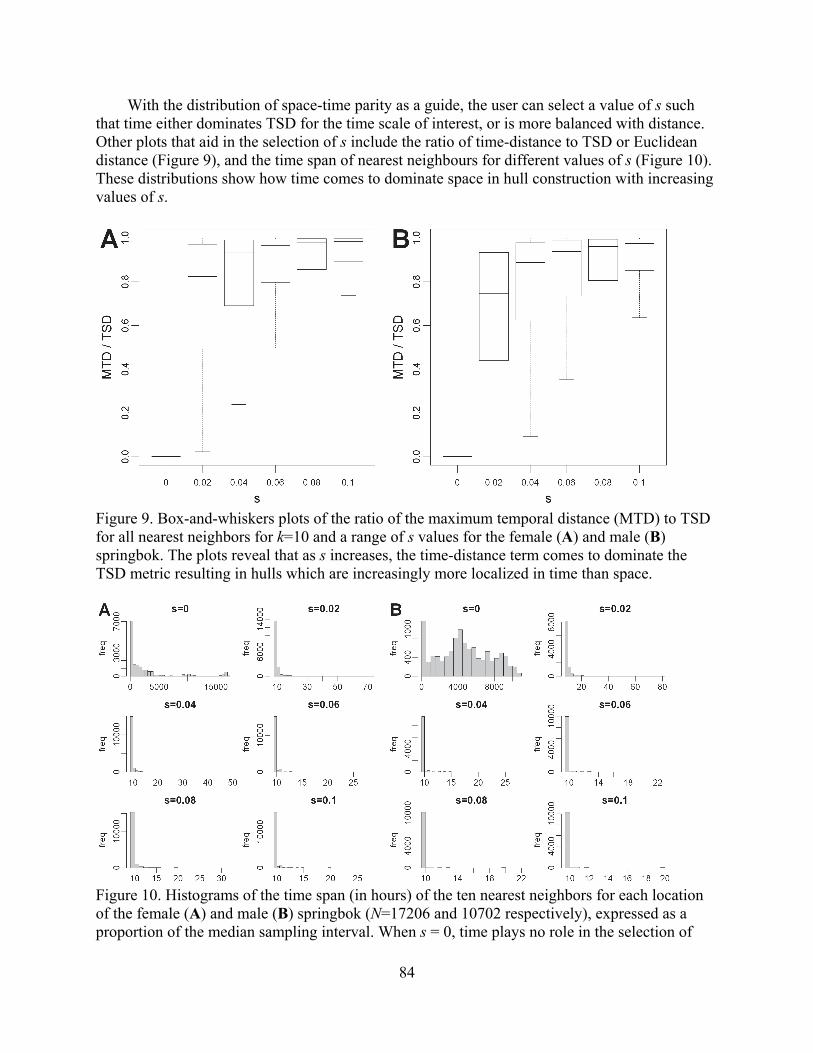
84
With the distribution of space-time parity as a guide, the user can select a value of s such that time either dominates TSD for the time scale of interest, or is more balanced with distance. Other plots that aid in the selection of s include the ratio of time-distance to TSD or Euclidean distance (Figure 9), and the time span of nearest neighbours for different values of s (Figure 10). These distributions show how time comes to dominate space in hull construction with increasing values of s.
Figure 9. Box-and-whiskers plots of the ratio of the maximum temporal distance (MTD) to TSD for all nearest neighbors for k=10 and a range of s values for the female (A) and male (B) springbok. The plots reveal that as s increases, the time-distance term comes to dominate the TSD metric resulting in hulls which are increasingly more localized in time than space.
Figure 10. Histograms of the time span (in hours) of the ten nearest neighbors for each location of the female (A) and male (B) springbok (N=17206 and 10702 respectively), expressed as a proportion of the median sampling interval. When s = 0, time plays no role in the selection of
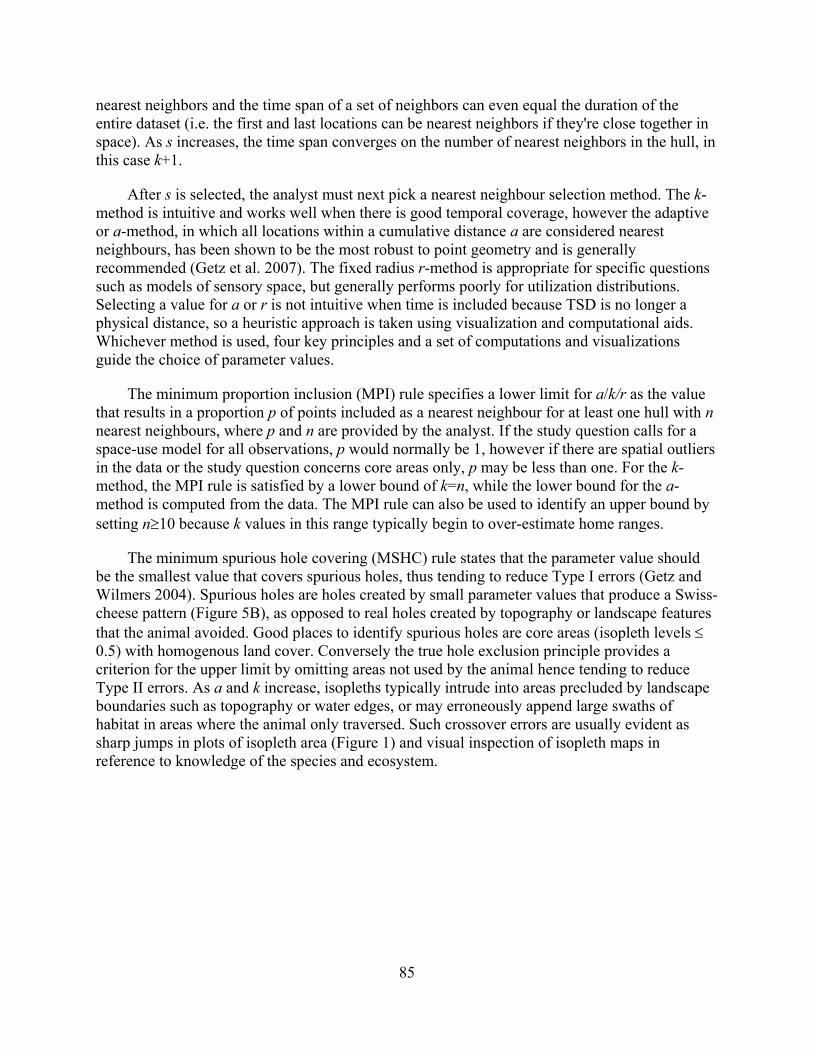
85
nearest neighbors and the time span of a set of neighbors can even equal the duration of the entire dataset (i.e. the first and last locations can be nearest neighbors if they're close together in space). As s increases, the time span converges on the number of nearest neighbors in the hull, in this case k+1.
After s is selected, the analyst must next pick a nearest neighbour selection method. The k-method is intuitive and works well when there is good temporal coverage, however the adaptive or a-method, in which all locations within a cumulative distance a are considered nearest neighbours, has been shown to be the most robust to point geometry and is generally recommended (Getz et al. 2007). The fixed radius r-method is appropriate for specific questions such as models of sensory space, but generally performs poorly for utilization distributions. Selecting a value for a or r is not intuitive when time is included because TSD is no longer a physical distance, so a heuristic approach is taken using visualization and computational aids. Whichever method is used, four key principles and a set of computations and visualizations guide the choice of parameter values.
The minimum proportion inclusion (MPI) rule specifies a lower limit for a/k/r as the value that results in a proportion p of points included as a nearest neighbour for at least one hull with n nearest neighbours, where p and n are provided by the analyst. If the study question calls for a space-use model for all observations, p would normally be 1, however if there are spatial outliers in the data or the study question concerns core areas only, p may be less than one. For the k-method, the MPI rule is satisfied by a lower bound of k=n, while the lower bound for the a-method is computed from the data. The MPI rule can also be used to identify an upper bound by setting n10 because k values in this range typically begin to over-estimate home ranges.
The minimum spurious hole covering (MSHC) rule states that the parameter value should be the smallest value that covers spurious holes, thus tending to reduce Type I errors (Getz and Wilmers 2004). Spurious holes are holes created by small parameter values that produce a Swiss-cheese pattern (Figure 5B), as opposed to real holes created by topography or landscape features that the animal avoided. Good places to identify spurious holes are core areas (isopleth levels 0.5) with homogenous land cover. Conversely the true hole exclusion principle provides a criterion for the upper limit by omitting areas not used by the animal hence tending to reduce Type II errors. As a and k increase, isopleths typically intrude into areas precluded by landscape boundaries such as topography or water edges, or may erroneously append large swaths of habitat in areas where the animal only traversed. Such crossover errors are usually evident as sharp jumps in plots of isopleth area (Figure 1) and visual inspection of isopleth maps in reference to knowledge of the species and ecosystem.
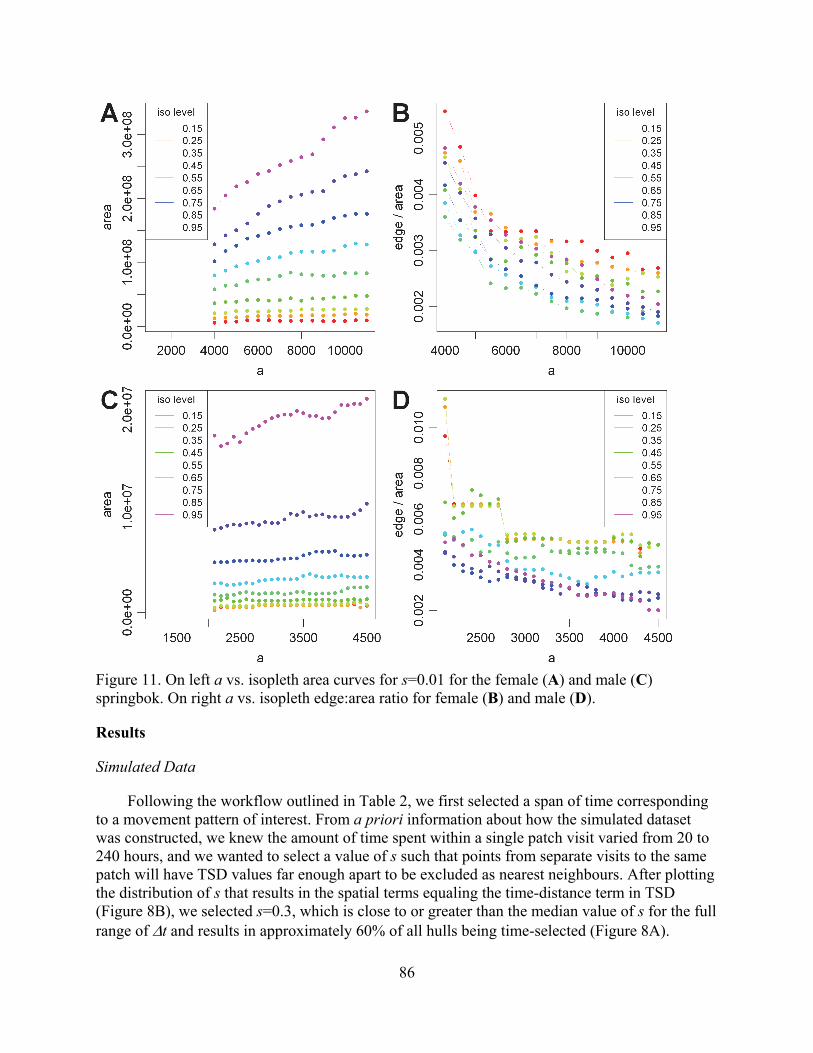
86
Figure 11. On left a vs. isopleth area curves for s=0.01 for the female (A) and male (C) springbok. On right a vs. isopleth edge:area ratio for female (B) and male (D).
Results
Simulated Data
Following the workflow outlined in Table 2, we first selected a span of time corresponding to a movement pattern of interest. From a priori information about how the simulated dataset was constructed, we knew the amount of time spent within a single patch visit varied from 20 to 240 hours, and we wanted to select a value of s such that points from separate visits to the same patch will have TSD values far enough apart to be excluded as nearest neighbours. After plotting the distribution of s that results in the spatial terms equaling the time-distance term in TSD (Figure 8B), we selected s=0.3, which is close to or greater than the median value of s for the full range of t and results in approximately 60% of all hulls being time-selected (Figure 8A).
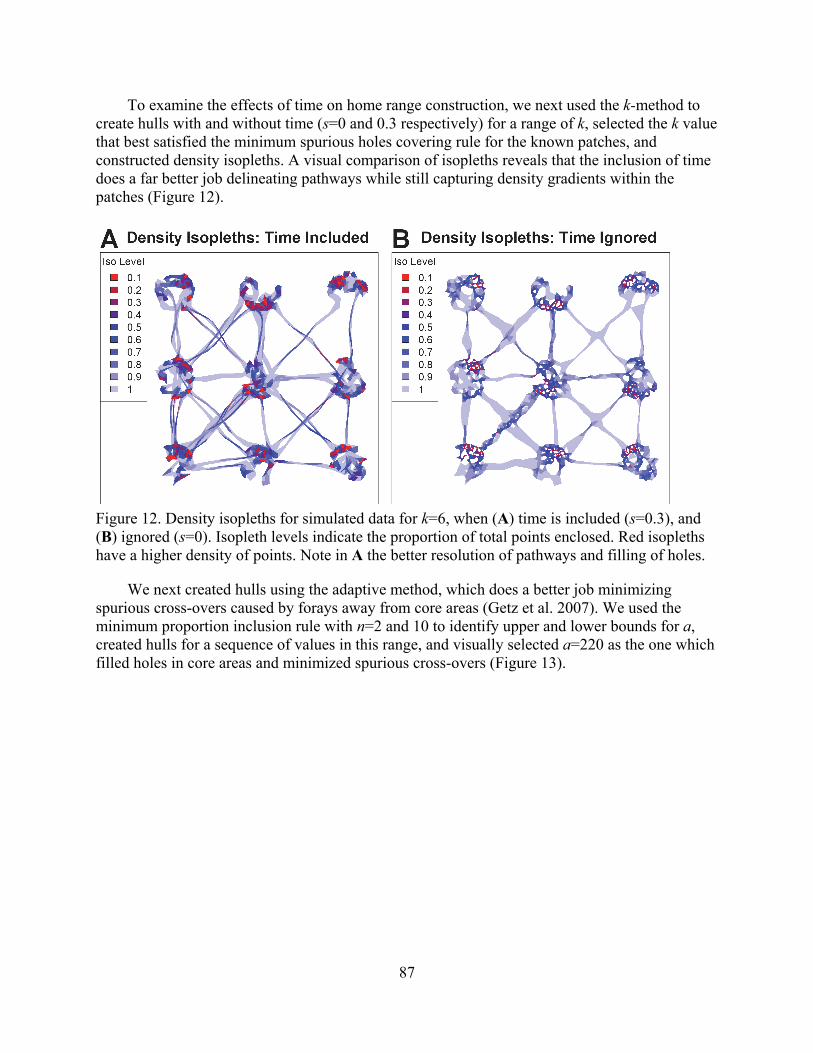
87
To examine the effects of time on home range construction, we next used the k-method to create hulls with and without time (s=0 and 0.3 respectively) for a range of k, selected the k value that best satisfied the minimum spurious holes covering rule for the known patches, and constructed density isopleths. A visual comparison of isopleths reveals that the inclusion of time does a far better job delineating pathways while still capturing density gradients within the patches (Figure 12).
Figure 12. Density isopleths for simulated data for k=6, when (A) time is included (s=0.3), and (B) ignored (s=0). Isopleth levels indicate the proportion of total points enclosed. Red isopleths have a higher density of points. Note in A the better resolution of pathways and filling of holes.
We next created hulls using the adaptive method, which does a better job minimizing spurious cross-overs caused by forays away from core areas (Getz et al. 2007). We used the minimum proportion inclusion rule with n=2 and 10 to identify upper and lower bounds for a, created hulls for a sequence of values in this range, and visually selected a=220 as the one which filled holes in core areas and minimized spurious cross-overs (Figure 13).
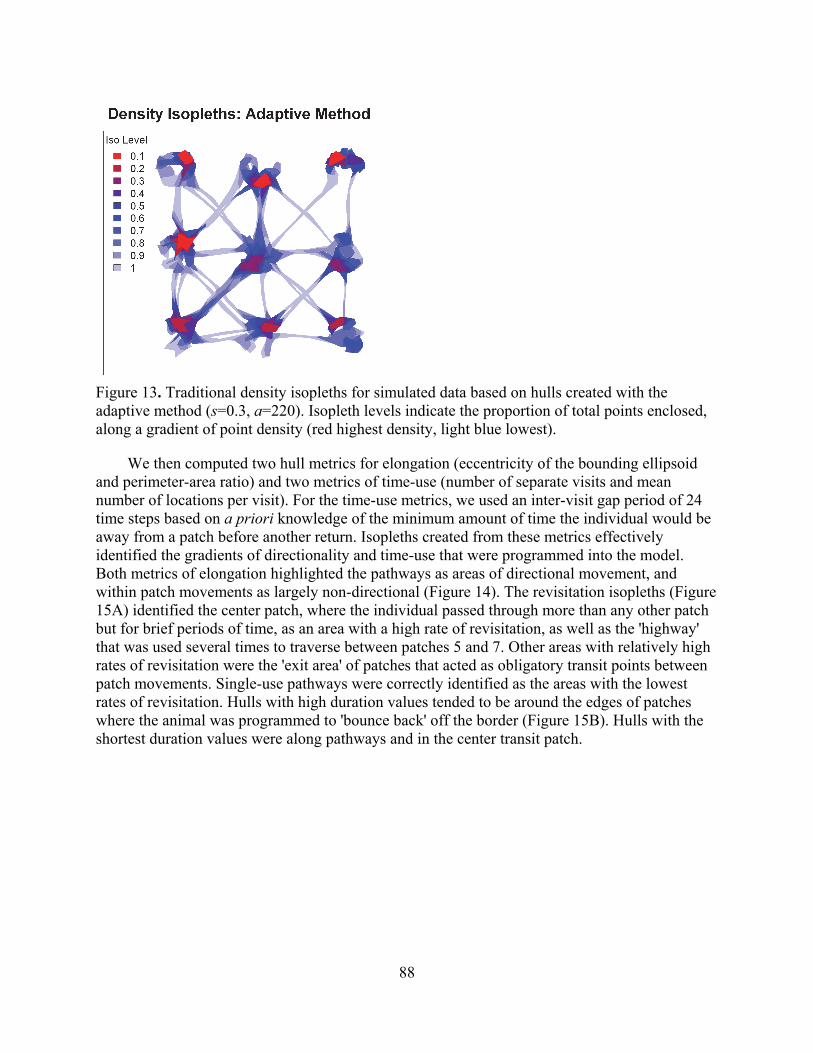
88
Figure 13. Traditional density isopleths for simulated data based on hulls created with the adaptive method (s=0.3, a=220). Isopleth levels indicate the proportion of total points enclosed, along a gradient of point density (red highest density, light blue lowest).
We then computed two hull metrics for elongation (eccentricity of the bounding ellipsoid and perimeter-area ratio) and two metrics of time-use (number of separate visits and mean number of locations per visit). For the time-use metrics, we used an inter-visit gap period of 24 time steps based on a priori knowledge of the minimum amount of time the individual would be away from a patch before another return. Isopleths created from these metrics effectively identified the gradients of directionality and time-use that were programmed into the model. Both metrics of elongation highlighted the pathways as areas of directional movement, and within patch movements as largely non-directional (Figure 14). The revisitation isopleths (Figure 15A) identified the center patch, where the individual passed through more than any other patch but for brief periods of time, as an area with a high rate of revisitation, as well as the 'highway' that was used several times to traverse between patches 5 and 7. Other areas with relatively high rates of revisitation were the 'exit area' of patches that acted as obligatory transit points between patch movements. Single-use pathways were correctly identified as the areas with the lowest rates of revisitation. Hulls with high duration values tended to be around the edges of patches where the animal was programmed to 'bounce back' off the border (Figure 15B). Hulls with the shortest duration values were along pathways and in the center transit patch.
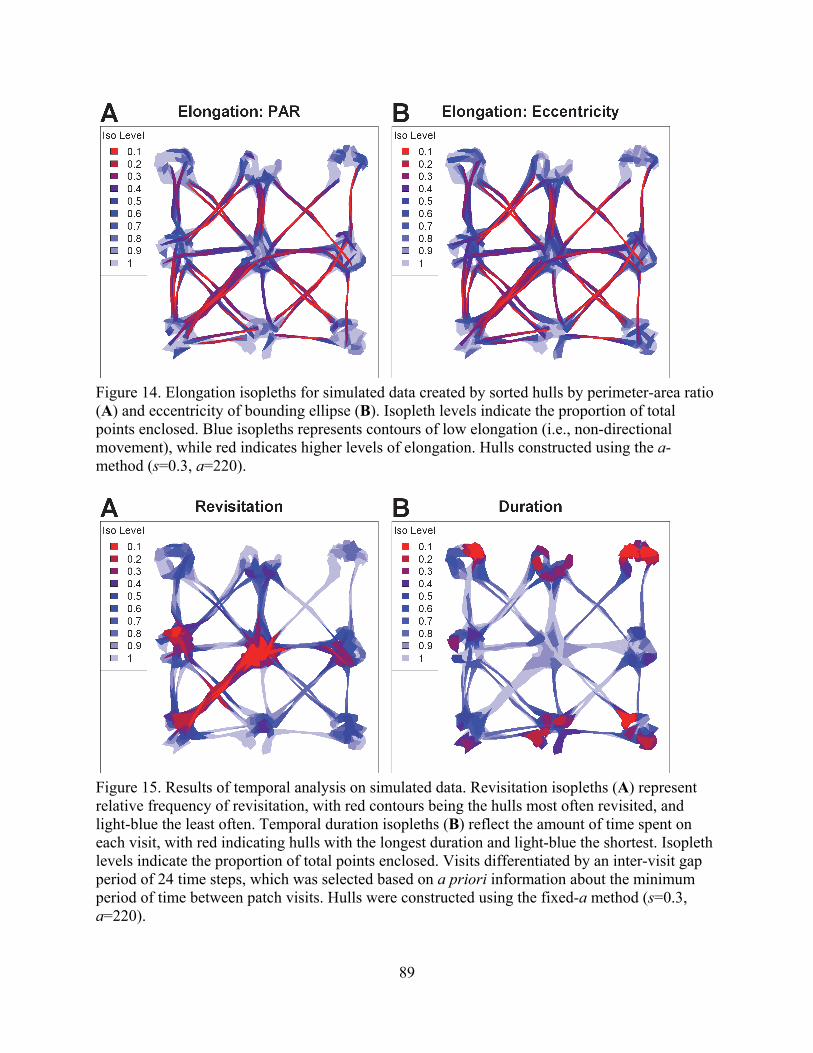
89
Figure 14. Elongation isopleths for simulated data created by sorted hulls by perimeter-area ratio (A) and eccentricity of bounding ellipse (B). Isopleth levels indicate the proportion of total points enclosed. Blue isopleths represents contours of low elongation (i.e., non-directional movement), while red indicates higher levels of elongation. Hulls constructed using the a-method (s=0.3, a=220).
Figure 15. Results of temporal analysis on simulated data. Revisitation isopleths (A) represent relative frequency of revisitation, with red contours being the hulls most often revisited, and light-blue the least often. Temporal duration isopleths (B) reflect the amount of time spent on each visit, with red indicating hulls with the longest duration and light-blue the shortest. Isopleth levels indicate the proportion of total points enclosed. Visits differentiated by an inter-visit gap period of 24 time steps, which was selected based on a priori information about the minimum period of time between patch visits. Hulls were constructed using the fixed-a method (s=0.3, a=220).
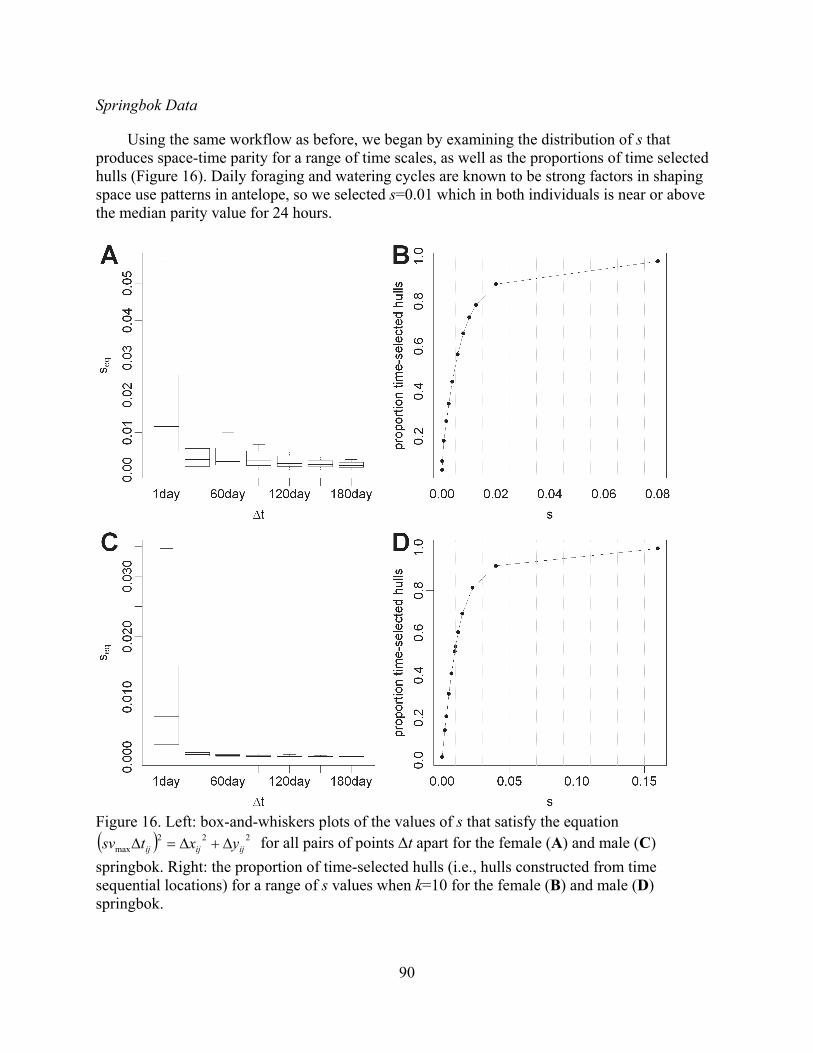
90
Springbok Data
Using the same workflow as before, we began by examining the distribution of s that produces space-time parity for a range of time scales, as well as the proportions of time selected hulls (Figure 16). Daily foraging and watering cycles are known to be strong factors in shaping space use patterns in antelope, so we selected s=0.01 which in both individuals is near or above the median parity value for 24 hours.
Figure 16. Left: box-and-whiskers plots of the values of s that satisfy the equation 222
max ijijij yxtsv for all pairs of points t apart for the female (A) and male (C)
springbok. Right: the proportion of time-selected hulls (i.e., hulls constructed from time sequential locations) for a range of s values when k=10 for the female (B) and male (D) springbok.
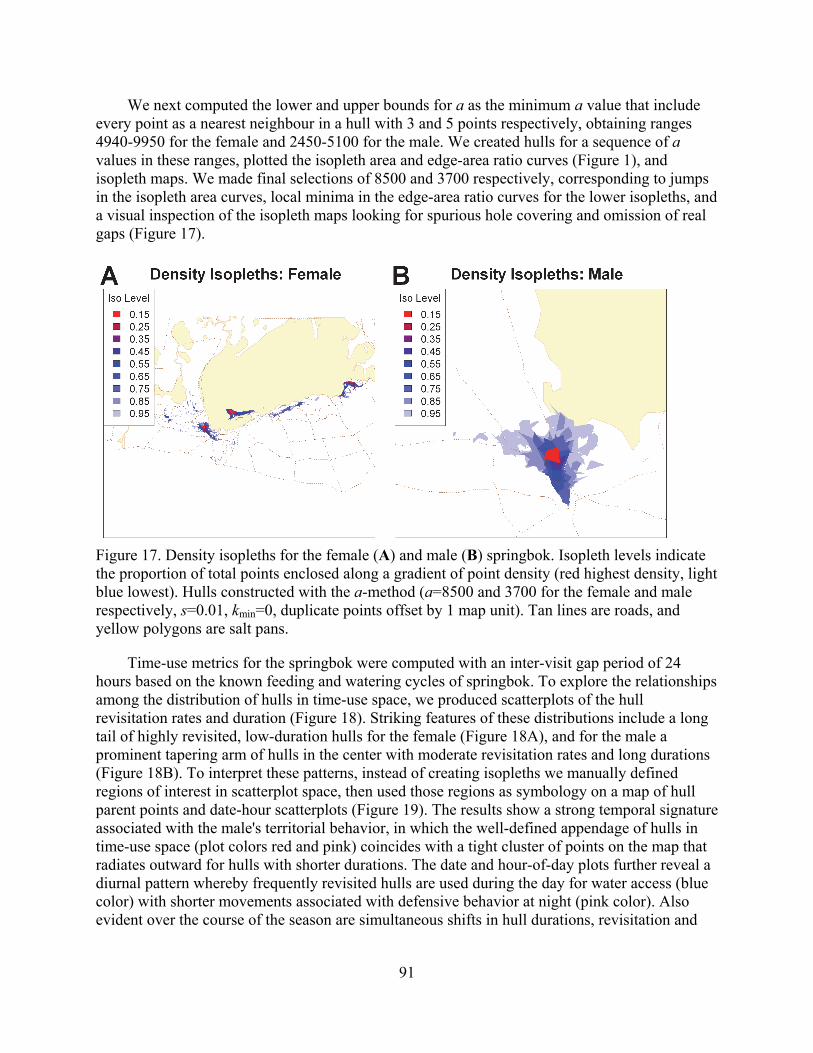
91
We next computed the lower and upper bounds for a as the minimum a value that include every point as a nearest neighbour in a hull with 3 and 5 points respectively, obtaining ranges 4940-9950 for the female and 2450-5100 for the male. We created hulls for a sequence of a values in these ranges, plotted the isopleth area and edge-area ratio curves (Figure 1), and isopleth maps. We made final selections of 8500 and 3700 respectively, corresponding to jumps in the isopleth area curves, local minima in the edge-area ratio curves for the lower isopleths, and a visual inspection of the isopleth maps looking for spurious hole covering and omission of real gaps (Figure 17).
Figure 17. Density isopleths for the female (A) and male (B) springbok. Isopleth levels indicate the proportion of total points enclosed along a gradient of point density (red highest density, light blue lowest). Hulls constructed with the a-method (a=8500 and 3700 for the female and male respectively, s=0.01, kmin=0, duplicate points offset by 1 map unit). Tan lines are roads, and yellow polygons are salt pans.
Time-use metrics for the springbok were computed with an inter-visit gap period of 24 hours based on the known feeding and watering cycles of springbok. To explore the relationships among the distribution of hulls in time-use space, we produced scatterplots of the hull revisitation rates and duration (Figure 18). Striking features of these distributions include a long tail of highly revisited, low-duration hulls for the female (Figure 18A), and for the male a prominent tapering arm of hulls in the center with moderate revisitation rates and long durations (Figure 18B). To interpret these patterns, instead of creating isopleths we manually defined regions of interest in scatterplot space, then used those regions as symbology on a map of hull parent points and date-hour scatterplots (Figure 19). The results show a strong temporal signature associated with the male's territorial behavior, in which the well-defined appendage of hulls in time-use space (plot colors red and pink) coincides with a tight cluster of points on the map that radiates outward for hulls with shorter durations. The date and hour-of-day plots further reveal a diurnal pattern whereby frequently revisited hulls are used during the day for water access (blue color) with shorter movements associated with defensive behavior at night (pink color). Also evident over the course of the season are simultaneous shifts in hull durations, revisitation and
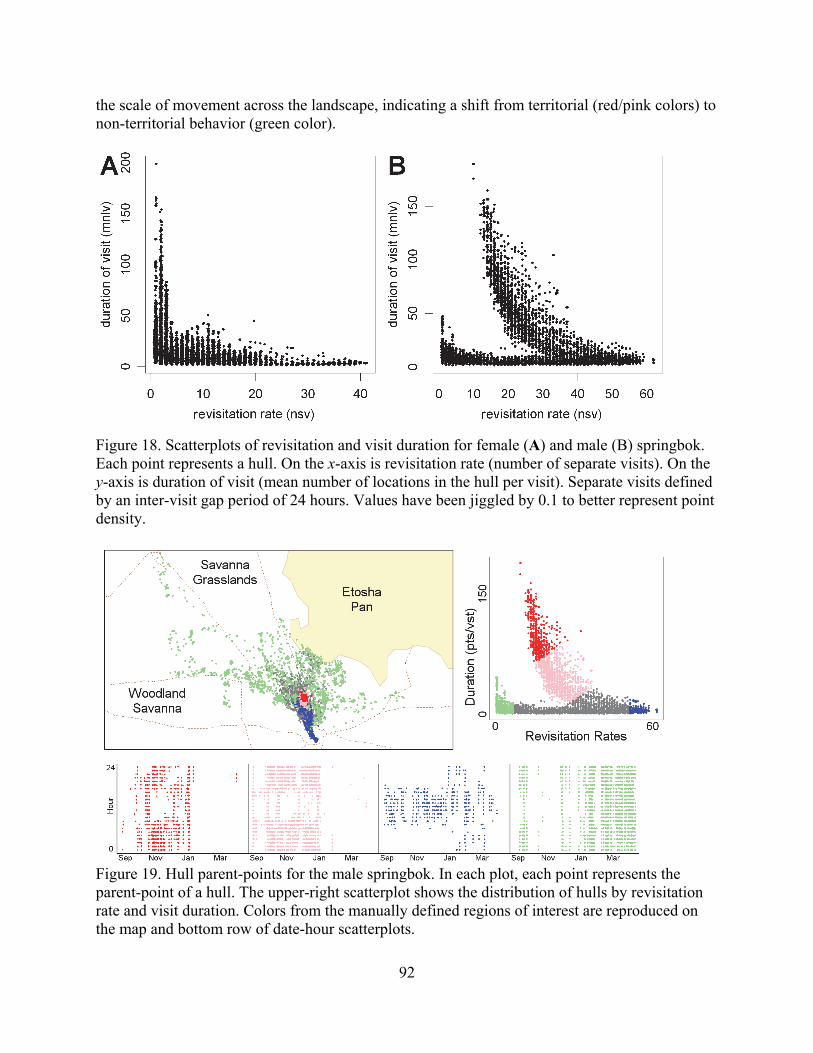
92
the scale of movement across the landscape, indicating a shift from territorial (red/pink colors) to non-territorial behavior (green color).
Figure 18. Scatterplots of revisitation and visit duration for female (A) and male (B) springbok. Each point represents a hull. On the x-axis is revisitation rate (number of separate visits). On the y-axis is duration of visit (mean number of locations in the hull per visit). Separate visits defined by an inter-visit gap period of 24 hours. Values have been jiggled by 0.1 to better represent point density.
Figure 19. Hull parent-points for the male springbok. In each plot, each point represents the parent-point of a hull. The upper-right scatterplot shows the distribution of hulls by revisitation rate and visit duration. Colors from the manually defined regions of interest are reproduced on the map and bottom row of date-hour scatterplots.
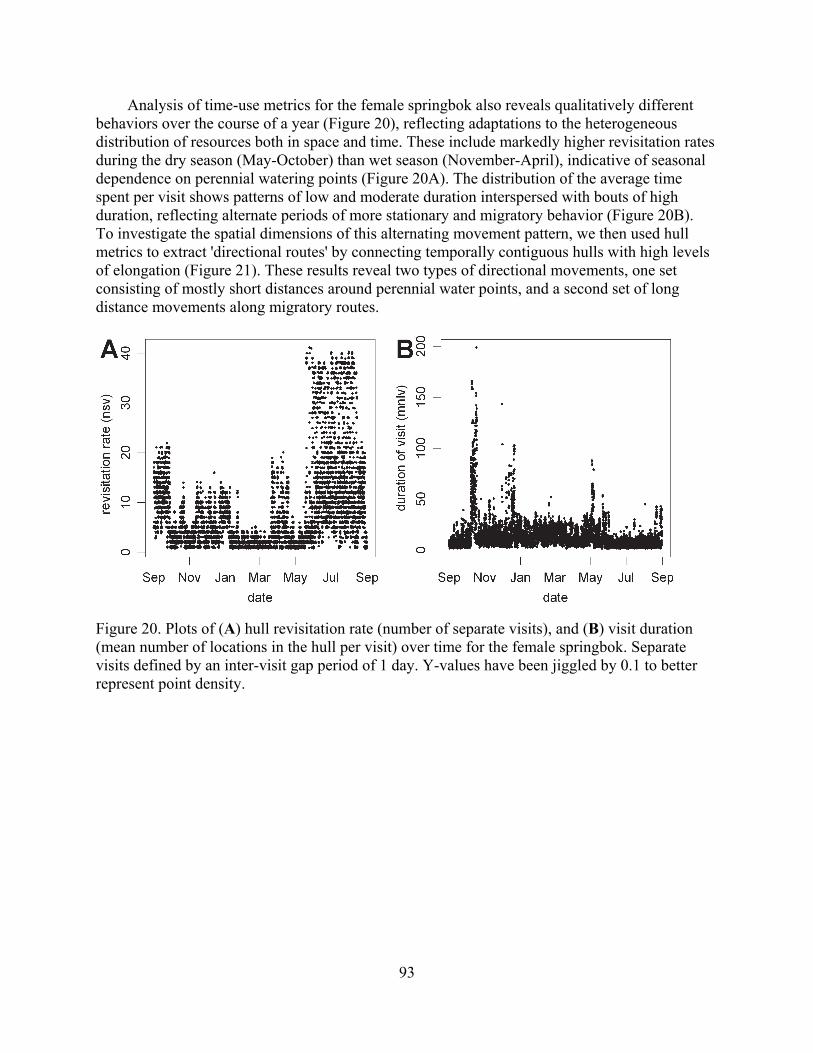
93
Analysis of time-use metrics for the female springbok also reveals qualitatively different behaviors over the course of a year (Figure 20), reflecting adaptations to the heterogeneous distribution of resources both in space and time. These include markedly higher revisitation rates during the dry season (May-October) than wet season (November-April), indicative of seasonal dependence on perennial watering points (Figure 20A). The distribution of the average time spent per visit shows patterns of low and moderate duration interspersed with bouts of high duration, reflecting alternate periods of more stationary and migratory behavior (Figure 20B). To investigate the spatial dimensions of this alternating movement pattern, we then used hull metrics to extract 'directional routes' by connecting temporally contiguous hulls with high levels of elongation (Figure 21). These results reveal two types of directional movements, one set consisting of mostly short distances around perennial water points, and a second set of long distance movements along migratory routes.
Figure 20. Plots of (A) hull revisitation rate (number of separate visits), and (B) visit duration (mean number of locations in the hull per visit) over time for the female springbok. Separate visits defined by an inter-visit gap period of 1 day. Y-values have been jiggled by 0.1 to better represent point density.
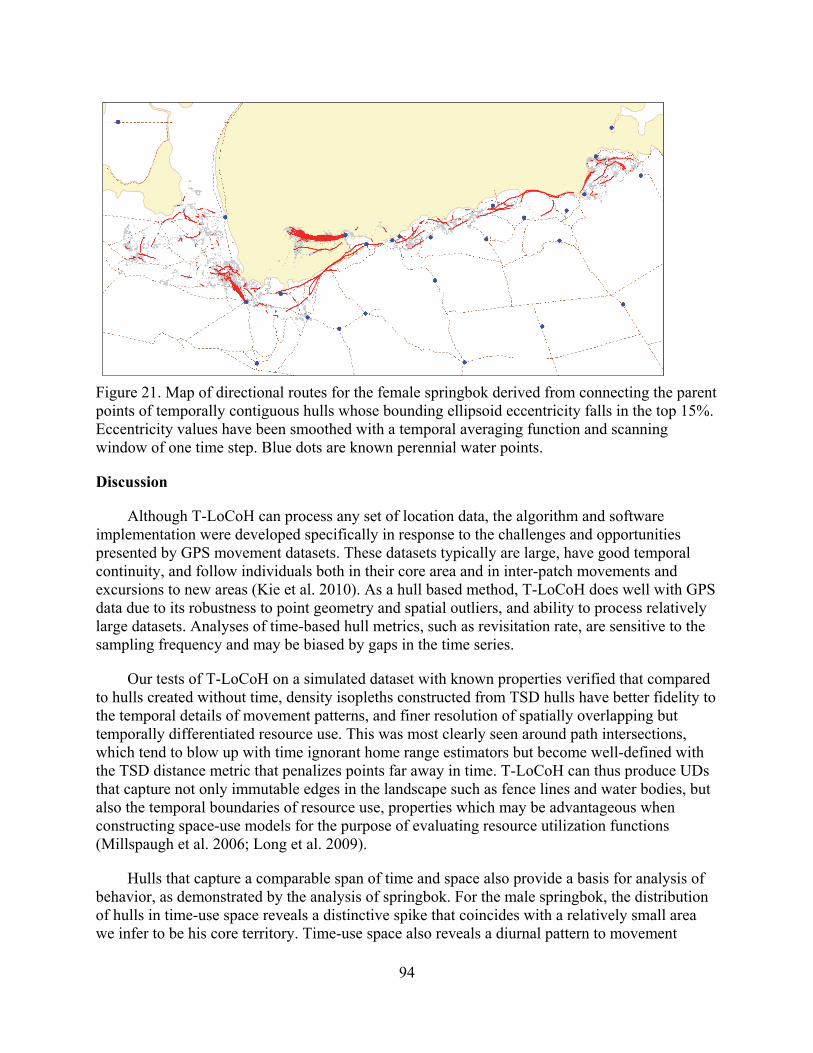
94
Figure 21. Map of directional routes for the female springbok derived from connecting the parent points of temporally contiguous hulls whose bounding ellipsoid eccentricity falls in the top 15%. Eccentricity values have been smoothed with a temporal averaging function and scanning window of one time step. Blue dots are known perennial water points.
Discussion
Although T-LoCoH can process any set of location data, the algorithm and software implementation were developed specifically in response to the challenges and opportunities presented by GPS movement datasets. These datasets typically are large, have good temporal continuity, and follow individuals both in their core area and in inter-patch movements and excursions to new areas (Kie et al. 2010). As a hull based method, T-LoCoH does well with GPS data due to its robustness to point geometry and spatial outliers, and ability to process relatively large datasets. Analyses of time-based hull metrics, such as revisitation rate, are sensitive to the sampling frequency and may be biased by gaps in the time series.
Our tests of T-LoCoH on a simulated dataset with known properties verified that compared to hulls created without time, density isopleths constructed from TSD hulls have better fidelity to the temporal details of movement patterns, and finer resolution of spatially overlapping but temporally differentiated resource use. This was most clearly seen around path intersections, which tend to blow up with time ignorant home range estimators but become well-defined with the TSD distance metric that penalizes points far away in time. T-LoCoH can thus produce UDs that capture not only immutable edges in the landscape such as fence lines and water bodies, but also the temporal boundaries of resource use, properties which may be advantageous when constructing space-use models for the purpose of evaluating resource utilization functions (Millspaugh et al. 2006; Long et al. 2009).
Hulls that capture a comparable span of time and space also provide a basis for analysis of behavior, as demonstrated by the analysis of springbok. For the male springbok, the distribution of hulls in time-use space reveals a distinctive spike that coincides with a relatively small area we infer to be his core territory. Time-use space also reveals a diurnal pattern to movement
95
phases, suggesting a temporal strategy for balancing resource optimization with territorial defense. In addition, hulls have the potential to serve as platforms for integrating into the analysis other fixed and dynamic variables, such as ground cover, environmental variables, proximity to landscape features, and spatial relationships with other individuals.
For well over two decades, movement ecologists have been engaged in a lively debate about the 'best' home range estimator and efforts continue to improve the fidelity of methods with respect to the actual movements of individuals, as tested using simulation data (e.g., Downs et al. 2012). T-LoCoH's flexibility in generating spatial contours that reflect a variety of behavioral patterns, including but not limited to the frequency of use, departs from this search for the Holy Grail, and is rather based upon a conceptualization of home range not as a geometry to be discovered but as a biological construct inextricably linked to a question or hypothesis (Kie et al. 2010). Towards this end, we believe T-LoCoH's toolbox approach will help ecologists understand the underlying drivers of both space and time use.
References
Bar-David S, Bar-David I, Cross PC, Ryan SJ, Knechtel CU, Getz WM (2009) Methods for assessing movement path recursion with application to African buffalo in South Africa. Ecology 90 (9):2467-2479
Barg JJ, Jones J, Robertson RJ (2005) Describing breeding territories of migratory passerines: suggestions for sampling, choice of estimator, and delineation of core areas. Journal of Animal Ecology 74 (1):139-149
Barraquand F, Benhamou S (2008) Animal Movements in Heterogeneous Landscapes: Identifying Profitable Places and Homogeneous Movement Bouts. Ecology 89 (12):3336-3348. doi:doi:10.1890/08-0162.1
Bartumeus F, Levin SA (2008) Fractal reorientation clocks: Linking animal behavior to statistical patterns of search. Proceedings of the National Academy of Sciences 105 (49):19072-19077. doi:10.1073/pnas.0801926105
Benhamou S (2011) Dynamic Approach to Space and Habitat Use Based on Biased Random Bridges. PLoS ONE 6 (1):e14592
Benhamou S, Cornélis D (2010) Incorporating Movement Behavior and Barriers to Improve Kernel Home Range Space Use Estimates. Journal of Wildlife Management 74 (6):1353-1360
Benhamou S, Riotte-Lambert L (2012) Beyond the Utilization Distribution: Identifying home range areas that are intensively exploited or repeatedly visited. Ecological Modelling 227 (0):112-116
Bingham BB, Noon BR (1997) Mitigation of Habitat “Take”: Application to Habitat Conservation Planning. Conservation Biology 11 (1):127-139
Börger L, Dalziel BD, Fryxell JM (2008) Are there general mechanisms of animal home range behaviour? A review and prospects for future research. Ecology Letters 11 (6):637-650
Burgman MA, Fox JC (2003) Bias in species range estimates from minimum convex polygons: implications for conservation and options for improved planning. Animal Conservation 6 (01):19-28. doi:doi:10.1017/S1367943003003044
Cagnacci F, Boitani L, Powell RA, Boyce MS (2010) Animal ecology meets GPS-based radiotelemetry: a perfect storm of opportunities and challenges. Philosophical
96
Transactions of the Royal Society B: Biological Sciences 365 (1550):2157-2162. doi:10.1098/rstb.2010.0107
Casaer JIM, Hermy M, Coppin POL, Verhagen RON (1999) Analysing space use patterns by Thiessen polygon and triangulated irregular network interpolation: a non-parametric method for processing telemetric animal fixes. International Journal of Geographical Information Science 13 (5):499-511
Downs J, Horner M (2009) A Characteristic-Hull Based Method for Home Range Estimation. Transactions in GIS 13 (5-6):527-537
Downs JA, Heller JH, Loraamm R, Stein DO, McDaniel C, Onorato D (2012) Accuracy of home range estimators for homogeneous and inhomogeneous point patterns. Ecological Modelling 225 (0):66-73
Downs JA, Horner MW (2008) Effects of Point Pattern Shape on Home-Range Estimates. The Journal of Wildlife Management 72 (8):1813-1818
ESRI (2009) ArcGIS Desktop: Release 9.2. Environmental Systems Research Institute, Redlands, CA
Fauchald P, Tveraa T (2003) Using first-passage time in the analysis of area-restricted search and habitat selection. Ecology 84 (2):282-288. doi:doi:10.1890/0012-9658(2003)084[0282:UFPTIT]2.0.CO;2
Fieberg J, Börger L (2012) Could you please phrase 'home range' as a question? Journal of Mammalogy 93 (4):890-902
Getz W, Fortmann-Roe S, Cross P, Lyons A, Ryan S, Wilmers C (2007) LoCoH: Nonparameteric Kernel Methods for Constructing Home Ranges and Utilization Distributions. PLoS ONE 2 (2):e207
Getz W, Wilmers C (2004) A local nearest-neighbor convex-hull construction of home ranges and utilization distributions. Ecography 27:489-505
Getz WM, Saltz D (2008) A framework for generating and analyzing movement paths on ecological landscapes. Proceedings of the National Academy of Sciences of the United States of America 105 (49):19066-19071
Harris S, Cresswell WJ, Forde PG, Trewhella WJ, Woollard T, Wray S (1990) Home-range analysis using radio-tracking data–a review of problems and techniques particularly as applied to the study of mammals. Mammal Review 20 (2-3):97-123
Hebblewhite M, Haydon DT (2010) Distinguishing technology from biology: a critical review of the use of GPS telemetry data in ecology. Philosophical Transactions of the Royal Society B: Biological Sciences 365 (1550):2303-2312. doi:10.1098/rstb.2010.0087
Horne JS, Garton EO, Krone SM, Lewis JS (2007) Analyzing Animal Movements Using Brownian Bridges. Ecology 88 (9):2354-2363
Jonsen ID, Myers RA, Flemming JM (2003) Meta-Analysis of Animal Movement using State-Space Models. Ecology 84 (11):3055-3063
Katajisto J, Moilanen A (2006) Kernel-based home range method for data with irregular sampling intervals. Ecological Modelling 194 (4):405-413
Keating KA, Cherry S (2009) Modeling utilization distributions in space and time. Ecology 90 (7):1971-1980
Kie JG, Matthiopoulos J, Fieberg J, Powell RA, Cagnacci F, Mitchell MS, Gaillard JM, Moorcroft PR (2010) The home-range concept: Are traditional estimators still relevant with modern telemetry technology? Philosophical Transactions of the Royal Society B: Biological Sciences 365 (1550):2221-2231
97
Kranstauber B, Kays R, LaPoint S, Wikelski M, Safi K (2012) A dynamic Brownian bridge movement model to estimate utilization distributions for heterogeneous animal movement. Journal of Animal Ecology 81:738–746. doi:doi: 10.1111/j.1365-2656.2012.01955.x
Laver PN, Kelly MJ (2008) A Critical Review of Home Range Studies. Journal of Wildlife Management 72 (1):290-298
Long JA, Nelson TA (2012) Time geography and wildlife home range delineation. The Journal of Wildlife Management 76 (2):407-413
Long RA, Muir JD, Rachlow JL, Kie JG (2009) A Comparison of Two Modeling Approaches for Evaluating Wildlife-Habitat Relationships. The Journal of Wildlife Management 73 (2):294-302
Millspaugh JJ, Nielson RM, McDonald L, Marzluff JM, Gitzen RA, Rittenhouse CD, Hubbard MW, Sheriff SL (2006) Analysis of Resource Selection Using Utilization Distributions. The Journal of Wildlife Management 70 (2):384-395
Morales JM, Haydon DT, Frair J, Holsinger KE, Fryxell JM (2004) Extracting more out of relocation data: Building movement models as mixtures of random walks. Ecology 85 (9):2436-2445. doi:doi:10.1890/03-0269
Nagy KA, Knight MH (1994) Energy, water, and food use by springbok antelope (Antidorcas marsupialis) in the Kalahari desert. Journal of Mammalogy 75 (4):860-872
Nathan R, Getz WM, Revilla E, Holyoak M, Kadmon R, Saltz D, Smouse PE (2008) A movement ecology paradigm for unifying organismal movement research. Proceedings of the National Academy of Sciences 105 (49):19052-19059. doi:10.1073/pnas.0800375105
Nielsen S, Boyce M, Stenhouse G, Munro R (2003) Development and testing of phenologically driven grizzly bear habitat models. Ecoscience 10 (1):1-10
Nilsen EB, Pedersen S, Linnell JDC (2008) Can minimum convex polygon home ranges be used to draw biologically meaningful conclusions? Ecological Research 23 (3):635-639
Patterson TA, Thomas L, Wilcox C, Ovaskainen O, Matthiopoulos J (2008) State-space models of individual animal movement. Trends in Ecology & Evolution 23 (2):87-94
Polansky L, Wittemyer G, Cross PC, Tambling CJ, Getz WM (2010) From moonlight to movement and synchronized randomness: Fourier and wavelet analyses of animal location time series data. Ecology 91 (5):1506-1518
Preisler HK, Ager AA, Johnson BK, Kie JG (2004) Modeling animal movements using stochastic differential equations. Environmetrics 15 (7):643-657
R Development Core Team (2010) R: A language and environment for statistical computing. R Foundation for Statistical Computing, Vienna, Austria
Railsback SF, Harvey BC (2002) Analysis of Habitat-Selection Rules Using an Individual-Based Model. Ecology 83 (7):1817-1830
Ritter R, Bednekoff P (1995) Dry season water, female movements and male territoriality in springbok: Preliminary evidence of waterhole-directed sexual selection. African Journal of Ecology 33:395-404
Rooney SM, Wolfe A, Hayden TJ (1998) Autocorrelated data in telemetry studies: time to independence and the problem of behavioural effects. Mammal Review 28 (2):89-98
Samuel MD, Pierce DJ, Garton EO (1985) Identifying Areas of Concentrated Use within the Home Range. Journal of Animal Ecology 54 (3):711-719
Sims DW, Southall EJ, Humphries NE, Hays GC, Bradshaw CJA, Pitchford JW, James A, Ahmed MZ, Brierley AS, Hindell MA, Morritt D, Musyl MK, Righton D, Shepard ELC,
98
Wearmouth VJ, Wilson RP, Witt MJ, Metcalfe JD (2008) Scaling laws of marine predator search behaviour. Nature 451 (7182):1098-1102
Tang W, Bennett DA (2010) Agent-based Modeling of Animal Movement: A Review. Geography Compass 4 (7):682-700
Tomkiewicz SM, Fuller MR, Kie JG, Bates KK (2010) Global positioning system and associated technologies in animal behaviour and ecological research. Philosophical Transactions of the Royal Society B: Biological Sciences 365 (1550):2163-2176. doi:10.1098/rstb.2010.0090
Tremblay Y, Roberts AJ, Costa DP (2007) Fractal landscape method: an alternative approach to measuring area-restricted searching behavior. J Exp Biol 210 (6):935-945. doi:10.1242/jeb.02710
Urbano F, Cagnacci F, Calenge Cm, Dettki H, Cameron A, Neteler M (2010) Wildlife tracking data management: a new vision. Philosophical Transactions of the Royal Society B: Biological Sciences 365 (1550):2177-2185. doi:10.1098/rstb.2010.0081
White GC, Garrott RA (1990) Analysis of Wildlife Radio-Tracking Data. Academic Press, San Diego, CA
Wittemyer G, Polansky L, Douglas-Hamilton I, Getz WM (2008) Disentangling the effects of forage, social rank, and risk on movement autocorrelation of elephants using Fourier and wavelet analyses. Proceedings of the National Academy of Sciences 105 (49):19108-19113. doi:10.1073/pnas.0801744105
Worton BJ (1989) Kernel Methods for Estimating the Utilization Distribution in Home-Range Studies. Ecology 70 (1):164-168
99
CHAPTER 5.
SPATIOTEMPORAL ASSOCIATION ANALYSIS WITH LOCAL HULLS Introduction
Inter- and intra-specific interactions between mobile individuals play important roles in a wide range of demographic and behavioral processes, including reproduction, competition, predation, and disease transmission, to name but a few (Morales et al. 2010). Measuring associations between individuals is thus central to a wide range of research questions. Direct measurement of interaction is an option for relatively few highly observable species (White and Harris 1994), however many species can not be observed directly. In such cases, movement data can serve as a window on interactions between individuals. The increasing availability of movement data from GPS devices has opened new opportunities for movement ecologists to study associations and understand their dynamics.
Classic techniques for measuring species interactions from location data fall into two families: static indices based upon aggregated space-use models for each individual, and dynamic measures which incorporate the properties of time-matched locations (Doncaster 1990). Static indices of association are generally based upon a space-use model for each individual, after which the area of intersection is measured. This can be as simple as taking the area of intersection of the minimum convex polygon of two sets of locations (Millspaugh et al. 2004) or overlap in core areas (Harris et al. 1990) (see Chapter 4 for a discussion of core area definitions). If the space-use model is in the form of a probability density function, as in Kernel Density Estimators, one may compute the volume of intersection instead of the area of intersection (Fieberg and Kochanny 2005; Seidel 1992). A more nuanced measure of association divides the space-use models into overlap and non-overlap areas, then computes how often each individual was in the overlap zone relative to their non-overlap zone (Minta 1992). Many static measures of association can be extended to quantify range shift by comparing space-use patterns over time rather than between individuals (Nelson et al. 2008).
Dynamic measures of interaction are derived from matched locations, with matches defined by a maximum temporal difference and/or a maximum distance threshold. One of the earliest dynamic indices, the Coefficient of Association, divides the number of matched locations defined by both space and time thresholds by the sum of number of individual observations (Cole 1949). The Doncaster test for non-random association compares the number of pairs within temporal and spatial threshold to the number of pairs obtained from neutral interaction as estimated from a simulated random walk (Doncaster 1990) or correlated random walk (White and Harris 1994). Other dynamic measures of association also integrate a model of space-use. The half-weight association index for example provides an index of avoidance versus attraction by comparing the number of matches in within a space-time threshold to the number of time matched locations when one individual is in the overlap zone (Doncaster 1990). All dynamic measures based upon matched locations are sensitive to the maximum thresholds for time and space.
While the dramatic improvements in GPS technology have generally improved space-use models across the board and thus association measures due to a richer set of data, traditional
100
spatial measures of association such as the VI index are derived from utilization distributions that throw away temporal information, and dynamic measures of association lack spatial structuring beyond coarse home range estimates. As a result these methods do not discern the spatiotemporal dynamics of interaction other than time windowing over seasonal or longer time scales (Nelson et al. 2008).
There are however numerous social and ecological processes that influence interactions at much finer spatiotemporal scales. Mobile individuals can selectively choose to avoid and/or associate with other individuals through either space or time use strategies. Intra-specific competition for resources, for example, can manifest itself through time-partitioning behavior, whereby individuals use a common resource but at different time periods to avoid direct contact. Time-partitioning is also characteristic of inter-specific competition and predator-prey interactions, such as when prey wait for predators to leave a watering hole. Other fine-grained covariates of association may include the time of day and environmental variables such as land cover or temperature.
In this chapter, I present a methodology for using local hulls to characterize association between individuals. As described in Chapter 4, hulls constructed with the time-scaled distance metric are localized in space and time, making them well-suited for characterizing the spatiotemporal dynamics of association. Increasingly, movement ecologists have access to simultaneous tracking data from multiple individuals over the same period of time. Given this type of data, two hull-based approaches can be used to characterize association: separate hull construction and combined construction. Hulls constructed for each individual separately and independently provide robust models of space-use, thus metrics derived from them reflect actual space-use properties as opposed to methodological artifacts. Two types of relationships or units of analysis can be measured in parallel hullsets – hulls that overlaps in time and hulls that overlap in space.
The most intuitive measure of association between hulls that overlap in time is the spatial distance between hull centroids. Plotted across space and over time may, this metric can reveal non-random associations, buffer distances and repulsion effects, thus illuminating important questions in behavioral ecology such as the mechanisms and signals which operate at the edges of an animal's home range.
Hulls that overlap in space may reveal temporal partitioning strategies for shared resources. At one end of the spectrum, closely associated individuals, such as a mother and calf, may consistently use the same resources at the same time. Alternately, individuals may actively avoid being at the same place either completely or within a given period of time. In the middle of the spectrum, individuals may share a resource with and without regard to the presence of the other individual, suggesting either no competition between the individuals and/or a plentiful resource. A consistent ordering, in which one individual occupies a space only after the other individual has moved on, is a measurable property that may indicate a dominance relationship. Other dynamics that are measurable with hulls include the effects of environmental variables on temporal partitioning strategies, as well as cyclical patterns of interaction (i.e., diurnal or seasonal).
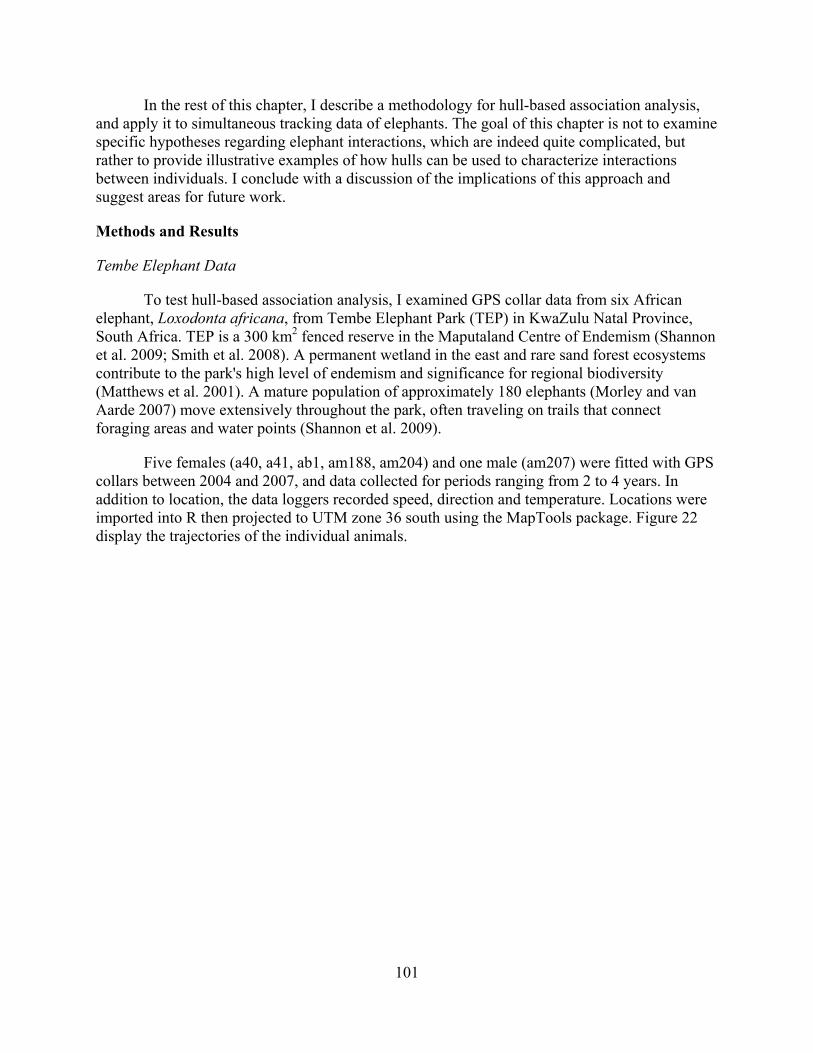
101
In the rest of this chapter, I describe a methodology for hull-based association analysis, and apply it to simultaneous tracking data of elephants. The goal of this chapter is not to examine specific hypotheses regarding elephant interactions, which are indeed quite complicated, but rather to provide illustrative examples of how hulls can be used to characterize interactions between individuals. I conclude with a discussion of the implications of this approach and suggest areas for future work.
Methods and Results
Tembe Elephant Data
To test hull-based association analysis, I examined GPS collar data from six African elephant, Loxodonta africana, from Tembe Elephant Park (TEP) in KwaZulu Natal Province, South Africa. TEP is a 300 km2 fenced reserve in the Maputaland Centre of Endemism (Shannon et al. 2009; Smith et al. 2008). A permanent wetland in the east and rare sand forest ecosystems contribute to the park's high level of endemism and significance for regional biodiversity (Matthews et al. 2001). A mature population of approximately 180 elephants (Morley and van Aarde 2007) move extensively throughout the park, often traveling on trails that connect foraging areas and water points (Shannon et al. 2009).
Five females (a40, a41, ab1, am188, am204) and one male (am207) were fitted with GPS collars between 2004 and 2007, and data collected for periods ranging from 2 to 4 years. In addition to location, the data loggers recorded speed, direction and temperature. Locations were imported into R then projected to UTM zone 36 south using the MapTools package. Figure 22 display the trajectories of the individual animals.
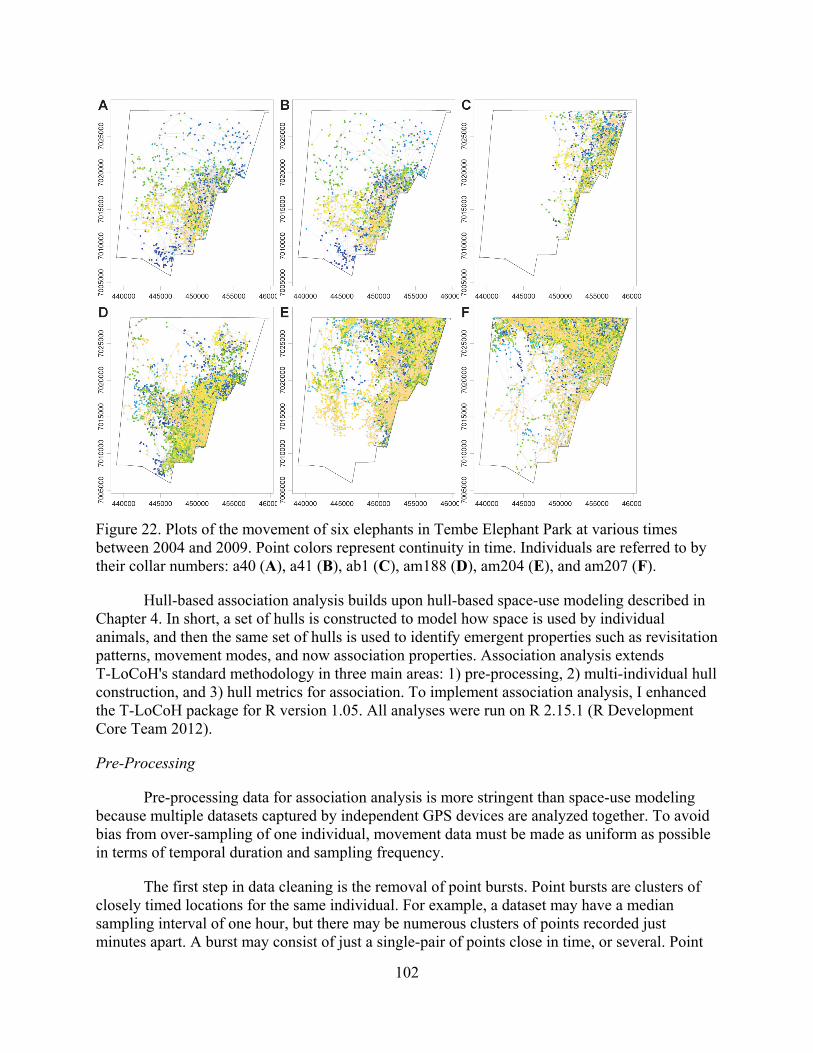
102
Figure 22. Plots of the movement of six elephants in Tembe Elephant Park at various times between 2004 and 2009. Point colors represent continuity in time. Individuals are referred to by their collar numbers: a40 (A), a41 (B), ab1 (C), am188 (D), am204 (E), and am207 (F).
Hull-based association analysis builds upon hull-based space-use modeling described in Chapter 4. In short, a set of hulls is constructed to model how space is used by individual animals, and then the same set of hulls is used to identify emergent properties such as revisitation patterns, movement modes, and now association properties. Association analysis extends T-LoCoH's standard methodology in three main areas: 1) pre-processing, 2) multi-individual hull construction, and 3) hull metrics for association. To implement association analysis, I enhanced the T-LoCoH package for R version 1.05. All analyses were run on R 2.15.1 (R Development Core Team 2012).
Pre-Processing
Pre-processing data for association analysis is more stringent than space-use modeling because multiple datasets captured by independent GPS devices are analyzed together. To avoid bias from over-sampling of one individual, movement data must be made as uniform as possible in terms of temporal duration and sampling frequency.
The first step in data cleaning is the removal of point bursts. Point bursts are clusters of closely timed locations for the same individual. For example, a dataset may have a median sampling interval of one hour, but there may be numerous clusters of points recorded just minutes apart. A burst may consist of just a single-pair of points close in time, or several. Point
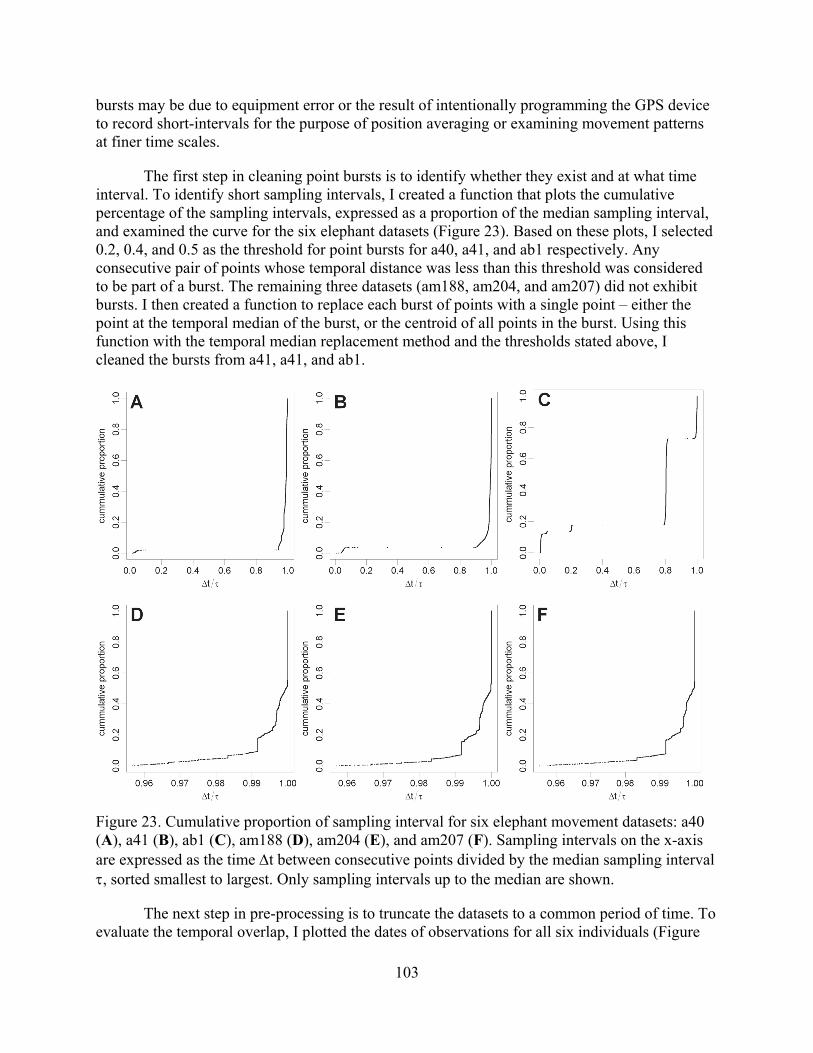
103
bursts may be due to equipment error or the result of intentionally programming the GPS device to record short-intervals for the purpose of position averaging or examining movement patterns at finer time scales.
The first step in cleaning point bursts is to identify whether they exist and at what time interval. To identify short sampling intervals, I created a function that plots the cumulative percentage of the sampling intervals, expressed as a proportion of the median sampling interval, and examined the curve for the six elephant datasets (Figure 23). Based on these plots, I selected 0.2, 0.4, and 0.5 as the threshold for point bursts for a40, a41, and ab1 respectively. Any consecutive pair of points whose temporal distance was less than this threshold was considered to be part of a burst. The remaining three datasets (am188, am204, and am207) did not exhibit bursts. I then created a function to replace each burst of points with a single point – either the point at the temporal median of the burst, or the centroid of all points in the burst. Using this function with the temporal median replacement method and the thresholds stated above, I cleaned the bursts from a41, a41, and ab1.
Figure 23. Cumulative proportion of sampling interval for six elephant movement datasets: a40 (A), a41 (B), ab1 (C), am188 (D), am204 (E), and am207 (F). Sampling intervals on the x-axis are expressed as the time t between consecutive points divided by the median sampling interval , sorted smallest to largest. Only sampling intervals up to the median are shown.
The next step in pre-processing is to truncate the datasets to a common period of time. To evaluate the temporal overlap, I plotted the dates of observations for all six individuals (Figure
104
24), revealing two time groups of three animals each. The first group contains individuals a40, a41, and ab1, who were tracked from early 2004 through early 2007. The second group consists of am188, am204, and am207 who were tracked from early 2007 through mid-2009. These two groups were treated separately for the rest of the analyses.
Figure 24. Dates of locations recorded for six elephants. Y-values have been 'jiggled' to better see point density
The next step of pre-processing is to standardize the sampling interval to account for differences over time and across individuals. If data collection was designed with association analysis in mind, the hardware may have been programmed to record at a common sampling interval, but more often than not collars are fitted for other purposes and/or sampling rates are adjusted mid-course based on hardware performance. When sampling intervals vary between two individuals or two time periods, one may either delete locations from the over-sampled dataset, or interpolate additional locations in the dataset sampled less often. Because of the additional uncertainty created by data interpolation, in this study I only used the deletion option. If associations between more than two individuals are analyzed, one may choose to standardize the sampling interval for each pair of individuals, or thin all datasets to a common sampling interval. The later approach has the advantage of enabling analysis across all pairs of individuals and direct comparisons of pair-wise association metrics.
To thin the elephant data to a common sampling interval, I wrote a function to plot the number of observations and sampling frequency over time for each group of elephants (Figure 25). I next created a function to delete points to achieve a common time period and sampling interval. The function works by generating a series of target sampling times based on a common sampling interval, then grabbing from each dataset the closest point in time to the targets. The common sampling interval can either be computed from the data by taking the least common multiple of the median sampling interval of each individual, or provided by the analyst. If a single location is found closest to two target dates, only one will be kept to prevent data duplication. After viewing the distribution of sampling intervals for each individual over time, I
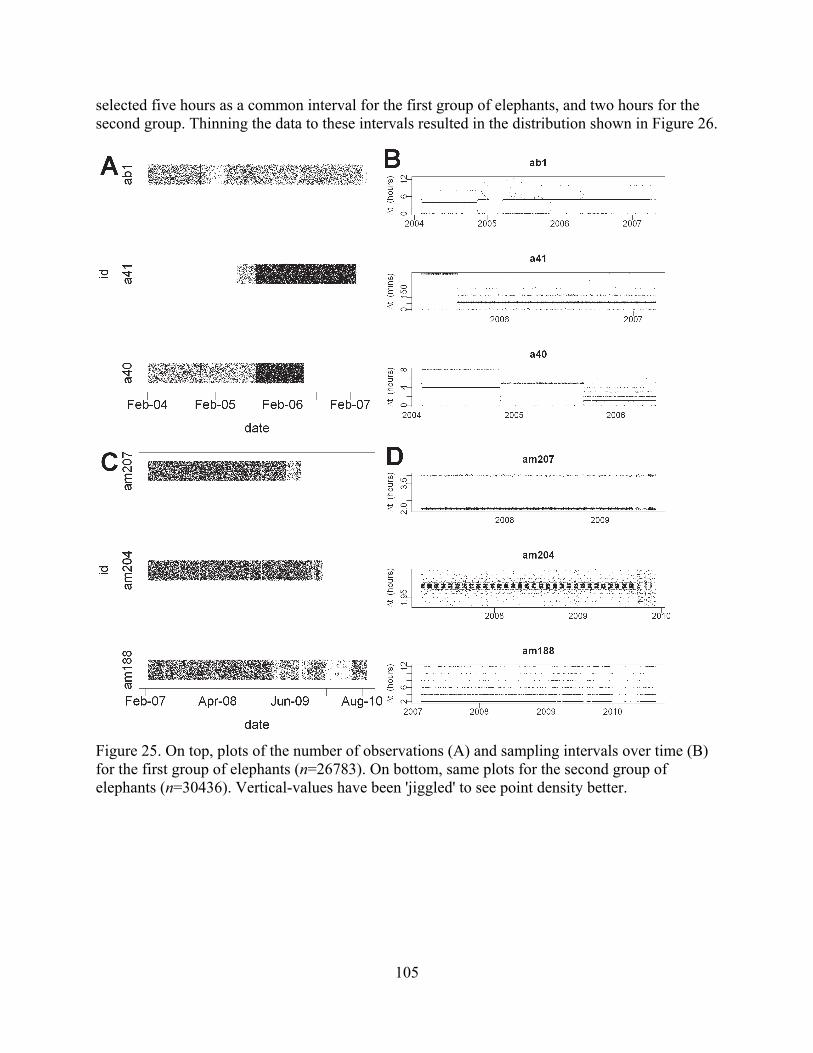
105
selected five hours as a common interval for the first group of elephants, and two hours for the second group. Thinning the data to these intervals resulted in the distribution shown in Figure 26.
Figure 25. On top, plots of the number of observations (A) and sampling intervals over time (B) for the first group of elephants (n=26783). On bottom, same plots for the second group of elephants (n=30436). Vertical-values have been 'jiggled' to see point density better.
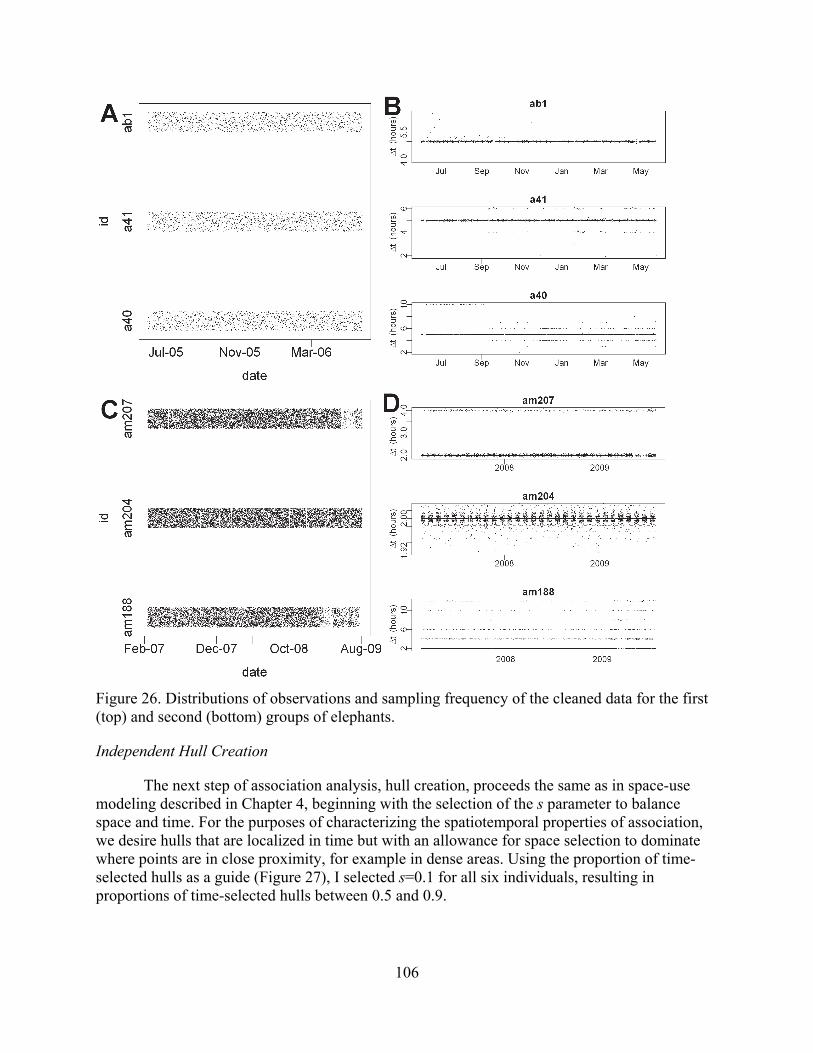
106
Figure 26. Distributions of observations and sampling frequency of the cleaned data for the first (top) and second (bottom) groups of elephants.
Independent Hull Creation
The next step of association analysis, hull creation, proceeds the same as in space-use modeling described in Chapter 4, beginning with the selection of the s parameter to balance space and time. For the purposes of characterizing the spatiotemporal properties of association, we desire hulls that are localized in time but with an allowance for space selection to dominate where points are in close proximity, for example in dense areas. Using the proportion of time-selected hulls as a guide (Figure 27), I selected s=0.1 for all six individuals, resulting in proportions of time-selected hulls between 0.5 and 0.9.
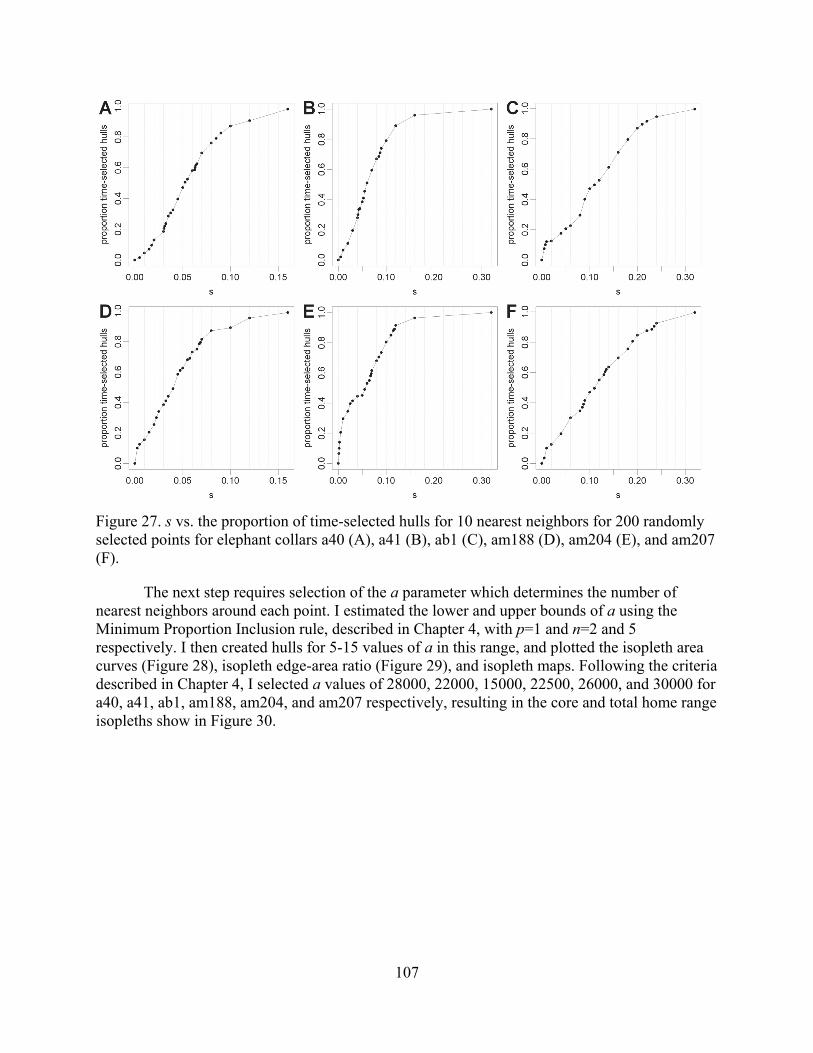
107
Figure 27. s vs. the proportion of time-selected hulls for 10 nearest neighbors for 200 randomly selected points for elephant collars a40 (A), a41 (B), ab1 (C), am188 (D), am204 (E), and am207 (F).
The next step requires selection of the a parameter which determines the number of nearest neighbors around each point. I estimated the lower and upper bounds of a using the Minimum Proportion Inclusion rule, described in Chapter 4, with p=1 and n=2 and 5 respectively. I then created hulls for 5-15 values of a in this range, and plotted the isopleth area curves (Figure 28), isopleth edge-area ratio (Figure 29), and isopleth maps. Following the criteria described in Chapter 4, I selected a values of 28000, 22000, 15000, 22500, 26000, and 30000 for a40, a41, ab1, am188, am204, and am207 respectively, resulting in the core and total home range isopleths show in Figure 30.
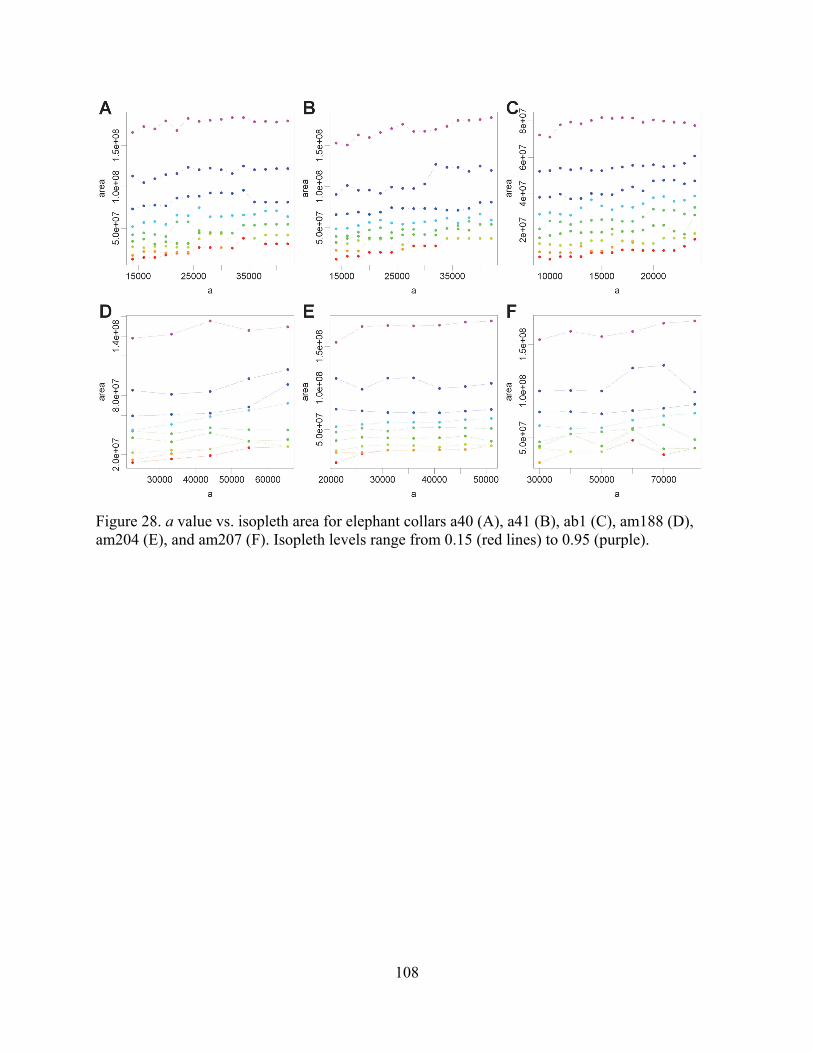
108
Figure 28. a value vs. isopleth area for elephant collars a40 (A), a41 (B), ab1 (C), am188 (D), am204 (E), and am207 (F). Isopleth levels range from 0.15 (red lines) to 0.95 (purple).
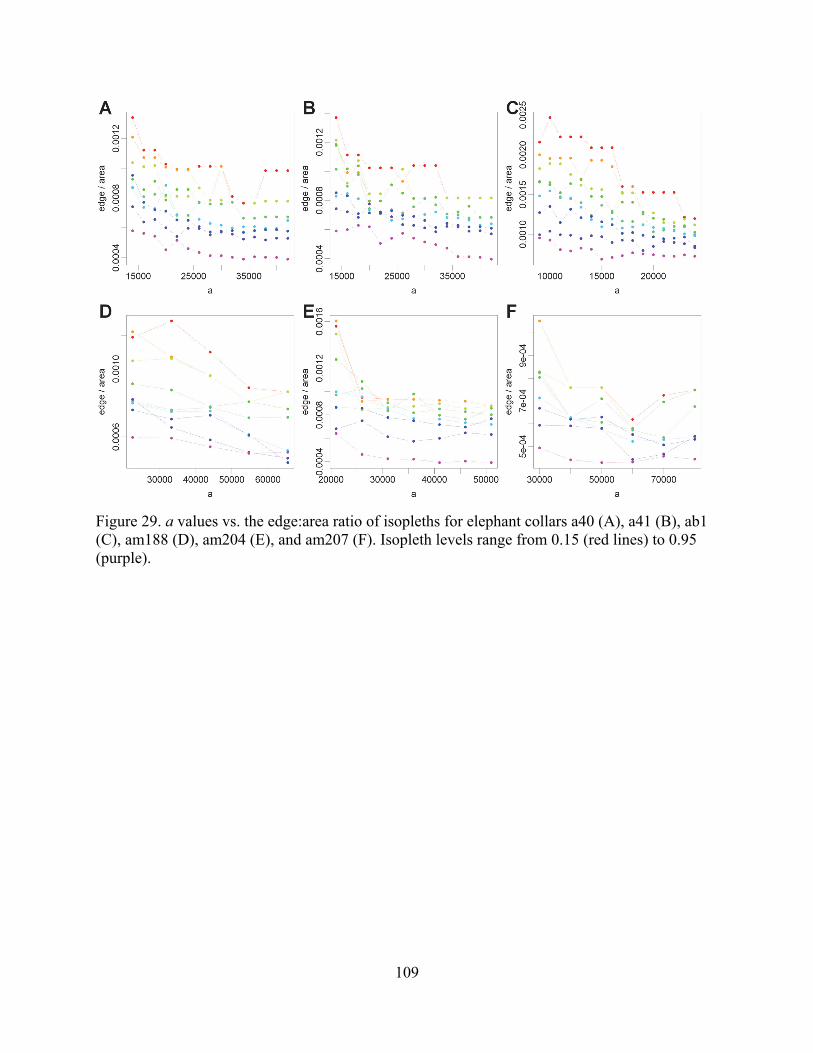
109
Figure 29. a values vs. the edge:area ratio of isopleths for elephant collars a40 (A), a41 (B), ab1 (C), am188 (D), am204 (E), and am207 (F). Isopleth levels range from 0.15 (red lines) to 0.95 (purple).
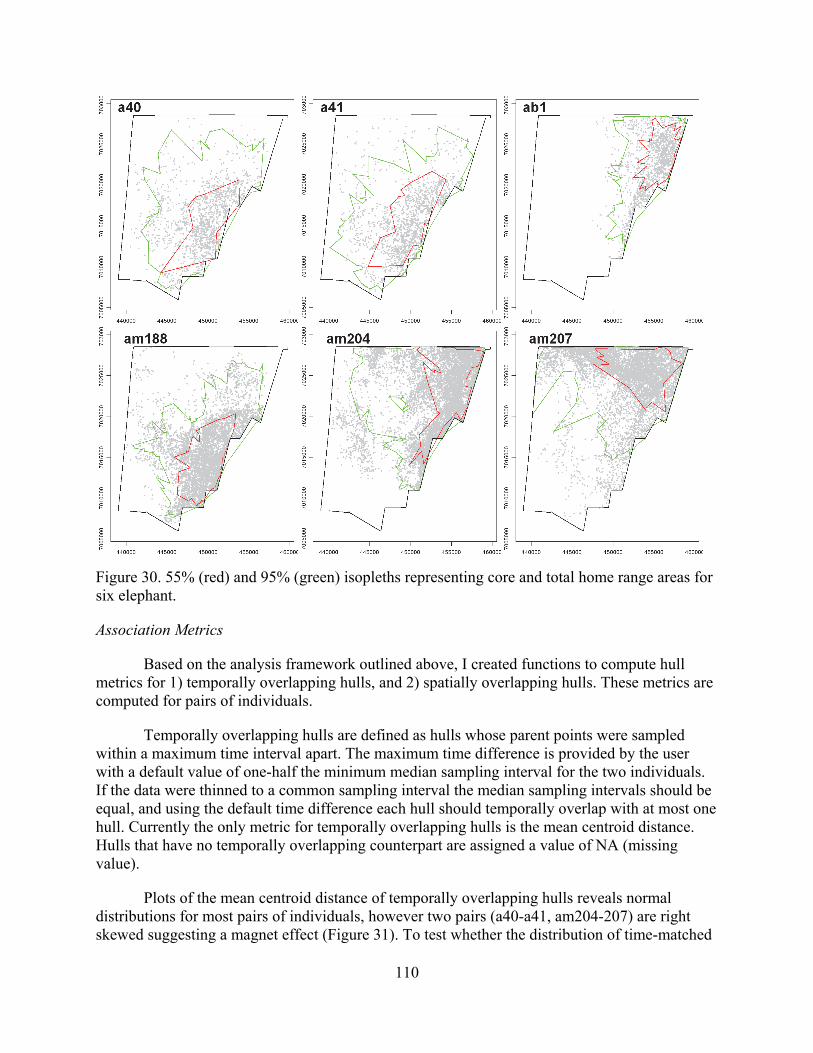
110
Figure 30. 55% (red) and 95% (green) isopleths representing core and total home range areas for six elephant.
Association Metrics
Based on the analysis framework outlined above, I created functions to compute hull metrics for 1) temporally overlapping hulls, and 2) spatially overlapping hulls. These metrics are computed for pairs of individuals.
Temporally overlapping hulls are defined as hulls whose parent points were sampled within a maximum time interval apart. The maximum time difference is provided by the user with a default value of one-half the minimum median sampling interval for the two individuals. If the data were thinned to a common sampling interval the median sampling intervals should be equal, and using the default time difference each hull should temporally overlap with at most one hull. Currently the only metric for temporally overlapping hulls is the mean centroid distance. Hulls that have no temporally overlapping counterpart are assigned a value of NA (missing value).
Plots of the mean centroid distance of temporally overlapping hulls reveals normal distributions for most pairs of individuals, however two pairs (a40-a41, am204-207) are right skewed suggesting a magnet effect (Figure 31). To test whether the distribution of time-matched
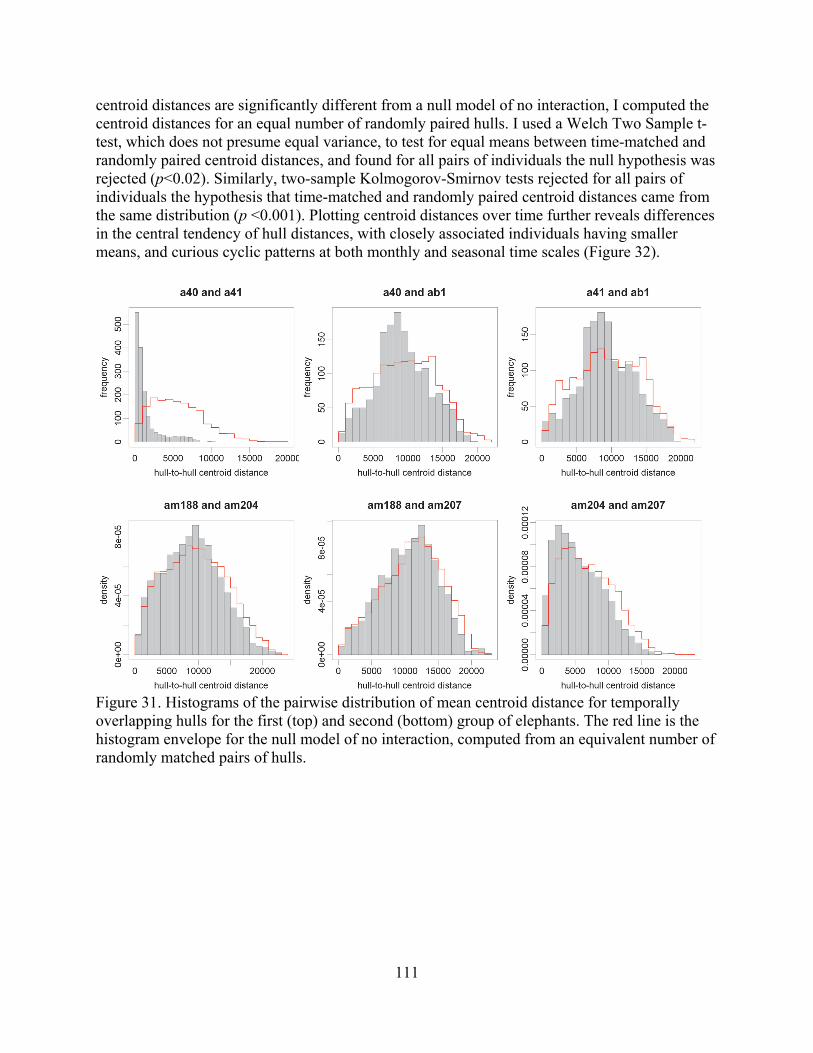
111
centroid distances are significantly different from a null model of no interaction, I computed the centroid distances for an equal number of randomly paired hulls. I used a Welch Two Sample t-test, which does not presume equal variance, to test for equal means between time-matched and randomly paired centroid distances, and found for all pairs of individuals the null hypothesis was rejected (p<0.02). Similarly, two-sample Kolmogorov-Smirnov tests rejected for all pairs of individuals the hypothesis that time-matched and randomly paired centroid distances came from the same distribution (p <0.001). Plotting centroid distances over time further reveals differences in the central tendency of hull distances, with closely associated individuals having smaller means, and curious cyclic patterns at both monthly and seasonal time scales (Figure 32).
Figure 31. Histograms of the pairwise distribution of mean centroid distance for temporally overlapping hulls for the first (top) and second (bottom) group of elephants. The red line is the histogram envelope for the null model of no interaction, computed from an equivalent number of randomly matched pairs of hulls.
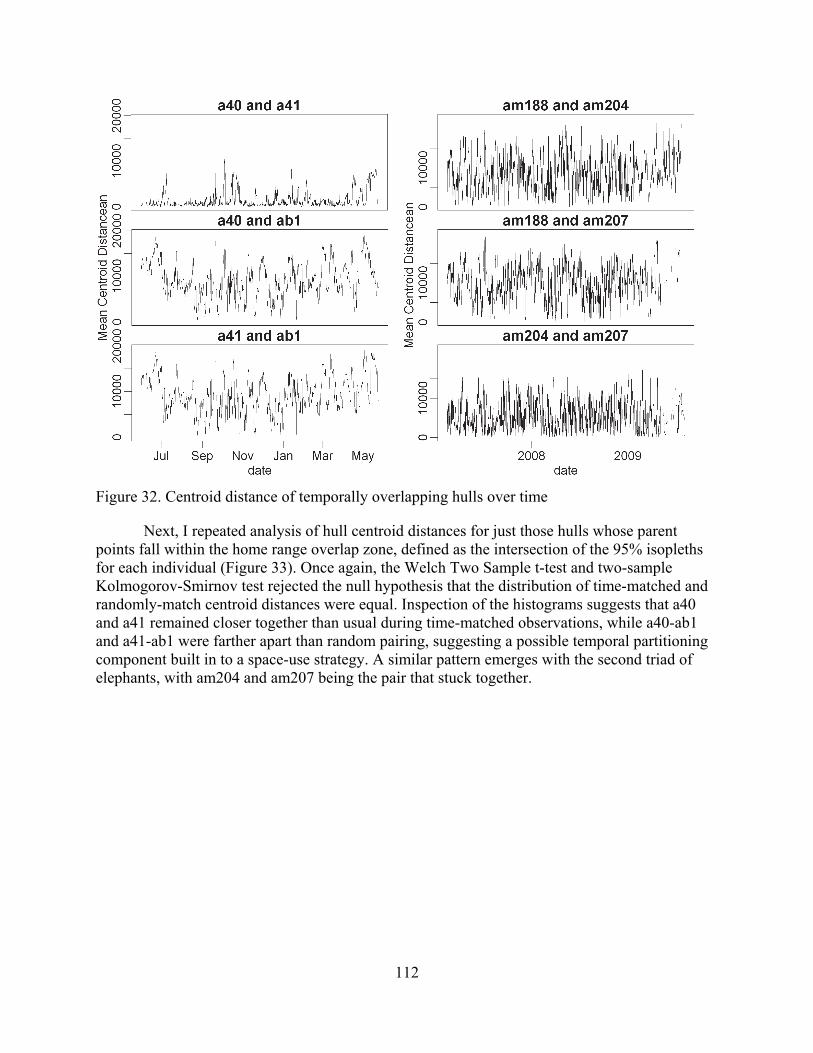
112
Figure 32. Centroid distance of temporally overlapping hulls over time
Next, I repeated analysis of hull centroid distances for just those hulls whose parent points fall within the home range overlap zone, defined as the intersection of the 95% isopleths for each individual (Figure 33). Once again, the Welch Two Sample t-test and two-sample Kolmogorov-Smirnov test rejected the null hypothesis that the distribution of time-matched and randomly-match centroid distances were equal. Inspection of the histograms suggests that a40 and a41 remained closer together than usual during time-matched observations, while a40-ab1 and a41-ab1 were farther apart than random pairing, suggesting a possible temporal partitioning component built in to a space-use strategy. A similar pattern emerges with the second triad of elephants, with am204 and am207 being the pair that stuck together.
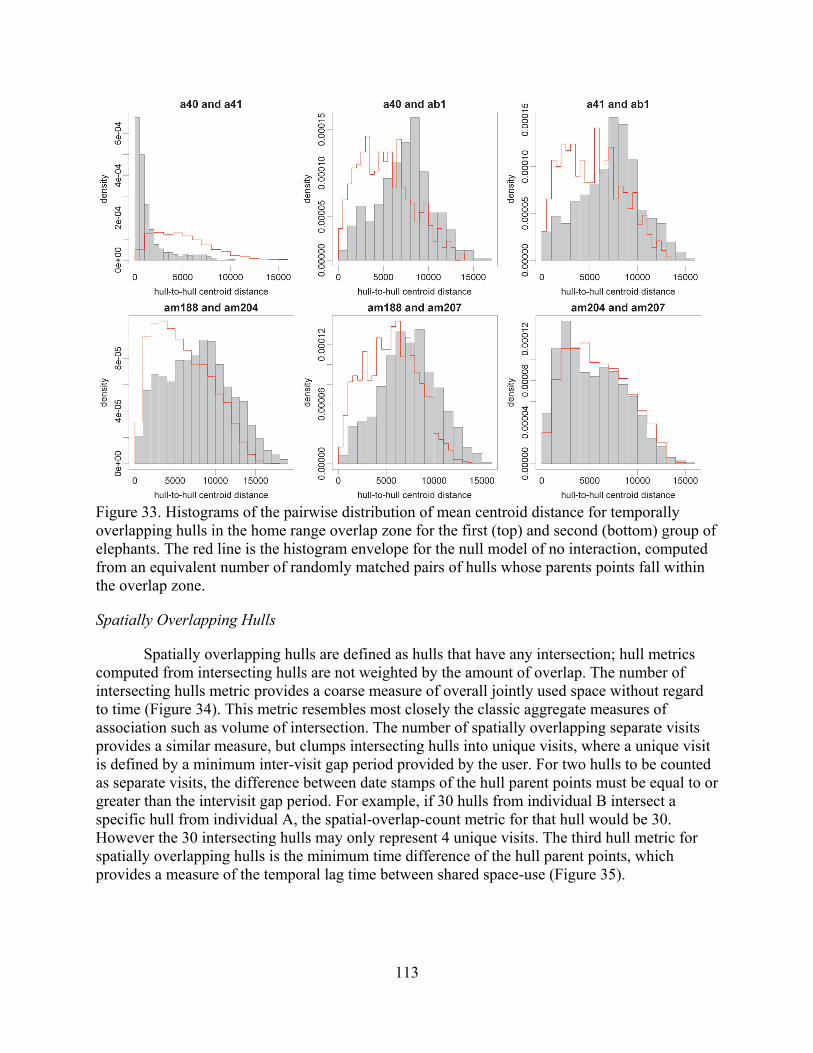
113
Figure 33. Histograms of the pairwise distribution of mean centroid distance for temporally overlapping hulls in the home range overlap zone for the first (top) and second (bottom) group of elephants. The red line is the histogram envelope for the null model of no interaction, computed from an equivalent number of randomly matched pairs of hulls whose parents points fall within the overlap zone.
Spatially Overlapping Hulls
Spatially overlapping hulls are defined as hulls that have any intersection; hull metrics computed from intersecting hulls are not weighted by the amount of overlap. The number of intersecting hulls metric provides a coarse measure of overall jointly used space without regard to time (Figure 34). This metric resembles most closely the classic aggregate measures of association such as volume of intersection. The number of spatially overlapping separate visits provides a similar measure, but clumps intersecting hulls into unique visits, where a unique visit is defined by a minimum inter-visit gap period provided by the user. For two hulls to be counted as separate visits, the difference between date stamps of the hull parent points must be equal to or greater than the intervisit gap period. For example, if 30 hulls from individual B intersect a specific hull from individual A, the spatial-overlap-count metric for that hull would be 30. However the 30 intersecting hulls may only represent 4 unique visits. The third hull metric for spatially overlapping hulls is the minimum time difference of the hull parent points, which provides a measure of the temporal lag time between shared space-use (Figure 35).
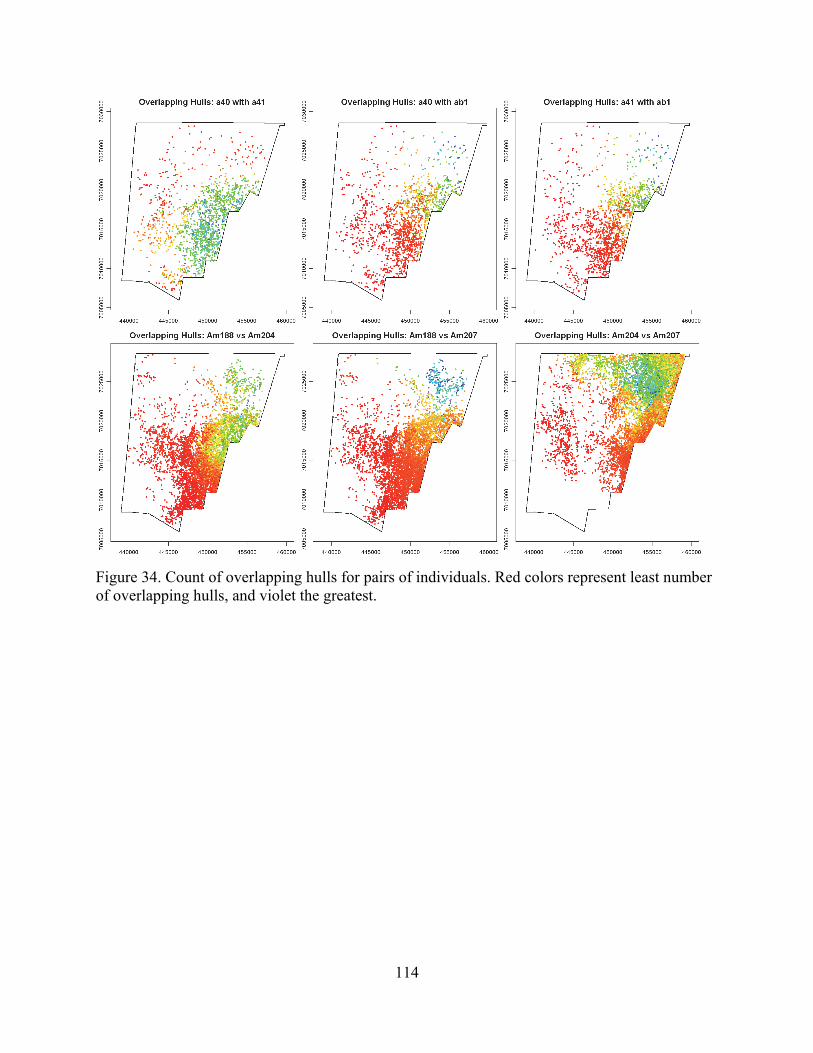
114
Figure 34. Count of overlapping hulls for pairs of individuals. Red colors represent least number of overlapping hulls, and violet the greatest.
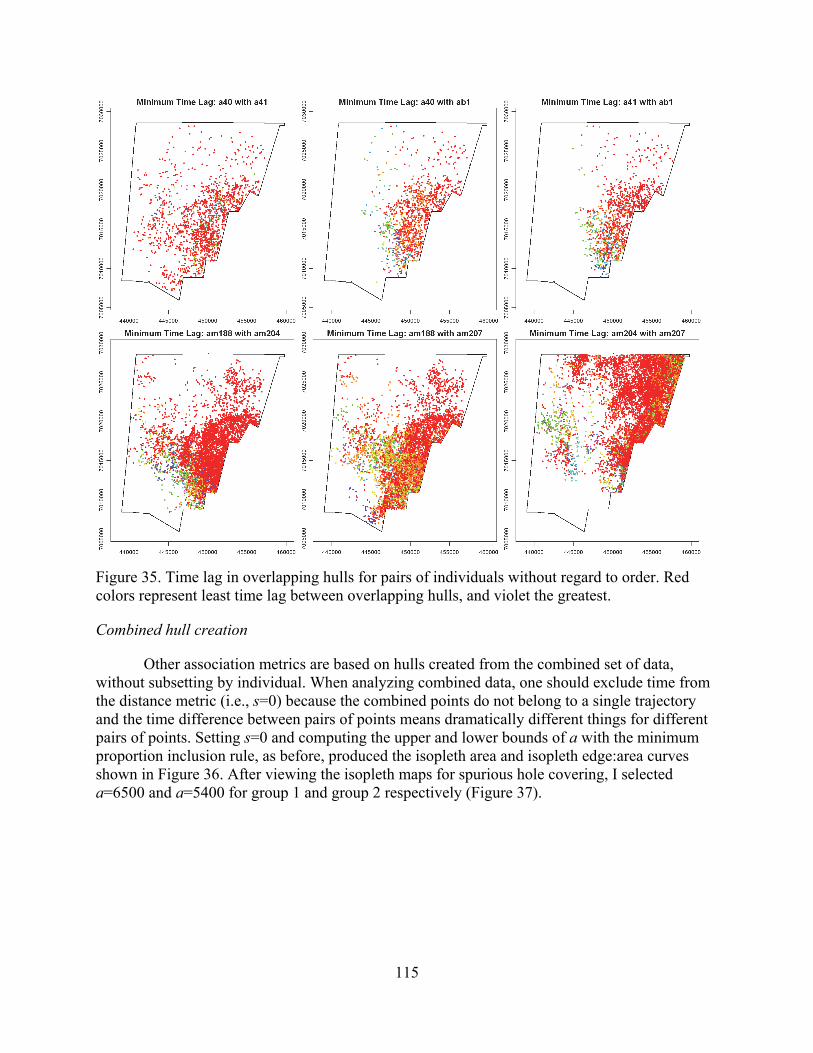
115
Figure 35. Time lag in overlapping hulls for pairs of individuals without regard to order. Red colors represent least time lag between overlapping hulls, and violet the greatest.
Combined hull creation
Other association metrics are based on hulls created from the combined set of data, without subsetting by individual. When analyzing combined data, one should exclude time from the distance metric (i.e., s=0) because the combined points do not belong to a single trajectory and the time difference between pairs of points means dramatically different things for different pairs of points. Setting s=0 and computing the upper and lower bounds of a with the minimum proportion inclusion rule, as before, produced the isopleth area and isopleth edge:area curves shown in Figure 36. After viewing the isopleth maps for spurious hole covering, I selected a=6500 and a=5400 for group 1 and group 2 respectively (Figure 37).
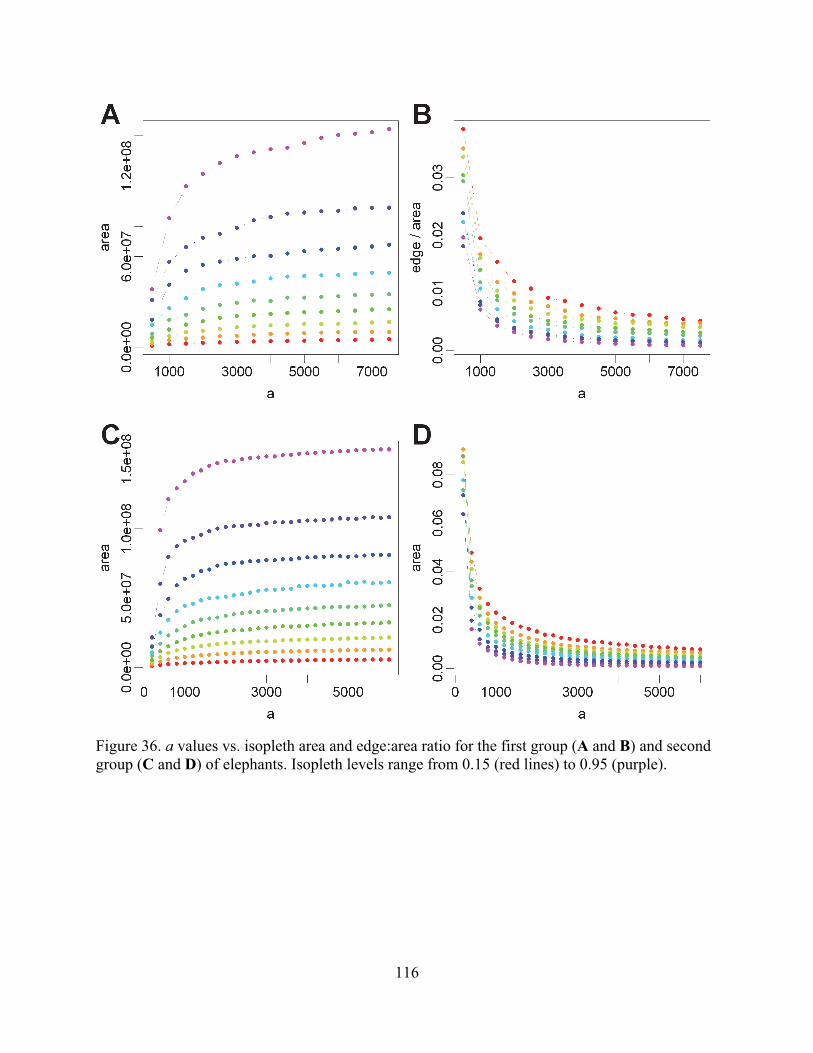
116
Figure 36. a values vs. isopleth area and edge:area ratio for the first group (A and B) and second group (C and D) of elephants. Isopleth levels range from 0.15 (red lines) to 0.95 (purple).
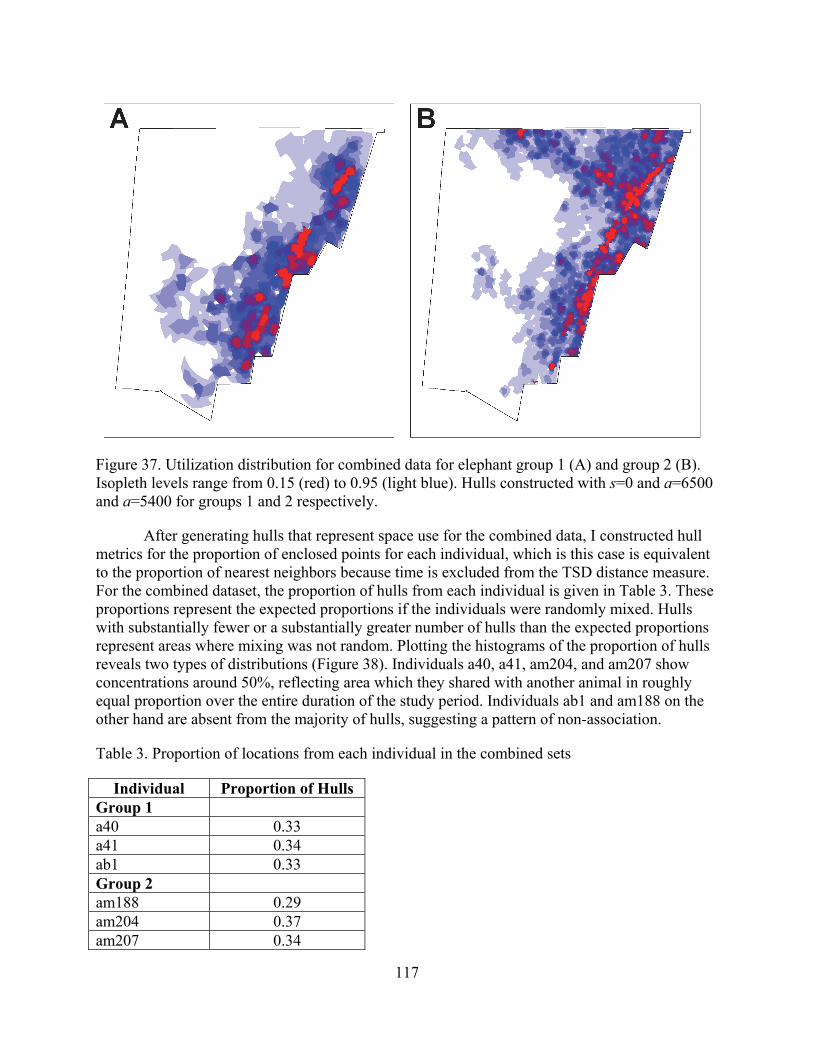
117
Figure 37. Utilization distribution for combined data for elephant group 1 (A) and group 2 (B). Isopleth levels range from 0.15 (red) to 0.95 (light blue). Hulls constructed with s=0 and a=6500 and a=5400 for groups 1 and 2 respectively.
After generating hulls that represent space use for the combined data, I constructed hull metrics for the proportion of enclosed points for each individual, which is this case is equivalent to the proportion of nearest neighbors because time is excluded from the TSD distance measure. For the combined dataset, the proportion of hulls from each individual is given in Table 3. These proportions represent the expected proportions if the individuals were randomly mixed. Hulls with substantially fewer or a substantially greater number of hulls than the expected proportions represent areas where mixing was not random. Plotting the histograms of the proportion of hulls reveals two types of distributions (Figure 38). Individuals a40, a41, am204, and am207 show concentrations around 50%, reflecting area which they shared with another animal in roughly equal proportion over the entire duration of the study period. Individuals ab1 and am188 on the other hand are absent from the majority of hulls, suggesting a pattern of non-association.
Table 3. Proportion of locations from each individual in the combined sets
Individual Proportion of Hulls Group 1 a40 0.33 a41 0.34 ab1 0.33 Group 2 am188 0.29 am204 0.37 am207 0.34
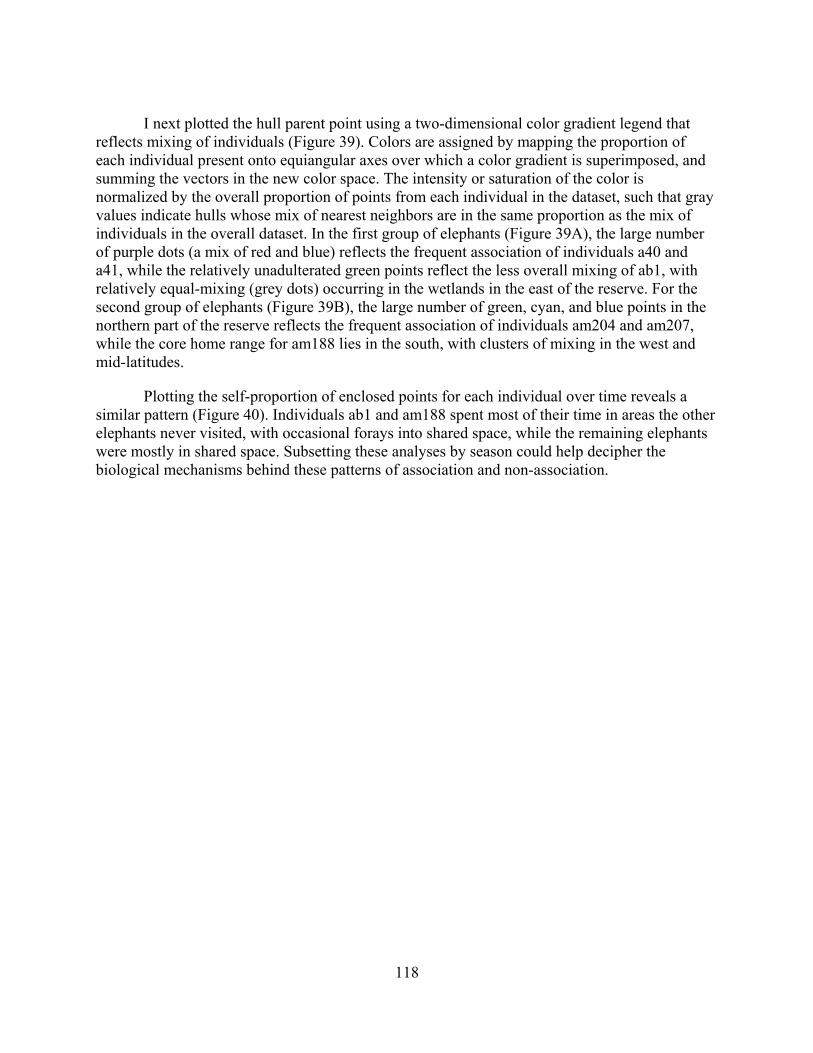
118
I next plotted the hull parent point using a two-dimensional color gradient legend that
reflects mixing of individuals (Figure 39). Colors are assigned by mapping the proportion of each individual present onto equiangular axes over which a color gradient is superimposed, and summing the vectors in the new color space. The intensity or saturation of the color is normalized by the overall proportion of points from each individual in the dataset, such that gray values indicate hulls whose mix of nearest neighbors are in the same proportion as the mix of individuals in the overall dataset. In the first group of elephants (Figure 39A), the large number of purple dots (a mix of red and blue) reflects the frequent association of individuals a40 and a41, while the relatively unadulterated green points reflect the less overall mixing of ab1, with relatively equal-mixing (grey dots) occurring in the wetlands in the east of the reserve. For the second group of elephants (Figure 39B), the large number of green, cyan, and blue points in the northern part of the reserve reflects the frequent association of individuals am204 and am207, while the core home range for am188 lies in the south, with clusters of mixing in the west and mid-latitudes.
Plotting the self-proportion of enclosed points for each individual over time reveals a similar pattern (Figure 40). Individuals ab1 and am188 spent most of their time in areas the other elephants never visited, with occasional forays into shared space, while the remaining elephants were mostly in shared space. Subsetting these analyses by season could help decipher the biological mechanisms behind these patterns of association and non-association.
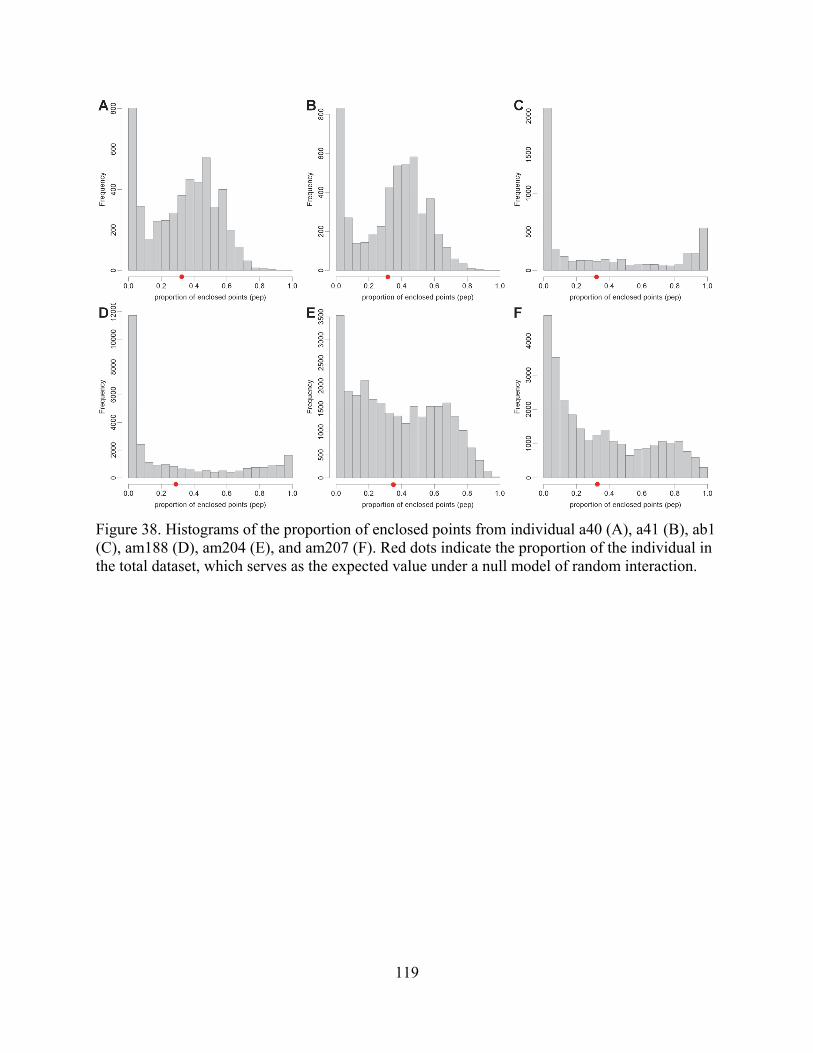
119
Figure 38. Histograms of the proportion of enclosed points from individual a40 (A), a41 (B), ab1 (C), am188 (D), am204 (E), and am207 (F). Red dots indicate the proportion of the individual in the total dataset, which serves as the expected value under a null model of random interaction.
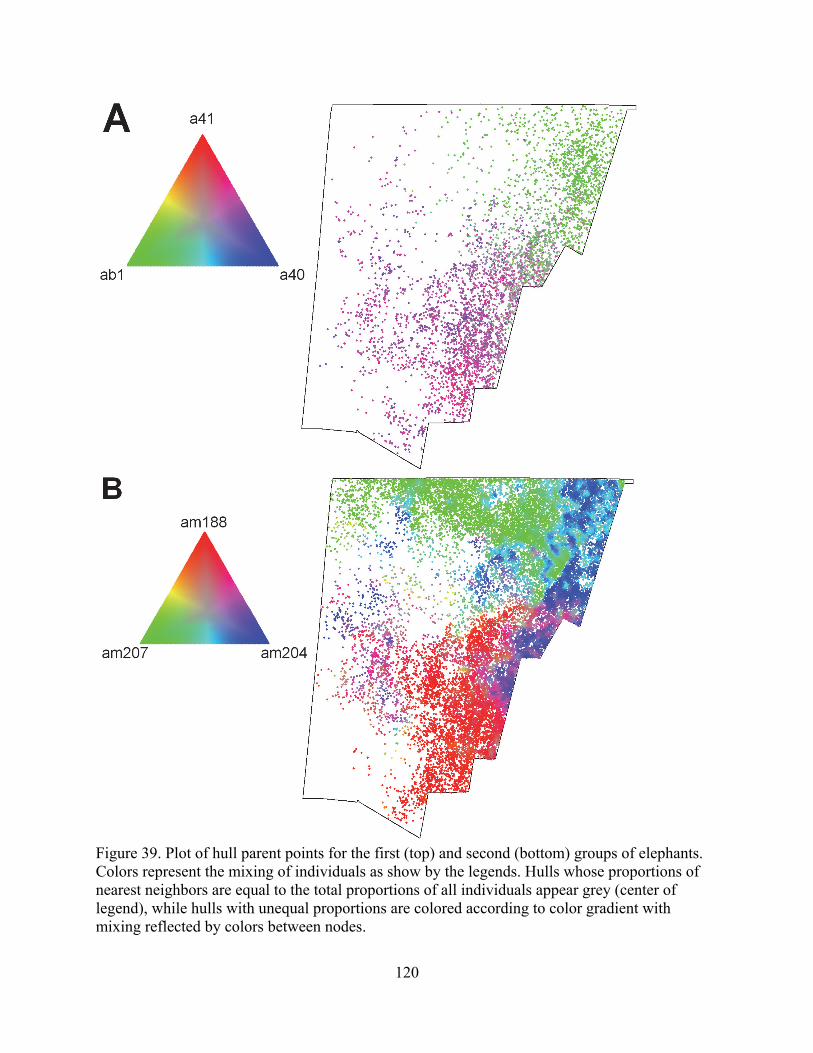
120
Figure 39. Plot of hull parent points for the first (top) and second (bottom) groups of elephants. Colors represent the mixing of individuals as show by the legends. Hulls whose proportions of nearest neighbors are equal to the total proportions of all individuals appear grey (center of legend), while hulls with unequal proportions are colored according to color gradient with mixing reflected by colors between nodes.
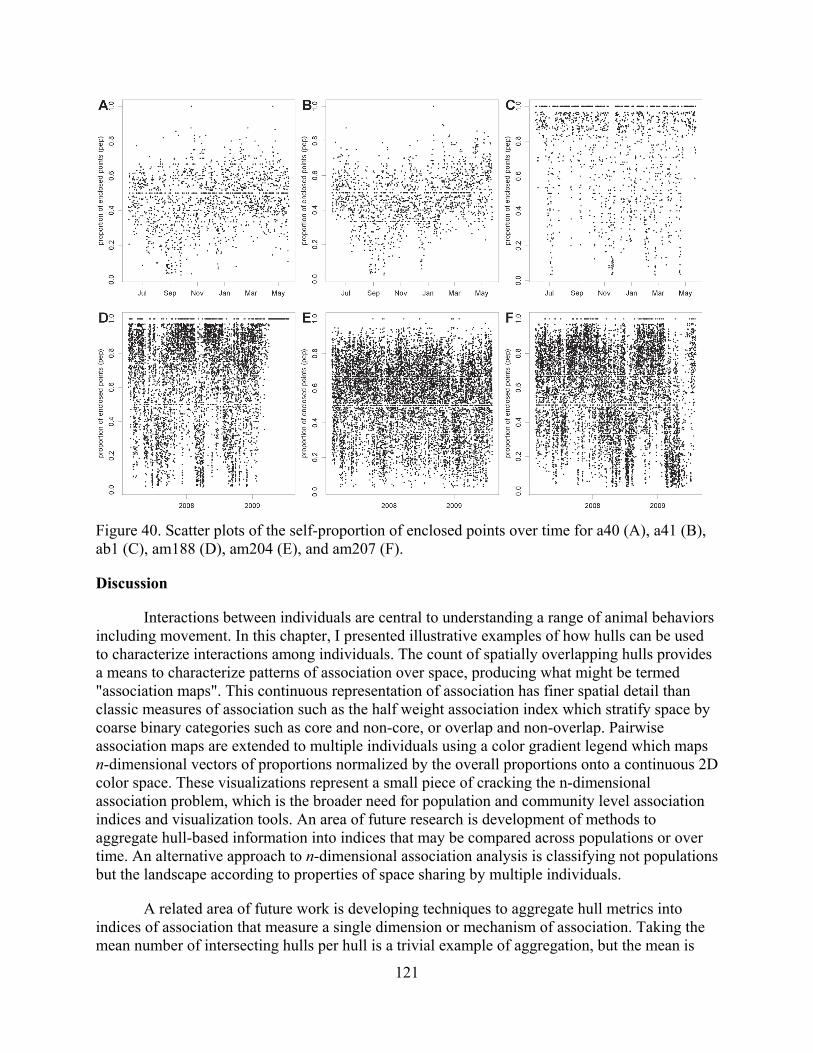
121
Figure 40. Scatter plots of the self-proportion of enclosed points over time for a40 (A), a41 (B), ab1 (C), am188 (D), am204 (E), and am207 (F).
Discussion
Interactions between individuals are central to understanding a range of animal behaviors including movement. In this chapter, I presented illustrative examples of how hulls can be used to characterize interactions among individuals. The count of spatially overlapping hulls provides a means to characterize patterns of association over space, producing what might be termed "association maps". This continuous representation of association has finer spatial detail than classic measures of association such as the half weight association index which stratify space by coarse binary categories such as core and non-core, or overlap and non-overlap. Pairwise association maps are extended to multiple individuals using a color gradient legend which maps n-dimensional vectors of proportions normalized by the overall proportions onto a continuous 2D color space. These visualizations represent a small piece of cracking the n-dimensional association problem, which is the broader need for population and community level association indices and visualization tools. An area of future research is development of methods to aggregate hull-based information into indices that may be compared across populations or over time. An alternative approach to n-dimensional association analysis is classifying not populations but the landscape according to properties of space sharing by multiple individuals.
A related area of future work is developing techniques to aggregate hull metrics into indices of association that measure a single dimension or mechanism of association. Taking the mean number of intersecting hulls per hull is a trivial example of aggregation, but the mean is
122
sensitive to sample size and thus difficult to interpret or compare across pairs of individuals. More useful would be transformation to scales whose lower and upper bounds represent well-defined ends of a spectrum. The low-hanging fruit is the scale that measures association along of spectrum of attraction—neutral interaction—repulsion, but other scales are possible based on other typologies of association. Developing scales of association should be in reference to classic indices of association to enable comparisons, but will likely go beyond existing methods due to the finer grained spatiotemporal properties of hulls.
Traditional indices of association are generally based on point locations. In considering hull-based analysis, an important question is the additional value of hulls above and beyond point-based measures of association. For example, distances between time-matched points will reflect the same general patterns as distances between time-matched hulls. However compared to point data, two-dimensional hulls that represent a region of space-time derived from the data open the door to exploring potential covariates of association including behavior mode (which can be modeled from hull geometry as described in Chapter 4), intensity of space-use, time-use patterns, as well as environmental variables such as soil type, distance to water, typography, and vegetation class. Nearly all association measures require spatial units of analysis to define events such as "revisitation" or "shared space use". Point-based analyses superimpose artificial geometries such as square grids (Seidel 1992) or circles (Benhamou and Riotte-Lambert 2012). Although convenient, such geometries presume homogeneous and static landscape properties and behavior mechanisms, which are rarely the case. In contrast hulls are constructed from the observed locations, dynamically adapt to point density and landscape features, and thus remain closer to the actual data.
Because hull-based association metrics are not parametric nor analytically tractable with real data, future development will likely require simulated datasets with known properties. Simulated data with neutral interaction is a logical choice for a null model; other patterns that can be built into a simulated dataset include avoidance, magnetic effects, temporal lags, and associations that vary over time or across space. Ultimately the properties of the simulated data should reflect actual behavioral processes in question.
Patterns of association revealed by hull-based analysis can be explored in greater detail in reference to specific hypotheses or questions about behavior using regression models and other statistical approaches on hull properties. Potential applications of this work also include development and parameterization of multi-individual state-space and agent-based models that explicitly incorporate interactions between individuals. Single-individual state-space models typically incorporate environmental characteristics such as resource quality, and internal states such as energetic needs and cognitive states. However animal movements are also strongly affected by the character of interactions with other animals. Hull-based metrics of association combined with hull-derived geometric and environmental properties offer a promising approach to developing multi-individual models.
References
Benhamou S, Riotte-Lambert L (2012) Beyond the Utilization Distribution: Identifying home range areas that are intensively exploited or repeatedly visited. Ecological Modelling 227 (0):112-116
123
Cole LC (1949) The Measurement of Interspecific Associaton. Ecology 30 (4):411-424 Doncaster CP (1990) Non-parametric estimates of interaction from radio-tracking data. Journal
of Theoretical Biology 143 (4):431-443 Fieberg J, Kochanny CO (2005) Quantifying Home-Range Overlap: The Importance of the
Utilization Distribution. The Journal of Wildlife Management 69 (4):1346-1359 Harris S, Cresswell WJ, Forde PG, Trewhella WJ, Woollard T, Wray S (1990) Home-range
analysis using radio-tracking data–a review of problems and techniques particularly as applied to the study of mammals. Mammal Review 20 (2-3):97-123
Matthews W, van Wyk A, van Rooyen N, Botha G (2001) Vegetation of the Tembe Elephant Park, Maputaland, South Africa. South African Journal of Botany 67 (4):573-594
Millspaugh JJ, Gitzen RA, Kernohan BJ, Larson MA, Clay CL (2004) Comparability of Three Analytical Techniques to Assess Joint Space Use. Wildlife Society Bulletin 32 (1):148-157
Minta SC (1992) Tests of Spatial and Temporal Interaction Among Animals. Ecological Applications 2 (2):178-188
Morales JM, Moorcroft PR, Matthiopoulos J, Frair JL, Kie JG, Powell RA, Merrill EH, Haydon DT (2010) Building the bridge between animal movement and population dynamics. Philosophical Transactions of the Royal Society B: Biological Sciences 365 (1550):2289-2301. doi:10.1098/rstb.2010.0082
Morley RC, van Aarde RJ (2007) Estimating abundance for a savanna elephant population using mark–resight methods: a case study for the Tembe Elephant Park, South Africa. Journal of Zoology 271 (4):418-427
Nelson TA, Duffus DA, Robertson C, Feyrer LJ (2008) Spatial-temporal patterns in intra-annual gray whale foraging: Characterizing interactions between predators and prey in Clayquot Sound, British Columbia, Canada. Marine Mammal Science 24 (2):356-370
R Development Core Team (2012) R: A language and environment for statistical computing. R Foundation for Statistical Computing, Vienna, Austria
Seidel KD (1992) Statistical Properties and Applications of a New Measure of Joint Space Use for Wildlife. University of Washington,
Shannon G, Matthews WS, Page BR, Parker GE, Smith RJ (2009) The affects of artificial water availability on large herbivore ranging patterns in savanna habitats: a new approach based on modelling elephant path distributions. Diversity and Distributions 15 (5):776-783
Smith RJ, Easton J, Nhancale BA, Armstrong AJ, Culverwell J, Dlamini SD, Goodman PS, Loffler L, Matthews WS, Monadjem A, Mulqueeny CM, Ngwenya P, Ntumi CP, Soto B, Leader-Williams N (2008) Designing a transfrontier conservation landscape for the Maputaland centre of endemism using biodiversity, economic and threat data. Biological Conservation 141 (8):2127-2138
White PCL, Harris S (1994) Encounters between Red Foxes (Vulpes vulpes): Implications for Territory Maintenance, Social Cohesion and Dispersal. Journal of Animal Ecology 63 (2):315-327
124
CHAPTER 6
CONCLUSION: TOWARDS AN INTEGRATION OF VISION Introduction
As outlined in chapter one, I present in this dissertation studies of coupled socio-ecological systems (SES) through different optics or perspectives differentiated by discipline, scale, and degree of abstraction. To begin this journey, in chapter one I use the language of vision to lay out the structure and normative reasoning for an information framework for the study of coupled socio-ecological systems (SES) that is built upon an understanding of coupled SES as complex adaptive systems that can not be fully specified by reductionist science, an acknowledgement that the current historical junction is marked by rapid environmental deterioration and dramatic consequences from present-day actions, and a value framework that takes seriously equity among social groups, species, and generations. In the current chapter, I revisit the research presented in parts I and II of the dissertation in light of this framework, ask what added value does one get when viewing a complex system thru multiple perspectives and from multiple vantage points, and discuss what does it take to get different epistemological communities talking to each other.
To review the main points of the research chapters, Part I of dissertation attempts to explain a paradoxical outcome by taking a view from within. It begins with a survey of the peer-reviewed literature on community based natural resource management (CBNRM), the bulk of which examines ecological or social outcomes of CBNRM as a function of site characteristics, incentives and disincentive for conservation, deeply rooted social relations and narratives, and the cause-effect model the program is based on. I then describe a case study of a CBNRM project from Zambia and try to answer the question why a project that had so many supporters and did so many things right struggled and ultimately failed to survive beyond its initial round of funding. Rather than explain this outcome based on what the project did or did not achieve on the ground, I apply a highly qualitative ethnographic approach and a set of ideas from development studies and public administration to illustrate the importance of also unpacking the broader institutional context in which projects operate as important explanatory factors for the evolution of projects. Viewing the project through this lens reveals the ways in which the genesis of the project, the need to stabilize relations both within the project and with its allies, a managerial style that had its origins with the donor, unforeseen political dynamics at the project site, and a complicated but ultimately unworkable narrative about synergy and spinoffs produced challenges and influenced staff decisions from the onset.
Part II starts from a very different viewing platform – a constellation of orbiting satellites that provide the location of moving objects on the planet's surface. I develop and present the T-LoCoH algorithm and software package to analyze spatial and temporal patterns in raw tracking data that has very little context with it save the location and time of each observation. The algorithm transforms each point location into little convex polygons; which are then aggregated using a variety of metrics to model space-use, time-use, and canonical activity modes. Using sample tracking data from free-ranging springbok antelope in Etosha National Park in Namibia and elephants from Tembe Elephant Reserve in South Africa, I illustrate how
125
this method can reveal and characterize patterns not readily evident from maps or animations of the raw data. In particular, the analysis reveals striking correlations between spatial and temporal clustering and produces maps of behavior and clusters of association over space and time.
From Framework to Assessment: Standards of Good Knowledge
Objectivity
In critiquing my research in terms of objectivity, one of the hallmarks of good science and a cornerstone of the information framework presented in Chapter 1, I invoke three standards or axes of objectivity. Latour (2000) highlights objective science as that which is able to "modify the representation the public has of itself fast enough so that we can be sure that the greatest number of objections have been made to this representation" (italics in original, Latour 2000:120), where "objections" are understood in a broad sense. Related to this is the gold standard in the scientific method of reproducible results (Popper 1959). Finally, having dismantled the mythical notions of neutral, omniscient knowledge, Haraway (1988), Harding (1995) and others characterize true and responsible objectivity as necessarily partial, embodied, and socially situated. Context
In Chapter 1, I argue that actionability of SES knowledge requires bundling and dissemination of context, because as other research has shown, context is essential to evaluating the bounds of knowledge, applying knowledge to new domains or problems, and reworking knowledge without distortion for specific purposes. Context in this sense is defined broadly and includes the broader institutional, social, and ecological characteristics of the study system. Equally important to note are the genesis of the research including the institutional setting, theoretical debates and antecedents. Sound interpretation of results requires recording the conditions in which data were collected including the transformations of those data for digitization, numerical and statistical abstractions, assumptions made, and standards of interpretation. Project Dynamics in CBNRM
Reproducibility is rarely an option in complex adaptive systems, of which CBNRM are a classic example, due to the many-to-many relationships between cause and effect (Bennett and McGinnis 2008). As Gould (1989) famously pointed out, if we were to 'rewind the tape of life' , an entirely different biota might emerge. The same can be said of conservation projects. Equally problematic for reproduction, ethnography as a method is inherently non-reproducible because knowledge emerges from the interactions of the researcher and the subjects. As a participant observer whose vantage point comes from an engagement with the very process being investigated, I find myself in the curious position of being on both sides of the research question, as both author and subject. I am aware of the boundaries this double-position places upon the interpretation of findings, and to ensure validity I triangulate my conclusions with multiple types and sources of data (Flick 2002). This usually means both drawing upon analyses of multiple texts, recorded observations, and interviews. As the standards of good research call for, I am willing to share field notes, documents and other sources I drew upon in conducting this study so
126
that parts of the analysis and interpretation could be reproduced. I did not however go as far as archiving my data with an online repository such as Dataverse (IQSS 2012), in part due to privacy issues as well as the substantial amount of work involved in compiling, organizing, and documenting raw data. However data collection can never be replicated because both the system and the researcher are no longer the same.
In these terms, my analysis of the evolution of the CONASA CBNRM project is certainly not reproducible, at least not in its exact form. This may be less of a problem than may at first appear because non-reproducibility in the traditional sense is a well-known characteristic of interpretative research, and interpretative research doesn't aspire to inference in the same way as reductionist science does. I invoke this alternative form of generalization when stating in the introduction, While many of the lessons learned may be specific to this particular project and its historical context, the approach and broader framework for understanding project dynamics are highly transferable (Chapter 3). In other words, while the specific findings from this study may not apply to other conservation projects, even those with similar institutional configurations, the 'results' that can and should be reproduced are the questions and methods used, much as I reproduced the questions and methods from previous works.
In terms of maximizing opportunities for objection, my study of CONASA went through a peer review process with anonymous reviewers making numerous objections that were eventually incorporated in the current version. An earlier draft of the paper was also reviewed by two former staff members of the project, who raised issues and clarified points that were ambiguous, incomplete, or open to alterative interpretations. A far more rigorous approach would have been to distribute the text to all actors involved in the project, including government and community members, and hold a workshop to discuss the points made in the paper (e.g., Mosse 2005). I would have welcomed such an opportunity but did not have the resources to organize one myself. My paper also fails to meet Latour's standard of speediness in re-presenting results back to the subjects; these are standards I aspire to for future work.
In terms of partiality, embodiment, and accountability, I tried in Chapter 3 to be explicit and conservative in making claims and inferences from my analysis. I also stated up front in the introduction what the paper is not, in particular it is not an evaluation of the project nor a paper about the effects of CBNRM on communities, an arguably more important question but one that would require me to ventriloquize local voices that I have mostly heard only under highly structured settings. While my vantage point comes from multiple scales and institutional bases, it has primarily been from within or closely attached to project structures. Despite such caveats, two of the anonymous reviewers curiously enough urged me to make more specific assertions and broader conclusions about lessons learned and implications of the work, rather than leaving it at merely emphasizing the importance of considering project dynamics in understanding CBNRM outcomes. I take this as a case of some readers expecting science papers to conform to certain positivistic standards, and experiencing disappointment or cognitive dissonance at anything less than the god-trick of seeing everything from nowhere (Haraway 1988:581).
Modeling Space-Use from Decontextualized Data
The movement model presented in Part II is highly quantitative yet shares many of the interpretative and epistemological properties as the research in Part I. The foundational construct
127
upon which the T-LoCoH algorithm is based is the concept of a home range. The home range is a canonical concept in ecology (Burt 1943), and the basis for a broad body of work on space use the goal of which has largely been the development of ever-better home range methods (Laver and Kelly 2008). This body of work may be likened to a 40 year quest for the Holy Grail, and yet home ranges, in all their variants and colors, don't exist in any real sense—you will never see a home range boundary painted on the ground. Rather, home range is an abstraction, an analytical construction employed to help answer questions about how animals use space.
Despite their essence as a social construction, subjectivity in defining and constructing home ranges has often been seen as a weakness. Marzluff et al. (2004:1413) for example write,
We prefer an objective definition because this begins to standardize the determination of space use. Subjective definitions of space use are inconsistent and arbitrary; they have plagued studies of resource selection for decades.
Nearly all home range methods have at least one parameter that affects the shape and
size, however increasingly techniques that remove subjectivity are seen as preferable:
Once the maximizing function (Eq. (1)) is accepted, the researcher no longer has control of the outcome. This strength ensures repeatability and provides for individual variation. (Vander Wal and Rodgers 2012)
Thus it would seem that not only social scientists have physics envy. My presentation of
T-LoCoH takes an alternative approach in emphasizing there is no single 'best' home range method and researchers should rather use the method that sheds the most light on the question and system of interest. Accordingly T-LoCoH has been developed to incorporate flexibility and user knowledge, with parameter selection driven not by optimization routines but by theory based principles. The lack of a "one click" option for parameter estimation may be seen as a drawback for some users and reviewers, however I believe better results will always be produced from a user's knowledge and informed judgment relative to a specific question and system than a canned routine to set parameter values based on optimization of an abstract quantity. T-LoCoH can also construct contours that reflect not only density of space use, as with classic density utilizations, but other properties of space use such as movement mode, time use patterns, and metrics derived from environmental variables. Indeed many of the insights provided by T-LoCoH are visualizations of pattern in multiple dimensions (e.g., Figure 19 and Figure 39).
Similar to the conservation project in Part I, the springbok and elephant data analyzed in Part II are from complex adaptive systems and not reproducible in themselves. And also similar to Part I, non-reproducibility of the data is not as big of a deal as may seem because what is being presented as generalizable is not the result of the analysis but the method itself. To enable reproducibility of the results and validation of the method, the T-LoCoH algorithm is available as an open-source R-package (R Development Core Team 2012). Sharing source code has been increasingly been called for as the best and perhaps only way to reproduce computational analyses (Ince et al. 2012). As an added bonus, open source software platforms such as R enable computer based algorithms like T-LoCoH to be accessible and understandable, thus used and improved by other scientists who become its allies (Latour 1988).
128
A challenge noted previously for extending quantitative analyses to new domains and questions is the obliteration of context through multiple processes of transformation. Abstraction and digitization of data is unavoidable in software, and indeed it is these processes that enable quantitative methods to do the amazing things they do. Remedies for this challenge include creating and bundling meta-data with the data themselves (Schuurman 2008). In T-LoCoH, I have tried to bundle descriptions of the outputs using meta-data fields built-in to various data structures, such as hullsets and hull metrics. T-LoCoH also places by default a caption on most figures that describes how the figure was produced. These annotations are elaborated in the package's help system and users guide. Future plans call for using documentation tools like Sweave that bundle figures and code together, and fuller explanation of the algorithm and outputs using dynamically generated HTML files.
Conclusion
As complex adaptive systems, coupled SES are challenging to understand and manage for the combined welfare of humans and non-humans, present and future. Yet we have little choice but to try, for nearly all life as we know it is embedded within people-nature systems. Viewing these systems from multiple perspectives and fields can improve understanding both the constituent parts as well as emergent properties and complex behavior. Bridging diverse scales, disciplines, methods, and subject positions is certainly possible, but can not be taken as a given. Through careful attention to the epistemological properties of knowledge, including those that enable translation of knowledge into action, the cumulative body of science on SES may itself exhibit emergent properties and generate understandings at new levels.
References
Bennett D, McGinnis D (2008) Coupled and complex: Human-environment interaction in the Greater Yellowstone Ecosystem, USA. Geoforum 39 (2):833-845
Burt WH (1943) Territoriality and home range concepts as applied to mammals. Journal of Mammalogy 24 (3):346–352
Flick U (2002) An Introduction to Qualitative Research (2nd Edition). Sage, London Gould S (1989) Wonderful Life: The Burgess Shale and the Nature of History. vol bb. W.W.
Norton and Company, New York Haraway D (1988) Situated Knowledges: The Science Question in Feminism and the Privilege of
Partial Perspective. Feminist Studies 14 (3):575-599 Harding S (1995) "Strong Objectivity": A Response to the New Objectivity Question. Synthese
104 (3):331-349 Ince DC, Hatton L, Graham-Cumming J (2012) The case for open computer programs. Nature
482 (7386):485-488 IQSS (2012) The Dataverse Network Project. Institute for Quantitative Social Science, Harvard
University, http://thedata.org <accessed on 12/01/2012> Latour B (1988) Science in Action: How to Follow Scientists and Engineers Through Society.
Harvard University Press, Cambridge, MA. Latour B (2000) When things strike back: a possible contribution of 'science studies' to the social
sciences. British Journal of Sociology 51 (1):107-123
129
Laver PN, Kelly MJ (2008) A Critical Review of Home Range Studies. Journal of Wildlife Management 72 (1):290-298
Marzluff JM, Millspaugh JJ, Hurvitz P, Handcock MS (2004) Relating Resources to a Probabilistic Measure of Space Use: Forest Fragments and Steller's Jays. Ecology 85 (5):1411-1427
Mosse D (2005) Cultivating Development: An Ethnography of Aid Policy and Practice. Pluto Press, London
Popper KR (1959) The logic of scientific discovery. Hutchinson, London R Development Core Team (2012) R: A language and environment for statistical computing. R
Foundation for Statistical Computing, Vienna, Austria Schuurman N (2008) Database Ethnographies Using Social Science Methodologies to Enhance
Data Analysis and Interpretation. Geography Compass 2 (5):1529-1548 Vander Wal E, Rodgers AR (2012) An individual-based quantitative approach for delineating
core areas of animal space use. Ecological Modelling 224 (1):48-53
Related Documents