QlikView BI Patterns Introduction Each page in this document describes a BI Pattern that can be met with QlikView to solve business and technical needs. Each page is broken into a diagram, a description of the pattern and a description of the use of this pattern. Most, but not all, of these patterns have publicly available QlikView demo applications that can serve as a template or conceptual example. New patterns will be added to this document over time.

Welcome message from author
This document is posted to help you gain knowledge. Please leave a comment to let me know what you think about it! Share it to your friends and learn new things together.
Transcript
QlikView BI Patterns
Introduction
Each page in this document describes a BI Pattern that can be met with QlikView to solve business and technical needs. Each page is broken into a diagram, a description of the pattern and a description of the use of this pattern.
Most, but not all, of these patterns have publicly available QlikView demo applications that can serve as a template or conceptual example. New patterns will be added to this document over time.
I
Pattern Description:
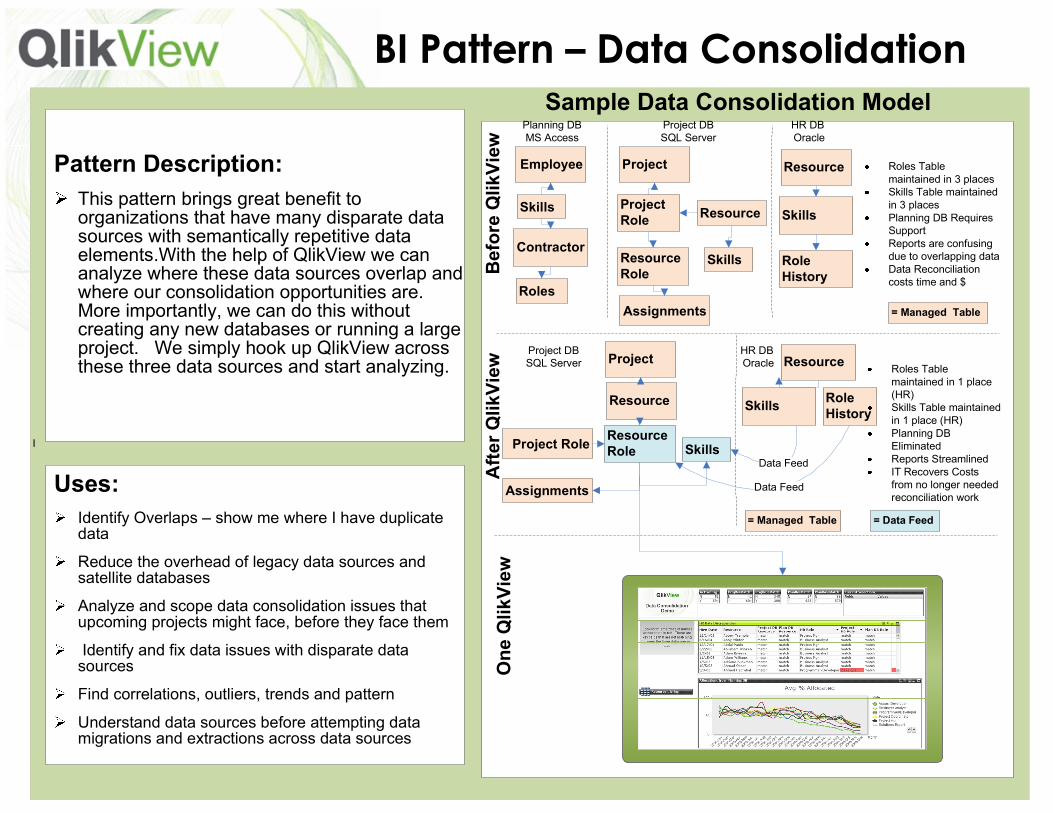
This pattern brings great benefit to organizations that have many disparate data sources with semantically repetitive data elements.With the help of QlikView we can analyze where these data sources overlap and where our consolidation opportunities are. More importantly, we can do this without creating any new databases or running a large project. We simply hook up QlikView across these three data sources and start analyzing.
BI Pattern – Data Consolidation
Uses:
Identify Overlaps – show me where I have duplicate data
Reduce the overhead of legacy data sources and satellite databases
Analyze and scope data consolidation issues that upcoming projects might face, before they face them
Identify and fix data issues with disparate data sources
Find correlations, outliers, trends and pattern
Understand data sources before attempting data migrations and extractions across data sources
Employee
Sample Data Consolidation Model
Before QlikView
After QlikView
One QlikView
Skills
Roles
Contractor
Project
Skills
ResourceProject Role
Resource Role
Assignments
Planning DB MS Access
Project DB SQL Server
Resource
Skills
Role History
HR DBOracle
Roles Table maintained in 3 placesSkills Table maintained in 3 placesPlanning DB Requires SupportReports are confusing due to overlapping dataData Reconciliation costs time and $
= Managed Table
Project
Skills
Assignments
Resource
Resource Role
Project Role
Project DB SQL Server Resource
SkillsRole History
Data Feed
Data Feed
Roles Table maintained in 1 place (HR)Skills Table maintained in 1 place (HR)Planning DB EliminatedReports StreamlinedIT Recovers Costs from no longer needed reconciliation work
HR DBOracle
= Managed Table = Data Feed
Pattern Description:
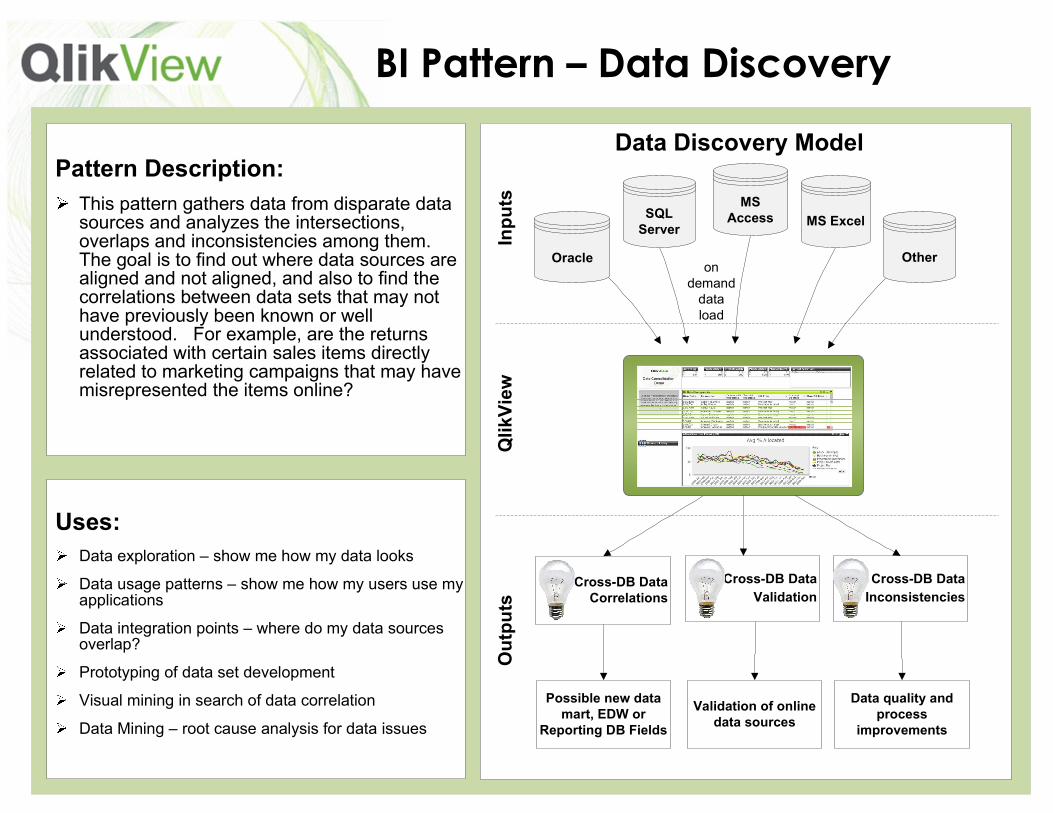
This pattern gathers data from disparate data sources and analyzes the intersections, overlaps and inconsistencies among them. The goal is to find out where data sources are aligned and not aligned, and also to find the correlations between data sets that may not have previously been known or well understood. For example, are the returns associated with certain sales items directly related to marketing campaigns that may have misrepresented the items online?
BI Pattern – Data Discovery
Uses:
Data exploration – show me how my data looks
Data usage patterns – show me how my users use my applications
Data integration points – where do my data sources overlap?
Prototyping of data set development
Visual mining in search of data correlation
Data Mining – root cause analysis for data issues
OtherOracle
SQL Server
MS Access MS Excel
Cross-DB Data Correlations
Data Discovery Model
on demand data load
Inputs
QlikView
Outputs
Cross-DB Data
Inconsistencies
Cross-DB Data
Validation
Possible new data mart, EDW or
Reporting DB Fields
Validation of online data sources
Data quality and process
improvements
Pattern Description:
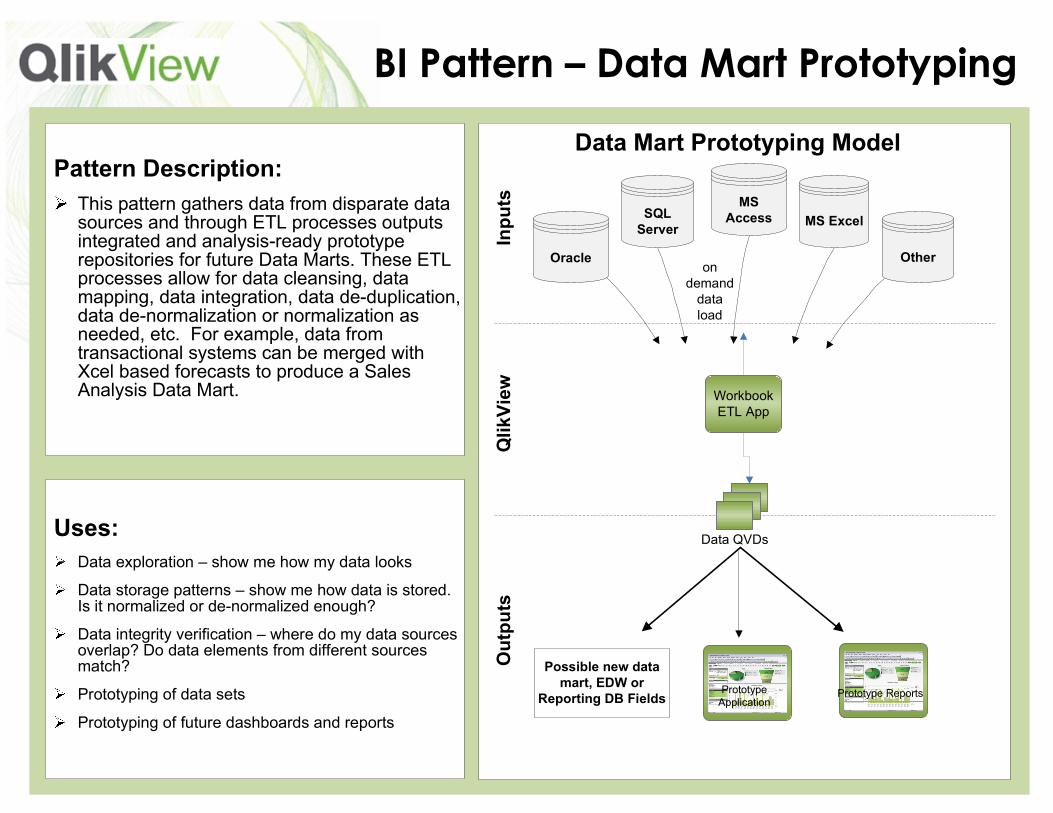
This pattern gathers data from disparate data sources and through ETL processes outputs integrated and analysis-ready prototype repositories for future Data Marts. These ETL processes allow for data cleansing, data mapping, data integration, data de-duplication, data de-normalization or normalization as needed, etc. For example, data from transactional systems can be merged with Xcel based forecasts to produce a Sales Analysis Data Mart.
BI Pattern – Data Mart Prototyping
Uses:
Data exploration – show me how my data looks
Data storage patterns – show me how data is stored. Is it normalized or de-normalized enough?
Data integrity verification – where do my data sources overlap? Do data elements from different sources match?
Prototyping of data sets
Prototyping of future dashboards and reports
OtherOracle
SQL Server
MS Access MS Excel
Data Mart Prototyping Model
on demand data load
Inputs
QlikView
Outputs
Possible new data mart, EDW or
Reporting DB Fields
WorkbookETL App
Prototype Application
Prototype Reports
Data QVDs
Pattern Description:
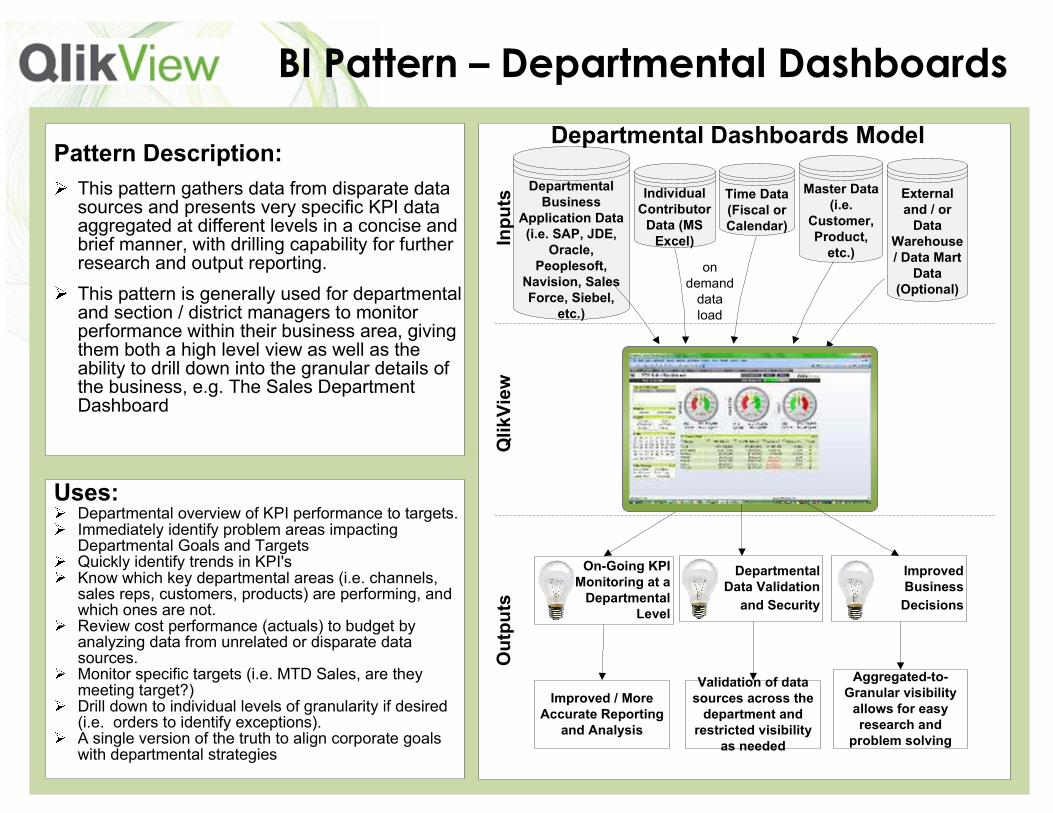
This pattern gathers data from disparate data sources and presents very specific KPI data aggregated at different levels in a concise and brief manner, with drilling capability for further research and output reporting.
This pattern is generally used for departmental and section / district managers to monitor performance within their business area, giving them both a high level view as well as the ability to drill down into the granular details of the business, e.g. The Sales Department Dashboard
BI Pattern – Departmental Dashboards
Uses:Departmental overview of KPI performance to targets. Immediately identify problem areas impacting Departmental Goals and TargetsQuickly identify trends in KPI's Know which key departmental areas (i.e. channels, sales reps, customers, products) are performing, and which ones are not. Review cost performance (actuals) to budget by analyzing data from unrelated or disparate data sources. Monitor specific targets (i.e. MTD Sales, are they meeting target?) Drill down to individual levels of granularity if desired (i.e. orders to identify exceptions). A single version of the truth to align corporate goals with departmental strategies
External and / or Data
Warehouse / Data Mart
Data (Optional)
Departmental Business
Application Data (i.e. SAP, JDE,
Oracle, Peoplesoft,
Navision, Sales Force, Siebel,
etc.)
Individual Contributor Data (MS Excel)
Time Data (Fiscal or Calendar)
Master Data (i.e.
Customer, Product, etc.)
On-Going KPI Monitoring at a Departmental
Level
Departmental Dashboards Model
on demand data load
Inputs
QlikView
Outputs
Improved Business
Decisions
DepartmentalData Validation
and Security
Improved / More Accurate Reporting
and Analysis
Validation of data sources across the department and restricted visibility
as needed
Aggregated-to-Granular visibility allows for easy research and
problem solving
Pattern Description:
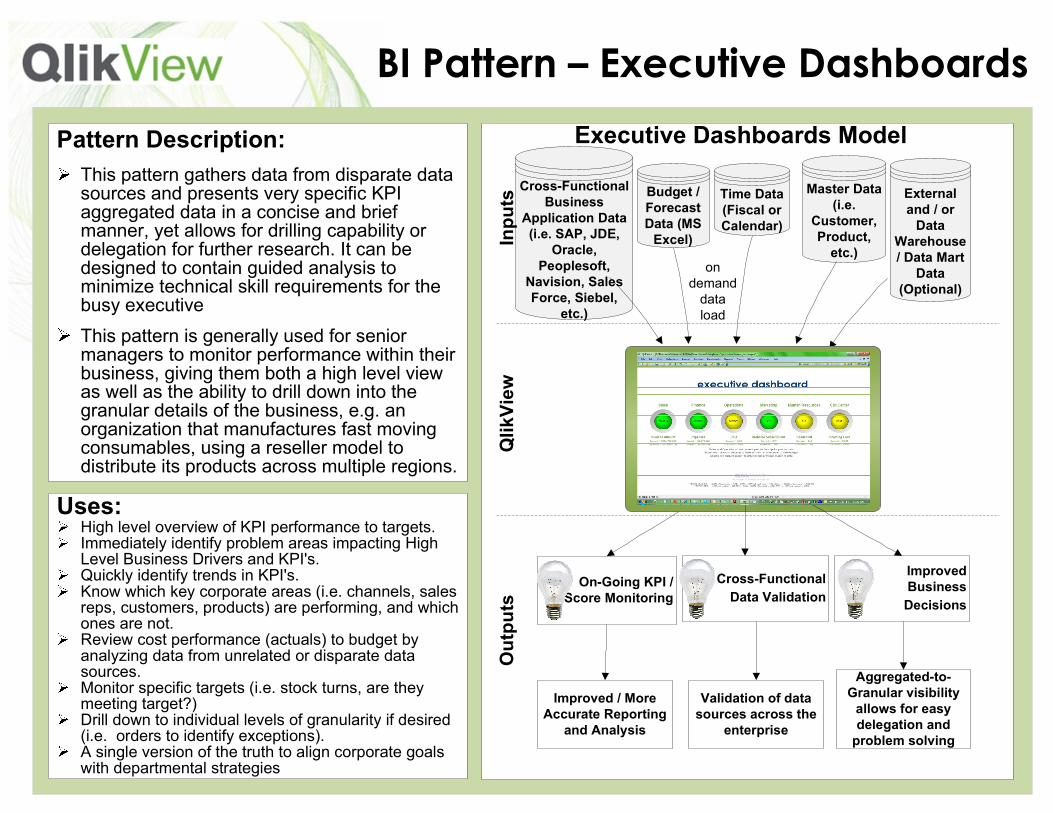
This pattern gathers data from disparate data sources and presents very specific KPI aggregated data in a concise and brief manner, yet allows for drilling capability or delegation for further research. It can be designed to contain guided analysis to minimize technical skill requirements for the busy executive
This pattern is generally used for senior managers to monitor performance within their business, giving them both a high level view as well as the ability to drill down into the granular details of the business, e.g. an organization that manufactures fast moving consumables, using a reseller model to distribute its products across multiple regions.
BI Pattern – Executive Dashboards
Uses:High level overview of KPI performance to targets. Immediately identify problem areas impacting High Level Business Drivers and KPI's. Quickly identify trends in KPI's. Know which key corporate areas (i.e. channels, sales reps, customers, products) are performing, and which ones are not. Review cost performance (actuals) to budget by analyzing data from unrelated or disparate data sources. Monitor specific targets (i.e. stock turns, are they meeting target?) Drill down to individual levels of granularity if desired (i.e. orders to identify exceptions). A single version of the truth to align corporate goals with departmental strategies
External and / or Data
Warehouse / Data Mart
Data (Optional)
Cross-Functional Business
Application Data (i.e. SAP, JDE,
Oracle, Peoplesoft,
Navision, Sales Force, Siebel,
etc.)
Budget / Forecast Data (MS Excel)
Time Data (Fiscal or Calendar)
Master Data (i.e.
Customer, Product, etc.)
On-Going KPI / Score Monitoring
Executive Dashboards Model
on demand data load
Inputs
QlikView
Outputs
Improved Business
Decisions
Cross-Functional
Data Validation
Improved / More Accurate Reporting
and Analysis
Validation of data sources across the
enterprise
Aggregated-to-Granular visibility allows for easy delegation and problem solving
Pattern Description:
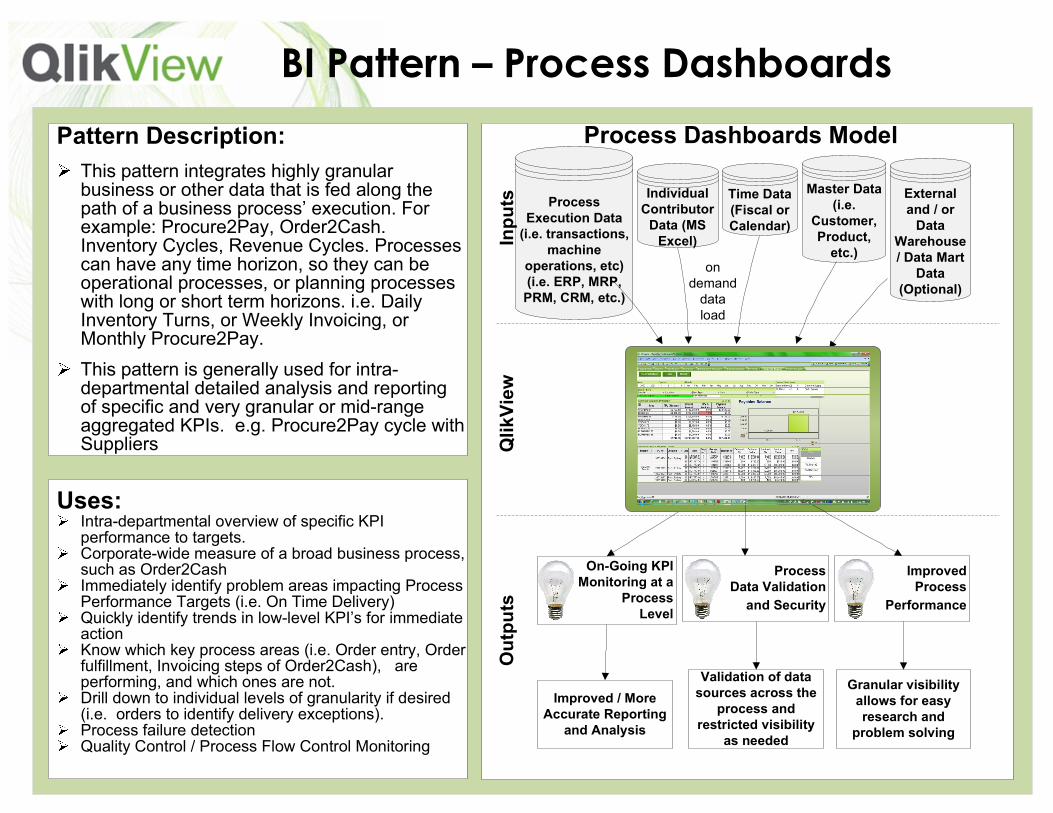
This pattern integrates highly granular business or other data that is fed along the path of a business process’ execution. For example: Procure2Pay, Order2Cash. Inventory Cycles, Revenue Cycles. Processes can have any time horizon, so they can be operational processes, or planning processes with long or short term horizons. i.e. Daily Inventory Turns, or Weekly Invoicing, or Monthly Procure2Pay.
This pattern is generally used for intra-departmental detailed analysis and reporting of specific and very granular or mid-range aggregated KPIs. e.g. Procure2Pay cycle with Suppliers
BI Pattern – Process Dashboards
Uses:Intra-departmental overview of specific KPI performance to targets.Corporate-wide measure of a broad business process, such as Order2Cash Immediately identify problem areas impacting Process Performance Targets (i.e. On Time Delivery)Quickly identify trends in low-level KPI’s for immediate action Know which key process areas (i.e. Order entry, Order fulfillment, Invoicing steps of Order2Cash), are performing, and which ones are not. Drill down to individual levels of granularity if desired (i.e. orders to identify delivery exceptions). Process failure detectionQuality Control / Process Flow Control Monitoring
External and / or Data
Warehouse / Data Mart
Data (Optional)
Process Execution Data (i.e. transactions,
machine operations, etc) (i.e. ERP, MRP, PRM, CRM, etc.)
Individual Contributor Data (MS Excel)
Time Data (Fiscal or Calendar)
Master Data (i.e.
Customer, Product, etc.)
On-Going KPI Monitoring at a
ProcessLevel
Process Dashboards Model
on demand data load
Inputs
QlikView
Outputs
Improved Process
Performance
ProcessData Validation
and Security
Improved / More Accurate Reporting
and Analysis
Validation of data sources across the
process and restricted visibility
as needed
Granular visibility allows for easy research and
problem solving
Pattern Description:
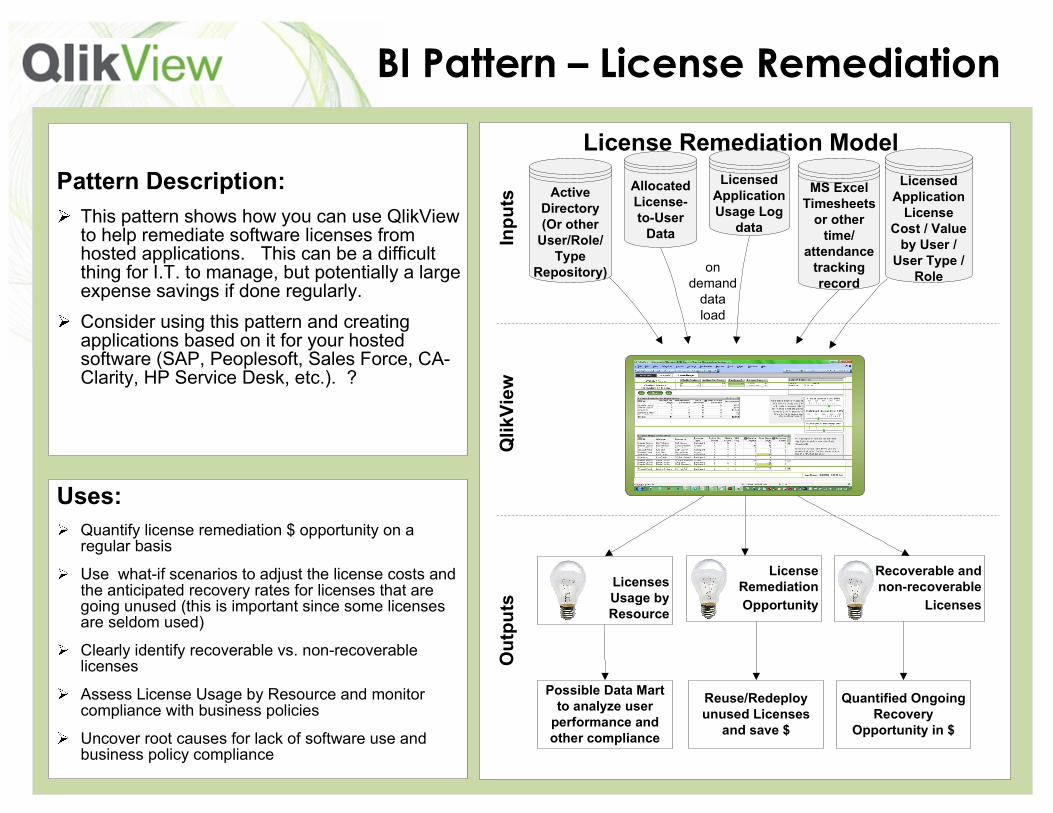
This pattern shows how you can use QlikView to help remediate software licenses from hosted applications. This can be a difficult thing for I.T. to manage, but potentially a large expense savings if done regularly.
Consider using this pattern and creating applications based on it for your hosted software (SAP, Peoplesoft, Sales Force, CA-Clarity, HP Service Desk, etc.). ?
BI Pattern – License Remediation
Uses:
Quantify license remediation $ opportunity on a regular basis
Use what-if scenarios to adjust the license costs and the anticipated recovery rates for licenses that are going unused (this is important since some licenses are seldom used)
Clearly identify recoverable vs. non-recoverable licenses
Assess License Usage by Resource and monitor compliance with business policies
Uncover root causes for lack of software use and business policy compliance
Licensed Application License
Cost / Value by User / User Type /
Role
Active Directory (Or other User/Role/Type
Repository)
AllocatedLicense-to-User Data
Licensed Application Usage Log
data
MS Excel Timesheets or other time/
attendance tracking record
Licenses Usage by Resource
License Remediation Model
on demand data load
Inputs
QlikView
Outputs
Recoverable and non-recoverable
Licenses
License Remediation
Opportunity
Possible Data Mart to analyze user performance and other compliance
Reuse/Redeploy unused Licenses
and save $
Quantified Ongoing Recovery
Opportunity in $
Pattern Description:
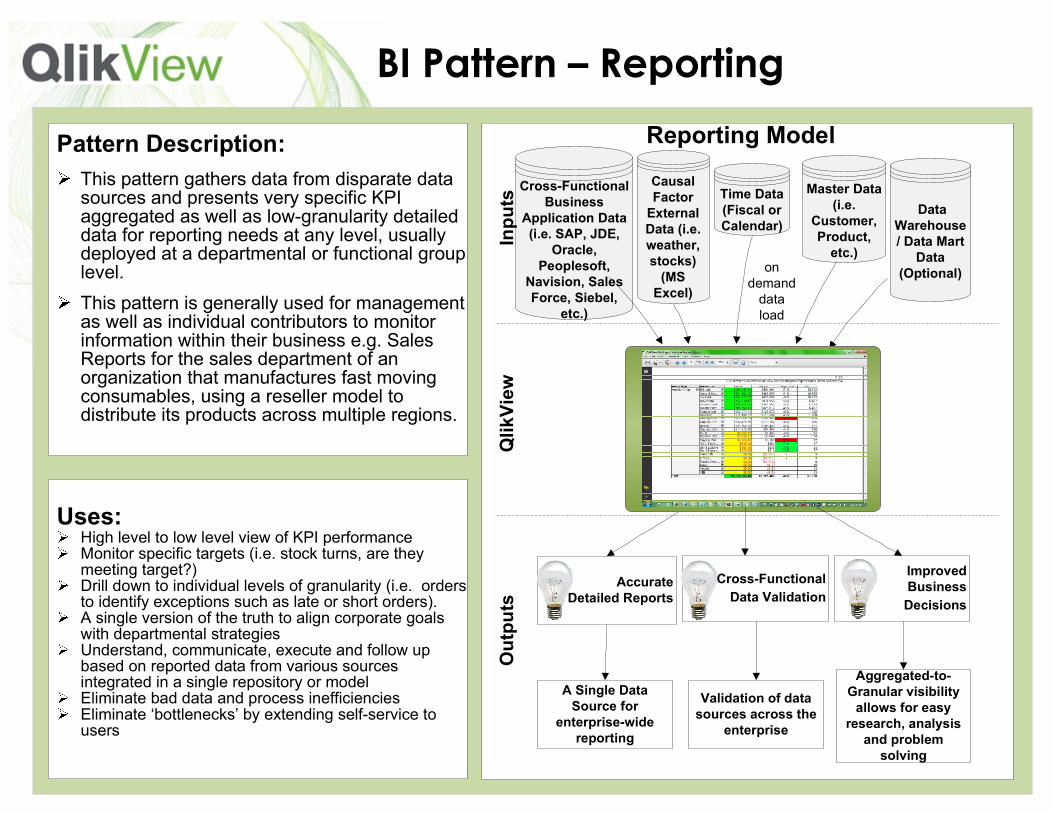
This pattern gathers data from disparate data sources and presents very specific KPI aggregated as well as low-granularity detailed data for reporting needs at any level, usually deployed at a departmental or functional group level.
This pattern is generally used for management as well as individual contributors to monitor information within their business e.g. Sales Reports for the sales department of an organization that manufactures fast moving consumables, using a reseller model to distribute its products across multiple regions.
BI Pattern – Reporting
Uses:High level to low level view of KPI performance Monitor specific targets (i.e. stock turns, are they meeting target?) Drill down to individual levels of granularity (i.e. orders to identify exceptions such as late or short orders). A single version of the truth to align corporate goals with departmental strategiesUnderstand, communicate, execute and follow up based on reported data from various sources integrated in a single repository or modelEliminate bad data and process inefficienciesEliminate ‘bottlenecks’ by extending self-service to users
Data Warehouse / Data Mart
Data (Optional)
Cross-Functional Business
Application Data (i.e. SAP, JDE,
Oracle, Peoplesoft,
Navision, Sales Force, Siebel,
etc.)
Causal Factor External Data (i.e. weather, stocks) (MS Excel)
Time Data (Fiscal or Calendar)
Master Data (i.e.
Customer, Product, etc.)
Accurate Detailed Reports
Reporting Model
on demand data load
Inputs
QlikView
Outputs
Improved Business
Decisions
Cross-Functional
Data Validation
A Single Data Source for
enterprise-wide reporting
Validation of data sources across the
enterprise
Aggregated-to-Granular visibility allows for easy
research, analysis and problem solving
Related Documents