Workshop „Biogas-Plant-technology planning, Beijing, 22 nd – 24 th of November 2009 _________________________________________________________________________________________________ 1 / 77 VII Climate Change 1 Introduction Climate change has been considered a fact since a decade, after the proof of rising CO 2 levels, rising earth’s temperatures, smelting of glaciers, etc. The consequences can be observed in daily life, by events such as strong floods of rivers, stronger storms and snowfall, cloudbursts, but also drought, and desertification. The reasons of the climate change - natural or anthropogenic? - have been under discussion for a longer term. But there is no doubt, that mankind contributes to climate change by all activities which are connected with climate gas emissions: use of fossil resources as fuels with high emissions of carbon dioxide and other climate gases, especially in transportation and traffic; industrial production and application of substances, which are climate gases of extreme high warming potentials; agricultural activities such as animal farming and rice cultivation, with the deliberation of methane or nitrous oxides; methane emissions from landfills caused by ineffective waste management, etc. To control the situation, reduction measures or climate gases and other relevant actions, are urgently necessary on all levels. This is understood by the public and by policy makers. Climate related activities thus are high ranking on the political agenda. They are implemented into the political programs on UN level, in state groups and states, but also on communal levels as in climate initiatives of cities, or NGOs. Examples are the programs launched in the last 10 years such as the so-called Kyoto protocol, to reduce climate gas emissions, and bans of persistent chemical components; the shift of energy sources from fossil to renewable; or the program of CO 2 - emission trading. It is but obvious, that the efforts must be strengthened, to reduce the risks of a climate collapse. The lecture is intended to give a more detailed insight into the problem and the efforts to tackle it, so that the reader is able to follow up best climate strategies in practical cases. In the first part, fundamentals of climate and climate change are discussed, including facts on the climate system and its modeling, as well as the climate effects on sustainable development, and international policy approaches. In the second part, evaluation of climate and related effects of technology are discussed, and an overview of climate effects of industrial and agricultural processes are given, including technological, infrastructural, economic, and socially oriented activities to reduce climate gas emissions.

Welcome message from author
This document is posted to help you gain knowledge. Please leave a comment to let me know what you think about it! Share it to your friends and learn new things together.
Transcript
Workshop „Biogas-Plant-technology planning,
Beijing, 22nd – 24th of November 2009
_________________________________________________________________________________________________
1 / 77
VII Climate Change
1 Introduction
Climate change has been considered a fact since a decade, after the proof of rising CO2 levels, rising earth’s
temperatures, smelting of glaciers, etc. The consequences can be observed in daily life, by events such as
strong floods of rivers, stronger storms and snowfall, cloudbursts, but also drought, and desertification. The
reasons of the climate change - natural or anthropogenic? - have been under discussion for a longer term.
But there is no doubt, that mankind contributes to climate change by all activities which are connected with
climate gas emissions: use of fossil resources as fuels with high emissions of carbon dioxide and other climate
gases, especially in transportation and traffic; industrial production and application of substances, which are
climate gases of extreme high warming potentials; agricultural activities such as animal farming and rice
cultivation, with the deliberation of methane or nitrous oxides; methane emissions from landfills caused by
ineffective waste management, etc.
To control the situation, reduction measures or climate gases and other relevant actions, are urgently necessary
on all levels. This is understood by the public and by policy makers. Climate related activities thus are high
ranking on the political agenda. They are implemented into the political programs on UN level, in state groups
and states, but also on communal levels as in climate initiatives of cities, or NGOs. Examples are the programs
launched in the last 10 years such as the so-called Kyoto protocol, to reduce climate gas emissions, and bans of
persistent chemical components; the shift of energy sources from fossil to renewable; or the program of CO2-
emission trading. It is but obvious, that the efforts must be strengthened, to reduce the risks of a climate
collapse.
The lecture is intended to give a more detailed insight into the problem and the efforts to tackle it, so that the
reader is able to follow up best climate strategies in practical cases. In the first part, fundamentals of climate
and climate change are discussed, including facts on the climate system and its modeling, as well as the
climate effects on sustainable development, and international policy approaches. In the second part, evaluation
of climate and related effects of technology are discussed, and an overview of climate effects of industrial and
agricultural processes are given, including technological, infrastructural, economic, and socially oriented
activities to reduce climate gas emissions.
Workshop „Biogas-Plant-technology planning,
Beijing, 22nd – 24th of November 2009
_________________________________________________________________________________________________
2 / 77
1 Climate System
2.1 Climate System Components
2.2 Observed Climate Variability and Change
2.3 The Greenhouse Effect of the Atmosphere
2.4 Greenhouse Gases
2.5 The Carbon Cycle and Atmospheric Carbon Dioxide
2.6 Aerosols, their Direct and Indirect Effects
2.7 Radiative Forcing of Climate Change
2.8 Physical Climate Processes and Feedbacks
2.9 Atmospheric Chemistry and Climate
2.10 Climate Change and Vegetation
2 Climate Modelling
3.1 Model Basics and Structure
3.2 Model Evaluation (including Climate Variability and Change)
3.3 Climate Scenarios
3.4 Projections of Climate Change
3.5 Regional Climate Change Information
3 Consequences of Mean Global Warming
4.1 Shrinking of the Cryosphere
4.2 Changes in Sea Level
4.3 Changed Precipitation Distribution
4.4 Detection of Climate Change and Attribution of Causes
Workshop „Biogas-Plant-technology planning,
Beijing, 22nd – 24th of November 2009
_________________________________________________________________________________________________
3 / 77
4 Impacts and Adaptation to Climate Change
5.1 Methods and Tools
5.2 Developing and Applying Scenarios
5.3 Impact Examples for Different Sectors
5.4 Impact Examples for Different Areas
5.5 Observed Impacts
5.6 Vulnerability to Climate Change
5.7 Adaptation to Climate Change
5 Sustainable Development and Climate Change
5.1 Greenhouse Gas Emissions and Fluxes
6.2 Carbon Reservoirs
6.3 Barriers, Opportunities, and Market Potential of new Technologies and Practices
6.4 Costing Methodologies
6.5 Mitigation of Climate Change
6.6 Decision-making Frameworks
6.7 CDM
6.8 Sustainable Energy Paths
Workshop „Biogas-Plant-technology planning,
Beijing, 22nd – 24th of November 2009
_________________________________________________________________________________________________
4 / 77
6 International policy approaches
7.1 Policies, Measures, and Instruments
7.2 United Nations Framework Convention on Climate Change
7.3 From Rio to Kyoto
7.4 Climate Protection Goals in Europe and Germany
7.5 Sustainable Development Strategy of the European Union
7.6 The Sixth Environmental Action Programme
7.7 National Climate Protection Strategy
6.1 Emissions Trading
7 Evaluation of technologies after climate effects
7.1 The technological evaluation problem
The reduction of negative climate effects of every human activity - in private life as well as in business - is
urgently needed. There are a lot of measures possible as a result of technological, social, infrastructural,
economic, etc. oriented systems analysis, which is a precondition for the improvement of the given situation.
But having such options defined, another problem arises. We have to choose one of the options and only one,
for we need a definite solution. What option is to be selected? This is not a simple question, and the solution is
a complex task.
Let us look for some types of situation: Some of the solutions proposed by the systems analysis efforts may be
of such a character, that they direct into the right direction, especially if they have extra positive side effects
other than climate relevant. Such an example is the reduction of individual traffic in a city by use of public
traffic - if it is available. This would result in reduced emissions of carbon dioxide and other greenhouse as
well as toxic gases from the combustion of fuel. Traffic burdens such as noise are reduced, lower risks of
traffic accidents and health troubles are envisaged. Lower use of fossil fuels reduces its overall consumption.
This example is but not typical for the decision situation of reducing greenhouse gas burdens: In most cases, a
certain measure will result in different effects, which include both positive and negative consequences.
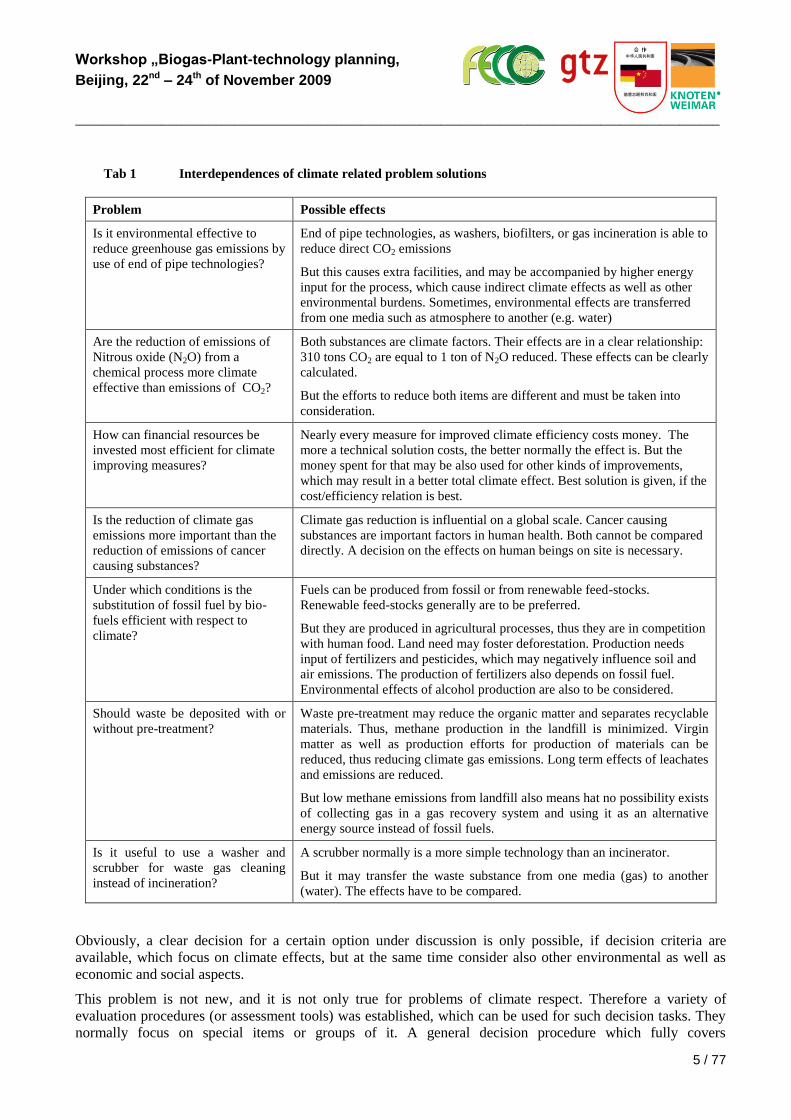
Some examples of problems related with climate effect related measures are given in table 1.
Workshop „Biogas-Plant-technology planning,
Beijing, 22nd – 24th of November 2009
_________________________________________________________________________________________________
5 / 77
Tab 1 Interdependences of climate related problem solutions
Problem Possible effects
Is it environmental effective to
reduce greenhouse gas emissions by
use of end of pipe technologies?
End of pipe technologies, as washers, biofilters, or gas incineration is able to
reduce direct CO2 emissions
But this causes extra facilities, and may be accompanied by higher energy
input for the process, which cause indirect climate effects as well as other
environmental burdens. Sometimes, environmental effects are transferred
from one media such as atmosphere to another (e.g. water)
Are the reduction of emissions of
Nitrous oxide (N2O) from a
chemical process more climate
effective than emissions of CO2?
Both substances are climate factors. Their effects are in a clear relationship:
310 tons CO2 are equal to 1 ton of N2O reduced. These effects can be clearly
calculated.
But the efforts to reduce both items are different and must be taken into
consideration.
How can financial resources be
invested most efficient for climate
improving measures?
Nearly every measure for improved climate efficiency costs money. The
more a technical solution costs, the better normally the effect is. But the
money spent for that may be also used for other kinds of improvements,
which may result in a better total climate effect. Best solution is given, if the
cost/efficiency relation is best.
Is the reduction of climate gas
emissions more important than the
reduction of emissions of cancer
causing substances?
Climate gas reduction is influential on a global scale. Cancer causing
substances are important factors in human health. Both cannot be compared
directly. A decision on the effects on human beings on site is necessary.
Under which conditions is the
substitution of fossil fuel by bio-
fuels efficient with respect to
climate?
Fuels can be produced from fossil or from renewable feed-stocks.
Renewable feed-stocks generally are to be preferred.
But they are produced in agricultural processes, thus they are in competition
with human food. Land need may foster deforestation. Production needs
input of fertilizers and pesticides, which may negatively influence soil and
air emissions. The production of fertilizers also depends on fossil fuel.
Environmental effects of alcohol production are also to be considered.
Should waste be deposited with or
without pre-treatment?
Waste pre-treatment may reduce the organic matter and separates recyclable
materials. Thus, methane production in the landfill is minimized. Virgin
matter as well as production efforts for production of materials can be
reduced, thus reducing climate gas emissions. Long term effects of leachates
and emissions are reduced.
But low methane emissions from landfill also means hat no possibility exists
of collecting gas in a gas recovery system and using it as an alternative
energy source instead of fossil fuels.
Is it useful to use a washer and
scrubber for waste gas cleaning
instead of incineration?
A scrubber normally is a more simple technology than an incinerator.
But it may transfer the waste substance from one media (gas) to another
(water). The effects have to be compared.
Obviously, a clear decision for a certain option under discussion is only possible, if decision criteria are
available, which focus on climate effects, but at the same time consider also other environmental as well as
economic and social aspects.
This problem is not new, and it is not only true for problems of climate respect. Therefore a variety of
evaluation procedures (or assessment tools) was established, which can be used for such decision tasks. They
normally focus on special items or groups of it. A general decision procedure which fully covers
Workshop „Biogas-Plant-technology planning,
Beijing, 22nd – 24th of November 2009
_________________________________________________________________________________________________
6 / 77
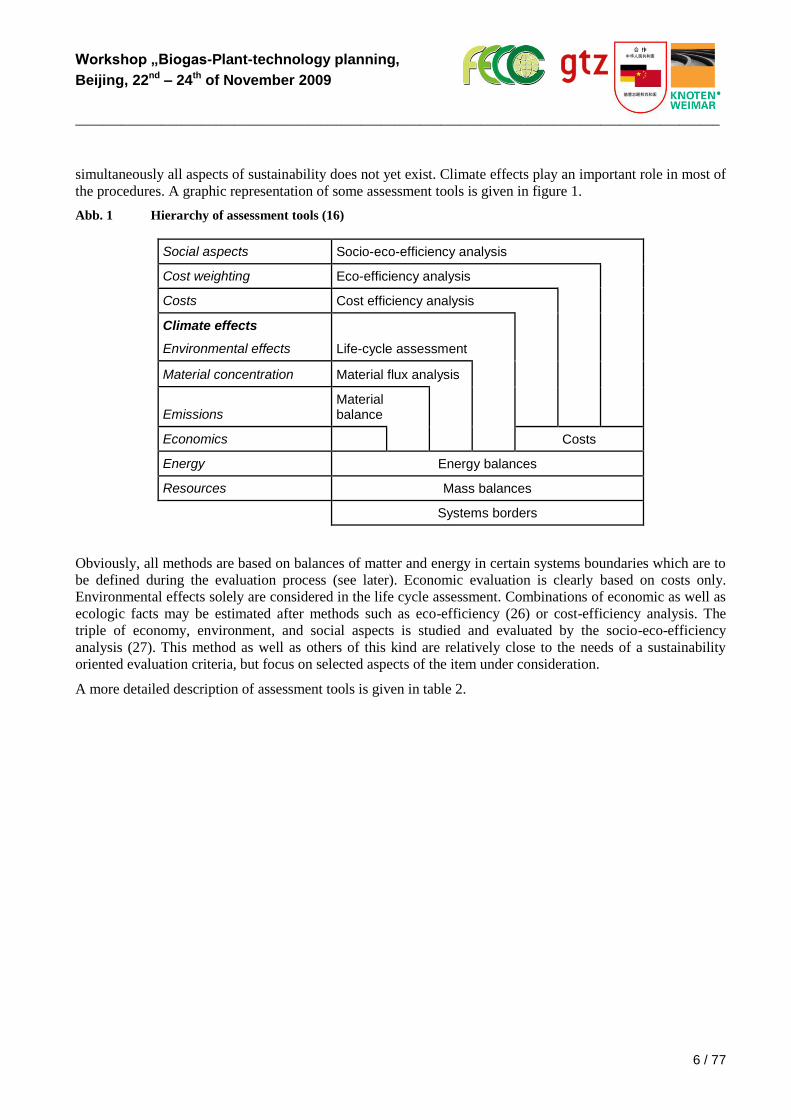
simultaneously all aspects of sustainability does not yet exist. Climate effects play an important role in most of
the procedures. A graphic representation of some assessment tools is given in figure 1.
Abb. 1 Hierarchy of assessment tools (16)
Social aspects Socio-eco-efficiency analysis
Cost weighting Eco-efficiency analysis
Costs Cost efficiency analysis
Climate effects
Environmental effects Life-cycle assessment
Material concentration Material flux analysis
Emissions Material balance
Economics Costs
Energy Energy balances
Resources Mass balances
Systems borders
Obviously, all methods are based on balances of matter and energy in certain systems boundaries which are to
be defined during the evaluation process (see later). Economic evaluation is clearly based on costs only.
Environmental effects solely are considered in the life cycle assessment. Combinations of economic as well as
ecologic facts may be estimated after methods such as eco-efficiency (26) or cost-efficiency analysis. The
triple of economy, environment, and social aspects is studied and evaluated by the socio-eco-efficiency
analysis (27). This method as well as others of this kind are relatively close to the needs of a sustainability
oriented evaluation criteria, but focus on selected aspects of the item under consideration.
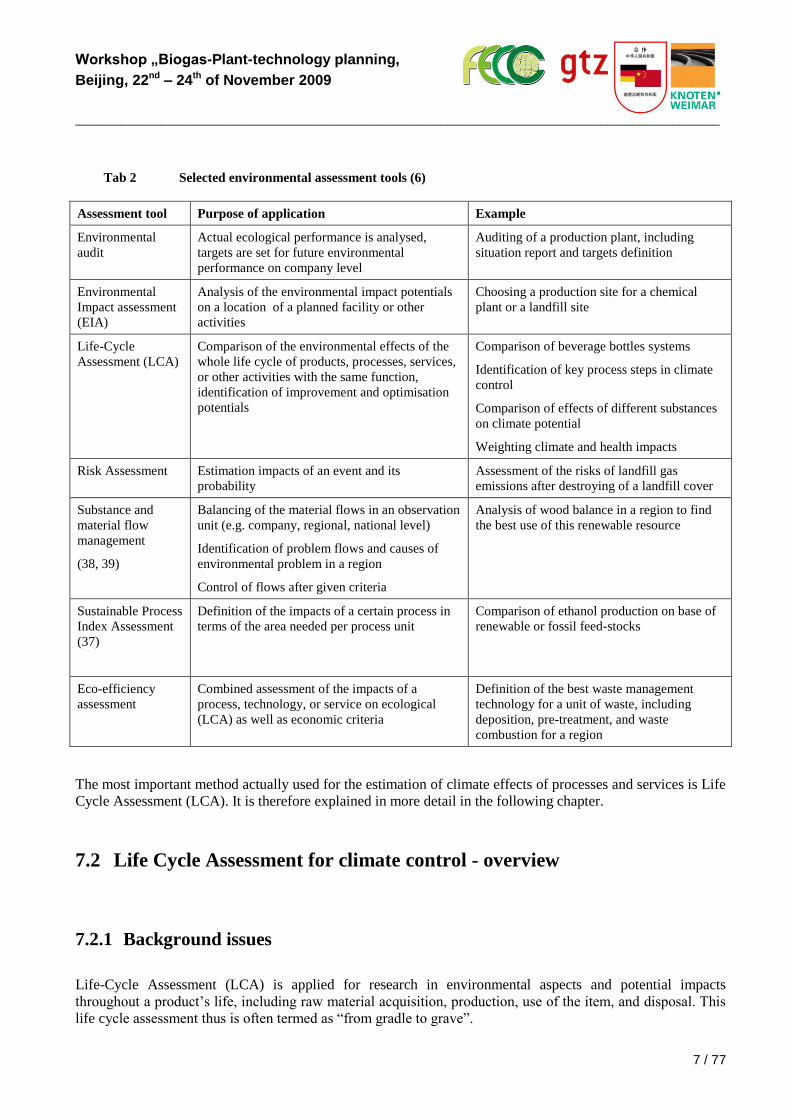
A more detailed description of assessment tools is given in table 2.
Workshop „Biogas-Plant-technology planning,
Beijing, 22nd – 24th of November 2009
_________________________________________________________________________________________________
7 / 77
Tab 2 Selected environmental assessment tools (6)
Assessment tool Purpose of application Example
Environmental
audit
Actual ecological performance is analysed,
targets are set for future environmental
performance on company level
Auditing of a production plant, including
situation report and targets definition
Environmental
Impact assessment
(EIA)
Analysis of the environmental impact potentials
on a location of a planned facility or other
activities
Choosing a production site for a chemical
plant or a landfill site
Life-Cycle
Assessment (LCA)
Comparison of the environmental effects of the
whole life cycle of products, processes, services,
or other activities with the same function,
identification of improvement and optimisation
potentials
Comparison of beverage bottles systems
Identification of key process steps in climate
control
Comparison of effects of different substances
on climate potential
Weighting climate and health impacts
Risk Assessment Estimation impacts of an event and its
probability
Assessment of the risks of landfill gas
emissions after destroying of a landfill cover
Substance and
material flow
management
(38, 39)
Balancing of the material flows in an observation
unit (e.g. company, regional, national level)
Identification of problem flows and causes of
environmental problem in a region
Control of flows after given criteria
Analysis of wood balance in a region to find
the best use of this renewable resource
Sustainable Process
Index Assessment
(37)
Definition of the impacts of a certain process in
terms of the area needed per process unit
Comparison of ethanol production on base of
renewable or fossil feed-stocks
Eco-efficiency
assessment
Combined assessment of the impacts of a
process, technology, or service on ecological
(LCA) as well as economic criteria
Definition of the best waste management
technology for a unit of waste, including
deposition, pre-treatment, and waste
combustion for a region
The most important method actually used for the estimation of climate effects of processes and services is Life
Cycle Assessment (LCA). It is therefore explained in more detail in the following chapter.
7.2 Life Cycle Assessment for climate control - overview
7.2.1 Background issues
Life-Cycle Assessment (LCA) is applied for research in environmental aspects and potential impacts
throughout a product’s life, including raw material acquisition, production, use of the item, and disposal. This
life cycle assessment thus is often termed as “from gradle to grave”.
Workshop „Biogas-Plant-technology planning,
Beijing, 22nd – 24th of November 2009
_________________________________________________________________________________________________
8 / 77
It serves
to compare environmental effects of different products
to identify environmental key issues, as climate effects
to improve and to optimize products and the production thereof.
The term “product” refers not only to a product from a process, but includes also material products and
services.
The definition as well as the whole procedure are standardised by ISO 14040 norm group (16). This norm
provides a framework and defines the key methodological needs, to make LCA’s comparable with each other,
independent on the institutions, or country, where the LCA analysis was performed.
There are several activities word wide to improve the methodology and support its application:
On United Nations Environmental programme (UNEP) level, a Life Cycle Initiative was established as a
response to the call from governments for a life cycle economy in the Malmö Declaration (in 2000). It
contributes to the 10-year framework of programmes to promote sustainability consumption and
production patterns, as requested at the World Summit on Sustainable Development (WSSD) in
Johannesburg (in 2002). This initiative develops and disseminates practical tools for evaluating the
opportunities, risks, and trade-offs, associated with products and services over their whole life cycle
(19).
EU commission launched a simplified method which condenses the basic methodology of ISO 14040
into an EXCEL calculation spreadsheet, which already contains basic dates for environmental impacts.
The aim is to enhance the application of LCA activities also in small enterprises for the environmental
and climate related improvement of their products, or services (17, 18).
The Society of Environmental Toxicology and Chemistry (SETAC) provides an international
infrastructure to support Life-Cycle Assessment groups in advancing the science, practice, and
application of LCA and related approaches worldwide. The organization serves as a focal point of a
broad-based forum for the identification, resolution, and communication of issues regarding LCAs, and
facilitates, coordinates, and provides guidance for the development and implementation of LCAs in
close cooperation with each other. Core tasks include planning and organizing LCA sessions and
conferences (such as the Annual Meetings in Europe and North America and the LCA Case Studies
Symposium), coordination of topical working groups, preparation and global integration of LCA
publications, and promotion of the UNEP/SETAC Life-Cycle Initiative (25).
Several countries, such as Denmark and the Netherlands also have more detailed guidelines prepared for
internal use on that base, including databases for LCA activities. In Germany, several calculation
programmes are available for a free of charge in LCA procedures (e.g. 40)
Workshop „Biogas-Plant-technology planning,
Beijing, 22nd – 24th of November 2009
_________________________________________________________________________________________________
9 / 77
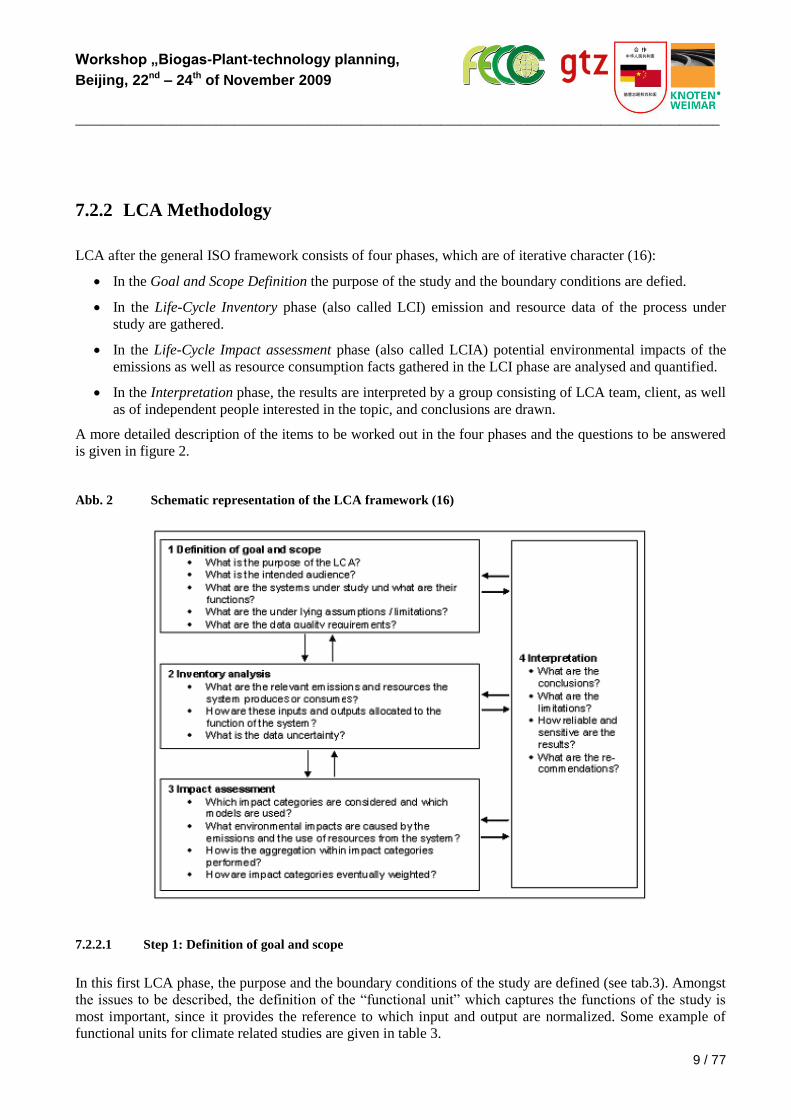
7.2.2 LCA Methodology
LCA after the general ISO framework consists of four phases, which are of iterative character (16):
In the Goal and Scope Definition the purpose of the study and the boundary conditions are defied.
In the Life-Cycle Inventory phase (also called LCI) emission and resource data of the process under
study are gathered.
In the Life-Cycle Impact assessment phase (also called LCIA) potential environmental impacts of the
emissions as well as resource consumption facts gathered in the LCI phase are analysed and quantified.
In the Interpretation phase, the results are interpreted by a group consisting of LCA team, client, as well
as of independent people interested in the topic, and conclusions are drawn.
A more detailed description of the items to be worked out in the four phases and the questions to be answered
is given in figure 2.
Abb. 2 Schematic representation of the LCA framework (16)
7.2.2.1 Step 1: Definition of goal and scope
In this first LCA phase, the purpose and the boundary conditions of the study are defined (see tab.3). Amongst
the issues to be described, the definition of the “functional unit” which captures the functions of the study is
most important, since it provides the reference to which input and output are normalized. Some example of
functional units for climate related studies are given in table 3.
Workshop „Biogas-Plant-technology planning,
Beijing, 22nd – 24th of November 2009
_________________________________________________________________________________________________
10 / 77
Tab 3 Examples of functional units for climate related studies
Example Typical functional unit
Comparison of
transportation systems
Transport of one ton of raw material over a distance of one
kilometre
Comparison of product
containers for chemical
substances
One container carrying one ton of material (i.e. not the ton of
material of the container itself is used as a functional unit,
since the materials are different in weight, which is irrelevant
for the transportation task)
Comparison of waste
treatment practices
Treatment of a certain amount of waste, e.g. one ton of
municipal solid waste
In principal, all processes from cradle to grave have to be included into such a study. But in practise, all such
processes can be eliminated from the scope of study, which are identical and do not influence the result.
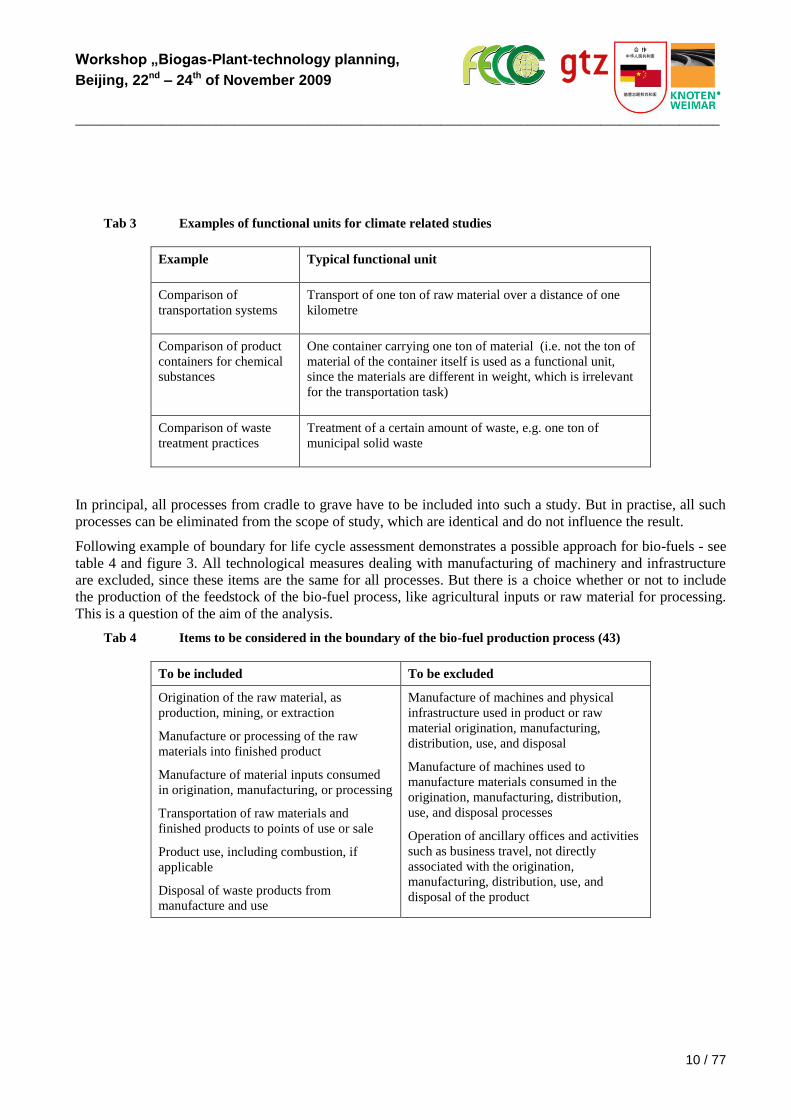
Following example of boundary for life cycle assessment demonstrates a possible approach for bio-fuels - see
table 4 and figure 3. All technological measures dealing with manufacturing of machinery and infrastructure
are excluded, since these items are the same for all processes. But there is a choice whether or not to include
the production of the feedstock of the bio-fuel process, like agricultural inputs or raw material for processing.
This is a question of the aim of the analysis.
Tab 4 Items to be considered in the boundary of the bio-fuel production process (43)
To be included To be excluded
Origination of the raw material, as
production, mining, or extraction
Manufacture or processing of the raw
materials into finished product
Manufacture of material inputs consumed
in origination, manufacturing, or processing
Transportation of raw materials and
finished products to points of use or sale
Product use, including combustion, if
applicable
Disposal of waste products from
manufacture and use
Manufacture of machines and physical
infrastructure used in product or raw
material origination, manufacturing,
distribution, use, and disposal
Manufacture of machines used to
manufacture materials consumed in the
origination, manufacturing, distribution,
use, and disposal processes
Operation of ancillary offices and activities
such as business travel, not directly
associated with the origination,
manufacturing, distribution, use, and
disposal of the product
Workshop „Biogas-Plant-technology planning,
Beijing, 22nd – 24th of November 2009
_________________________________________________________________________________________________
11 / 77
Abb. 3 Boundary for LCA of bio-fuel production (43)
7.2.2.2 Step 2: Life-cycle inventory analysis (LCI)
The inventory analysis involves data gathering and calculation procedures to quantify inputs and outputs, i.e.
resources and emissions. This is based on setting up flowcharts of the system under study, which contain all
details of the processes and the interconnections of process steps. A definition may be necessary at this stage
of the work, which mass and energy fluxes are important and which eventually can be eliminate to reduce the
complexity of the LCA. Indeed, a pre-condition for such a definition is knowledge about the process effects.
These may be a result a previous steps in a trial and error procedure, which is typical for LCA measures.
Data gathering can be a time consuming task. Potential data sources may be primary data from process studies,
or from literature, or expert judgement. Also public databases, such as GEMIS database (40), which offer
inventory data for a large number of processes, can be used, if - as is often the case - primary date cannot be
extracted.
The data have to be normalised to the functional unit.
7.2.2.3 Step 3: Life Cycle impact assessment (LCIA)
This step of the Life Cycle Assessment aims to evaluating the magnitude and the significance of the potential
environmental impacts of the system under study. It involves three mandatory elements: Most important is the
selection of i) impact categories, ii) indicators for these categories, and iii) models to quantify the contribution
of resources and emissions to it. This also may comprise a ranking of the indicators. In the classification step,
Workshop „Biogas-Plant-technology planning,
Beijing, 22nd – 24th of November 2009
_________________________________________________________________________________________________
12 / 77
the inventory data have to be assigned to the impact categories. Afterwards, in the characterization procedure,
the contribution of the inventory data has to be quantified to the chosen impacts.
In life cycle assessment practice, following impact categories with specific indicators were established (see
table 5). Table 5 also indicates some examples of substances, which primarily influence these impact
categories.
Besides impact categories after table 5, which are used in the LCA after ISO 14040, also other criteria are used
for environmental analysis, e.g. energy and material needs per unit of product, etc., which may also have an
indirect effect on climate (see chapter 9 to 12 for examples of industrial and other processes).
Tab 5 LCA impacts categories and indicators
Impact
category
Indicator Description and climate relevance
Global
warming
potential, GWP
CO2 Contribution to global warming by its heat
absorption capacity. Value depends on the
time horizon considered. Typically, 100
years time horizon is used. High climate
relevance.
CO2, CH4,
N2O, SF6,
HFCs, PFCs
Ozone
depletion
potential, ODP
HCFC 11 Contribution to the depletion of the
stratospheric ozone layer by persistent
chlorine and bromine hydrocarbons.
Global effects on biosphere by UV
radiation, effects on human health.
Climate neutral.
HCFCs
Photochemical
ozone
formation
potential, PCOP
(Summer smog
potential)
Ethylene
Contribution to the formation of oxidizing
substances, e.g. ozone, mostly by
reactions between NOx and NMVOCs
under the influence of UV-radiation in the
troposphere. Effects of human health and
ecosphere (e.g. damage of forests). No
direct climate effects.
NMVOCs,
CH4
Acidification
potential, AP
SO2 Contribution to the acidification of an
environment. Regional effects. No climate
relevance.
SO2, NOx,
NH4, HF,
HCl
Nutrition
potential, NP
PO43-
Contribution to the production of biomass.
Regional effects. No climate relevance.
NOx, NH3,
NH4-
Cancer
potential (short
term and long
term)
Unit risk
values
Contribution to cancer disease risks of
certain substances after a deposition with
the same substances. Short and long term
effects. No environmental effect, no
climate effect.
Cd, Hg, Cr IV
To define how much a process contributes to the impact categories, the effects of all material and energy
fluxes of the relevant process steps and their individual impact have to be considered. The total of the impact
category is given as the sum of the effects of all substances “k” in all process steps.
Workshop „Biogas-Plant-technology planning,
Beijing, 22nd – 24th of November 2009
_________________________________________________________________________________________________
13 / 77
In the case of the Global Warming Potential of a process, this is given in the following equation:
Formel (1) GWPtotal = ∑ (βk * GWP100; k)
GWPtotal: total global warming potential
GWP100, k: individual GWP of the substance k in the time horizon of 100
years
βk: mass of emission of substance k
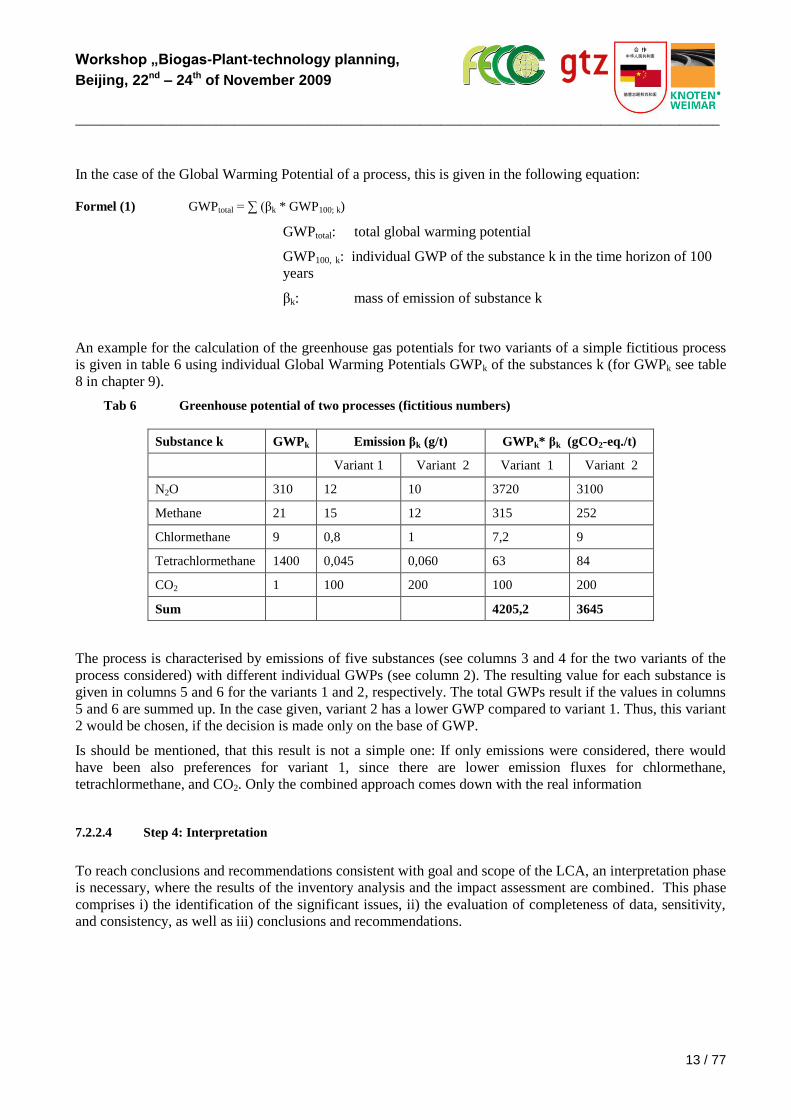
An example for the calculation of the greenhouse gas potentials for two variants of a simple fictitious process
is given in table 6 using individual Global Warming Potentials GWPk of the substances k (for GWPk see table
8 in chapter 9).
Tab 6 Greenhouse potential of two processes (fictitious numbers)
Substance k GWPk Emission βk (g/t) GWPk* βk (gCO2-eq./t)
Variant 1 Variant 2 Variant 1 Variant 2
N2O 310 12 10 3720 3100
Methane 21 15 12 315 252
Chlormethane 9 0,8 1 7,2 9
Tetrachlormethane 1400 0,045 0,060 63 84
CO2 1 100 200 100 200
Sum 4205,2 3645
The process is characterised by emissions of five substances (see columns 3 and 4 for the two variants of the
process considered) with different individual GWPs (see column 2). The resulting value for each substance is
given in columns 5 and 6 for the variants 1 and 2, respectively. The total GWPs result if the values in columns
5 and 6 are summed up. In the case given, variant 2 has a lower GWP compared to variant 1. Thus, this variant
2 would be chosen, if the decision is made only on the base of GWP.
Is should be mentioned, that this result is not a simple one: If only emissions were considered, there would
have been also preferences for variant 1, since there are lower emission fluxes for chlormethane,
tetrachlormethane, and CO2. Only the combined approach comes down with the real information
7.2.2.4 Step 4: Interpretation
To reach conclusions and recommendations consistent with goal and scope of the LCA, an interpretation phase
is necessary, where the results of the inventory analysis and the impact assessment are combined. This phase
comprises i) the identification of the significant issues, ii) the evaluation of completeness of data, sensitivity,
and consistency, as well as iii) conclusions and recommendations.
Workshop „Biogas-Plant-technology planning,
Beijing, 22nd – 24th of November 2009
_________________________________________________________________________________________________
14 / 77
7.2.3 LCA case study: Integrated waste management systems
Examples for LCAs are given in the next chapters for certain defined industrial, agricultural, energetic, etc.
processes. They focus on the climate effects of the process, mainly on the greenhouse gas potential, given as
“mass unit CO2 equivalents per mass unit of product”, as was given in chapter 8.2.2.3. As was explained, the
LCA methodology comprises also other environmental burdens, which have to be kept in mind for a
comprehensive decision. Therefore, the following example is given to elucidate the methodology of a full
LCA (all data after 49).
The example refers to waste management technologies, which are described in detail in chapter 10.
7.2.3.1 Definition of goal and scope
The goal of the study is to find out the best solution for the treatment of municipal solid waste of a region with
respect to the impact categories. This implies
Comparison of the impacts of different waste management options
Identification of key factors and critical paths
Assessment of the importance of political, economical and technical background conditions
Assessment of the ecological benefits through material flow specific waste management
Identification of most effective improvement strategies and measures
Systematic analysis of uncertainties
Determination of best values in (technical) compromise situations
The systems boundaries include the pre-treatment plants and the landfill. Waste collection is not considered.
Credits are given for recovered materials and energy resources. The consumption of materials and energy for
the operation of the pre-treatment plants and the landfills are taken into account.
Since the technologies can be set up anywhere in the world, the analysis in principle is independent from a
certain country. But for a concrete solution, German conditions are used.
Reference point of the calculation is the specific contribution to the total effects of waste management in
Germany, i.e. to which percentage the waste management system would contribute to the total national
impacts of every category if the total amount of residual waste was treated by the considered system.
7.2.3.2 Technology description and functional unit
For waste treatment, several technologies can be applied. Under EU conditions, a so-called pre-treatment is
necessary. In principle, all technologies after figure 4 can be applied.
Workshop „Biogas-Plant-technology planning,
Beijing, 22nd – 24th of November 2009
_________________________________________________________________________________________________
15 / 77
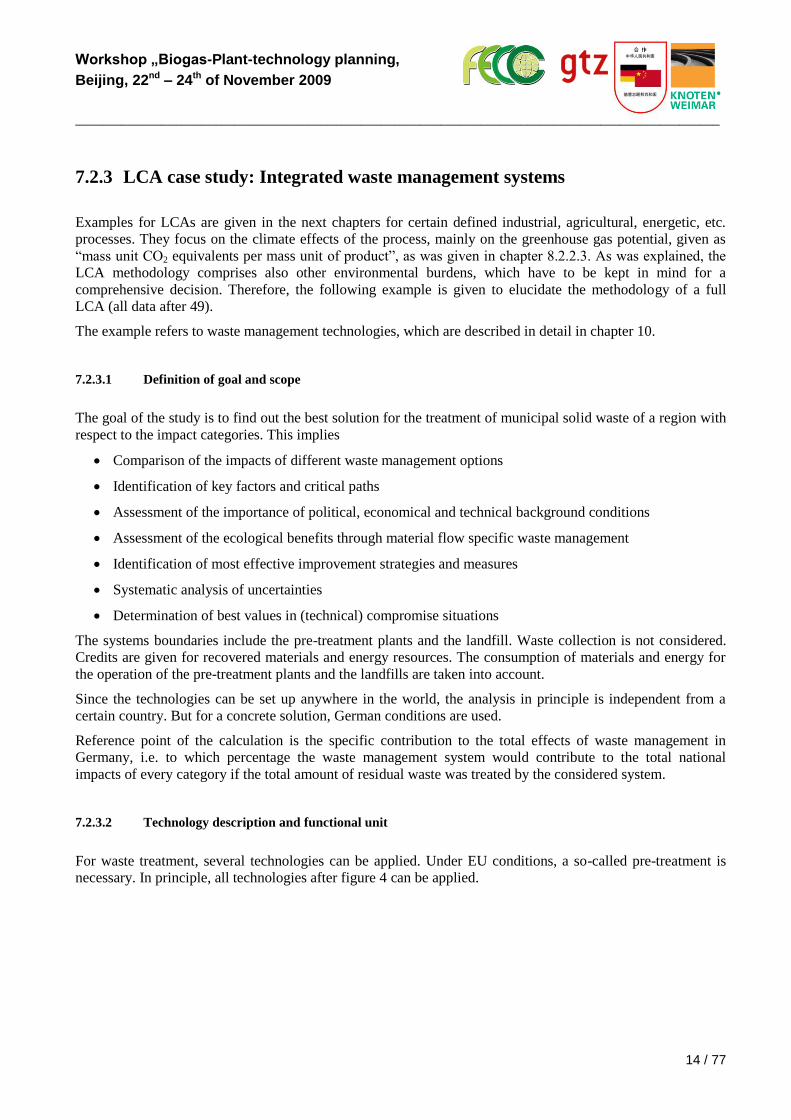
Abb. 4 Waste management pre-treatment technology options
In the study, following special waste management processes after table 7 are included.
Tab 7 Technologies included in the LCA
Technology Assumptions and specialities
Landfill without pre-
treatment
No decomposition of organic matter before the landfill.
Capping of landfill emission and energy production from
landfill gas recovery.
Mechanical biological
pre-treatment
High decomposition of organic matter by intensive rotting (8
weeks with forced aeration) and subsequent extensive rotting,
Recovery of the metal fraction. Collecting and cleaning of
waste gas of the pre-treatment by a bio-filter system.
Optimised mechanical
biological pre-treatment
Like b), additionally biogas production by anaerobic digestion
of a part of the organic fraction. Energetic use of a RDF-
fraction in a cement kiln. Material recovery of Fe-, non-ferrous
metals and of plastics. No waste gas incineration.
Combustion Conventional combustion plant with grate firing.
The principal function of all technologies is the treatment of waste. Therefore, as the functional unit, the
treatment of 1 ton of waste material is defined.
Workshop „Biogas-Plant-technology planning,
Beijing, 22nd – 24th of November 2009
_________________________________________________________________________________________________
16 / 77
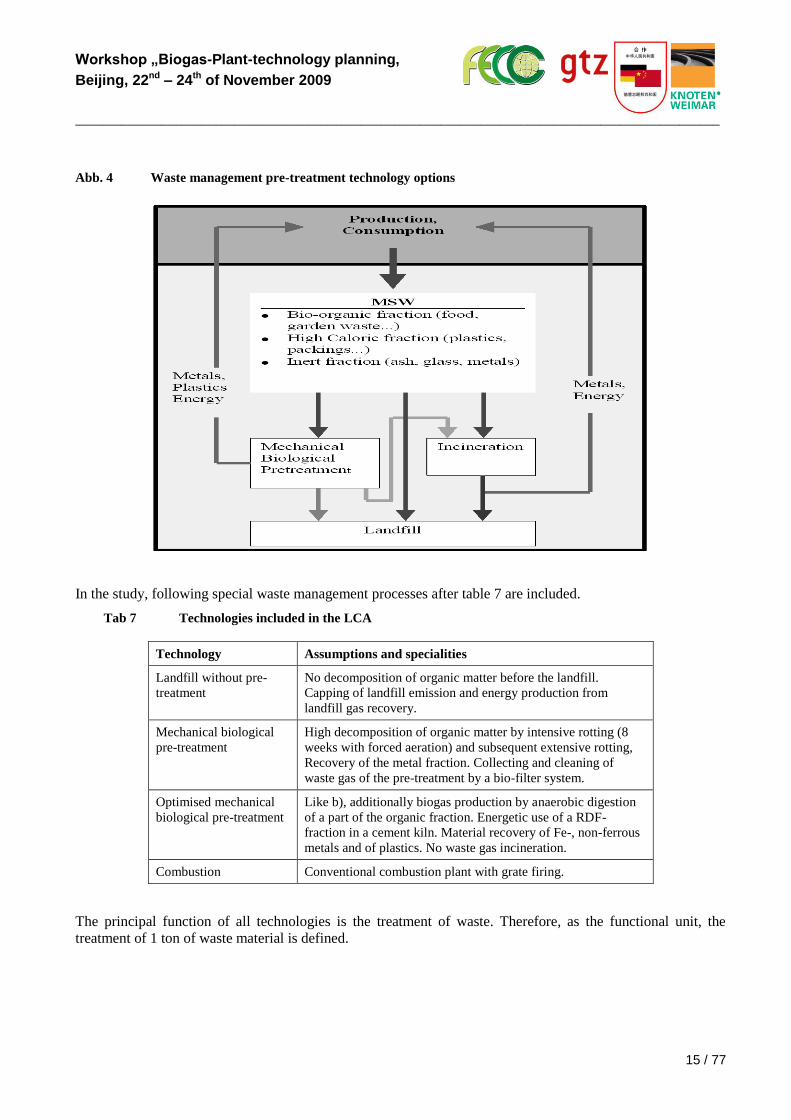
7.2.3.3 Impact assessment results
Impact assessment is performed using the impact categories after table 5. Figure 5 represents the results of the
assessment.
Abb. 5 National relevance and specific contributions
7.2.3.4 Interpretation and conclusions
Figure 5 indicates in terms of the impact categories the environmental benefits and disadvantages of the waste
management options. If a decision is to be made only on the base of one category, that in case of summer
smog potential as well as for climate impacts, a clear decision would be possible: combustion and optimized
MBP are preferable options. For climate impacts alone, the optimized MBP would be the best solution.
But it is also to be seen, that no one of the waste treatment options is best in every criteria considered. Direct
deposition results only in environmental burdens in every impact categories considered. The other options also
result in environmental benefits in the total results. The specific contributions mostly do not exceed the one
percent level.
The Global warming potential (GWP) is mainly caused by CO2 and CH4. The burdens result from the energy
consumption and the landfill emissions. However, these burdens can be equalised by credits through recovery
of waste fractions for recycling or power production, so that the optimised MBP and the combustion end up
with an climate benefit.
The ozone depletion (ODP) and the summer smog potentials (POCP) of the landfill and the MBP are caused
mainly by CFC (CFC-11, CFC-12) and by highly volatile chlorinated hydrocarbons, which are emitted during
pre-treatment and in the landfill. The specific contributions of the burdens exceed one percent. During
combustion, these substances are almost completely destroyed, so that no burdens result from them. On the
other hand, in the combustion facility, energy is recovered, which results in benefits. For the optimised MBP-
Option the benefits from material and energetic recovery prevail.
Workshop „Biogas-Plant-technology planning,
Beijing, 22nd – 24th of November 2009
_________________________________________________________________________________________________
17 / 77
The acidification potential (AP) is caused by SO2, NOx, and ammonia emissions, the nutrification potential
(NP) by ammonia and NOx emissions. Both burdens are comparatively low and are balanced through credits
for material and energetic recovery.
The Human Toxicity Potential is predominated by the air emissions of heavy metals such as chrome,
cadmium, and nickel. These metals are mobilised to higher a degree when the waste or waste fraction is
combusted, this option as well as the optimised MBP option (which includes the recovery of a RDF-fraction)
end up with higher burdens. In the landfill a certain percentage of the metals can be considered to be stored
over a very long period (several thousand years), depending on the buffer capacity and humification within in
the landfill. Therefore the landfill option has the lowest Human Toxicity Potential.
More examples of greenhouse gas effect evaluations for processes of various kinds are given in he following
chapters.
8 Climate effects of industrial processes
8.1 Background
Every industrial process results not only in the products wanted, but also in by-products, wastes and emissions.
Amongst the emissions, normally also greenhouse gases occur. Hence, every industrial process is climate
relevant, for greenhouse gases are emitted as a result of the technological processes taking place.
Which substance is emitted and in which amount it is emitted depends on the specific process and the
conditions of its application. Thus, the choice of the technology, the apparatus, the cleaning devise, etc. may
influence the climate effects of the production process. An optimisation of the process with reference to a
decision criteria reflecting the climate effects is thus a necessary precondition for the choice of the best
technologies (see chapter 8.1).
Some examples of industrial processes are given in the next chapter. The data used for description of the
processes are either derived from assumptions of chemical reactions or upon published empirical data (1).
The emissions considered here are by-products of the industrial process itself. Typically, in such processes,
raw materials are transformed from one state to another in the end product. This transformation is
accompanied by the release of emissions, such as carbon dioxide (CO2), methane (CH4), or nitrous oxide
(N2O). They are the reason of the greenhouse effect of the process.
It is to be stressed that these emissions are not directly a result of the energy consumption of the process, as for
heating or cooling for best process conditions, or electrical energy for melting processes (as in the case of
aluminum production), or stirrer power for stirring of the process fluids (as in the case of liquid-liquid
reactions or solvents), etc. The energy related emissions are considered independent of the process.
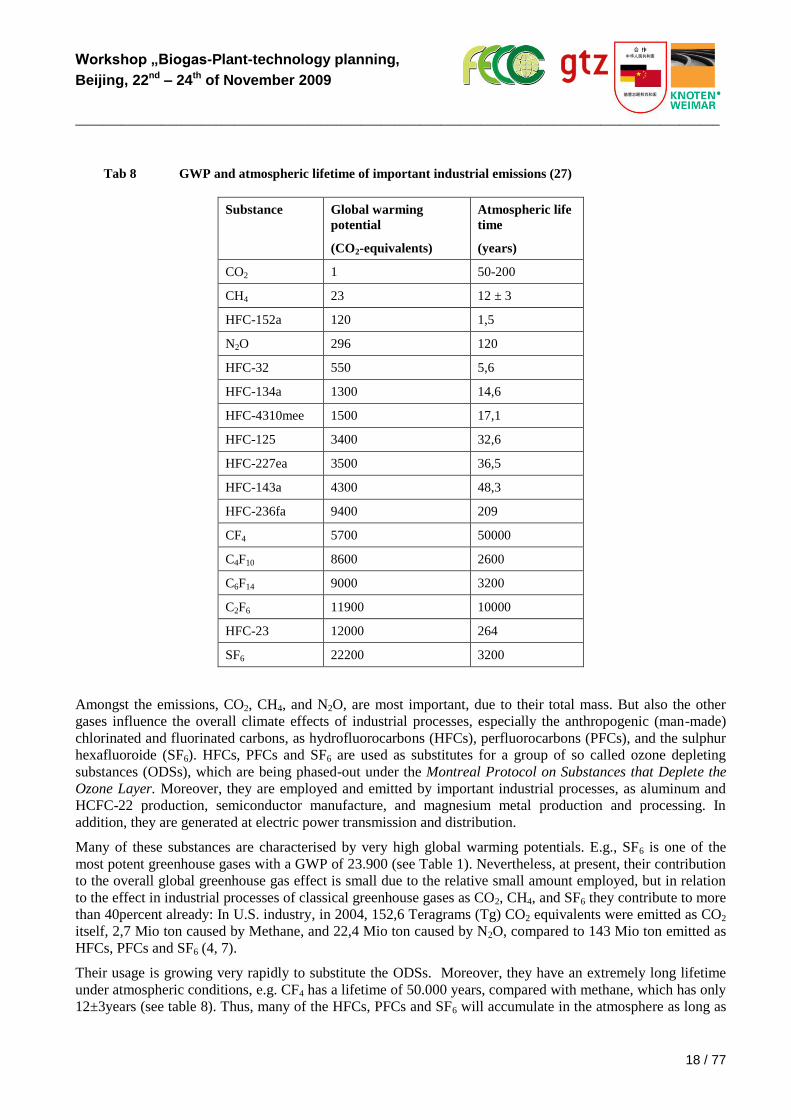
Typical emissions in industrial processes and their Global Warming Potential (GWP, 100 years period) as well
as their atmospheric life time are given in table 8. The table also indicates, that there are changes in the
numbers due to improved knowledge base, but obviously, the chances are not thus dramatic. Partly they are
because of the changes in the global warming potential of the reference substance CO2, which is set lower than
in previous studies.
Workshop „Biogas-Plant-technology planning,
Beijing, 22nd – 24th of November 2009
_________________________________________________________________________________________________
18 / 77
Tab 8 GWP and atmospheric lifetime of important industrial emissions (27)
Substance Global warming
potential
(CO2-equivalents)
Atmospheric life
time
(years)
CO2 1 50-200
CH4 23 12 ± 3
HFC-152a 120 1,5
N2O 296 120
HFC-32 550 5,6
HFC-134a 1300 14,6
HFC-4310mee 1500 17,1
HFC-125 3400 32,6
HFC-227ea 3500 36,5
HFC-143a 4300 48,3
HFC-236fa 9400 209
CF4 5700 50000
C4F10 8600 2600
C6F14 9000 3200
C2F6 11900 10000
HFC-23 12000 264
SF6 22200 3200
Amongst the emissions, CO2, CH4, and N2O, are most important, due to their total mass. But also the other
gases influence the overall climate effects of industrial processes, especially the anthropogenic (man-made)
chlorinated and fluorinated carbons, as hydrofluorocarbons (HFCs), perfluorocarbons (PFCs), and the sulphur
hexafluoroide (SF6). HFCs, PFCs and SF6 are used as substitutes for a group of so called ozone depleting
substances (ODSs), which are being phased-out under the Montreal Protocol on Substances that Deplete the
Ozone Layer. Moreover, they are employed and emitted by important industrial processes, as aluminum and
HCFC-22 production, semiconductor manufacture, and magnesium metal production and processing. In
addition, they are generated at electric power transmission and distribution.
Many of these substances are characterised by very high global warming potentials. E.g., SF6 is one of the
most potent greenhouse gases with a GWP of 23.900 (see Table 1). Nevertheless, at present, their contribution
to the overall global greenhouse gas effect is small due to the relative small amount employed, but in relation
to the effect in industrial processes of classical greenhouse gases as CO2, CH4, and SF6 they contribute to more
than 40percent already: In U.S. industry, in 2004, 152,6 Teragrams (Tg) CO2 equivalents were emitted as CO2
itself, 2,7 Mio ton caused by Methane, and 22,4 Mio ton caused by N2O, compared to 143 Mio ton emitted as
HFCs, PFCs and SF6 (4, 7).
Their usage is growing very rapidly to substitute the ODSs. Moreover, they have an extremely long lifetime
under atmospheric conditions, e.g. CF4 has a lifetime of 50.000 years, compared with methane, which has only
12±3years (see table 8). Thus, many of the HFCs, PFCs and SF6 will accumulate in the atmosphere as long as
Workshop „Biogas-Plant-technology planning,
Beijing, 22nd – 24th of November 2009
_________________________________________________________________________________________________
19 / 77
such substances are emitted. Accumulation may cause extremely negative climate effects of these substances
in future times.
In addition to the greenhouse gases, which directly influence climate factors, many industrial processes
generate so called indirect greenhouse gases. Such indirect effects of gases occur, when chemical
transformations involving the chemical substance produce greenhouse gases. Another indirect effect occurs,
when the gas considered influences other climate important processes such as atmospheric lifetime of
greenhouse gases. Most important indirect greenhouse gases are NOx, carbon monoxide (CO) and non
methane volatile organic carbon compounds (NMVOCs). They are produced in chemical and allied product
manufacturing, metals processing, during storage and transport, as well as health services, cooling tower
operation, fugitive dusts, various uncompleted combustion processes, and accidental or catastrophic releases.
To get a clearer impression of the importance of industrial processes in the climate change, the emission date
given should be compared with the total greenhouse gas emissions in an economy: In the case of the United
States, industrial processes in 2004 generated emissions of 320,7 Mio ton of CO2 equivalents. This is equal to
only 5 percent of total U.S. greenhouse gas emissions, measured as CO2 equivalents. Calculated in real figures
of the substances themselves, CO2 contributed to about 3 percent of the national CO2 emissions, methane to
less than 1 percent of the national methane emissions, N2O to about 6 percent of the national N2O emissions.
In the last 15 years the industrial emissions increased by 6,5 percent, though emissions from several industrial
processes decreased, e.g. for the iron and steel, as well as from aluminum production. In the iron and steel
branch, there was a reduction from 85 to 51,3 Mio ton CO2 Eq. between 1990 and 2004. The total increase was
driven partly by an increase in the emissions originating from cement manufacture, but mostly by the
emissions from the use of substitutes for the ozone depleting substances ODSs.
By the emissions discussed, industry actively influences the climate change. On the other side, industry itself
is influenced passively by climate effects. One main factor could be the situation of infrastructure, which may
be influenced or even destroyed by weather events, as snow, floods, or low water levels in rivers, which make
river transportation untenable, or low water supplies that make process cooling and environmental activities
more difficult.
Moreover, industrial activities would be affected through the impact of government policies pertaining to
climate change, such as carbon taxes, which increase the material and energy costs. They could also be
affected through a changed consumer behavior. An example is clothing, the choice of which depends on the
temperature, and more warm-weather clothing might be ordered under cold climates, and visa versa. Climatic
impacts on natural resources may influence manufacture that depends on such resources, as food processing
which depends on the agricultural yields, which strongly depend on climate factors (IPCC, 2006). This aspect
of climate influence on industrial processes is not yet clarified fully.
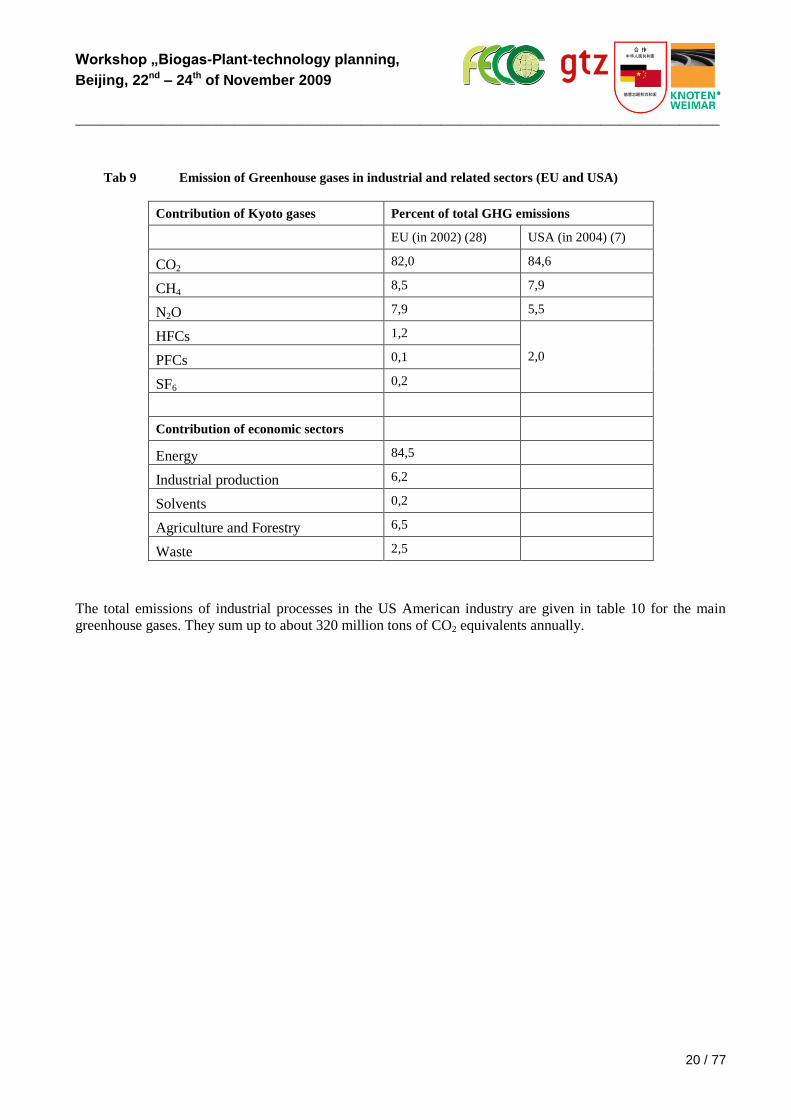
The actual situation of climate gas emissions by the most important six substances (Kyoto gases) as well as
their contribution to the economic sectors of the European Union and USA is given in table 9. The value totals
to about 4,13 and 7,07 Million t CO2 Equivalents, respectively (7, 28)
Workshop „Biogas-Plant-technology planning,
Beijing, 22nd – 24th of November 2009
_________________________________________________________________________________________________
20 / 77
Tab 9 Emission of Greenhouse gases in industrial and related sectors (EU and USA)
Contribution of Kyoto gases Percent of total GHG emissions
EU (in 2002) (28) USA (in 2004) (7)
CO2 82,0 84,6
CH4 8,5 7,9
N2O 7,9 5,5
HFCs 1,2
2,0 PFCs 0,1
SF6 0,2
Contribution of economic sectors
Energy 84,5
Industrial production 6,2
Solvents 0,2
Agriculture and Forestry 6,5
Waste 2,5
The total emissions of industrial processes in the US American industry are given in table 10 for the main
greenhouse gases. They sum up to about 320 million tons of CO2 equivalents annually.
Workshop „Biogas-Plant-technology planning,
Beijing, 22nd – 24th of November 2009
_________________________________________________________________________________________________
21 / 77
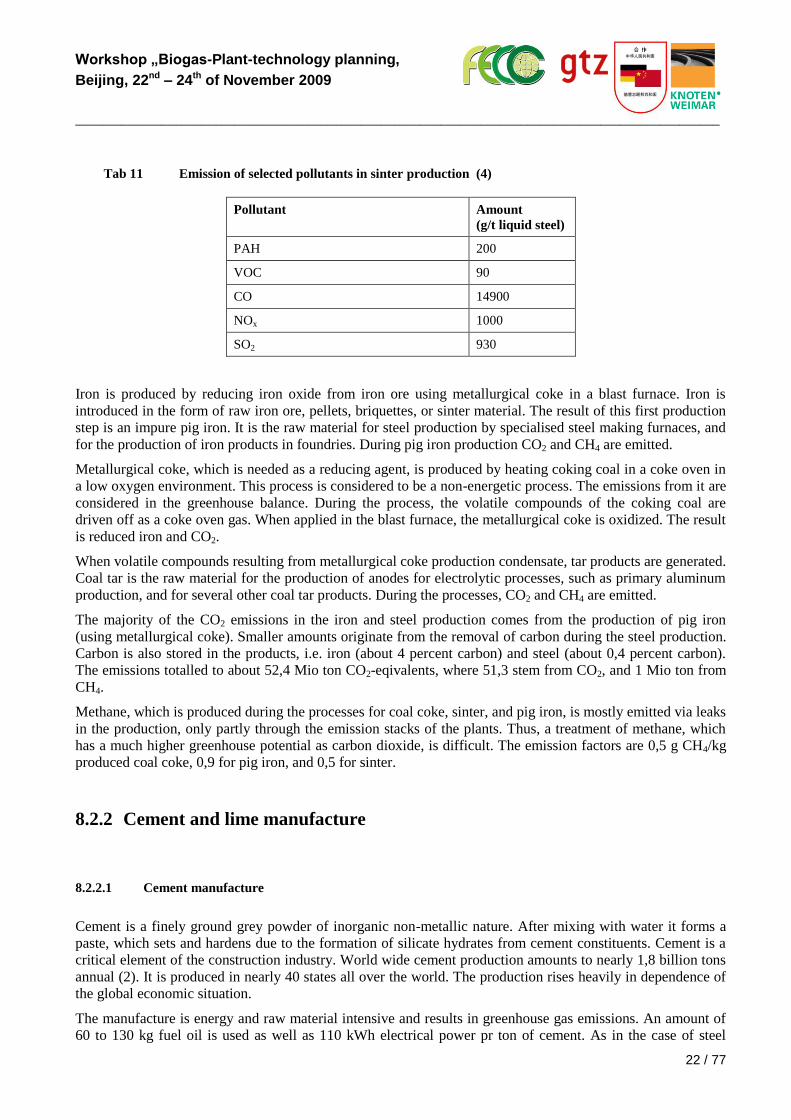
Tab 10 Total emissions from selected industrial processes in U.S. industry, 2004, (Mio ton CO2
Equivalents) (7)
Process CO2 CH4 N2O HFCs,
PFCs, SF6
All
Sum 152,6 2,7 22,6 143,0 320,9
Substitution of Ozone
Depleting Substances
103,3 103,3
Iron and Steel production 51,3 1,0 52,4
Cement manufacture 45,6 45,6
Ammonia manufacture and
Urea application
16,9 16,9
Nitric Acid Production 16,6 16,6
HCFC-22 Production 15,6 15,6
Electrical Transmission and
Distribution
13,8 13,8
Lime Manufacture 13,7 13,7
Aluminum Production 4,3 2,8 7,1
Limestone and Dolomite Use 6,7 6,7
Adipic Acid Production 5,7 5,7
Semiconductor Manufacture 4,7 4,7
Petrochemical Production 2,9 1,6 4,5
Soda Ash Manufacture and
Consumption
4,2 4,2
Magnesium production and
Processing
2,7 2,7
Titanium Dioxide Production 2,3 2,3
8.2 Climate contributions of industrial processes (7)
8.2.1 Production of Iron and Steel
Worldwide steel production is about 757 million tons (1995) (1), markets are very fast growing, especially in
the developing countries, as China and India. In China the annual production was about 150 million of tons in
2005, with an increase of 10 percent per year. In Germany 6,3 million tons of steel were consumed in 2002.
Iron and steel production is of climatic relevance by two reasons: first it is an energy intensive process, and
thus uses large amounts of fossil energy sources, which result in CO2 emissions. In additions to that during the
different process steps, non energetic production related emissions of direct climate gases such as CO2 and
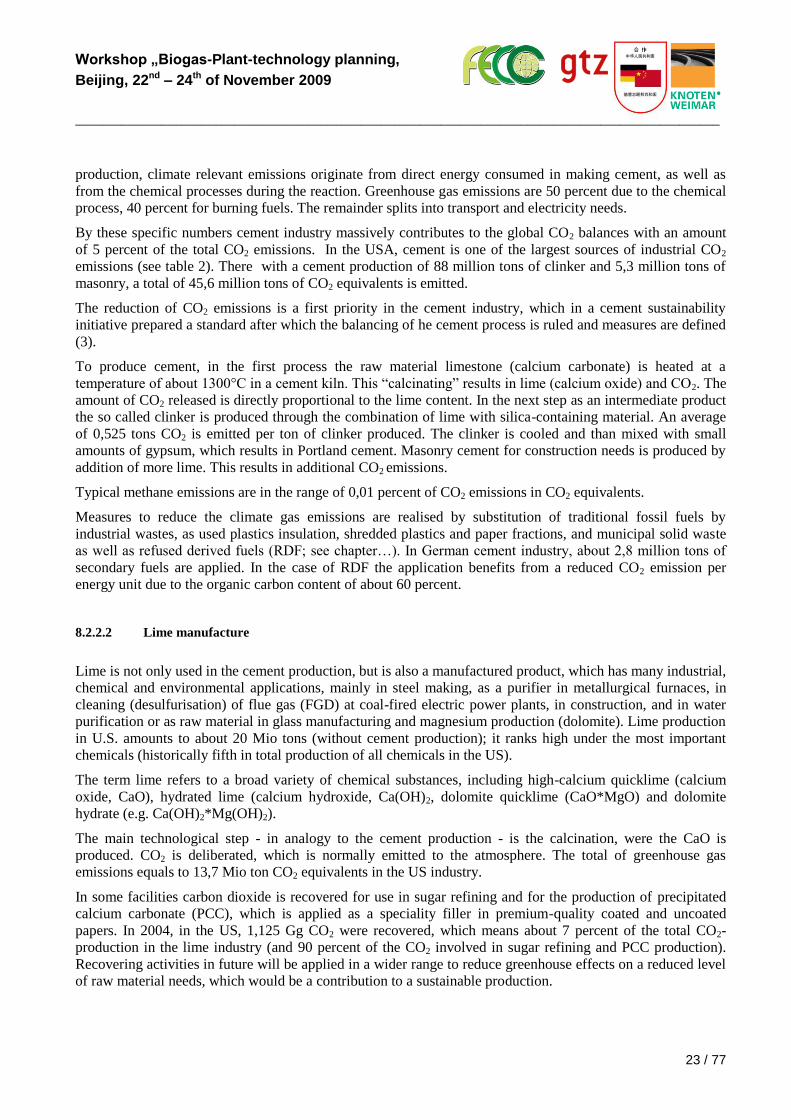
CH4, but also other pollutants with direct greenhouse gas effects (see table 11).
Workshop „Biogas-Plant-technology planning,
Beijing, 22nd – 24th of November 2009
_________________________________________________________________________________________________
22 / 77
Tab 11 Emission of selected pollutants in sinter production (4)
Pollutant Amount
(g/t liquid steel)
PAH 200
VOC 90
CO 14900
NOx 1000
SO2 930
Iron is produced by reducing iron oxide from iron ore using metallurgical coke in a blast furnace. Iron is
introduced in the form of raw iron ore, pellets, briquettes, or sinter material. The result of this first production
step is an impure pig iron. It is the raw material for steel production by specialised steel making furnaces, and
for the production of iron products in foundries. During pig iron production CO2 and CH4 are emitted.
Metallurgical coke, which is needed as a reducing agent, is produced by heating coking coal in a coke oven in
a low oxygen environment. This process is considered to be a non-energetic process. The emissions from it are
considered in the greenhouse balance. During the process, the volatile compounds of the coking coal are
driven off as a coke oven gas. When applied in the blast furnace, the metallurgical coke is oxidized. The result
is reduced iron and CO2.
When volatile compounds resulting from metallurgical coke production condensate, tar products are generated.
Coal tar is the raw material for the production of anodes for electrolytic processes, such as primary aluminum
production, and for several other coal tar products. During the processes, CO2 and CH4 are emitted.
The majority of the CO2 emissions in the iron and steel production comes from the production of pig iron
(using metallurgical coke). Smaller amounts originate from the removal of carbon during the steel production.
Carbon is also stored in the products, i.e. iron (about 4 percent carbon) and steel (about 0,4 percent carbon).
The emissions totalled to about 52,4 Mio ton CO2-eqivalents, where 51,3 stem from CO2, and 1 Mio ton from
CH4.
Methane, which is produced during the processes for coal coke, sinter, and pig iron, is mostly emitted via leaks
in the production, only partly through the emission stacks of the plants. Thus, a treatment of methane, which
has a much higher greenhouse potential as carbon dioxide, is difficult. The emission factors are 0,5 g CH4/kg
produced coal coke, 0,9 for pig iron, and 0,5 for sinter.
8.2.2 Cement and lime manufacture
8.2.2.1 Cement manufacture
Cement is a finely ground grey powder of inorganic non-metallic nature. After mixing with water it forms a
paste, which sets and hardens due to the formation of silicate hydrates from cement constituents. Cement is a
critical element of the construction industry. World wide cement production amounts to nearly 1,8 billion tons
annual (2). It is produced in nearly 40 states all over the world. The production rises heavily in dependence of
the global economic situation.
The manufacture is energy and raw material intensive and results in greenhouse gas emissions. An amount of
60 to 130 kg fuel oil is used as well as 110 kWh electrical power pr ton of cement. As in the case of steel
Workshop „Biogas-Plant-technology planning,
Beijing, 22nd – 24th of November 2009
_________________________________________________________________________________________________
23 / 77
production, climate relevant emissions originate from direct energy consumed in making cement, as well as
from the chemical processes during the reaction. Greenhouse gas emissions are 50 percent due to the chemical
process, 40 percent for burning fuels. The remainder splits into transport and electricity needs.
By these specific numbers cement industry massively contributes to the global CO2 balances with an amount
of 5 percent of the total CO2 emissions. In the USA, cement is one of the largest sources of industrial CO2
emissions (see table 2). There with a cement production of 88 million tons of clinker and 5,3 million tons of
masonry, a total of 45,6 million tons of CO2 equivalents is emitted.
The reduction of CO2 emissions is a first priority in the cement industry, which in a cement sustainability
initiative prepared a standard after which the balancing of he cement process is ruled and measures are defined
(3).
To produce cement, in the first process the raw material limestone (calcium carbonate) is heated at a
temperature of about 1300°C in a cement kiln. This “calcinating” results in lime (calcium oxide) and CO2. The
amount of CO2 released is directly proportional to the lime content. In the next step as an intermediate product
the so called clinker is produced through the combination of lime with silica-containing material. An average
of 0,525 tons CO2 is emitted per ton of clinker produced. The clinker is cooled and than mixed with small
amounts of gypsum, which results in Portland cement. Masonry cement for construction needs is produced by
addition of more lime. This results in additional CO2 emissions.
Typical methane emissions are in the range of 0,01 percent of CO2 emissions in CO2 equivalents.
Measures to reduce the climate gas emissions are realised by substitution of traditional fossil fuels by
industrial wastes, as used plastics insulation, shredded plastics and paper fractions, and municipal solid waste
as well as refused derived fuels (RDF; see chapter…). In German cement industry, about 2,8 million tons of
secondary fuels are applied. In the case of RDF the application benefits from a reduced CO2 emission per
energy unit due to the organic carbon content of about 60 percent.
8.2.2.2 Lime manufacture
Lime is not only used in the cement production, but is also a manufactured product, which has many industrial,
chemical and environmental applications, mainly in steel making, as a purifier in metallurgical furnaces, in
cleaning (desulfurisation) of flue gas (FGD) at coal-fired electric power plants, in construction, and in water
purification or as raw material in glass manufacturing and magnesium production (dolomite). Lime production
in U.S. amounts to about 20 Mio tons (without cement production); it ranks high under the most important
chemicals (historically fifth in total production of all chemicals in the US).
The term lime refers to a broad variety of chemical substances, including high-calcium quicklime (calcium
oxide, CaO), hydrated lime (calcium hydroxide, Ca(OH)2, dolomite quicklime (CaO*MgO) and dolomite
hydrate (e.g. Ca(OH)2*Mg(OH)2).
The main technological step - in analogy to the cement production - is the calcination, were the CaO is
produced. CO2 is deliberated, which is normally emitted to the atmosphere. The total of greenhouse gas
emissions equals to 13,7 Mio ton CO2 equivalents in the US industry.
In some facilities carbon dioxide is recovered for use in sugar refining and for the production of precipitated
calcium carbonate (PCC), which is applied as a speciality filler in premium-quality coated and uncoated
papers. In 2004, in the US, 1,125 Gg CO2 were recovered, which means about 7 percent of the total CO2-
production in the lime industry (and 90 percent of the CO2 involved in sugar refining and PCC production).
Recovering activities in future will be applied in a wider range to reduce greenhouse effects on a reduced level
of raw material needs, which would be a contribution to a sustainable production.
Workshop „Biogas-Plant-technology planning,
Beijing, 22nd – 24th of November 2009
_________________________________________________________________________________________________
24 / 77
8.2.3 Ammonia manufacture and Urea application
Ammonia and Urea are nitrogen fertilizers for application in agriculture to improve agricultural yields. The
annual world production is about … million tons.
Temporarily, feedstocks of ammonia production are natural gas, but also petroleum coke. In the case of
production from natural gas, there are five main process steps, including a primary and a secondary reforming
and a shift reforming process, by which CO2 is removed from the process. During the following ammonia
synthesis, from H2 and N2 by a catalytic process NH3 is formed.
The CO2 together with process impurities is a constituent of the waste gas. It is washed out by a scrubber, from
which the CO2 is released into the atmosphere during regeneration of the scrubber solution. A part of the CO2
is used as a raw material in the production of urea (CO(NH2)2) together with ammonia. The carbon in the urea
is released into the environment after application of the urea fertilizer in agriculture. This means that the whole
amount of CO2 produced in the ammonia synthesis is finally emitted into the atmosphere. For greenhouse gas
balancing these CO2 emissions are allocated to ammonia or urea production according to the amount of both
fertilizers.
The emission factor is 1,2 ton CO2 eq. per ton of NH3 in the case of natural gas feedstock. For each ton of
urea, 0,73 tons of CO2 eq. are emitted.
8.2.4 Aluminum production
Aluminum is a light weight metal with high corrosion resistance and a high heat and electric conductivity. Its
annual global production is about 18 million tons (1990) and the second in the range of the most important
metals. In USA, 2,5 mio tons were produced in 2004. It is used in a variety of manufactured products. This
includes aircraft, automobiles, bicycles, and utensils for daily life, as kitchen ware and packaging material. By
the so called eloxation, a thin surface cover is produced, which improves the corrosion resistance and makes
aluminum better applicable in the construction sector.
In nature, aluminum occurs as a low soluble oxide and silicate. The production of primary aluminum from the
ores (especially bauxite ores) is very power consuming (via electrolytical processes) and results - despite this
energy aspect - in process related emissions of CO2 and PFCs, especially perfluormethane (CF4) and
perfluoroethane (C2F6), both characterised by high global warming potentials (see table 1).
The emission of CO2 occurs during the aluminum smelting process, when aluminum oxide from the ores is
reduced (Hall-Heroult reduction process) through electrolysis in reduction cells. The cells contain a molten
bath of cryolite (Na3AlF6), which is of natural or synthetic origin. As the cathode in the electrolytic process, a
carbon lining is used. As the anode, also carbon containing material is applied. Carbon is oxidised during the
reduction, and emitted as CO2, which is released into the atmosphere. The amount of CO2 released is
approximately 1,5 t/t aluminum produced. In another technology (so called Soderberg cell), 1,8 t/t are released.
Aluminum production industry, in addition to CO2, is a source of PFC emissions. The reason are so called
anode effects, by which the voltage in the electrolysis bath rapidly increases due to reduced levels of the
melting bath. Than reactions of carbon and fluorine of the molten cryolite bath occur. As a result, fugitive
emissions of CF4 and C2F6 occur. Their magnitude depends on the process conditions (measured as anode
effect minutes per Cell-Day), and can be massively reduced if anode effects are minimised by better control
technologies. In the US aluminum industry, PFC emissions declined by a factor of 6,6 in the last 15 years. The
relation of CO2 emissions to PFC emissions actually is about 1:0,7 compared with 1:2,6 in 1990.
Workshop „Biogas-Plant-technology planning,
Beijing, 22nd – 24th of November 2009
_________________________________________________________________________________________________
25 / 77
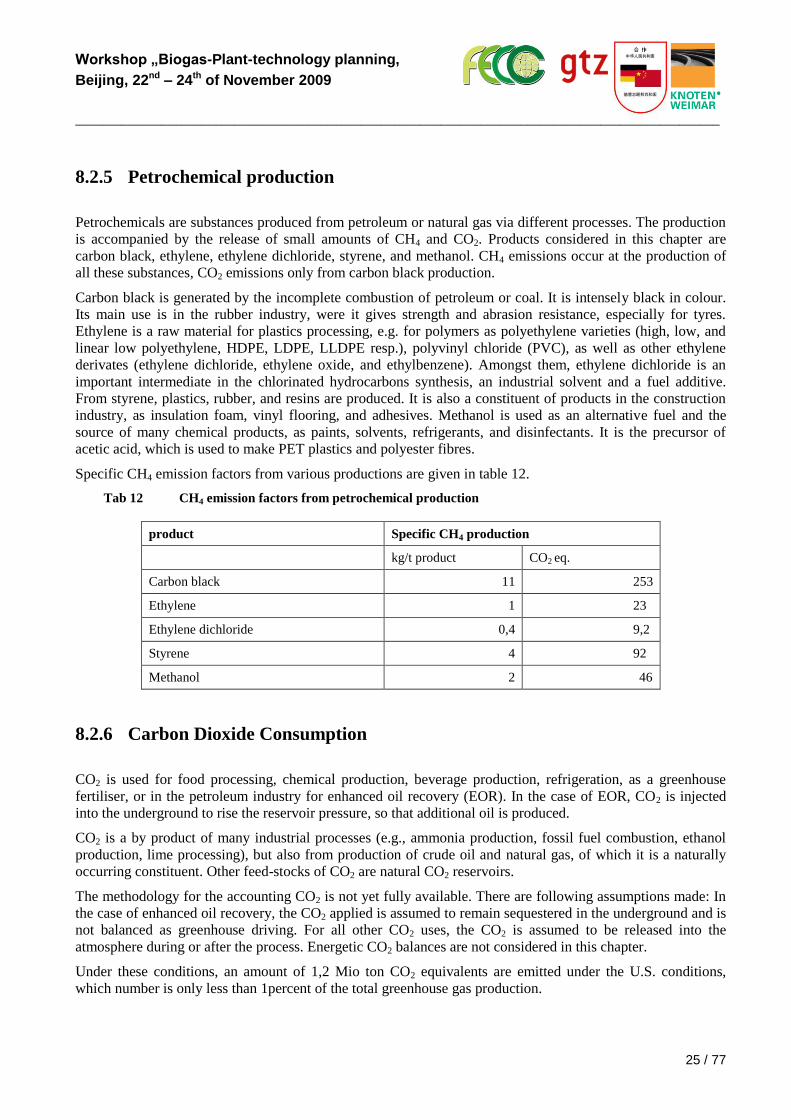
8.2.5 Petrochemical production
Petrochemicals are substances produced from petroleum or natural gas via different processes. The production
is accompanied by the release of small amounts of CH4 and CO2. Products considered in this chapter are
carbon black, ethylene, ethylene dichloride, styrene, and methanol. CH4 emissions occur at the production of
all these substances, CO2 emissions only from carbon black production.
Carbon black is generated by the incomplete combustion of petroleum or coal. It is intensely black in colour.
Its main use is in the rubber industry, were it gives strength and abrasion resistance, especially for tyres.
Ethylene is a raw material for plastics processing, e.g. for polymers as polyethylene varieties (high, low, and
linear low polyethylene, HDPE, LDPE, LLDPE resp.), polyvinyl chloride (PVC), as well as other ethylene
derivates (ethylene dichloride, ethylene oxide, and ethylbenzene). Amongst them, ethylene dichloride is an
important intermediate in the chlorinated hydrocarbons synthesis, an industrial solvent and a fuel additive.
From styrene, plastics, rubber, and resins are produced. It is also a constituent of products in the construction
industry, as insulation foam, vinyl flooring, and adhesives. Methanol is used as an alternative fuel and the
source of many chemical products, as paints, solvents, refrigerants, and disinfectants. It is the precursor of
acetic acid, which is used to make PET plastics and polyester fibres.
Specific CH4 emission factors from various productions are given in table 12.
Tab 12 CH4 emission factors from petrochemical production
product Specific CH4 production
kg/t product CO2 eq.
Carbon black 11 Tab 13 253
Ethylene Tab 14 1 Tab 15 23
Ethylene dichloride Tab 16 0,4 Tab 17 9,2
Styrene Tab 18 4 Tab 19 92
Methanol 2 46
8.2.6 Carbon Dioxide Consumption
CO2 is used for food processing, chemical production, beverage production, refrigeration, as a greenhouse
fertiliser, or in the petroleum industry for enhanced oil recovery (EOR). In the case of EOR, CO2 is injected
into the underground to rise the reservoir pressure, so that additional oil is produced.
CO2 is a by product of many industrial processes (e.g., ammonia production, fossil fuel combustion, ethanol
production, lime processing), but also from production of crude oil and natural gas, of which it is a naturally
occurring constituent. Other feed-stocks of CO2 are natural CO2 reservoirs.
The methodology for the accounting CO2 is not yet fully available. There are following assumptions made: In
the case of enhanced oil recovery, the CO2 applied is assumed to remain sequestered in the underground and is
not balanced as greenhouse driving. For all other CO2 uses, the CO2 is assumed to be released into the
atmosphere during or after the process. Energetic CO2 balances are not considered in this chapter.
Under these conditions, an amount of 1,2 Mio ton CO2 equivalents are emitted under the U.S. conditions,
which number is only less than 1percent of the total greenhouse gas production.
Workshop „Biogas-Plant-technology planning,
Beijing, 22nd – 24th of November 2009
_________________________________________________________________________________________________
26 / 77
8.2.7 Semiconductor manufacture
Semiconductors are produced using multiple long-lived fluorinated gases in plasma etching (patterning) and in
plasma enhanced chemical vapour deposition (PECVD). About 100 process steps, using fluorinated gases are
used to produce the semiconductor products, as devices or chips from silicon wafers.
Plasma etching is applied to provide pathways for conducting substances which connect the circuit
components of the semiconductors. Plasma-generated fluorine atoms are used. These atoms chemically react
with exposed dielectric films. By this means, certain portions of the film are removed selectively. Some
residual undissociated fluorinated gases remain. They - together with the material removed - partly are emitted
as waste gas, partly are treated in emission abatement systems.
PECVD chambers are periodically cleaned by using fluorinated gases, which in plasma are converted to
fluorine atoms. By this atoms, the residual material from chamber walls, electrodes and hardware are moved
away. Residues and reaction products, as CF4, are emitted.
For these purposes, dependent of the specifity of the products, mainly the following gases are used:
Trifluoromethane (HFC-23, CHF3), perfluoromethane (CF4), perfluorethane (C2F6), nitrogen trifluoride (NF3),
and sulphur hexafluoride (SF6), moreover perfluoropropane (C3F8) and perfluorocyclobutane (c-C4F8).
These substances were applied in the US semiconductor industry by about 500 tons per year (in 2004). This
seems to be a relative low amount. But these gases are high potent greenhouse gases (see table 1), and thus end
up with about 4,7 Mio ton CO2 Eq. emitted (in 2004). The numbers were growing all over the last 15 years,
due to the growth of the industry and the higher complexity of the semiconductors, which use more PFCs. But
there is a tendency in the growth rate of PFCs to decline in the last years, due to process optimisation and
abatement technologies. The decline in growth was about one third in the last 5 years.
8.2.8 Adipic acid production
Adipic acid is a white, crystalline solid. Chemically it is also called hexanedioic acid, which is a C6 straight-
chain dicarboxylic acid. It is slightly soluble in water and soluble in alcohol and acetone.
The annual world production is about 3 million ton. One third is produced in the U.S. industry in only 4
companies. Its commercial use to approximately 90 percent is linked to nylon production, which is further
processed into fibers for applications in carpeting, automobile tire cord, and clothing. Furthermore, adipic acid
is used for plasticizers and lubricants components, and making polyester polyols for polyurethane systems.
Food grade adipic acid is used as gelling aid, acidulant, leavening and buffering agent. Its derivates are used in
making flavoring agents, internal plasticizers, pesticides, dyes, textile treatment agents, fungicides, and
pharmaceuticals.
Commercial adipic acid is mostly produced from cyclohexane through a two-stage oxidation process. The first
involves the catalytic reaction of cyclohexane with oxygen to produce cyclohexanol and cyclohexanone.
Afterwards, adipic acid is formed by another catalytic reaction of the mixture with nitric acid and air.
Due to the use of nitric acid in this process, N2O is generated at a rate of 0,3 tons per ton of adipic acid. It is
emitted by the waste gas stream. In modern plants, the waste gas is treated by an abatement system, which
destroys pollutant by catalytic or by thermal reactions, with an efficiency of 95 and 98 percent, respectively.
Due to the installation of these technologies is most plants, the N2O emissions from adipic acid production
have been reduced by two thirds since 1990. The actual total in US industry is about 5,7 Mio ton CO2
Equivalents.
Workshop „Biogas-Plant-technology planning,
Beijing, 22nd – 24th of November 2009
_________________________________________________________________________________________________
27 / 77
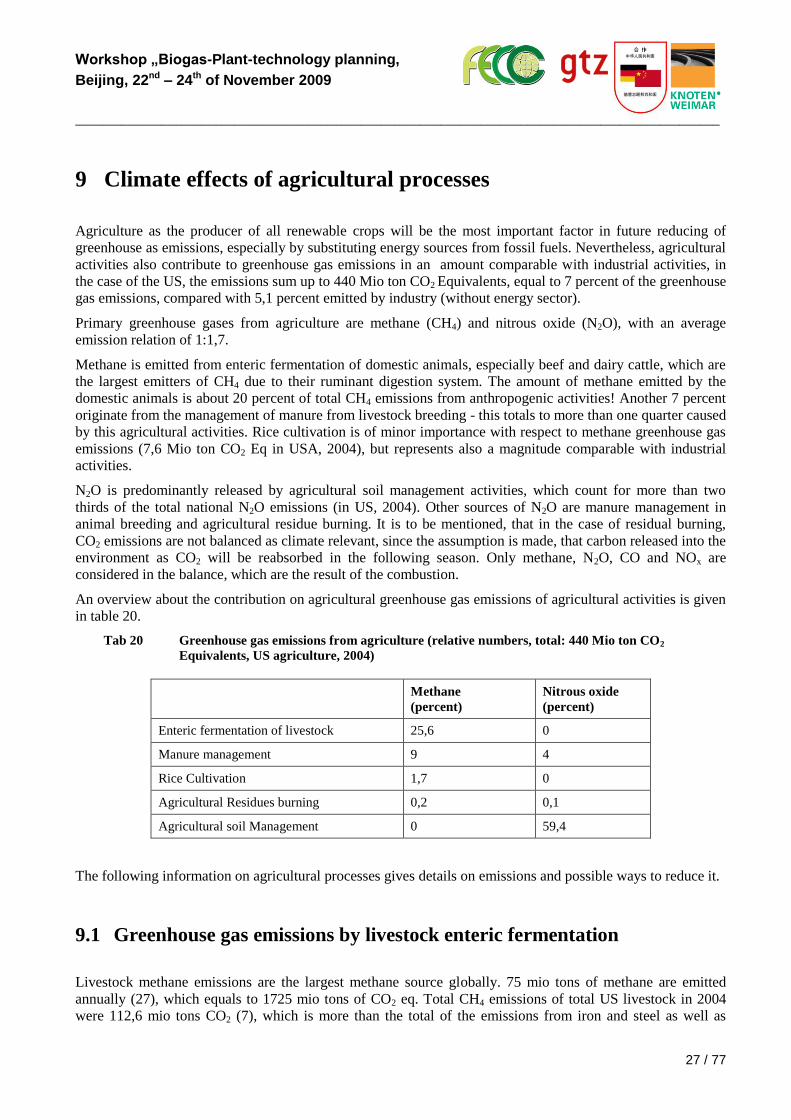
9 Climate effects of agricultural processes
Agriculture as the producer of all renewable crops will be the most important factor in future reducing of
greenhouse as emissions, especially by substituting energy sources from fossil fuels. Nevertheless, agricultural
activities also contribute to greenhouse gas emissions in an amount comparable with industrial activities, in
the case of the US, the emissions sum up to 440 Mio ton CO2 Equivalents, equal to 7 percent of the greenhouse
gas emissions, compared with 5,1 percent emitted by industry (without energy sector).
Primary greenhouse gases from agriculture are methane (CH4) and nitrous oxide (N2O), with an average
emission relation of 1:1,7.
Methane is emitted from enteric fermentation of domestic animals, especially beef and dairy cattle, which are
the largest emitters of CH4 due to their ruminant digestion system. The amount of methane emitted by the
domestic animals is about 20 percent of total CH4 emissions from anthropogenic activities! Another 7 percent
originate from the management of manure from livestock breeding - this totals to more than one quarter caused
by this agricultural activities. Rice cultivation is of minor importance with respect to methane greenhouse gas
emissions (7,6 Mio ton CO2 Eq in USA, 2004), but represents also a magnitude comparable with industrial
activities.
N2O is predominantly released by agricultural soil management activities, which count for more than two
thirds of the total national N2O emissions (in US, 2004). Other sources of N2O are manure management in
animal breeding and agricultural residue burning. It is to be mentioned, that in the case of residual burning,
CO2 emissions are not balanced as climate relevant, since the assumption is made, that carbon released into the
environment as CO2 will be reabsorbed in the following season. Only methane, N2O, CO and NOx are
considered in the balance, which are the result of the combustion.
An overview about the contribution on agricultural greenhouse gas emissions of agricultural activities is given
in table 20.
Tab 20 Greenhouse gas emissions from agriculture (relative numbers, total: 440 Mio ton CO2
Equivalents, US agriculture, 2004)
Methane
(percent)
Nitrous oxide
(percent)
Enteric fermentation of livestock 25,6 0
Manure management 9 4
Rice Cultivation 1,7 0
Agricultural Residues burning 0,2 0,1
Agricultural soil Management 0 59,4
The following information on agricultural processes gives details on emissions and possible ways to reduce it.
9.1 Greenhouse gas emissions by livestock enteric fermentation
Livestock methane emissions are the largest methane source globally. 75 mio tons of methane are emitted
annually (27), which equals to 1725 mio tons of CO2 eq. Total CH4 emissions of total US livestock in 2004
were 112,6 mio tons CO2 (7), which is more than the total of the emissions from iron and steel as well as
Workshop „Biogas-Plant-technology planning,
Beijing, 22nd – 24th of November 2009
_________________________________________________________________________________________________
28 / 77
cement industry. Beef cattle contribute by 71 percent, dairy cattle by 24 percent. The residual small portion
comes from other animals.
The background of GHG production by livestock is as follows: Nutrients from the food consumed by the
animals are digested in its digestion system. During this complex process also microbes take part, which
metabolize the nutritional components. As the process partly takes place under anaerobic conditions, i.e. in an
oxygen free atmosphere, anaerobic bacteria predominate.
In a metabolic process, including the production of intermediates as acetic acid and hydrogen, microbes
produce methane as an end-product. This is exhaled or eructated by the animal. The amount of methane
produced depends primarily on the type of the digestive system of the animal. Other factors are the amount
and composition of the feed consumed. Energy rich feed results in more methane.
As methane producers ruminant animals as cattle, sheep, gouts, and camels dominate. In their rumen, which is
a type of a fore-stomach, bacteria break down the feed, so that it can be absorbed and afterwards metabolized
by the following indestinal organs. Ruminant animals are thus able to digest coarse plant material, as grass,
and other high cellulose containing green crops. For more details of the bioprocess see chapter 11.4.
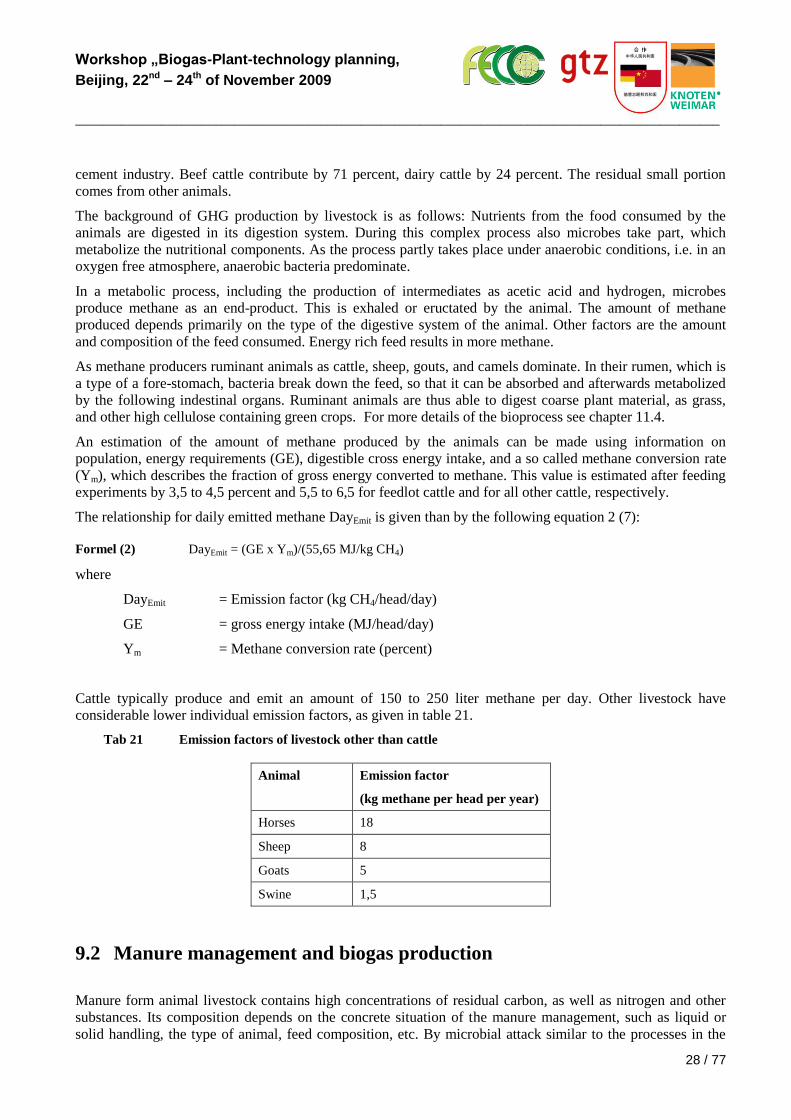
An estimation of the amount of methane produced by the animals can be made using information on
population, energy requirements (GE), digestible cross energy intake, and a so called methane conversion rate
(Ym), which describes the fraction of gross energy converted to methane. This value is estimated after feeding
experiments by 3,5 to 4,5 percent and 5,5 to 6,5 for feedlot cattle and for all other cattle, respectively.
The relationship for daily emitted methane DayEmit is given than by the following equation 2 (7):
Formel (2) DayEmit = (GE x Ym)/(55,65 MJ/kg CH4)
where
DayEmit = Emission factor (kg CH4/head/day)
GE = gross energy intake (MJ/head/day)
Ym = Methane conversion rate (percent)
Cattle typically produce and emit an amount of 150 to 250 liter methane per day. Other livestock have
considerable lower individual emission factors, as given in table 21.
Tab 21 Emission factors of livestock other than cattle
Animal Emission factor
(kg methane per head per year)
Horses 18
Sheep 8
Goats 5
Swine 1,5
9.2 Manure management and biogas production
Manure form animal livestock contains high concentrations of residual carbon, as well as nitrogen and other
substances. Its composition depends on the concrete situation of the manure management, such as liquid or
solid handling, the type of animal, feed composition, etc. By microbial attack similar to the processes in the
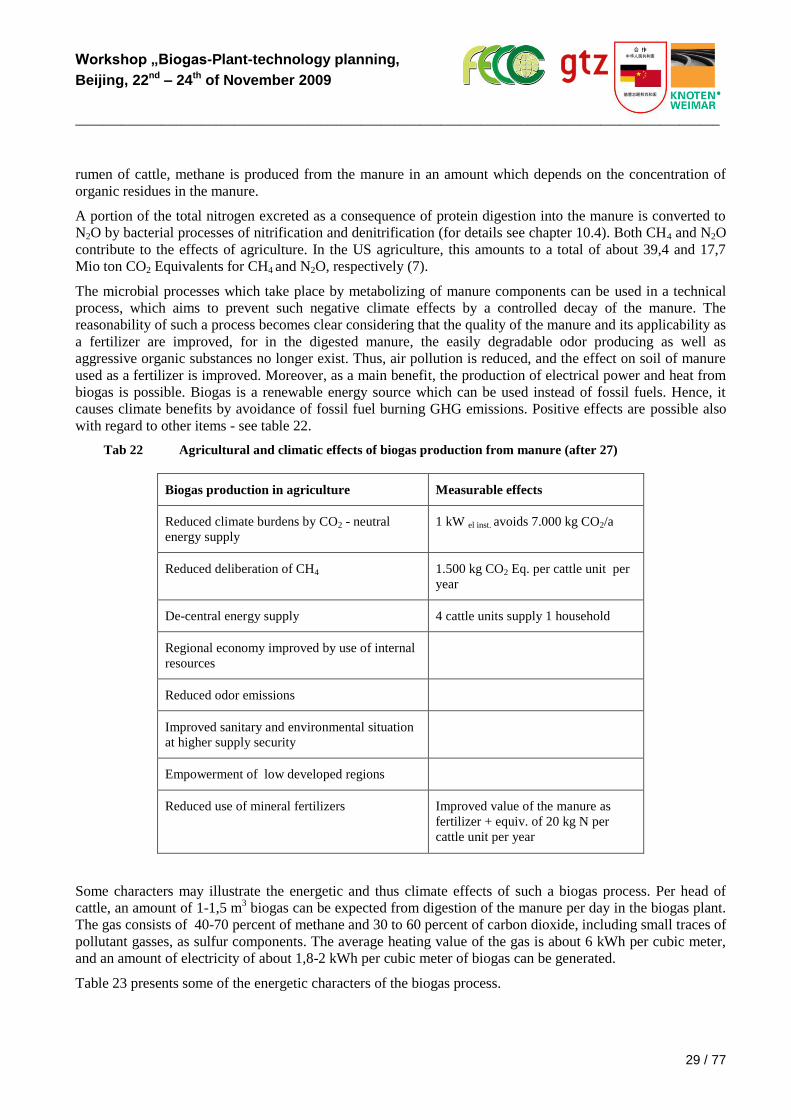
Workshop „Biogas-Plant-technology planning,
Beijing, 22nd – 24th of November 2009
_________________________________________________________________________________________________
29 / 77
rumen of cattle, methane is produced from the manure in an amount which depends on the concentration of
organic residues in the manure.
A portion of the total nitrogen excreted as a consequence of protein digestion into the manure is converted to
N2O by bacterial processes of nitrification and denitrification (for details see chapter 10.4). Both CH4 and N2O
contribute to the effects of agriculture. In the US agriculture, this amounts to a total of about 39,4 and 17,7
Mio ton CO2 Equivalents for CH4 and N2O, respectively (7).
The microbial processes which take place by metabolizing of manure components can be used in a technical
process, which aims to prevent such negative climate effects by a controlled decay of the manure. The
reasonability of such a process becomes clear considering that the quality of the manure and its applicability as
a fertilizer are improved, for in the digested manure, the easily degradable odor producing as well as
aggressive organic substances no longer exist. Thus, air pollution is reduced, and the effect on soil of manure
used as a fertilizer is improved. Moreover, as a main benefit, the production of electrical power and heat from
biogas is possible. Biogas is a renewable energy source which can be used instead of fossil fuels. Hence, it
causes climate benefits by avoidance of fossil fuel burning GHG emissions. Positive effects are possible also
with regard to other items - see table 22.
Tab 22 Agricultural and climatic effects of biogas production from manure (after 27)
Biogas production in agriculture Measurable effects
Reduced climate burdens by CO2 - neutral
energy supply
1 kW el inst. avoids 7.000 kg CO2/a
Reduced deliberation of CH4 1.500 kg CO2 Eq. per cattle unit per
year
De-central energy supply 4 cattle units supply 1 household
Regional economy improved by use of internal
resources
Reduced odor emissions
Improved sanitary and environmental situation
at higher supply security
Empowerment of low developed regions
Reduced use of mineral fertilizers
Improved value of the manure as
fertilizer + equiv. of 20 kg N per
cattle unit per year
Some characters may illustrate the energetic and thus climate effects of such a biogas process. Per head of
cattle, an amount of 1-1,5 m3 biogas can be expected from digestion of the manure per day in the biogas plant.
The gas consists of 40-70 percent of methane and 30 to 60 percent of carbon dioxide, including small traces of
pollutant gasses, as sulfur components. The average heating value of the gas is about 6 kWh per cubic meter,
and an amount of electricity of about 1,8-2 kWh per cubic meter of biogas can be generated.
Table 23 presents some of the energetic characters of the biogas process.
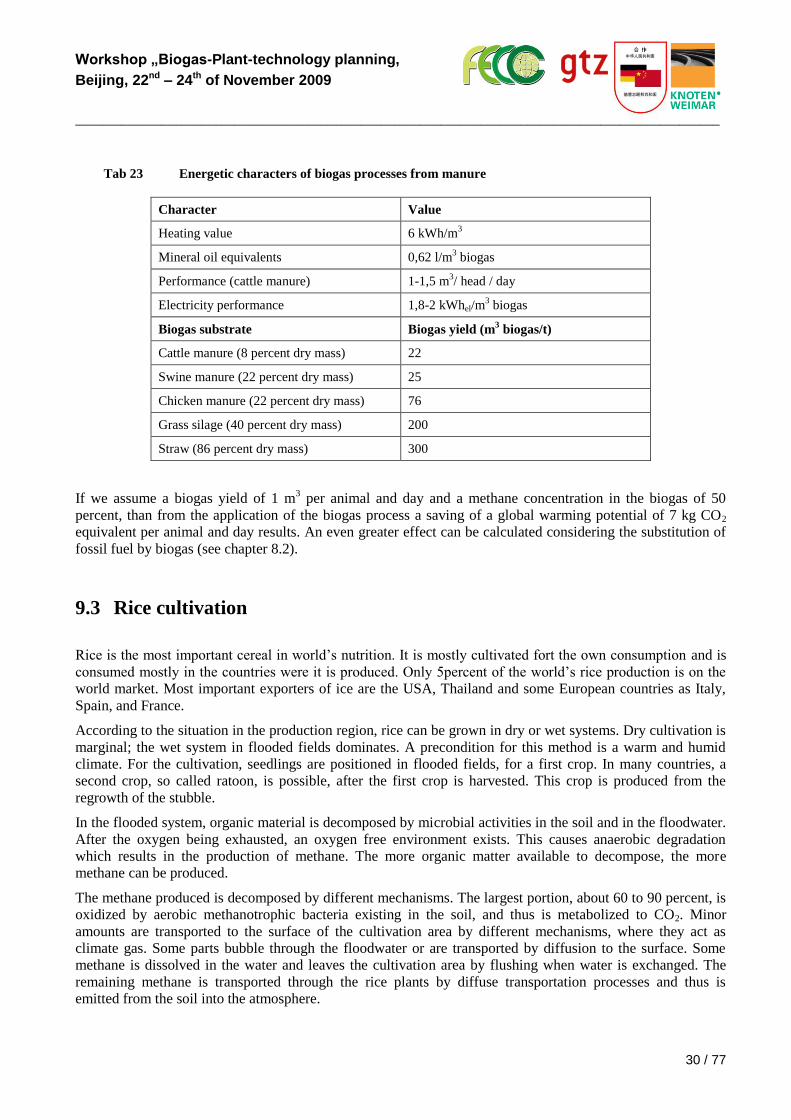
Workshop „Biogas-Plant-technology planning,
Beijing, 22nd – 24th of November 2009
_________________________________________________________________________________________________
30 / 77
Tab 23 Energetic characters of biogas processes from manure
Character Value
Heating value 6 kWh/m3
Mineral oil equivalents 0,62 l/m3 biogas
Performance (cattle manure) 1-1,5 m3/ head / day
Electricity performance 1,8-2 kWhel/m3 biogas
Biogas substrate Biogas yield (m3 biogas/t)
Cattle manure (8 percent dry mass) 22
Swine manure (22 percent dry mass) 25
Chicken manure (22 percent dry mass) 76
Grass silage (40 percent dry mass) 200
Straw (86 percent dry mass) 300
If we assume a biogas yield of 1 m3 per animal and day and a methane concentration in the biogas of 50
percent, than from the application of the biogas process a saving of a global warming potential of 7 kg CO2
equivalent per animal and day results. An even greater effect can be calculated considering the substitution of
fossil fuel by biogas (see chapter 8.2).
9.3 Rice cultivation
Rice is the most important cereal in world’s nutrition. It is mostly cultivated fort the own consumption and is
consumed mostly in the countries were it is produced. Only 5percent of the world’s rice production is on the
world market. Most important exporters of ice are the USA, Thailand and some European countries as Italy,
Spain, and France.
According to the situation in the production region, rice can be grown in dry or wet systems. Dry cultivation is
marginal; the wet system in flooded fields dominates. A precondition for this method is a warm and humid
climate. For the cultivation, seedlings are positioned in flooded fields, for a first crop. In many countries, a
second crop, so called ratoon, is possible, after the first crop is harvested. This crop is produced from the
regrowth of the stubble.
In the flooded system, organic material is decomposed by microbial activities in the soil and in the floodwater.
After the oxygen being exhausted, an oxygen free environment exists. This causes anaerobic degradation
which results in the production of methane. The more organic matter available to decompose, the more
methane can be produced.
The methane produced is decomposed by different mechanisms. The largest portion, about 60 to 90 percent, is
oxidized by aerobic methanotrophic bacteria existing in the soil, and thus is metabolized to CO2. Minor
amounts are transported to the surface of the cultivation area by different mechanisms, where they act as
climate gas. Some parts bubble through the floodwater or are transported by diffusion to the surface. Some
methane is dissolved in the water and leaves the cultivation area by flushing when water is exchanged. The
remaining methane is transported through the rice plants by diffuse transportation processes and thus is
emitted from the soil into the atmosphere.
Workshop „Biogas-Plant-technology planning,
Beijing, 22nd – 24th of November 2009
_________________________________________________________________________________________________
31 / 77
The resulting emissions of methane from the rice cultivation field depend on the water management system
applied. Most is emitted by shallow systems. Deep water rice with water depth of more than one meter is
characterized by a much lower emission, due to the fact, that the lower stems and roots of the plants are dead,
so that the transport of the methane through the plant is inhibited. If the field is drained periodically and the
soil is dried sufficiently, methane is no longer produced and thus not emitted.
Fertilizer practices also influence the methane production, especially application organic fertilizers which
enhance the amount of organics decompostible. Some fertilizers, as nitrate and sulfate fertilizers, also inhibit
the methane production.
Emission factors of methane were estimated defined by yield experiments. They came down with different
emission factors for primary and secondary crops. These averaged over a broad variety of results were 210 and
780 kg CH4/hectare and season, respectively.
With respect to the cultivation method the secondary crop results in an about threefold emission compared
with primary crops.
9.4 Agricultural soil management
Agricultural soil management is the primary source of N2O emissions, which heavily contributes to the
greenhouse effect. In the U.S. agriculture, its contribution amounts to about 60 percent of the overall
greenhouse gas emissions (see table 20). The total is about 260 Mio ton CO2 Eq. per year in 2004. This equals
to more than 80 percent of the total greenhouse gas emissions of all industrial processes.
N2O production is a naturally occurring process in every soil. Its magnitude depends on agricultural activities.
The processes behind are microbial nitrification and denitrification. Nitrification is defined as the aerobic
microbial oxidation of ammonium (NH4) to nitrate (NO3). Denitrification takes place under anaerobic
conditions. Microorganisms than reduce nitrate to free nitrogen gas (N2). N2O in this process is an intermediate
during both nitrification and denitrification, where the contribution of denitrification is well understood and
predominates.
The amount of N2O produced during these processes depends on the amount of nitrogen available in the soil.
The predominant factor in enhancing the nitrogen level is fertilizer application, as mineral nitrogen, or organic
fertilizers from livestock manure (see chapter 10.1), compost, or the direct application of sewage sludge. Also
nitrogen fixing crops, as leguminoses, contribute to the N-level.
10 Climate effects of Waste management processes
10.1 Background
Municipal solid waste is the end product of the life cycle of all material consumed by the people. Its
management is an important environmental challenge facing all states. Besides effects on material use and
exhaustion of natural resources, need of landfill space and health problems, the impacts of waste and waste
management on climate are of considerable importance.
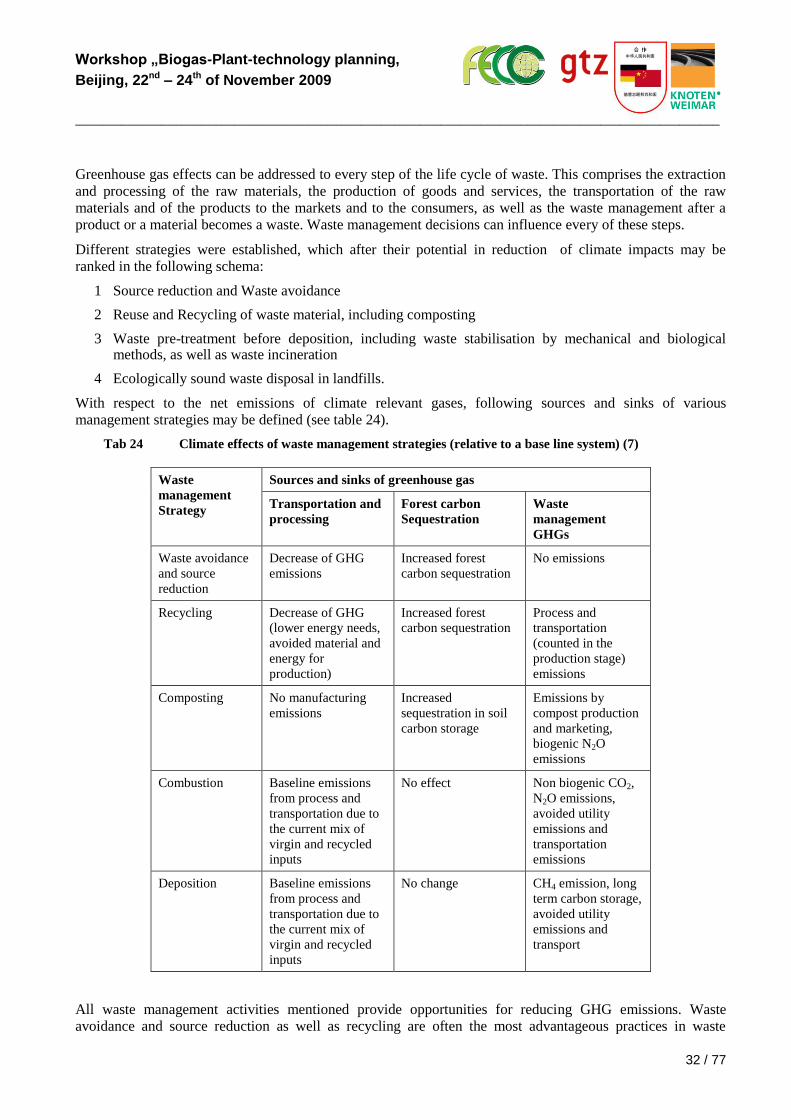
Workshop „Biogas-Plant-technology planning,
Beijing, 22nd – 24th of November 2009
_________________________________________________________________________________________________
32 / 77
Greenhouse gas effects can be addressed to every step of the life cycle of waste. This comprises the extraction
and processing of the raw materials, the production of goods and services, the transportation of the raw
materials and of the products to the markets and to the consumers, as well as the waste management after a
product or a material becomes a waste. Waste management decisions can influence every of these steps.
Different strategies were established, which after their potential in reduction of climate impacts may be
ranked in the following schema:
1 Source reduction and Waste avoidance
2 Reuse and Recycling of waste material, including composting
3 Waste pre-treatment before deposition, including waste stabilisation by mechanical and biological methods, as well as waste incineration
4 Ecologically sound waste disposal in landfills.
With respect to the net emissions of climate relevant gases, following sources and sinks of various
management strategies may be defined (see table 24).
Tab 24 Climate effects of waste management strategies (relative to a base line system) (7)
Waste
management
Strategy
Sources and sinks of greenhouse gas
Transportation and
processing
Forest carbon
Sequestration
Waste
management
GHGs
Waste avoidance
and source
reduction
Decrease of GHG
emissions
Increased forest
carbon sequestration
No emissions
Recycling Decrease of GHG
(lower energy needs,
avoided material and
energy for
production)
Increased forest
carbon sequestration
Process and
transportation
(counted in the
production stage)
emissions
Composting No manufacturing
emissions
Increased
sequestration in soil
carbon storage
Emissions by
compost production
and marketing,
biogenic N2O
emissions
Combustion Baseline emissions
from process and
transportation due to
the current mix of
virgin and recycled
inputs
No effect Non biogenic CO2,
N2O emissions,
avoided utility
emissions and
transportation
emissions
Deposition Baseline emissions
from process and
transportation due to
the current mix of
virgin and recycled
inputs
No change CH4 emission, long
term carbon storage,
avoided utility
emissions and
transport
All waste management activities mentioned provide opportunities for reducing GHG emissions. Waste
avoidance and source reduction as well as recycling are often the most advantageous practices in waste
Workshop „Biogas-Plant-technology planning,
Beijing, 22nd – 24th of November 2009
_________________________________________________________________________________________________
33 / 77
management. Which reduction is achieved, depends on the individual circumstances, amongst which the
composition of waste material plays a dominant role. Moreover, the specific technology applied influences the
calculation. Therefore, a material-specific comparison of all options available would define where the benefits
are bioggest.
In the following chapter, typical climate effects of some waste management activities are considered. They
may help for decisions what should be planned and realised in a concrete situation.
Some examples may give a first rough indication on the effects possible (7). For a more detailed estimation see
chapter 11.7.
Firm level: The recycling of 50 tons of paper and 4 tons of aluminum per year instead of deposition this
may reduce the GHG emissions by about 350 tons CO2 equivalents.
A re-use of carbon dioxide from composting of 1000 tons of green waste substitutes 150 tons of
technically produced CO2 used as a fertilizer in a greenhouse.
Community level: An increase of the recycling rate from 30 percent to 40 percent at an average waste
generation of 1 kg per person per day in a community of 30.000 and disposed at a landfill without a gas
collection system results in a reduction of GHG emissions by 10.000 tons CO2 equivalents. In a town of
50.000 and a waste mass of 30.000 tons per year, the installation of a landfill gas recovery system is
reduced by 22.000 tons CO2 equivalents.
City level (1 million inhabitants): Waste management in a mass burn combustor unit instead of
deposition on a landfill without gas collection, reduces GHG emissions by about 450.000 CO2
equivalents.
On the national level of the USA, an increase of the average recycling rate from 30 percent to 35 percent
results in a reduction of GHG effects by about 10 million tons CO2 equivalents annually.
10.2 Source reduction and waste recycling
10.2.1 Background and preconditions
Besides waste avoidance, source reduction and waste recycling are two other options to improve the waste
management situation.
In the case of source reduction, less material is used to produce a product. It is achieved by practices such as
“green design” or “ecological design”. Such activities also are targets of the new EU strategy for an improved
resource management (47). It is also possible to source reduce one type of material by a substitute, which
consists of another type of material with lower GHG emissions.
In the case of recycling the material is used in place of a virgin input in the manufacturing process, instead of
being disposed of and managed as waste. The material after its first use is recovered and prepared for a second
use in the same field of application. Examples are the paper recycling or the use of remould tyres. In a “closed
loop” recycling the material is used to produce new material of the same kind, e.g. newspapers, which are
recycled into new newspapers. Most of the materials are but recycled into a broader variety of manufactured
products. This type of recycling is named as “open loop”.
Benefits of recycling due to GHG emissions are calculated as the difference between GHG emissions from
manufacturing of a material only from recycled and only from virgin input.
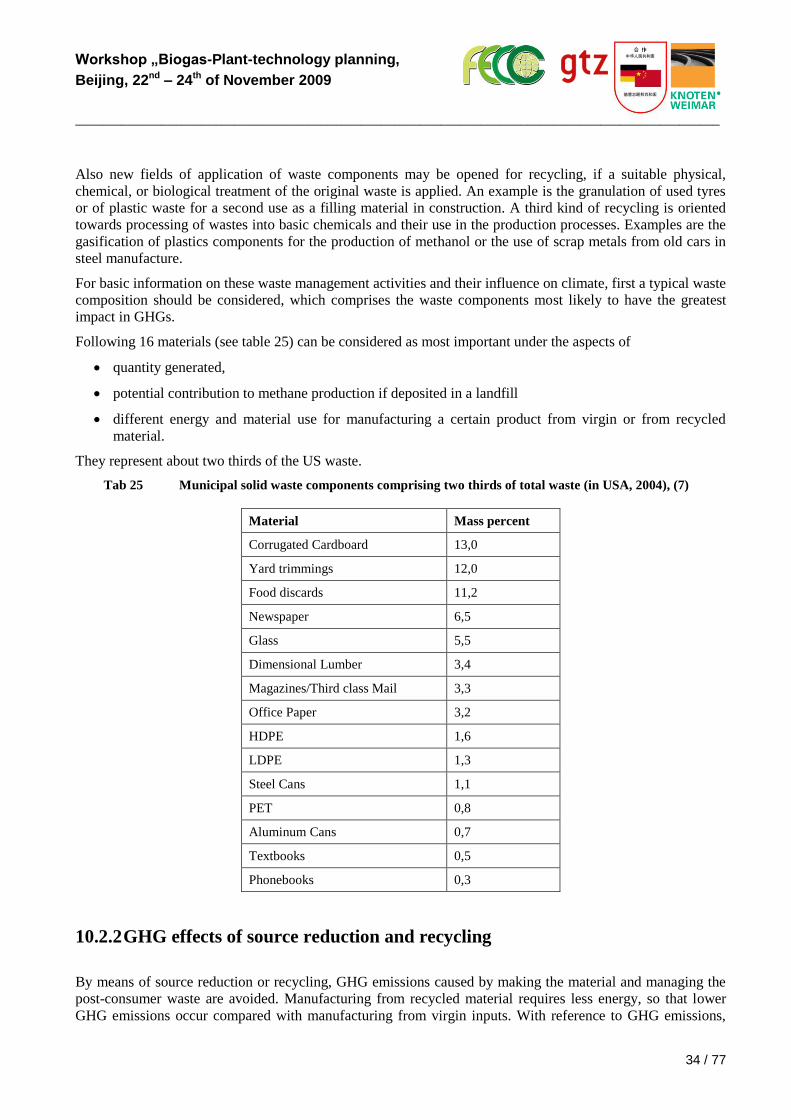
Workshop „Biogas-Plant-technology planning,
Beijing, 22nd – 24th of November 2009
_________________________________________________________________________________________________
34 / 77
Also new fields of application of waste components may be opened for recycling, if a suitable physical,
chemical, or biological treatment of the original waste is applied. An example is the granulation of used tyres
or of plastic waste for a second use as a filling material in construction. A third kind of recycling is oriented
towards processing of wastes into basic chemicals and their use in the production processes. Examples are the
gasification of plastics components for the production of methanol or the use of scrap metals from old cars in
steel manufacture.
For basic information on these waste management activities and their influence on climate, first a typical waste
composition should be considered, which comprises the waste components most likely to have the greatest
impact in GHGs.
Following 16 materials (see table 25) can be considered as most important under the aspects of
quantity generated,
potential contribution to methane production if deposited in a landfill
different energy and material use for manufacturing a certain product from virgin or from recycled
material.
They represent about two thirds of the US waste.
Tab 25 Municipal solid waste components comprising two thirds of total waste (in USA, 2004), (7)
Material Mass percent
Corrugated Cardboard 13,0
Yard trimmings 12,0
Food discards 11,2
Newspaper 6,5
Glass 5,5
Dimensional Lumber 3,4
Magazines/Third class Mail 3,3
Office Paper 3,2
HDPE 1,6
LDPE 1,3
Steel Cans 1,1
PET 0,8
Aluminum Cans 0,7
Textbooks 0,5
Phonebooks 0,3
10.2.2 GHG effects of source reduction and recycling
By means of source reduction or recycling, GHG emissions caused by making the material and managing the
post-consumer waste are avoided. Manufacturing from recycled material requires less energy, so that lower
GHG emissions occur compared with manufacturing from virgin inputs. With reference to GHG emissions,
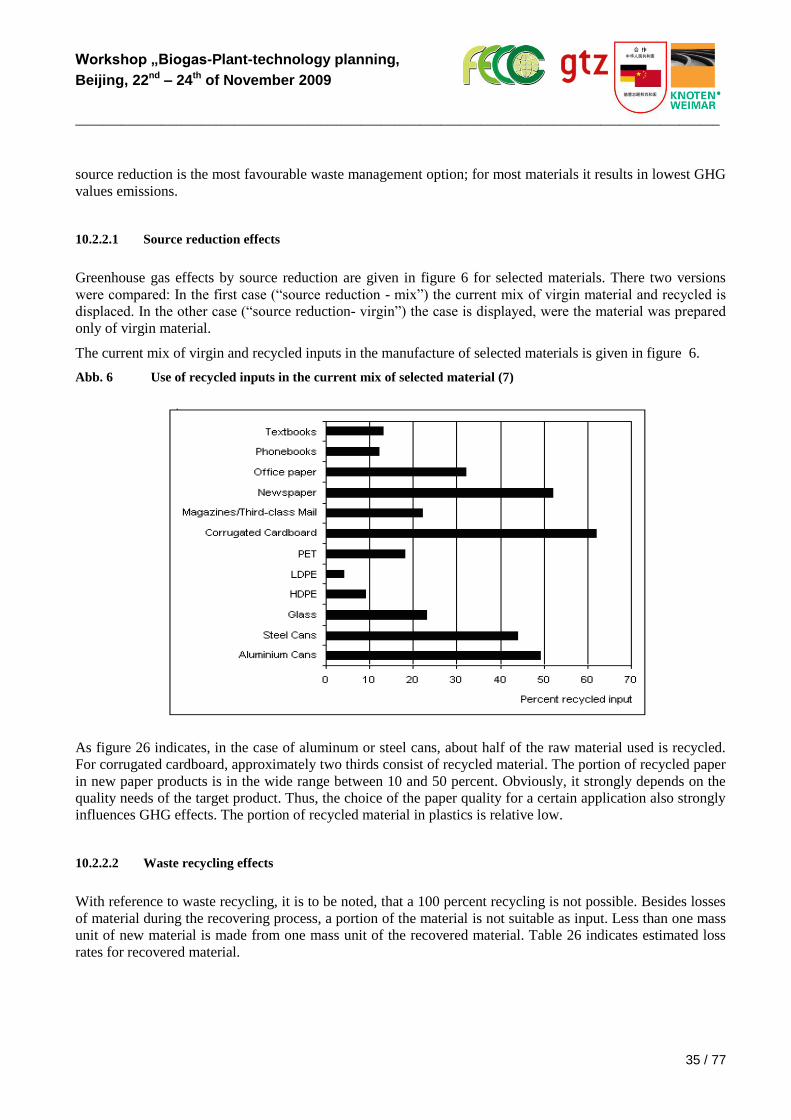
Workshop „Biogas-Plant-technology planning,
Beijing, 22nd – 24th of November 2009
_________________________________________________________________________________________________
35 / 77
source reduction is the most favourable waste management option; for most materials it results in lowest GHG
values emissions.
10.2.2.1 Source reduction effects
Greenhouse gas effects by source reduction are given in figure 6 for selected materials. There two versions
were compared: In the first case (“source reduction - mix”) the current mix of virgin material and recycled is
displaced. In the other case (“source reduction- virgin”) the case is displayed, were the material was prepared
only of virgin material.
The current mix of virgin and recycled inputs in the manufacture of selected materials is given in figure 6.
Abb. 6 Use of recycled inputs in the current mix of selected material (7)
As figure 26 indicates, in the case of aluminum or steel cans, about half of the raw material used is recycled.
For corrugated cardboard, approximately two thirds consist of recycled material. The portion of recycled paper
in new paper products is in the wide range between 10 and 50 percent. Obviously, it strongly depends on the
quality needs of the target product. Thus, the choice of the paper quality for a certain application also strongly
influences GHG effects. The portion of recycled material in plastics is relative low.
10.2.2.2 Waste recycling effects
With reference to waste recycling, it is to be noted, that a 100 percent recycling is not possible. Besides losses
of material during the recovering process, a portion of the material is not suitable as input. Less than one mass
unit of new material is made from one mass unit of the recovered material. Table 26 indicates estimated loss
rates for recovered material.
Workshop „Biogas-Plant-technology planning,
Beijing, 22nd – 24th of November 2009
_________________________________________________________________________________________________
36 / 77
Tab 26 Loss rates for recovered material (7)
Material Recovered
material
retained in the
recovery stage
(percent)
Product made
per ton of
recycled inputs
in the
manufacturing
stage
Loss rate
(t product made
per t recovered
materials)
Steel cans 100 0.98 0,98
Aluminum cans 100 0,93 0,93
Corrugated Cardboard 100 0,93 0,93
Newspaper 95 0,94 0,90
Glass 90 0,98 0,88
Dimensional Lumber 88 0,91 0,80
Medium-density fiberboard 88 0,91 0,80
HDPE 90 0,86 0,78
LDPE 90 0,86 0,78
PET 90 0,86 0,78
Phonebooks 95 0,71 0,68
Magazines/Third Class Mail 95 0,71 0,67
Textbooks 95 0,69 0,66
Office paper 91 0,66 0,60
Calculation results of climate effects based on these assumptions are shown in figure 6 in terms of greenhouse
gas emission reduction. The numbers given as a per-ton basis characterize the improvement of emissions due
to a waste generation reference point, which is defined by the situation, that the material has already
undergone the acquisition of the raw material and the manufacturing phase.
For more GHG reduction dates from selected materials see chapter 11.8.
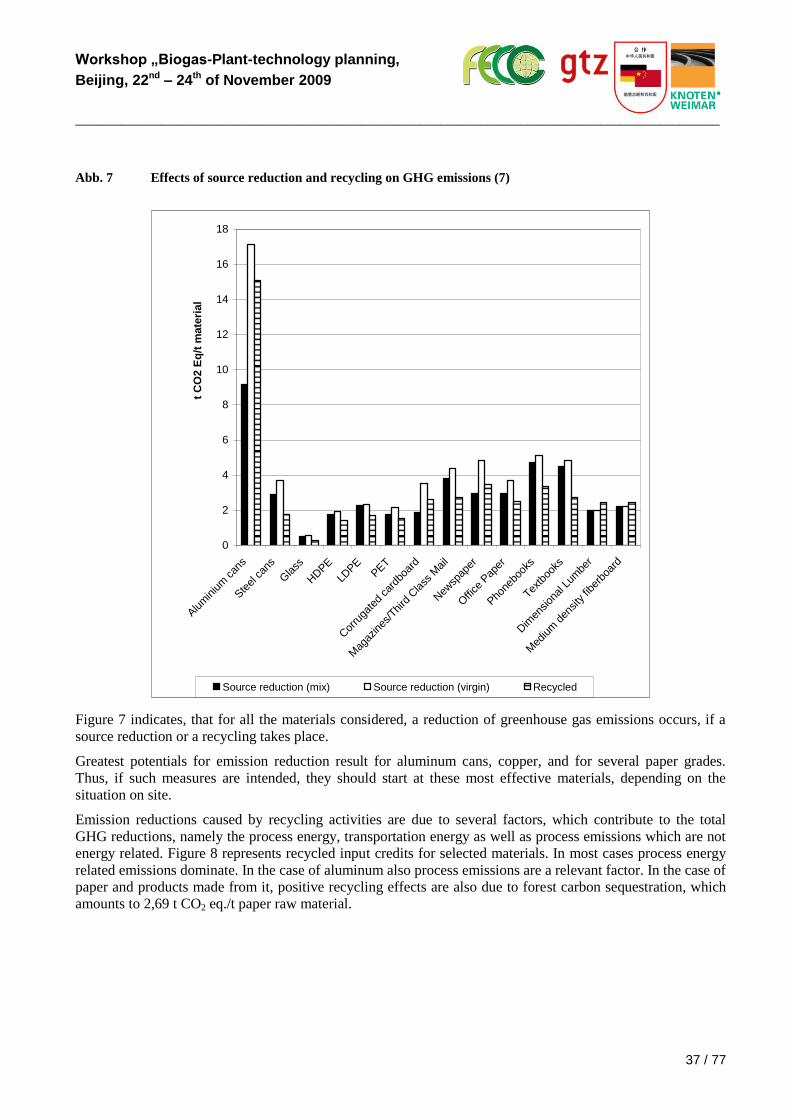
Workshop „Biogas-Plant-technology planning,
Beijing, 22nd – 24th of November 2009
_________________________________________________________________________________________________
37 / 77
Abb. 7 Effects of source reduction and recycling on GHG emissions (7)
0
2
4
6
8
10
12
14
16
18
Alum
inium
can
s
Ste
el can
s
Glass
HDPE
LDPE
PET
Cor
ruga
ted
card
boar
d
Mag
azines
/Third
Class
New
spap
er
Office
Pap
er
Pho
nebo
oks
Textb
ooks
Dim
ension
al L
umbe
r
Med
ium
den
sity fibe
rboa
rd
t C
O2 E
q/t
mate
rial
Source reduction (mix) Source reduction (virgin) Recycled
Figure 7 indicates, that for all the materials considered, a reduction of greenhouse gas emissions occurs, if a
source reduction or a recycling takes place.
Greatest potentials for emission reduction result for aluminum cans, copper, and for several paper grades.
Thus, if such measures are intended, they should start at these most effective materials, depending on the
situation on site.
Emission reductions caused by recycling activities are due to several factors, which contribute to the total
GHG reductions, namely the process energy, transportation energy as well as process emissions which are not
energy related. Figure 8 represents recycled input credits for selected materials. In most cases process energy
related emissions dominate. In the case of aluminum also process emissions are a relevant factor. In the case of
paper and products made from it, positive recycling effects are also due to forest carbon sequestration, which
amounts to 2,69 t CO2 eq./t paper raw material.
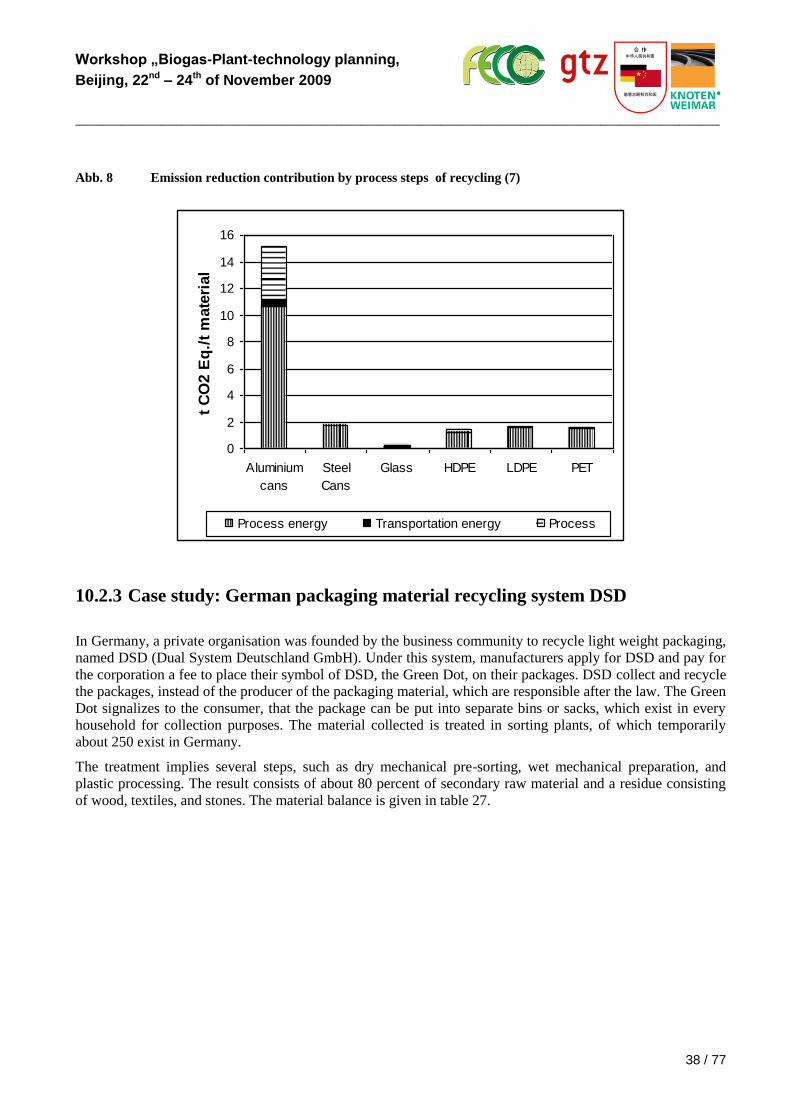
Workshop „Biogas-Plant-technology planning,
Beijing, 22nd – 24th of November 2009
_________________________________________________________________________________________________
38 / 77
Abb. 8 Emission reduction contribution by process steps of recycling (7)
0
2
4
6
8
10
12
14
16
Aluminium
cans
Steel
Cans
Glass HDPE LDPE PET
t C
O2 E
q./
t m
ate
rial
Process energy Transportation energy Process
10.2.3 Case study: German packaging material recycling system DSD
In Germany, a private organisation was founded by the business community to recycle light weight packaging,
named DSD (Dual System Deutschland GmbH). Under this system, manufacturers apply for DSD and pay for
the corporation a fee to place their symbol of DSD, the Green Dot, on their packages. DSD collect and recycle
the packages, instead of the producer of the packaging material, which are responsible after the law. The Green
Dot signalizes to the consumer, that the package can be put into separate bins or sacks, which exist in every
household for collection purposes. The material collected is treated in sorting plants, of which temporarily
about 250 exist in Germany.
The treatment implies several steps, such as dry mechanical pre-sorting, wet mechanical preparation, and
plastic processing. The result consists of about 80 percent of secondary raw material and a residue consisting
of wood, textiles, and stones. The material balance is given in table 27.
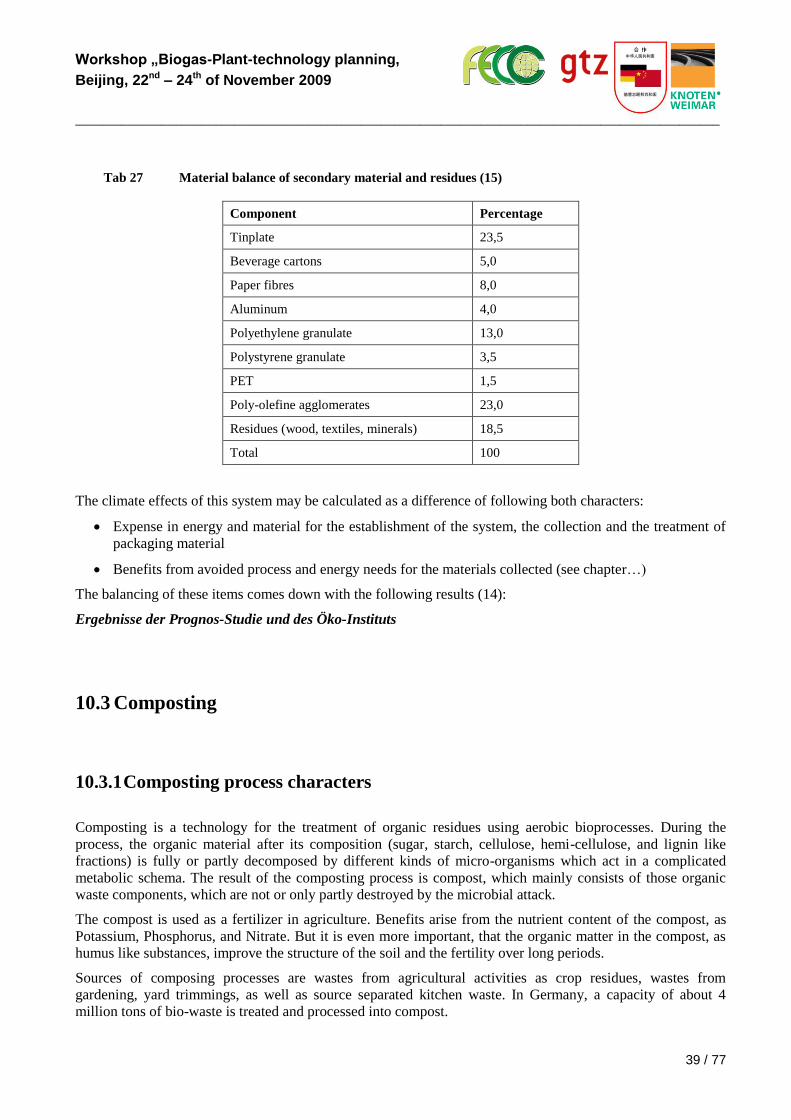
Workshop „Biogas-Plant-technology planning,
Beijing, 22nd – 24th of November 2009
_________________________________________________________________________________________________
39 / 77
Tab 27 Material balance of secondary material and residues (15)
Component Percentage
Tinplate 23,5
Beverage cartons 5,0
Paper fibres 8,0
Aluminum 4,0
Polyethylene granulate 13,0
Polystyrene granulate 3,5
PET 1,5
Poly-olefine agglomerates 23,0
Residues (wood, textiles, minerals) 18,5
Total 100
The climate effects of this system may be calculated as a difference of following both characters:
Expense in energy and material for the establishment of the system, the collection and the treatment of
packaging material
Benefits from avoided process and energy needs for the materials collected (see chapter…)
The balancing of these items comes down with the following results (14):
Ergebnisse der Prognos-Studie und des Öko-Instituts
10.3 Composting
10.3.1 Composting process characters
Composting is a technology for the treatment of organic residues using aerobic bioprocesses. During the
process, the organic material after its composition (sugar, starch, cellulose, hemi-cellulose, and lignin like
fractions) is fully or partly decomposed by different kinds of micro-organisms which act in a complicated
metabolic schema. The result of the composting process is compost, which mainly consists of those organic
waste components, which are not or only partly destroyed by the microbial attack.
The compost is used as a fertilizer in agriculture. Benefits arise from the nutrient content of the compost, as
Potassium, Phosphorus, and Nitrate. But it is even more important, that the organic matter in the compost, as
humus like substances, improve the structure of the soil and the fertility over long periods.
Sources of composing processes are wastes from agricultural activities as crop residues, wastes from
gardening, yard trimmings, as well as source separated kitchen waste. In Germany, a capacity of about 4
million tons of bio-waste is treated and processed into compost.
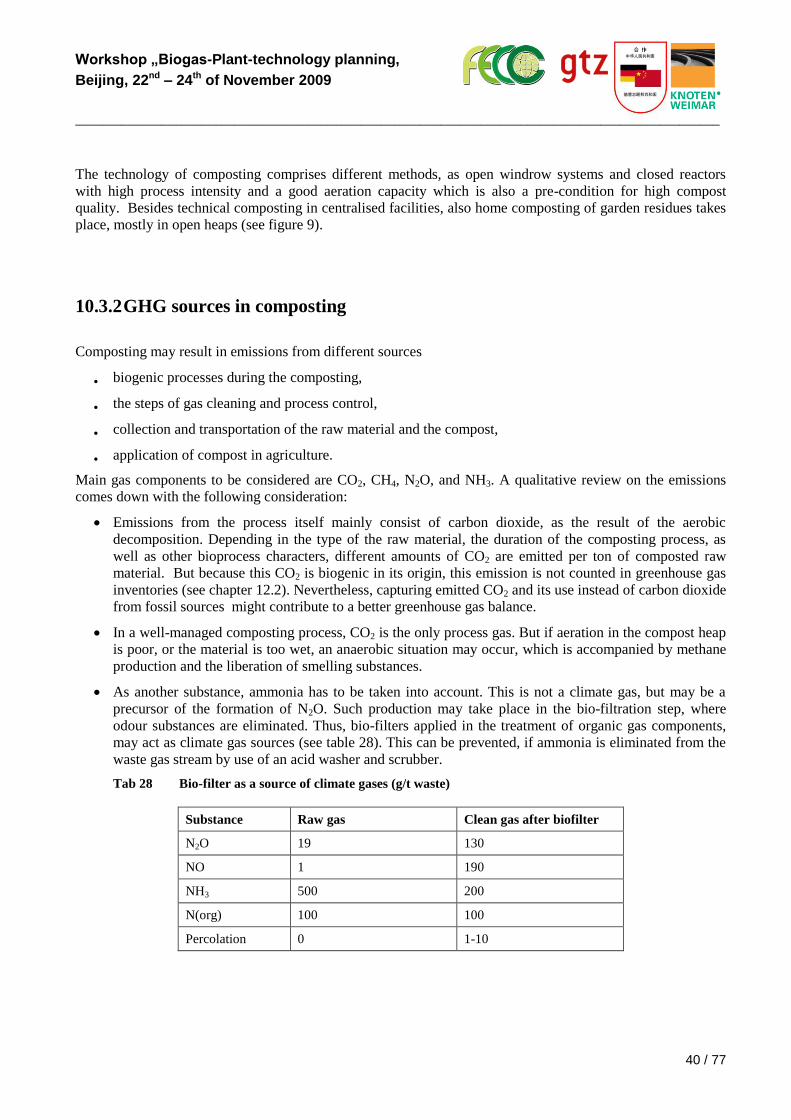
Workshop „Biogas-Plant-technology planning,
Beijing, 22nd – 24th of November 2009
_________________________________________________________________________________________________
40 / 77
The technology of composting comprises different methods, as open windrow systems and closed reactors
with high process intensity and a good aeration capacity which is also a pre-condition for high compost
quality. Besides technical composting in centralised facilities, also home composting of garden residues takes
place, mostly in open heaps (see figure 9).
10.3.2 GHG sources in composting
Composting may result in emissions from different sources
biogenic processes during the composting,
the steps of gas cleaning and process control,
collection and transportation of the raw material and the compost,
application of compost in agriculture.
Main gas components to be considered are CO2, CH4, N2O, and NH3. A qualitative review on the emissions
comes down with the following consideration:
Emissions from the process itself mainly consist of carbon dioxide, as the result of the aerobic
decomposition. Depending in the type of the raw material, the duration of the composting process, as
well as other bioprocess characters, different amounts of CO2 are emitted per ton of composted raw
material. But because this CO2 is biogenic in its origin, this emission is not counted in greenhouse gas
inventories (see chapter 12.2). Nevertheless, capturing emitted CO2 and its use instead of carbon dioxide
from fossil sources might contribute to a better greenhouse gas balance.
In a well-managed composting process, CO2 is the only process gas. But if aeration in the compost heap
is poor, or the material is too wet, an anaerobic situation may occur, which is accompanied by methane
production and the liberation of smelling substances.
As another substance, ammonia has to be taken into account. This is not a climate gas, but may be a
precursor of the formation of N2O. Such production may take place in the bio-filtration step, where
odour substances are eliminated. Thus, bio-filters applied in the treatment of organic gas components,
may act as climate gas sources (see table 28). This can be prevented, if ammonia is eliminated from the
waste gas stream by use of an acid washer and scrubber.
Tab 28 Bio-filter as a source of climate gases (g/t waste)
Substance Raw gas Clean gas after biofilter
N2O 19 130
NO 1 190
NH3 500 200
N(org) 100 100
Percolation 0 1-10
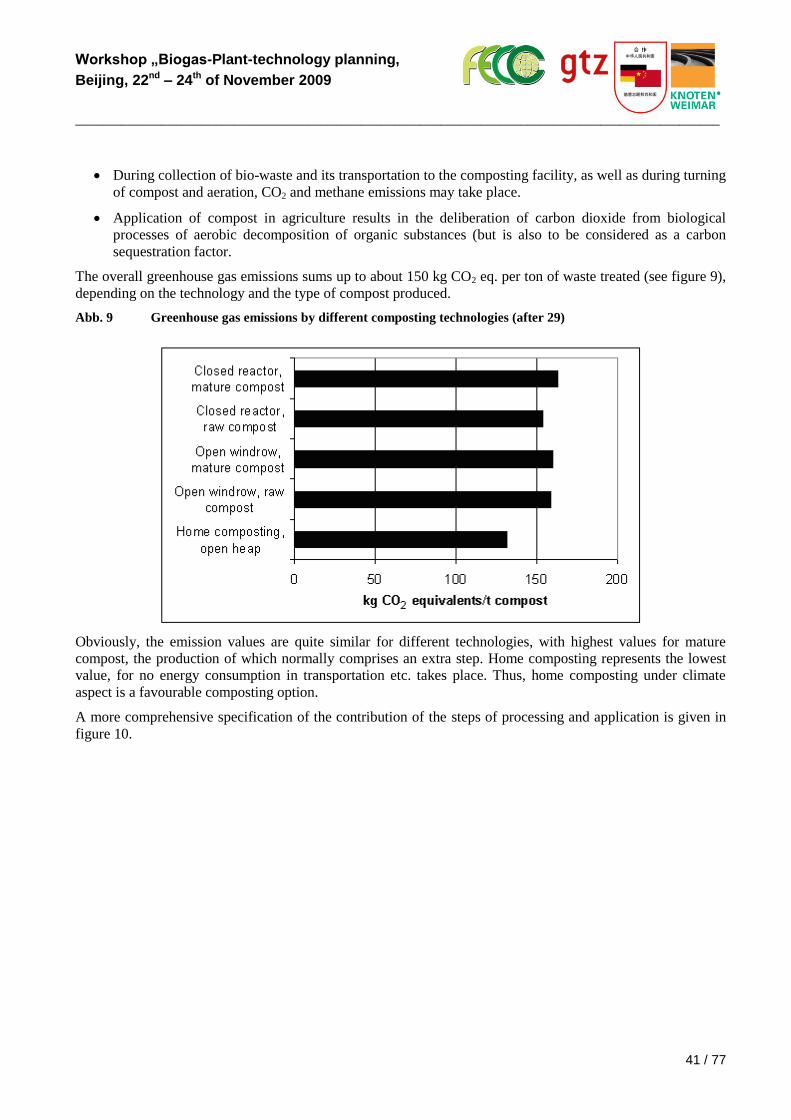
Workshop „Biogas-Plant-technology planning,
Beijing, 22nd – 24th of November 2009
_________________________________________________________________________________________________
41 / 77
During collection of bio-waste and its transportation to the composting facility, as well as during turning
of compost and aeration, CO2 and methane emissions may take place.
Application of compost in agriculture results in the deliberation of carbon dioxide from biological
processes of aerobic decomposition of organic substances (but is also to be considered as a carbon
sequestration factor.
The overall greenhouse gas emissions sums up to about 150 kg CO2 eq. per ton of waste treated (see figure 9),
depending on the technology and the type of compost produced.
Abb. 9 Greenhouse gas emissions by different composting technologies (after 29)
Obviously, the emission values are quite similar for different technologies, with highest values for mature
compost, the production of which normally comprises an extra step. Home composting represents the lowest
value, for no energy consumption in transportation etc. takes place. Thus, home composting under climate
aspect is a favourable composting option.
A more comprehensive specification of the contribution of the steps of processing and application is given in
figure 10.
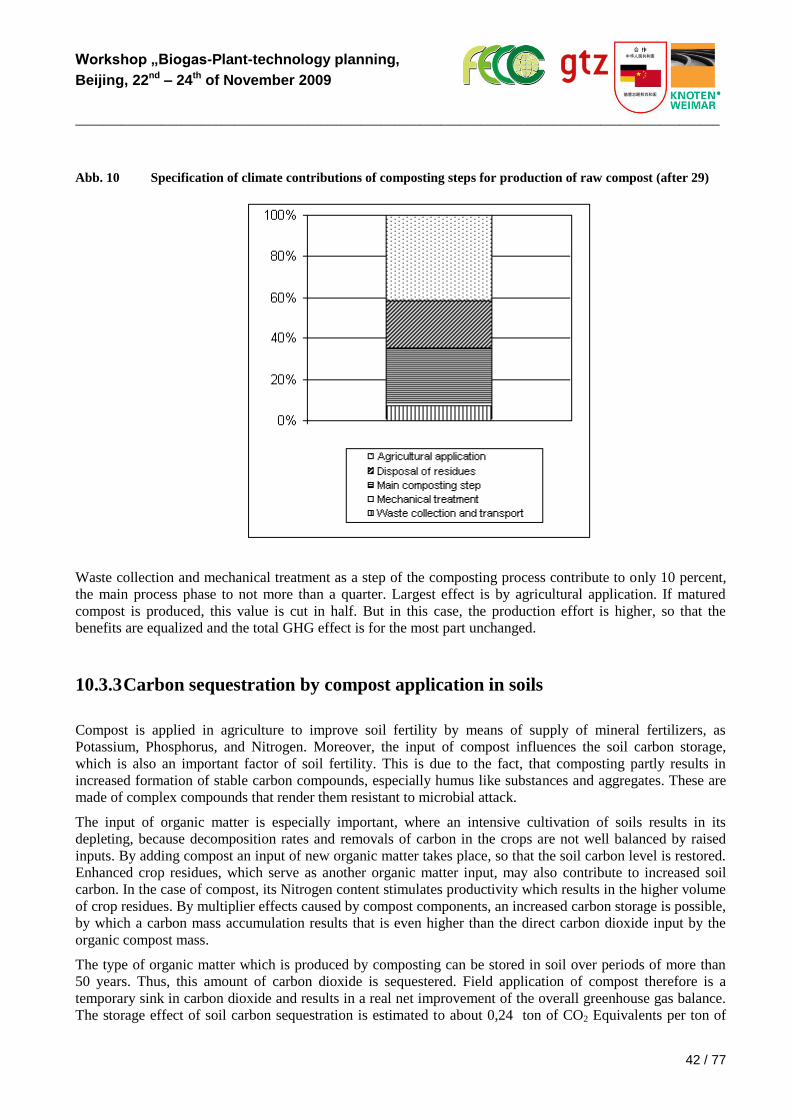
Workshop „Biogas-Plant-technology planning,
Beijing, 22nd – 24th of November 2009
_________________________________________________________________________________________________
42 / 77
Abb. 10 Specification of climate contributions of composting steps for production of raw compost (after 29)
Waste collection and mechanical treatment as a step of the composting process contribute to only 10 percent,
the main process phase to not more than a quarter. Largest effect is by agricultural application. If matured
compost is produced, this value is cut in half. But in this case, the production effort is higher, so that the
benefits are equalized and the total GHG effect is for the most part unchanged.
10.3.3 Carbon sequestration by compost application in soils
Compost is applied in agriculture to improve soil fertility by means of supply of mineral fertilizers, as
Potassium, Phosphorus, and Nitrogen. Moreover, the input of compost influences the soil carbon storage,
which is also an important factor of soil fertility. This is due to the fact, that composting partly results in
increased formation of stable carbon compounds, especially humus like substances and aggregates. These are
made of complex compounds that render them resistant to microbial attack.
The input of organic matter is especially important, where an intensive cultivation of soils results in its
depleting, because decomposition rates and removals of carbon in the crops are not well balanced by raised
inputs. By adding compost an input of new organic matter takes place, so that the soil carbon level is restored.
Enhanced crop residues, which serve as another organic matter input, may also contribute to increased soil
carbon. In the case of compost, its Nitrogen content stimulates productivity which results in the higher volume
of crop residues. By multiplier effects caused by compost components, an increased carbon storage is possible,
by which a carbon mass accumulation results that is even higher than the direct carbon dioxide input by the
organic compost mass.
The type of organic matter which is produced by composting can be stored in soil over periods of more than
50 years. Thus, this amount of carbon dioxide is sequestered. Field application of compost therefore is a
temporary sink in carbon dioxide and results in a real net improvement of the overall greenhouse gas balance.
The storage effect of soil carbon sequestration is estimated to about 0,24 ton of CO2 Equivalents per ton of
Workshop „Biogas-Plant-technology planning,
Beijing, 22nd – 24th of November 2009
_________________________________________________________________________________________________
43 / 77
compost applied (7). Taking into account a total CO2 emission of about 0,15 t, there a benefit for the total
greenhouse balance of about 0,1 ton CO2 equivalents per ton of compost produced results.
10.3.4 Use of composting CO2 as greenhouse fertilizer
If compost born CO2 instead of fossil derived carbon dioxide could be applied in production processes, a net
reduction of the GHG balance would be possible. As was mentioned, a total of about 150 kg CO2 (see figure 8)
is emitted per ton of compost raw material. Thus, in a facility with a capacity of 100.000 ton annual, about
15.000 tons of carbon dioxide is produced. In Germany, CO2 from composting totals to about one million tons
carbon dioxide, which could be used instead of fossil derived CO2.
A sensible solution is the application in greenhouses, where crops are fertilized by CO2 to improve the yields
by about 30-40 percent with a CO2 input of 100 tons per hectare annually. Actually, the CO2 is from gas
burners or is industrially produced. If compost CO2 is used, by a medium sized composting facility an area of
about 150 hectares could be fully fertilized by self produced CO2. As another advantage, the residues from the
greenhouse crop can be applied as raw material in the composting process. Moreover, renewable heat energy,
produced by the composting process can be used for heating the greenhouse, hence avoiding climate gas
missions from fossil fuel for greenhouse heating (5).
10.4 Climate effects of waste deposition in landfills
Waste deposition in landfills is the final step in the waste management hierarchy.
The climatic effects from landfills mainly result from
landfill gas emissions, especially methane emissions, as a result of microbial decaying processes of
organic matter in the waste deposited in the landfill,
waste transportation on the landfill site,
carbon sequestration in the landfill body by forming stable carbon structures.
10.4.1 Climatic effects by landfill gas emissions
Landfill gas contributes to the global methane emissions to about 13 percent with a total amount of 842
Million tons of CO2 eq. per year (in 2000, 8). Nearly half of the total emissions stem from four countries:
USA, China, Russia, and Mexico (see table 29).
Workshop „Biogas-Plant-technology planning,
Beijing, 22nd – 24th of November 2009
_________________________________________________________________________________________________
44 / 77
Tab 29 Annual landfill Methane emissions by 10 most relevant countries (in 2000 and estimations for
2020, in Mio t CO2 eq. (8)
Country 2000 2020
USA 199,3 145,2
Russian Federation 51,1 45,3
China 44,6 49,7
Mexico 31,0 39,2
Ukraine 25,2 37,4
Canada 22,8 33,5
Poland 17,0 17,0
Brazil 15,6 19,0
Australia 14,8 22,0
Germany 14,4 4,4
In the U.S., were 1800 operational landfills exist, annual landfill gas emissions of 140,9 Mio ton CO2 eq. by
2004 (9) are approximately the same as the total of the Kyoto protocol gases of industrial origin (see table 10).
There, the landfill gas emissions account for 34 percent of all anthropogenic methane emissions.
The global growth is estimated to 19 percent between 2005 and 2020, mostly due to the raising amounts of
waste to be deposited under poor landfill management conditions in emerging countries and China, whereas
industrialized countries mostly have strict regulations to reduce methane emissions. Examples are the US
Landfill Rule (from 1999), or the EU Landfill Directive (from 2002). They principally include waste
management improvements, such as
waste reduction, re-use and recycling, such as reduction of organic content of waste by source
separation of organics,
pre-treatment of waste to reduce organic content prior to deposition, such as waste combustion or
mechanical-biological pre-treatment,
capturing landfill gas especially with use of its energy content in energy recovery systems for electricity
production.
10.4.1.1 Basics of landfill gas production
The processes of landfill gas production and emission are as follows: Organic compounds of waste such as
paper, food discharges, or yard trimmings are decomposed in a landfill just after being deposited in the landfill
body. Initially they are decomposed by aerobic micro-organisms. This process lasts as long as oxygen is
available in the waste mass, normally some months.
After its depletion, anaerobic processes start, which decompose the residual complex organic compounds into
smaller molecules by hydrolysis. In a two stage process, specialised bacteria produce organic acids, hydrogen
(H2), and CO2. Acidic acid as well as hydrogen are the substrates for the methane producing (methanogenic)
bacteria, which convert it into methane and CO2, which are the constituents of the landfill gas.
Typically, the landfill gas consists of 50 percent of methane and CO2 respectively, similar to biogas from
organic residues. In the case of landfill gas, the methane content is lower than in biogas due to dissolving of
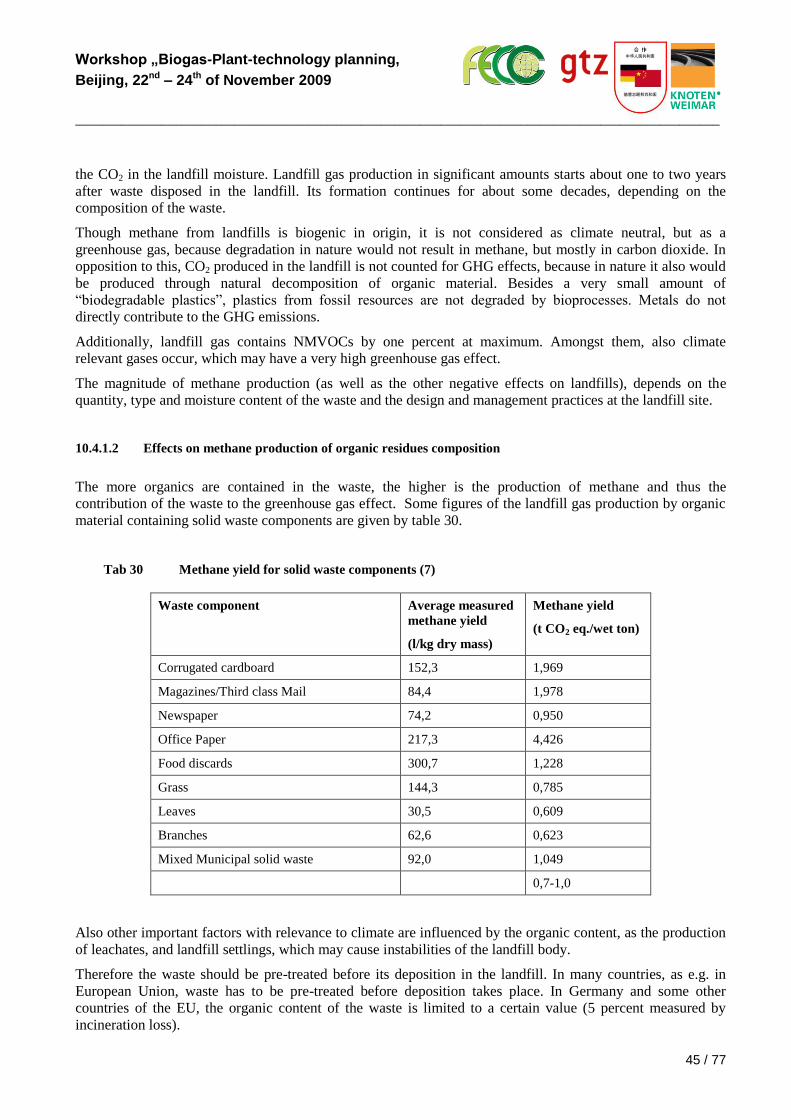
Workshop „Biogas-Plant-technology planning,
Beijing, 22nd – 24th of November 2009
_________________________________________________________________________________________________
45 / 77
the CO2 in the landfill moisture. Landfill gas production in significant amounts starts about one to two years
after waste disposed in the landfill. Its formation continues for about some decades, depending on the
composition of the waste.
Though methane from landfills is biogenic in origin, it is not considered as climate neutral, but as a
greenhouse gas, because degradation in nature would not result in methane, but mostly in carbon dioxide. In
opposition to this, CO2 produced in the landfill is not counted for GHG effects, because in nature it also would
be produced through natural decomposition of organic material. Besides a very small amount of
“biodegradable plastics”, plastics from fossil resources are not degraded by bioprocesses. Metals do not
directly contribute to the GHG emissions.
Additionally, landfill gas contains NMVOCs by one percent at maximum. Amongst them, also climate
relevant gases occur, which may have a very high greenhouse gas effect.
The magnitude of methane production (as well as the other negative effects on landfills), depends on the
quantity, type and moisture content of the waste and the design and management practices at the landfill site.
10.4.1.2 Effects on methane production of organic residues composition
The more organics are contained in the waste, the higher is the production of methane and thus the
contribution of the waste to the greenhouse gas effect. Some figures of the landfill gas production by organic
material containing solid waste components are given by table 30.
Tab 30 Methane yield for solid waste components (7)
Waste component Average measured
methane yield
(l/kg dry mass)
Methane yield
(t CO2 eq./wet ton)
Corrugated cardboard 152,3 1,969
Magazines/Third class Mail 84,4 1,978
Newspaper 74,2 0,950
Office Paper 217,3 4,426
Food discards 300,7 1,228
Grass 144,3 0,785
Leaves 30,5 0,609
Branches 62,6 0,623
Mixed Municipal solid waste 92,0 1,049
0,7-1,0
Also other important factors with relevance to climate are influenced by the organic content, as the production
of leachates, and landfill settlings, which may cause instabilities of the landfill body.
Therefore the waste should be pre-treated before its deposition in the landfill. In many countries, as e.g. in
European Union, waste has to be pre-treated before deposition takes place. In Germany and some other
countries of the EU, the organic content of the waste is limited to a certain value (5 percent measured by
incineration loss).
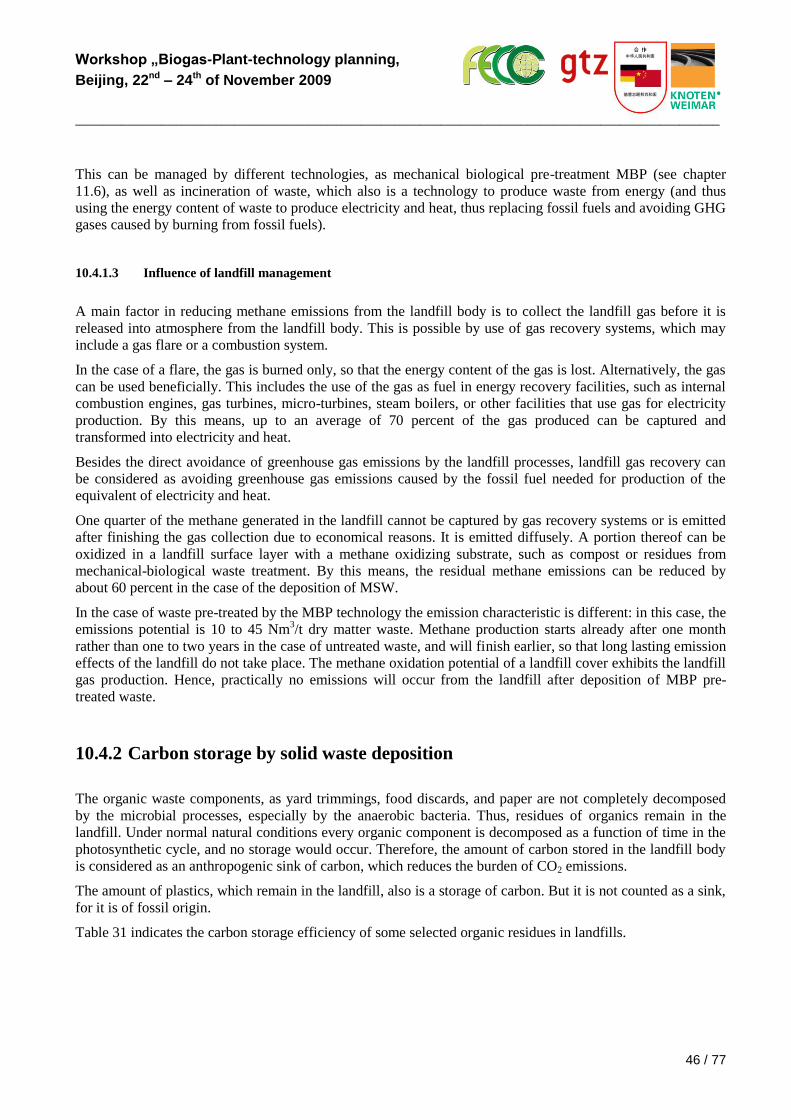
Workshop „Biogas-Plant-technology planning,
Beijing, 22nd – 24th of November 2009
_________________________________________________________________________________________________
46 / 77
This can be managed by different technologies, as mechanical biological pre-treatment MBP (see chapter
11.6), as well as incineration of waste, which also is a technology to produce waste from energy (and thus
using the energy content of waste to produce electricity and heat, thus replacing fossil fuels and avoiding GHG
gases caused by burning from fossil fuels).
10.4.1.3 Influence of landfill management
A main factor in reducing methane emissions from the landfill body is to collect the landfill gas before it is
released into atmosphere from the landfill body. This is possible by use of gas recovery systems, which may
include a gas flare or a combustion system.
In the case of a flare, the gas is burned only, so that the energy content of the gas is lost. Alternatively, the gas
can be used beneficially. This includes the use of the gas as fuel in energy recovery facilities, such as internal
combustion engines, gas turbines, micro-turbines, steam boilers, or other facilities that use gas for electricity
production. By this means, up to an average of 70 percent of the gas produced can be captured and
transformed into electricity and heat.
Besides the direct avoidance of greenhouse gas emissions by the landfill processes, landfill gas recovery can
be considered as avoiding greenhouse gas emissions caused by the fossil fuel needed for production of the
equivalent of electricity and heat.
One quarter of the methane generated in the landfill cannot be captured by gas recovery systems or is emitted
after finishing the gas collection due to economical reasons. It is emitted diffusely. A portion thereof can be
oxidized in a landfill surface layer with a methane oxidizing substrate, such as compost or residues from
mechanical-biological waste treatment. By this means, the residual methane emissions can be reduced by
about 60 percent in the case of the deposition of MSW.
In the case of waste pre-treated by the MBP technology the emission characteristic is different: in this case, the
emissions potential is 10 to 45 Nm3/t dry matter waste. Methane production starts already after one month
rather than one to two years in the case of untreated waste, and will finish earlier, so that long lasting emission
effects of the landfill do not take place. The methane oxidation potential of a landfill cover exhibits the landfill
gas production. Hence, practically no emissions will occur from the landfill after deposition of MBP pre-
treated waste.
10.4.2 Carbon storage by solid waste deposition
The organic waste components, as yard trimmings, food discards, and paper are not completely decomposed
by the microbial processes, especially by the anaerobic bacteria. Thus, residues of organics remain in the
landfill. Under normal natural conditions every organic component is decomposed as a function of time in the
photosynthetic cycle, and no storage would occur. Therefore, the amount of carbon stored in the landfill body
is considered as an anthropogenic sink of carbon, which reduces the burden of CO2 emissions.
The amount of plastics, which remain in the landfill, also is a storage of carbon. But it is not counted as a sink,
for it is of fossil origin.
Table 31 indicates the carbon storage efficiency of some selected organic residues in landfills.
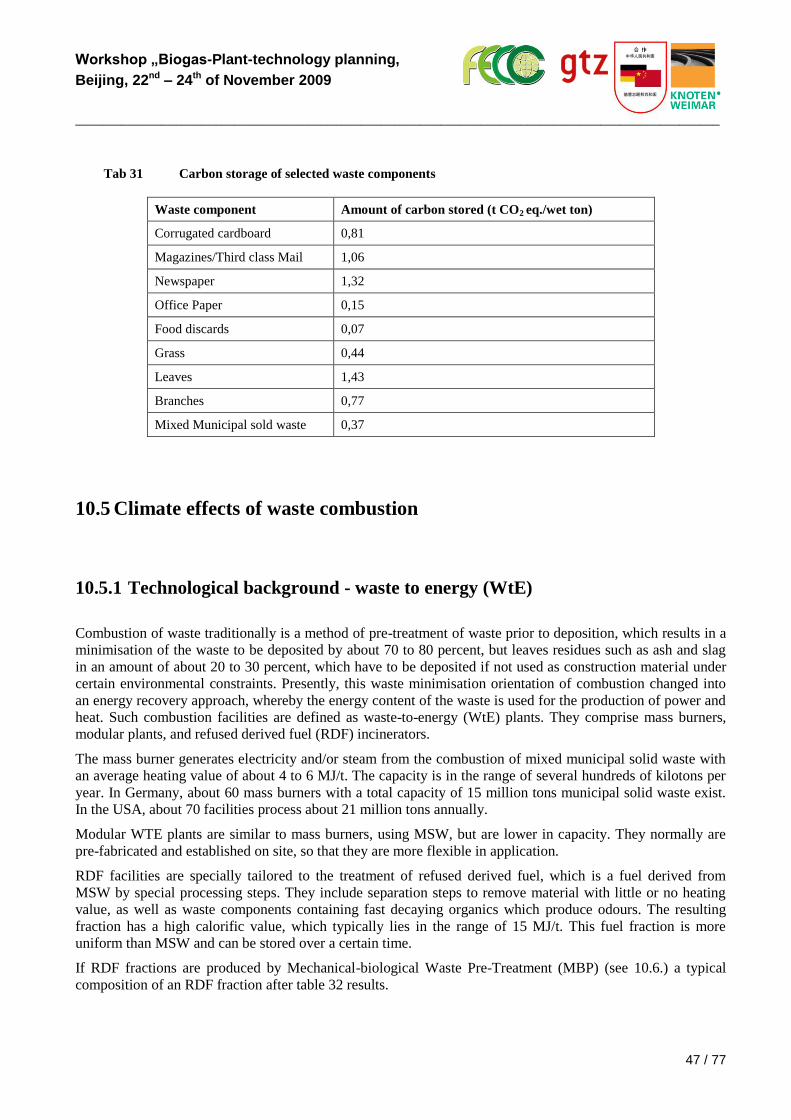
Workshop „Biogas-Plant-technology planning,
Beijing, 22nd – 24th of November 2009
_________________________________________________________________________________________________
47 / 77
Tab 31 Carbon storage of selected waste components
Waste component Amount of carbon stored (t CO2 eq./wet ton)
Corrugated cardboard 0,81
Magazines/Third class Mail 1,06
Newspaper 1,32
Office Paper 0,15
Food discards 0,07
Grass 0,44
Leaves 1,43
Branches 0,77
Mixed Municipal sold waste 0,37
10.5 Climate effects of waste combustion
10.5.1 Technological background - waste to energy (WtE)
Combustion of waste traditionally is a method of pre-treatment of waste prior to deposition, which results in a
minimisation of the waste to be deposited by about 70 to 80 percent, but leaves residues such as ash and slag
in an amount of about 20 to 30 percent, which have to be deposited if not used as construction material under
certain environmental constraints. Presently, this waste minimisation orientation of combustion changed into
an energy recovery approach, whereby the energy content of the waste is used for the production of power and
heat. Such combustion facilities are defined as waste-to-energy (WtE) plants. They comprise mass burners,
modular plants, and refused derived fuel (RDF) incinerators.
The mass burner generates electricity and/or steam from the combustion of mixed municipal solid waste with
an average heating value of about 4 to 6 MJ/t. The capacity is in the range of several hundreds of kilotons per
year. In Germany, about 60 mass burners with a total capacity of 15 million tons municipal solid waste exist.
In the USA, about 70 facilities process about 21 million tons annually.
Modular WTE plants are similar to mass burners, using MSW, but are lower in capacity. They normally are
pre-fabricated and established on site, so that they are more flexible in application.
RDF facilities are specially tailored to the treatment of refused derived fuel, which is a fuel derived from
MSW by special processing steps. They include separation steps to remove material with little or no heating
value, as well as waste components containing fast decaying organics which produce odours. The resulting
fraction has a high calorific value, which typically lies in the range of 15 MJ/t. This fuel fraction is more
uniform than MSW and can be stored over a certain time.
If RDF fractions are produced by Mechanical-biological Waste Pre-Treatment (MBP) (see 10.6.) a typical
composition of an RDF fraction after table 32 results.
Workshop „Biogas-Plant-technology planning,
Beijing, 22nd – 24th of November 2009
_________________________________________________________________________________________________
48 / 77
Tab 32 Output flow of the dry stabilate process (6)
Output fraction Percent of total input
Fraction for industrial re-use
RDF (calorific value 15-18 MJ/kg) 53
Ferrous metals 4
Non-ferrous metals 1
Batteries 0,05
White glass 5
Brown glass 0,5
Green glass 0,5
Minerals 4
Others
Fine grain and dust (to be deposited) 4
10.5.2 Climate effects by Combustion
Combustion is a chemical process which needs oxygen. Normally, oxygen is supplied by air, which in the
process is transferred into a waste gas containing the combustion products as well as non combusted residues
from the original waste. The amount of waste gas produced is about 5700 m3/t.
Climate effects by waste combustion result from
Direct emissions of CO2, pollutants, and indirect emissions,
Avoidance of greenhouse gas emissions caused by production of electricity and steam as well as
recovery of metals, glass, and other recyclables
Net greenhouse gas emissions result from addition of these effects.
10.5.2.1 CO2 and pollutant emissions
During the incineration process in the combustor, nearly all carbon substances of the waste are transferred into
CO2. Also in this case, the CO2 from the biogenic portion of the carbon in the waste is not counted as a
greenhouse gas. The average portion of biogenic organics is about 60 percent. Specific climate effect of CO2
from combustion is about 0,7 t CO2 eq./t MSW. In Germany, were about 15 million tons combusted, this for
instance amounts to 7,5 million t CO2 equivalents emitted annually.
Besides CO2, a broad variety of pollutants are emitted. Some of them are climate relevant, others are indirect
climate gases. A selection of such substances is given in table 33.
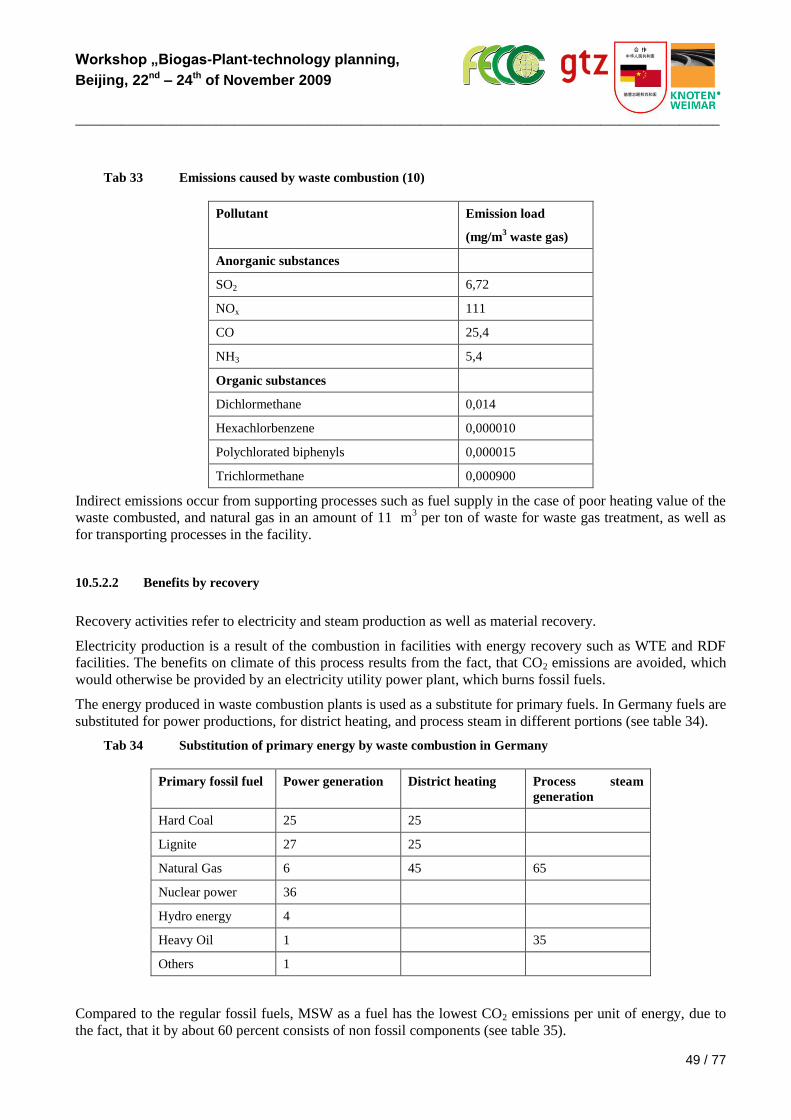
Workshop „Biogas-Plant-technology planning,
Beijing, 22nd – 24th of November 2009
_________________________________________________________________________________________________
49 / 77
Tab 33 Emissions caused by waste combustion (10)
Pollutant Emission load
(mg/m3 waste gas)
Anorganic substances
SO2 6,72
NOx 111
CO 25,4
NH3 5,4
Organic substances
Dichlormethane 0,014
Hexachlorbenzene 0,000010
Polychlorated biphenyls 0,000015
Trichlormethane 0,000900
Indirect emissions occur from supporting processes such as fuel supply in the case of poor heating value of the
waste combusted, and natural gas in an amount of 11 m3 per ton of waste for waste gas treatment, as well as
for transporting processes in the facility.
10.5.2.2 Benefits by recovery
Recovery activities refer to electricity and steam production as well as material recovery.
Electricity production is a result of the combustion in facilities with energy recovery such as WTE and RDF
facilities. The benefits on climate of this process results from the fact, that CO2 emissions are avoided, which
would otherwise be provided by an electricity utility power plant, which burns fossil fuels.
The energy produced in waste combustion plants is used as a substitute for primary fuels. In Germany fuels are
substituted for power productions, for district heating, and process steam in different portions (see table 34).
Tab 34 Substitution of primary energy by waste combustion in Germany
Primary fossil fuel Power generation District heating Process steam
generation
Hard Coal 25 25
Lignite 27 25
Natural Gas 6 45 65
Nuclear power 36
Hydro energy 4
Heavy Oil 1 35
Others 1
Compared to the regular fossil fuels, MSW as a fuel has the lowest CO2 emissions per unit of energy, due to
the fact, that it by about 60 percent consists of non fossil components (see table 35).
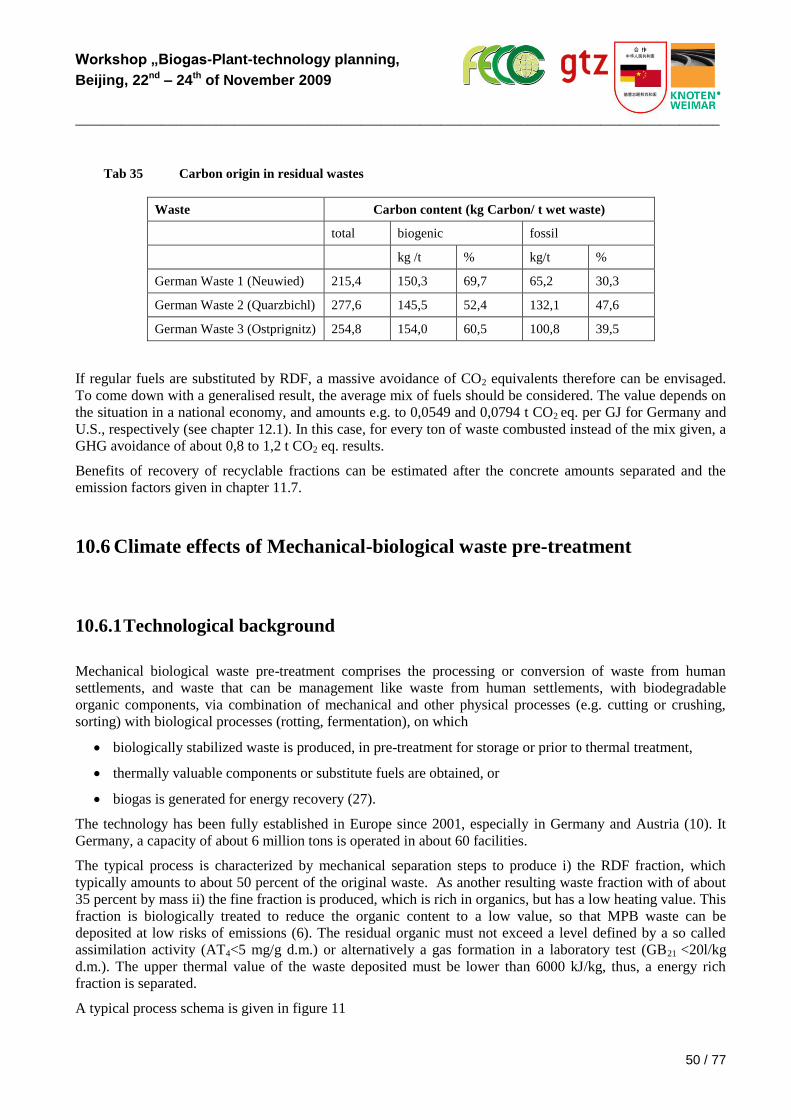
Workshop „Biogas-Plant-technology planning,
Beijing, 22nd – 24th of November 2009
_________________________________________________________________________________________________
50 / 77
Tab 35 Carbon origin in residual wastes
Waste Carbon content (kg Carbon/ t wet waste)
total biogenic fossil
kg /t % kg/t %
German Waste 1 (Neuwied) 215,4 150,3 69,7 65,2 30,3
German Waste 2 (Quarzbichl) 277,6 145,5 52,4 132,1 47,6
German Waste 3 (Ostprignitz) 254,8 154,0 60,5 100,8 39,5
If regular fuels are substituted by RDF, a massive avoidance of CO2 equivalents therefore can be envisaged.
To come down with a generalised result, the average mix of fuels should be considered. The value depends on
the situation in a national economy, and amounts e.g. to 0,0549 and 0,0794 t CO2 eq. per GJ for Germany and
U.S., respectively (see chapter 12.1). In this case, for every ton of waste combusted instead of the mix given, a
GHG avoidance of about 0,8 to 1,2 t CO2 eq. results.
Benefits of recovery of recyclable fractions can be estimated after the concrete amounts separated and the
emission factors given in chapter 11.7.
10.6 Climate effects of Mechanical-biological waste pre-treatment
10.6.1 Technological background
Mechanical biological waste pre-treatment comprises the processing or conversion of waste from human
settlements, and waste that can be management like waste from human settlements, with biodegradable
organic components, via combination of mechanical and other physical processes (e.g. cutting or crushing,
sorting) with biological processes (rotting, fermentation), on which
biologically stabilized waste is produced, in pre-treatment for storage or prior to thermal treatment,
thermally valuable components or substitute fuels are obtained, or
biogas is generated for energy recovery (27).
The technology has been fully established in Europe since 2001, especially in Germany and Austria (10). It
Germany, a capacity of about 6 million tons is operated in about 60 facilities.
The typical process is characterized by mechanical separation steps to produce i) the RDF fraction, which
typically amounts to about 50 percent of the original waste. As another resulting waste fraction with of about
35 percent by mass ii) the fine fraction is produced, which is rich in organics, but has a low heating value. This
fraction is biologically treated to reduce the organic content to a low value, so that MPB waste can be
deposited at low risks of emissions (6). The residual organic must not exceed a level defined by a so called
assimilation activity (AT4<5 mg/g d.m.) or alternatively a gas formation in a laboratory test (GB21 <20l/kg
d.m.). The upper thermal value of the waste deposited must be lower than 6000 kJ/kg, thus, a energy rich
fraction is separated.
A typical process schema is given in figure 11
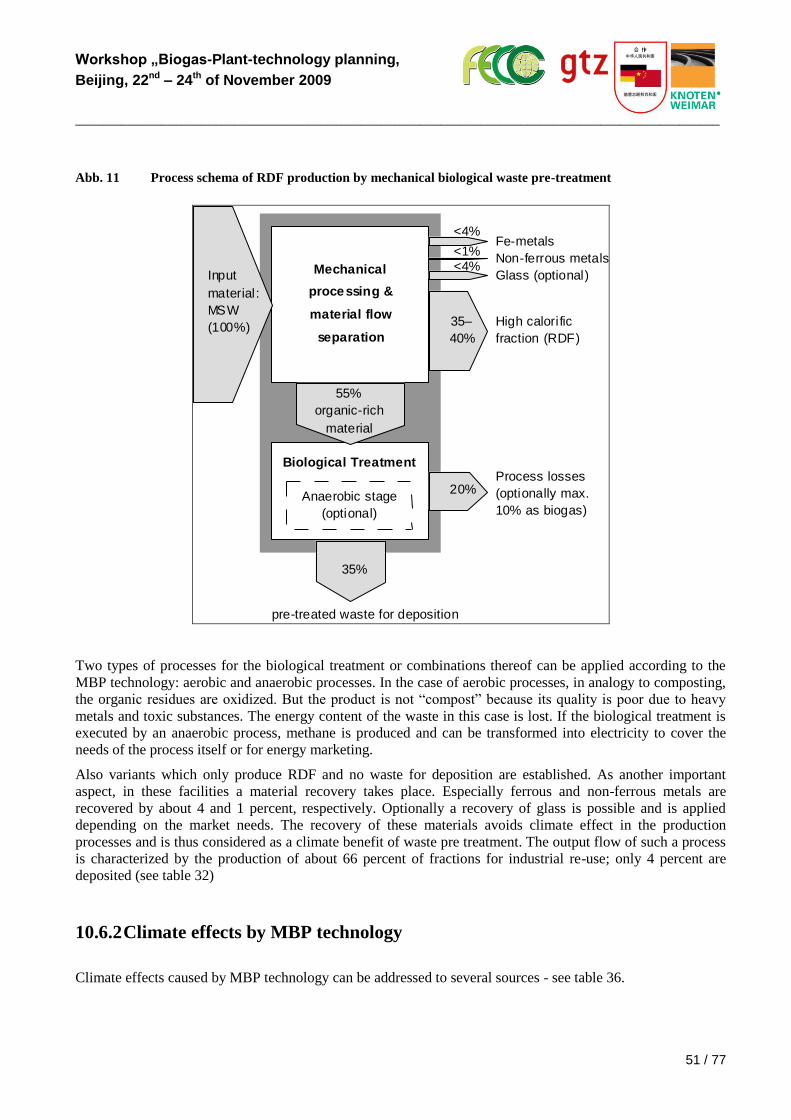
Workshop „Biogas-Plant-technology planning,
Beijing, 22nd – 24th of November 2009
_________________________________________________________________________________________________
51 / 77
Abb. 11 Process schema of RDF production by mechanical biological waste pre-treatment
High calorific
fraction (RDF)
Mechanical
processing &
material flow
separation
I n p u t
m a t e r i a l :
M S W
( 1 0 0 % )
Biological Treatment
Anaerobic stage
(optional)
55%
organic-rich
material
2 0 %
pre-treated waste for deposition
Process losses
(optionally max.
10% as biogas)
35%
35–
40%
Fe-metals
Non-ferrous metals
Glass (optional)
<1%
<4%
<4%
Two types of processes for the biological treatment or combinations thereof can be applied according to the
MBP technology: aerobic and anaerobic processes. In the case of aerobic processes, in analogy to composting,
the organic residues are oxidized. But the product is not “compost” because its quality is poor due to heavy
metals and toxic substances. The energy content of the waste in this case is lost. If the biological treatment is
executed by an anaerobic process, methane is produced and can be transformed into electricity to cover the
needs of the process itself or for energy marketing.
Also variants which only produce RDF and no waste for deposition are established. As another important
aspect, in these facilities a material recovery takes place. Especially ferrous and non-ferrous metals are
recovered by about 4 and 1 percent, respectively. Optionally a recovery of glass is possible and is applied
depending on the market needs. The recovery of these materials avoids climate effect in the production
processes and is thus considered as a climate benefit of waste pre treatment. The output flow of such a process
is characterized by the production of about 66 percent of fractions for industrial re-use; only 4 percent are
deposited (see table 32)
10.6.2 Climate effects by MBP technology
Climate effects caused by MBP technology can be addressed to several sources - see table 36.
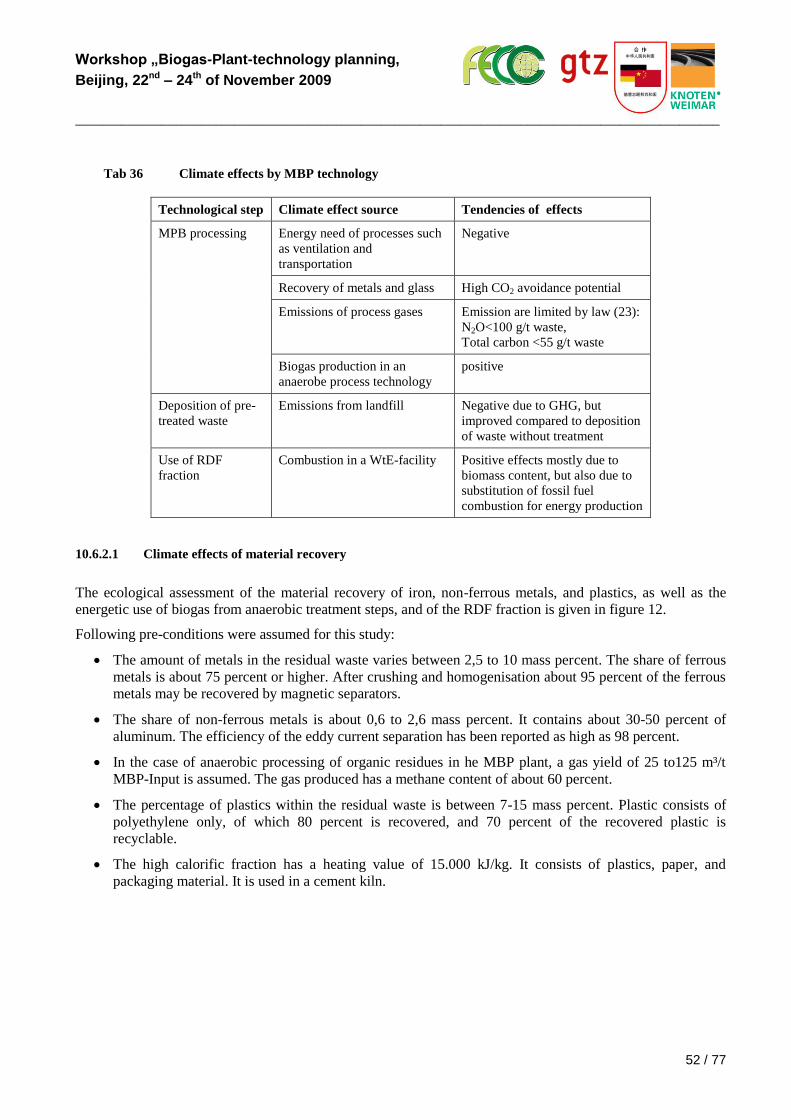
Workshop „Biogas-Plant-technology planning,
Beijing, 22nd – 24th of November 2009
_________________________________________________________________________________________________
52 / 77
Tab 36 Climate effects by MBP technology
Technological step Climate effect source Tendencies of effects
MPB processing Energy need of processes such
as ventilation and
transportation
Negative
Recovery of metals and glass High CO2 avoidance potential
Emissions of process gases Emission are limited by law (23):
N2O<100 g/t waste,
Total carbon <55 g/t waste
Biogas production in an
anaerobe process technology
positive
Deposition of pre-
treated waste
Emissions from landfill Negative due to GHG, but
improved compared to deposition
of waste without treatment
Use of RDF
fraction
Combustion in a WtE-facility Positive effects mostly due to
biomass content, but also due to
substitution of fossil fuel
combustion for energy production
10.6.2.1 Climate effects of material recovery
The ecological assessment of the material recovery of iron, non-ferrous metals, and plastics, as well as the
energetic use of biogas from anaerobic treatment steps, and of the RDF fraction is given in figure 12.
Following pre-conditions were assumed for this study:
The amount of metals in the residual waste varies between 2,5 to 10 mass percent. The share of ferrous
metals is about 75 percent or higher. After crushing and homogenisation about 95 percent of the ferrous
metals may be recovered by magnetic separators.
The share of non-ferrous metals is about 0,6 to 2,6 mass percent. It contains about 30-50 percent of
aluminum. The efficiency of the eddy current separation has been reported as high as 98 percent.
In the case of anaerobic processing of organic residues in he MBP plant, a gas yield of 25 to125 m³/t
MBP-Input is assumed. The gas produced has a methane content of about 60 percent.
The percentage of plastics within the residual waste is between 7-15 mass percent. Plastic consists of
polyethylene only, of which 80 percent is recovered, and 70 percent of the recovered plastic is
recyclable.
The high calorific fraction has a heating value of 15.000 kJ/kg. It consists of plastics, paper, and
packaging material. It is used in a cement kiln.
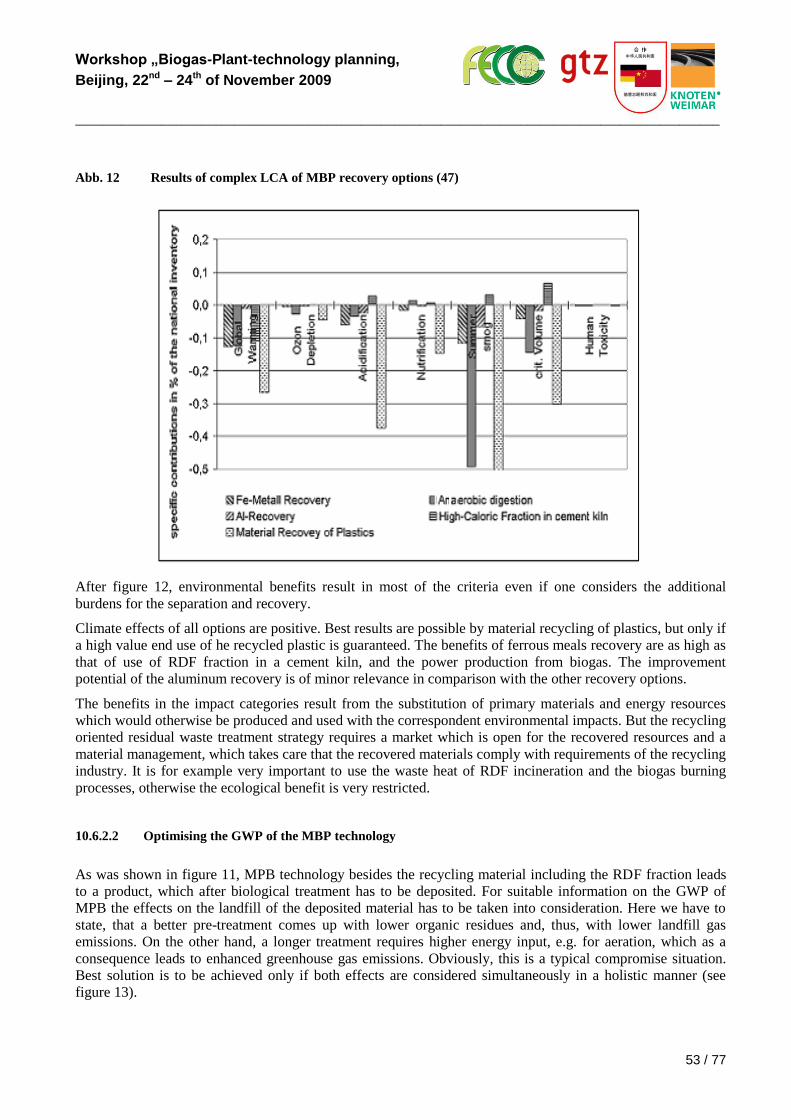
Workshop „Biogas-Plant-technology planning,
Beijing, 22nd – 24th of November 2009
_________________________________________________________________________________________________
53 / 77
Abb. 12 Results of complex LCA of MBP recovery options (47)
After figure 12, environmental benefits result in most of the criteria even if one considers the additional
burdens for the separation and recovery.
Climate effects of all options are positive. Best results are possible by material recycling of plastics, but only if
a high value end use of he recycled plastic is guaranteed. The benefits of ferrous meals recovery are as high as
that of use of RDF fraction in a cement kiln, and the power production from biogas. The improvement
potential of the aluminum recovery is of minor relevance in comparison with the other recovery options.
The benefits in the impact categories result from the substitution of primary materials and energy resources
which would otherwise be produced and used with the correspondent environmental impacts. But the recycling
oriented residual waste treatment strategy requires a market which is open for the recovered resources and a
material management, which takes care that the recovered materials comply with requirements of the recycling
industry. It is for example very important to use the waste heat of RDF incineration and the biogas burning
processes, otherwise the ecological benefit is very restricted.
10.6.2.2 Optimising the GWP of the MBP technology
As was shown in figure 11, MPB technology besides the recycling material including the RDF fraction leads
to a product, which after biological treatment has to be deposited. For suitable information on the GWP of
MPB the effects on the landfill of the deposited material has to be taken into consideration. Here we have to
state, that a better pre-treatment comes up with lower organic residues and, thus, with lower landfill gas
emissions. On the other hand, a longer treatment requires higher energy input, e.g. for aeration, which as a
consequence leads to enhanced greenhouse gas emissions. Obviously, this is a typical compromise situation.
Best solution is to be achieved only if both effects are considered simultaneously in a holistic manner (see
figure 13).
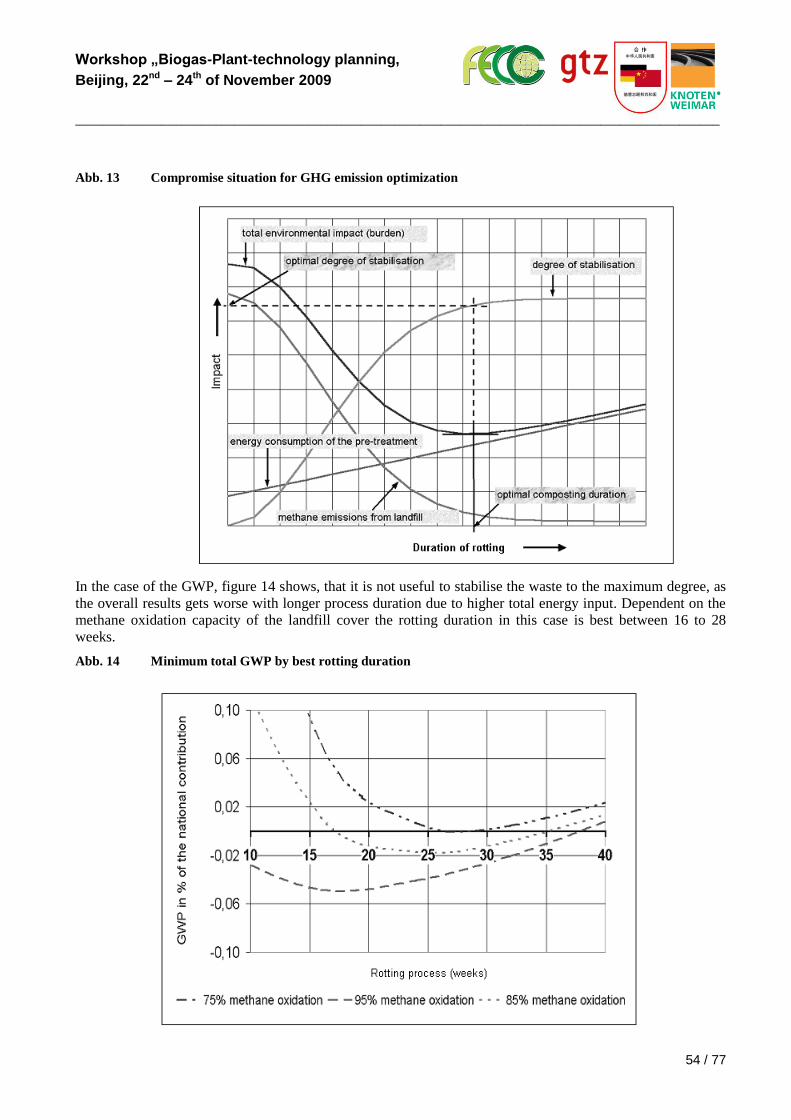
Workshop „Biogas-Plant-technology planning,
Beijing, 22nd – 24th of November 2009
_________________________________________________________________________________________________
54 / 77
Abb. 13 Compromise situation for GHG emission optimization
In the case of the GWP, figure 14 shows, that it is not useful to stabilise the waste to the maximum degree, as
the overall results gets worse with longer process duration due to higher total energy input. Dependent on the
methane oxidation capacity of the landfill cover the rotting duration in this case is best between 16 to 28
weeks.
Abb. 14 Minimum total GWP by best rotting duration
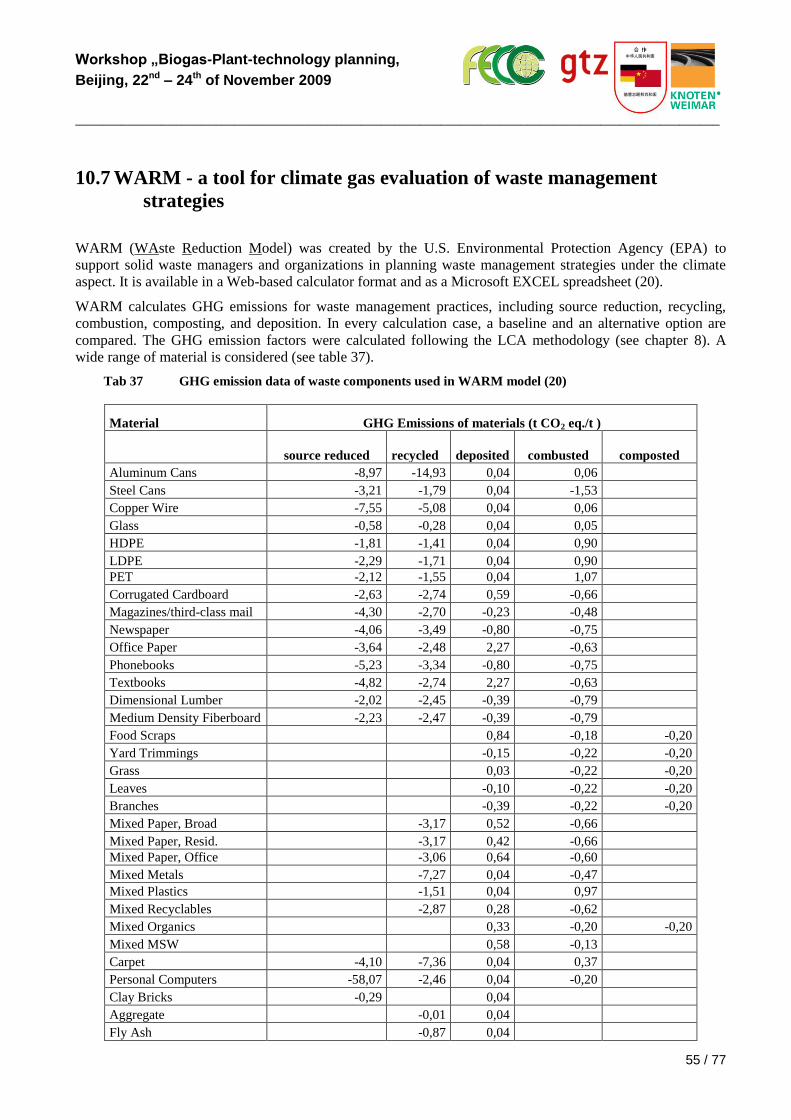
Workshop „Biogas-Plant-technology planning,
Beijing, 22nd – 24th of November 2009
_________________________________________________________________________________________________
55 / 77
10.7 WARM - a tool for climate gas evaluation of waste management
strategies
WARM (WAste Reduction Model) was created by the U.S. Environmental Protection Agency (EPA) to
support solid waste managers and organizations in planning waste management strategies under the climate
aspect. It is available in a Web-based calculator format and as a Microsoft EXCEL spreadsheet (20).
WARM calculates GHG emissions for waste management practices, including source reduction, recycling,
combustion, composting, and deposition. In every calculation case, a baseline and an alternative option are
compared. The GHG emission factors were calculated following the LCA methodology (see chapter 8). A
wide range of material is considered (see table 37).
Tab 37 GHG emission data of waste components used in WARM model (20)
Material GHG Emissions of materials (t CO2 eq./t )
source reduced recycled deposited combusted composted
Aluminum Cans -8,97 -14,93 0,04 0,06
Steel Cans -3,21 -1,79 0,04 -1,53
Copper Wire -7,55 -5,08 0,04 0,06
Glass -0,58 -0,28 0,04 0,05
HDPE -1,81 -1,41 0,04 0,90
LDPE -2,29 -1,71 0,04 0,90
PET -2,12 -1,55 0,04 1,07
Corrugated Cardboard -2,63 -2,74 0,59 -0,66
Magazines/third-class mail -4,30 -2,70 -0,23 -0,48
Newspaper -4,06 -3,49 -0,80 -0,75
Office Paper -3,64 -2,48 2,27 -0,63
Phonebooks -5,23 -3,34 -0,80 -0,75
Textbooks -4,82 -2,74 2,27 -0,63
Dimensional Lumber -2,02 -2,45 -0,39 -0,79
Medium Density Fiberboard -2,23 -2,47 -0,39 -0,79
Food Scraps 0,84 -0,18 -0,20
Yard Trimmings -0,15 -0,22 -0,20
Grass 0,03 -0,22 -0,20
Leaves -0,10 -0,22 -0,20
Branches -0,39 -0,22 -0,20
Mixed Paper, Broad -3,17 0,52 -0,66
Mixed Paper, Resid. -3,17 0,42 -0,66
Mixed Paper, Office -3,06 0,64 -0,60
Mixed Metals -7,27 0,04 -0,47
Mixed Plastics -1,51 0,04 0,97
Mixed Recyclables -2,87 0,28 -0,62
Mixed Organics 0,33 -0,20 -0,20
Mixed MSW 0,58 -0,13
Carpet -4,10 -7,36 0,04 0,37
Personal Computers -58,07 -2,46 0,04 -0,20
Clay Bricks -0,29 0,04
Aggregate -0,01 0,04
Fly Ash -0,87 0,04
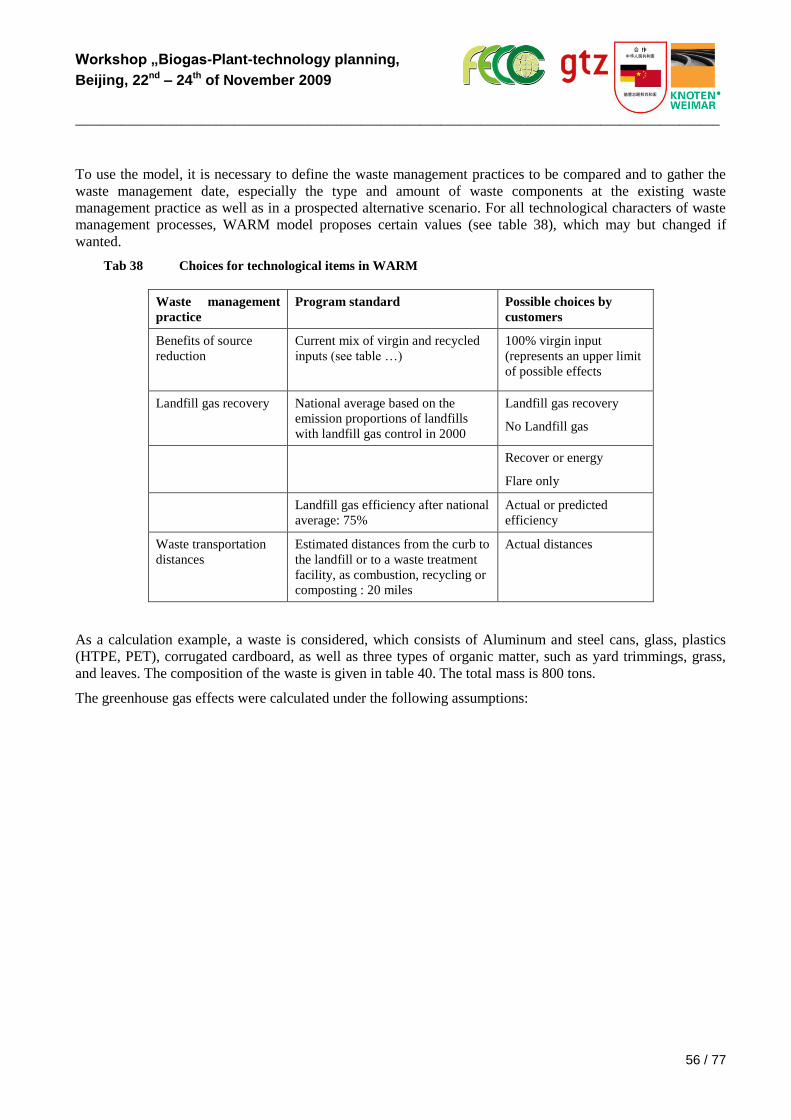
Workshop „Biogas-Plant-technology planning,
Beijing, 22nd – 24th of November 2009
_________________________________________________________________________________________________
56 / 77
To use the model, it is necessary to define the waste management practices to be compared and to gather the
waste management date, especially the type and amount of waste components at the existing waste
management practice as well as in a prospected alternative scenario. For all technological characters of waste
management processes, WARM model proposes certain values (see table 38), which may but changed if
wanted.
Tab 38 Choices for technological items in WARM
Waste management
practice
Program standard Possible choices by
customers
Benefits of source
reduction
Current mix of virgin and recycled
inputs (see table …)
100% virgin input
(represents an upper limit
of possible effects
Landfill gas recovery National average based on the
emission proportions of landfills
with landfill gas control in 2000
Landfill gas recovery
No Landfill gas
Recover or energy
Flare only
Landfill gas efficiency after national
average: 75%
Actual or predicted
efficiency
Waste transportation
distances
Estimated distances from the curb to
the landfill or to a waste treatment
facility, as combustion, recycling or
composting : 20 miles
Actual distances
As a calculation example, a waste is considered, which consists of Aluminum and steel cans, glass, plastics
(HTPE, PET), corrugated cardboard, as well as three types of organic matter, such as yard trimmings, grass,
and leaves. The composition of the waste is given in table 40. The total mass is 800 tons.
The greenhouse gas effects were calculated under the following assumptions:
Workshop „Biogas-Plant-technology planning,
Beijing, 22nd – 24th of November 2009
_________________________________________________________________________________________________
57 / 77
The waste was deposited in a landfill, which is equipped with a landfill gas recovery system for
electricity production. Land fill gas collection efficiency is 75 percent.
Greenhouse gas emissions of deposition, recycling, combustion, composting, and source reduction are
calculated after table 37.
Benefits of recycling were calculated in comparison to the current mix of recycled and virgin matter in
manufacturing (see figure 6)
Following scenarios were studies (see table 39):
Tab 39 Description of scenarios
Scenario Description
0 Reference scenario: whole waste deposited
1 recycling of 50 percent of the waste components, without organic green
matter
2 Same as 1, but total composting of the organic matter
3 Same as 2, but 50 percent of the plastics and the corrugated cardboard
are combusted
4 Same as 3, but no recycling, 100 percent combusted
5 Same as 2, but no combustion, 100 percent recycling
6 Same as 2, but 25 percent of aluminum and steel cans deposited and 25
percent source reduced
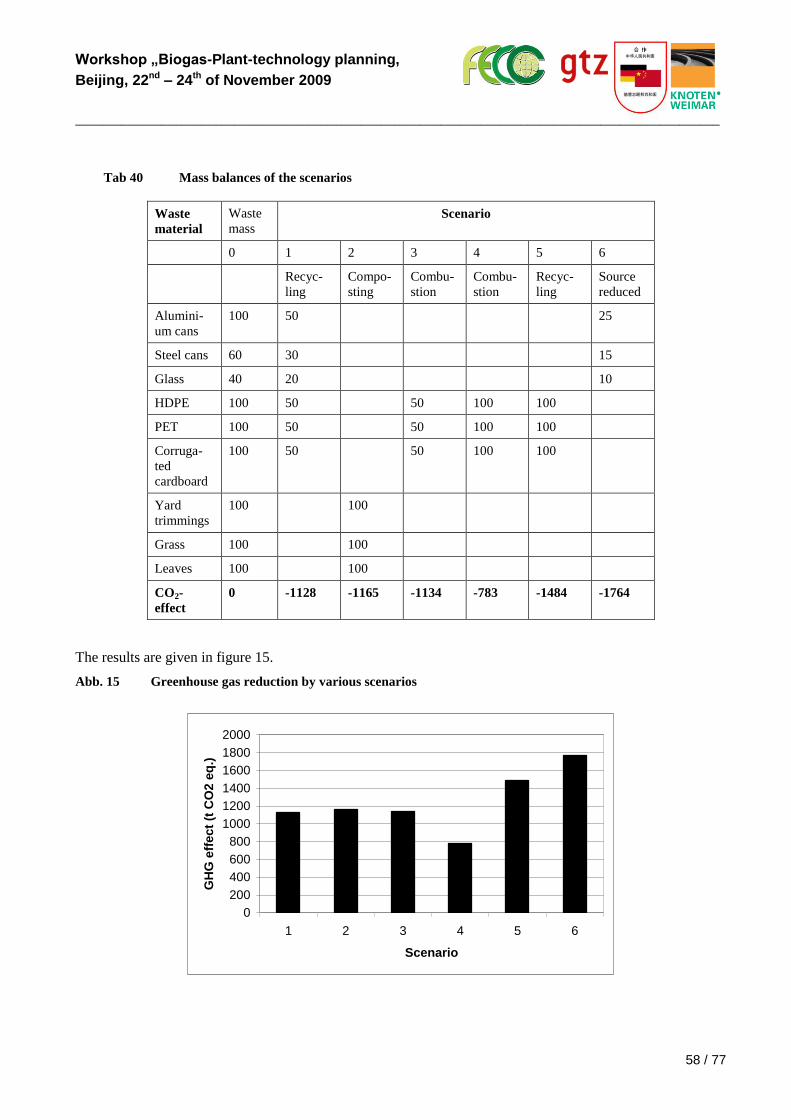
Workshop „Biogas-Plant-technology planning,
Beijing, 22nd – 24th of November 2009
_________________________________________________________________________________________________
58 / 77
Tab 40 Mass balances of the scenarios
Waste
material
Waste
mass
Scenario
0 1 2 3 4 5 6
Recyc-
ling
Compo-
sting
Combu-
stion
Combu-
stion
Recyc-
ling
Source
reduced
Alumini-
um cans
100 50 25
Steel cans 60 30 15
Glass 40 20 10
HDPE 100 50 50 100 100
PET 100 50 50 100 100
Corruga-
ted
cardboard
100 50 50 100 100
Yard
trimmings
100 100
Grass 100 100
Leaves 100 100
CO2-
effect
0 -1128 -1165 -1134 -783 -1484 -1764
The results are given in figure 15.
Abb. 15 Greenhouse gas reduction by various scenarios
0
200
400
600
800
1000
1200
1400
1600
1800
2000
1 2 3 4 5 6
Scenario
GH
G e
ffe
ct
(t C
O2
eq
.)
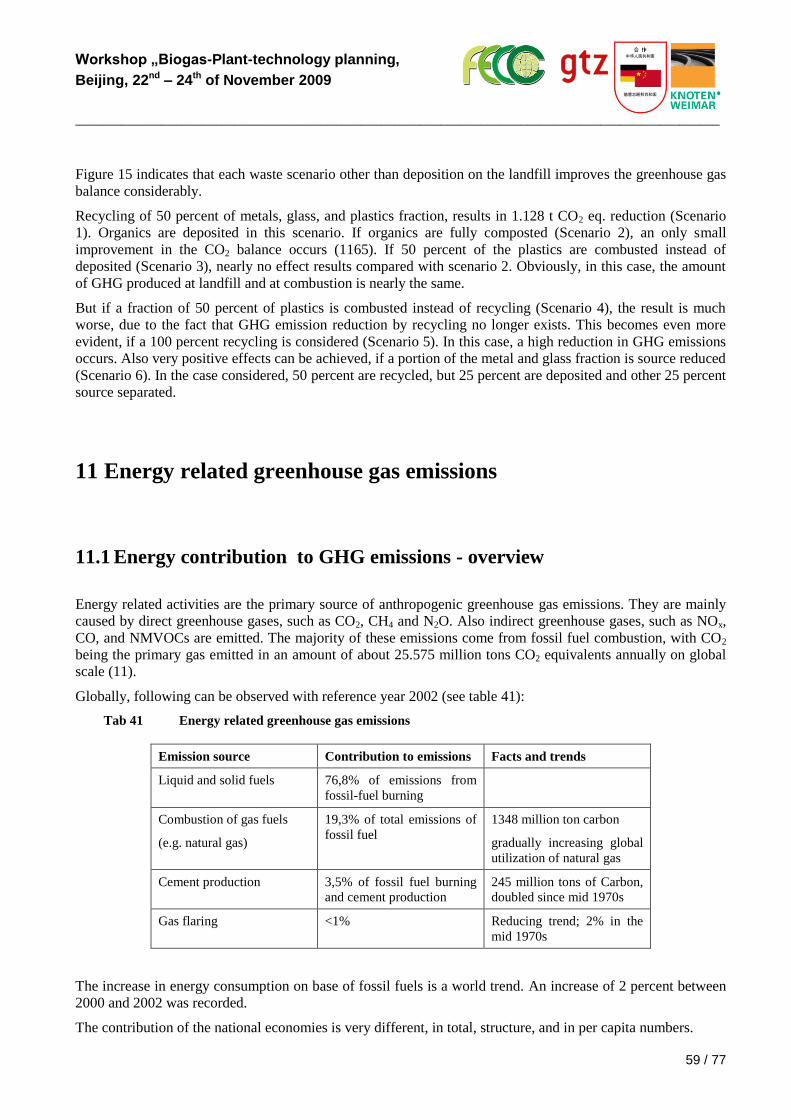
Workshop „Biogas-Plant-technology planning,
Beijing, 22nd – 24th of November 2009
_________________________________________________________________________________________________
59 / 77
Figure 15 indicates that each waste scenario other than deposition on the landfill improves the greenhouse gas
balance considerably.
Recycling of 50 percent of metals, glass, and plastics fraction, results in 1.128 t CO2 eq. reduction (Scenario
1). Organics are deposited in this scenario. If organics are fully composted (Scenario 2), an only small
improvement in the CO2 balance occurs (1165). If 50 percent of the plastics are combusted instead of
deposited (Scenario 3), nearly no effect results compared with scenario 2. Obviously, in this case, the amount
of GHG produced at landfill and at combustion is nearly the same.
But if a fraction of 50 percent of plastics is combusted instead of recycling (Scenario 4), the result is much
worse, due to the fact that GHG emission reduction by recycling no longer exists. This becomes even more
evident, if a 100 percent recycling is considered (Scenario 5). In this case, a high reduction in GHG emissions
occurs. Also very positive effects can be achieved, if a portion of the metal and glass fraction is source reduced
(Scenario 6). In the case considered, 50 percent are recycled, but 25 percent are deposited and other 25 percent
source separated.
11 Energy related greenhouse gas emissions
11.1 Energy contribution to GHG emissions - overview
Energy related activities are the primary source of anthropogenic greenhouse gas emissions. They are mainly
caused by direct greenhouse gases, such as CO2, CH4 and N2O. Also indirect greenhouse gases, such as NOx,
CO, and NMVOCs are emitted. The majority of these emissions come from fossil fuel combustion, with CO2
being the primary gas emitted in an amount of about 25.575 million tons CO2 equivalents annually on global
scale (11).
Globally, following can be observed with reference year 2002 (see table 41):
Tab 41 Energy related greenhouse gas emissions
Emission source Contribution to emissions Facts and trends
Liquid and solid fuels 76,8% of emissions from
fossil-fuel burning
Combustion of gas fuels
(e.g. natural gas)
19,3% of total emissions of
fossil fuel
1348 million ton carbon
gradually increasing global
utilization of natural gas
Cement production 3,5% of fossil fuel burning
and cement production
245 million tons of Carbon,
doubled since mid 1970s
Gas flaring <1% Reducing trend; 2% in the
mid 1970s
The increase in energy consumption on base of fossil fuels is a world trend. An increase of 2 percent between
2000 and 2002 was recorded.
The contribution of the national economies is very different, in total, structure, and in per capita numbers.
Workshop „Biogas-Plant-technology planning,
Beijing, 22nd – 24th of November 2009
_________________________________________________________________________________________________
60 / 77
The contribution of the United States in the CO2 emissions is about 23 percent of the global emissions
(28). Energy related activities accounted for 86 percent of total U.S. emissions (in 2004), measured on
CO2 eq.-base, amongst them CO2-emissions contribute to 82 percent, whereas non-CO2-emissions from
energy related activities represent only 4 percent. 97, 39, and 15 percent of the nation’s CO2, CH4 and
N2O emissions, respectively, are included in this number. US energy mix is based on 40,1percent
petroleum, 22,5% coal, 23,0% natural gas, 8,2% nuclear, and 6,1% renewable. U.S. power plant GHG
emissions total to 2,65 billion tons of CO2 eq.(22). The emissions of the national average fuel mix for
electricity is 0,0549 t CO2 eq./GJ electricity produced (or 15,79 kg carbon eq. per million Btu).
In Germany, fossil-fuel emissions of CO2 have declined 18,1 percent since 1990 to about 800 million
ton of CO2 eq. (in 2002). This means an average per capita emission of about less than 10 ton of CO2,
which is comparable to mid 1950s levels. Largest fraction of emissions (40,4 percent) is from burning of
solid fuels. Natural gas burning is 21,5 percent of the total emissions. The energy mix for power
production is given in table 42. From the date by using an energy efficiency factor for power production
of 28,6 percent, a factor of 0,0794 t CO2 eq./GJ results.
Tab 42 Power production energy mix in Germany (in 2000) (%) (10)
Hard
coal
Lignite Oil Natural
gas
Nuclear
energy
Hydro
Power
Others
25 27 1 6 36 4 1
Amongst other Western European Countries, United Kingdom is emitting about 15,7 ton CO2 per capita
annually (2002), compared to France with only about 6,2 (22).
Africa's fossil-fuel CO2 emissions are low in both absolute and per capita terms. They are not reaching
900 million ton of CO2 eq. in 2002. Per capita emissions are only about 5 percent of the comparable
value for North America. Fuels account for 15,6 percent. The emissions are mostly due to the activities
of only a few countries, amongst them South Africa accounts for 40% of the continental total, and
another 44% of the CO2 comes from Egypt, Algeria, Nigeria, Libya and Morocco combined.
In Thailand, the total consumption of fossil fuels is about 232 million tons CO2 eq. annually (2002) with
a per capita rate of 3,7 ton per head. The consumption more the doubles very 10 years. Cement
production actually contributes to less than 2 percent.
Besides combustion of fuel, also all other energy related activities such as production, transmission, storage,
and distribution of fossil fuels, emit greenhouse gases. These emissions mostly originate from fugitive
methane from natural gas and petroleum systems, and coal mining. During these processes, also CO2 as a
direct greenhouse gas, as well as CO, NOx and NMVOCs are emitted, but in smaller quantities.
The industrial end use sector includes activities such as manufacturing, construction, mining, and agriculture.
Manufacturing is the largest consumer of energy. Six industries comprising petroleum refineries, chemicals,
primary metals, paper, food, and nonmetallic mineral products, represent the majority of energy use.
In the case of the United States, the industrial end use sector accounts for 28 percent of CO2 emissions from
fossil fuel combustion, from which 54 result from the direct consumption of fossil fuels for steam and process
heat. The other part (46 percent) is used for consumption of electricity for uses such as motors, electrical
furnaces, and lighting - see figure 16.
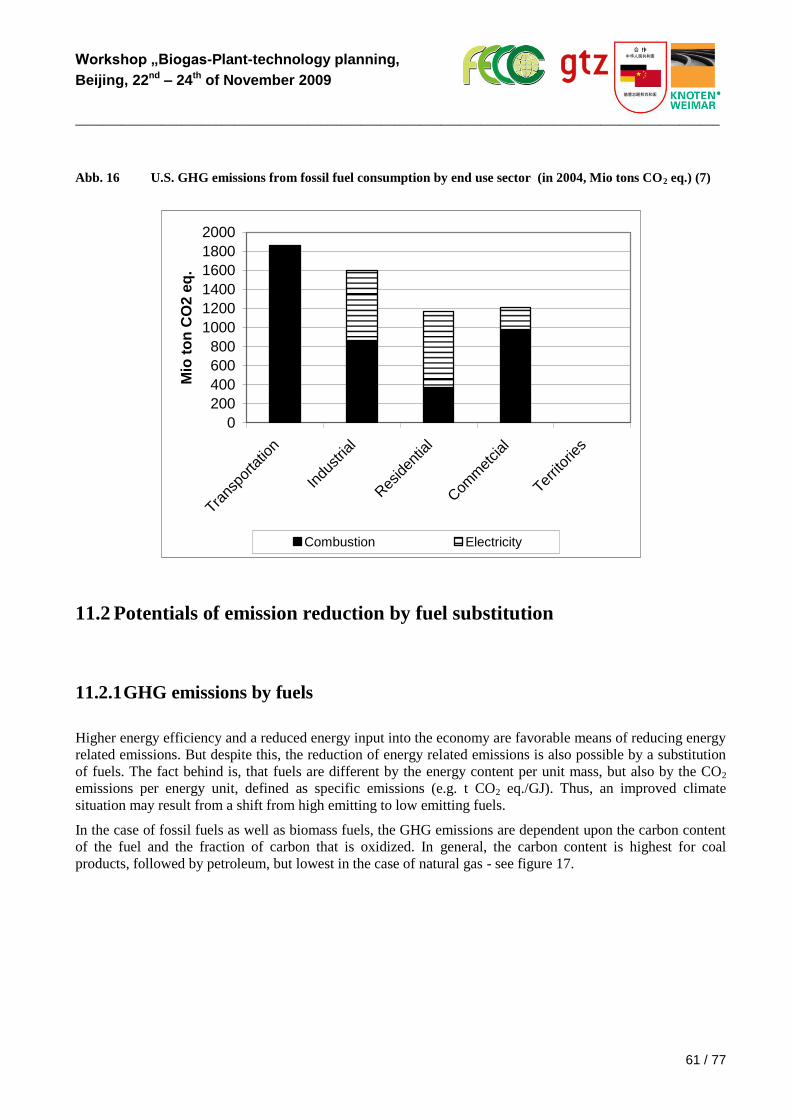
Workshop „Biogas-Plant-technology planning,
Beijing, 22nd – 24th of November 2009
_________________________________________________________________________________________________
61 / 77
Abb. 16 U.S. GHG emissions from fossil fuel consumption by end use sector (in 2004, Mio tons CO2 eq.) (7)
0
200
400
600
800
1000
1200
1400
1600
1800
2000
Trans
porta
tion
Indu
stria
l
Res
iden
tial
Com
met
cial
Territ
ories
Mio
to
n C
O2 e
q.
Combustion Electricity
11.2 Potentials of emission reduction by fuel substitution
11.2.1 GHG emissions by fuels
Higher energy efficiency and a reduced energy input into the economy are favorable means of reducing energy
related emissions. But despite this, the reduction of energy related emissions is also possible by a substitution
of fuels. The fact behind is, that fuels are different by the energy content per unit mass, but also by the CO2
emissions per energy unit, defined as specific emissions (e.g. t CO2 eq./GJ). Thus, an improved climate
situation may result from a shift from high emitting to low emitting fuels.
In the case of fossil fuels as well as biomass fuels, the GHG emissions are dependent upon the carbon content
of the fuel and the fraction of carbon that is oxidized. In general, the carbon content is highest for coal
products, followed by petroleum, but lowest in the case of natural gas - see figure 17.
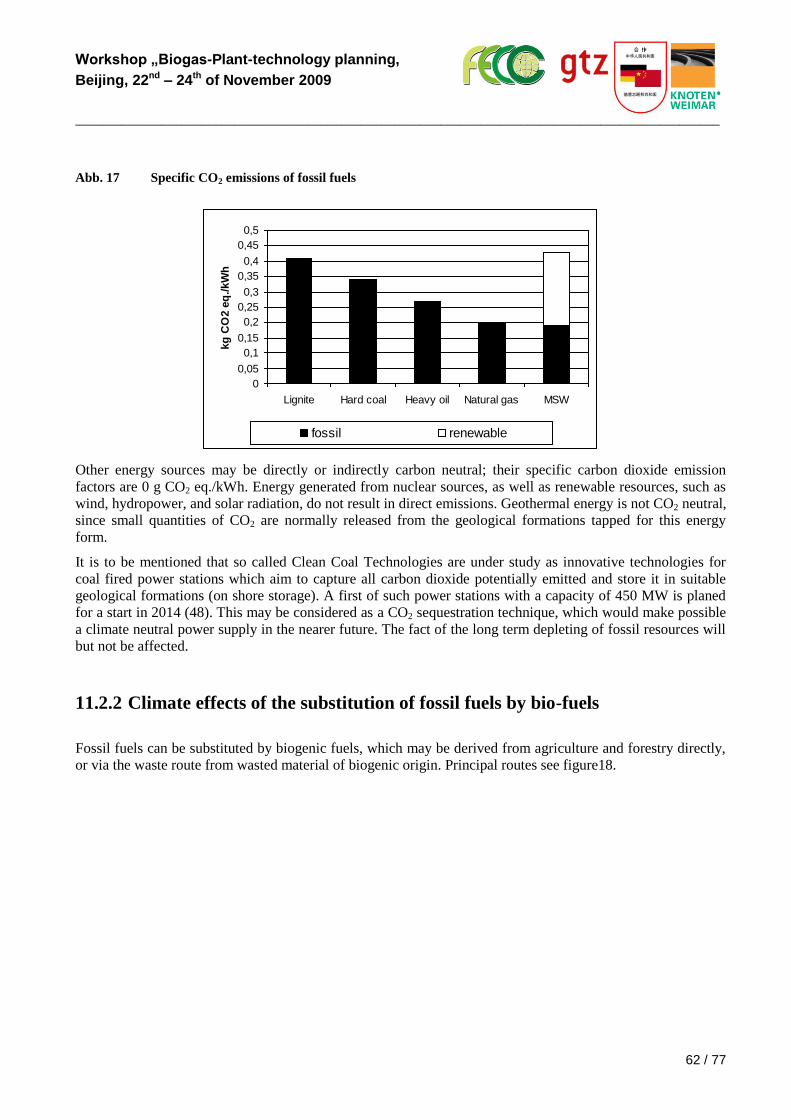
Workshop „Biogas-Plant-technology planning,
Beijing, 22nd – 24th of November 2009
_________________________________________________________________________________________________
62 / 77
Abb. 17 Specific CO2 emissions of fossil fuels
0
0,05
0,1
0,15
0,2
0,25
0,3
0,35
0,4
0,45
0,5
Lignite Hard coal Heavy oil Natural gas MSW
kg
CO
2 e
q./kW
h
fossil renewable
Other energy sources may be directly or indirectly carbon neutral; their specific carbon dioxide emission
factors are 0 g CO2 eq./kWh. Energy generated from nuclear sources, as well as renewable resources, such as
wind, hydropower, and solar radiation, do not result in direct emissions. Geothermal energy is not CO2 neutral,
since small quantities of CO2 are normally released from the geological formations tapped for this energy
form.
It is to be mentioned that so called Clean Coal Technologies are under study as innovative technologies for
coal fired power stations which aim to capture all carbon dioxide potentially emitted and store it in suitable
geological formations (on shore storage). A first of such power stations with a capacity of 450 MW is planed
for a start in 2014 (48). This may be considered as a CO2 sequestration technique, which would make possible
a climate neutral power supply in the nearer future. The fact of the long term depleting of fossil resources will
but not be affected.
11.2.2 Climate effects of the substitution of fossil fuels by bio-fuels
Fossil fuels can be substituted by biogenic fuels, which may be derived from agriculture and forestry directly,
or via the waste route from wasted material of biogenic origin. Principal routes see figure18.
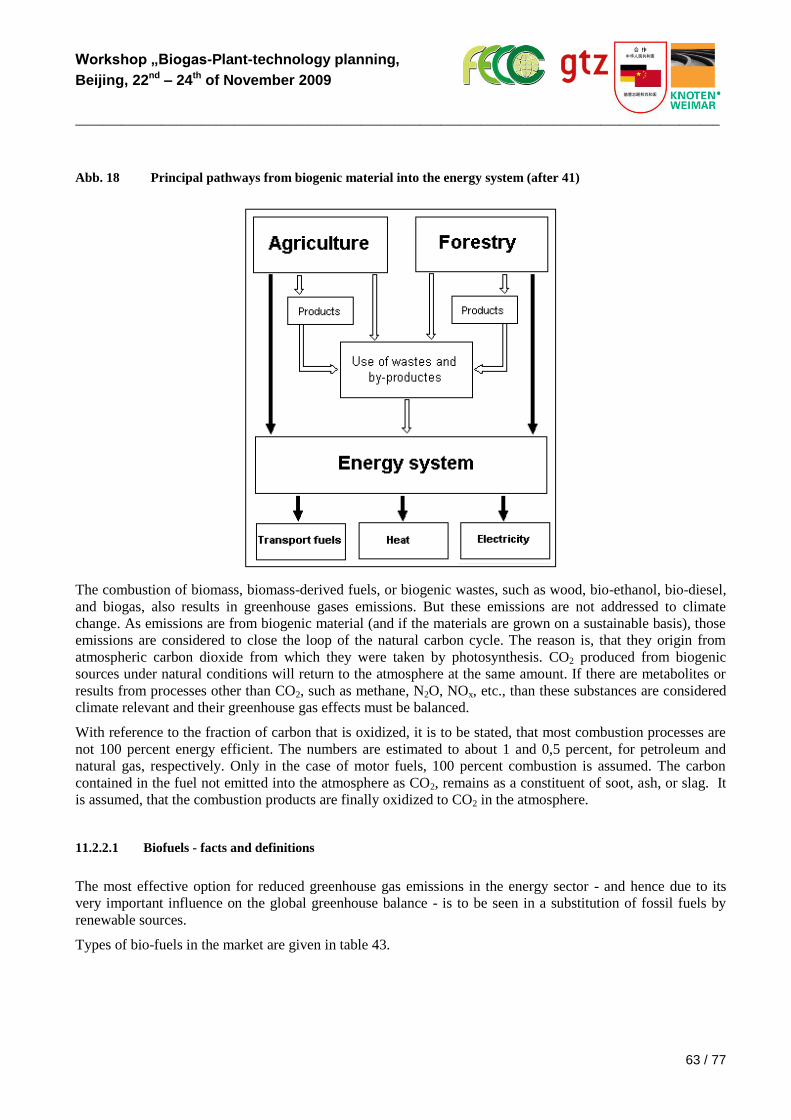
Workshop „Biogas-Plant-technology planning,
Beijing, 22nd – 24th of November 2009
_________________________________________________________________________________________________
63 / 77
Abb. 18 Principal pathways from biogenic material into the energy system (after 41)
The combustion of biomass, biomass-derived fuels, or biogenic wastes, such as wood, bio-ethanol, bio-diesel,
and biogas, also results in greenhouse gases emissions. But these emissions are not addressed to climate
change. As emissions are from biogenic material (and if the materials are grown on a sustainable basis), those
emissions are considered to close the loop of the natural carbon cycle. The reason is, that they origin from
atmospheric carbon dioxide from which they were taken by photosynthesis. CO2 produced from biogenic
sources under natural conditions will return to the atmosphere at the same amount. If there are metabolites or
results from processes other than CO2, such as methane, N2O, NOx, etc., than these substances are considered
climate relevant and their greenhouse gas effects must be balanced.
With reference to the fraction of carbon that is oxidized, it is to be stated, that most combustion processes are
not 100 percent energy efficient. The numbers are estimated to about 1 and 0,5 percent, for petroleum and
natural gas, respectively. Only in the case of motor fuels, 100 percent combustion is assumed. The carbon
contained in the fuel not emitted into the atmosphere as CO2, remains as a constituent of soot, ash, or slag. It
is assumed, that the combustion products are finally oxidized to CO2 in the atmosphere.
11.2.2.1 Biofuels - facts and definitions
The most effective option for reduced greenhouse gas emissions in the energy sector - and hence due to its
very important influence on the global greenhouse balance - is to be seen in a substitution of fossil fuels by
renewable sources.
Types of bio-fuels in the market are given in table 43.
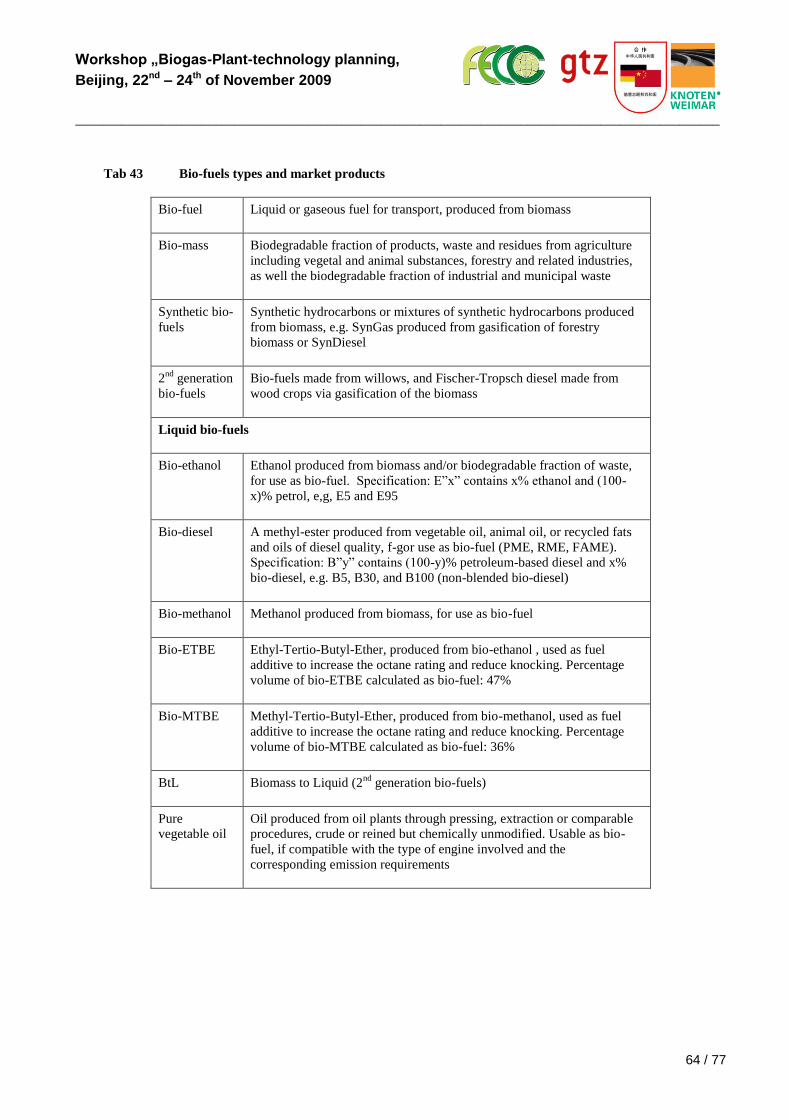
Workshop „Biogas-Plant-technology planning,
Beijing, 22nd – 24th of November 2009
_________________________________________________________________________________________________
64 / 77
Tab 43 Bio-fuels types and market products
Bio-fuel Liquid or gaseous fuel for transport, produced from biomass
Bio-mass Biodegradable fraction of products, waste and residues from agriculture
including vegetal and animal substances, forestry and related industries,
as well the biodegradable fraction of industrial and municipal waste
Synthetic bio-
fuels
Synthetic hydrocarbons or mixtures of synthetic hydrocarbons produced
from biomass, e.g. SynGas produced from gasification of forestry
biomass or SynDiesel
2nd
generation
bio-fuels
Bio-fuels made from willows, and Fischer-Tropsch diesel made from
wood crops via gasification of the biomass
Liquid bio-fuels
Bio-ethanol Ethanol produced from biomass and/or biodegradable fraction of waste,
for use as bio-fuel. Specification: E”x” contains x% ethanol and (100-
x)% petrol, e,g, E5 and E95
Bio-diesel A methyl-ester produced from vegetable oil, animal oil, or recycled fats
and oils of diesel quality, f-gor use as bio-fuel (PME, RME, FAME).
Specification: B”y” contains (100-y)% petroleum-based diesel and x%
bio-diesel, e.g. B5, B30, and B100 (non-blended bio-diesel)
Bio-methanol Methanol produced from biomass, for use as bio-fuel
Bio-ETBE Ethyl-Tertio-Butyl-Ether, produced from bio-ethanol , used as fuel
additive to increase the octane rating and reduce knocking. Percentage
volume of bio-ETBE calculated as bio-fuel: 47%
Bio-MTBE Methyl-Tertio-Butyl-Ether, produced from bio-methanol, used as fuel
additive to increase the octane rating and reduce knocking. Percentage
volume of bio-MTBE calculated as bio-fuel: 36%
BtL Biomass to Liquid (2nd
generation bio-fuels)
Pure
vegetable oil
Oil produced from oil plants through pressing, extraction or comparable
procedures, crude or reined but chemically unmodified. Usable as bio-
fuel, if compatible with the type of engine involved and the
corresponding emission requirements
Workshop „Biogas-Plant-technology planning,
Beijing, 22nd – 24th of November 2009
_________________________________________________________________________________________________
65 / 77
Gaseous bio-fuels
Bio-DME Dimethylether produced from biomass, for use as bio-fuel
Biogas A fuel gas produced from biomass and/or the biodegradable fraction of
waste (in technical equipment, such as MBP technology, or as landfill
gas), used as a fuels for power stations. Can be purified to natural gas
quality for use as bio-fuel or woodgas.
Bio-hydrogen Hydrogen produced from biomass and/or the biodegradable fraction or
waste for use as bio-fuel
Amongst these types of bio-fuels, bio-fuels of the 1st generation are applied and will be more intensively
introduced into the markets until 2010. Afterwards, bio-fuels of the 2nd
generation will come into application
after 2010 to 2020 as a result of intensive research, which is already in the state of demonstration projects (see
table 44).
Tab 44 Renewable fuels applicability timescale in U.K. (35)
Commercial
applicability
Bio-fuel Possible sources
To 2010
Bio-ethanol Starch and sugar crops: Wheat grain, sugar
beet, sugar cane, sorghum, corn
Bio-diesel Oil crops and wastes: Rapeseed, sunflower,
soybean, palm oil, jatropha, waste vegetable
oil, waste animal fat
Bio-gas Organic waste from agriculture (animal
farming), wet energy crops
2010-2020
Bio-diesel, bio-ethanol
and bio-gas
As 2010
Bio-ethanol Lignocellulose biomass: straw, wood,
biodegradable municipal solid waste Fischer-Tropsch diesel
Hydrogen Electrolysis of water using renewable
electricity. Biomass feed-stocks
(lignocellulose wastes, wet feed-stocks)
Production capacities for bio-fuels are already considerably as a result of the policy measures. Recently, total
bio-fuel production amounted to about 35 billion litres world wide. It develops very progressively; growth
rates of more than 10 percent per year are envisaged. Bio-ethanol is the world’s main bio-fuel which was
around 30 billion litres. This represents 2 percent of the global petrol use. World bio-ethanol production is
given in figure 19.
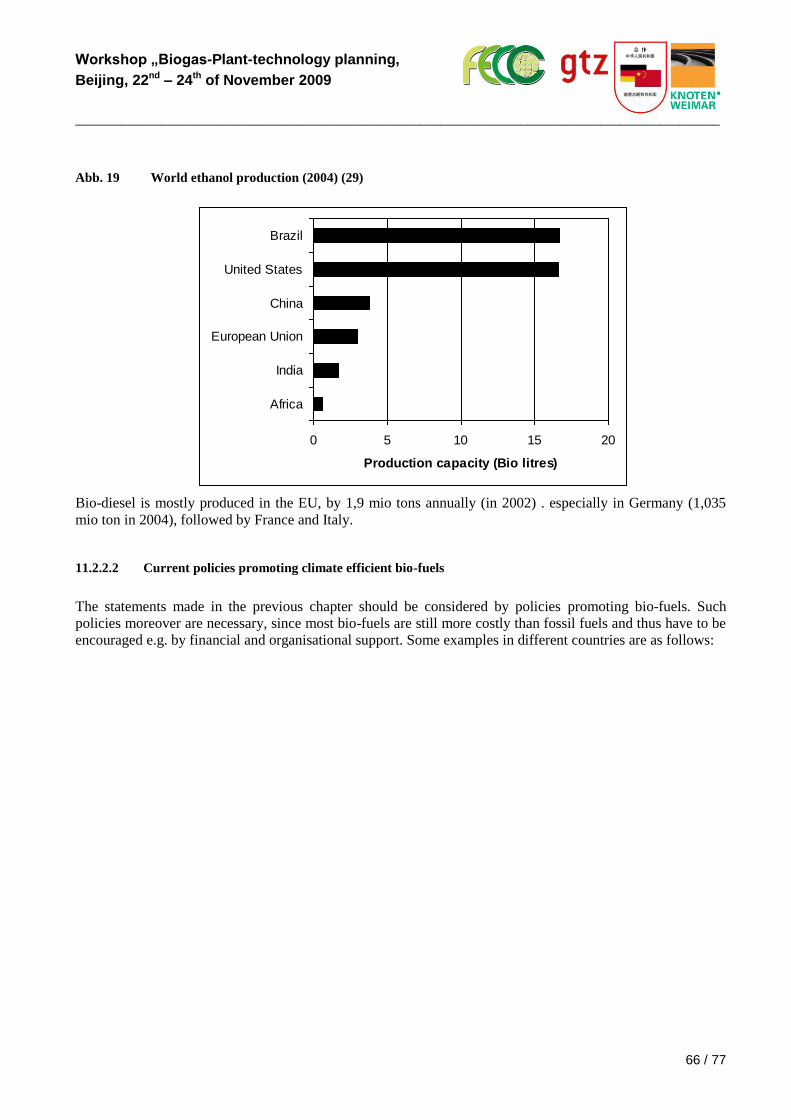
Workshop „Biogas-Plant-technology planning,
Beijing, 22nd – 24th of November 2009
_________________________________________________________________________________________________
66 / 77
Abb. 19 World ethanol production (2004) (29)
Bio-diesel is mostly produced in the EU, by 1,9 mio tons annually (in 2002) . especially in Germany (1,035
mio ton in 2004), followed by France and Italy.
11.2.2.2 Current policies promoting climate efficient bio-fuels
The statements made in the previous chapter should be considered by policies promoting bio-fuels. Such
policies moreover are necessary, since most bio-fuels are still more costly than fossil fuels and thus have to be
encouraged e.g. by financial and organisational support. Some examples in different countries are as follows:
0 5 10 15 20
Africa
India
European Union
China
United States
Brazil
Production capacity (Bio litres)
Workshop „Biogas-Plant-technology planning,
Beijing, 22nd – 24th of November 2009
_________________________________________________________________________________________________
67 / 77
A Bio-fuels directive (32) for bio-fuel use was developed by the European Commission, with the
objectives of i) reducing climate effects on an acceptable cost-benefit relation, ii) avoidance of
environmental damages by the production of the bio-fuels as well as of its raw materials, and iii)
guarantee, hat no extra burdens on ecology or technical problems arise. Other aims are the diversifying
the fuel supply sources and development of long-term replacement of fossil fuel (29). Moreover, it is
expected to offer new income and employment in rural regions. The bio-fuels directive had set reference
values of 2 percent market share for bio-fuels in 2005, which was but not achieved in his reference year.
In 2010, a 5,75 percent share is planned. To implement the directive, some EU members are relying on
tax exemptions, which are facilitated by the Enquiry Taxation Directive (33). Other measures are bio-
fuel obligations, requiring fuel suppliers to incorporate a certain percentage of bio-fuels in the fuel
marketed.
In Germany, Governmental ln is to double the use of renewable energies by 2010, compared with 2000.
For electricity, an enhancement of 12,5 percent is envisages, and 4 percent of primary energy use. In the
long run, by the year 2030, renewables could cover a quarter of the total energy needs by biomass
feedstocks.
With respect to the reducing road transport sector CO2 emissions, “low fossil carbon fuels” are
recommended by the CARS 21 group (30), and 2nd
generation bio-fuels (see table 43) are seen as
particularly important.
A number of countries other than EU member states also have set targets for incorporation into
conventional fuel of bio-fuels. Amongst the measures, there are mandatory mixing percentage (e.g.
Brazil, 25% mandatory; Canada: 3,5% target for 2010; in Ontario 5% for 2007), tax credits or incentives
to bio-fuels producers or reduced fuel taxes (India: purchasing policy, 5% oil from indigenous plants in
2006, rising to 20% in 2020), or tax credits for vehicles (Brazil and Thailand for cars run on bio-fuels;
Thailand supports the development of a green vehicle) (29).
Most simulating for bio-fuels was the Brazil Proalcool programme, launched in this country after the
energy crisis of 1975. An extra aim was to develop a use for surplus sugar production. In Brazil
currently all petrol is sold by an ethanol component of 20 to 26 percent. A new legislation on bio-diesel
was implemented in 2004.
In the United States, which is the world’s second largest bio-ethanol producer, a series of tax measures
and incentives were followed by an exponential rise in the production. In 2004 the Volumetric Ethanol
Excise Tax Credit (VEETC) extended the existing tax incentives until 2010. In 2005, as part of a new
energy bill, a Renewable Fuels Standard (RFS) was introduced, with a target rising 4 billion gallon in
2006 to 7,5 by 2012. A coming Bio-ethanol Bill will require a 5 percent blend of bio-ethanol within two
years after coming the act into force, and other 5 percent in the following two years (29).
11.2.2.3 Climate consequences of bio-fuels
Positive effects of bio-fuels are primarily due to the reduction of greenhouse gas emissions. At the same time
the reduction of the demands of fossil material sources is considered, and hence, the enhancement of the
lifetime of this scarce and expensive resource. Moreover, it supports the development of the agriculture in
rural regions, broadens the activity field of farmers, and opens new markets for products such as sugar. In
many cases, residues from agriculture as well as from industry can be used as raw material sources of bio-
fuels, thus also contributing to reduce negative environmental effects of poor wastes management.
Not in every case the intended positive effects will fully occur, and negative effects also have to be considered.
Under the sustainability aspect, following argumentation speaks for a detailed analysis of the environmental
benefits of bio-fuels (31):
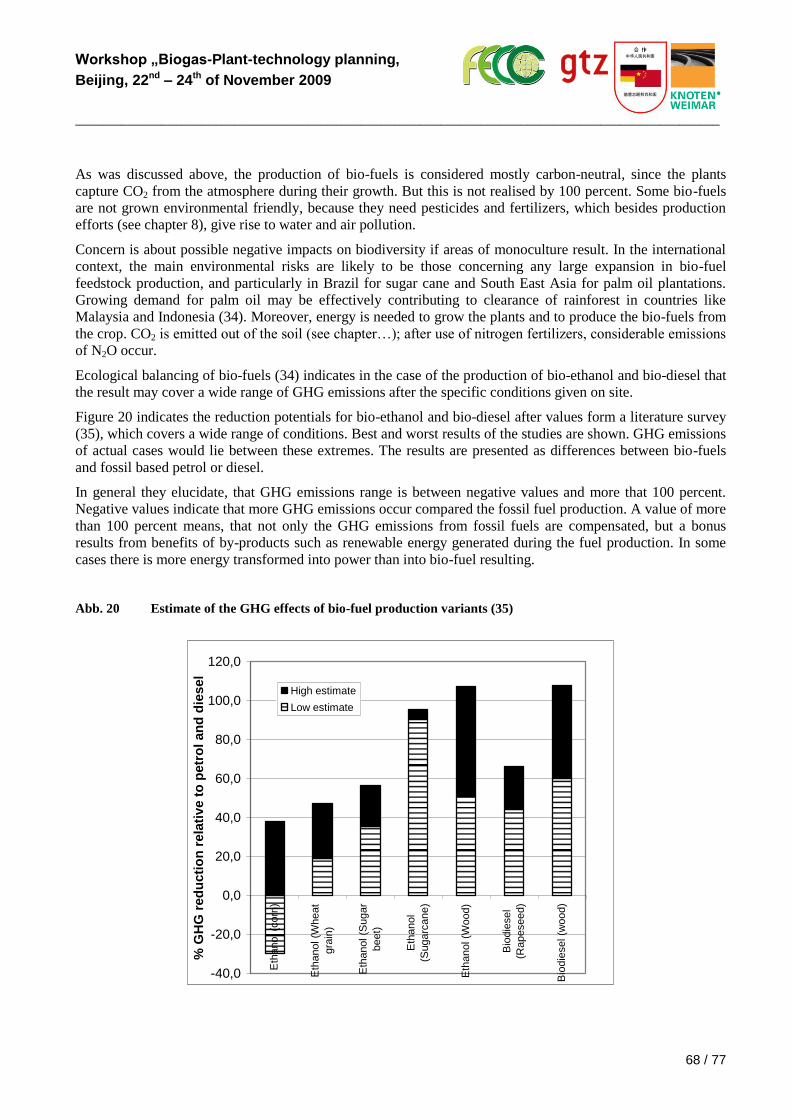
Workshop „Biogas-Plant-technology planning,
Beijing, 22nd – 24th of November 2009
_________________________________________________________________________________________________
68 / 77
As was discussed above, the production of bio-fuels is considered mostly carbon-neutral, since the plants
capture CO2 from the atmosphere during their growth. But this is not realised by 100 percent. Some bio-fuels
are not grown environmental friendly, because they need pesticides and fertilizers, which besides production
efforts (see chapter 8), give rise to water and air pollution.
Concern is about possible negative impacts on biodiversity if areas of monoculture result. In the international
context, the main environmental risks are likely to be those concerning any large expansion in bio-fuel
feedstock production, and particularly in Brazil for sugar cane and South East Asia for palm oil plantations.
Growing demand for palm oil may be effectively contributing to clearance of rainforest in countries like
Malaysia and Indonesia (34). Moreover, energy is needed to grow the plants and to produce the bio-fuels from
the crop. CO2 is emitted out of the soil (see chapter…); after use of nitrogen fertilizers, considerable emissions
of N2O occur.
Ecological balancing of bio-fuels (34) indicates in the case of the production of bio-ethanol and bio-diesel that
the result may cover a wide range of GHG emissions after the specific conditions given on site.
Figure 20 indicates the reduction potentials for bio-ethanol and bio-diesel after values form a literature survey
(35), which covers a wide range of conditions. Best and worst results of the studies are shown. GHG emissions
of actual cases would lie between these extremes. The results are presented as differences between bio-fuels
and fossil based petrol or diesel.
In general they elucidate, that GHG emissions range is between negative values and more that 100 percent.
Negative values indicate that more GHG emissions occur compared the fossil fuel production. A value of more
than 100 percent means, that not only the GHG emissions from fossil fuels are compensated, but a bonus
results from benefits of by-products such as renewable energy generated during the fuel production. In some
cases there is more energy transformed into power than into bio-fuel resulting.
Abb. 20 Estimate of the GHG effects of bio-fuel production variants (35)
-40,0
-20,0
0,0
20,0
40,0
60,0
80,0
100,0
120,0
Eth
anol (c
orn
)
Eth
anol (W
heat
gra
in)
Eth
anol (S
ugar
beet)
Eth
anol
(Sugarc
ane)
Eth
anol (W
ood)
Bio
die
sel
(Rapeseed)
Bio
die
sel (w
ood)
% G
HG
red
ucti
on
rela
tive t
o p
etr
ol an
d d
iesel
High estimate
Low estimate
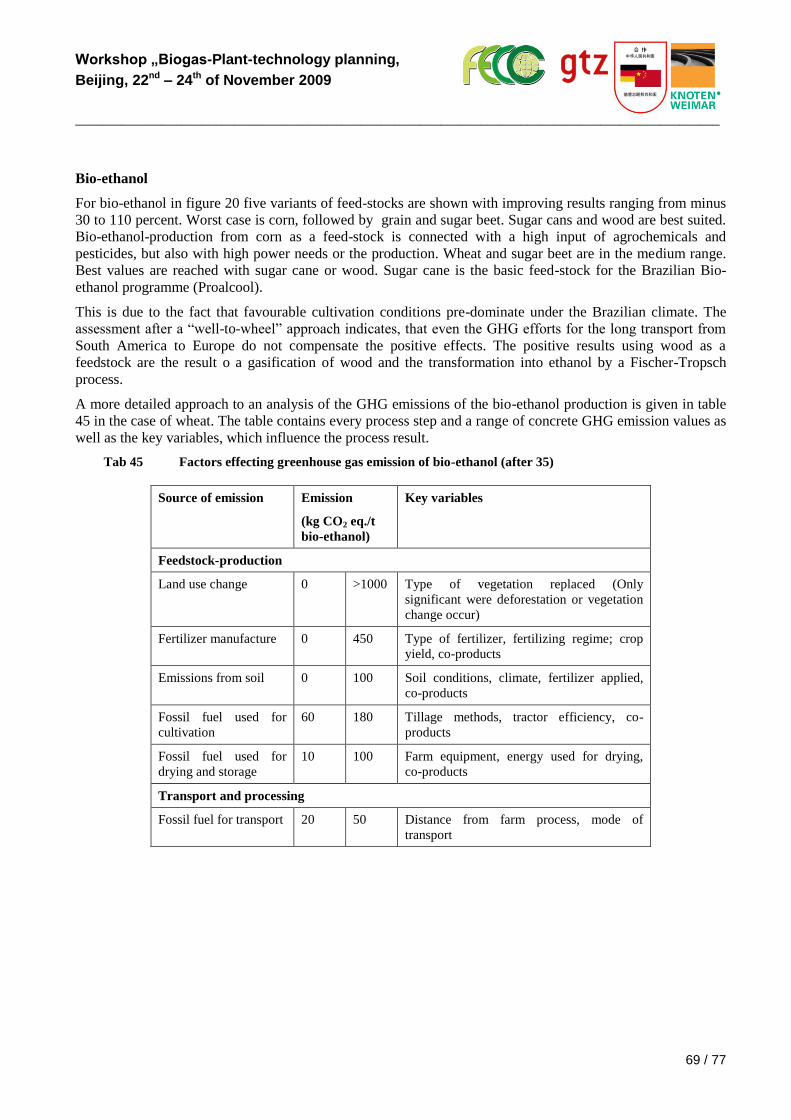
Workshop „Biogas-Plant-technology planning,
Beijing, 22nd – 24th of November 2009
_________________________________________________________________________________________________
69 / 77
Bio-ethanol
For bio-ethanol in figure 20 five variants of feed-stocks are shown with improving results ranging from minus
30 to 110 percent. Worst case is corn, followed by grain and sugar beet. Sugar cans and wood are best suited.
Bio-ethanol-production from corn as a feed-stock is connected with a high input of agrochemicals and
pesticides, but also with high power needs or the production. Wheat and sugar beet are in the medium range.
Best values are reached with sugar cane or wood. Sugar cane is the basic feed-stock for the Brazilian Bio-
ethanol programme (Proalcool).
This is due to the fact that favourable cultivation conditions pre-dominate under the Brazilian climate. The
assessment after a “well-to-wheel” approach indicates, that even the GHG efforts for the long transport from
South America to Europe do not compensate the positive effects. The positive results using wood as a
feedstock are the result o a gasification of wood and the transformation into ethanol by a Fischer-Tropsch
process.
A more detailed approach to an analysis of the GHG emissions of the bio-ethanol production is given in table
45 in the case of wheat. The table contains every process step and a range of concrete GHG emission values as
well as the key variables, which influence the process result.
Tab 45 Factors effecting greenhouse gas emission of bio-ethanol (after 35)
Source of emission Emission
(kg CO2 eq./t
bio-ethanol)
Key variables
Feedstock-production
Land use change 0 >1000 Type of vegetation replaced (Only
significant were deforestation or vegetation
change occur)
Fertilizer manufacture 0 450 Type of fertilizer, fertilizing regime; crop
yield, co-products
Emissions from soil 0 100 Soil conditions, climate, fertilizer applied,
co-products
Fossil fuel used for
cultivation
60 180 Tillage methods, tractor efficiency, co-
products
Fossil fuel used for
drying and storage
10 100 Farm equipment, energy used for drying,
co-products
Transport and processing
Fossil fuel for transport 20 50 Distance from farm process, mode of
transport
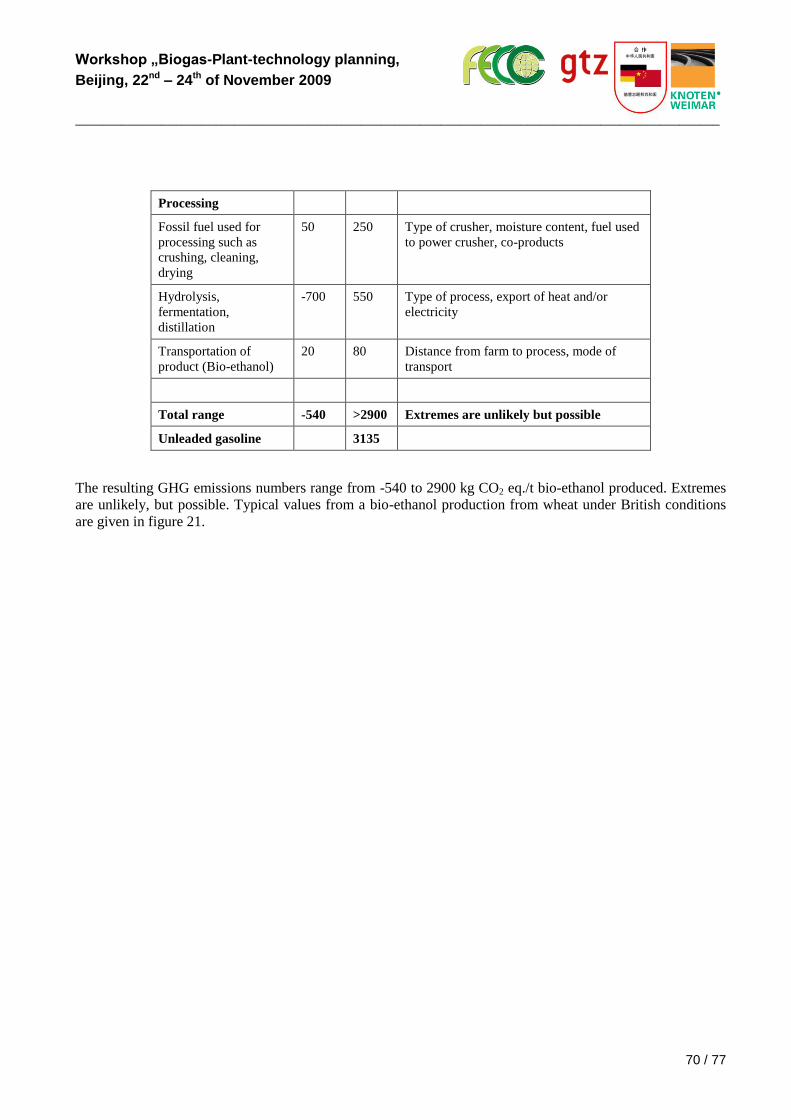
Workshop „Biogas-Plant-technology planning,
Beijing, 22nd – 24th of November 2009
_________________________________________________________________________________________________
70 / 77
Processing
Fossil fuel used for
processing such as
crushing, cleaning,
drying
50 250 Type of crusher, moisture content, fuel used
to power crusher, co-products
Hydrolysis,
fermentation,
distillation
-700 550 Type of process, export of heat and/or
electricity
Transportation of
product (Bio-ethanol)
20 80 Distance from farm to process, mode of
transport
Total range -540 >2900 Extremes are unlikely but possible
Unleaded gasoline 3135
The resulting GHG emissions numbers range from -540 to 2900 kg CO2 eq./t bio-ethanol produced. Extremes
are unlikely, but possible. Typical values from a bio-ethanol production from wheat under British conditions
are given in figure 21.
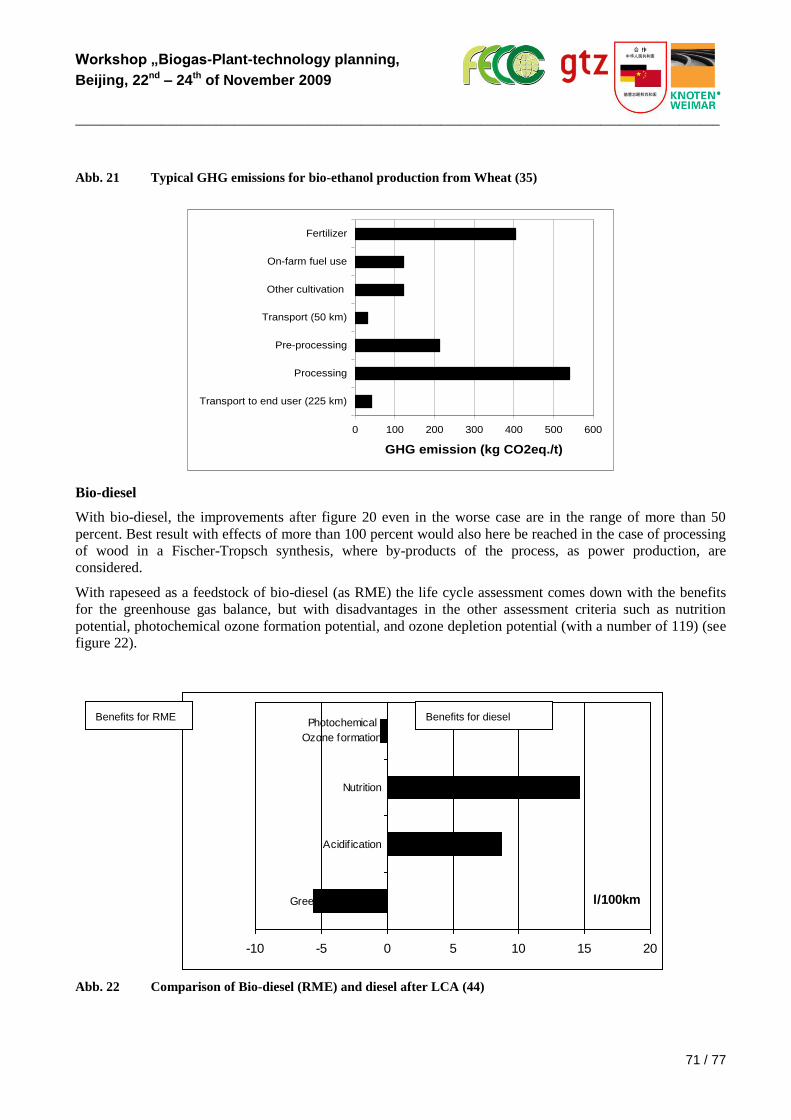
Workshop „Biogas-Plant-technology planning,
Beijing, 22nd – 24th of November 2009
_________________________________________________________________________________________________
71 / 77
Abb. 21 Typical GHG emissions for bio-ethanol production from Wheat (35)
0 100 200 300 400 500 600
Transport to end user (225 km)
Processing
Pre-processing
Transport (50 km)
Other cultivation
On-farm fuel use
Fertilizer
GHG emission (kg CO2eq./t)
Bio-diesel
With bio-diesel, the improvements after figure 20 even in the worse case are in the range of more than 50
percent. Best result with effects of more than 100 percent would also here be reached in the case of processing
of wood in a Fischer-Tropsch synthesis, where by-products of the process, as power production, are
considered.
With rapeseed as a feedstock of bio-diesel (as RME) the life cycle assessment comes down with the benefits
for the greenhouse gas balance, but with disadvantages in the other assessment criteria such as nutrition
potential, photochemical ozone formation potential, and ozone depletion potential (with a number of 119) (see
figure 22).
Abb. 22 Comparison of Bio-diesel (RME) and diesel after LCA (44)
-10 -5 0 5 10 15 20
Greenhouse effect
Acidif ication
Nutrition
Photochemical
Ozone formation
l/100km
Benefits for diesel Benefits for RME
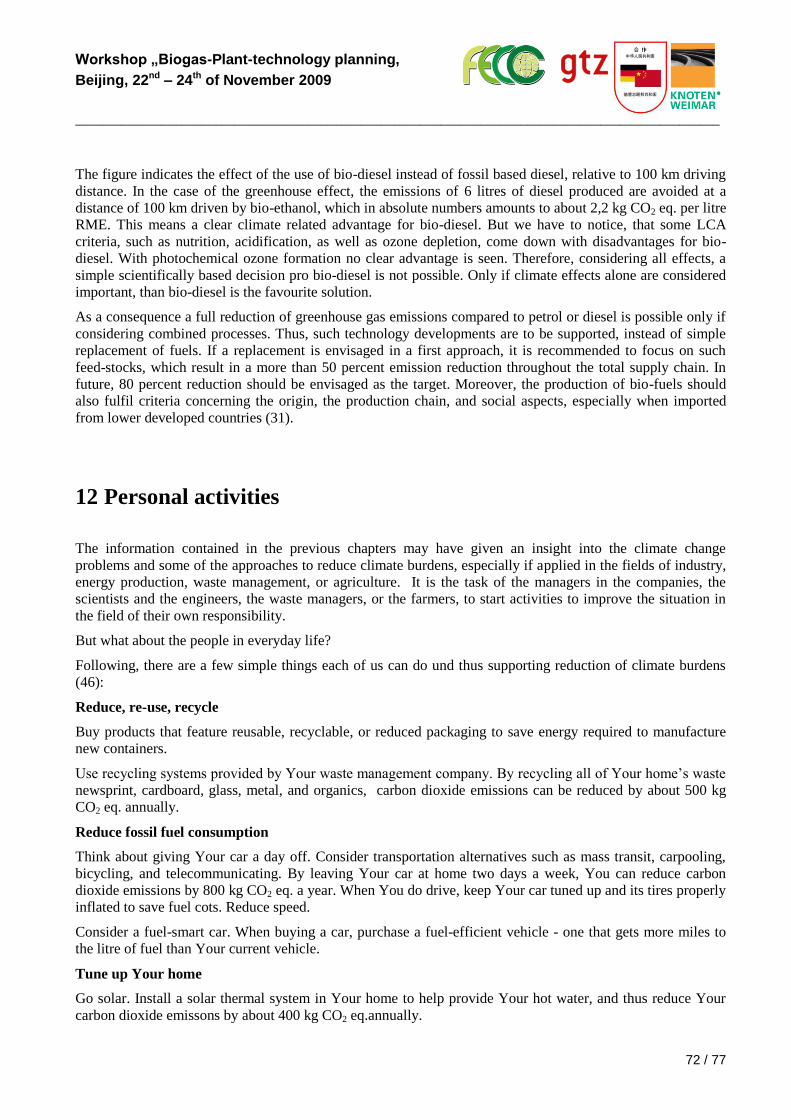
Workshop „Biogas-Plant-technology planning,
Beijing, 22nd – 24th of November 2009
_________________________________________________________________________________________________
72 / 77
The figure indicates the effect of the use of bio-diesel instead of fossil based diesel, relative to 100 km driving
distance. In the case of the greenhouse effect, the emissions of 6 litres of diesel produced are avoided at a
distance of 100 km driven by bio-ethanol, which in absolute numbers amounts to about 2,2 kg CO2 eq. per litre
RME. This means a clear climate related advantage for bio-diesel. But we have to notice, that some LCA
criteria, such as nutrition, acidification, as well as ozone depletion, come down with disadvantages for bio-
diesel. With photochemical ozone formation no clear advantage is seen. Therefore, considering all effects, a
simple scientifically based decision pro bio-diesel is not possible. Only if climate effects alone are considered
important, than bio-diesel is the favourite solution.
As a consequence a full reduction of greenhouse gas emissions compared to petrol or diesel is possible only if
considering combined processes. Thus, such technology developments are to be supported, instead of simple
replacement of fuels. If a replacement is envisaged in a first approach, it is recommended to focus on such
feed-stocks, which result in a more than 50 percent emission reduction throughout the total supply chain. In
future, 80 percent reduction should be envisaged as the target. Moreover, the production of bio-fuels should
also fulfil criteria concerning the origin, the production chain, and social aspects, especially when imported
from lower developed countries (31).
12 Personal activities
The information contained in the previous chapters may have given an insight into the climate change
problems and some of the approaches to reduce climate burdens, especially if applied in the fields of industry,
energy production, waste management, or agriculture. It is the task of the managers in the companies, the
scientists and the engineers, the waste managers, or the farmers, to start activities to improve the situation in
the field of their own responsibility.
But what about the people in everyday life?
Following, there are a few simple things each of us can do und thus supporting reduction of climate burdens
(46):
Reduce, re-use, recycle
Buy products that feature reusable, recyclable, or reduced packaging to save energy required to manufacture
new containers.
Use recycling systems provided by Your waste management company. By recycling all of Your home’s waste
newsprint, cardboard, glass, metal, and organics, carbon dioxide emissions can be reduced by about 500 kg
CO2 eq. annually.
Reduce fossil fuel consumption
Think about giving Your car a day off. Consider transportation alternatives such as mass transit, carpooling,
bicycling, and telecommunicating. By leaving Your car at home two days a week, You can reduce carbon
dioxide emissions by 800 kg CO2 eq. a year. When You do drive, keep Your car tuned up and its tires properly
inflated to save fuel cots. Reduce speed.
Consider a fuel-smart car. When buying a car, purchase a fuel-efficient vehicle - one that gets more miles to
the litre of fuel than Your current vehicle.
Tune up Your home
Go solar. Install a solar thermal system in Your home to help provide Your hot water, and thus reduce Your
carbon dioxide emissons by about 400 kg CO2 eq.annually.
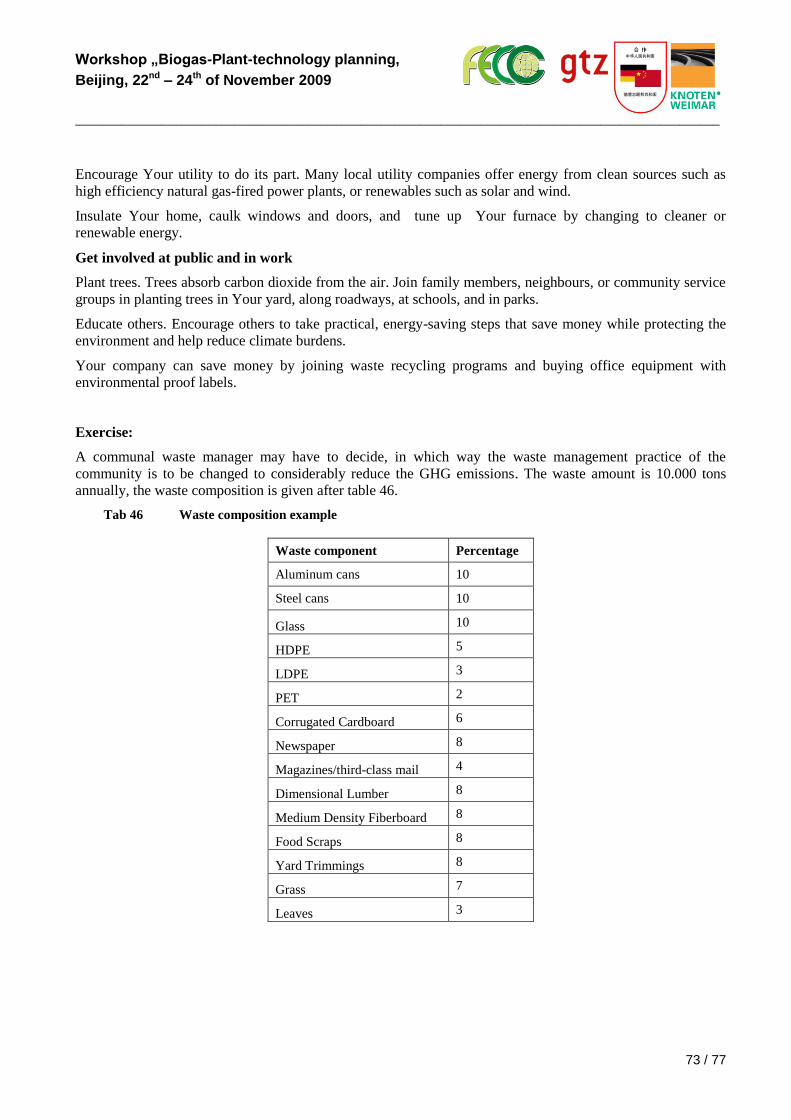
Workshop „Biogas-Plant-technology planning,
Beijing, 22nd – 24th of November 2009
_________________________________________________________________________________________________
73 / 77
Encourage Your utility to do its part. Many local utility companies offer energy from clean sources such as
high efficiency natural gas-fired power plants, or renewables such as solar and wind.
Insulate Your home, caulk windows and doors, and tune up Your furnace by changing to cleaner or
renewable energy.
Get involved at public and in work
Plant trees. Trees absorb carbon dioxide from the air. Join family members, neighbours, or community service
groups in planting trees in Your yard, along roadways, at schools, and in parks.
Educate others. Encourage others to take practical, energy-saving steps that save money while protecting the
environment and help reduce climate burdens.
Your company can save money by joining waste recycling programs and buying office equipment with
environmental proof labels.
Exercise:
A communal waste manager may have to decide, in which way the waste management practice of the
community is to be changed to considerably reduce the GHG emissions. The waste amount is 10.000 tons
annually, the waste composition is given after table 46.
Tab 46 Waste composition example
Waste component Percentage
Aluminum cans 10
Steel cans 10
Glass 10
HDPE 5
LDPE 3
PET 2
Corrugated Cardboard 6
Newspaper 8
Magazines/third-class mail 4
Dimensional Lumber 8
Medium Density Fiberboard 8
Food Scraps 8
Yard Trimmings 8
Grass 7
Leaves 3
Workshop „Biogas-Plant-technology planning,
Beijing, 22nd – 24th of November 2009
_________________________________________________________________________________________________
74 / 77
For this situation it is to be calculated, which benefits in terms of CO2 equivalents result from a changing from
a 100 percent deposition of the whole waste in a MSW sanitary landfill to variants of source reduction and
recycling activities. Check source reduction rates and recycling rates of 25 and 50 %, both, as well as 100
percent composting of the compostable matter.
Are there variants to reduce the GHG emissions in total by 50 percent? Which of them would be most
favourable?
For the resulting CO2 reduction calculate equivalents of driving diistances with a middle class car (petrol use
about 10 litres per 100 km).
For calculation You may use the WARM programme.
Workshop „Biogas-Plant-technology planning,
Beijing, 22nd – 24th of November 2009
_________________________________________________________________________________________________
75 / 77
Literature
(1) Integrated pollution and prevention control. BREF, Madrid, 2001.
(2) Guidelines for the selection and use of fuels and raw materials in cement manufacturing
process. World business council for sustainable development, Draft report, Version 1,
12/2005. http://www.wbcsdcement.org/pdf/tf2/tf2_guidelines.pdf
(3) Cement sustainability initiative. http://www.wbcsdcement.org/pdf/tf1/tf1_guidelines.pdf
(4) Best available technique reference document Iron and Steel, EU commission, Madrid, 2002.
http://www.wbcsdcement.org/pdf/tf1/tf1_guidelines.pdf
(5) Soyez, K.: Combined bioprocess of composting and greenhouse fertilization. In:
(6) Soyez, K.; Plickert, S.: Mechanical biological waste treatment. In: Ludwig, C.; Hellweg, S.;
Stucki, S. et al, (edts): Municipal solid waste management. Berlin, 2002
(7) Environmental Protection agency (EPA): US emission inventory2006.
http://yosemite.epa.gov/oar/globalwarming.nsf/content/ResourceCenterPublicationsGHGEmis
sionsUSEmissionsInventory2006.html
(8) International Non-CO2 greenhouse Gas marginal abatement report. Draft methane and nitrous
from Non-agricultural sources, April 2005.
http://www.epa.gov/methane/pdfs/chapter3_landfill.pdf
(9) Solid waste management and greenhouse gases. A life cycle assessment of emissions and
sinks. EPA 530-R-02-006. Washington, 2002.
(10) VDI-Richtlinie No… MBA
(11) Marland, G.; Boden, T.A.; Andres, R.J.: Global, regional, and national fossil fuel CO2
emissions. http://cdiac.esd.ornl.gov/trends/emis/meth_reg.htm
(12) Öko-Institut: The Green Dot and its Benefit for the Environment. Darmstadt, …
(13) Prognos Study
(14) DSD GmbH: Environmental Success Balance 2003.
(15) Gohlke, O.; Neukirchen, B.; Wiesner, J. (Hrsg.): Werkzeuge zur Bewertung von
Abfallbehandlungsverfahren - Methoden und Ergebnisse. VDI-Verlag, Düsseldorf, 2006.
(16) European Committee for Standardization (CEN)-ISO 14040-14043. Brussels, 1977-
1999.
(17) VHK-Van Holsteijn en Kemma BV: Methodology Study Eco-Design of energy using
Products. Final Report, Delft, November 205. www.eupproject.org
(18) United Nations Environmental Program (UNEP). International life cycle partnership .
www.uneptie.org/sustain/lcinitiative
(19) http://www.uneptie.org/pc/sustain/reports/lcini/LCIni_Flyer03.pdf
(20) US Environmental Protection agency: Calculating Greenhouse Gas Emissions with
the Excel. Version of the WAste Reduction Model (WARM).
http://www.epa.gov/globalwarming/actions/waste/warm.htm and
http://yosemite.epa.gov/oar/globalwarming.nsf/content/ActionsWasteToolsReports.html
(21) US Environmental Protection agency: Solid waste Management and greenhouse
gases. A life-cycle assessment of emissions and sinks.
www.epa.gov/mswclimate/greengas.pdf
Workshop „Biogas-Plant-technology planning,
Beijing, 22nd – 24th of November 2009
_________________________________________________________________________________________________
76 / 77
(22) US Environmental Protection Agency: eGRID Sample & Maps.
http://www.epa.gov/cleanenergy/egrid/samples.htm#highlights
(23) BMU: Ordinance on environmentally compatible storage of waste from human
settlements and on biological waste-treatment facilities, Berlin 2001
(24) US Environmental Protection agency: online WARM
http://www.epa.gov/globalwarming/actions/waste/w-online.htm
(25) Society of Environmental Toxicology and Chemistry (SETAC). http://www.setac.org
(26) BASF: Eco-efficiency analysis.
http://corporate.basf.com/en/sustainability/oekoeffizienz/?id=noAIH8fMmbcp1tZ
(27) Fachverband Biogas. Biogas Fakten, 2006.
http://www.biogas.org/datenbank/file/notmember/medien/Fakten_Biogas_2006_03.pdf
(28) Marland, G. et. Al.: Global, regional, and national fossil fuel CO2-emissions (2003).
http://cdiac.esd.ornl.gov/trends/emis/meth_reg.htm
(29) Commission of the European Union: An EU strategy for bio-fuels. KOM(2006)34
final. Brussels, 8.2.2006EU
http://ec.europa.eu/energy/res/biomass_action_plan/doc/2006_02_08_comm_eu_strategy_en.p
df
(30) CARS 21: A competitive automotive regulatory system for he 21st century. Final
report.
http://eutropa.eu.int/comm/entreprise/automotive/pagesbackground/competitiveness/cars21fin
alreport.pdf
(31) EEB: EEB position on Biomass and bio-fuels: the need of well defined sustainability
criteria, December, 2005: http://www.eeb.org/activities/agriculture/EEB-position-on-
bioenergy-191205.pdf
(32) Directive 2003/30/EC of 8 May 2003 on the promotion of the use of bio-fuels or other
renewable fuels for transport (OJL 123, 17.5.2003. http://europa.eu.int/eur-
lex/pri/en/oj/dat/2003/l_123/l_12320030517en00420046.pdf
(33) Directive 2003/96/EC of 27 October 2003 restructuring the Community framework
for the taxation of energy products and electricity (OJL 283, 31.10.2003). http://eur-
lex.europa.eu/LexUriServ/site/en/com/2004/com2004_0042en01.pdf
(34) UK Renewable Transport Fuel Obligation (RTFO) feasibility report:
http://www.dft.gov.uk/stellent/groups/dft_roads/documents/page/dft_roads_610329-
03.hcsp#P37_6185
(35) E4tech: Feasibility report on certification for a renewable transport fuel obligation.
Final report, June 2005.
http://www.dft.gov.uk/stellent/groups/dft_roads/documents/page/dft_roads_610366.pdf
(36) International Energy agency: Bio-fuels for transport - an international perspective.
Paris, 2004.
http://www.oecdobserver.org/news/fullstory.php/aid/1647/Biofuels_for_transport.html
(37) Narodoslawsky, M.: The sustainable process index (SPI).
http://www.spionexcel.tugraz.at/
(38) Bringezu, S.:Ressourcennutzung in Wirtschaftsräumen. Stoffstromanalysen für eine
nachhaltige Raumentwicklung. Berlin, 2000.
Workshop „Biogas-Plant-technology planning,
Beijing, 22nd – 24th of November 2009
_________________________________________________________________________________________________
77 / 77
(39) Brunner, P.H.; Rechberger, H.: Practical handbook on material flow analysis. Boca
Raton, Florida, 2004
(40) Öko-Institut: Global Emission Model for Integrated Systems (GEMIS) Heidelberg,
2006. http://www.oeko.de/service/gemis/en/index.htm
(41) Öko-Institut,: Bioenergy. New growth for Germany. Heidelberg, 2005.
http://www.oeko.de/service/bio/de/index.htm
(42) Institut fuer Energetik, Leipzig: Nachhaltige Biomassenutzungsstrategien im
europäischen Kontext. Leipzig, 2005. http://www.erneuerbare-
energien.de/files/pdfs/allgemein/application/pdf/biohandel_endbericht.pdf
(43) Bio-climate Research and Development (BR&D): Bio-fuels Carbon Declaration
Methodology.
http://www.greenergy.com/expertise/pdfs/Carbon_Declaration_Methodology.pdf
(44) IFEU: Gutachten zur Erweiterung der Ökobilanz für RME. Heidelberg, 2003.
(45) Umweltbundesamt
(46) Environmental protection agency, EPA: What can we do about global warming.
http://yosemite.epa.gov/oar/globalwarming.nsf/UniqueKeyLookup/SHSU5BWJKS/$File/what
canwedoaboutgw.pdf
(47) European Union: Website ecodesign. http://europa.eu.int/comm/enterprise/eco_design
(48) RWE: RWE plant weltweit erstes CO2-freies Großkraftwerk für Kohle inclusive CO2-
Speicherung.
http://www.rwe.com/generator.aspx/templateId=renderPage/id=76858?pmid=4000956
Related Documents