VERMONT AGENCY OF EDUCATION Child Nutrition Programs Annual Statistical Report Percent of Students Approved for Free and Reduced-Price School Meals School Year 2019-2020

Welcome message from author
This document is posted to help you gain knowledge. Please leave a comment to let me know what you think about it! Share it to your friends and learn new things together.
Transcript
VERMONT AGENCY OF EDUCATION
Child Nutrition Programs
Annual Statistical Report
Percent of Students Approved for Free and Reduced-Price School Meals
School Year 2019-2020
Nondiscrimination Statement: In accordance with Federal civil rights law and U.S. Department of Agriculture (USDA) civil rights regulations and policies, the USDA, its Agencies, offices, and employees, and institutions participating in or administering USDA programs are prohibited from discriminating based on race, color, national origin, sex, disability, age, or reprisal or retaliation for prior civil rights activity in any program or activity conducted or funded by USDA.
Persons with disabilities who require alternative means of communication for program information (e.g. Braille, large print, audiotape, American Sign Language, etc.), should contact the Agency (State or local) where they applied for benefits. Individuals who are deaf, hard of hearing or have speech disabilities may contact USDA through the Federal Relay Service at (800) 877-8339. Additionally, program information may be made available in languages other than English.
To file a program complaint of discrimination, complete the USDA Program Discrimination Complaint Form, (AD-3027) found online at: http://www.ascr.usda.gov/complaint_filing_cust.html, and at any USDA office, or write a letter addressed to USDA and provide in the letter all of the information requested in the form. To request a copy of the complaint form, call (866) 632-9992. Submit your completed form or letter to USDA by:
(1) mail: U.S. Department of AgricultureOffice of the Assistant Secretary for Civil Rights1400 Independence Avenue, SWWashington, D.C. 20250-9410;(2) fax: (202) 690-7442; or(3) email: [email protected].
This institution is an equal opportunity provider.
2020 Free & Reduced Eligibility Report Page 1 of 28
Introduction
This is the annual report of the number of students approved for free and reduced-price meals in each school in each School Food Authority (SFA). A School Food Authority (SFA) is the entity responsible operating the National School Lunch Program (NSLP) and/or a School Breakfast Program (SBP) in schools. In Vermont, the SFA is at the supervisory union level for public schools. In some cases, there are multiple school districts within a School Food Authority. In Vermont, the state pays for the student’s share of reduced-price breakfast and lunch, so meals are free to all students who are approved for either free or reduced-price meals.
The report includes the total number of students approved for free and reduced-price meals and the total number of students enrolled, as of the last operating day in October of the current school year, as reported by the SFA. Please note that other measures of student poverty in Vermont may report similar information, but as of the first day of October. Because student status may carry over for the first 30 operating days of the year, October 1st free and reduced rates may be higher than the rates found in this report.
“Approved” means that a student has been certified as qualifying for free or reduced-price meals based on an application submitted by the household, or they are Directly Certified as free-eligible. To qualify as income-eligible for free meals based on an application, a household’s income must be at or below 130% of the Federal poverty guidelines. To qualify as income-eligible for reduced-price meals, a household’s income must fall between 130% and 185% of Federal poverty guidelines. Updated guidelines are provided by USDA annually. Households may be Directly Certified for free meals when someone in the household receives 3SquaresVT or Reach-Up, or students are determined categorically eligible through Foster, Homeless, Migrant, or Head Start. Eligibility determinations are made at the SFA- or school-level by the Food Service Director, Administrative Assistants, or others designated by SFA or school administration.
The information in this report is based on information that SFAs report in the annual Site Enrollment Report. The percentages are calculated for all schools in the system participating in the National School Lunch Program. There are a few public schools in Vermont that do not participate in the National School Lunch Program and therefore are not included in this report. The data reported meets Vermont Agency of Education data governance requirements which eliminate any sensitive and/or potentially personally identifiable information from fewer than 11 students. As a result, some information from some schools is not available, and is replaced with two plus signs (++).
How the Report is organized:
The report is organized alphabetically by Supervisory Union/SFA. The schools participating within the Supervisory Union are listed by school name, followed by the total for all the schools in the Supervisory Union. Independent schools who participate in the National School Lunch Program are included alphabetically, except when they participate as sites under another SFA. In that case, they are listed under that SFA.
2020 Free & Reduced Eligibility Report Page 2 of 28
Column Headings
1. Supervisory Union2. School3. Number of students approved for free and reduced-price meals4. Enrollment in the school lunch program as of the last operating day in October. Note: Students are considered “enrolled” for the
purposes of this report if they have access to the school meals program.5. Percent of students enrolled in the lunch program who are approved for free and reduced-price school meals
Statewide Average: The statewide total enrollment of students in school lunch programs is 84,541. The total number of students approved for free and reduced-price meals is 32,397. Therefore, the statewide average is 38.32%.
2020 Free & Reduced Eligibility Report Page 3 of 28
Community Eligibility Provision (CEP) Schools
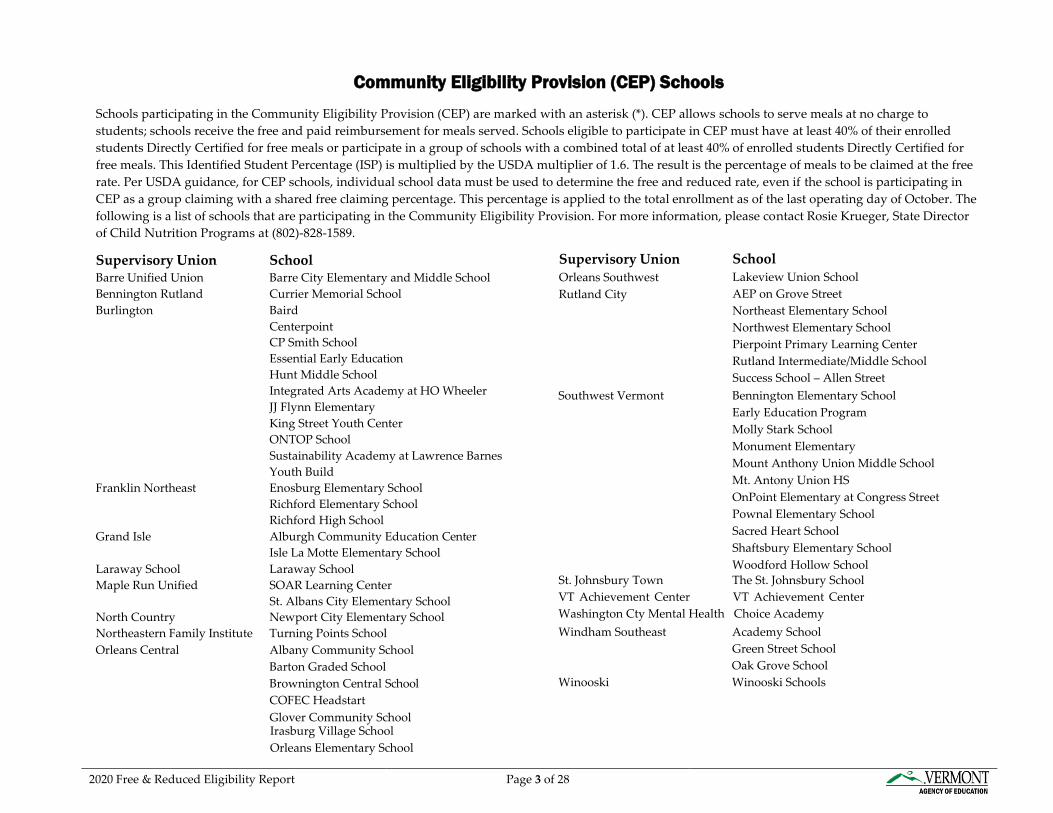
Schools participating in the Community Eligibility Provision (CEP) are marked with an asterisk (*). CEP allows schools to serve meals at no charge to students; schools receive the free and paid reimbursement for meals served. Schools eligible to participate in CEP must have at least 40% of their enrolled students Directly Certified for free meals or participate in a group of schools with a combined total of at least 40% of enrolled students Directly Certified for free meals. This Identified Student Percentage (ISP) is multiplied by the USDA multiplier of 1.6. The result is the percentage of meals to be claimed at the free rate. Per USDA guidance, for CEP schools, individual school data must be used to determine the free and reduced rate, even if the school is participating in CEP as a group claiming with a shared free claiming percentage. This percentage is applied to the total enrollment as of the last operating day of October. The following is a list of schools that are participating in the Community Eligibility Provision. For more information, please contact Rosie Krueger, State Director of Child Nutrition Programs at (802)-828-1589.
Supervisory Union School Barre Unified Union Barre City Elementary and Middle School Bennington Rutland Currier Memorial School Burlington Baird
Centerpoint CP Smith School Essential Early Education Hunt Middle School Integrated Arts Academy at HO Wheeler JJ Flynn Elementary King Street Youth Center ONTOP School Sustainability Academy at Lawrence Barnes Youth Build
Franklin Northeast Enosburg Elementary School Richford Elementary School Richford High School
Grand Isle Alburgh Community Education Center Isle La Motte Elementary School
Laraway School Laraway School Maple Run Unified SOAR Learning Center
St. Albans City Elementary School North Country Newport City Elementary School Northeastern Family Institute Turning Points School Orleans Central Albany Community School
Barton Graded School Brownington Central School COFEC Headstart Glover Community School Irasburg Village School Orleans Elementary School
Supervisory Union Orleans Southwest Rutland City
School Lakeview Union School AEP on Grove Street Northeast Elementary School Northwest Elementary School Pierpoint Primary Learning Center Rutland Intermediate/Middle School Success School – Allen Street
Southwest Vermont Bennington Elementary School Early Education Program Molly Stark School Monument Elementary Mount Anthony Union Middle School Mt. Antony Union HS OnPoint Elementary at Congress Street Pownal Elementary School Sacred Heart School Shaftsbury Elementary SchoolWoodford Hollow School
St. Johnsbury Town The St. Johnsbury School VT Achievement Center VT Achievement Center Washington Cty Mental Health Choice Academy Windham Southeast Academy School
Green Street School Oak Grove School
Winooski Winooski Schools
2020 Free & Reduced Eligibility Report Page 4 of 28
Provision 2 Schools
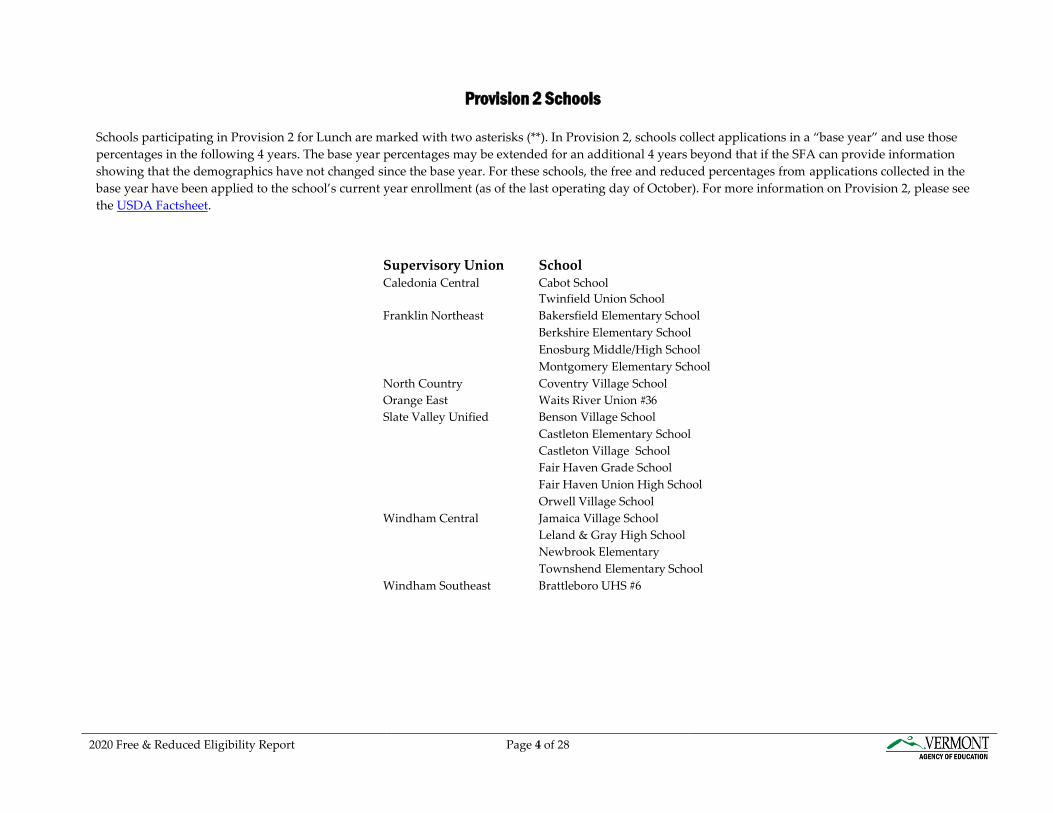
Schools participating in Provision 2 for Lunch are marked with two asterisks (**). In Provision 2, schools collect applications in a “base year” and use those percentages in the following 4 years. The base year percentages may be extended for an additional 4 years beyond that if the SFA can provide information showing that the demographics have not changed since the base year. For these schools, the free and reduced percentages from applications collected in the base year have been applied to the school’s current year enrollment (as of the last operating day of October). For more information on Provision 2, please see the USDA Factsheet.
Supervisory Union School Caledonia Central Cabot School
Twinfield Union School Franklin Northeast Bakersfield Elementary School
Berkshire Elementary School Enosburg Middle/High School Montgomery Elementary School
North Country Coventry Village School Orange East Waits River Union #36 Slate Valley Unified Benson Village School
Castleton Elementary School Castleton Village School Fair Haven Grade School Fair Haven Union High School Orwell Village School
Windham Central Jamaica Village School Leland & Gray High School Newbrook Elementary Townshend Elementary School
Windham Southeast Brattleboro UHS #6
Vermont Agency of EducationChild Nutrition Programs
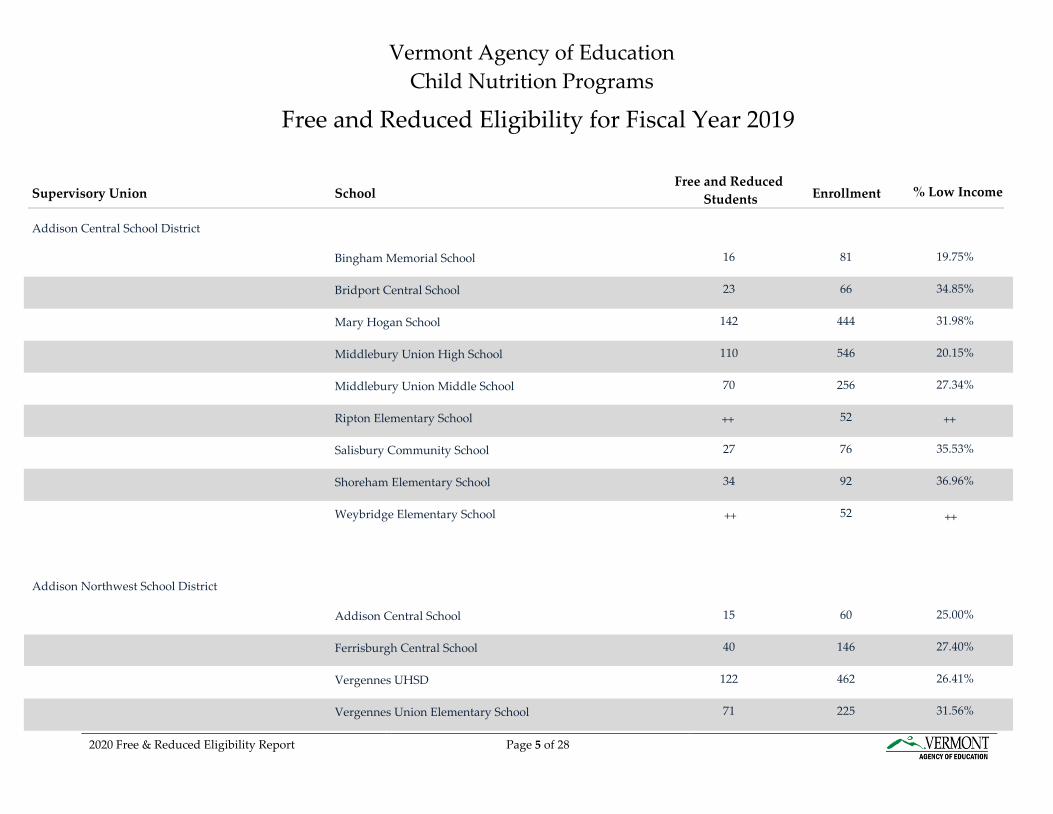
Free and Reduced Eligibility for Fiscal Year 2019
Supervisory Union SchoolFree and Reduced
Students Enrollment % Low Income
Addison Central School District
Bingham Memorial School 16 81 19.75%
Bridport Central School 23 66 34.85%
Mary Hogan School 142 444 31.98%
Middlebury Union High School 110 546 20.15%
Middlebury Union Middle School 70 256 27.34%
Ripton Elementary School 52
Salisbury Community School 27 76 35.53%
Shoreham Elementary School 34 92 36.96%
Weybridge Elementary School 52
Addison Northwest School District
Addison Central School 15 60 25.00%
Ferrisburgh Central School 40 146 27.40%
Vergennes UHSD 122 462 26.41%
Vergennes Union Elementary School 71 225 31.56%
++++
++ ++
2020 Free & Reduced Eligibility Report Page 5 of 28
Supervisory Union SchoolFree and Reduced
Students Enrollment % Low Income
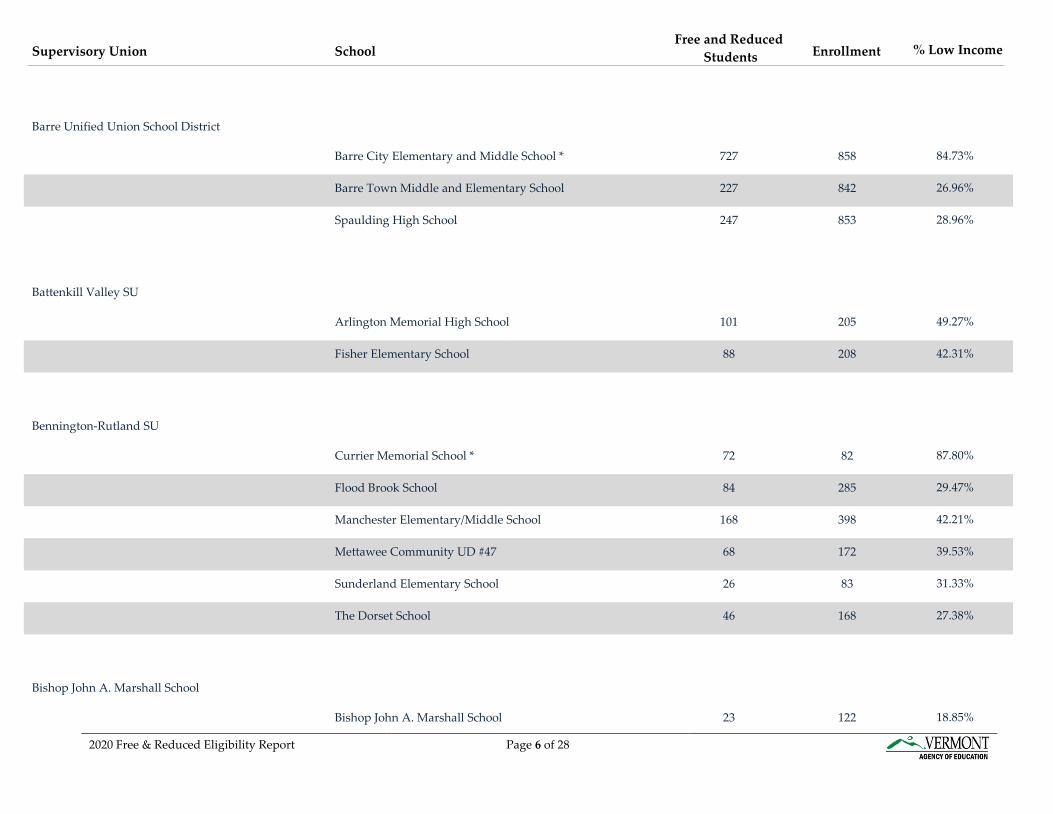
Barre Unified Union School District
Barre City Elementary and Middle School * 727 858 84.73%
Barre Town Middle and Elementary School 227 842 26.96%
Spaulding High School 247 853 28.96%
Battenkill Valley SU
Arlington Memorial High School 101 205 49.27%
Fisher Elementary School 88 208 42.31%
Bennington-Rutland SU
Currier Memorial School * 72 82 87.80%
Flood Brook School 84 285 29.47%
Manchester Elementary/Middle School 168 398 42.21%
Mettawee Community UD #47 68 172 39.53%
Sunderland Elementary School 26 83 31.33%
The Dorset School 46 168 27.38%
Bishop John A. Marshall School
Bishop John A. Marshall School 23 122 18.85%
2020 Free & Reduced Eligibility Report Page 6 of 28
Supervisory Union SchoolFree and Reduced
Students Enrollment % Low Income
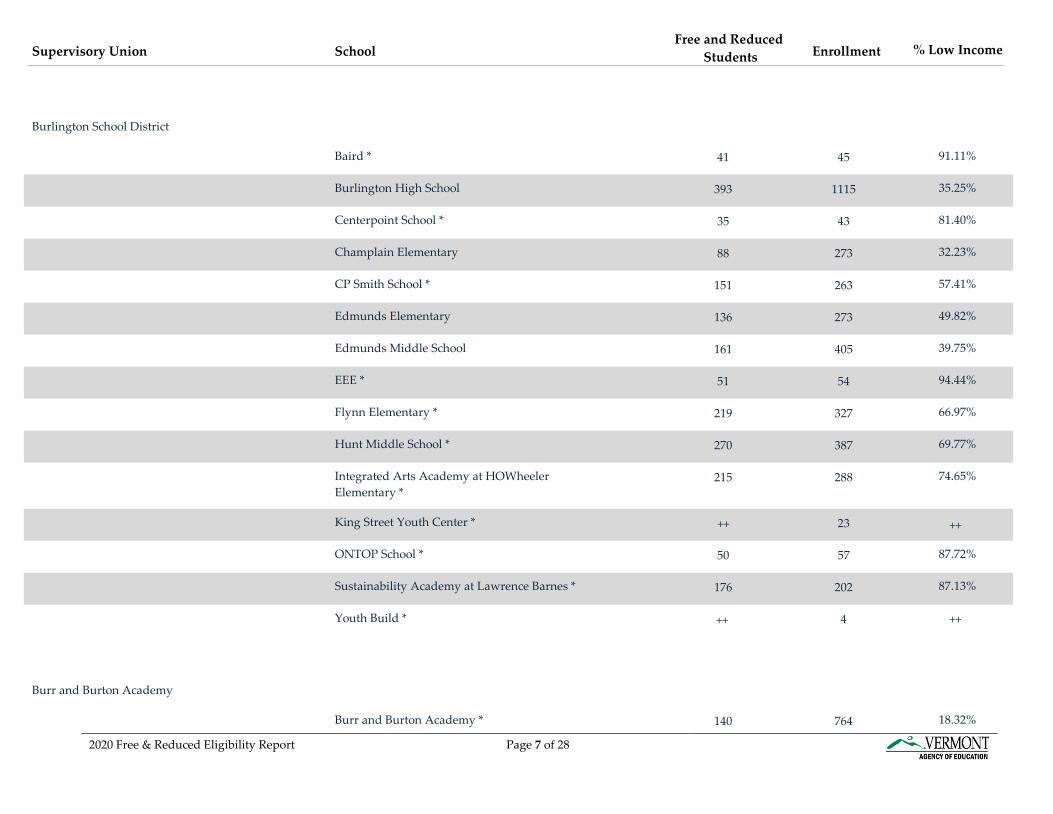
Burlington School District
Baird * 41 45 91.11%
Burlington High School 393 1115 35.25%
Centerpoint School * 35 43 81.40%
Champlain Elementary 88 273 32.23%
CP Smith School * 151 263 57.41%
Edmunds Elementary 136 273 49.82%
Edmunds Middle School 161 405 39.75%
EEE * 51 54 94.44%
Flynn Elementary * 219 327 66.97%
Hunt Middle School * 270 387 69.77%
Integrated Arts Academy at HOWheeler Elementary *
215 288 74.65%
King Street Youth Center * 23
ONTOP School * 50 57 87.72%
Sustainability Academy at Lawrence Barnes * 176 202 87.13%
Youth Build * 4
Burr and Burton Academy
Burr and Burton Academy * 140 764 18.32%
++ ++
++ ++
2020 Free & Reduced Eligibility Report Page 7 of 28
Supervisory Union SchoolFree and Reduced
Students Enrollment % Low Income
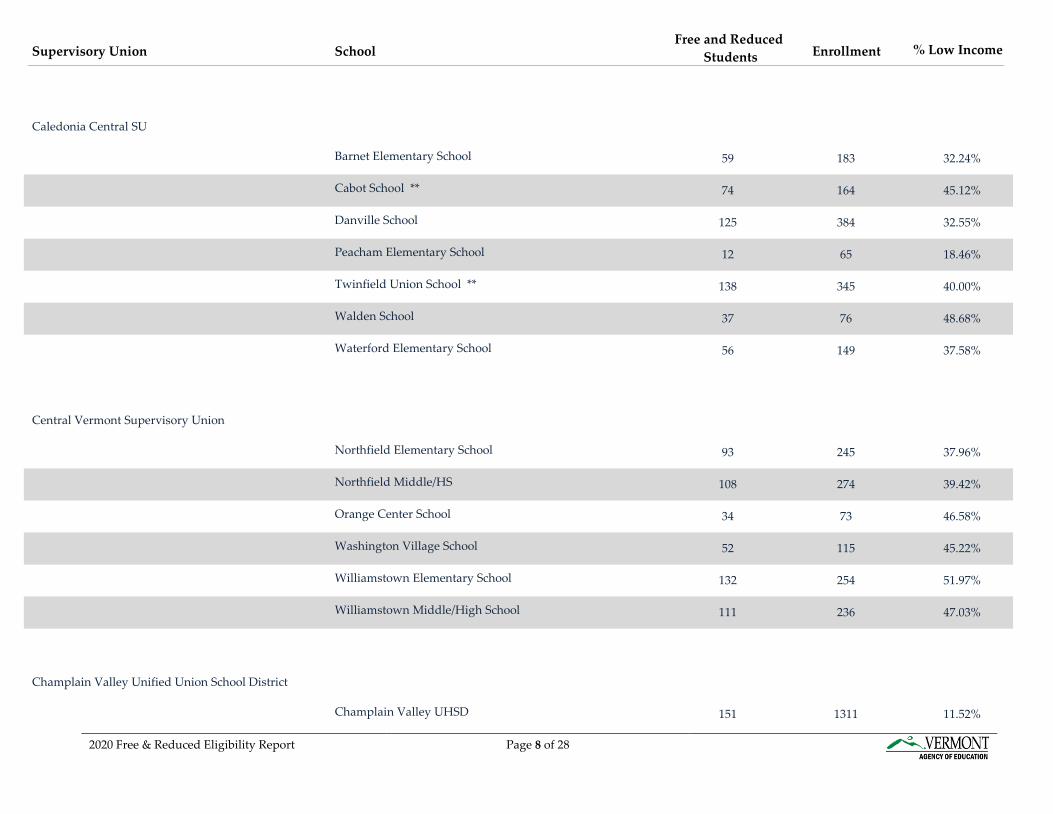
Caledonia Central SU
Barnet Elementary School 59 183 32.24%
Cabot School ** 74 164 45.12%
Danville School 125 384 32.55%
Peacham Elementary School 12 65 18.46%
Twinfield Union School ** 138 345 40.00%
Walden School 37 76 48.68%
Waterford Elementary School 56 149 37.58%
Central Vermont Supervisory Union
Northfield Elementary School 93 245 37.96%
Northfield Middle/HS 108 274 39.42%
Orange Center School 34 73 46.58%
Washington Village School 52 115 45.22%
Williamstown Elementary School 132 254 51.97%
Williamstown Middle/High School 111 236 47.03%
Champlain Valley Unified Union School District
Champlain Valley UHSD 151 1311 11.52%
2020 Free & Reduced Eligibility Report Page 8 of 28
Supervisory Union SchoolFree and Reduced
Students Enrollment % Low Income
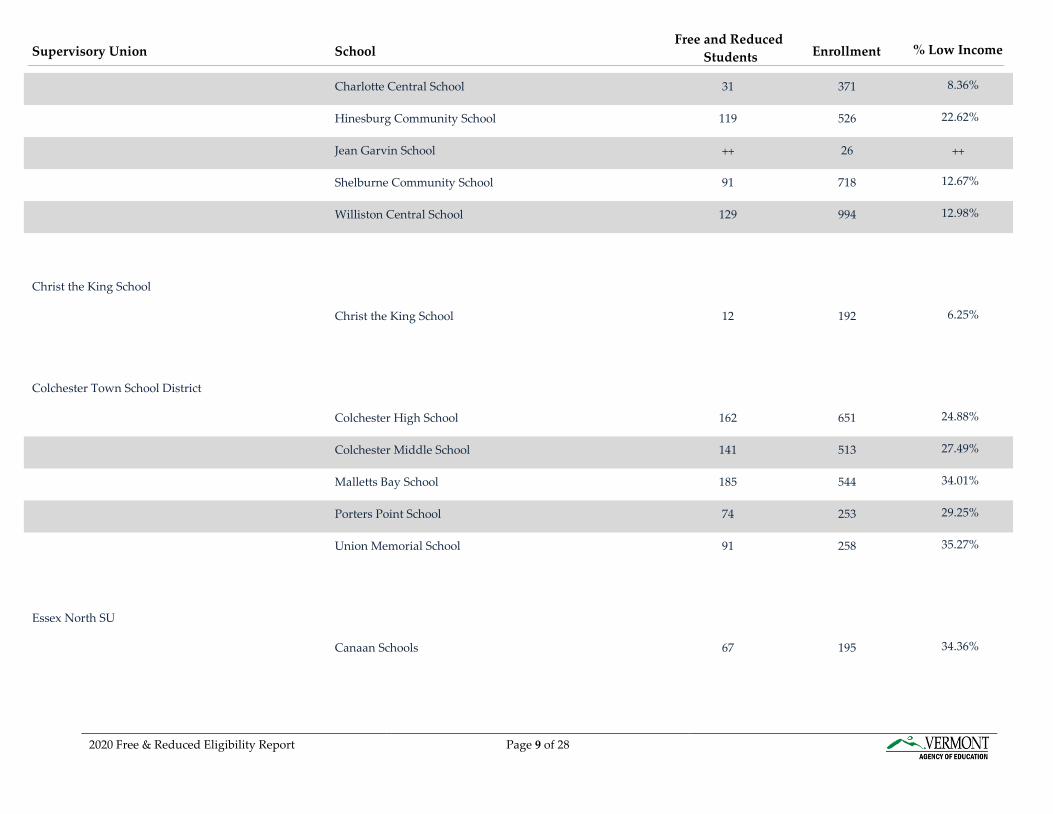
Charlotte Central School 31 371 8.36%
Hinesburg Community School 119 526 22.62%
Jean Garvin School 26
Shelburne Community School 91 718 12.67%
Williston Central School 129 994 12.98%
Christ the King School
Christ the King School 12 192 6.25%
Colchester Town School District
Colchester High School 162 651 24.88%
Colchester Middle School 141 513 27.49%
Malletts Bay School 185 544 34.01%
Porters Point School 74 253 29.25%
Union Memorial School 91 258 35.27%
Essex North SU
Canaan Schools 67 195 34.36%
++ ++
2020 Free & Reduced Eligibility Report Page 9 of 28
Supervisory Union SchoolFree and Reduced
Students Enrollment % Low Income
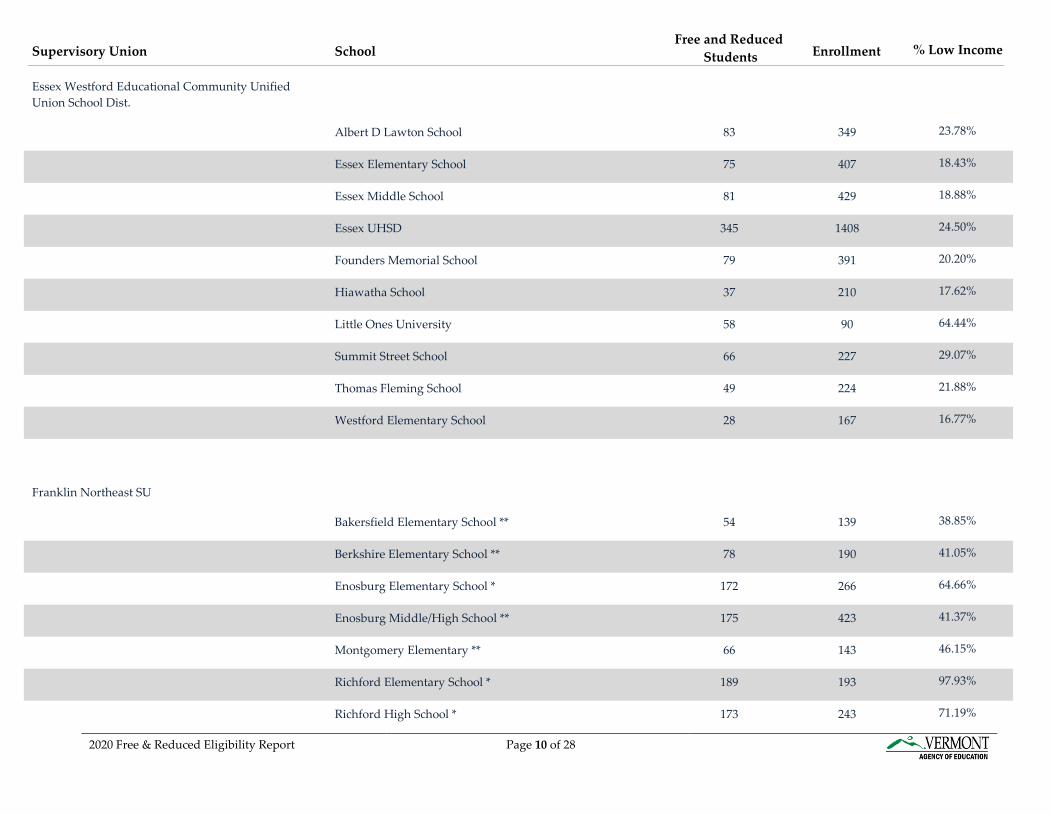
Essex Westford Educational Community Unified Union School Dist.
Albert D Lawton School 83 349 23.78%
Essex Elementary School 75 407 18.43%
Essex Middle School 81 429 18.88%
Essex UHSD 345 1408 24.50%
Founders Memorial School 79 391 20.20%
Hiawatha School 37 210 17.62%
Little Ones University 58 90 64.44%
Summit Street School 66 227 29.07%
Thomas Fleming School 49 224 21.88%
Westford Elementary School 28 167 16.77%
Franklin Northeast SU
Bakersfield Elementary School ** 54 139 38.85%
Berkshire Elementary School ** 78 190 41.05%
Enosburg Elementary School * 172 266 64.66%
Enosburg Middle/High School ** 175 423 41.37%
Montgomery Elementary ** 66 143 46.15%
Richford Elementary School * 189 193 97.93%
Richford High School * 173 243 71.19%
2020 Free & Reduced Eligibility Report Page 10 of 28
Supervisory Union SchoolFree and Reduced
Students Enrollment % Low Income
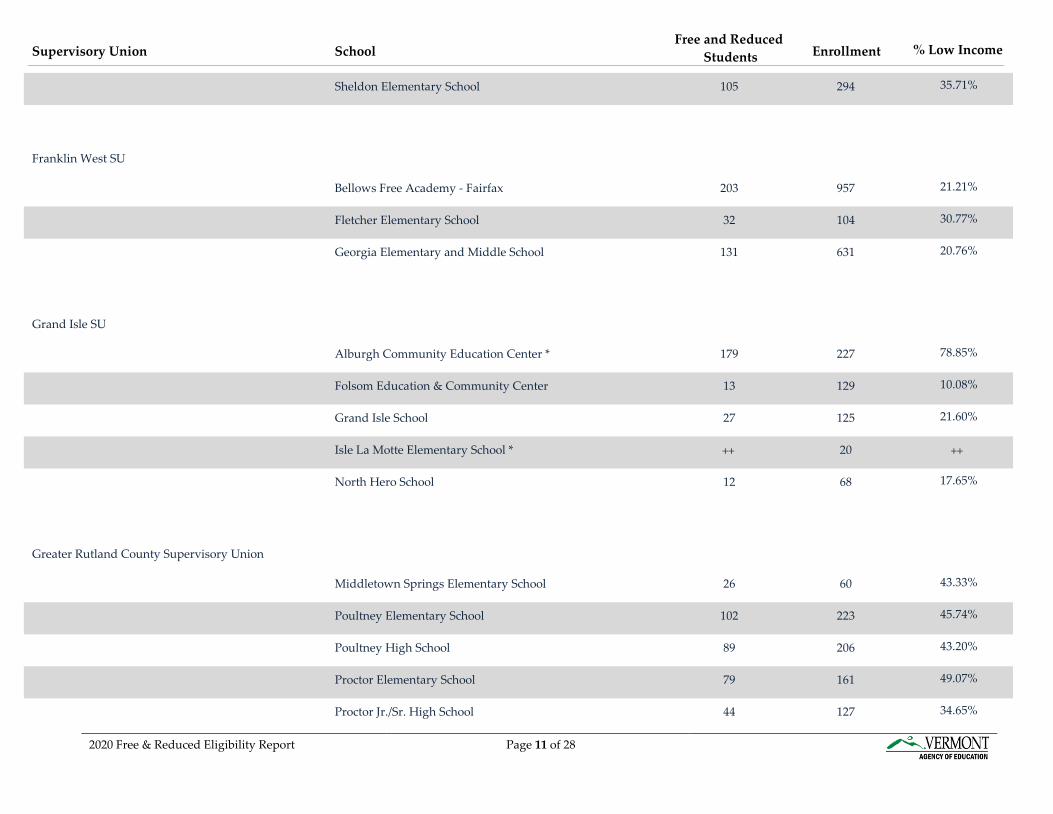
Sheldon Elementary School 105 294 35.71%
Franklin West SU
Bellows Free Academy - Fairfax 203 957 21.21%
Fletcher Elementary School 32 104 30.77%
Georgia Elementary and Middle School 131 631 20.76%
Grand Isle SU
Alburgh Community Education Center * 179 227 78.85%
Folsom Education & Community Center 13 129 10.08%
Grand Isle School 27 125 21.60%
Isle La Motte Elementary School * 20
North Hero School 12 68 17.65%
Greater Rutland County Supervisory Union
Middletown Springs Elementary School 26 60 43.33%
Poultney Elementary School 102 223 45.74%
Poultney High School 89 206 43.20%
Proctor Elementary School 79 161 49.07%
Proctor Jr./Sr. High School 44 127 34.65%
++ ++
2020 Free & Reduced Eligibility Report Page 11 of 28
Supervisory Union SchoolFree and Reduced
Students Enrollment % Low Income
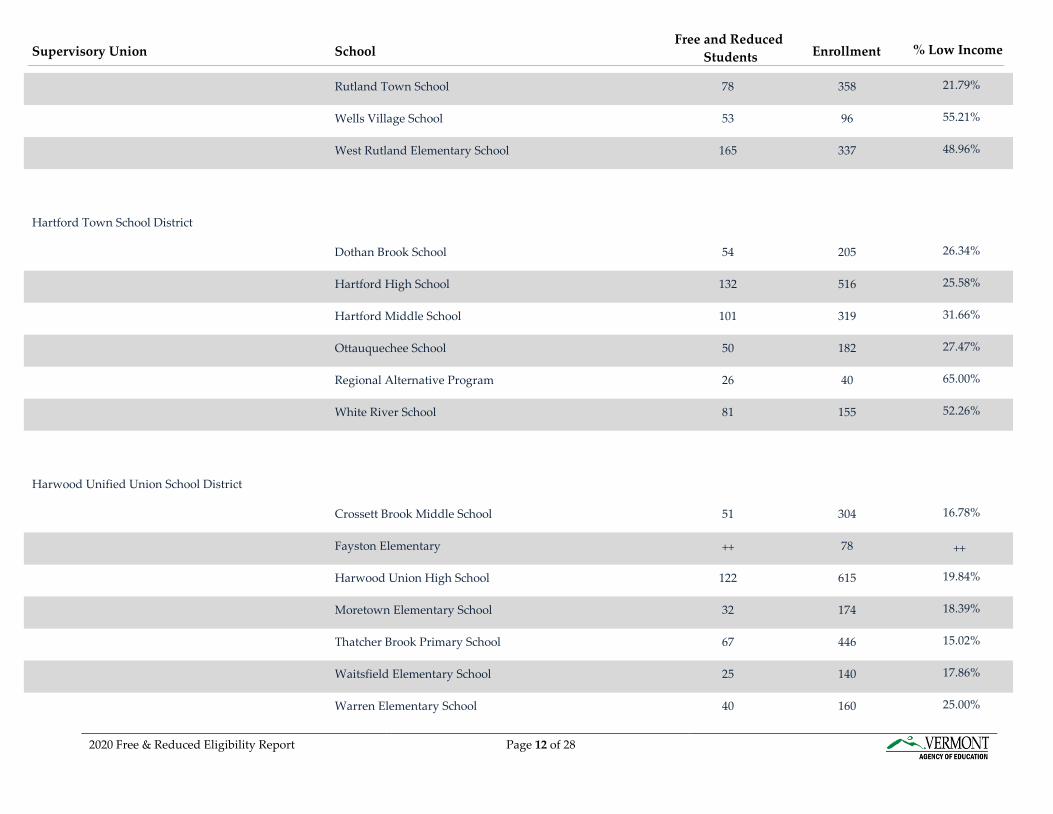
Rutland Town School 78 358 21.79%
Wells Village School 53 96 55.21%
West Rutland Elementary School 165 337 48.96%
Hartford Town School District
Dothan Brook School 54 205 26.34%
Hartford High School 132 516 25.58%
Hartford Middle School 101 319 31.66%
Ottauquechee School 50 182 27.47%
Regional Alternative Program 26 40 65.00%
White River School 81 155 52.26%
Harwood Unified Union School District
Crossett Brook Middle School 51 304 16.78%
Fayston Elementary 78
Harwood Union High School 122 615 19.84%
Moretown Elementary School 32 174 18.39%
Thatcher Brook Primary School 67 446 15.02%
Waitsfield Elementary School 25 140 17.86%
Warren Elementary School 40 160 25.00%
++ ++
2020 Free & Reduced Eligibility Report Page 12 of 28
Supervisory Union SchoolFree and Reduced
Students Enrollment % Low Income
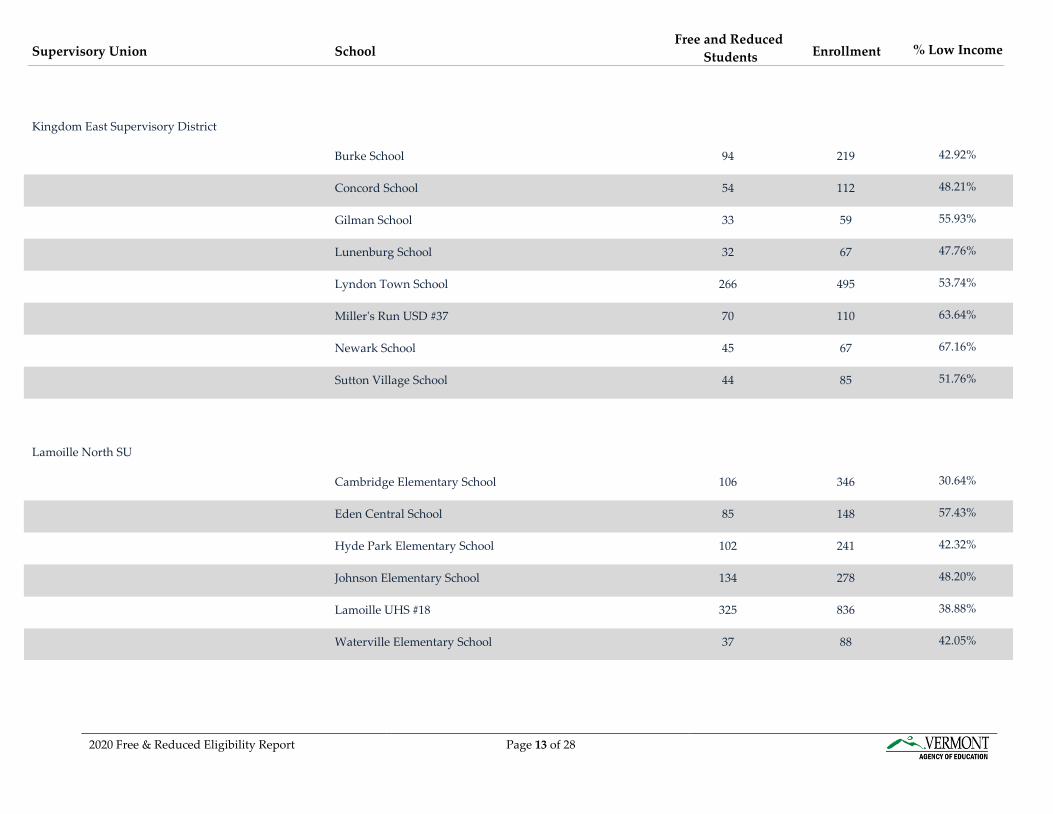
Kingdom East Supervisory District
Burke School 94 219 42.92%
Concord School 54 112 48.21%
Gilman School 33 59 55.93%
Lunenburg School 32 67 47.76%
Lyndon Town School 266 495 53.74%
Miller's Run USD #37 70 110 63.64%
Newark School 45 67 67.16%
Sutton Village School 44 85 51.76%
Lamoille North SU
Cambridge Elementary School 106 346 30.64%
Eden Central School 85 148 57.43%
Hyde Park Elementary School 102 241 42.32%
Johnson Elementary School 134 278 48.20%
Lamoille UHS #18 325 836 38.88%
Waterville Elementary School 37 88 42.05%
2020 Free & Reduced Eligibility Report Page 13 of 28
Supervisory Union SchoolFree and Reduced
Students Enrollment % Low Income
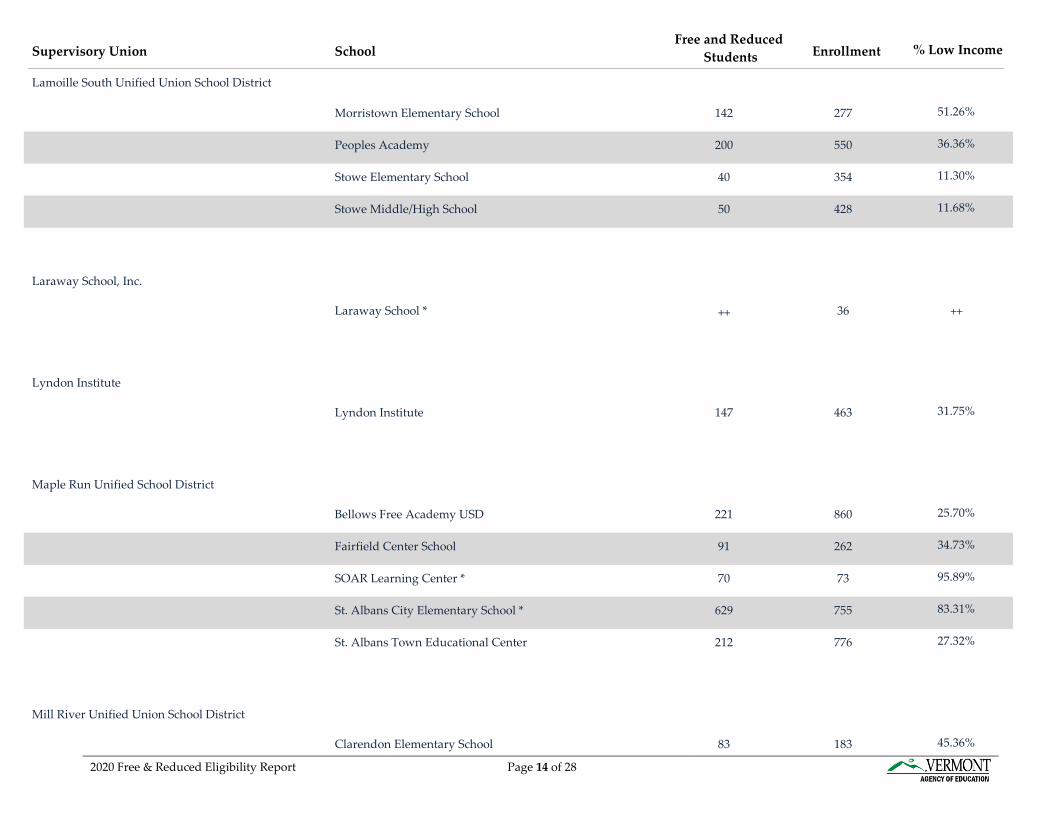
Morristown Elementary School 142 277 51.26%
Peoples Academy 200 550 36.36%
Stowe Elementary School 40 354 11.30%
Stowe Middle/High School 50 428 11.68%
Laraway School, Inc.
Laraway School * 36
Lyndon Institute
Lyndon Institute 147 463 31.75%
Maple Run Unified School District
Bellows Free Academy USD 221 860 25.70%
Fairfield Center School 91 262 34.73%
SOAR Learning Center * 70 73 95.89%
St. Albans City Elementary School * 629 755 83.31%
St. Albans Town Educational Center 212 776 27.32%
Mill River Unified Union School District
Clarendon Elementary School 83 183 45.36%
++ ++
Lamoille South Unified Union School District
2020 Free & Reduced Eligibility Report Page 14 of 28
Supervisory Union SchoolFree and Reduced
Students Enrollment % Low Income
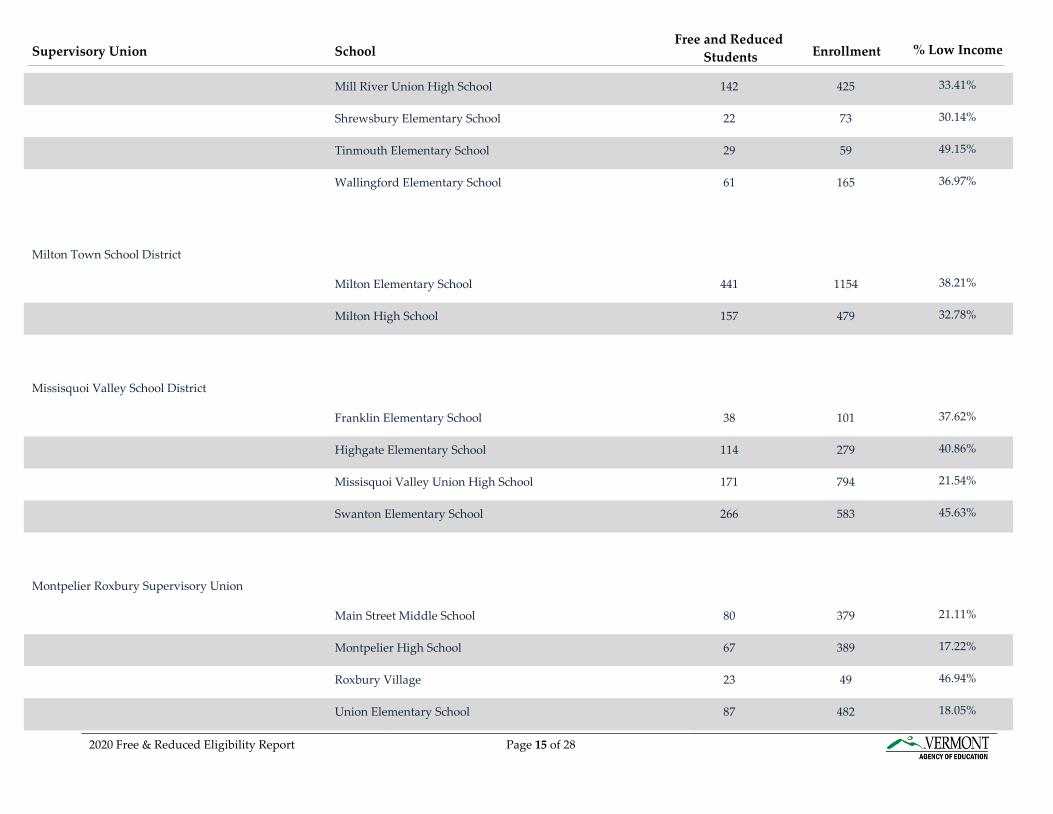
Mill River Union High School 142 425 33.41%
Shrewsbury Elementary School 22 73 30.14%
Tinmouth Elementary School 29 59 49.15%
Wallingford Elementary School 61 165 36.97%
Milton Town School District
Milton Elementary School 441 1154 38.21%
Milton High School 157 479 32.78%
Missisquoi Valley School District
Franklin Elementary School 38 101 37.62%
Highgate Elementary School 114 279 40.86%
Missisquoi Valley Union High School 171 794 21.54%
Swanton Elementary School 266 583 45.63%
Montpelier Roxbury Supervisory Union
Main Street Middle School 80 379 21.11%
Montpelier High School 67 389 17.22%
Roxbury Village 23 49 46.94%
Union Elementary School 87 482 18.05%
2020 Free & Reduced Eligibility Report Page 15 of 28
Supervisory Union SchoolFree and Reduced
Students Enrollment % Low Income
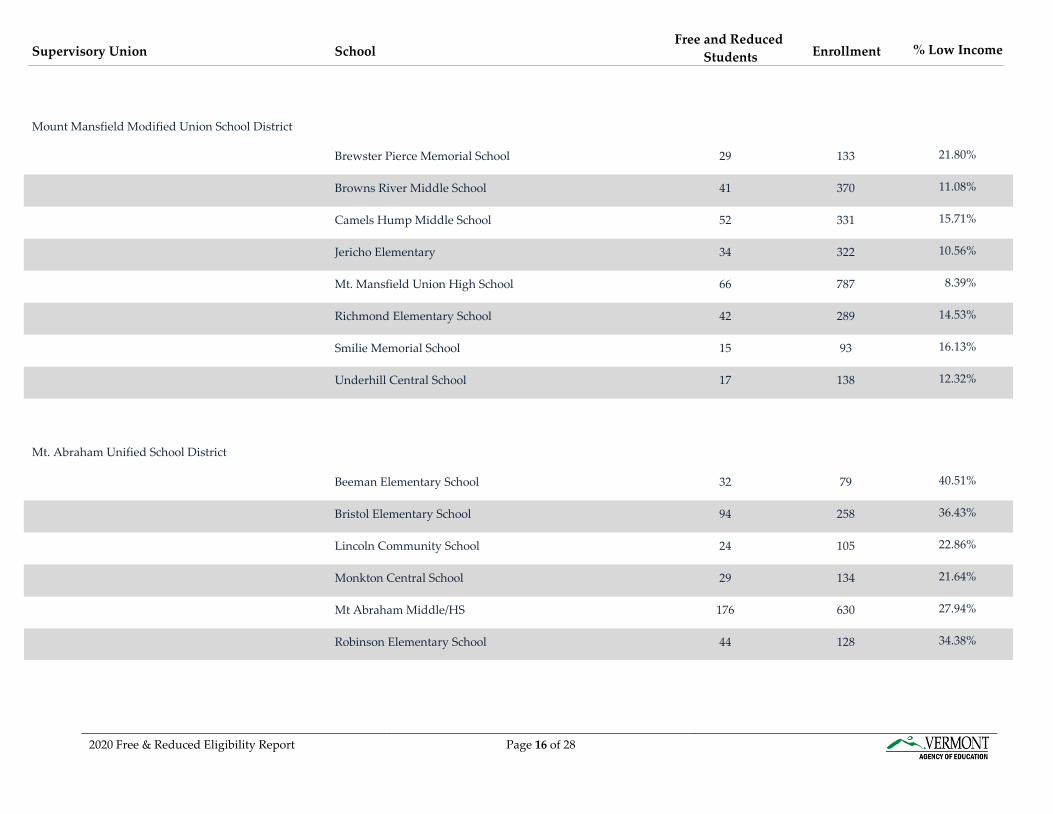
Mount Mansfield Modified Union School District
Brewster Pierce Memorial School 29 133 21.80%
Browns River Middle School 41 370 11.08%
Camels Hump Middle School 52 331 15.71%
Jericho Elementary 34 322 10.56%
Mt. Mansfield Union High School 66 787 8.39%
Richmond Elementary School 42 289 14.53%
Smilie Memorial School 15 93 16.13%
Underhill Central School 17 138 12.32%
Mt. Abraham Unified School District
Beeman Elementary School 32 79 40.51%
Bristol Elementary School 94 258 36.43%
Lincoln Community School 24 105 22.86%
Monkton Central School 29 134 21.64%
Mt Abraham Middle/HS 176 630 27.94%
Robinson Elementary School 44 128 34.38%
2020 Free & Reduced Eligibility Report Page 16 of 28
Supervisory Union SchoolFree and Reduced
Students Enrollment % Low Income
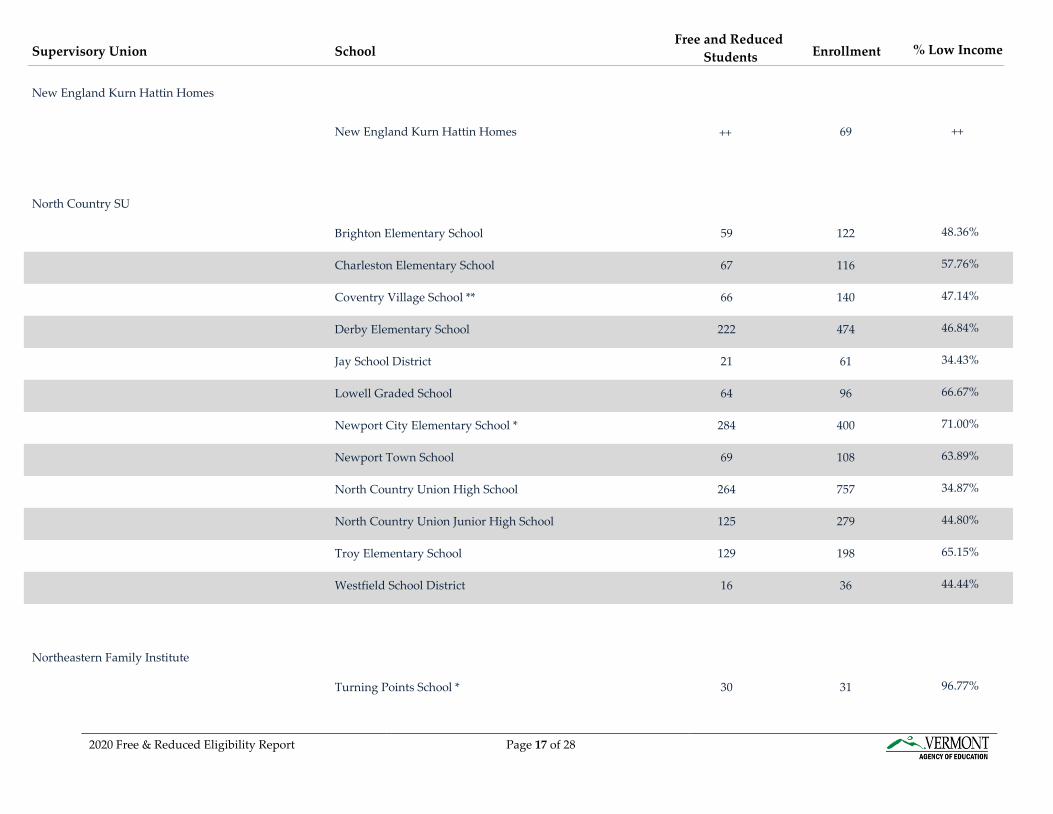
New England Kurn Hattin Homes 69
North Country SU
Brighton Elementary School 59 122 48.36%
Charleston Elementary School 67 116 57.76%
Coventry Village School ** 66 140 47.14%
Derby Elementary School 222 474 46.84%
Jay School District 21 61 34.43%
Lowell Graded School 64 96 66.67%
Newport City Elementary School * 284 400 71.00%
Newport Town School 69 108 63.89%
North Country Union High School 264 757 34.87%
North Country Union Junior High School 125 279 44.80%
Troy Elementary School 129 198 65.15%
Westfield School District 16 36 44.44%
Northeastern Family Institute
Turning Points School * 30 31 96.77%
New England Kurn Hattin Homes
++ ++
2020 Free & Reduced Eligibility Report Page 17 of 28
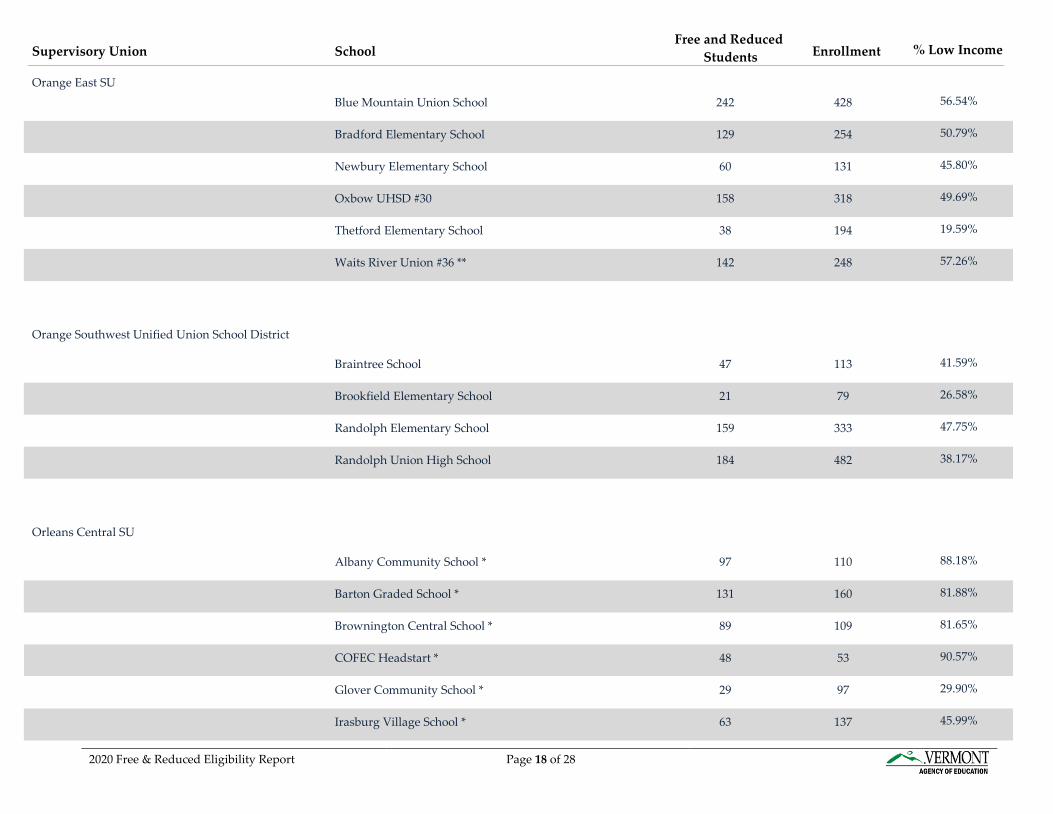
Supervisory Union SchoolFree and Reduced
Students Enrollment % Low Income
Blue Mountain Union School 242 428 56.54%
Bradford Elementary School 129 254 50.79%
Newbury Elementary School 60 131 45.80%
Oxbow UHSD #30 158 318 49.69%
Thetford Elementary School 38 194 19.59%
Waits River Union #36 ** 142 248 57.26%
Orange Southwest Unified Union School District
Braintree School 47 113 41.59%
Brookfield Elementary School 21 79 26.58%
Randolph Elementary School 159 333 47.75%
Randolph Union High School 184 482 38.17%
Orleans Central SU
Albany Community School * 97 110 88.18%
Barton Graded School * 131 160 81.88%
Brownington Central School * 89 109 81.65%
COFEC Headstart * 48 53 90.57%
Glover Community School * 29 97 29.90%
Irasburg Village School * 63 137 45.99%
Orange East SU
2020 Free & Reduced Eligibility Report Page 18 of 28
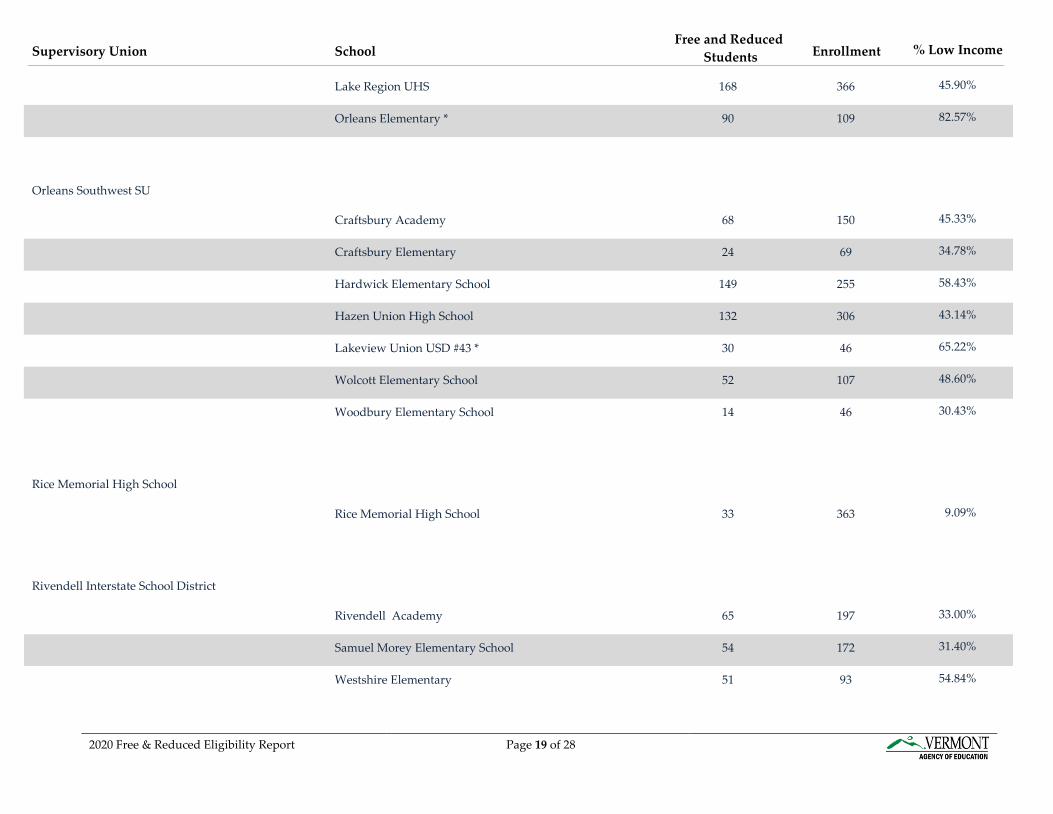
Supervisory Union SchoolFree and Reduced
Students Enrollment % Low Income
Lake Region UHS 168 366 45.90%
Orleans Elementary * 90 109 82.57%
Orleans Southwest SU
Craftsbury Academy 68 150 45.33%
Craftsbury Elementary 24 69 34.78%
Hardwick Elementary School 149 255 58.43%
Hazen Union High School 132 306 43.14%
Lakeview Union USD #43 * 30 46 65.22%
Wolcott Elementary School 52 107 48.60%
Woodbury Elementary School 14 46 30.43%
Rice Memorial High School
Rice Memorial High School 33 363 9.09%
Rivendell Interstate School District
Rivendell Academy 65 197 33.00%
Samuel Morey Elementary School 54 172 31.40%
Westshire Elementary 51 93 54.84%
2020 Free & Reduced Eligibility Report Page 19 of 28
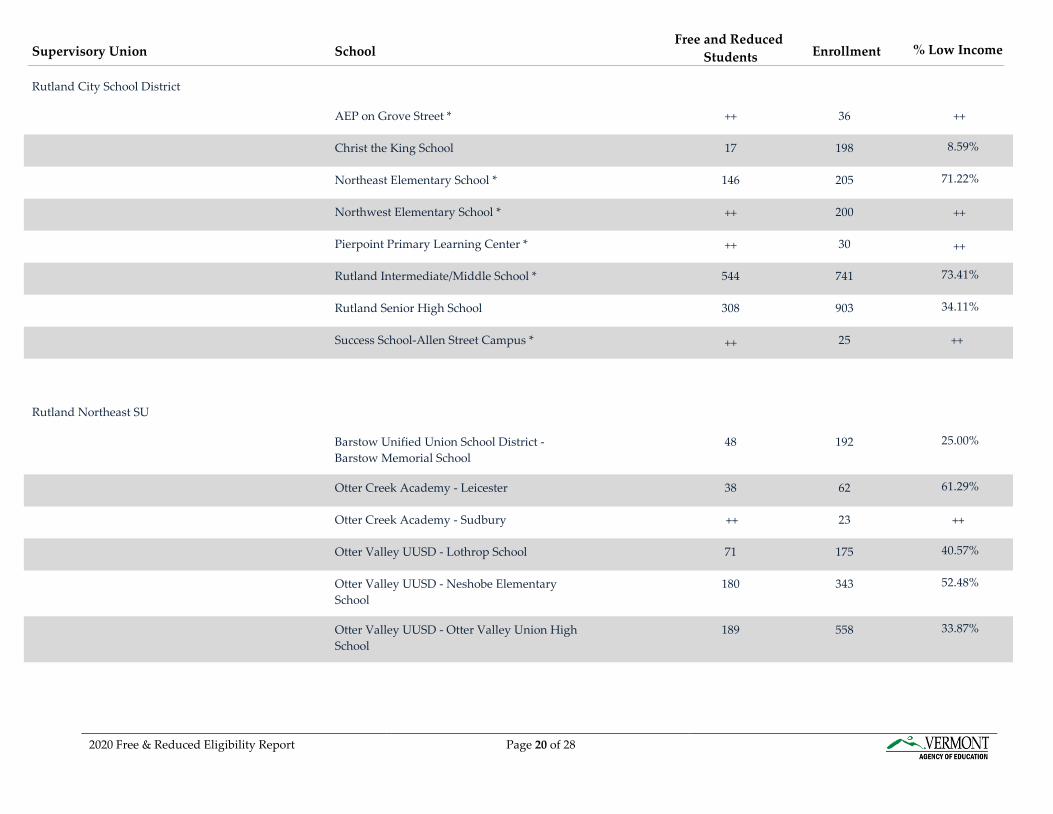
Supervisory Union SchoolFree and Reduced
Students Enrollment % Low Income
Rutland City School District
AEP on Grove Street * 36
Christ the King School 17 198 8.59%
Northeast Elementary School * 146 205 71.22%
Northwest Elementary School * 200
Pierpoint Primary Learning Center * 30
Rutland Intermediate/Middle School * 544 741 73.41%
Rutland Senior High School 308 903 34.11%
Success School-Allen Street Campus * 25
Rutland Northeast SU
Barstow Unified Union School District - Barstow Memorial School
48 192 25.00%
Otter Creek Academy - Leicester 38 62 61.29%
Otter Creek Academy - Sudbury 23
Otter Valley UUSD - Lothrop School 71 175 40.57%
Otter Valley UUSD - Neshobe Elementary School
180 343 52.48%
Otter Valley UUSD - Otter Valley Union High School
189 558 33.87%
++ ++
++ ++
++ ++
++ ++
++++
2020 Free & Reduced Eligibility Report Page 20 of 28
Supervisory Union SchoolFree and Reduced
Students Enrollment % Low Income
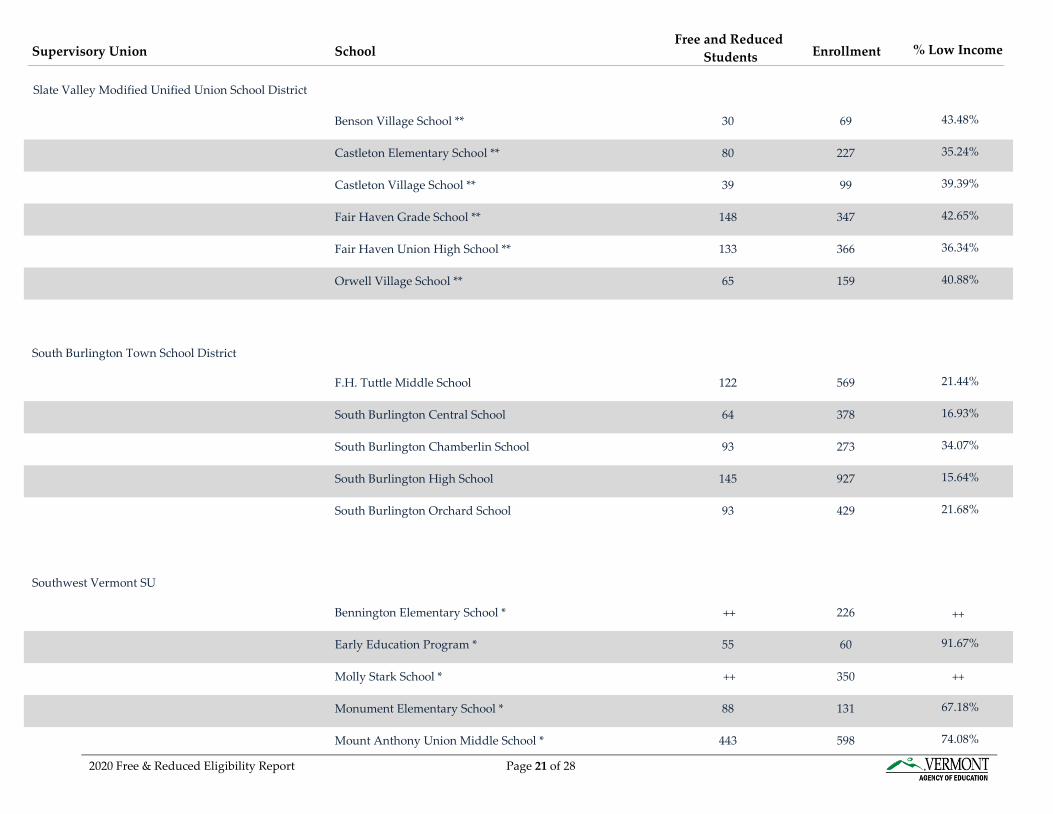
Benson Village School ** 30 69 43.48%
Castleton Elementary School ** 80 227 35.24%
Castleton Village School ** 39 99 39.39%
Fair Haven Grade School ** 148 347 42.65%
Fair Haven Union High School ** 133 366 36.34%
Orwell Village School ** 65 159 40.88%
South Burlington Town School District
F.H. Tuttle Middle School 122 569 21.44%
South Burlington Central School 64 378 16.93%
South Burlington Chamberlin School 93 273 34.07%
South Burlington High School 145 927 15.64%
South Burlington Orchard School 93 429 21.68%
Southwest Vermont SU
Bennington Elementary School * 226
Early Education Program * 55 60 91.67%
Molly Stark School * 350
Monument Elementary School * 88 131 67.18%
Mount Anthony Union Middle School * 443 598 74.08%
++ ++
++ ++
Slate Valley Modified Unified Union School District
2020 Free & Reduced Eligibility Report Page 21 of 28
Supervisory Union SchoolFree and Reduced
Students Enrollment % Low Income
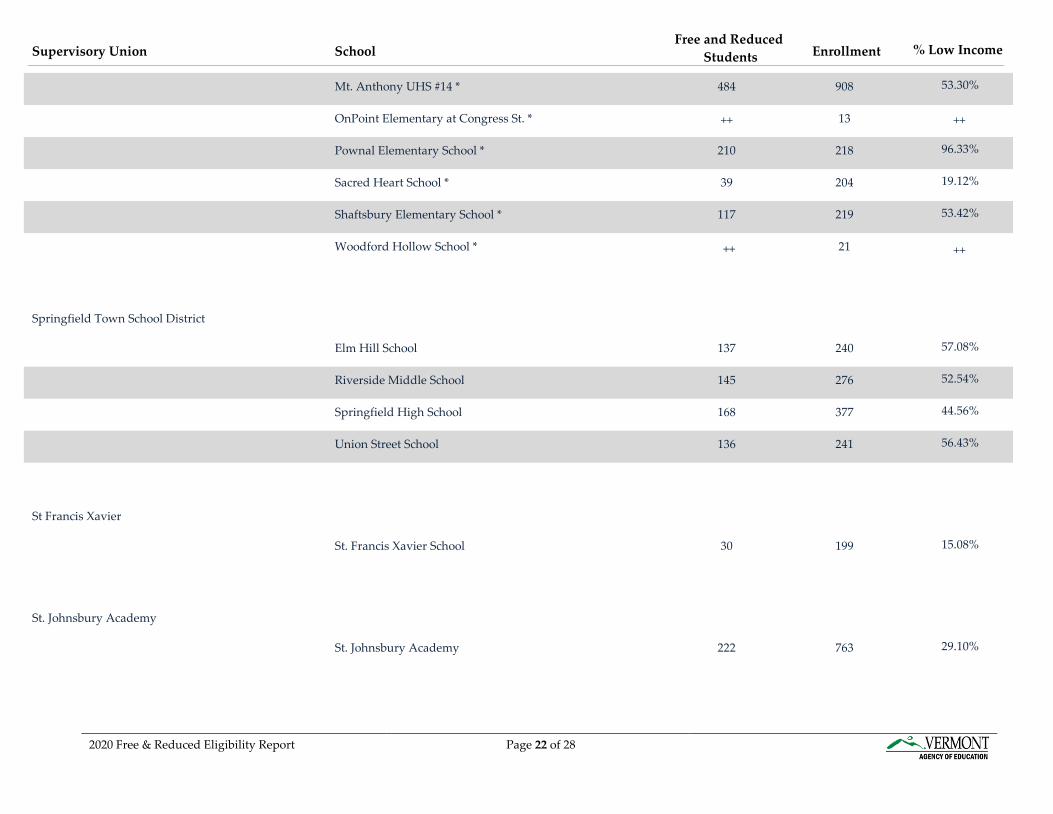
Mt. Anthony UHS #14 * 484 908 53.30%
OnPoint Elementary at Congress St. * 13
Pownal Elementary School * 210 218 96.33%
Sacred Heart School * 39 204 19.12%
Shaftsbury Elementary School * 117 219 53.42%
Woodford Hollow School * 21
Springfield Town School District
Elm Hill School 137 240 57.08%
Riverside Middle School 145 276 52.54%
Springfield High School 168 377 44.56%
Union Street School 136 241 56.43%
St Francis Xavier
St. Francis Xavier School 30 199 15.08%
St. Johnsbury Academy
St. Johnsbury Academy 222 763 29.10%
++ ++
++ ++
2020 Free & Reduced Eligibility Report Page 22 of 28
Supervisory Union SchoolFree and Reduced
Students Enrollment % Low Income
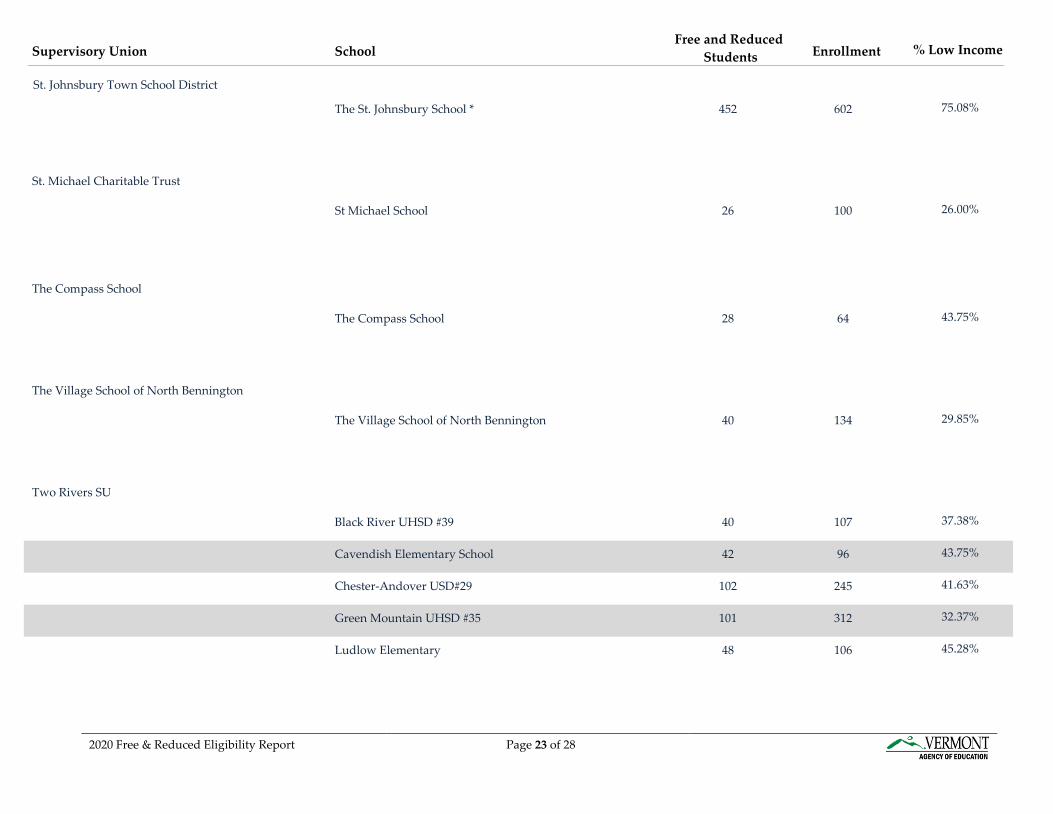
The St. Johnsbury School * 452 602 75.08%
St. Michael Charitable Trust
St Michael School 26 100 26.00%
The Compass School
The Compass School 28 64 43.75%
The Village School of North Bennington
The Village School of North Bennington 40 134 29.85%
Two Rivers SU
Black River UHSD #39 40 107 37.38%
Cavendish Elementary School 42 96 43.75%
Chester-Andover USD#29 102 245 41.63%
Green Mountain UHSD #35 101 312 32.37%
Ludlow Elementary 48 106 45.28%
St. Johnsbury Town School District
2020 Free & Reduced Eligibility Report Page 23 of 28
Supervisory Union SchoolFree and Reduced
Students Enrollment % Low Income
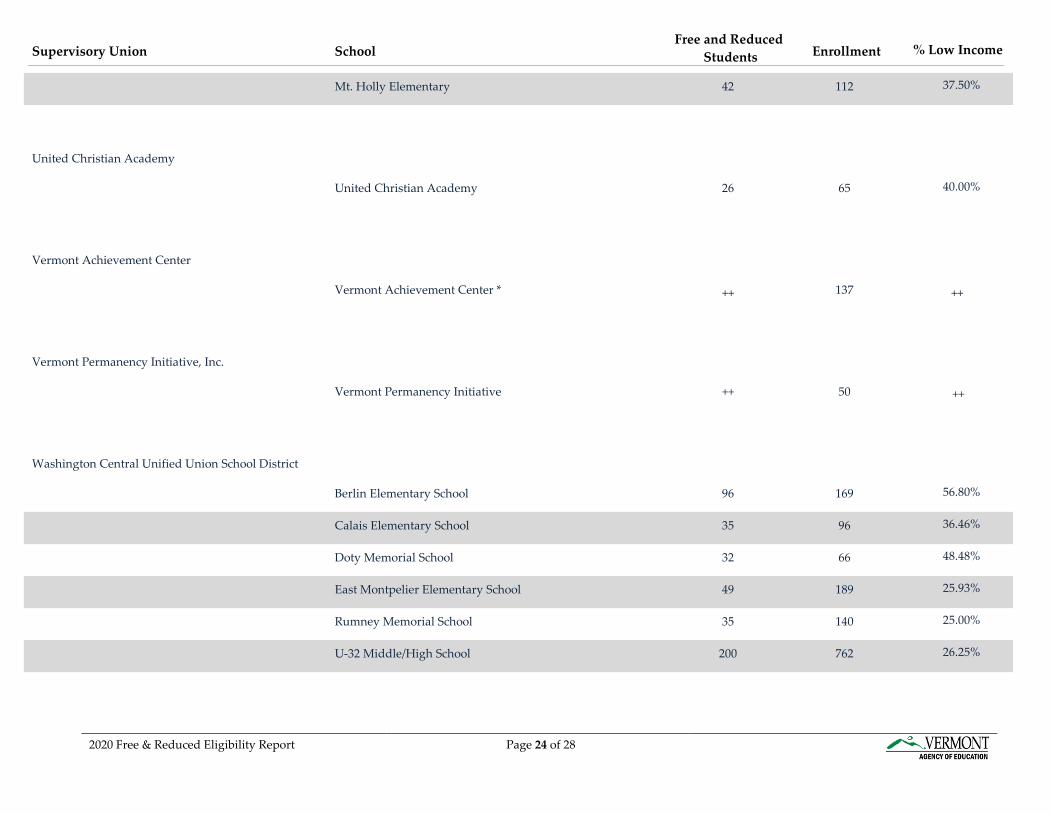
Mt. Holly Elementary 42 112 37.50%
United Christian Academy
United Christian Academy 26 65 40.00%
Vermont Achievement Center
Vermont Achievement Center * 137
Vermont Permanency Initiative, Inc.
Vermont Permanency Initiative 50
Washington Central Unified Union School District
Berlin Elementary School 96 169 56.80%
Calais Elementary School 35 96 36.46%
Doty Memorial School 32 66 48.48%
East Montpelier Elementary School 49 189 25.93%
Rumney Memorial School 35 140 25.00%
U-32 Middle/High School 200 762 26.25%
++ ++
++ ++
2020 Free & Reduced Eligibility Report Page 24 of 28
Supervisory Union SchoolFree and Reduced
Students Enrollment % Low Income
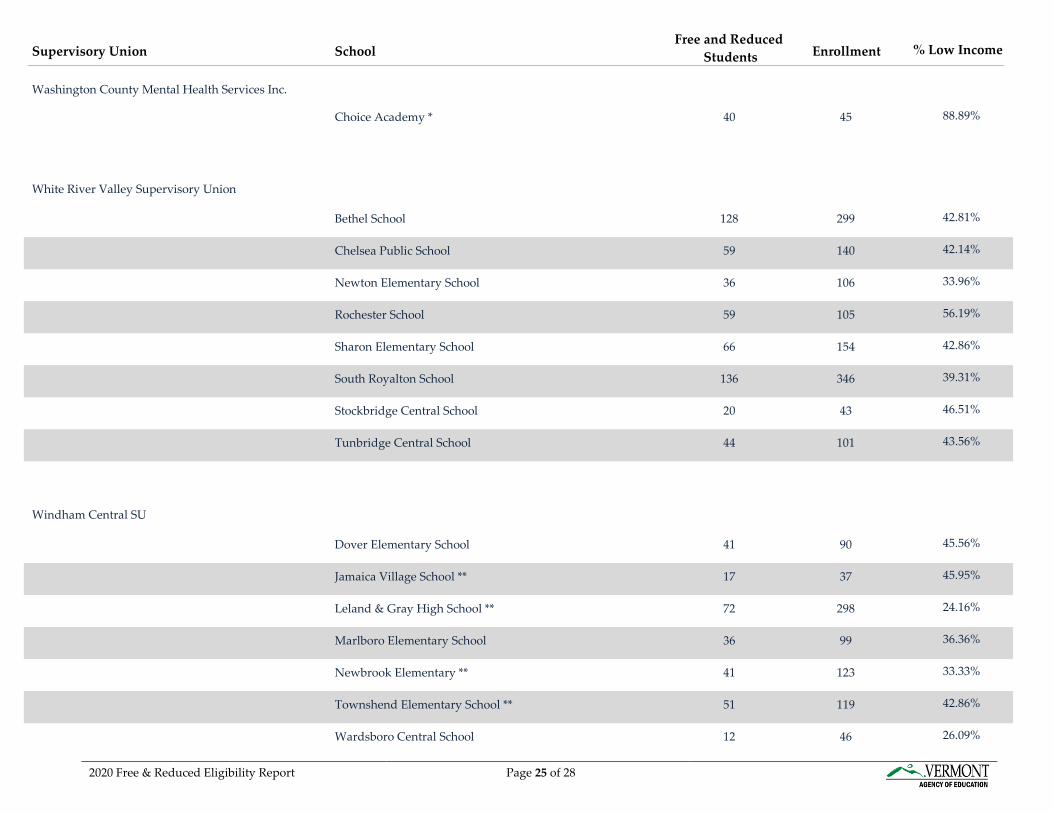
Choice Academy * 40 45 88.89%
White River Valley Supervisory Union
Bethel School 128 299 42.81%
Chelsea Public School 59 140 42.14%
Newton Elementary School 36 106 33.96%
Rochester School 59 105 56.19%
Sharon Elementary School 66 154 42.86%
South Royalton School 136 346 39.31%
Stockbridge Central School 20 43 46.51%
Tunbridge Central School 44 101 43.56%
Windham Central SU
Dover Elementary School 41 90 45.56%
Jamaica Village School ** 17 37 45.95%
Leland & Gray High School ** 72 298 24.16%
Marlboro Elementary School 36 99 36.36%
Newbrook Elementary ** 41 123 33.33%
Townshend Elementary School ** 51 119 42.86%
Wardsboro Central School 12 46 26.09%
Washington County Mental Health Services Inc.
2020 Free & Reduced Eligibility Report Page 25 of 28
Supervisory Union SchoolFree and Reduced
Students Enrollment % Low Income
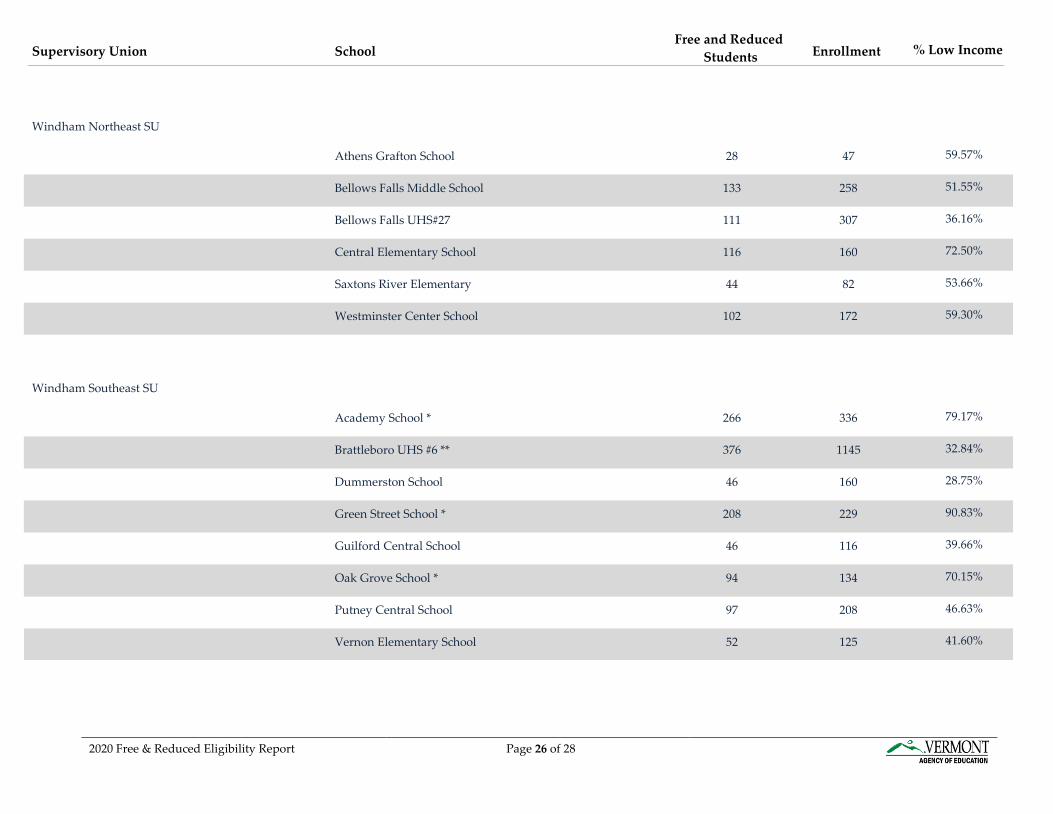
Windham Northeast SU
Athens Grafton School 28 47 59.57%
Bellows Falls Middle School 133 258 51.55%
Bellows Falls UHS#27 111 307 36.16%
Central Elementary School 116 160 72.50%
Saxtons River Elementary 44 82 53.66%
Westminster Center School 102 172 59.30%
Windham Southeast SU
Academy School * 266 336 79.17%
Brattleboro UHS #6 ** 376 1145 32.84%
Dummerston School 46 160 28.75%
Green Street School * 208 229 90.83%
Guilford Central School 46 116 39.66%
Oak Grove School * 94 134 70.15%
Putney Central School 97 208 46.63%
Vernon Elementary School 52 125 41.60%
2020 Free & Reduced Eligibility Report Page 26 of 28
Supervisory Union SchoolFree and Reduced
Students Enrollment % Low Income
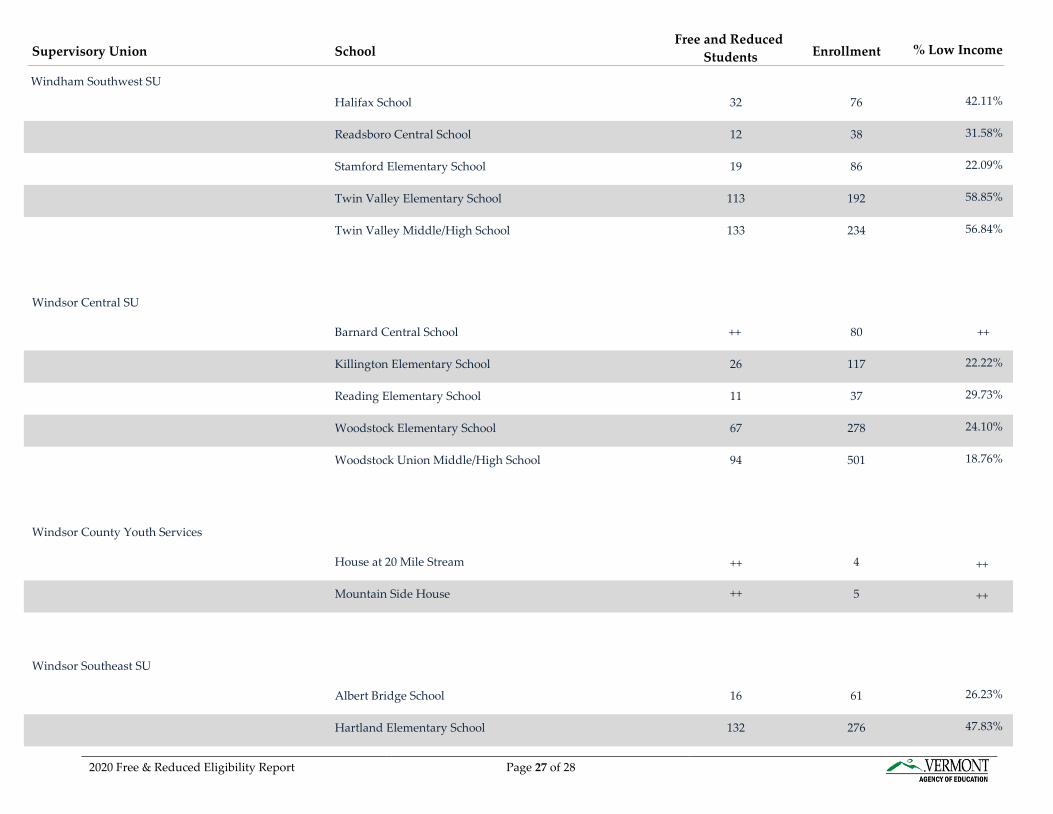
Halifax School 32 76 42.11%
Readsboro Central School 12 38 31.58%
Stamford Elementary School 19 86 22.09%
Twin Valley Elementary School 113 192 58.85%
Twin Valley Middle/High School 133 234 56.84%
Windsor Central SU
Barnard Central School 80
Killington Elementary School 26 117 22.22%
Reading Elementary School 11 37 29.73%
Woodstock Elementary School 67 278 24.10%
Woodstock Union Middle/High School 94 501 18.76%
Windsor County Youth Services
House at 20 Mile Stream 4
Mountain Side House 5
Windsor Southeast SU
Albert Bridge School 16 61 26.23%
Hartland Elementary School 132 276 47.83%
++ ++
++ ++
++ ++
Windham Southwest SU
2020 Free & Reduced Eligibility Report Page 27 of 28
Supervisory Union SchoolFree and Reduced
Students Enrollment % Low Income
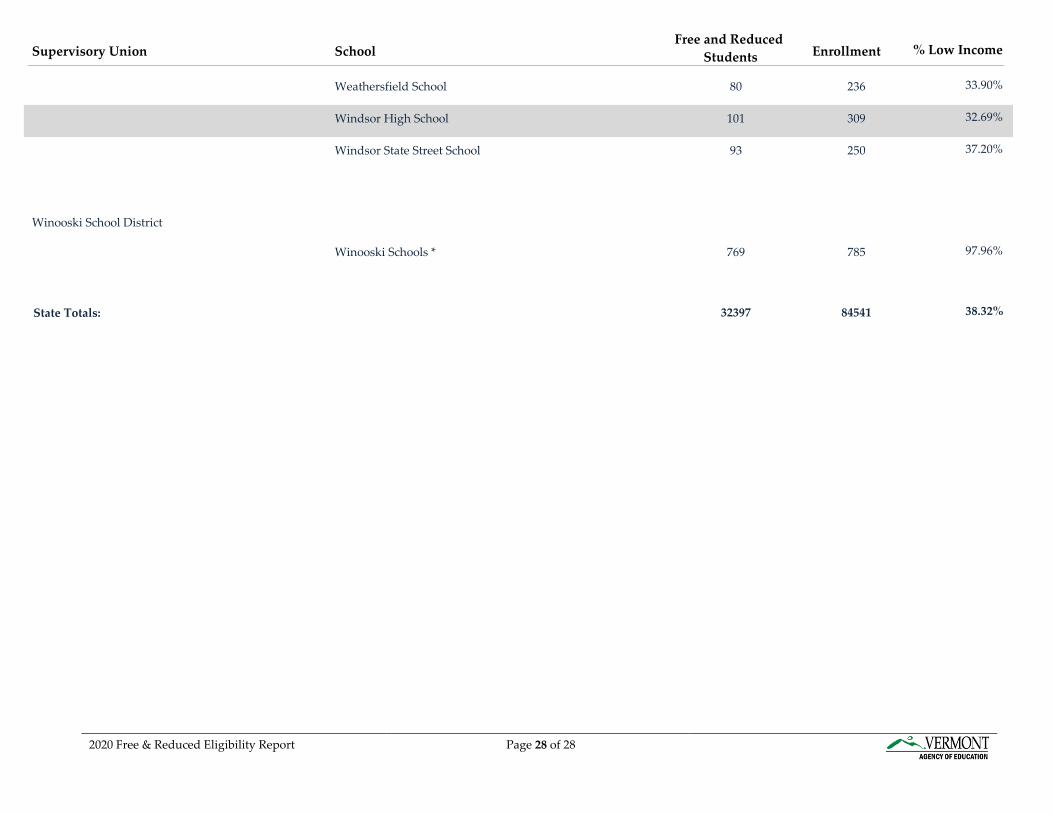
Weathersfield School 80 236 33.90%
Windsor High School 101 309 32.69%
Windsor State Street School 93 250 37.20%
Winooski School District
Winooski Schools * 769 785 97.96%
State Totals: 32397 84541 38.32%
2020 Free & Reduced Eligibility Report Page 28 of 28
Related Documents