1 VARIATION OF UNSTEADY FLOW PATTERN IN COMPRESSORS PRECEDING THE LOSS OF GASDYNAMIC STABILITY. EXPERIMENT. Ledovskaya N.N. Central institute of aviation motors (CIAM), Moscow Abstract The experimental investigation of unsteady flow pattern in model stages designed for application in compressors of modern turbofans having different design parameters and, respectively, different experimental characteristics *=f(G cor ) and * ad =f(G cor ) has been carried out. On the basis of the flow pattern analysis in a wide range of tip speeds and airflow as well as including the statistical analysis of pressure pulsations measured along the flowpath of the tested stages at different speeds – fromn =1.0 to 0.5 and variation of airflow from G cor max to G cor min it is shown that the approach to the instability boundary is accompanied by considerable variations of unsteady flow pattern which go with redistribution of pulsations energy to the low- frequency spectral region. Proposed is parameter П that characterizes the increase in intensity of pressure pulsations which are the result of the circumferential nonuniformity that is initiated in rotating rotors. 1.Introduction The goal of the work: detection of a symptom suitable for warning diagnostics of the onset of different-type flow instability The investigation of flow stability loss using special tools and methods allowing to determine the unsteady flow parameters and its pattern on the periphery of wheels of different-purpose compressors’ model stages has shown that if air flow reduces at fixed rotational speeds there takes place a significant change in pattern and unsteady parameters of flow in the passages of wheels’ peripheral sections, in the inlet duct and at exit. In order to evaluate the flow pattern in compressor stages there was used the system for measuring parameters of a pulsating flow. As is known, flow in the compressor stages’ flow path has an unsteady pulsating pattern. The main contribution to flow fluctuations upstream of the wheel, downstream of the wheel and the stage is made by harmonic flow oscillations at the wheel blade passing frequency and at the frequencies multiple of it that is a result of disturbances propagation in the form of expulsed shock waves, blades’ wakes, flow separation in the blade passages and leakages in the tip clearances. In order to investigate the unsteady flow pattern and to determine unsteady parameters there was created the system for measuring the parameters of a pulsating flow. This system uses the readings of fast-response pressure transducers and blade passing frequency sensors installed above the compressor rotor as well as the readings of probes (with fast-response pressure transducers) located upstream and downstream of the compressor. Stage instrumentation with fast – response sensors shown on figure 1 At present the methods is supplemented with measurements of temperature pulsations. The methods of determining unsteady flow pattern in compressors include: 1- measuring devices permitting to simultaneously measure averaged parameters of the pulsating flow - such as total and static pressure as well as pulsations of these parameters, flow velocities; 2- digital (or analog) recording equipment that performs recording and digital conversion of the measured analog data for subsequent processing; 3- reprocessing system which enables to obtain at any time the values of total and static pressure, flow velocity and the values of total pressure losses and pressure ratio.

Welcome message from author
This document is posted to help you gain knowledge. Please leave a comment to let me know what you think about it! Share it to your friends and learn new things together.
Transcript
1
VARIATION OF UNSTEADY FLOW PATTERN IN COMPRESSORS PRECEDING THE LOSS OF GASDYNAMIC
STABILITY. EXPERIMENT.
Ledovskaya N.N.
Central institute of aviation motors (CIAM), Moscow
Abstract
The experimental investigation of unsteady flow pattern in model stages designed for application in compressors of modern turbofans having different design parameters and, respectively, different experimental characteristics *=f(Gcor) and *ad=f(Gcor) has been carried out. On the basis of the flow pattern analysis in a wide range of tip speeds and airflow as well as including the statistical analysis of pressure pulsations measured along the flowpath of the tested stages at different speeds – fromn =1.0 to 0.5 and variation of airflow from Gcor max to G cor min it is shown that the approach to the instability boundary is accompanied by considerable variations of unsteady flow pattern which go with redistribution of pulsations energy to the low-frequency spectral region. Proposed is parameter П that characterizes the increase in intensity of pressure pulsations which are the result of the circumferential nonuniformity that is initiated in rotating rotors.
1.Introduction
The goal of the work: detection of a symptom suitable for warning diagnostics of the onset of different-type flow instability The investigation of flow stability loss using special tools and methods allowing to determine the unsteady flow parameters and its pattern on the periphery of wheels of different-purpose compressors’ model stages has shown that if air flow reduces at fixed rotational speeds there takes place a significant change in pattern and unsteady parameters of flow in the passages of wheels’ peripheral sections, in the inlet duct and at exit. In order to evaluate the flow pattern in compressor stages there was used the system for
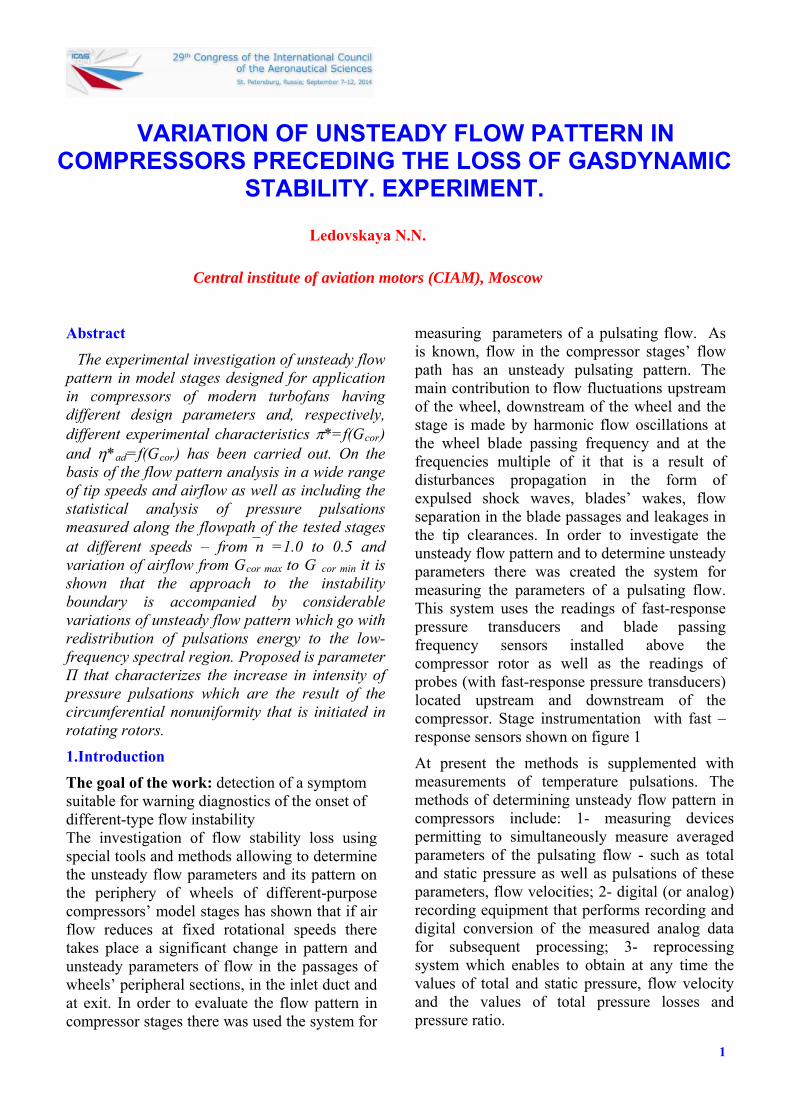
measuring parameters of a pulsating flow. As is known, flow in the compressor stages’ flow path has an unsteady pulsating pattern. The main contribution to flow fluctuations upstream of the wheel, downstream of the wheel and the stage is made by harmonic flow oscillations at the wheel blade passing frequency and at the frequencies multiple of it that is a result of disturbances propagation in the form of expulsed shock waves, blades’ wakes, flow separation in the blade passages and leakages in the tip clearances. In order to investigate the unsteady flow pattern and to determine unsteady parameters there was created the system for measuring the parameters of a pulsating flow. This system uses the readings of fast-response pressure transducers and blade passing frequency sensors installed above the compressor rotor as well as the readings of probes (with fast-response pressure transducers) located upstream and downstream of the compressor. Stage instrumentation with fast – response sensors shown on figure 1
At present the methods is supplemented with measurements of temperature pulsations. The methods of determining unsteady flow pattern in compressors include: 1- measuring devices permitting to simultaneously measure averaged parameters of the pulsating flow - such as total and static pressure as well as pulsations of these parameters, flow velocities; 2- digital (or analog) recording equipment that performs recording and digital conversion of the measured analog data for subsequent processing; 3- reprocessing system which enables to obtain at any time the values of total and static pressure, flow velocity and the values of total pressure losses and pressure ratio.
Ledovskaya N.N.
Fast-response pressure transducers Fine – wire resistance thermometer
Probe with fast – response transducers fore measurement flow velocities ( frequency range up 28KHz)
Figure 1. Stage instrumentation with fast – response sensors
00,10,20,30,40,5
0,60,70,80,9
1
1 944 1887 2830 3773 4716 5659 6602 7545 8488 9431
давление,кг
/см
2
time time time
0,92
0,94
0,96
0,98
1
1,02
1,04
0 2000 4000 6000 8000
время мкс
дав
лен
ие кг/см
2
0,9
0,95
1
1,05
1,1
1,15
1,2
0 1000 2000 3000 4000 5000 6000 7000 8000
время мкс
дав
лен
ие к
г/см
2
а) b) c)
Figure 2.Example of pressure changing of flow in the passages of wheels peripheral sections a), in the inlet duct (b)and at exit (d). The methods also enable to make statistic analysis of the obtained data and parameter averaging using the coherent summation algorithm; 4 - methods of determining temperature pulsations using a fine-wire resistance thermometer (wire diameter is 5 µm, natural frequencies range ~1,000 Hz with an extension of frequency range up to 30-40KHz) Example of pressure changing of flow in the passages of wheels peripheral sections a), in the inlet duct (b)and at exit (d) shown on fig. 2.
2
Ledovskaya N.N.
2.The investigation of the flow stability loss process in model stages of different-purpose compressors.
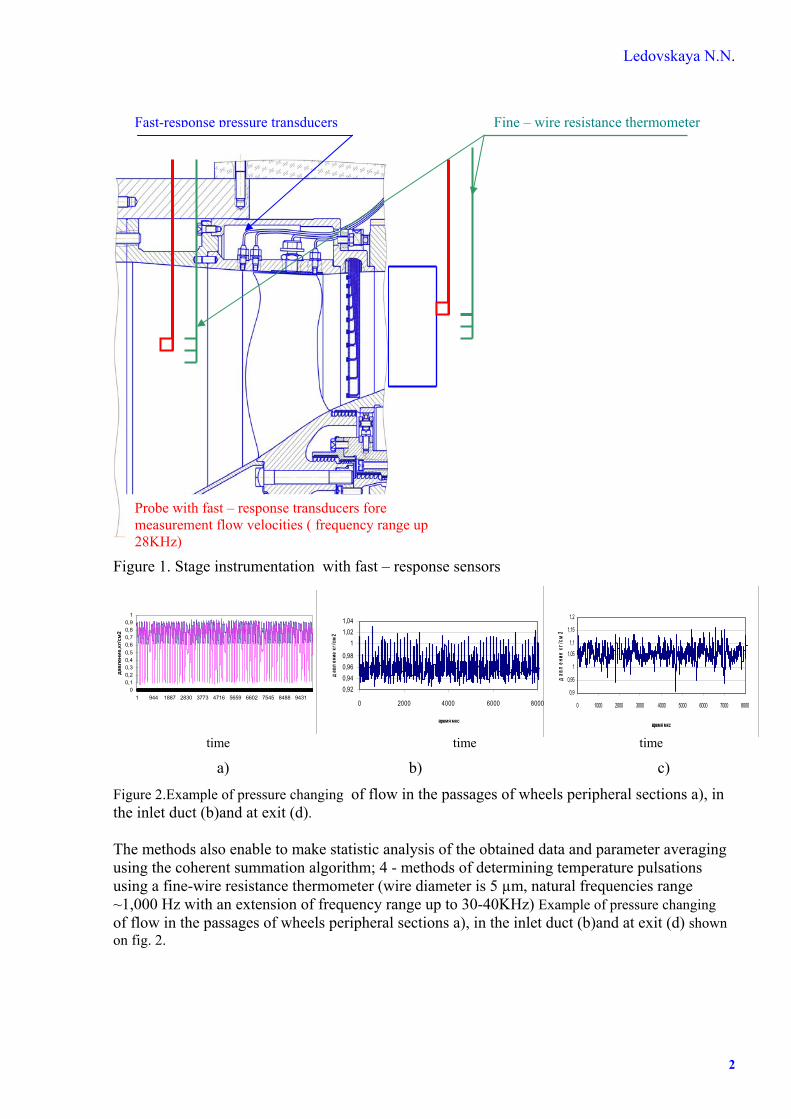
2.2 Variation of paramtres of the obtained data and parameter averaging when flow decrease.
а) b)
Fig. 3 The variation of RMS pressure deviation, blade passing frequency amplitude and pulsations in the 0...fnz band over a compressor stage flow path a) π * opt b) π* min
As it is seen in comparison fig.3a
with 3bby 30%, and the pulsation energy
peeds results
Fig. 4 Variation average parameters: – a) axial velocity 1а es β1 in relative motion on
, air flow decrease down to G min in a single-stage fan at constant rotational speed leads to change in the amplitude of RMS deviation of pressure and its distribution through the station passage. At that, the pulsations in the leading edge area increase
redistributes to the Δf=0…fw Zw band.
Air flow reduction at all rotational sin decrease of axiall flow velocity and,
subsequently, to decrease of angle β1 on the periphery as it can be seen in fig. 4 a,b.
а) b)
С ; – b) flow angl the model stage periphery
Изменение углов потока на периферии в относительном движении betta1 в С179
0
5
10
15
20
25
30
8 13 18 23 28
Gпр кг/с
bet
ta1 м
/с
Изменение осевой скорости на периферии в С179 C1a
0
50
100
150
200
250 35
0.5 b1
06 b1
0.65 b1
0.7 b1
0.75 b1
0.8 b1
0.85 b1
0.9 b1
0.95 b1
1b1
8 13 18 23 28
Gпр кг/с
С1
a м
/с
0.5 C1a
06 C1a
0.65 C1a
0.7C1a
0.75 C1a
0.8 C1a
0.85 C1a
0.9 C1a
0.95 C1a
1 C1a
0.5
0.7
0.8
0.9
1
3
Ledovskaya N.N.
2.1 In-time variation of both axial velocity pulsations and flow direction in relative motion at the wheel inlet at the optimal point of characteristics and at rotational speed accounting for 95% of the calculated value characteristics and at rotational speed accounting for 95% of the calculated value
The analysis of the available results of the experimentally investigated unsteady flow pattern in compressors has shown that when the compressor airflow decreases at the same rotational speed then the flow in the rotor gradually loses its stability that manifests itself in destabilization of flow in the compressor rotor blade passages. In this case the change of pressure pulsations measured on the wall above the rotor occurs. The pulsation detectors show that the root-mean-square deviation of pressure in a wide frequency band: f=0…40 kHz increases simultaneously with the change in the high-frequency spectral region. This change manifests itself in increase of the blade passing frequency harmonic’s amplitude An1
and the frequencies that are multiple of it – An2, Аn3 …Аnz.. The preliminary analysis of the measured unsteady parameters at the stage entry has shown that there are pulsating circumferential and radial periodic flow nonuniformities in the flowpath. The circumferential nonuniformity rotating together with the rotor is described by harmonics at the blade passing frequencies as well as by rotor harmonics in the low-frequency spectral region. The circumferential nonuniformity intensity varies depending on the operating mode in respect of rotational speed and airflow. It increases at all rotational speeds when approaching the instability boundary. At the same time the spectral composition of pressure pulsations in the f = 0…frot Zrot frequency band changes. Because of the change in the flow pattern and the increase in the circumferential nonuniformity intensity the blades in the adjacent blade passages are flown over differently, and the flow pattern in the passages differs. The difference becomes more evident with the decrease in the airflow and approach to the instability boundary. At that, the spectral
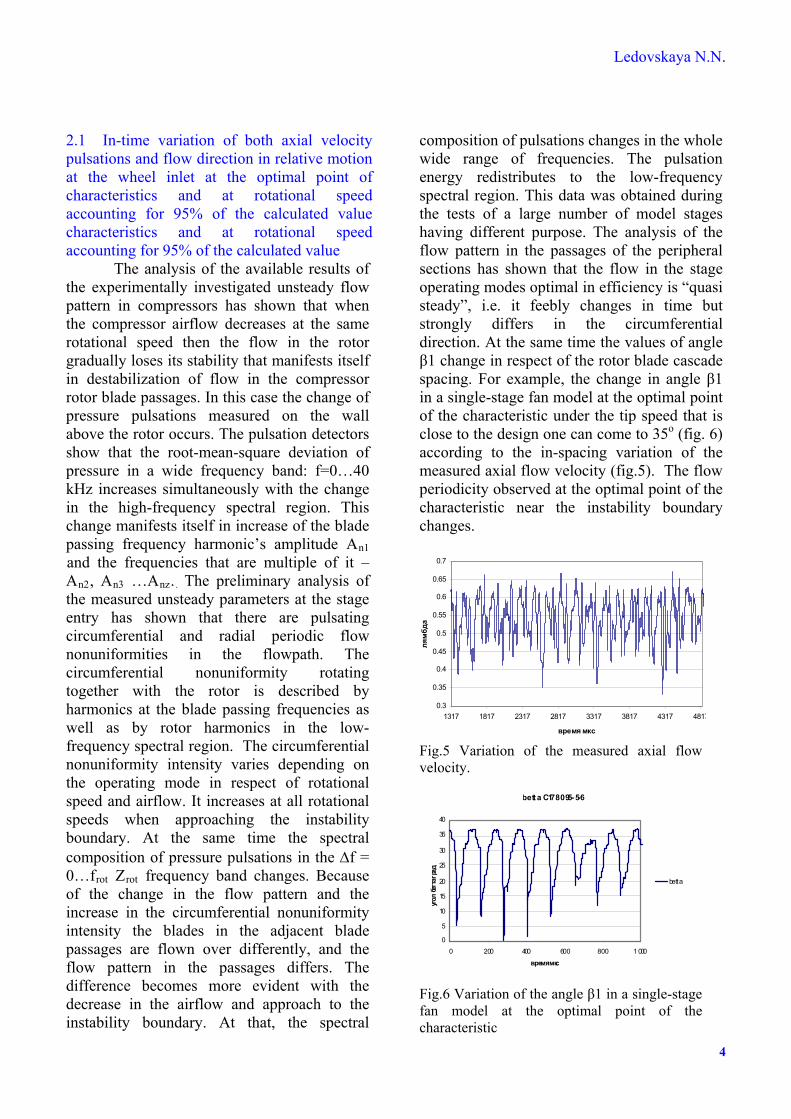
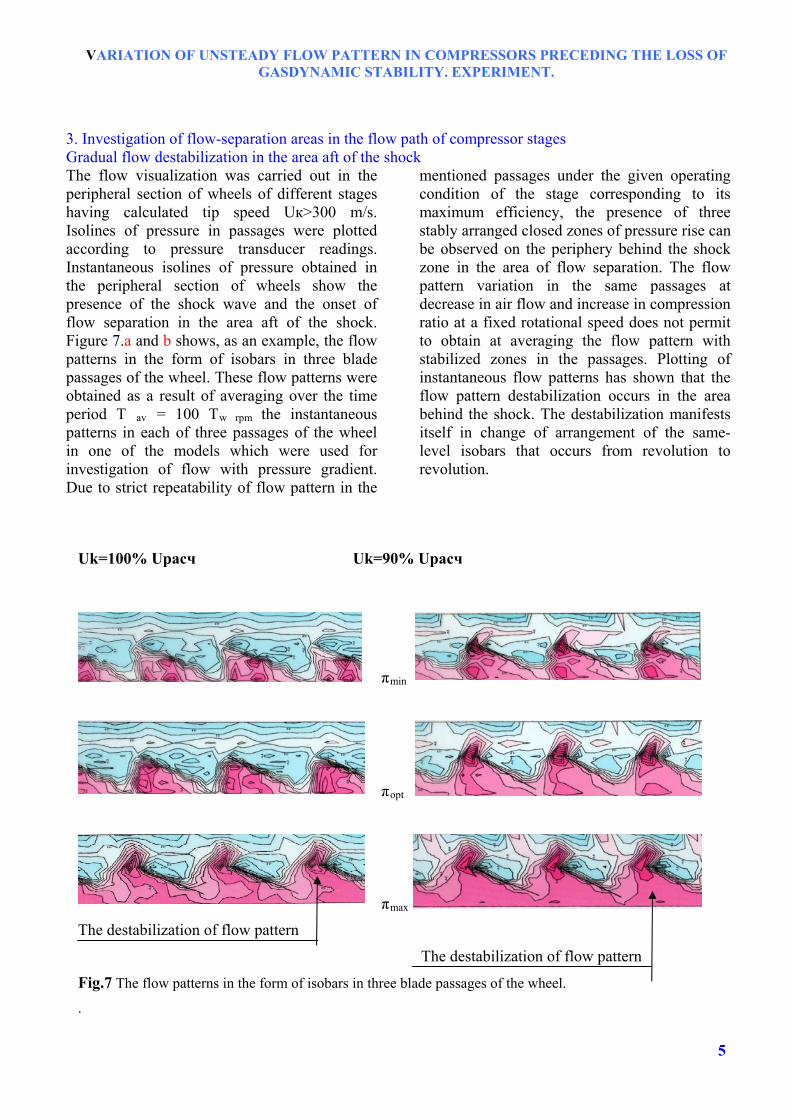
composition of pulsations changes in the whole wide range of frequencies. The pulsation energy redistributes to the low-frequency spectral region. This data was obtained during the tests of a large number of model stages having different purpose. The analysis of the flow pattern in the passages of the peripheral sections has shown that the flow in the stage operating modes optimal in efficiency is “quasi steady”, i.e. it feebly changes in time but strongly differs in the circumferential direction. At the same time the values of angle β1 change in respect of the rotor blade cascade spacing. For example, the change in angle β1 in a single-stage fan model at the optimal point of the characteristic under the tip speed that is close to the design one can come to 35o (fig. 6) according to the in-spacing variation of the measured axial flow velocity (fig.5). The flow periodicity observed at the optimal point of the characteristic near the instability boundary changes.
Fig.5 Variation of the measured axial flow velocity.
Fig.6 Variation of the angle β1 in a single-stage fan model at the optimal point of the characteristic
betta C178 095-5-6
0
5
10
15
20
25
30
35
40
0 200 400 600 800 1 000
время мкс
угол
бетта
град
betta
0.3
0.35
0.4
0.45
0.5
0.55
0.6
0.65
0.7
1317 1817 2317 2817 3317 3817 4317 4817
время мкс
лямбда
4
VARIATION OF UNSTEADY FLOW PATTERN IN COMPRESSORS PRECEDING THE LOSS OF GASDYNAMIC STABILITY. EXPERIMENT.
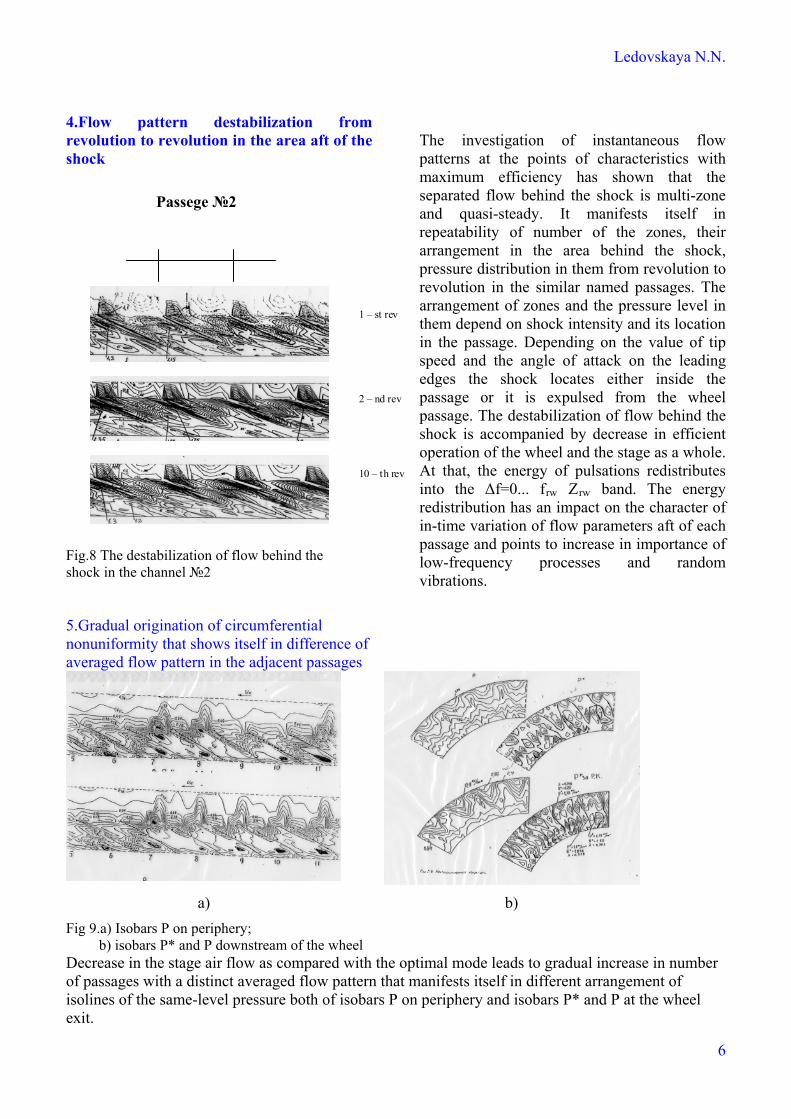
3. Investigation of flow-separation areas in the flow path of compressor stages Gradual flow destabilization in the area aft of the shock The flow visualization was carried out in the peripheral section of wheels of different stages having calculated tip speed Uк>300 m/s. Isolines of pressure in passages were plotted according to pressure transducer readings. Instantaneous isolines of pressure obtained in the peripheral section of wheels show the presence of the shock wave and the onset of flow separation in the area aft of the shock. Figure 7.a and b shows, as an example, the flow patterns in the form of isobars in three blade passages of the wheel. These flow patterns were obtained as a result of averaging over the time period Т av = 100 Тw rpm the instantaneous patterns in each of three passages of the wheel in one of the models which were used for investigation of flow with pressure gradient. Due to strict repeatability of flow pattern in the
mentioned passages under the given operating condition of the stage corresponding to its maximum efficiency, the presence of three stably arranged closed zones of pressure rise can be observed on the periphery behind the shock zone in the area of flow separation. The flow pattern variation in the same passages at decrease in air flow and increase in compression ratio at a fixed rotational speed does not permit to obtain at averaging the flow pattern with stabilized zones in the passages. Plotting of instantaneous flow patterns has shown that the flow pattern destabilization occurs in the area behind the shock. The destabilization manifests itself in change of arrangement of the same-level isobars that occurs from revolution to revolution.
Uk=100% Uрасч Uk=90% Uрасч
πmin
πopt
πmax
The destabilization of flow pattern
The destabilization of flow pattern
Fig.7 The flow patterns in the form of isobars in three blade passages of the wheel.
.
5
Ledovskaya N.N.
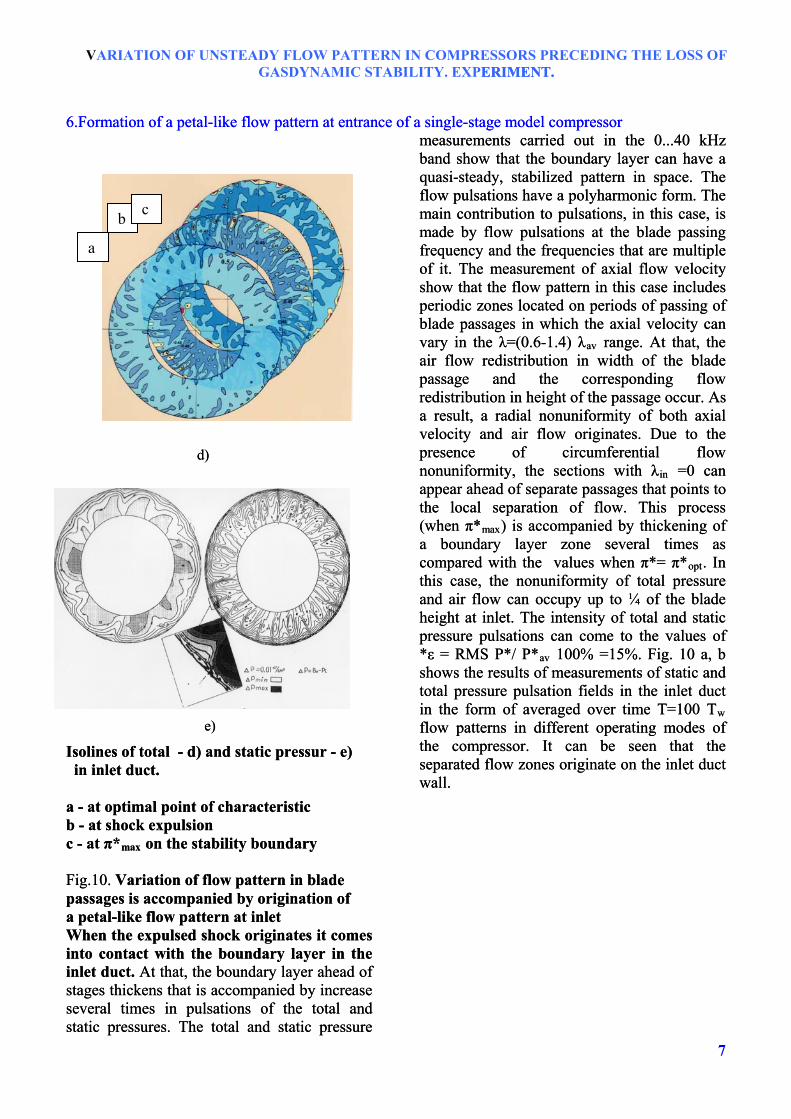
4.Flow pattern destabilization from revolution to revolution in the area aft of the shock
The investigation of instantaneous flow patterns at the points of characteristics with maximum efficiency has shown that the separated flow behind the shock is multi-zone and quasi-steady. It manifests itself in repeatability of number of the zones, their arrangement in the area behind the shock, pressure distribution in them from revolution to revolution in the similar named passages. The arrangement of zones and the pressure level in them depend on shock intensity and its location in the passage. Depending on the value of tip speed and the angle of attack on the leading edges the shock locates either inside the passage or it is expulsed from the wheel passage. The destabilization of flow behind the shock is accompanied by decrease in efficient operation of the wheel and the stage as a whole. At that, the energy of pulsations redistributes into the Δf=0... f
Passege №2
Fig.8 The destabilization of flow behind the shock in the channel №2
rw Zrw band. The energy redistribution has an impact on the character of in-time variation of flow parameters aft of each passage and points to increase in importance of low-frequency processes and random vibrations.
1 – st rev
2 – nd rev
10 – th rev
5.Gradual origination of circumferential nonuniformity that shows itself in difference of averaged flow pattern in the adjacent passages
a) b)
Fig 9.a) Isobars P on periphery; b) isobars Р* and Р downstream of the wheel Decrease in the stage air flow as compared with the optimal mode leads to gradual increase in number of passages with a distinct averaged flow pattern that manifests itself in different arrangement of isolines of the same-level pressure both of isobars P on periphery and isobars Р* and Р at the wheel exit.
6
VARIATION OF UNSTEADY FLOW PATTERN IN COMPRESSORS PRECEDING THE LOSS OF GASDYNAMIC STABILITY. EXPERIMENT.
6.Formation of a petal-like flow pattern at entrance of a single-stage model compressor 6.Formation of a petal-like flow pattern at entrance of a single-stage model compressor
d) d)
е) е)
Isolines of total - d) and static pressur - e) Isolines of total - d) and static pressur - e) in inlet duct. in inlet duct.
а - at optimal point of characteristic а - at optimal point of characteristic b - at shock expulsion b - at shock expulsion с - at π*max on the stability boundary с - at π* Fig.10. Variation of flow pattern in blade Fig.10. Variation of flow pattern in blade passages is accompanied by origination of passages is accompanied by origination of a petal-like flow pattern at inlet a petal-like flow pattern at inlet When the expulsed shock originates it comes into contact with the boundary layer in the inlet duct. At that, the boundary layer ahead of stages thickens that is accompanied by increase several times in pulsations of the total and static pressures. The total and static pressure
measurements carried out in the 0...40 kHz band show that the boundary layer can have a quasi-steady, stabilized pattern in space. The flow pulsations have a polyharmonic form. The main contribution to pulsations, in this case, is made by flow pulsations at the blade passing frequency and the frequencies that are multiple of it. The measurement of axial flow velocity show that the flow pattern in this case includes periodic zones located on periods of passing of blade passages in which the axial velocity can vary in the λ=(0.6-1.4) λav range. At that, the air flow redistribution in width of the blade passage and the corresponding flow redistribution in height of the passage occur. As a result, a radial nonuniformity of both axial velocity and air flow originates. Due to the presence of circumferential flow nonuniformity, the sections with λin =0 can appear ahead of separate passages that points to the local separation of flow. This process (when π*max) is accompanied by thickening of a boundary layer zone several times as compared with the values when π*= π*opt. In this case, the nonuniformity of total pressure and air flow can occupy up to ¼ of the blade height at inlet. The intensity of total and static pressure pulsations can come to the values of *ε = RMS Р*/ Р*av 100% =15%. Fig. 10 a, b shows the results of measurements of static and total pressure pulsation fields in the inlet duct in the form of averaged over time Т=100 Тw flow patterns in different operating modes of the compressor. It can be seen that the separated flow zones originate on the inlet d
When the expulsed shock originates it comes into contact with the boundary layer in the inlet duct. At that, the boundary layer ahead of stages thickens that is accompanied by increase several times in pulsations of the total and static pressures. The total and static pressure
measurements carried out in the 0...40 kHz band show that the boundary layer can have a quasi-steady, stabilized pattern in space. The flow pulsations have a polyharmonic form. The main contribution to pulsations, in this case, is made by flow pulsations at the blade passing frequency and the frequencies that are multiple of it. The measurement of axial flow velocity show that the flow pattern in this case includes periodic zones located on periods of passing of blade passages in which the axial velocity can vary in the λ=(0.6-1.4) λ
uct all.
ERIMENT.
uct all.
b c
a
av range. At that, the air flow redistribution in width of the blade passage and the corresponding flow redistribution in height of the passage occur. As a result, a radial nonuniformity of both axial velocity and air flow originates. Due to the presence of circumferential flow nonuniformity, the sections with λin =0 can appear ahead of separate passages that points to the local separation of flow. This process (when π*max) is accompanied by thickening of a boundary layer zone several times as compared with the values when π*= π*opt. In this case, the nonuniformity of total pressure and air flow can occupy up to ¼ of the blade height at inlet. The intensity of total and static pressure pulsations can come to the values of *ε = RMS Р*/ Р*av 100% =15%. Fig. 10 a, b shows the results of measurements of static and total pressure pulsation fields in the inlet duct in the form of averaged over time Т=100 Тw
ww
flow patterns in different operating modes of the compressor. It can be seen that the separated flow zones originate on the inlet d
max on the stability boundary
7
Ledovskaya N.N.
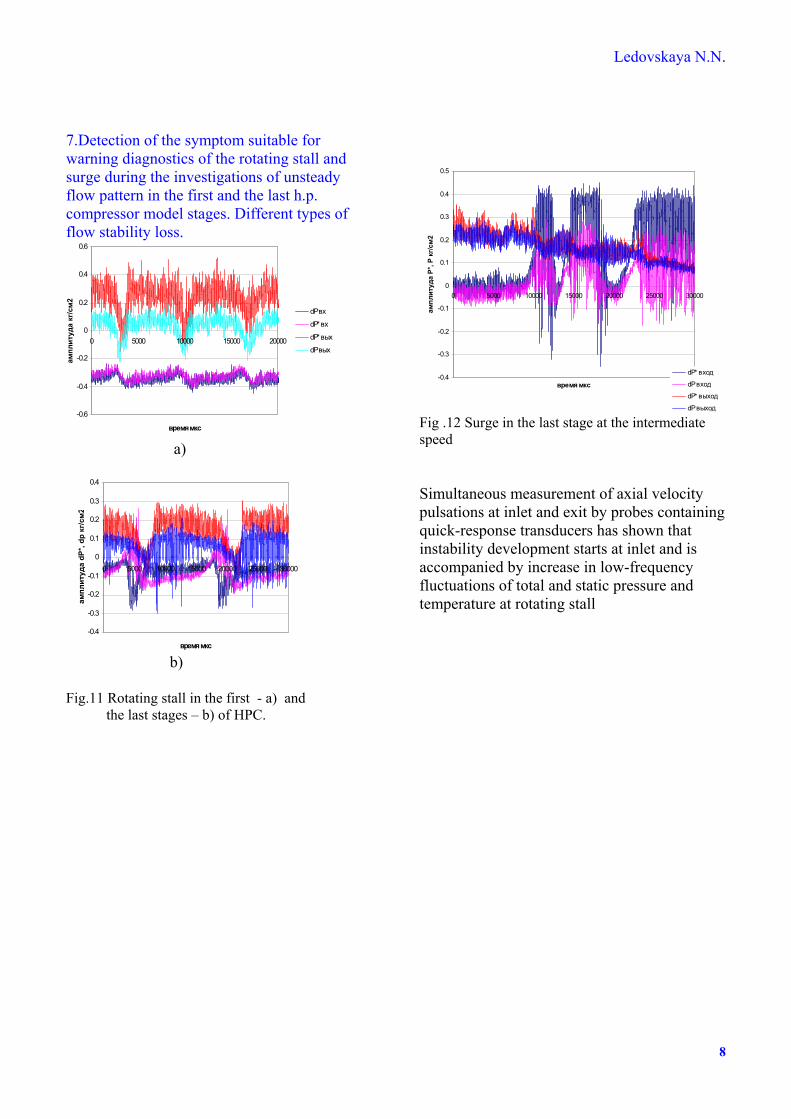
7.Detection of the symptom suitable for warning diagnostics of the rotating stall and surge during the investigations of unsteady flow pattern in the first and the last h.p. compressor model stages. Different types of flow stability loss.
a)
b)
Fig .12 Surge in the last stage at the intermediate speed
-0.4
-0.3
-0.2
-0.1
0
0.1
0.2
0.3
0.4
0.5
0 5000 10000 15000 20000 25000 30000
время мкс
амплитуда Р
*, Р
кг/см
2
dР* вход
dР вход
dР* выход
dР выход-0.6
-0.4
-0.2
0
0.2
0.4
0.6
0 5000 10000 15000 20000
время мкс
амплитуда
кг/см
2
dP вх
dP* вх
dP* вых
dP вых
-0.4
-0.3
-0.2
-0.1
0
0.1
0.2
0.3
0.4
0 5000 10000 15000 20000 25000 30000
время мкс
амплитуда
dP
*, d
p кг/
cм2
Simultaneous measurement of axial velocity pulsations at inlet and exit by probes containing quick-response transducers has shown that instability development starts at inlet and is accompanied by increase in low-frequency fluctuations of total and static pressure and temperature at rotating stall
Fig.11 Rotating stall in the first - a) and the last stages – b) of HPC.
8
VARIATION OF UNSTEADY FLOW PATTERN IN COMPRESSORS PRECEDING THE LOSS OF GASDYNAMIC STABILITY. EXPERIMENT. ERIMENT.
a)
a)
b) b)
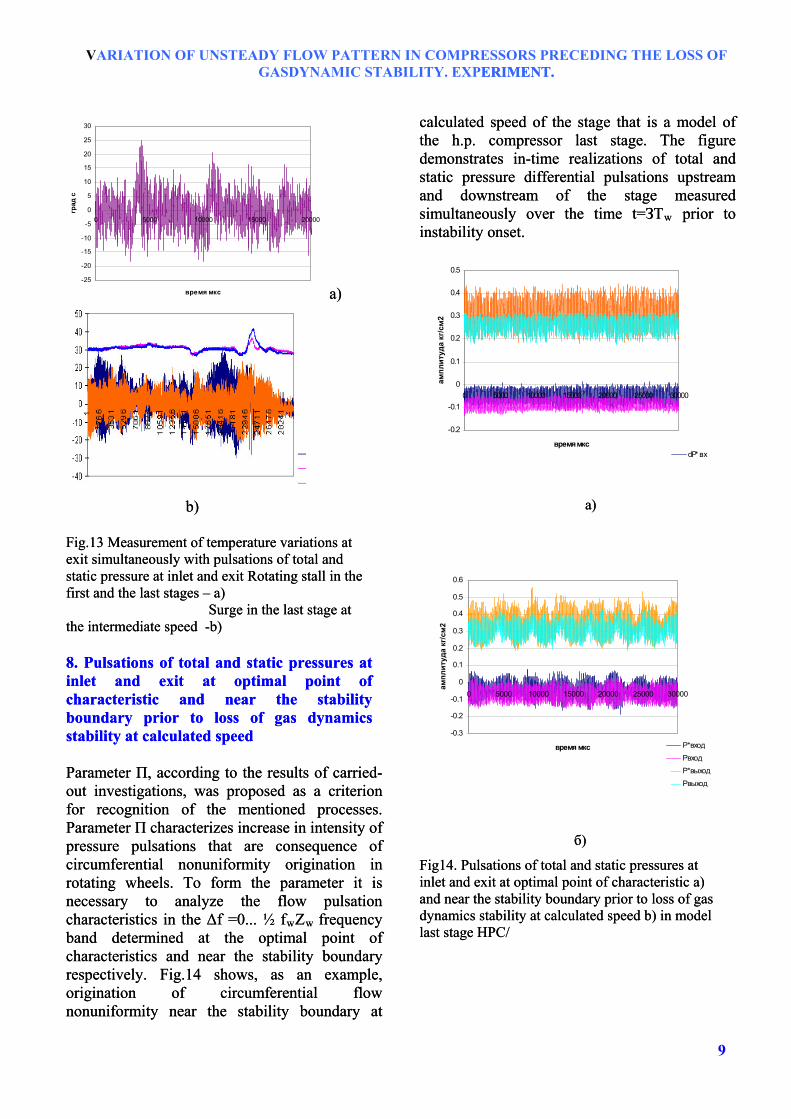
Fig.13 Measurement of temperature variations at exit simultaneously with pulsations of total and static pressure at inlet and exit Rotating stall in the first and the last stages – a)
Fig.13 Measurement of temperature variations at exit simultaneously with pulsations of total and static pressure at inlet and exit Rotating stall in the first and the last stages – a) Surge in the last stage at the intermediate speed -b) Surge in the last stage at the intermediate speed -b) 8. Pulsations of total and static pressures at inlet and exit at optimal point of characteristic and near the stability boundary prior to loss of gas dynamics stability at calculated speed
8. Pulsations of total and static pressures at inlet and exit at optimal point of characteristic and near the stability boundary prior to loss of gas dynamics stability at calculated speed Parameter П, according to the results of carried-out investigations, was proposed as a criterion for recognition of the mentioned processes. Parameter П characterizes increase in intensity of pressure pulsations that are consequence of circumferential nonuniformity origination in rotating wheels. To form the parameter it is necessary to analyze the flow pulsation characteristics in the Δf =0... ½ fwZw frequency band determined at the optimal point of characteristics and near the stability boundary respectively. Fig.14 shows, as an example, origination of circumferential flow nonuniformity near the stability boundary at
calculated speed of the stage that is a model of the h.p. compressor last stage. The figure demonstrates in-time realizations of total and static pressure differential pulsations upstream and downstream of the stage measured simultaneously over the time t=ЗТw prior to instability onset.
Parameter П, according to the results of carried-out investigations, was proposed as a criterion for recognition of the mentioned processes. Parameter П characterizes increase in intensity of pressure pulsations that are consequence of circumferential nonuniformity origination in rotating wheels. To form the parameter it is necessary to analyze the flow pulsation characteristics in the Δf =0... ½ f
а) а)
б) б)
Fig14. Pulsations of total and static pressures at inlet and exit at optimal point of characteristic a) and near the stability boundary prior to loss of gas dynamics stability at calculated speed b) in model last stage HPC/
Fig14. Pulsations of total and static pressures at inlet and exit at optimal point of characteristic a) and near the stability boundary prior to loss of gas dynamics stability at calculated speed b) in model last stage HPC/
wZw frequency band determined at the optimal point of characteristics and near the stability boundary respectively. Fig.14 shows, as an example, origination of circumferential flow nonuniformity near the stability boundary at
calculated speed of the stage that is a model of the h.p. compressor last stage. The figure demonstrates in-time realizations of total and static pressure differential pulsations upstream and downstream of the stage measured simultaneously over the time t=ЗТ
-25
-20
-15
-10
-5
0
5
10
15
20
25
30
0 5000 10000 15000 20000
время мкс
град
с
w prior to instability onset.
-0.2
-0.1
0
0.1
0.2
0.3
0.4
0.5
0 5000 10000 15000 20000 25000 30000
время мксам
плитуда кг
/см
2
dP* вх
предсрыв канал1 на выходе Д-70,Gпр=4.08кг/с
-0.3
-0.2
-0.1
0
0.1
0.2
0.3
0.4
0.5
0.6
0 5000 10000 15000 20000 25000 30000
время мкс
амплитуда кг
/см
2
Р*вход
Рвход
Р*выход
Рвыход
9
Ledovskaya N.N.
10
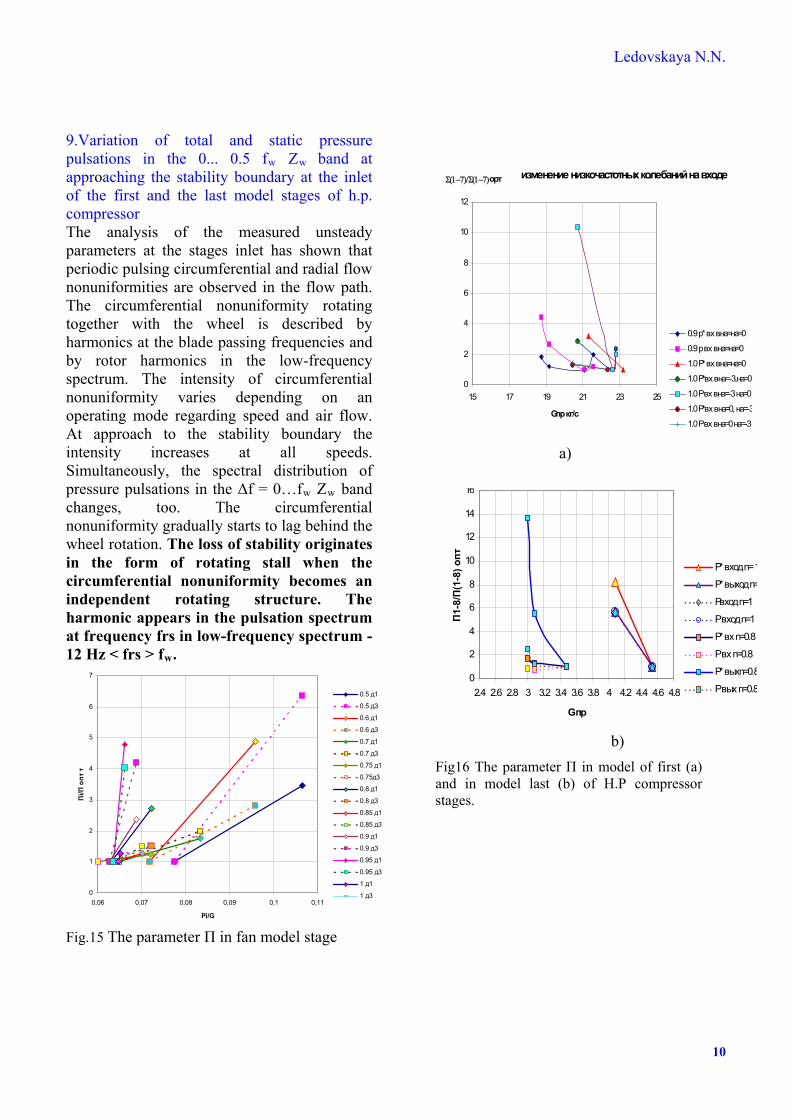
9.Variation of total and static pressure
pulsations in the 0... 0.5 f w Zw band at approaching the stability boundary at the inlet of the first and the last model stages of h.p. compressor The analysis of the measured unsteady parameters at the stages inlet has shown that periodic pulsing circumferential and radial flow nonuniformities are observed in the flow path. The circumferential nonuniformity rotating together with the wheel is described by harmonics at the blade passing frequencies and by rotor harmonics in the low-frequency spectrum. The intensity of circumferential nonuniformity varies depending on an operating mode regarding speed and air flow. At approach to the stability boundary the intensity increases at all speeds. Simultaneously, the spectral distribution of pressure pulsations in the Δf = 0…fw Zw band changes, too. The circumferential nonuniformity gradually starts to lag behind the wheel rotation. The loss of stability originates in the form of rotating stall when the circumferential nonuniformity becomes an independent rotating structure. The harmonic appears in the pulsation spectrum at frequency frs in low-frequency spectrum - 12 Hz < frs > fw.
Fig.15 The parameter П in fan model stage
изменение низкочастотных колебаний на входе
0
2
4
6
8
10
12
15 17 19 21 23 25
Gпр кг/с
0.9 p* вх вна=на=0
0.9 p вх вна=на=0
1.0 Р* вх вна=на=0
1.0 Р*вх вна=-3,на=0
1.0 Р вх вна=-3 на=0
1.0 P*вх вна=0, на=-3
1.0 Р вх вна=0 на=-3
орт
a)
0
2
4
6
8
10
12
14
16
2.4 2.6 2.8 3 3.2 3.4 3.6 3.8 4 4.2 4.4 4.6 4.8
G пр
П1-
8/П
(1-8
) опт
P* вход n= 1
Р* выход n=
Рвход n=1
Р вход n=1
Р* вх n=0.8
Р вх n=0.8
Р* выхn=0.8
Р вых n=0.8
0
1
2
3
4
5
6
7
0,06 0,07 0,08 0,09 0,1 0,11
Pi/G
Пi/П
опт т
0.5 д1
0.5 д3
0.6 д1
0.6 д3
0.7 д1
0.7 д3
0.75 д1
0.75д3
0.8 д1
0.8 д3
0.85 д1
0.85 д3
0.9 д1
0.9 д3
0.95 д1
0.95 д3
1 д1
1 д3
b)
Fig16 The parameter П in model of first (a) and in model last (b) of H.P compressor stages.
VARIATION OF UNSTEADY FLOW PATTERN IN COMPRESSORS PRECEDING THE LOSS OF GASDYNAMIC STABILITY. EXPERIMENT.
Conclusion .•The values of parameter
П= / at approach to the surge
margin line increase 2 – 5 times and more depending on the vicinity of the mode to the instability boundary.
• The investigation of flow stability loss using special tools and methods allowing to determine the unsteady parameters and pattern of flow on the periphery of wheels of different-purpose compressors’ model stages has shown that if air flow reduces at fixed rotational speeds then a significant change in flow pattern and its unsteady parameters gradually takes place in the passages of wheels’ peripheral sections, in the inlet duct and at exit.
fnz
Ai5.0
0
fnz
optAi5.0
0
•Using parameter П as a diagnostic sign of approach to the instability boundary prevents from a rotating stall and surge. The threshold value of a control signal is a function of the rotor speed and the corrected axial flow velocity at entry. It is determined under conditions of the compressor stable operation.
•.The determination of parameter П is based on a physical phenomenon that develops before the flow instability takes place. One of the signs is the flow circumferential nonuniformity that arises as a result of flow separation in the rotor. This nonuniformity rotates together with the rotor and transforms at a fixed rotational speed as the airflow changes.
•The novelty of the approach to the diagnostics of the surge margin limit is confirmed by the patent “The method of compressor operating modes monitoring and the means of its realization”. The patent of the RF №2354851.
• When approaching the instability boundary there takes place the change in the flow pattern at the compressor entry. The inlet flow at a distance from wheels takes a petal-like periodic pattern. This process is accompanied by intensification of pulsations in the 0…0.5 f
Copyright Statement
The authors confirm that they, and/or their company or organization, hold copyright on all of the original material included in this paper. The authors also confirm that they have obtained permission, from the copyright holder of any third party material included in this paper, to publish it as part of their paper. The authors confirm that they give permission, or have obtained permission from the copyright holder of this paper, for the publication and distribution of this paper as part of the ICAS 2014 proceedings or as individual off-prints from the proceedings.
rot Zrot frequency band upstream of the compressor by several times. The parameter obtained as a result of the carried-out investigations of the unsteady flow pattern has been proposed for advance diagnostics of the rotating stall. Its efficiency regarding the advance diagnostics of the surge margin change has been checked in multistage compressors under their tests as components and
in the
engine system.
11
Related Documents